shear strength and elastic properties of lime-soil...
TRANSCRIPT
Shear Strength and Elastic Properties of Lime-Soil Mixtures MARSHALL R. THOMPSON, University of Illinois, Urbana
•THE SHEAR strength properties of a material are essential for the rational analysis and design of a flexible pavement structure. McCleod (1), Hewitt (2), and others have used shear strength parameters for evaluating the load-carrying capacity of flexible pavements. Many flexible pavement design procedures are based on the shear strength properties of the pavement materials. The Texas and Kansas triaxial design techniques and procedures are among the most renowned. McDowell (3) has shown excellent correlation between the Texas triaxial procedures and the performance of the flexible test sections at the AASHO Road Test.
If lime-soil mixtures are to be effectively used as paving materials, it is necessary to develop information concerning their shear strength properties. This information is required for determining the structural behavior of the material in addition to its usefulness in triaxial design procedures.
INVESTIGATION
The objectives of this study were (a) to investigate the shear strength and elastic properties of typical lime-soil mixtures, (b) to evaluate the influence of soil type and curing time on these properties, and (c) to determine the relationships, if any, between shear strength properties and unconfined compression test results.
Materials
Four typical Illinois soils were used in the testing program. Previous laboratory experience with these soils indicated that they reacted very satisfactorily with lime. These soils display a wide range of such properties as clay content, mineralogy, and plasticity. Selected soil properties, the lime treatments used, and the percent of dry weight of soil, are given in Table 1.
A commercially produced, high-calcium hydrated lime was used throughout the study. The lime contained 96 percent Ca(OH)a, and 95 percent passed the No. 325 sieve.
Specimen Preparation
Mixing. -Proper quantities of lime and air-dry soil were thoroughly blended in a Lancaster mixer. The amount of water required to bring the lime-soil mixture to optimum moisture content was then added, and mixing continued for approximately 2 min. Following mixing, the lime-soil mixture was covered and allowed to stand 1 hr before specimens were compacted.
Compaction. -All specimens were compacted at approximately optimum moisture content as determined by a moisture-density test. This test was conducted in a manner similar to AASHO T99-57 except that 2-in. diameter by 4-in. high molds were used and the compactive effort was applied through 20 blows of a 4-lb hammer having a 12-in. drop. This compactive effort produces maximum dry densities and optimum moisture contents similar to those obtained from Method A of AASHO T99-57 test for moisturedensity relations of soils. Optimum moisture contents and maximum dry densities for the various soils and lime-soil mixtures are given in Table 2.
Poper sponsored by Committee on Lime and Lime-Fly Ash Stabilization and presented at the 45th Annual Meeting.
2
Soil AASHO Class.
Bryce B A-7-6 (18) Illinoian till A-6 (6) Fa yette C Wisconsinan l oam till
A-6 (8) A-4 (8)
0Noncalcoreous.
Soil
Bryce B
Illinoian till
Fayette C
TABLE 1
SELECTED SOIL PROPERTIES
< 2µ L. L. P . I. Carbonates Predom. Clay('!, ) (%) (%)
52 53. 1 28. 8 14 25. 5 11. 0 21 31. 9 10. 1 18 24. 5 7. 8
TABLE 2
COMPACTION PROPERTIES
(%)
NCa 18. 6 20. 0 13. 8
Lime(%) Max. Dry Density (pcf)
0 101. 9 5 97. 3 0 125. 3 3 121. 0 0 110. 5 5 108. 6
Clay Mine ral
Illite Illite
Montmorillonite lllite
Opt. Moist. (i )
20. 5 25. 8 11. 3 13. 0 18. 1 18 . 3
Wisconsinan loam till 0 122. 4 12. 0 3 120. 0 12. 0
Lime Treat. ('!, )
5 3 5 3
A series of sixteen 2-in. diameter by 4-in. high specimens was prepared for each test condition, i. e., lime percentage, soil type, and curing period. The specimens were molded in three equal layers with each layer receiving a compactive effort of 20 blows of a 4-lb hammer dropping 12 in. Each layer was scarified to provide bond between the adjacent layers. After proper trimming, the specimens were extruded from their molds and cured.
Curing. -After compaction, trimming, and extrusion, the specimens were placed in 1-gal tnetal cans, and the can lids sealed with Perma-Tex. The lime-soil specimens were then placed in a 120 F curing cabinet for periods of 1, 2, 4, or 6 days. These curing conditions produce strengths that are comparable to those developed under field curing conditions ( 4).
The natural soilspecimens were allowed to cure for 7 days at ambient room temperature to allow for thixotropic effects.
Testing Procedures
At the termination of the prescribed curing period, the specimens were allowed to cool to room temperature and then tested in triaxial compression (unconsolidatedundrained test).
The 16 specimens were divided into four equal-sized groups and one specimen from each group was selected at random to be tested at a given air-confining pressure (a3) of 0, 5, 15, or 35 psi. The samples were loaded at a consta.nl rate of deformation of 0. 05/ in./min., and periodic readings of applied load and total deformation of the spe imen were recorded until maximum load was ::tchieved.
Samples taken from representative specimens following testing indicated that the specimens were at approximately the same moisture content as at the time of preparation.
Determination of C and r/J
The cohesion intercept, C, and angle of shearing resistance, r/J, were determined statistically by a process used by Herrin (~). The procedure is described below.
II> UJ Q) ..... -en ..... 0 -0
> Q)
0
3
300
·u; 3.3 <T 3 a.
b-.; UJ cu 200 ..... - BRYCE B en
5% LIME 0 I DAY CURE .e-(,) c: ..... 100 0..
Confining Pressure, u 3, psi
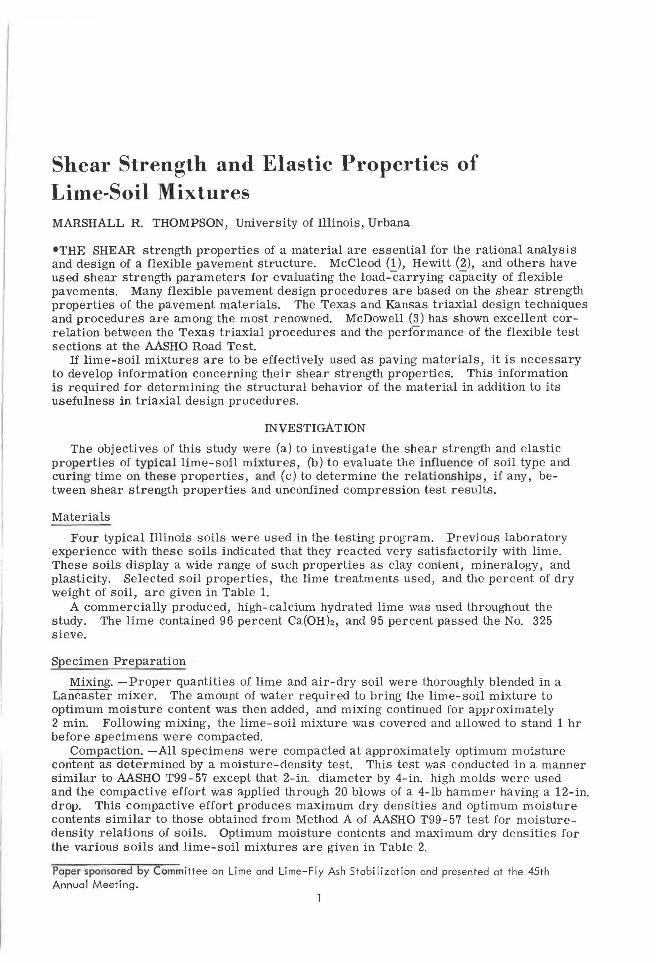
Figure 1. Influence of confining pressure on maximum principal st ress .
Strain, £
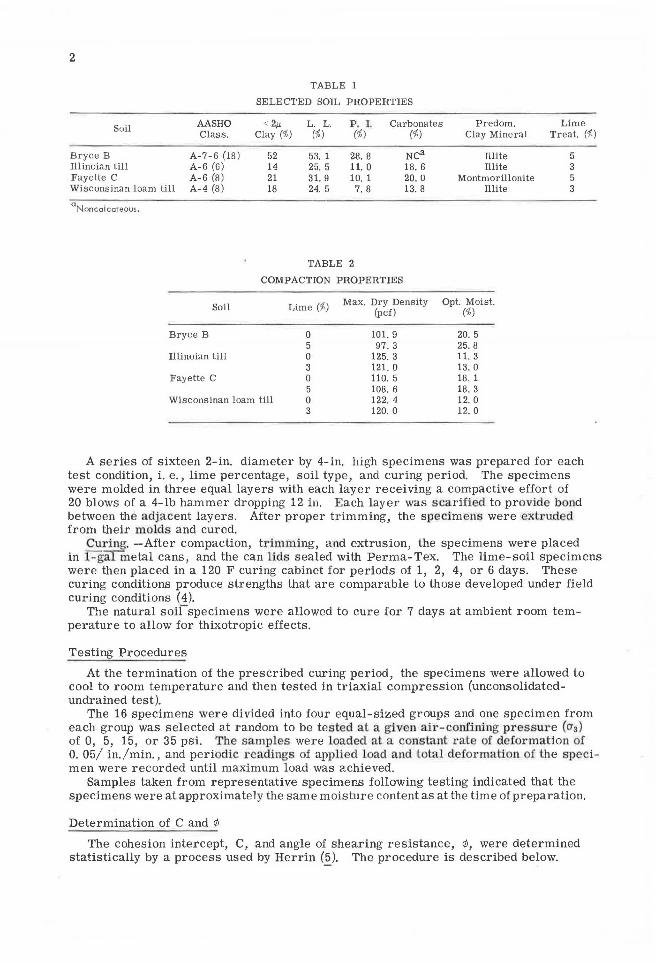
Figure 2. Composite stress-strain curve.
1. A plot of CJ1, maximum normal stress applied, vs CJ3, confining pressure, was prepared (Fig. 1).
2. The best least-squares regression equation for the data was determined. The equation (Fig. 1) was of the form CJ1 = a + b CJ3.
3. C and ¢ were calculated from the following relationships:
c =_a_ 2 lb
. b-1 sin ¢ = -b + 1
Evaluating Elasticity Properties
A composite or average stress-strain relationship was es tablished for each series of four lime- soil s pecimens tested at a given confining pressure, CJ3. The composite relation (Fig. 2) was developed using the technique described in the appendix.
ANALYSIS OF TEST RESULTS
Shear Strength Properties
Pertinent shear strength properties for the natural soils and the lime-soil mixtures included in the investigation are

4
TABLE 3
SHEAR STRENGTH DATA
Shear Strength
7 Days 1 Day 2 Days 4 Days 6 Days at 120 F at 120 F at 120 F at 120 F Soil
Lime at 73 F (%)
C(psi) E(ksi)a C(psi) E(slti)" C(psl) E(ski)'\ C(psi) E(ski)3- C(psi) E(ksi)a
Bryce B 0 39 11.5 5. 70 ! 64 32. 5 29. o 158 13, 4 54. 0 178 32. 7 Bl , 3 159 21. 2 73. 0
lllinoian till 0 60 13. 0 8. 60 i 94 34. 2 28. 4 113 35. 5 63. 5 129 32. 1 56 , 7 250 27. 0 87 , 5
Fayette C 0 22 17 6 6. 50 6 108 14. 5 52. 5 93 37. 0 63 0 149 43. 7 115. 0 386 14, 2 160. 0
Wisconsin.an loam G 48 7. 5 5. 25 till ! 105 25. 0 48, 0 139 13. 0 58. 3 184 27, 4 77, B 164 36. B 91, 9
aE computed at 15 psi confining pressure,
I
300
rn a.
c: 200 0 rn Q) .c 0 u
100
Curing Time, days at 120° F
Figure 3. Influence of curing time on cohesion of lime-soil mixtures.
TABLE 4
COHESION (C)• UNC:ONl"lllF.ll COMPRESSIVE STRENGTH (0u) LINEAR REcrrtESSlOM ANi\LYSlS SUMMARY (Analysis
Source of Variation
Total Regression Residual
or YIU ' )ru.<:eU)
Degrees of Sum or Freedom Squares
15 87, 145 1 77' 089
g 10, 056
Variance
77' 089, 0 718. 3
~Regression equation: C(psi) = 9, 3 + O. 292 l!u (psi). SJrtulfi cant al a = 0, 01.
F
produced further increases in cohesion period varied from 159 to 386 psi.
given in Table 3. The lime treatment greatly improved the shear strength of the soils.
Substantial cohesion increases were obtained with every soil, the magnitude of the increase depe nding on the soil type and length of curing p eriod. For the 1-day curing periods, the cohesion values of the lime-soil mixtures were 1. 5 to 5 times larger than the cohesion of the untreated soils. Longer curing periods generally
(Fig. 3). Cohesion valu s for the 6-day curing
Statistical analysis of the unconfined compressive strength and cohesion values for the lime-soil mixtures indicated a highly significant linear regress.ion relation (Table 4). The r egr ession equation, C (psi)= 9. 3 + 0. 292 qu (psi) is shown in Fig1.11·e 4.

5
•
300 c = 9 . 3 + . 292 Qu
V> 0.
u 200
• c • 0 • V> • Q) • .s::. 0 u 100
1200
Unconfined Compressive Strength, q u, psi
Figure 4. Cohesion vs unconfined compressive strength of lime-soil mixtures.
In every case except two, the cured lime-soil mixtures displayed a larger angle of shearing resistance, ¢, than the untreated soil. The majority of the r/J values for the lime-soil mixtures ranged from 25 to 35 deg. The data do not indicate any apparent trend between r/J and curing time or soil type.
It is very difficult to evaluate r/J effectively for materials such as lime-soil mixtures, which are characterized by very high cohesion. In this study, the cohesion was so large that small specimen-to-sp cimen variations in cohesion may have negated the effect of the low confining pressures, 0 to 35 psi, used. More realistic determinations of 0 would require exb·emely high confining pressures for eliminating the influence of cohesion variations. Considering the very high cohesion of lime-soil mixtures and the low confining pressures normally assumed to exist in a flexible pavement structure, extremely elaborate high-pressure triaxial tests to obtain a more precise determination of ¢ may not be justified.
Elasticity Properties
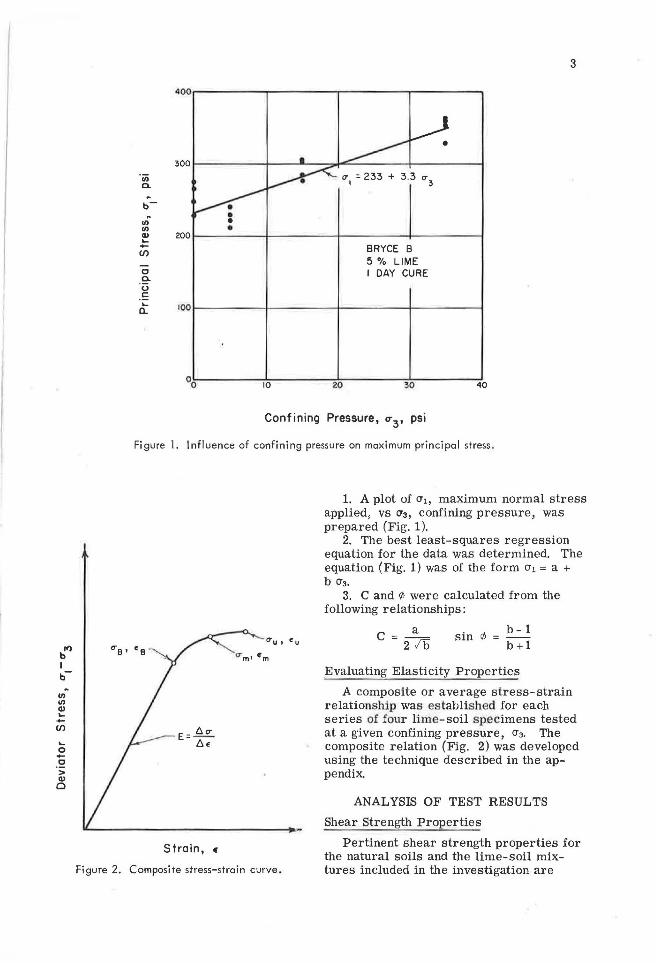
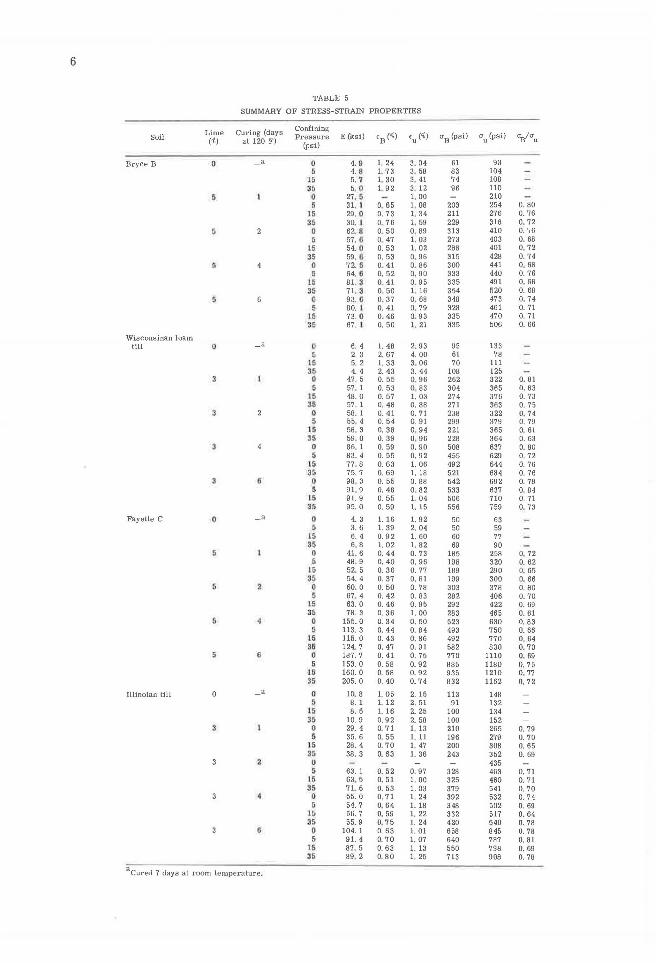
A summary of pertinent stress-strain properties (E, fB, (u, us, uu) for the natural soils and the lime-soil mixtures is given in Table 5. Figure 5 shows typical stressstrain curves.
The modulus of elasticity, E, of the cured lime-soil mixtures ranged from 28, 000 to 160, 000 psi, and the range was from 5, 200 to 8, 600 psi for the natural soils. Longer curing periods for the lime-soil mixtures generally produced an in.crease in E (Fig. 6). Increased confining pressure had little effect on E, the value remaining essentially constant for all magnitudes of confining pressures used.
The increase in E with longer curing periods is similar to the strength vs curingtime relation for lime-soil mixtures. Figure 7 shows the relation between E determined for a confining pressure of 15 psi and the unconfined compressive strength of the limesoil mixtures. Linear regression analysis of the data indicated a highly significant regression between the variables (Table 6). The regression equation, E (ksi) = 9. 98 + 0. 1235 % (psi) is shown in Figure 7.
6
TABLE 5
SUMMARY OF STRESS-STRAIN PROPERTIES
Lime Curing (days Confining
on/au Soil Pressure E(ksi) 'B ({ ) 'u (~) a8
(psi) au (psi) (~) at 120 F) (psi)
Bryce B 0 a 0 4. 0 I. 24 3. 04 61 93 5 4. 8 1. 73 3. 58 83 104
15 5. 7 1. 30 3. 41 74 108 35 5. 0 1. 92 3. 12 96 110 0 27. 5 1. 00 210 5 31. I o. 65 l , 08 203 254 u. 80
15 29. 0 0. 73 1. 34 211 276 0. 76 35 30. I 0. 76 1. 59 229 318 o. 72
5 0 62. 8 0. 50 o. 89 313 410 0. 'o6 5 57. G 0. 47 1. 03 273 403 o. 68
15 54. 0 0. 53 1. 02 288 401 0. 72 35 59. 0 0. 53 o. 96 315 428 0. 74
0 72. 5 0. 41 0. 66 300 441 o. 66 5 64. G 0. 52 o. 90 333 440 0. 76
15 81. 3 0. 41 0. 95 335 491 0, 66 35 71. 3 0. 50 1. 16 354 520 0. 66
5 0 93. 6 o. 37 0. 68 348 473 0. 74 5 BO. I 0. 41 o. 79 328 461 0. 71
L5 73. 0 0. 46 0. 93 335 470 0. 71 35 67. I 0. 50 l , 21 335 506 0. 66
Wisconsinan loam till _a u 6, 4 I. 48 2. 93 95 133
5 2. 3 2. 67 4. 00 61 7B 16 5. 2 I. 33 3. 06 70 111 35 4. 4 2. 43 3. 44 108 125
0 47, 5 0. 55 0. 96 262 322 0. Bl 6 57. 1 0. 53 0. 83 304 365 0. B3
15 4B. 0 0. 57 1. 03 274 376 0. 73 35 57. 1 0. 48 0. 86 271 363 0. 75
3 0 56. 1 0. 41 0. 71 238 322 0. 74 5 55, 4 0. 54 0. 91 299 379 0. 79
15 56. 3 0. 38 0, 94 221 365 0. 61 35 59. 0 0. 39 o. 96 22B 364 0. 63
3 0 B6. 1 0. 59 0. 90 508 637 0. 60 5 B3. 4 0. 55 0. 92 455 629 0. 72
15 77. B 0. 63 I. 06 492 644 0. 76 35 75. 7 0. 69 I. 18 521 684 0. 76
3 0 98, 3 0. 55 0. 68 542 692 0. 79 5 91. 9 0. 48 0. 82 533 637 0. 84
15 91. 9 0. 55 1. 04 506 710 0. 71 35 95. 0 0. 59 1. 15 556 "i59 0, 73
Fayette C 0 _a 0 4. 3 I. 16 1. 92 50 63 5 3. 6 I. 39 2. 04 50 59
15 6. 4 0. 92 1. 60 60 77 3~ 6. 8 I. 02 I. 82 69 90 0 41. 6 0. 44 0. 73 185 258 0. 72 5 48. 9 0. 40 0. 96 198 320 0. 62
15 52. 5 0. 36 0. 77 189 290 o. 65 35 54. 4 0. 37 0. 81 199 300 0. 66
0 60. 0 0. 50 0. 78 303 378 0. 80 5 67. 4 0. 42 0. 83 282 406 0. 70
15 63. 0 0. 46 0. 95 292 422 0. 69 35 78. 3 0. 36 I. 00 283 465 0. 61
0 155. 0 0. 34 0. 50 523 630 0. 83 5 113. 3 0. 44 0. 84 493 750 0. 66
15 115. 0 0. 43 0. 86 492 770 0, 64 35 124. 7 0. 47 0. 91 582 830 0. 70 0 187. 7 0. 41 0. 75 770 1110 0. 69 5 153. 0 0. 58 0. 92 885 1180 o. 75
15 160. 0 0. 56 0. 92 935 1210 0. 77 35 205. 0 0. 40 0. 74 832 1162 o. 72
Illinoian till a 0 10, 8 1. 05 2. 15 113 148 5 8. 1 I. 12 2. 51 91 132
15 8. 6 1. 16 2. 25 100 134 35 10. 9 0. 92 2. 58 100 152
3 0 29. 4 0. 71 1. 13 210 265 0. 79 5 35. 6 0. 55 1. 11 196 279 0. 70
lS 28. 4 0. 70 1. 47 200 308 0. 65 35 38. 3 0. 63 1. 36 243 352 0. 69 0 435 5 63. 1 0. 52 0. 97 328 463 0. 71
15 63. 5 0. 51 1. 00 325 460 0. 71 35 71. 6 0. 53 I. 03 379 541 0. 70
0 55. 0 0. 71 1. 24 392 532 0. 74 5 54. 7 o. 64 1. 18 348 502 0. 69
15 56. 7 0. 59 1. 22 332 517 0. 64 35 55. 9 0. 75 I. 24 420 540 0. 78
6 0 104. 1 0. 63 1. 01 658 845 0. 78 5 91. 4 0. 70 1. 07 640 787 0. 81
15 87. 5 0. 63 1. 13 550 798 0. 69 35 89, 2 0. 60 1. 25 713 908 0. 78
aCured 7 days at room temperature.

rn a.
tr> I b-
rn rn Q) '--Cl)
'-0 -.!:! > Q)
a
500r-~~~~--,r-~~~-....,.~~~~~....,.~-~~~ ....
BRYCE B
400t-------11~---~-t------+----~~
5 % Lime, 2 Doy Cure E = 54 ks i o t u 3 = 15 psi
300t----+---+--- ---i---- --t------;
2oor---t'---~-t~~~~+-~~~~+--~~~_J
100 I l I J... --= I I Soil
ksi ata-3=15psi
2 3 oo----~~--'~~~~~ ....... ~~~~~ ....... ~~~~~-'
4
% Strain
Figure 5. Typical stress-strain curves for natural and lime-treated soi I.
rn a.
brt) I b-
rn rn Q) '--Cl)
'-0 -c > Q)
a
1200 FAYETI E C 5 % LIME
1000 1----l-- --+---tt- 6 days, E = 160 ksi +---1
BOOL_~L-~~l--+-~+-~-t-~--1-~-r~-,
600 4 days, E = 115 ksi
4001 I t /I I .,r-=:- I I I I
days , E = 63 ksi
I day , E = 52.5 ks i
200 I >' >'I / A' I I I I I I
ps i
ot:....~--1.~~_,.._~~1.--~--1.~~_,.._~~.1.-~--1.~~~
0 0.4 0.8 1.2 1.4
% Strain
Figure 6. Influence of curing time on stress-strain properties of lime-soil -.::i
mixture.

B
E = 9.98 +
•
E Determined For ,__,,.___,__--1conflnlnQ Pressure = 15 psi
400 eco 1200
Unconfined Compressive Strength, qu, psi
TABLE 6
MODULUS OF ELASTICITY (E) - UNCONFINED COMPRESSIVE STRENGTH (qu) LINEAR llEGRESSION
ANALYSIS SUMMARY (Analysis of Variancea)
Source of Degrees of Sum of Variance F Variation Freedom Squares
Total 15 15,951 68.7b Regression 1 13, 252 13,252
Residual 14 2,699 192. 8
~Regrcuion equation: E(ksi)~ 9.98+0.1235 qu(psi). Significant ot a:: = 0.0l.
The failure strains, <u, for the limesoil mixtures were decreased in relation to those exhibited by the natural soils ( Fig. 5). Typical failure strains for the lime-soil mixtures were approximately
Figure 7. Modulus of elasticity vs unconfined compressive strength of lime-soi I mixtures.
1 percenl compared to 2 or 3 percent for the untreated soils. Complete ly randomized design statistical analyses (Table 7) of the lime-soil mixture failure strains at different confining pressures indicated that for one-half of the mixes an increase in confining pressure produced
larger failure strains. For the remainder of the mixtures there was no statistically significant influence of confining pressure on Eu.
To evaluate the influence of soil 1.ype and curing j)eriod on failur e strains, the average failure strains at a confining presstu·e of 15 psi for the various lime-soil mixtures and curing periods were statistically analyzed in a randomized complete block design. The analysis indicated that ther was no statistically significant difference among U1e failure strains, regardless of soil type or cu1·ing period (T bl 8). The averag failure strains £u, for all of the lime-soil mixtures a nalyzed was 1. 02 p r ent.
TABLE 7
INFLUENCE OF CONFINING PRESSURE (a3) ON FAILURE STRAINS (Eu) (Statistical Summary of Completely Randomized Designsa)
Soil Lime Curing (days Treatmentb F (%) at 120 F) Variance Variance
Bryce B 5 1 28. 35 2. 0 14. 2C 2 2. 0 2. 5 0. 8 4 6. 33 I. 42 4. 46c 6 19. 33 0. 58 33. 2c
Illinoian till 3 1 7. 33 4. 1 1. '79 2 0. 5 1. 62 0. 31 4 0. 0 4. 1 0. 0 6 2. 0 4. 9 0. 41
Fayette C 5 1 3. 67 0. 82 4. 5C 2 4. 0 I. 8 2. 22 4 10. 67 0. 91 11. 7C 6 3. 67 1. 36 2. 7
Wisconsinan loam till 3 1 2. 0 5. 73 0. 35 2 6. 33 0. 33 19. QC
4 6. 33 1. 18 5. 36C 6 8. 0 1. 09 7. 34C
~In all 01•olyses degrnes of Freedom were 3 for treatment and 12 for error . . Treatment corresponds- to various confining pressures. cSignifitont at a= 0.05 level.
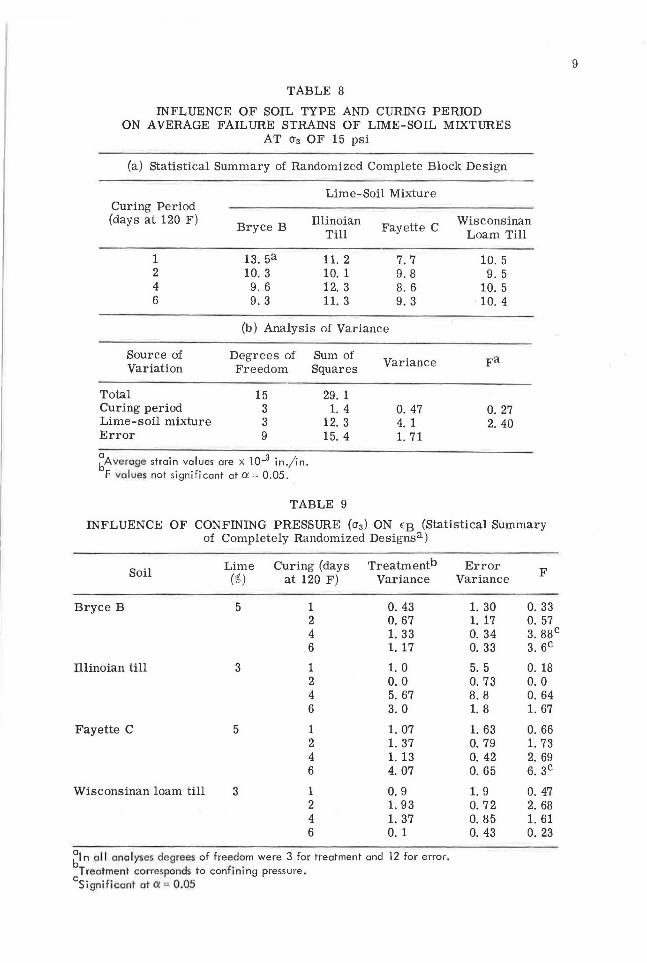
TABLE 8
INFLUENCE OF SOIL TYPE AND CURING PERIOD ON AVERAGE FAILURE STRAINS OF LIME-SOIL MIXTURES
AT 0'3 OF 15 psi
(a) Statistical Summary of Randomized Complete Block Design
Lime-Soil Mixture Curing Period (days at 120 F)
Bryce B Illinoian Fayette C
Wisconsinan
1 2 4 6
13. 5a 10. 3
9. 6 9. 3
Till
11. 2 10. 1 12. 3 11. 3
Loam Till
7.7 10. 5 9.8 9. 5 8. 6 10. 5 9.3 10. 4
(b) Analysis of Variance
Source of Degrees of Sum of Variation Freedom Squares
Variance Fa
Total 15 29. 1 Curing period 3 1. 4 0. 47 0. 27 Lime-soil mixture 3 12. 3 4. 1 2. 40 Error 9 15. 4 1. 71
~Average strain values are x 10-3 in./in. F values not significant at a= 0.05.
TABLE 9
INFLUENCE OF CONFINING PRESSURE (a3) ON EB (Statistical Summary of Completely Randomized Designsa)
Soil Lime Curing (days Treatmentb Error
F (%) at 120 F) Variance Variance
Bryce B 5 1 0. 43 1. 30 0. 33 2 0. 67 1. 17 0. 57 4 1. 33 0. 34 3. BBC 6 1. 17 0. 33 3. 5c
Illinoian till 3 1 1. 0 5. 5 0. 18 2 0.0 0. 73 0. 0 4 5. 67 8. 8 0. 64 6 3. 0 1. 8 1. 67
Fayette C 5 1 1. 07 1. 63 0. 66 2 1. 37 0.79 1. 73 4 1. 13 0. 42 2. 69 6 4. 07 0. 65 6. 3c
Wisconsinan loam till 3 1 0.9 1. 9 0. 47 2 1. 93 0. 72 2. 68 4 1. 37 0. 85 1. 61 6 0. 1 0. 43 0. 23
bin all analyses degrees of freedom were 3 for treatment and 12 for error. Treatment corresponds to confining pressure.
cSignificant ot a = 0.05
9

10
TABLE 10
INFL UENCE OF SOIL TYPE AND CURING P ERIOD ON AVERAGE <B
(a) Statistical Summary of Randomized Complete Block Design
Curing Pe riod (days at 120 F)
1 2 4 6
Lime-Soil Mixture
Bryce B Illinoian Fayette C
Till
7. 2a 6.9 4. 1 5. 2 5. 2 4. 4 4. 6 6. 4 4. 2 4. 4 7. 0 5. 0
(b) Analysis of Variance
Wisconsinan Loam Till
5.7 4. 3 6. 2 5. 7
Source of Degrees of Sum of Variation Freedom Squares
Variance Fb
Total 15 41. 9 Curing 3 3. 0 1. 0 0. 29 Lime-soil mixture 3 7. 7 2. 56 0.74 Error 9 31. 2 3. 47
~Average strain values are X 10...3 in./ in . F values not significant at a = 0.05.
TABLE 11
INFLUENCE OF SOIL TYPE AND CURING PERIOD ON AVERAGE aB/ au RATIO
(a) Statistical Summary of Randomized Complete Block Design
Curing Period (days at 120 F)
1 2 3 6
Bryce B
0.76a 0. 72 0.70 0. 71
Lime-Soil Mixture
Illinoian Fayette C Till
0. 66 0. 71 0. 70 0. 71 0. 71 0. 71 0. 73 0.77
(b) Analysis of Variance
Source of Degrees of Sum of Variance Variation Freedom Squares
Total 15 2. 13 Curing 3 0.0 0. 0 Lime-soil mixture 3 0. 84 0. 28 Error 9 1. 29 0. 143
~Average aB/a~ r~t'.o based on all specimens . F values not s1gn1f1cant at a= 0.05.
Wisconsinan Loam Till
0. 78 0. 69 0.76 0. 77
Fb
0. 0 1. 96
11
The strains at which the stress-strain curves departed from a linear relation, fB , were analyzed to determine if confining pressure, soil type, or curing period inUuenced the value. Completely randomized design statistical analyses of the data indicated that for 13 of the 16 lime-soil mixtures there was no significant difference for fB at different confining pressures (Table 9 ). Thus, fB for a giv n lime-soil mixture and curing period could be averaged to provide a representative EB. Statistical analysis of the average EB values indicated that there was no significant difference among the various lime-soil mixtures (Table 10). The overall average of EB, regardless of soil type, confining pressure, or curing period, was 0. 54 percent.
The data suggest that oB, the deviator stress corresponding to the strain "B• varies in relation to au, the ultimate deviator stress. Close analysis of the data indicates that for a given lime-soil mixtm·e and cui·iug period the aB/au for all confining pressures was therefore taken to be representative of a lime-soil mixture cured for a particular period. Table 5 gives the average aB/au values for the various mixtures, curing periods, and coniiningpressures. Statistical analysis of the data indicates no significant difierence among the 0]3/a ratios , regardless of soil type and curing period (Table 11). Th overall average , 0. 72 is th refore the best estimate of as/au for these lime-soil mixtures.
DISCUSSION
Shear Strength
The major effect of lime on the shear strength properties of a reactive fine-grained soil is to produce a substantial increase in cohesion, with some minor increase in !/!. At the low confining pressures normally considered to exist in a flexible pavement structure, the cohesion increase is of the greatest significance.
McCleod (1) has demonstrated the value of cohesion to the ultimate bearing capacity of a flexible pavement structure. He stated, "The important contribution that the existence of cohesion, C, in any layer, surface, base, or subbase makes to the ultimate strength of a flexible pavement is one of the major conclusions indicated .... " Using McCleod's ultimate strength approach, it can be shown that if the lime-soil mixtures studied in this investigation were used in pavement components of normal thicknesses, the ultimate strength would be much larger than required for normal wheel loading and traffic conditions.
Theoretical analyses of shear stresses in pavement systems have been conducted by many investigators. In some instances, the maximum shearing stress is taken as onehalf the difference of the principal stresses (6), but Mehta and Veletsos (7) evaluated U1e vertical shear stress component at various points in a layered systen:l. Although the maximum shear stress in a pavement is dependent on the properties and characteristics of the particular pavement system and wheel loading condition, the maximum theoretical shear stress is substantially less than the tire contact pressure if the pavement is of normal thickness, greater than 6 to 8 in.
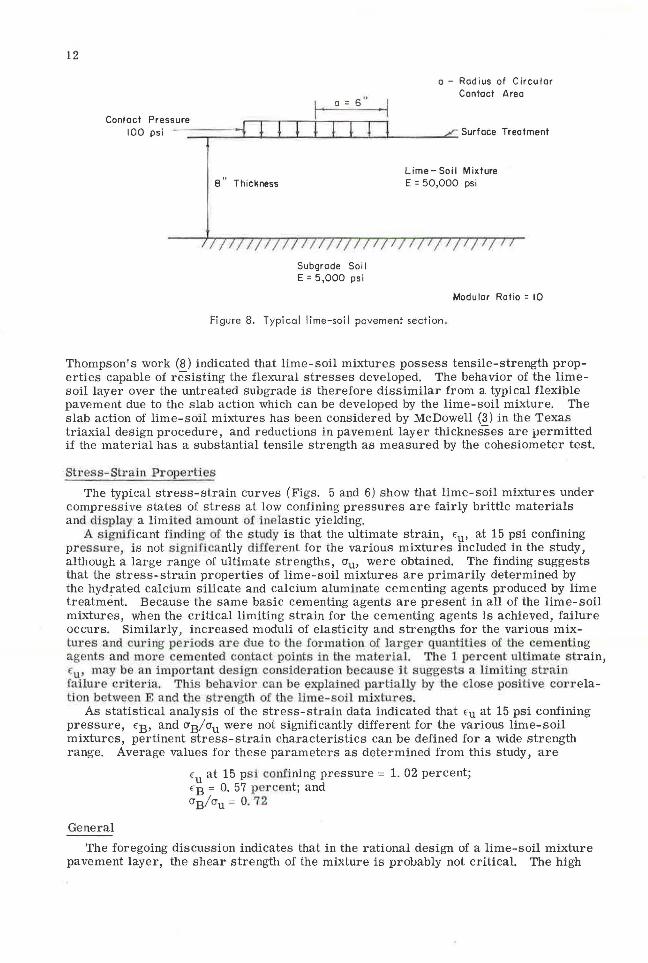
Assuming a simple pavem ent system similar to that in Figure 8, and using analytical procedures recommended by McDowell (6) and Mehta and Veletsos (7), the maximum shearing stresses in such a syst m are :Less than approximately 50 psi. Shear stresses of this magnitude would not cause shearing failure in any of the materials investigated in this study.
Modulus of Elasticity
The large E increase produced by lime treatment of a fine-grained soil has important implications regarding pavement system behavior. If a subgrade soil is stabilized, the modular ratio, Elime-sou/Esubgradei will be much larger than unity. Inasmuch
as the modulus of elasticity of the lime-soil mixture increases with curing time, the effective modular ratio for the pavement system also varies. For the materials in this investigation the modular ratios for different mixtures ranged from approximately 3 to 25. Theoretical analyses have shown that in such a layered pavement system, substantial flexural stresses are developed in the layer containing the lime-soil mixture.
12
1 · a = s .. . I
a - Radius of Circular Contact Area
Contact Pressure 100 psi _ _,... __ .._....___._..__.___._..___.__. ____ """"" Surf ace T rec tment
8" Thickness
Subgrode Soi I E = 5,000 psi
Lime-Soil Mixture E = 50,000 psi
Modular Ratio = 10
Figure 8. Typical lime-soil pavement section.
Thompson's work (8) indicated that lime-soil mixtures possess tensile-strength properties capable of resisting the flexural stresses developed. The behavior of the limesoil layer over the untreated subgrade is therefore dissimilar from a typical flexible pavement due to the slab action which can be developed by the lime-soil mixture. The slab action of lime- soil mixtures has been considered by McDowell (3) in the Texas triaxial design procedure, and reductions in pavement layer thicknesses are permitted if the material has a substantial tensile strength as measured by the cohesiometer test.
Stress-Str ain Properties
The typical stress-strain curves (Figs. 5 and 6) show that lime-soil mixtures under compressive states of s tress at low confining pressures are fairly brittle materials and display a limited amount of inelastic yielding.
A significant fi nding of the study is that the ultimate strain, <ui at 15 psi confining pressur e, is not sig1illicantly diIIerent for the various mixtures included in the study, although a large range of ultimate strengths, au, were obtained. The finding suggests that the stress-strain properties of lime-soil mixtures are primarily determined by the hydrated calcium silicate and calcium aluminate cementing agents produced by lime treatment. Because the same basic cementing agents are present in all of the lime-soil mixtures, when the critical limiting strain for the cementing agents is achieved, failure occurs. Similarly, increased moduli of elasticity and strengths for the various mixtu.res and curing periods are due to the formation oI larger quantities of the cementing agents and more cemented conta t points in the material. The 1 percent ultimate strain,
u• may be an important design consider ation because it suggests a limiting str ain failur e criter ia. This behavior can be expla ined partially by the close positive cor r elation between E and th strength of the lime-soil mixtures .
As statistical analysis of the stress-strain data indicated that <u at 15 psi confining pressure, <B , and aB/au were not significantly different for the various lime-soil mixtures, pertinent stress-strain characteristics can be defined for a wide strength range. Average values for these parameters as determined from this study, are
General
<u at 15 psi confi ning pressure = 1. 02 percent; <B = 0. 57 percent; and aB/ au = 0. 72
The foregoing discussion indicates that in the rational design of a lime-soil mixture pavement layer, the shear strength of the mixture is probably not critical. The high
13
modular ratios and mixture tensile-strength properties result in the generation of substantial flexural stresses in the lime-soil layer. These flexural stresses are probably the controlling factor in any rational design considerations if subgrade stresses are within an allowable range. The foregoing comments are based on the assumption that the lime-soil mixture is durable and retains its strength and integrity throughout its service life.
SUMMARY AND CONCLUSIONS
The shear strength and stress-strain properties of four soils and four lime-soil mixtures were evaluated. Curing periods for the lime-soil mixtures varied from 1 to 6 days at 120 F. Unconsolidated-undrained type triaxial tests with total deformation measurements were conducted on the cured samples. The test results suggest the following conclusions:
1. Lime treatment substantially increases the shear strength of lime-reactive soils. This improvement is primarily due to a large increase in cohesion with small increases in the angle of shearing resistance, ¢.
2. The moduli of elasticity, E, of the lime-soil mixtures were much larger than the E of the untreated soils. Modular ratios, Eume-son/ Esoil' of 3 to 25 were obtained for the materials studied.
3. Increased curing periods normally produced lime-soil mixtures with higher shear strengths and moduli of elasticity.
4. The cohesion, C, and modulus of elasticity, E, of the cured lime-soil mixtures investigated can be predicted based on unconfined ·compression test results.
C (psi) 9. 3 + 0. 292 % (psi) E (ksi) = 9. 98 + 0. 1235 % (psi)
5. Ultimate failure strains for the lime-soil mixtures were decreased in relation to the untreated soils. For the mixtures studied, the failure strains at 15 psi confining pressure were not significantly different for the various lime-soil mixtures and curing periods. The average ultimate strain was approximately 1 percent.
6. The strains at which the lime-soil stress-strain curves departed from a linear relation, EB, were not significantly different for the mixtures studied. The average value for EB was 0. 54 percent.
7. The stress, aB, corresponding to 'B was equal to approximately 0. 72 au for the different lime-soil mixtures, irrespective of soil type and curing period.
8. In typical flexible pavement structures the shear shear strengths of the mixtures studied were sufficient to prevent shear failure of the lime-stabilized layer. Flexural stresses in the stabilized layer will probably be the controlling factor in a rational design procedure for lime-soil mixtures of a quality comparable to those included in this investigation.
ACKNOWLEDGMENTS
This study was conducted as a part of the Illinois Cooperative Highway Research Program, Project IHR-76, by the staff of the Department of Civil Engineering in the Engineering Experiment Station, University of Illinois, under the joint sponsorship of the Illinois Division of Highways and the U. S. Bureau of Public Roads.
REFERENCES
1. McCleod, Norman A. An Ultimate Strength Approach to Flexible Pavement Design. Proc. Assoc. of Asphalt Paving Technologists, Vol. 23, 1954.
2. Hewitt, William L. Analysis of Stress in Flexible Pavements and Development of a Structural Design Procedure. Highway Research Board Bull. 269, 1960.
3. McDowell, Chester. Road Test Findings Utilized in Analysis of Texas Triaxial Method of Pavement Design. Highway Research Board Spec. Rept. 73, pp. 314-349, 1962.
14
4. Anday, M. C. Curing Lime-Stabilized Soils. Highway Research Record 29, pp. 13-24, 1963.
5. Herrin, Moreland. Effects of Aggregate Shape on the Stability of Bituminous Mixes. PhD thesis, Purdue Univ. , 1954.
6. McDowell, Chester. Wheel-Load-Stress Computations Related to Flexible Pavement Design. Highway Research Board Bull. 114, pp. 1- 16, 1955.
7. Mehta, M. R. , and Veletsos, A. S. Stresses and Displacements in Layered Systems. Civ. Eng. Studies, Structural Res. Series No. · 178, Univ. of Illinois, 1959.
8. Thompson, Marshall R. Split-Tensile Strength of Lime Stabilized Soils. Highway Research Record 92, pp. 69-80, 1965.
Appendix METHOD FOR DETERMINING COMPOSITE STRESS-STRAIN RELATION
1. Graphs of deviator stress, 0'1 - 0'3, vs strain were prepared for each specimen. 2. An initial tangent modulus of elasticity (E1, E2, En, etc. ) was evaluated for each
specimen from the straight-line portion of its stress-strain curve. An average modulus of elasticity, E, was determined by E = E1 + ... + En/n.
3. The deviator stress at which the stress- strain curve departed from a linear relation was designated aBl • aB2, aBn' etc. An average stress corresponding to this point was determined by aB = aBl + ... + aBn/ n. A strain value for aB was evaluated by <B =
aB/ E. 4. The maximum devialur slresses for the four stress-strain curves au1, au2, O'un,
etc. , were averaged to provide an average ultimate s trength, au. 5. An average ultimate strain value, <u, corresponding to au was evaluated by
averaging, for the four specimens, the magnitude of the st rains that occurred between aBn and aun and adding this average strain increment to <B·
6. An intermediate deviator stress value (am) for the strain, <m, corresponding to the point midway between <B and <u was determined by averaging, for the four specimens, the stresses occurring at the strain halfway between the strains associated with O'Bn and aun·
7. Utilizing the values computed above, , aB, <B, au, Ei.J, crm, and <m, the com posite stress-strain curve was plotted (Fig. 2).