shareholder value creation through corporate spin-offs
TRANSCRIPT

Shareholder Value Creation Through
Corporate Spin-offs
- Master Thesis -
- Master of Science in Economics and Business Administration -
Helena Grane M.Sc. Finance and Investments
[email protected] Student number: 107823
John Persson M.Sc. Finance and Investments
[email protected] Student number: 107068
Acknowledgements
We would like to express our gratitude to Domenico Tripodi, Senior Investment Manager at PKA AIP for his guidance throughout the writing of this thesis. Also, we would like to thank Liselott Ledin, Head of Equity Research/Portfolio Manager at Alecta for her valuable insight as a sparring-partner during the initial parts of the writing process.
Supervisor: Domenico Tripodi
Total Pages: 93
Total Characters: 188,931 (incl. spaces)
Submission Date: 15 May, 2018

2
Abstract
This study empirically analyzes the wealth effects associated with European corporate spin-offs
completed between 1988 and 2017. We detect a significant positive stock price reaction at the
announcement of the spin-off, corresponding to a cumulative average abnormal return of 3.3%
for shareholders. Relative spin-off size and a wealth transfer from bondholders partly explain these
gains. The bondholder abnormal return upon spin-off announcement is significant at -0.4%.
Furthermore, we present evidence of bondholders’ loss being more severe the larger the
shareholders’ gain.
When investigating the spin-off subsidiaries’ long-term performance, we find significant
outperformance validated by two different methods for all investigated holding periods. Assessing
against the Fama–French Three-Factor model, we find the largest abnormal returns for a 12-
month holding period to be 17.6%. The spin-off subsidiary returns in excess of a matching industry
portfolio peak at a 24-month holding period, corresponding to 15.8%. Extending our analysis to
value creating factors, we find contradicting evidence to what is suggested in previous research.
Firms that display low levels of information asymmetry prior to the spin-off create long-term
abnormal returns for shareholders. This proved to be the only factor to explain any value creation
in the long-term.
Next to a significant positive subsidiary outperformance, we find that parent firms display slightly
negative, but insignificant, long-term outperformance. As a result, the pro-forma combined firms
display generally positive but insignificant long-term outperformance. This suggests that the
passive shareholder is unaffected, or at least not hurt, by spin-off activity.

3
Contents Abstract ................................................................................................................................ 2
1 Introduction ...................................................................................................................... 6
1.1 Background ....................................................................................................................................... 6
1.2 Purpose .............................................................................................................................................. 7
1.3 Research Question ........................................................................................................................... 8
1.4 Contribution ..................................................................................................................................... 8
1.5 Limitations and Delimitations ........................................................................................................ 9
1.6 Definitions ...................................................................................................................................... 10
1.6.1 Divestiture Methods ............................................................................................................................. 10 1.7 Structure .......................................................................................................................................... 12
2 Literature Review ............................................................................................................. 13
2.1 Shareholder Value Creation Associated with Spin-offs ........................................................... 13
2.2 Factors Explaining Shareholder Value Creation Associated with Spin-offs ......................... 16
2.2.1 Corporate Focus ................................................................................................................................... 16 2.2.2 Information Asymmetry ...................................................................................................................... 17 2.2.3 Relative Spin-off Size ........................................................................................................................... 18
2.3 Other Factors ................................................................................................................................. 19
2.3.1 Investor Attitude .................................................................................................................................. 19 2.3.2 Takeover Activity ................................................................................................................................. 19 2.3.3 Geographical Focus ............................................................................................................................. 20 2.3.4 Regional Differences for Motives Behind Spin-off Activities ...................................................... 20
2.4 Bondholder Wealth Transfer........................................................................................................ 21
2.5 Ambiguous Definitions ................................................................................................................. 22
2.6 Summary Literature Review ......................................................................................................... 23
3 Theoretical Background ................................................................................................. 24
3.1 Efficient Market Hypothesis ........................................................................................................ 24
3.2 CAPM and Fama-French Three-Factor Model ......................................................................... 26
3.3 Modigliani Miller and the Irrelevance of Capital Structure ...................................................... 27
3.4 Options and Asset Pricing ............................................................................................................ 28
4 Methodology ................................................................................................................... 29
4.1 Research Approach ........................................................................................................................ 29
4.2 Stock Returns .................................................................................................................................. 30
4.2.1 Stock Returns: Announcement Effect .............................................................................................. 31 4.2.2 Stock Returns: Long-Term Effect ..................................................................................................... 33
4.3 Value-Creating Factors .................................................................................................................. 37
4.3.1 Proxies .................................................................................................................................................... 38 4.3.2 Test of Factor Variables ...................................................................................................................... 39
4.4 Bond Returns .................................................................................................................................. 41
4.4.1 Bond Returns: Spin-off Announcement Effect .............................................................................. 41 4.4.2 Aggregated Return from Spin-off Announcement ......................................................................... 43 4.4.3 Shareholders Gain on Behalf of Bondholders ................................................................................. 44

4
5 Data ................................................................................................................................. 45
5.1 Sample Collection .......................................................................................................................... 45
5.1.1 Samples ................................................................................................................................................... 46 5.2 Data Collection of Benchmarks and Factor Proxies ................................................................ 47
5.3 Sample Characteristics ................................................................................................................... 48
5.4 Data Collection and Validation .................................................................................................... 51
5.5 Share Price Collection ................................................................................................................... 52
5.6 Bond Data Collection and Characteristics ................................................................................. 53
6 Hypotheses ..................................................................................................................... 56
7 Empirical Findings ......................................................................................................... 57
7.1 Stock Returns .................................................................................................................................. 57
7.1.1 Announcement Effect ......................................................................................................................... 57 7.1.2 Long-term Effect .................................................................................................................................. 61
7.2 Shareholder Value-creating Factors ............................................................................................ 67
7.2.1 Value-creating Factors: Spin-off Announcement Effect ............................................................... 67 7.2.3 Value-creating Factors: Long-Term Effect ...................................................................................... 70
7.3 Bond Returns .................................................................................................................................. 75
7.3.1 Bond Returns: Spin-off Announcement Effect .............................................................................. 75 7.3.2 Total Announcement Wealth Effect ................................................................................................. 75 7.3.3 Cross-Sectional Relationship between Shareholders and Bondholders....................................... 76
8 Discussion ....................................................................................................................... 78
8.1 Stock Returns .................................................................................................................................. 79
8.1.1 Impact of Spin-off Announcement ................................................................................................... 79 8.1.2 Spin-off Impact on Long-term Performance ................................................................................... 80 8.1.3 Long-term Methodology Discussion................................................................................................. 82
8.2 Value-creating Factors ................................................................................................................... 83
8.2.1 Corporate Focus ................................................................................................................................... 84 8.2.2 Information Asymmetry ...................................................................................................................... 85 8.2.3 Relative Spin-off Size ........................................................................................................................... 87
8.3 Bond Returns .................................................................................................................................. 88
8.4 Reflections ....................................................................................................................................... 89
8.5 Suggested Further Research ......................................................................................................... 90
9 Conclusion ...................................................................................................................... 92
10. Bibliography ................................................................................................................. 94

5
List of Figures
Figure 1.1 – Overview of Divestiture Methods 10
Figure 1.2 – Equity Carve-out 11
Figure 1.3 – Spin-off 12
Figure 4.1 – Conceptual Framework 29
Figure 4.2 – Calendar-time Portfolio Approach 34
Figure 4.3 – Bond Index Selection 42
Figure 7.1 – Abnormal Return at Announcement 59
Figure 7.2 – Announcement Abnormal Return 60
List of Tables
Table 2.1 – Previous Studies of the Announcement Effect 14
Table 2.2 – Previous Studies of the Long-term Effect 16
Table 2.3 – Previous Studies of the Wealth Transfer 22
Table 5.1 – Sample Collection Overview 45
Table 5.2 – Spin-off by Year and Country 48
Table 5.3 – Spin-offs by Country 49
Table 5.4 – Spin-offs by Industry 50
Table 5.6 – Bond Related Spin-offs by Country and Year 53
Table 5.7 – Bond Related Spin-offs by Country 54
Table 5.8 – Bond Related Spin-offs by Industry 55
Table 7.1 – Spin-off Announcement Effect 58
Table 7.2 – Cumulative Average Abnormal Returns (CAAR) 59
Table 7.3 – Fama-French Three-Factor Regressions 62
Table 7.4 – Average Buy-And-Hold Returns 65
Table 7.5 – Announcement Factor Investigation 68
Table 7.6 – Calendar-time Portfolio Factor Investigation 71
Table 7.7 – Industry Match Factor Investigation 74
Table 7.8 – Announcement Abnormal Bond Return 75
Table 7.9 – Aggregate Return 76
Table 7.10 – Abnormal Value Change 76
Table 8.1 – Concluding Framework 78

6
1 Introduction
In this thesis, we investigate the wealth effects associated with European corporate spin-offs.
Investigations are done prior to the separation and up to three years subsequent the spin-off. The
spin-off phenomenon has been more common in the US market and therefore more researched
there. The evidence of how this form of restructuring creates value is scarcer for the European
market. In the following sections, we discuss the background of the study, the purpose, the
research question, the main contributions, limitations and define the key terms used throughout
the thesis.
1.1 Background
From the 1960s up to the 1980s, large conglomerate firms were common in the corporate
landscape. The market trend was to expand the scope of corporate empires by acquiring both
related and unrelated businesses. Conglomerates were long argued to be advantageous in terms of
diversification possibilities and the potential for vertical integration. (Leinwand & Mainardi, 2012)
However, as firms increase their scope they also become more complex. Broad diversification
poses challenges in terms of effectively managing all the various business lines. Similarly, it can be
argued that large conglomerates are at greater risk of being subject to agency issues. The larger the
firm, the higher the cost of maintaining control and transparency. Instead of a premium, there is
a clear risk for conglomerate discounts, implying that the valuation of a diversified firm is lower
than the sum of its parts. This argument, along with the overall management objective of
maximizing shareholder value, could motivate companies to divest unrelated lines of business
rather than acquire them.
Furthermore, as capital markets have become more open and accessible in the last 30 years
investors are now able to achieve increased diversification of their portfolios by buying individual
stocks instead of conglomerates. It appears that investor focus in the 21st century has changed and
that investors are now more interested in investing in focused pure-play business models to
promote transparency and focus on core competencies. Divestures and outsourcing have therefore
become increasingly common corporate strategies, and active investors drive these themes actively
and sometimes aggressively. (McIvor, 2007)
A strategy that has increased in popularity is to divest a unit through a spin-off, implying a complete
separation between the parent firm and its subsidiary, making the subsidiary an independent firm
with its own management. The spin-off is a completely cash-free transaction, where the shares are
pro-rata distributed to the existing shareholders. Spin-offs are meant to improve managerial
efficiency by reducing potential misallocation of capital and enabling improved investment

7
decisions and corporate focus. By reducing the diversity of operations carried out under a single
management, spin-offs could lead to improved utilization of the firm asset base once operations
have been separated. Moreover, the management of the new firm often comes from or has
experience with the parent firm. This implies an opportunity for the spin-off to be supported by
previous experiences while being liberated from the history and perception of the parent. The
spin-off can thus realize the potential of existing strategies parallel to the development and growth
of new ideas unhampered by the past.
Overall, a positive wealth effect associated with spin-off activity has been documented. Building
on a previously documented positive spin-off announcement effect, one academic study that has
received significant attention is that by Cusatis, Miles and Woolridge (1993). They prove that spun-
off subsidiaries outperform their industry peers and the market by approximately 10% yearly in
the three first years subsequent to the separation. Similarly, the parent firms are proved to
outperform the market by an annual average of 6% during the same period (Cusatis et al., 1993).
Later studies have generally documented positive effects of corporate spin-offs. However, the
spin-off phenomenon has mainly been investigated in the US market, whereas the European
markets have been understudied. Historically, there have been various European legal barriers
preventing spin-offs, a main factor limiting their popularity (Veld & Veld-Merkoulova, 2009).
However, with a regulatory framework more favorable for spin-offs and an increased need for
corporate transparency, spin-offs have become increasingly popular in Europe. Additionally, with
increased global competition, managers are forced to continuously seek new ways to generate
growth and improve capital efficiency.
1.2 Purpose
Multiple spin-off studies have been conducted in the US, but the European market has been
understudied. Evidence of the overall wealth effect is weak, and the specific value-creating sources
remain relatively unclear. Therefore, the aim of this thesis is to empirically analyze the wealth
effects of European corporate spin-offs so that managers and shareholders of modern
corporations can more accurately evaluate their options in attempts to maximize shareholder value.
It should be noted that we primarily aim to investigate the impact of spin-offs on the passive
shareholder, that is, an investor that holds stocks in the parent firm prior to the spin-off but does
not actively trade the stock. Naturally, the analysis will simultaneously touch upon the implications
of the spin-off for active investors.

8
1.3 Research Question
The weak and inconclusive findings concerning previous European spin-offs motivates us to
further explore shareholder value creation. Our ambition for this thesis is to add robustness to
existing research, derive results that are more up to date, and investigate wealth sources not yet
explored for European markets. To that end, we intend to answer the following research question,
which is the foundation of this study:
Do European spin-offs create shareholder value, and what sources explain
possible wealth gains?
The research question will be answered by an examination of following sub questions:
i) What are the wealth effects associated with the announcement of a spin-off? Does the
announcement effect differ between shareholders and bondholders?
ii) Are there any long-term shareholder wealth effects associated with spin-off activity?
How does the parent and its spun-off subsidiary perform separately and what is the pro-
forma effect?
iii) What factors can explain possible shareholder wealth effects at announcement and on
long-term?
1.4 Contribution
This thesis contributes to the existing research on spin-offs in several ways. The sample size used
in this thesis is larger compared to the sample sizes in previous European studies. In addition, the
study is more up to date, being conducted more than a decade after the last peer-reviewed study.
The obtained results verify those of previous European studies in that we find a positive abnormal
return upon the announcement of spin-offs. In addition, the long-term performance of parent
firms and pro-forma combined firms is found to be insignificant, which is also in line with previous
studies. It is noteworthy that owning only the parent firm can imply a negative economic impact,
while owning both the parent and subsidiary does not appear to hurt an investor or be particularly
beneficial. However, this thesis is the first European study to find significant positive long-term
outperformance of spun-off subsidiary. It can also be seen that a larger relative spin-off size is
particularly beneficial at the announcement of the spin-off, while in the longer term it is irrelevant
for the performance.
Finally, due to the increased popularity of corporate bonds in Europe and the improved availability
of data, we are the first study to test if the hypothesis of bondholder wealth expropriation is

9
applicable to European markets. Using tests similar to those in previous US-based research, we
are able to identify a significant wealth transfer from bondholders upon the spin-off
announcement, which is shown to partly explain the positive shareholder gain.
1.5 Limitations and Delimitations
This thesis aims to give an overview of the implications of spin-offs. In terms of the quantitative
research, the larger the sample size the more robust the results. Although the study has a larger
sample size compared to other European studies, the main limitation is data availability.
For announcement investigations, we recognize the fact that we are not incorporating the time
window between the spin-off announcement and the dividend date. Therefore, there is a risk that
the total potential value creation of spin-offs is not fully captured. For the average firm included
in the applied sample, the number of days from announcement date to the first day of trading for
the spun-off subsidiary reached 131 days.
The examination of long-term spin-off performance does not follow the matching-firm
methodology applied by the majority of the existing research. We do not employ this approach
because of the difficulty of finding appropriate matches for each observation within each country-
specific market. Instead, we apply two methodologies that have been suggested by previous studies
to yield similar results. Thus, they complement each other, increasing the robustness of the
analysis.
In this study, we investigate potential factors to explain value creation. Previous research has
investigated factors such as geographical focus; legal and tax consequences; takeover activity; and
contemporaneous market psychology. We do not investigate these factors as we wish to focus on
the factors most commonly used in spin-off research.
Similarly, the methodology used in investigating bond returns does not follow the same matching
approach employed in previous research. Instead, a bond index is employed. However, this does
not account for differences in duration, which results in bias. The methodology relies on the
matching of each bond to an index of similar risk, measured by credit rating. In this thesis, we rely
on risk classifications of investment grade quality and high yield. These credit ratings span a large
range of risk classifications and as such are a simplification. The argument for applying a duration
and a more appropriate risk-matched portfolio is that bond returns increase in volatility as time to
maturity lengthens and credit ratings fall.

10
1.6 Definitions
This section outlines the most common divestiture forms and the differences between them. The
definition of spin-off will be closely followed in gathering the data.
1.6.1 Divestiture Methods
Figure 1.1 – Overview of Divestiture Methods Source: Own illustration
A divestiture or divestment refers to the separation of an asset by a firm. Divestitures take many
forms. For instance, the separation can imply a complete or partial separation of management
control. Similarly, the asset can be sold for cash or disposed of on a pro-rata basis to shareholders
in exchange for new shares. The most common forms of divestitures include sell-offs, equity carve-
outs and spin-offs.
1.6.1.1 Sell-offs
Sell-offs allow firms to completely relinquish ownership and control of sold assets. In a sell-off, a
certain asset (such as a unit, division, subsidiary, etc.) is sold to another entity in exchange for cash
or securities. A sell-off can occur for many reasons. For instance, a unit could be sold off as a
result of disappointing earnings or due to the streamlining of business operations.
Asset sales are often motivated by liquidity constraints or a desire to pay down debt; it is therefore
very common for a seller to receive cash (Desai & Jain, 1999). If not used for corporate purposes,
gains could also be distributed to shareholders (Prezas & Simonyan, 2015). The proceeds from the
sell-off are taxable to the parent firm.
Restructuring options
Operational
restructuring
Divestiture/ Ownership restructuring
Private
arena
Public arena
Type of restructuring Description Example
Joint Venture • Venture Capitalist partner for
business development, or
• Integration to exploit synergies
• Vestas - Mitsubishi
Sell-off • Sell all or part of business to
financial/strategic buyer
• Maersk Oil
• DONG Energy
LBO / MBO • Management or investor acquires
business who uses significant
leverage in financing
• TDC
• Nets
Spin-off • Parent firm distributes shares of
business unit to shareholders
• NKT – Nilfisk
• SCA - Essity
Carve-out • Sell portion or all shares of
business through IPO
• Siemens - Infineon
Split-off • Parent shareholders are offered
shares of a subsidiary in exchange
for parent shares
• Sara Lee - Coach

11
1.6.1.2 Equity Carve-outs
A carve-out or equity carve-out is a partial divestiture of a business unit, where the parent company
sells a portion of the subsidiary shares to outside investors. The parent company keeps a fraction
of the shares and also retains management control. Carve-out strategies can be preferred over total
divestitures if the business unit is deeply integrated with the rest of the firm. (Pedersen, 2015)
Equity carve-outs are tax-free transactions where the subsidiary’s equity can be sold to the public
in a partial initial public offering (IPO) or awarded to parent shareholders on a pro-rata basis. A
partial IPO implies an exchange of cash for shares and is a common method for companies to
raise cash to finance growth opportunities for the carved-out subsidiary. The carve-out can often
be followed by a spin-off or split-off of the remaining parent shares (Pedersen, 2015). Other names
for equity carve-out are split-off IPO and partial spin-off.
Figure 1.2 – Equity Carve-out Source: Own illustration
1.6.1.3 Spin-offs
A spin-off refers to the separation of a subset of assets of a parent company to a new corporate
entity. As such, the parent company discharges ownership of the spin-off assets. However,
ownership is not completely taken from shareholders because they receive a pro-rata distribution
of the shares in the new firm. As a result, the spun-off subsidiary is independent from the parent
firm but initially retains the same shareholder base. The proceeds are considered non-cash
dividends from the parent company and are therefore often tax-free for shareholders. This way of
divesting raises no new capital for the joint firm, and therefore it cannot be motivated by a desire
to generate cash to pay off debt, which is often the case with other divestiture methods
(Krishnaswami & Subramanian, 1999). Depending on the location and conditions of the spin-off,
it can have tax consequences for the divesting firm (Veld & Veld-Merkoulova, 2009).
Clearly, the main reason for spin-offs is because the value of the spin-off entity and that of its
parent are expected to exceed the value of the parent prior to the spin-off. As will be presented in
the Literature Review, there are different arguments for why this separation is more valuable.
Subsidiary
Rest of parent
company
Parent company
Interest in
subsidiary
Rest of parent
company
Floating shares
of subsidiary

12
Figure 1.3 – Spin-Off Source: Own illustration
1.6.1.4 Split-offs
A split-off is very similar to a spin-off. The difference is that the shareholders of the parent
company can decide whether to tender parent shares in exchange for shares in the subsidiary
(Pedersen, 2015).
1.7 Structure
The remainder of the thesis is organized as follows:
Chapter 2 reviews the previous research on corporate spin-offs. Motives for spin-offs,
potential wealth explanatory factors, and empirical evidence are outlined.
Chapter 3 presents the theoretical frameworks against which the spin-off performance is
assessed and evaluated.
Chapter 4 introduces the methodologies employed in this study that approach the spin-off
wealth effect from different angles. These include methods to investigate stock returns,
value-creating factors, and bond returns upon spin-off announcement and methods to
examine stock prices and value-creating factors in the long-term.
Chapter 5 describes the data collection procedure and characteristics of the gathered data.
Chapter 6 states the hypotheses put forward based on previous research and theoretical
frameworks.
Chapter 7 describes the empirical findings obtained by applying the described
methodology to the collected data. The results are compared with those of previous
research, and hypotheses are accepted or rejected.
Chapter 8 critically evaluates and further discusses the implications of the empirical
findings in relation to previous research and theoretical frameworks.
Chapter 9 concludes the key findings of the study.
Subsidiary
Rest of parent
company
Parent companySubsidiary
Rest of parent
company

13
2 Literature Review
In this section, we present the key empirical findings of relevant previous research. To begin with,
research that examines the announcement value effects associated with spin-offs is presented,
followed by research about the long-term impact. We then review different factors that potentially
explain shareholder value gains associated with spin-offs. Finally, research examining a potential
wealth transfer from bondholders to shareholders is presented.
2.1 Shareholder Value Creation Associated with Spin-offs
To capture the full value created through a spin-off, one must measure any potential value created
upon announcement of the spin-off and its long-term impact. As a result of shareholders
ownership being maintained on a pro-rata basis, any potential shareholder value created can be
analyzed upon the announcement and after the actual spin-off. As such, we are able to see and
analyze the effect of any wealth-creating factors related to shareholders’ valuation for the firm
prior to the spin-off.
Based on peer-reviewed literature dating back to the 1980s, researchers have been able to identify
a positive abnormal return for shareholders upon the public announcement of spin-offs. Using
different sample sizes from different geographies, significant abnormal return between +1.3% and
+5.6% has been documented. The vast majority of the research has studied US markets. Some
pioneering researchers who have documented positive abnormal return for spin-offs in the US
market include Hite and Owers (1983), Miles and Rosenfeld (1983), and Schipper and Smith
(1983). In contrast, the effect of spin-offs on European markets were first examined at the
beginning of the 21st century with the research of Kirchmaier (2003), Veld and Veld-Merkoulova
(2004), and Sudarsanam and Qian (2007). In line with the US studies, the European studies also
find a positive abnormal/excess return upon the announcement of spin-offs ranging between
+2.6% and +5.4%. Table 2.1 summarizes the empirical findings of existing research regarding the
wealth effects of spin-off announcements.

14
Table 2.1 – Previous Studies of the Announcement Effect
The positive abnormal stock returns associated with the announcement of spin-offs reflects
investors’ expectations for improved performance by the spin-off entity and its parent in the
future. Presumably, these expectations become incorporated in the share price of the parent at
announcement; therefore, we should not expect to observe any post spin-off abnormal returns.
However, as previously mentioned, Cusatis et al. (1993) have proven there are positive effects up
to three years subsequent to the spin-off, both for the spun-off subsidiary and the parent. The
excess return generated by spin-offs is particularly high during the second year, while parents
perform best in the first two years after the spin-off (Cusatis et al., 1993).
Desai and Jain (1999), McConnell and Ovtchinnikov (2004) and Rüdisüli (2005) confirm that on
average, spin-offs generate long-term abnormal/excess returns. McConnell and Ovtchinnikov
(2004) shows that the subsidiary tends to generate the highest outperformance over the first 12
months of trading, which contrasts with the findings of Cusatis et al. (1993). This finding also
rejects the generally followed and accepted theory introduced by Cusatis et al. (1993) that investors
should not purchase spin-off companies in the first six months following the initial listing to avoid
a downside risk associated with institutional investors’ portfolio rebalancing following spin-offs.
Author(s) Year Region(s)Research
Period
Sample
Size
Event
Window
Abnormal
Return
Event
Window
Abnormal
Return
Schipper and Smith 1983 USA 1963-1981 93 (-1, 0) 2.84%*** (-5, 5) 3.50%
Hite and Owers 1983 USA 1963-1981 123 (-1, 0) 3.3%***
Miles and Rosenfeld 1983 USA 1963-1980 55 (0, 1) 3.34%*** (-5, 5) +7.30%
Rosenfeld 1984 USA 1963-1981 35 (-1, 0) 5.56%***
Copeland et al. 1987 USA 1962-1982 188 (-1, 0) 3.03%***
Denning 1988 USA 1970-1982 42 (-6, 6) 2.6%
Seifert and Rubin 1989 USA 1968-1983 51 (-1, 0) 3.26%***
Ball et al. 1993 USA 1968-1990 39 (-1, 0) 2.6%
Vijh 1994 USA 1964-1990 113 (-1, 0) 2.9%***
Allen et al. 1995 USA 1962-1991 94 (-1, 0) 2.15%*** (-4, 4) 2.49%***
Michaely and Shaw 1995 USA 1981-1988 9 (-2, 2) 4.46%*
Slovin et al. 1995 USA 1980-1991 37 (0, 1) 1.32%**
Seward and Walsh 1996 USA 1972-1987 78 (-1, 0) 2.6%***
Johnson et al. 1996 USA 1975-1988 104 (-1, 0) 3.96%***
Daley et al. 1997 USA 1975-1991 85 (-1, 0) 3.4%***
Desai and Jain 1999 USA 1975-1991 144 (-1, 1) 3.84%***
Krishnaswami and Subramaniam 1999 USA 1978-1993 118 (-1, 1) 3.28%*** (0) 1.8%***
Mulherin and Boone 2000 USA 1990-1998 106 (-1, 1) 4.51%***
Gertner et al. 2002 USA 1981-1996 160 (-1, 1) 3.9%***
Maxwell and Rao 2003 USA 1976-1999 79 (0, 1) 3.59%***
Kirchmaier 2003 Europe 1989-1999 48 (-1, 1) 5.4%*** (5, 5) 5.5%***
Veld and Veld-Merkoulova 2004 Europe 1987-2000 156 (-1, 1) 2.62%*** (0) 1.19%***
Rudisuli 2005 USA, Europe 1990-2003 772 (-1, 0) 2.8%*** (-10, 10) 2.8%***
Sudarsanam and Qian 2007 Europe 1987-2005 157 (-1, 1) 4.82%*** (0) 3.45%***
Veld and Veld-Merkoulova 2009 World 1995-2002 91 (-1, 1) 3.07%***
The t-statistics test the hypothesis that the mean holding-period returns equal zero. (***) 1% signif icance, (**) 5% signif icance, (***) 10%
signif icance; two-tailed tests.

15
However, neither Desai and Jain (1999), McConnell and Ovtchinnikov (2004) nor Rüdisüli (2005)
find any statistically significant abnormal/excess return for parent companies. McConnell and
Ovtchinnikov (2004) explain that the difference in their findings compared to those of Cusatis et
al. (1993) is the result of different time periods. It appears that parent companies have unusually
high returns, specifically between 1964 and 1988, which is the sample period used by Cusatis et al.
(1993). Still, both McConnell and Ovtchinnikov (2004) and Desai and Jain (1999) find positive,
insignificant abnormal/excess returns for parent companies. Therefore, it could be argued that an
investor who only attempts to stay in the market is not hurt by investing in parent companies.
The studies discussed above conclude that on average there are long-term abnormal/excess
returns for spun-off subsidiaries. However, other research questions the validity of these results.
Fama (1998) criticizes the t-statistics calculations done by Cusatis et al. (1993), where the buy-and-
hold excess returns of the event firms are assumed to be independent. If adjusting for cross-
correlation, the results would not suggest any real anomaly (Fama, 1998). McConnell et al. (2001)
adjust for cross-correlation and find that the results of different tests are highly dependent on what
performance benchmark is employed. Returns are compared against three different benchmarks,
and the overall result of the analysis does not provide any robust evidence for long-term
abnormal/excess performance. Furthermore, the results are strongly positively affected by an
outlier parent firm (McConnell et al., 2001). Applying the same methodology, neither Veld and
Veld-Merkoulova (2004) nor Sudarsanam and Qian (2007) find any statistically significant long-
term abnormal/excess returns for European parent firms or their spun-off subsidiaries. However,
a tendency for an economically positive impact can be observed.

16
Table 2.2 summarizes the empirical findings of existing research on the long-term performance of
spin-offs.
Table 2.2 – Previous Studies of the Long-term Effect
2.2 Factors Explaining Shareholder Value Creation Associated with Spin-offs
As seen, there is a broad body of research documenting abnormal returns following corporate
spin-offs. There are also theories about and empirical evidence for different factors that explain
these wealth effects. In this section, we present some of the different factors, which will be tested
later.
2.2.1 Corporate Focus
As an independent company, a spin-off entity risks losing potential synergy with the parent
company. However, a company that is too diversified is at risk of diluted attention on the part of
managers, limiting total firm performance. Cross-subsidies have been shown to contribute to value
losses in diversified firms (Berger & Ofek, 1995). A spin-off is a way to eliminate cross-subsidies
by separating unrelated lines of business.
Consequently, improving corporate focus is often claimed to be the motive behind spin-offs, and
as such the associated wealth effects have been widely researched. In previous research, a spin-off
is generally defined as focus-increasing if the parent company has a different two-digit standard
industry classification (SIC) code than the spun-off subsidiary. Daley et al. (1997) find significant
T+6M T+12M T+24M T+36M
Cusatis, Miles and Woolridge 1993 USA 1965-1988 131 Parent +6.80%* +12.50%** +26.70%** +18.10%
146 Subsidiary -1.00% +4.50% +25.00%** +33.60%**
141 Proforma +4.70% +18.90%** +13.90%
Michaely and Shaw 1995 USA 1981-1988 30 Subsidiary -36.60%*** -59.13%***
Desai and Jain 1999 USA 1975-1991 155 Parent +6.51% +10.58% +15.18%
162 Subsidiary +15.69%*** +36.19%*** +32.32%***
155 Proforma +7.69% +12.70% +19.82%***
McConnel, Ozbilgin and Wahal 2001 USA 1989-1995 80 Parent +8.64% +13.48% +19.21% +5.14%
96 Subsidiary +8.90% +7.21% +5.75% -20.87%
Powers 2001 USA 1989-1998 187 Parent +2.49%
187 Subsidiary -6.25%
Kirchmaier 2003 Europe 1987-2000 34 Parent -4.90% 0-99 days -5.90% 0-699 days
41 Subsidiary -4.20% 0-99 days +17.30%* 0-699 days
34 Proforma -7.30%* 0-99 days +4.20% 0-699 days
Veld and Veld-Merkoulova 2004 Europe 1965-2000 68-106 Parent +3.88% -0.65% +6.49% -0.41%
53-70 Subsidiary +11.96% +12.58% +13.72% +15.15%
45-61 Proforma -2.23% -2.33% +4.24% +2.01%
McConnel and Ovtchinnikov 2004 USA 1990-2003 267 Parent +10.70% +5.91% +4.64% -2.21%
311 Subsidiary +12.20% +10.59%** +8.20% +2.87%**
Rudisuli 2005 USA and 1980-2005 330-435 Parent +7.70% +17.30% +15.90%
Europe 229-336 Subsidiary +18.90%** +30.90%*** +55.80%**
Sudarsanam and Qian 2007 Europe 1994-2006 129 Parent -3.90% -6.20% +7.10%
142 Subsidiary +7.20% +17.50% +23.00%
129 Proforma -2.30% +8.30% +8.40%
The test statistic test the hypothesis that the mean holding-period return equal to zero. (***) 1% significance, (**) 5% significance, (*) 10% significance; two-tailed test
Excess/Abnormal returnResearch
PeriodRegion (s)YearAuthor(s)
Firm /
Security
Sample
Size

17
value creation around the announcement date for focus-increasing spin-offs only, while Desai and
Jain (1999), Veld and Veld-Merkoulova (2004), and Krishnaswami and Subramaniam (1999) find
positive abnormal/excess returns around the announcement date for both focus-increasing and
non-focus-increasing spin-offs. However, all studies find that focus-increasing spin-offs
outperform non-focus-increasing firms upon the announcement.
Regarding long-term performance, Desai and Jain (1999) show that abnormal/excess returns for
focus-increasing spin-offs are significantly larger than for non-focus-increasing spin-offs. The
findings are similar for the parent firms but are non-significant. While their study is limited to firms
in the US, Veld and Veld-Merkoulova (2004) find no such significant long-term outperformance
for European focus-increasing spin-offs.
Furthermore, Daley et al. (1997) report a significant improvement in operating performance
(measured as return on assets) for the focus-increasing spin-offs compared to the non-focus-
increasing cases. This is also found by Desai and Jain (1999) and Chemmanur et al. (2014). Desai
and Jain (1999) even use cross-sectional regressions to further strengthen evidence of a direct
association between change in focus and operating performance.
In line with the hypothesis that spin-off activity creates value due to the streamlining of core
operations, both Daley et al. (1997) and Chemmanur et al. (2014) find that operating performance
improvements occur primarily in entities that remain with the parent company. It is shown that
engagement in spin-offs increases the productivity, that this improvement is long-lived, and that it
can be attributed to cost savings rather than higher sales. However, unlike speculations in earlier
studies, the spun-off subsidiaries are not found to underperform their parents prior to the spin-
off (Chemmanur et al., 2014).
2.2.2 Information Asymmetry
For most suggested factors explaining spin-off value creation, it could be argued that other
divestiture methods should work just as well as a spin-off. Spin-offs differ from other divestiture
methods in that no cash is raised by the firm; therefore, it could be argued that spin-offs are an
especially appropriate divestiture method to increase information transparency (Krishnaswami &
Subramaniam, 1999). Following this argument, the wealth effect could potentially be attributed to
an improved ability to convey information about the entities’ individual operating efficiency and
future prospects to investors. As such, managers should be motivated to pursue spin-offs if they
deem the firm to be undervalued (Sudarsanam & Qian, 2007).

18
Habib et al. (1997) are among the first to suggest that a firm can decrease information asymmetry
by spinning off a subsidiary, thus increasing firm value. The increased information availability is
claimed to be a result of internal effects, for instance more and clearer reports, and external impact,
as the spin-off also leads to an increase in the number of securities traded on the market. In
summary, eventual undervaluation is explored and corrected, generating a higher share value
(Habib et al., 1997).
Krishnaswami and Subramaniam (1999) are the first to test this hypothesis. They use data on
analysts’ earnings forecasts collected from the Institute of Brokerage for Investment Services
(IBES) and test five different measurements of information asymmetry. Overall, they found that
firms that engage in spin-offs show higher levels of information asymmetry compared to their
industry- and size-matched counterparts. Furthermore, the authors show that this information
asymmetry decreases significantly after the spin-off. Additionally, firms with higher growth
opportunities and firms in need of external capital show a greater tendency to engage in spin-offs.
Capital is often raised after the spin-off, which according to Krishnaswami and Subramaniam
(1999) is consistent with the view that these firms mitigate information asymmetry before
approaching the capital market for funds.
In contrast to the above arguments, Veld and Veld-Merkoulova (2004) find a stronger positive
correlation between low information asymmetry and cumulative abnormal return (CAR) than for
high information asymmetry. Therefore, the hypothesis is rejected. Similarly, Sudarsanam and Qian
(2007) do not find evidence of information asymmetry explaining the wealth effect of spin-offs. It
is noteworthy that these studies are of European firms, while Habib et al. (1997) and Krishnaswami
and Subramaniam (1999) investigate US firms. However, in a global study by Veld and Veld-
Merkoulova (2009), they find the information asymmetry variable is not significant. This question
if information asymmetry could explain any wealth creation.
2.2.3 Relative Spin-off Size
The relative size of the spun-off subsidiary has further been argued to explain its performance and
value creation. It is generally claimed that the larger the relative size of the spin-off subsidiary, the
larger the value creation. This argument is related to the efficiency improvement associated with
increased firm focus. Schipper and Smith (1983) suggest that management productivity is
improved by reducing the size and diversity of firm assets. In addition, with a smaller asset base
the number of transactions within the company is reduced. Finally, by spinning off a larger unit it
is assumed that more value-destroying activities are eliminated, thus increasing the total value of
the remaining assets. In line with this hypothesis, Hite and Owers (1983), Miles and Rosenfeld

19
(1983), Krishnaswami and Subramaniam (1999), and Veld and Veld-Merkoulova (2004) show that
announcement returns are higher for larger spin-offs compared to smaller ones.
Chemmanur and Yan (2004) argue differently, suggesting that the larger the proportion of assets
being spun off by the parent, the more likely the parent is to be a target for takeover, thus increasing
shareholder value.
As a concluding remark, we would like to highlight that no previous study has found that this
factor explains any positive long-term performance.
2.3 Other Factors
In the following sections, we discuss other factors that could motivate corporate spin-offs. These
factors are not investigated in this thesis, as we aim to test the most commonly used factors in
spin-off research. However, these factors will to a various extent be involved later on in the
discussion section.
2.3.1 Investor Attitude
Previous researchers find evidence that the investor's demand for pure-play business models is
time-varying. In periods, the investor appetite for conglomerates is larger than for pure-play
business models and vice versa. This is suggested to explain different valuation effects of
diversifying refocusing transactions. Stocks subject to excessive demand become overpriced. As
such, when the investor sentiment has a larger appetite for pure-play business models, there is an
incentive for managers to cater a temporary investor demand by spinning off overvalued subsidiary
businesses to shareholders (Sudarsanam & Qian, 2007).
The catering theory is proved to hold by Sudarsanam and Qian (2007). It is shown for European
firms, that the stock market reaction to corporate restructurings is affected by investor sentiments
and not only fundamental value drivers. Furthermore, it is shown that some spin-offs are
undertaken by managers to cater an unrealistic investor demand for stocks with glamour status.
Spin-offs with glamour status outperform other spin-offs around announcement, however show
a long-run underperformance. (Sudarsanam & Qian, 2007)
2.3.2 Takeover Activity
Some studies argue that the wealth effect associated with spin-offs is the result of an increased
likelihood that the new company will be acquired. Cusatis et al. (1993) find that both spin-offs and
parents experience significantly more takeovers than control groups of similar firms. It is further
shown that the observed long-term abnormal returns primarily occur in firms that later are

20
involved in takeover activity. Their findings indicate a strong relationship between spin-off
abnormal returns and takeover activity, suggesting that investors have not fully anticipated the
increased takeover activity and therefore tend to underestimate the value created by spin-offs.
(Cusatis et al., 1993)
Desai and Jain (1999) achieved similar results when replicating their own analysis for firms that
did not experience any takeover activity within three years following spin-offs. This suggests that
long-term abnormal returns are not driven by this factor. Similarly, McConnell et al. (2001) do not
find that takeover activity has any particular impact. However, they suggest that different takeover
premiums for various investigation periods could partly explain the varied findings in previous
research (McConnell et al., 2001).
2.3.3 Geographical Focus
Veld and Veld-Merkoulova (2004) suggest that an increase in geographical focus may either be
associated with higher or lower abnormal returns. The announcement could lower firm value due
to reduced economies of scale or relative disadvantage to more geographically diversified
competitors. Similarly, firm value could potentially also decrease if the spin-off is signaling that
earlier decisions to expand abroad were not successful.
On the contrary, the geographically focused increasing spin-off could increase firm value due to
increased effectiveness in a particular area. Similarly, the management could be perceived as active
in optimizing firm value. Potentially reduced monitoring and coordination costs could also be
value creating. Following this hypothesis, the overall effect will be determined by the relative
strengths of these arguments. However, test results show that geographical focus is insignificant
in explaining abnormal announcement returns (Veld & Veld-Merkoulova, 2004).
2.3.4 Regional Differences for Motives Behind Spin-off Activities
Studies investigating the wealth effects associated with spin-offs contribute with different angles
and results. One reason for differing results is the region where the investigation takes place. This
section briefly touches upon why motives and wealth effects for spin-offs can differ between
regions.
2.3.4.1 Corporate Governance
According to the index of La Porta et al. (1998), shareholders in Anglo-Saxon countries are more
protected than shareholders in continental Europe. As such, long-term excess returns should be
higher for countries with greater degrees of shareholder protection. However, Veld and Veld-
Merkoulova (2004) find that long-term excess returns are higher for countries with less shareholder

21
protection, implying that differences in corporate governance systems have no explanatory power
(Veld & Veld-Merkoulova, 2004).
2.3.4.2 Tax Treatment
Spin-off tax treatment also differs between countries. Krishnaswami and Subramaniam (1999)
investigate the tax effect in the US, where some spin-offs are taxable. The results indicate that
taxable spin-offs show lower abnormal returns compared to non-taxable spin-offs.
Veld and Veld-Merkoulova (2004) claim that spin-offs in Europe generally do not have tax issues,
as it is possible to defer tax payments. Furthermore, for the two central markets of Germany and
France, eventual tax consequences are not known in advance because they depend on the actions
of the investors subsequent to the spin-off. As the direct tax effect is ambiguous and hard to
measure accurately, there are no general conclusions about it.
2.3.4.3 Regulation
Previous research has also investigated whether regulatory motives play a role in engagement in
spin-offs. For American companies, both Schipper and Smith (1983) and Krishnaswami and
Subramaniam (1999) show that abnormal returns are not affected by the regulatory status for spin-
offs. Spin-offs are legally possible in all European countries, but Veld and Veld-Merkoulova (2004)
claim there are no motives to engage in spin-offs, specifically due to regulatory reasons.
2.4 Bondholder Wealth Transfer
If managers act to maximize the wealth of shareholders, significant shareholder gains from spin-
offs are not surprising. While a spin-off does not alter the asset composition of the original
shareholders’ claims, it does alter the contract among other stakeholders. Simultaneous with the
spin-off’s redeployment of assets between the two units, the firm’s debt claims are re-contracted.
Therefore, there could be a potential wealth transfer from bondholders to shareholders. (Hite &
Owers, 1983)
The potential debt wealth transfer stems from two sources. First, bondholders may suffer from
loss of collateral and liquidation value due to assets being reassigned between the two companies.
Second, bondholders may suffer from a loss of coinsurance provided by operating cash flow
stemming from two units that might not be positively correlated. Unless bondholders protect
themselves from the loss of collateral with covenants, bondholders may suffer a loss to the benefit
of shareholders. Relating to agency theory, management, who is hired by shareholders and should
act in their interest, has control over how the debt is allocated, unless explicitly limited by
covenants. (Maxwell & Rao, 2003)

22
The effect of a spin-off announcement on bondholder wealth could be argued to depend on how
accurately spin-offs can be forecasted and on the impact on future bondholders’ cash flows. If
bondholders expect reduced future cash flows, the announcement should cause a drop in the bond
prices as the probabilities are revised. As such, if the spin-off does not reduce the bondholders
expected payoff, the announcement should not affect the bond price (Hite & Owers, 1983). Table
2.3 summarizes the empirical findings of existing research related to the wealth transfer hypothesis.
Table 2.3 – Previous Studies of the Wealth Transfer
In their search for explanatory variables, previous studies have found mixed evidence of the
significance of wealth transfer from bondholders to shareholders. These studies have explored US
markets with relatively small samples and limited access to price data (Hite & Owers, 1983;
Schipper & Smith, 1983; Parrino, 1997). In a more recent paper by Maxwell and Rao (2003), the
authors use a larger sample size and find evidence of wealth expropriation, which challenges the
results of previous research. By studying the spin-off companies’ bond returns within the month
of the spin-off announcement, bondholders on average suffer a negative abnormal return of -
0.9%. Simultaneously, shareholders gained 2.9% on average. Maxwell and Rao (2003) also find
evidence that bondholders’ losses are more severe the larger the shareholder gains. They also prove
that the wealth gain of shareholders surpasses the loss of bondholders. As such, some but not all
returns gained by shareholders are attributable to bondholders’ loss.
2.5 Ambiguous Definitions
As indicated above, there are many studies investigating spin-off performance. Even though
previous research in general agrees that spin-offs are value creating, the results vary. The variation
might be due to the use of different time periods, sample sizes, benchmarks, or regions. However,
it is important to note that most studies use different criteria when categorizing spin-offs. Some
studies only include spin-offs that eventually were completed, while others also include spin-off
Author(s) Year RegionResearch
period
Firm /
Security
Sample
size1)
Data typeEvent
WindowAbn. ret.
Hite and Owers 1983 USA 1963-1981 Security 31 Daily (-10,+10)(0.3%; 0.6%,
0.2%, 0.7%)
Schipper and Smith 1983 USA 1963-1981 Security 26 Daily (0,-1) n.a.
Parrino 1997 USA 1993 Security 13 Daily (-60,60) -4.24%
Maxwell and Rao 2003 USA 1976-1997 Firm 80 Monthly (0,-30) -0.88%***
Security 311 Monthly (0,-30) -0.63%***1) Sample size displayed based on firm / security level estimation. If firm-level is analyzed, the figure displays # firms. If security-level is analyzed, the
figure displays # securities. (***) corresponds 1% significance, (**) corresponds 5% significance, (*) corresponds 10% signifianc; two-tailed test

23
announcements that were later withdrawn. Similarly, there are studies that include or exclude spin-
offs that were later merged or acquired. In summary, it is no wonder that studies on this topic
produce different results.
2.6 Summary Literature Review
This section summarizes the findings of previous research, motivating the decision of which angles
of the spin-off wealth effects will be investigated and which hypotheses that later will be
formulated for the tests.
Across all investigated markets, the consensus is that spin-off announcements result in an
abnormal positive return for the shareholders. However, the long-term shareholder return effects
are mixed. A positive economic significance is generally found for most spun-off subsidiaries, but
also for parents. However, these are not statistically significant. It should be noted that most
studies use relatively small sample sizes.
The most common value-creating factors are an increase in corporate focus, equalization of
information asymmetry, and a large relative size of spun-off subsidiary. Regarding increased
corporate focus, all previous research has found the variable to be explanatory at announcement,
with mixed long-term findings. An increase in corporate focus has been shown to significantly
affect operational performance. Information asymmetry has been found to explain positive spin-
off value creation in the US market, both at announcement and long-term. However, European
studies have found contradictory evidence or no significance at all. A larger relative spin-off size
is clearly shown across all previous research to partly explain the positive spin-off announcement
reaction. However, the explanations for why this factor is value-creating differ. Other factors that
are suggested to explain shareholder value creation include market psychology, takeover activity,
geographical focus and specific regionally varying factors.
Finally, there is research investigating the bondholders’ return upon spin-off announcements and
whether this reaction could explain any of the shareholders’ return. There is some significant
evidence for the US market, but the implications of this element for the European market remain
unexplored.
24
3 Theoretical Background
This section discusses various theories and concepts relating to corporate spin-offs. These theories
are described because they support or contradict the hypothesis of corporate spin-offs being value
creating. Therefore, they will be directly and indirectly tested throughout the analysis. The first
subsections below describe the theory behind efficient markets. Thereafter follows a section
describing the Capital Asset Pricing Model (CAPM) and the Fama-French Three-Factor Model.
The latter will be employed as a benchmark in one of the long-term tests to assess the wealth effect
of corporate spin-offs. We then turn to the theory behind the irrelevance of firm capital structure,
which will be relevant in discussing the implications of wealth transfer. In addition, the
interpretation of a firm’s capital structure as options on the firm’s assets is outlined.
3.1 Efficient Market Hypothesis
Since the 1970s, the theory of efficient markets has been greatly debated. The theory suggests that
if financial markets are informationally efficient, the price of an asset at any point in time should
reflect all available information (Fama, 1970). In turn, this implies that risk-adjusted profits cannot
be systematically earned based on trading strategies using only publicly available information and
especially if only based on historical price patterns.
According to the theory, competition in financial markets will lead to informational efficiency,
which is generally supported by empirical studies on the topic. Fama formulized the efficient
market hypothesis in 1970 and presents three categories of efficiency that are dependent on the
nature of the information subset of interest (Fama, 1970).
Strong-form efficiency means that asset prices reflect all relevant information, public and
non-public. Fama states that it cannot be expected that such an extreme model could be
an exact description of the world. Still, it can be viewed as the benchmark against which
the importance of deviations from market efficiency can be evaluated (Fama, 1970).
Semi-strong form efficiency refers to asset prices reflecting all publicly available
information.
Weak-form efficiency implies that asset prices reflect information about historical price
and return sequences, as well as other past trading information. This form of efficiency is
closely connected to the random walk hypothesis, which claims that changes in stock prices
are random and unpredictable (Fama, 1965). However, the strict random walk hypothesis

25
has been proved wrong, as assets generally have positive expected returns, which is why a
price increase is more likely than a decrease.
In practice, most markets are considered to be semi-strong form efficient. This assumption is
based on the fact that professional analysts constantly evaluate publicly available information.
Once new information is discovered, investors start to trade based on this information,
incorporating it in the price. Furthermore, the existence of insider trading restrictions conflict with
strong-form efficiency, thus supporting semi-efficiency.
It can be argued that financial markets can only be efficient to a certain extent, where the costs
related to the information analysis are lower or equal to the value of the benefits. Pedersen (2015)
refers to this argument when claiming markets are efficiently inefficient. Financial markets are
inefficient enough that investors are compensated for their costs through the profits of their
strategies. At the same time, they are efficient enough that the proceeds after costs do not
encourage any additional active investing.
Semi-efficient markets imply that price changes only occur when new information arrives, which
is in line with previous literature findings of positive reactions to spin-off announcements.
However, efficient markets also imply that no asset can persistently obtain positive abnormal
returns, which contradicts some previous studies that find a long-term abnormal return from spin-
offs. Given that all previous studies on the topic report ambiguous findings regarding long-term
performance, there is no profound conclusion about whether the semi-efficient market hypothesis
holds or not. Overall, one should also keep in mind that instead of implying weak efficiency, long-
term spin-off performance could also be a result of inadequate risk adjustments or other
factors/events that positively affect the return.
Additionally, this study treats European companies. Since Europe consists of several individual
markets, all in different conditions, there exists different levels of efficiency that can impact the
results.

26
3.2 CAPM and Fama-French Three-Factor Model
CAPM is based on the mean-variance theory introduced by Markowitz (1952) and describes the
relationship between systematic risk and expected return for assets, primarily for stocks. The
model is based on the following investor assumptions (Berk & DeMarzo, 2014):
I) Investors can buy and sell securities at market prices, that is, no tax or transaction costs exist;
II) Investors can lend or borrow at the risk-free rate;
III) Investors only hold efficient portfolios, that is, they maximize the expected return for any
given volatility; and
IV) Investors’ expectations regarding expected returns, volatilities, and correlations are
homogeneous.
If these assumptions hold, all investments will be a combination of the risk-free asset and the market
portfolio. Given this, the return of an asset can be calculated using the CAPM equation as:
𝑅𝑖 = 𝑟𝑓 + 𝛽𝑖(𝑅𝑚𝑘𝑡 − 𝑟𝑓)
where 𝑅𝑖 is the return for asset 𝑖, 𝑟𝑓 equals the risk-free interest rate, 𝛽𝑖 is the sensitivity of asset j
to market risk, and 𝑅𝑚𝑘𝑡 is the market return during the same period.
The empirical performance of CAPM has turned out to be questionable. This is why different
complementing models have been developed and have been suggested to better explain returns.
Fama and French (1992) introduced an extension of CAPM that includes two additional factors—
Small-minus-Big (SMB) and High-minus-Low (HML). The SMB factor is the return on a portfolio
of shares of small companies (defined by the size of market equity) minus the return on a portfolio
of shares of large companies. The HML factor is the return on a portfolio of stocks with a high
book-to-market value (value stocks) minus the return on a portfolio of stocks with a low book-to-
market value (growth stocks). This model is called the Fama–French Three-Factor model and
calculates asset returns as:
𝑅𝑖 = 𝑟𝑓 + 𝛽1(𝑅𝑚𝑘𝑡 − 𝑟𝑓) + 𝛽2𝑆𝑀𝐵𝑖 + 𝛽3𝐻𝑀𝐿𝑖
where 𝛽1-𝛽3 are the sensitivities of the return on asset 𝑖 with respect to each factor. These factors
are proven to have a reliable power to explain returns.
The explanation behind the SMB factor is that small firms tend to generate higher returns than
stocks of large companies. As such, the firm size is a proxy for risk factors associated with small

27
firms. While researchers are indecisive regarding the underlying risk sources, they are argued to be
linked to liquidity risk and information availability, which tends to be poorer for small firms. This
suggests that size factor is a proxy for information uncertainty (Crain, 2011).
Similarly, value stocks, captured in the HML factor, tend to generate higher returns than growth
stocks. Value stocks are those with a high book-to-market equity ratio compared to the growth
stocks with a low value. Researchers have tried to explain the idea behind the value premium in
several ways. One camp believes the value premium to be compensation for a systematic risk factor,
while the other believes it to stem from irrational investor behavior. Fama and French, who designed
the model, suggest that the reason for the outperformance of value stocks is that low book-to-
market firms are more likely to be financially distressed, causing investors to demand greater
compensation (Fama and French, 1993).
By including these two additional factors, the Fama–French Three-Factor model further adjusts for
the outperformance tendency and provides a premium on financial distress (small companies
perform worse in recession than large companies, and value firms demand a higher expected return
due to their tendency to be hit harder in recession due to their higher levels of tangible assets). The
Fama–French Three-Factor model will be used in this thesis as a benchmark against portfolios of
parents, spun-off subsidiaries and the pro-forma position when investigating the spin-off long-term
wealth effect. The exact procedure is described in more detail in the methodology section.
3.3 Modigliani Miller and the Irrelevance of Capital Structure
Related to the creation of shareholder wealth from corporate spin-offs is the theorem presented by
Modigliani and Miller (1958). Modigliani and Miller argue that in a world with perfect information
symmetry and without transaction costs, the value of a firm is independent of its capital structure
and dividend policy. As such, a firm should not be able to increase its firm value by manipulating
its capital structure. This theorem becomes central to the factor of wealth transfer from
bondholders. Given that the asset base remains the same post spin-off, an alteration in the capital
structure between the two units should not affect the total valuation.
The key assumptions of the theorem are the absence of agency costs, bankruptcy costs, taxes, and
asymmetric information. However, these assumptions become problematic in the real world
because they are very demanding.

28
In line with Modigliani & Miller’s theory about the irrelevance of capital structure, there should be
no wealth effect of spin-offs. Given that the total asset base remains the same post spin-off, an
alteration in the capital structure between the two units should not affect the valuation. Similarly, it
could be argued that because the spin-off activity itself does not change the total cash flows, no
wealth effect should be visible because it stems from the same asset base. Put differently, in the
absence of synergies, the cash flows post divesture equal the combined cash flow as if the two firms
had remained as one. As such, in a frictionless capital market, a spin-off should not affect the
valuation of the firm’s asset base. Assuming an irrelevance of capital structure, any stakeholder
preference should be indifferent to the firm structure.
3.4 Options and Asset Pricing
The interpretation of a firm’s capital structure as options on the firm’s assets will be of relevance
for the analysis. Stocks can be viewed as a call option on the assets, with a strike price equal to the
required debt payment. If firm value is smaller than debt value at maturity, the firm must declare
bankruptcy where debtholders have highest priority to claim the remaining assets. Shareholders will
receive nothing, and the call option is out-of-the-money. However, if the firm value exceeds the
debt outstanding at maturity, shareholders will receive the surplus. Similarly, the dynamics of firm
debt can also be constructed using options. The combination of owning the firm assets and a
shorted call option with a strike price equal to the debt principal generates the same situation.
Likewise, the exposure of the debtholder can also be constructed using risk-free debt and a shorted
put option on the firm’s assets, with a strike price equal to the debt principal. (Berk & DeMarzo,
2014)
The value of call options, and thereby equity, increase in volatility. The reason for this is that call
options offer a limited downside and practically no upper boundary. A period with high volatility
can offer possibilities to make significant gains, while losses are limited; therefore, there is a price
premium. Applying this view in the corporate structure setting, if the firm falls into bankruptcy the
shareholders will not make any gains. Therefore, they rather desire management to increase risk
exposure, increasing the possibilities of making profits. The bond- or debtholders, however, prefer
a lower risk. First, they have a claim on whatever assets are left in case of bankruptcy, which is why
they have an incentive to be defensive. Furthermore, their maximum gain is limited to the principal
and recurring coupon payments, which is why additional corporate profits are not beneficial for
them. The perception of debt and equity claims as options could potentially play a role with regards
the capital restructuring following corporate spin-offs. (Berk & DeMarzo, 2014)

29
4 Methodology
This chapter presents the methodology employed in the study. The first section discusses the
scientific perspective. Thereafter follows descriptions of the various methods employed to assess
whether there is any value effect associated with spin-offs. The investigation will be structured
according to Figure 4.1. This structure allows us to study different aspects associated with the
wealth effect of corporate spin-offs. The different approaches complement each other, enabling a
more complete overview. In line with previous research, stock returns of parents, subsidiaries, and
pro-forma combined firms are tested upon announcement and in the long-term. Furthermore,
different factors that can potentially explain any shareholder wealth creation will be assessed on
announcement and in the long-term to determine the specific source of value creation. In addition,
being the first European study, we explore the effect of spin-offs on bond returns on
announcement. All tests aim to detect if there is any value creation, from what sources, and for
which stakeholders.
Figure 4.1 – Conceptual Framework
4.1 Research Approach
Three dimensions form the foundation for a proper research process—methodology,
epistemology, and ontology. While methodology relates to how to accomplish a study, ontology
and epistemology refer to the philosophic perspective of knowledge. Ontology is defined as an
objective sense, referring to the nature of reality and how reality is considered. Epistemology is a
more subjective dimension that refers to knowledge, what knowledge is, how it is created, and the
relationship between the subject studied and the researcher. (Bryman & Bell, 2011)
Because this study is based on an observed phenomenon in reality, any new generated knowledge
will be based on reality. Reality can be viewed through two perspectives, constructivism and
positivism. The constructivist perspective implies that there is no objective reality and that
knowledge is continuously constructed. Through this perspective, it is possible to derive general
results from specific examples. By contrast, this study is characterized by positivism, entailing an
objectivistic relation to reality and an underlying assumption that reality is independent of any
Test of:
• Announcement
abnormal return
1. Stock returns
a. Announcement b. Long-term
3. Bond returns
a. Announcement
2. Factors – Stock returns
a. Announcement b. Long-term
Conceptual framework
Test of
• Calendar-time
portfolio
• Matching industry
Test of:
• Announcement
abnormal return
• Value expropriation
Test of:
• Mean/median
• Mean/median
difference
Test of
• Calendar-time
portfolio
• Matching industry

30
researcher. This positivistic approach is employed, as we aim to analyze a large sample of
quantitative observations. Our own actions and perceptions will not affect the analysis, as valid
scientific knowledge is derived from mathematical processing of empirical data. (Bryman & Bell,
2011)
In accordance with the existing research discussed in the Literature Review, this study follows a
deductive approach and is carried out using a quantitative research method. The deductive
approach implies that hypotheses are formulated based on existing empirical evidence. Applying a
quantitative research method generally follows an epistemological positivistic approach with an
objective ontological stance. This implies that any subjective or intuitive values are to be dismissed,
and the intention is to enable a general application of found patterns for different situations.
(Bryman & Bell, 2011)
In addition to a clear scientific research stance, it is important to continuously be critical in
methodological choices, aiming to obtain results that are generalizable, reliable, and valid. To
achieve this, we have applied a strict definition of spin-offs and performed careful data collection
screening involving the pairing of four databases and additional manual cross-checking (see Data,
Section 5). The extensive data gathering leads to a sample of European spin-offs that is notably
larger than those in other studies. Therefore, the results can be argued to be representative for the
whole population and thus generalizable. Similarly, this careful screening can be argued to increase
the validity of the results. The methodological testing approaches have been carefully chosen based
on existing research in the field. For tests that require even more critical methodological choices,
multiple methods are used to strengthen the reliability of the results.
4.2 Stock Returns
Initially, we examine the share price reaction to the spin-off announcement to test for any
shareholder value creation related to the new information and to test how efficiently it is
incorporated by the market. Thereafter, we investigate the spin-off’s long-term value creation,
testing parent firm, spun-off subsidiary, and pro-forma returns. Any long-term effect is evaluated
using both a calendar-time approach and an industry-match approach to determine robustness and
to compare our findings to those of previous studies. This is an indirect extension of the test of
market efficiency.

31
4.2.1 Stock Returns: Announcement Effect
Many event study methodologies could be employed for this study, including various factor
models, matched firm models, and matched industry models. In this study, the announcement
effect on stock returns is examined using a standard market return model, as described in Kothari
and Warner (2006) and MacKinlay (1997). This is very similar to the models used by Hite and
Owers (1983), Veld and Veld-Merkoulova (2004), and Sudarsanam and Qian (2007).
In addition, we will apply an event study methodology that includes both cross-sectional
aggregation and time–series aggregation, as suggested by Fama et al. (1969). This approach is also
used by Miles and Rosenfeldt (1983).
4.2.1.1 Event Study Methodology
The expected return for a firm 𝑖 during a time period 𝑡 will be calculated according to a standard
market model and will be used as the comparison return in the event study. By applying the market
model rather than the constant-mean return model, we remove the return on the stock related to
the variations in the market’s return. In this way, the variance of the abnormal return is reduced
(MacKinlay, 1997).
The expected return is calculated as:
𝐸(𝑅𝑖,𝑡) = 𝛼𝑖 + 𝛽𝑖(𝑅𝑚𝑘𝑡,𝑡) + 𝜀𝑖,𝑡
where 𝛼𝑖 and 𝛽𝑖 denote the least squares estimates of the intercept and slope for each individual
firm 𝑖, generated by regressing the stock returns on the corresponding market returns for the
estimation period. 𝑅𝑚𝑘𝑡 denotes the return of the MSCI Europe Index during the time period of
interest for firm 𝑖. Studying European spin-offs, we chose the MSCI Europe to serve as a proxy
for the market portfolio as it better captures the alternative investment opportunity of the
European investor. 𝜀𝑖,𝑡 is the error term associated with each observation. Similar to Veld and
Veld-Merkoulova (2004) and Sudarsanam and Qian (2007), we use an estimation period from
𝑡−200 to 𝑡−20 , relative the announcement date 𝑡0 to calculate the expected return. This estimation
period can be argued to capture the firm conditions close to the actual event, while still presumably
avoiding any eventual leaking of information that can affect the return.
Thereafter, the daily abnormal return for each firm is defined. It represents the difference between
the observed return and the expected return and is calculated as:
𝐴𝑅𝑖,𝑡 = 𝑅𝑖,𝑡 − 𝐸(𝑅𝑖,𝑡)

32
Where 𝐴𝑅𝑖,𝑡 denotes the abnormal return in time period 𝑡 and 𝑅𝑖,𝑡 denotes the realized return in
time period 𝑡.
The objective of the event study is to establish whether a spin-off on average is associated with a
wealth change. To that end, an average abnormal return is calculated for each of the event window
days across the whole sample. This procedure is known as the cross-sectional aggregation. The
approach minimizes the risk of the results being affected by individual stock noise and thus further
reinforces the isolation of the spin-off announcement effect. The average abnormal return for the
period 𝑡 is given by:
𝐴𝐴𝑅𝑡 =1
𝑁∑ 𝐴𝑅𝑖,𝑡
𝑁𝑖=1
where 𝐴𝐴𝑅𝑖,𝑡 denotes the average abnormal return. In addition to cross-sectional aggregation,
we want to account for the time-series effect and capture the total impact of the spin-off across
the whole event window. The cumulative average abnormal return (CAAR) is therefore
calculated by summing the average abnormal returns over the event window:
𝐶𝐴𝐴𝑅𝑇 = ∑ 𝐴𝐴𝑅𝑡
𝑇
𝑡=1
where 𝐶𝐴𝐴𝑅𝑇 denotes the cumulative average abnormal return.
The main event window ranges from 𝑡−1 to 𝑡+1. However, it is also of interest to investigate if the
spin-off effect for windows around the event are equal to zero. For instance, if the event is partially
foreseen, parts of the abnormal return should show in periods prior to the event. It is also of
interest to examine the market efficiency, that is, the speed of price adjustment, by investigating
the period subsequent to the event. Therefore, the event windows 𝑡−10 to 𝑡−1. and 𝑡+1 to 𝑡+10
will also be tested.
Following, a student’s t-test is employed to test whether the different CAARs over each event
window are significantly different from zero. Three different significance levels are used, rejecting
the null hypothesis if the test statistic exceeds a critical value corresponding to the 1%, 5%, and
10% tail regions, respectively, using a two-sided test. In this test, the abnormal returns are assumed
to be independently and identically distributed.
The standard test statistic for testing the CAAR is divided by an estimate of its standard deviation
(Kothari & Warner, 2006). For an event window ranging from 𝑡−1 to 𝑡+1, the formula for the test
statistic is:

33
𝐶𝐴𝐴𝑅𝑇
√𝜎𝑇2
where 𝜎𝑇2 = 𝐿 𝜎2(𝐴𝐴𝑅𝑡)
Where 𝜎2(𝐴𝐴𝑅𝑡) is the variance of the one-period average abnormal return. This way, the
variance assumes a time-series independence of the one-period average abnormal return. 𝐿 is the
number of days. The longer the 𝐿, the higher the CAAR variance.
The test statistic formula is well-specified given that the variance of the one-period mean abnormal
return is estimated correctly. Eventual event–time clustering would render the independence
assumption for the abnormal returns. This would in turn bias the estimated standard deviation
estimate downward and the test statistic upward (Kothari & Warner, 2006).
4.2.1.2 Event Study Critiques
An event study based on a market model is subject to some limitations. Kirchmaier (2003) claims
that the market model is based on the CAPM theory, in which the alphas are constrained to be
zero and the betas are constrained to be one. The assumption of the beta of an individual security
being one is unrealistic, which is why the employed model introduces a certain measurement bias.
However, research has shown that most methodologies yield qualitatively similar results for
announcement abnormal returns (Kothari & Warner, 2006). This defends the reliability of the
chosen methodology for this study and is also the reason for why no additional robustness tests
are performed.
4.2.2 Stock Returns: Long-Term Effect
Investigation of long-run performance requires critical methodological choices. The following
sections begin with presenting the motives behind the types of returns chose. Thereafter follows
a reasoning and description of the two separate methodologies employed to investigate the long-
term spin-off performance.
4.2.2.1 Return Types
Either cumulative returns (CRs) or buy-and-hold returns (BHRs) can be applied in the analysis.
The BHR methodology has been criticized because it assumes independence of individual firms’
abnormal returns. According to Mitchell and Stafford (2000), major corporate events cluster by
industry over time, which is why it is incorrect to assume independent return distribution. On the
contrary, Barber and Lyon (1997) argue that BHRs more appropriately reflect the true investor
experience in the long-term because they better capture and display the real abnormal returns.
Following this argument, BHRs will be used throughout this study.
Furthermore, there are contrasting opinions on whether equal-weighted or value-weighted returns
should be employed to compute the portfolio abnormal returns. While Loughran and Ritter (2000)

34
claim that equal-weighted returns more appropriately envision the abnormal returns associated
with a random event, Fama (1998) argues that value-weighted returns better reflect the total wealth
effect. However, as this study aims to test whether random spin-offs can be associated with long-
run abnormal returns, equal-weighted returns will be applied.
4.2.2.2 Calendar–Time Portfolio Approach
If the cross-sectional dependence of monthly overlapping individual BHRs is ignored, any eventual
systematic errors will be compounded; the larger the sample, the larger the errors. This in turn
implies that the t-statistics are likely to be overstated (Fama, 1998; Mitchell & Stafford, 2000). To
solve this dependency problem, a calendar–time portfolio approach is applied using monthly
BHRs. The cross-sectional correlations are automatically accounted for in the portfolio variance
at each point in calendar time. Both Fama (1998) and Mitchell and Stafford (2000) advocate this
approach because it accounts for positive cross-correlations across the individual firm BHRs.
McConnell and Ovtchinnikov (2004) apply this approach in their study.
Constructively, we form monthly equal-weighted portfolios for all parents, subsidiaries, and pro-
forma combinations that were engaged in spin-off activity between May 1988 and December 2014.
The final month of December 2014 is the last time a spin-off could be completed in order for us
to have 36 months of returns to measure the performance. The portfolios are formed for each
holding period of 6, 12, 24, and 36 months. The composition of each portfolio changes over time.
New stocks are added to the respective portfolio in the calendar month of the stock’s initial listing
date. Similarly, if stocks are delisted or acquired, they are removed in the calendar month
corresponding to the transaction.
Figure 4.2 – Calendar-time Portfolio Approach Source: Own illustration
The figure exemplifies the inclusion and removal of a firm in the four portfolios for different holding period settings. The procedure is the same for the parent, subsidiary and pro-forma portfolios. Note that this figure only covers the
time period 1988 to 1998. In this thesis, the time period 1988 to 2017 is examined.
Calendar-time Portfolio Approach
1988
1998
6
months
12
months
24
months36
months
InclusionExclusion

35
Following, the returns of each portfolio need to be assessed against a benchmark to estimate any
potential abnormal returns. McConnell et al. (2001) discuss the implication of employing different
performance benchmarks, showing that this choice impacts the outcome profoundly. Similar to
the approaches of Rüdisüli (2005) and McConnell et al. (2001), this study will begin with assessing
post spin-off returns of the parent, subsidiary, and pro-forma combinations against the Fama–
French Three-Factor Model. The Fama–French European stock market aggregates include stock
data from developed European countries. Compared to assessing the returns against the well-
known CAPM framework, the additional SMB and HML factors are expected to further isolate
the spin-off effect.
Initially, the contemporaneous risk-free rate is subtracted from the portfolio returns. The excess
portfolio return is then regressed against the corresponding Fama–French factors, following the
formula:
𝑅𝑝 − 𝑟𝑓 =∝ + 𝛽1(𝑅𝑚𝑘𝑡 − 𝑟𝑓)𝑡
+ 𝛽2𝑆𝑀𝐵𝑡 + 𝛽3𝐻𝑀𝐿𝑡 + 𝜀𝑖
where 𝑅𝑝 signifies the monthly return for each observation, 𝑟𝑓 is the corresponding monthly risk-
free rate, and 𝑅𝑚𝑘𝑡, 𝑆𝑀𝐵𝑡, and 𝐻𝑀𝐿𝑡 are the corresponding monthly factor returns. 𝛽1 - 𝛽3 are
the sensitivities to each factor (and epsilon is an error term).
Running the regressions generate an alpha for each portfolio, that is, an abnormal return for each
holding period. This alpha and the risk-factor coefficients are tested using a t-test, in which the t-
statistic is derived using the following formula:
𝑡 =𝑋𝑡
𝑠 / √𝑛𝑖
where 𝑠 denotes the cross-sectional standard deviation of 𝑋𝑡 (𝑋𝑡 represent the intercept and
coefficients respectively) for the 𝑛 observations in the time series. The test statistic of each
portfolio is then converted into a p-value. Significance is reported at the 10%, 5% and 1% levels.
4.2.2.3 Matching Industry Portfolio Approach
The most commonly used benchmark in the existing research is a matching-firm approach in
which firms are matched with a peer according to different characteristics, such as industry, size,
and market-to-book ratio. This approach is used by Cusatis et al. (1993), Barber and Lyon (1997),
Desai and Jain (1999), Veld and Veld-Merkoulova (2004), and McConnell and Ovtchinnikov
(2004). However, applying the matching-firm method in this study would imply that at least one
appropriate match must be found for each observation in the sample within the same country-

36
specific market. Occasionally, the matches do not have all required data, which is why a new match
(which might not be equally appropriate) must be found. Naturally, the more unsuitable match,
the more biased the results. Similarly, the matching procedure could impose bias due to manual
classification errors. In the worst case, no appropriate match exists, meaning the original spin-off
observation should be removed. In short, we deem this to be too cumbersome a procedure and
moreover acknowledge the benefits of maintaining a large sample. Desai and Jain (1999) applied
both a matching-firm benchmark and an index benchmark approach, finding similar results across
both benchmarks. In line with this, we modify the matching-firm approach by instead matching
and assessing the returns of each firm against a relevant industry portfolio to evaluate any
outperformance of spin-off firms. Furthermore, we note that Sudarsanam and Qian (2007) also
construct matching portfolios for their analysis. In this approach, there is a risk of cross-sectional
dependence, such that t-statistics are at risk of being overstated (Fama, 1998; Mitchell & Stafford
2000). However, as the calendar-time approach accounts for this, we believe that employing both
methodologies enables a comparison of the results and thus facilitates a more complete view on
the value creation effect, yielding more robustness in the analysis.
Daily returns for 48 industry portfolios are collected from Kenneth French’s library (French,
2018). One must note that these portfolios are formed based on US firms, which poses a risk to
the European spin-off sample. For instance, different legislation, taxes, political activities, and
other US individual dynamics risk lowering the accuracy of the matching. However, as no
corresponding European industry portfolios are available, we choose to rely on these benchmarks.
In addition, the results of the calendar–time portfolio approach will serve as robustness checks for
this method and vice versa.
In our choice of return metrics we rely on BHRs. The methodology follows the one applied by
Sudarsanam and Qian (2007). The method sums up single-period returns and as such precisely
represents the investor gain from the beginning until the end of the holding period. From a
statistical point of view, the method is more likely than, for example, cumulative returns to produce
extreme observations and therefore a fat right-hand tail and right skewness.
The industry excess return of each firm is calculated by subtracting the return of the corresponding
industry portfolio on the same trading date. This is done for parents, subsidiaries, and pro-forma
combinations. We then calculate the excess BHRs for every firm for each holding period of 6, 12,
24, and 36 months using the following formula:

37
𝐵𝐻𝑅𝑖,𝑇 = ∏(1 + 𝑅𝑖,𝑡)
𝑇
𝑖=1
− ∏(1 + 𝑅𝑡 𝑏𝑚)
𝑇
𝑖=1
where 𝑅𝑡,𝑖 is the return of firm 𝑖, and 𝑅𝑡 𝑏𝑚 is the return of benchmark for the same period.
Thereafter, the excess BHRs are averaged across each subsample, so that one average excess BHR
is estimated for every sample of subsidiaries, parents, and pro-forma combinations for each
holding period. This is done according to the following formula:
𝐴𝐵𝐻𝑅(𝑡) =∑ 𝐵𝐻𝑅
𝑁𝑥
where 𝑁𝑥 is the number of firms in the investigated subsample 𝑋.
Finally, the average BHRs for each subsample and for each holding period are tested using a non-
parametric test due to the possibility of extreme observations, that is, fat right tails and skewness.
We use a Wilcoxon signed rank test to test the significance of each BHR. For the Wilcoxon signed
rank test, the difference between the return and the sample mean return is calculated for each
observation in a subsample. Thereafter, the absolute differences are ranked, where the smallest
difference is assigned a ranking score of 1 and the largest difference is assigned the highest rank.
Subsequently, a 𝑧𝑗 score is assigned to each observation, being zero if the difference is below the
null hypothesis (which in this case is zero) and otherwise being the rank number. (Taheri &
Hesamian, 2013)
Next, the distribution of the (random) variable 𝑊 is calculated as the sum of 𝑧𝑖. Finally, the z-
value for the whole sample is calculated as:
𝑧𝑖 =𝑊
𝜎𝑤 where 𝜎𝑤 = √
𝑁𝑟(𝑁𝑟+1)(2𝑁𝑟+1)
6
This z-score is converted to a corresponding p-value, where again 10%, 5%, and 1% significance
levels are reported.
4.3 Value-Creating Factors
In this study, we aim to further investigate three factors that potentially could explain any source
of value gains. These factors are the improvement of corporate focus, the level of information
asymmetry and the relative spin-off size, all of which are described in the Literature Review,
Section 2.2. These are the most documented factors. However, most previous studies use different

38
methodologies, and therefore the reported findings are mixed. In addition, the number of
European studies is small. With a more profound methodology and a significantly larger sample
size, this study aims to provide further guidance and robustness in relation to the eventual factors
that possibly create value in spin-offs.
The following subchapter begins with presenting the proxies that will be used to measure the effect
on returns attributable to each factor. Thereafter, the testing methodologies for different horizons
are presented.
4.3.1 Proxies
In order to measure the effects of each factor on stock returns, a dummy variable methodology
will be employed. Applying numerical values of 1 or 0 to the different subsamples enables both
individual investigation of each subsample and examination of all factors simultaneously.
4.3.1.1 Improvement of Corporate Focus
Similar to the methodology of Desai and Jain (1999) and Veld and Veld-Merkoulova (2004), the
wealth effect associated with an improvement in corporate focus is measured using a two-digit
SIC code. More precisely, a dummy variable of 1 will be attributed to those sets of parents and
subsidiaries where the SIC code of the subsidiary subsequent to the spin-off differs from that of
the parent. This procedure divides the original sample into two subsamples, one with focus-
increasing spin-offs and one with non-focus-increasing spin-offs.
4.3.1.2 Information Asymmetry
In line with the methodology of Krishnaswami and Subramaniam (1999), the information
asymmetry variable is measured using data on analysts’ earnings forecasts, which are collected from
IBES. The analysts’ earnings forecasts are monthly reports on mean, median, and standard
deviation of the forecasts for each firm, which in turn are based on submitted analyst estimates
for that very month. The variable that will serve as the information asymmetry proxy in this study
is the standard deviation of earnings forecasts for the next 12 months.
The standard deviation of earnings forecast represents the consensus disparity among analysts for
a certain firm. Disagreement is viewed as a lack of available information about the firm. As such,
the higher the standard deviation, the higher the level of information asymmetry. Similar to the
approach of Krishnaswami and Subramaniam (1999), the standard deviation for the last month of
the fiscal year prior to the spin-off announcement will serve as the information asymmetry proxy
for each individual parent firm.
For the information asymmetry factor, the sample is divided in two and assigned a dummy variable
of 1 if the standard deviation is higher than the median, and 0 otherwise. All firms are not

39
compared against the same median. Instead, the dummy variable is assigned against the sample
median corresponding to the relevant time period of each respective announcement. As such, the
median becomes time-varying. This way the differences in analyst earnings estimates incorporate
the differences over different economic states. Thus, it can be argued that post an economic
downturn, the deviations in earnings estimates are assumed to be higher than in steady economic
states.
4.3.1.3 Relative Size
In line with previous research, the relative size variable in this study is defined as the market
capitalization of the subsidiary relative to the sum of the market capitalization of the parent and
the subsidiary, both based on the initial trading date of the subsidiary (Sudarsanam & Qian, 2007;
Veld & Veld-Merkoulova, 2004). While previous US studies find median spin-off size to be around
20%–22%, previous European studies report median sizes ranging from 24%–30% (Desai & Jain,
1999; Hite & Owers, 1983; Krishnaswami & Subramaniam, 1999; Veld & Veld-Merkoulova, 2004;
Sudarsanam & Qian, 2007). Similarly, Rüdisüli (2005) reports that the European spin-offs on
average are relatively larger compared to US counterparts. The median of our sample is 26.9% and
will serve as the benchmark for the relative size variable.
As for other variables, the sample is split into two and assessed using a dummy variable of 1 if the
relative size is larger than the median and 0 otherwise. This procedure is also performed by Hite
and Owers (1983).
4.3.2 Test of Factor Variables
The factor variables are tested both around the announcement and in the long-term. For the
announcement, three different testing methods are used—the classic t-test, the Wilcoxon signed
rank test, and the Mann–Whitney U test. This structure closely follows that of Veld and Veld-
Merkoulova (2004), as they employ a more profound methodology compared to other studies
investigating factors. This facilitates an authentic comparison of our results with previous studies.
For the long-term factor tests, the same methodologies used for the long-term stock return
investigations are applied. See Section 4.2 for a further description of the calendar–time and
matching industry portfolio approaches. As we aim to capture the wealth effect generated for the
pre-spin-off shareholder, the different factors are assessed against the pro-forma returns. This is
natural, as the pro-forma firm consists of the same assets as the parent firm prior to the spin-off
on which the motivation for the spin-off was initially based.

40
4.3.2.1Announcement Testing Methodology
Based on the dummy variable procedure described in the preceding sections, the sample is split
into subsamples for each factor, according to whether it has a certain factor characteristic not.
Again, an event window of 𝑡−1 to 𝑡+1 is employed. First, a t-test is employed to examine if the
mean CAARs from each subsample are statistically different from zero. Next, the mean difference
between the two subsamples for a factor is tested. For example, the CAARs from the subsample
of non-focus-increasing spin-offs are subtracted from corresponding CAARs of the focus-
increasing spin-offs. The CAAR difference (i.e., mean difference) is then t-tested.
For the test of medians for each subsample, we apply the non-parametric Wilcoxon signed rank
test due to its distribution-free assumptions, which is favorable when handling smaller datasets. In
addition, it serves as a robustness check of our student t-test statistics applied on the means.
In the following, the median difference between the two subsamples of each factor is examined.
This is done by applying a non-parametric Mann–Whitney U test. First, all returns for the whole
sample are ranked in ascending order. Thereafter, an 𝑅𝑖 value is calculated as the sum of the ranks
in a certain subsample (for example, the focus-increasing subsample). A 𝑈𝑖 value is then calculated
for each subsample:
𝑈𝑖 = 𝑅𝑖 −𝑛𝑖(𝑛𝑖 + 1)
2
where 𝑛𝑖 is the number of observations in the subsample of interest.
Finally, we compare the two subsample distributions for a certain factor and calculate a z-score
according to the following formula:
𝑧 =𝑊
𝜎𝑤 where 𝜎𝑤 = √
𝑁𝑟(𝑁𝑟+1)(2𝑁𝑟+1)
6
where 𝑚𝑢 and 𝜎𝑈 are calculated as:
𝑚𝑢 =𝑛𝑖𝑛𝑗
2 and 𝜎𝑈 = √
𝑛𝑖𝑛𝑗(𝑛1+𝑛2+1)
12
This z-score is converted to a corresponding p-value, where again 10%, 5%, and 1% levels of
significance are reported. (Mann & Whitney, 1947)
4.3.2.2 Long-term Testing Methodology of Factors
The long-term investigation of possible value-creating factors is carried out in a similar manner to
the long-term investigation of stock returns, as described in Section 4.2. To begin, the returns of
each of the six subsamples are separately regressed, less the contemporaneous risk-free rate,

41
according to the calendar–time methodology on the Fama–French Three-Factor model. This is
done for holding periods of 6, 12, 24, and 36 months.
𝑅𝑖 − 𝑟𝑓 =∝ + 𝛽1(𝑅𝑚𝑘𝑡 − 𝑟𝑓)𝑡
+ 𝛽2𝑆𝑀𝐵𝑡 + 𝛽3𝐻𝑀𝐿𝑡
Similarly, we apply the matching industry portfolio approach and regress the excess returns
simultaneously over all factor dummies. This is also done for each holding period of 6, 12, 24, and
36 months.
All investigated subsample returns are pro-forma, that is, a weighted combination of the parent
firm and its spin-off subsidiary. This is because we primarily aim to investigate the spin-off wealth
effect for the pre-spin-off shareholder.
4.4 Bond Returns
Various tests are performed to examine if there is any wealth transfer from bondholders to
shareholders upon the spin-off announcement. To begin, the bond abnormal return is measured
and tested around the main event window. We then test the total wealth effect of the spin-off to
evaluate if the total gain of shareholders exceed the loss of bondholders. Thereafter, the cross-
sectional relationship between the gains and losses of shareholders and bondholders is investigated
to detect if an eventual larger loss in bond returns implies a larger gain in stock returns.
4.4.1 Bond Returns: Spin-off Announcement Effect
First, the bond abnormal return around the spin-off announcement is examined. As a measure of
the abnormal return of the bonds, we employ a matching portfolio approach. This approach
differs from that used by Maxwell and Rao (2003), who apply a mean-adjusted return model. The
difference between the two lies in the calculation of the expected return. The mean-adjusted model
applies the return of a Treasury security with a similar maturity date and coupon rate as each bond,
whereas the matching portfolio approach relies on the return of similar securities. In our thesis,
we evaluate daily prices rather than monthly prices, as examined by Maxwell and Rao (2003). When
examining daily prices, Bessembinder et al. (2009) suggest using the matched portfolio approach.
Their recommendation is based on the infrequency of bond trades, which makes it difficult for the
mean-adjusted model to accurately calculate expected returns. Additionally, according to
Ederington et al. (2015), daily data significantly increases the power of tests and reduces any noise
around the event window.
The matching portfolio approach controls for default risk, as it calculates the expected return on

42
the bonds based on the return on a portfolio with assets of similar risk. However, the method
lacks the ability to control for the differences in time to maturity, which would have been captured
using the mean-adjusted return model.
Initially, the bond returns are calculated over the event window as follows:
𝑅𝑛,(𝑡−1,𝑡+1) =𝑃𝑛,𝑡+1
𝑃𝑛,𝑡−1
where 𝑃𝑛,𝑡 represents the gross price of the 𝑏𝑜𝑛𝑑𝑖 at time 𝑡. By applying the gross price, we
account for the accrued interest of the bond between the two time periods. Note that the return
is calculated in a three-day window in accordance with the method described by Ederington et al.
(2015).
We then turn to the calculation of the abnormal return:
𝐴𝐵𝑅𝑛,(𝑡−1,𝑡+1) = 𝑅𝑛,(𝑡−1,𝑡+1) − 𝑅𝑛,(𝑡−1,𝑡−1)𝐵𝑀
where 𝑅𝑛,(𝑡−1,𝑡−1)𝐵𝑀 is the return on a matching portfolio corresponding to each bond. The chosen
portfolio is matched by credit rating so that they carry similar risk. Ideally, the bond portfolios
would be further divided based on time to maturity, but due to the unavailability of time-varying
European bond indices for different credit quality we do not account for this fact.
Figure 4.3 – Bond Index Selection
As displayed in the above figure, we lack European bond indices prior to 2000. Therefore, we
choose to rely on bonds from US markets.
Similar to Maxwell and Rao (2003), we apply a firm basis when calculating the abnormal returns
for each company. This implies that in any case of a company having multiple traded bonds, we
use a market value weighted return to measure the bondholders’ return over the observed period.
Because the returns of bonds issued by one firm are highly but not perfectly correlated, the
standard errors would be overestimated if measured as individual securities. Measuring the
Bond Index Selection
Bloomberg Barclays US Corporate High Yield
Bloomberg Barclays Pan-European High Yield
Bloomberg Barclays US Aggregate
Bloomberg Barclays Pan-European Aggregate
1988 2000 2018IndexCredit Rating
Investment
Grade
High
Yield

43
securities separately also creates a bias in the sample toward larger firms. By applying a firm-level
approach, we mitigate the issue of cross-correlation. Furthermore, the approach is argued to more
accurately capture the change in firm value associated with the event.
𝐴𝐵𝑅𝑘 = ∑ 𝐴𝐵𝑅𝑖 𝑤𝑖
𝐽
𝑖=1
The method summarizes the abnormal return of each 𝑏𝑜𝑛𝑑𝑖 relative to the total value of bonds
outstanding for 𝑓𝑖𝑟𝑚𝑘. We convert the issue size of each bond to USD. We then employ a
Wilcoxon signed rank test, as outlined previously, to test if the abnormal bond return is different
from zero. This is a non-parametric test that, as opposed to the parametric t-test, can be argued to
have better power for bond tests. The argument lies in the t-test’s assumption of normal
distribution and homoscedasticity. First, as fewer firms issue bonds than stocks, we can expect to
have a smaller sample, which increases the possibility of a violated normal distribution. Second,
bond abnormal returns have been documented to be more likely to violate the homoscedasticity
assumption of common t-tests. As documented by Bessembinder et al. (2009) and Ederington et
al. (2015), bond return volatility increases with the time to maturity and as the credit rating falls.
They also recognize that bond return volatility also increases for more illiquid bonds.
4.4.2 Aggregated Return from Spin-off Announcement
We now turn to the test of the aggregated return from spin-off announcement for shareholders
and bondholders. The methodology employs values for abnormal stock and bond returns for
𝑓𝑖𝑟𝑚𝑖 using:
𝐴𝐵𝑅(𝑡−1,𝑡+1)𝑒𝑞𝑢𝑖𝑡𝑦
× 𝑀𝑉( 𝑡−1)𝑒𝑞𝑢𝑖𝑡𝑦
+ 𝐴𝐵𝑅(𝑡−1,𝑡+1)𝑑𝑒𝑏𝑡 × 𝑀𝑉(𝑡−1)
𝑑𝑒𝑏𝑡
𝑀𝑉𝑡−1𝑓𝑖𝑟𝑚
We then calculate the abnormal change in equity and debt by multiplying the abnormal percentage
change by the market value of equity and debt, respectively. We test the mean and median
significance for each 𝑓𝑖𝑟𝑚𝑖 using a non-parametric test to determine the total value created during
the announcement and how much shareholder wealth is attributed to bondholders’ loss. It should
be noted that we rely only on publicly traded securities to calculate aggregate firm value.
Consequently, our results are only an approximation of the aggregated return of the firm.
Extending our calculation and approximation of aggregated firm return by including non-traded
securities and assuming they exhibit returns similar to public securities is possible; however,

44
according to Maxwell and Rao (2003) this would overestimate any loss for bondholders. (Maxwell
& Rao, 2003)
4.4.3 Shareholders Gain on Behalf of Bondholders
We next investigate if there is any cross-sectional relationship between the gains and losses of
shareholders and bondholders. This is assessed using the following regression:
∆𝐴𝐵𝑁 𝑀𝑉𝑒𝑞𝑢𝑖𝑡𝑦 =∝ + 𝛽1∆𝐴𝐵𝑁 𝑀𝑉𝑑𝑒𝑏𝑡 + 𝛽2𝑀𝑉𝑓𝑖𝑟𝑚 + 𝜀
We use the abnormal change in market value of equity, calculated as the 𝐴𝐵𝑅(𝑡−1,𝑡+1)𝑒𝑞𝑢𝑖𝑡𝑦
multiplied
by the 𝑀𝑉(𝑡−1)𝑒𝑞𝑢𝑖𝑡𝑦
, as the dependent variable. The change is regressed against the change in market
value of debt, calculated as the abnormal bond return multiplied by the market value of outstanding
bonds. Furthermore, the market value of the firm is used as an independent variable to account
for the size of the firm. The described investigation of the aggregated spin-off announcement
return and the wealth expropriation are both in line with those in Maxwell and Rao (2003).

45
5 Data
To perform relevant tests in the pursuit of answering the research question, various data has to be
collected. In this section we outline what data is collected and from which sources. First, we
describe the collection of equity related data and its characteristics. We then turn to the collection
of data related to the bond related data and its characteristics.
5.1 Sample Collection
We apply the definition of a spin-off as a cash-free transaction where shares of a subsidiary are
pro-rata distributed to shareholders. Both parent and subsidiary must be independently managed
and separately valued on the stock market subsequent to the completion of the spin-off. As this
thesis aims to investigate a sample of European spin-offs, both parents and subsidiaries in the
sample need to be of European origin.
For the purpose of completeness, the sample is pooled from four different databases—
Bloomberg, Thomson One Banker, Zephyr, and Capital IQ. Table 5.1 shows the search criteria
used for each database and the total number of observations generated.
Table 5.1 – Sample Collection Overview
Despite each database having its own definitions and limitations, they complement each other and
facilitate a holistic overview. To avoid any transaction misclassifications, the data is cross-matched
so that only transactions that are reported as completed and that exist in two or more databases
remain. However, for observations prior to 1990 we manually verify the obtained spin-offs from
Thomson One, as it is the only database to include observations from the 1980s. This initial
screening resulted in a gross sample of 308 observations.
Further, the sample is gradually reduced following different screenings. Finally, following an
investigation of the announcement dates, a number of observations were removed because they
did not follow the definition of spin-offs used in this thesis. In the following, the reduction of
observations is reported in parentheses next to the reason for their removal:
Criteria Bloomberg Thomson One Zephyr Capital IQ
Deal Type Spin-off Demerger IPO sub-demerger Spin-off / Split-off
Geographical Focus Europe Europe Europe Europe
# Countries 36 31 26 28
Time Period 1997-2017 1987-2017 1997-2017 1990-2017
# Observations 408 529 229 303

46
a) No data or unable to find ticker (29);
b) Subsidiary publicly traded prior to spin-off announcement (13);
c) Transaction involved cash (5);
d) M&A (other kinds of transactions/divestitures not to be considered spin-offs) (2);
e) No continuous operations, that is, the parent was completely split or experienced
discontinuous operations post spin-off (18);
f) Non-public spin-off or private company (4);
g) Partial spin-off (7);
h) No IBES estimates (11); and
i) Observation not part of developed Europe (5).
Final number observations used throughout this study is 214, ranging from May 1988 to December
2017. The observations represent are from developed Europe, counting 15 countries.
5.1.1 Samples
On announcement, the final sample of 214 observations will be assessed. However, the long-term
tests require that each firm has been traded for at least the number of months corresponding to
the investigated holding period. For the sake of transparency and comparison, the same long-term
sample is employed for all investigated holding periods, covering a total of 201 observations
trading within the period from May 1988 to December 2014. In the same manner, this sample of
201 observations will also be employed when analyzing the spin-off value-creation source
attributable to various factors.
The sample of firms that is used for the wealth transfer study is described separately. This is
because the collection and sorting process is different to the one described above. See Section 5.6
for further information.

47
5.2 Data Collection of Benchmarks and Factor Proxies
The MSCI Europe index used in the announcement investigation is downloaded from Datastream,
denominated in USD.
The Fama-French Three-Factor stock market aggregates and industry portfolios are both
downloaded from Kenneth French’s library (French, 2018). These are used in the long-term return
investigations.
In order to test the factors outlined in Methodology, Section 4.3, the sample is paired with various
financial databases containing static and time-series data.
To test whether spin-off activity that is aimed to increase corporate focus is value creating,
corporate SIC codes are used. SIC codes are gathered from Compustat using the International
Securities Identification Number for our identified parents in the sample. SIC codes are collected
for both parent and subsidiary
Regarding the tests for whether a decrease in information asymmetry is value explaining, IBES
estimates of the standard deviation of analysts’ forecasts are collected from Datastream. We collect
the standard deviation of the last month’s earnings per share (“EPS”) forecast of the year prior to
the spin-off announcement for every parent firm, similar to Krishnaswami and Subramaniam
(1999).
Finally, market capitalizations of parents and subsidiaries are sourced from Datastream for the
initial trading date of the spin-off. This enables assessment of whether the spin-off relative size
factor can be a source of value creation. All market capitalizations are measured in USD.

48
5.3 Sample Characteristics
Table 5.2 shows the distribution of completed spin-offs in Europe covering a time period from
1988–2017. The United Kingdom is the most popular country for corporate spin-offs, with 68
spin-offs recorded. The second and third most popular countries are Sweden and Norway, with
52 and 23 spin-offs, respectively.
Table 5.2 – Spin-off by Year and Country
As also displayed in Table 5.2, spin-off fluctuate in popularity over time. The three most popular
years captured in our sample are 2004-2006.
Despite being the most popular country by number of spin-offs, the United Kingdom does not
have the highest average value per spin-off. Spin-offs from the Netherlands are largest by average
value, USDm 3,786, with Italy and Germany following in second and third place, respectively. In
addition, the Netherlands is the country with the largest relative size of spin-offs, with an average
size of 46%. In second and third place we have Finland and Austria, respectively.
Year AUT BEL CHE DEN DEU ESP FIN FRA GBR IRL ITA NLD NOR PRT SWE TotalCumulative
(# Spin-offs)
1988 1 1 1
1989 4 4 5
1991 2 2 7
1992 1 1 8
1993 2 2 10
1994 1 1 2 12
1995 1 1 13
1996 5 5 10 23
1997 1 1 1 3 26
1998 2 3 5 31
1999 1 1 2 4 35
2000 6 2 8 43
2001 1 8 1 1 11 54
2002 1 4 2 2 9 63
2003 1 1 1 5 2 2 1 13 76
2004 1 1 1 2 1 2 1 1 2 1 7 20 96
2005 1 1 1 2 1 3 2 2 2 15 111
2006 1 1 9 2 1 3 5 22 133
2007 1 4 1 3 1 3 13 146
2008 1 1 1 2 5 151
2009 1 1 1 1 4 155
2010 1 3 1 1 1 7 162
2011 1 1 1 2 1 1 2 3 12 174
2012 1 1 1 1 2 1 3 10 184
2013 2 2 1 1 6 190
2014 2 1 1 2 1 2 2 11 201
2015 1 1 1 3 204
2016 1 1 1 1 3 7 211
2017 1 1 1 3 214
Total 3 3 8 3 5 2 10 11 68 5 13 5 23 3 52 214

49
From Table 5.3 it is also visible that spin-offs with a parent firm in Ireland, the Netherlands and
Germany have the highest average number of focus increasing spin-offs. For all of the mentioned
countries 80% of spin-offs included in the sample are focus increasing, i.e. the spin-off has a
different SIC-code from that of the parent firm.
Turning to the information asymmetry factor, the United Kingdom is the country with the highest
percentage of firms classified as "high information asymmetry". In second place follows Sweden
with 86% of firms included in the sample classified with a high information asymmetry. It is
noteworthy that these two countries also have the largest amounts of corporate spin-offs in the
sample.
Table 5.3 – Spin-offs by Country
Country# Spin-
offs
Avg. Spin-
off Value
Focus
Incr.
High
Info.
Asym.
Avg.
Relative
Size
AUT 3 691 67% 67% 38%
BEL 3 690 67% 67% 28%
CHE 8 1,826 63% 75% 12%
DEN 3 1,049 0% 67% 19%
DEU 5 3,615 80% 60% 11%
ESP 2 2,459 0% 50% 6%
FIN 10 1,088 50% 50% 39%
FRA 11 1,975 64% 64% 7%
GBR 68 917 68% 93% 16%
IRL 5 902 80% 40% 10%
ITA 13 3,733 62% 62% 11%
NLD 5 3,786 80% 60% 46%
NOR 23 471 39% 70% 26%
PRT 3 216 67% 67% 15%
SWE 52 328 67% 86% 21%
Total 214 1,123 57% 65% 18%

50
Table 5.4 – Spin-offs by Industry
Industry (2-digit SIC)# Spin-
offs
Avg.
Value
Focus
Incr.
% High
Info.
Asym.
Avg.
Relative
Size
Industry (2-digit SIC)# Spin-
offs
Avg.
Value
Focus
Incr.
% High
Info.
Asym.
Avg.
Relative
Size
Amusement and Recreation Services 4 59 25% 25% 9% Leather and Leather Products 1 489 100% 100% 2%
Apparel and Accessory Stores 2 1,309 50% 50% 10% Lumber and Wood Products, Except Furniture 1 1,825 100% 100% 39%
Apparel, Finished Products from Fabrics & Similar Materials 2 831 50% 50% 7% Measuring, Photographic, Medical, & Optical Goods, & Clocks 6 205 25% 67% 13%
Automotive Dealers and Gasoline Service Stations 1 145 100% 0% 35% Metal Mining 5 823 40% 100% 5%
Building Materials, Hardware, Garden Supplies & Mobile Homes 2 430 50% 100% 4% Mining and Quarrying of Nonmetallic Minerals, Except Fuels 2 64 50% 100% 7%
Business Services 19 188 16% 58% 14% Miscellaneous Retail 2 1,696 50% 100% 79%
Chemicals and Allied Products 21 1,079 14% 67% 10% Motion Pictures 2 42 50% 50% 36%
Communications 11 4,038 45% 55% 27% Motor Freight Transportation 1 7,222 100% 0% 18%
Construction - General Contractors & Operative Builders 7 419 29% 86% 27% Nonclassifiable Establishments 3 2,640 67% 67% 8%
Construction - Special Trade Contractors 1 3 100% 100% 0% Nondepository Credit Institutions 2 703 50% 100% 35%
Depository Institutions 4 715 25% 75% 7% Oil and Gas Extraction 12 647 13% 67% 27%
Eating and Drinking Places 2 1,636 50% 50% 12% Paper and Allied Products 1 41 100% 0% 13%
Electric, Gas and Sanitary Services 7 4,545 43% 29% 23% Petroleum Refining and Related Industries 1 2,498 100% 100% 2%
Electronic & Other Electrical Equipment & Components 11 466 36% 55% 14% Primary Metal Industries 1 2,345 100% 100% 14%
Engineering, Accounting, Research, and Management Services 2 19 50% 50% 61% Printing, Publishing and Allied Industries 4 94 25% 75% 7%
Fabricated Metal Products 1 111 100% 100% 20% Real Estate 12 275 33% 75% 36%
Food and Kindred Products 4 112 25% 50% 13% Rubber and Miscellaneous Plastic Products 2 71 50% 100% 11%
Food Stores 2 268 50% 50% 14% Security & Commodity Brokers, Dealers, Exchanges & Services 3 2,540 33% 67% 31%
Furniture and Fixtures 3 24 33% 100% 7% Services, Not Elsewhere Classified 1 2,725 100% 100% 22%
General Merchandise Stores 2 5,305 50% 0% 39% Stone, Clay, Glass, and Concrete Products 1 1,470 100% 100% 50%
Health Services 1 16 100% 100% 9% Tobacco Products 1 992 100% 100% 5%
Heamy Construction, Except Building Construction, Contractor 1 179 100% 100% 59% Transportation by Air 1 386 100% 0% 15%
Holding and Other Investment Offices 7 263 29% 71% 36% Transportation Equipment 7 3,832 71% 86% 7%
Home Furniture, Furnishings and Equipment Stores 1 9 100% 100% 27% Transportation Services 1 434 0% 0% 6%
Hotels, Rooming Houses, Camps, and Other Lodging Places 1 3,208 100% 0% 30% Water Transportation 5 959 20% 20% 6%
Industrial and Commercial Machinery and Computer Equipment 8 1,113 13% 50% 33% Wholesale Trade - Durable Goods 6 180 25% 25% 29%
Insurance Carriers 1 383 100% 100% 28% Wholesale Trade - Nondurable Goods 2 632 50% 50% 25%
Total 214 1,123 57% 65% 18%

51
The most popular industry by number of completed spin-offs is the "Chemicals and Allied
Products", counting a total of 21 spin-offs. Based on average spin-off value, the "Motor Freight
Transport" industry ranks first, with a spin-off value of USDm 7,222. It should be noted that only
one spin-off parent company is classified within the industry. Still, the average value is almost
seven times the average value for the total sample, measuring USDm 1,123. We then turn to the
focus increasing percentage of firms within each industry. With many industries counting single
spin-offs, we comment on the firms who are not focus increasing and have above one deal count.
Firms within "Industrial and Commercial Machinery and Computer Equipment" tend to not spin-
off subsidiaries of different industry classification, measuring only 13% of spin-offs as focus
increasing. This is well below the average of 57% for the total sample. Analysing the information
asymmetry of our sample for industries with above one observation, we witness "Water
Transportation" as the industry with the fewest firms counting high information asymmetry. Using
the methodology described in the previous section we note that 65% of the firms in the sample
are classified as high information asymmetry. Again, this classification is due to the time-varying
medians, adjusting for differences in economic states. Finally, we turn to the relative size of the
spin-offs. For categories counting more than one spin-offs, "Miscellaneous Retail" has the largest
relative spin-off size measuring 79%. This is to be compared with the sample average of 18%.
5.4 Data Collection and Validation
Despite collecting data from a well-recognized database, Sudarsanam and Qian (2007) find that
the announcement date for 157 out of 170 spin-offs needs to be corrected to an earlier date.
Similarly, the databases used in this study follow disparate definitions of announcement date,
resulting in different announcement dates for the same spin-off. Consequently, the announcement
dates have to be manually validated. In general, there are three critical dates that could be
interpreted as the announcement date of the spin-off:
Press date: The date when the spin-off is mentioned for the first time.
Confirmation date: The date of board confirmation and announcement of terms.
Approval date: The date of shareholder approval.
As this study primarily aims to capture the initial market reaction to the spin-off revelation, the
press date is used as the announcement date. To fully capture the announcement effect, each
observation is individually validated by checking press releases, information from tax authorities,

52
articles from official newspapers (The Guardian, Financial Times, etc.), and by comparing dates
found in the four databases.
With starting point in the announcement dates provided by Bloomberg, it shows that 82
observations are correctly dated, while 79 have to be adjusted to an earlier date. For 53
observations, often older observations, no exact announcement day can be found. However, the
month and year can often be found, and these often prove to align with the date provided by
Thomson One. Therefore, for all observations where no exact day is found, the Thomson One
date is used as it proved to be the most accurate for the observations with different announcement
dates.
It should be noted that the situation of each observation is unique, which is why the effect on
share price subsequent to the announcement will naturally vary. Some firms share a lot of
information, beginning with restructuring considerations that gradually transform into clear spin-
off plans. Other firms are more precise regarding their first spin-off announcement. Furthermore,
in some cases firms jointly release other news as well, which introduces bias to the announcement
effect.
5.5 Share Price Collection
To test the spin-off announcement effect, daily share prices for each parent firm are downloaded
from Datastream using the identified tickers. Following the methodology for announcement tests,
share prices are needed from 220 days prior to the spin-off announcement until 20 days subsequent
to the announcement for each parent firm.
To assess the long-term spin-off effect, daily and monthly share prices are downloaded for each
parent and respective spun-off subsidiary. Downloaded share prices cover the whole time period
from May 1988 until December 2014. All share prices are downloaded in US dollars, as both
employed benchmarks are measured in this currency. This way, we remove any returns related to
the currency fluctuations that could bias the results.

53
5.6 Bond Data Collection and Characteristics
From the identified transactions, 63 corporations had publicly traded debt at the time of the spin-
off announcement. With the possibility of a corporation having multiple debt securities traded
simultaneously, any senior traded securities are screened for using both Datastream and
Bloomberg, leaving us with some 3,000 senior traded securities in the sample. The securities are
then matched with the date of the spin-off announcement, leaving us with 880 active securities.
From these we exclude the debt of financial institutions, as their issuance of financial securities
differs from other firms. We also exclude puttable bonds and zero-coupon bonds. This is in line
with the methodology of Ederington et al. (2015) and Maxwell and Rao (2003). With this exclusion,
we arrive at a sample of 63 companies. Collectively, these firms have approximately 550 traded
securities, averaging 9 per company.
As displayed in Table 5.6, there is a large deviation between the number of firms with bonds from
those in the total sample. As the number of firms with publicly traded debt only represent 29.4%
of the total sample, their characteristics are further assessed to understand how representative they
are of the total sample.
Table 5.6 – Bond Related Spin-offs by Country and Year
Year AUT BEL CHE DEN DEU ESP FIN FRA GBR IRL ITA NLD NOR PRT SWE TotalCumulative
(# spin-offs)
1989 1 1 1
1990 0 1
1991 1 1 2
1992 0 2
1993 1 1 3
1994 1 1 4
1995 1 1 5
1996 1 2 3 8
1997 1 1 9
1998 2 1 3 12
1999 0 12
2000 1 1 13
2001 1 1 14
2002 0 14
2003 1 1 1 1 1 1 6 20
2004 1 1 1 3 23
2005 1 1 1 1 4 27
2006 1 2 1 1 1 6 33
2007 1 1 2 35
2008 1 1 36
2009 1 1 1 3 39
2010 1 1 1 3 42
2011 1 1 1 1 1 5 47
2012 1 1 2 1 5 52
2013 2 2 54
2014 1 1 1 3 57
2015 1 1 58
2016 1 1 1 2 5 63
2017 0 63
Total 1 0 3 0 4 2 3 5 16 3 2 4 9 0 11 63

54
Table 5.6 displays the distribution of the corporate spin-offs over time and across nations. As can
be seen, there is an increasing amount of bonds over time, suggesting that bonds have become
more popular for spin-offs in Europe.
Table 5.7 – Bond Related Spin-offs by Country
Table 5.7 depicts credit rating of bond issuers through different nations. As can be seen, we only
have two countries with high yield issuers, namely United Kingdom and Norway. This comes to
little surprise given that the UK have long been the financial center in Europe, and Norway’s
history of high yield bond issuance related to its offshore and oil exposure. We also recognize that
the investment graded issuers represent 84% of our total sample.
CountryInvestment
Grade
High
Yield
Avg. Bond
Value
Avg. Spin-
off Value
Avg.
Relative Size
AUT 1 3,115 1,924 39%
CHE 3 345 2,812 14%
DEU 4 26,399 2,653 7%
ESP 2 6,690 2,459 6%
FIN 3 988 2,499 38%
FRA 5 2,881 1,343 3%
GBR 10 6 3,237 3,751 13%
IRL 3 10,656 1,387 10%
ITA 2 13,558 5,120 36%
NLD 4 946 4,733 46%
NOR 5 4 640 1,454 20%
SWE 11 521 911 23%
Total 53 (84%) 10 (16%) 4,233 2,035 14%

55
Table 5.8 – Bond Related Spin-offs by Industry
Table 5.8 shows the distribution of firms with traded bonds that engage in spin-off activity across
the industry. It also displays the average spin-off value in each industry, similar to the equity tables.
One notable difference is that the average size of the spin-offs with bonds is notably smaller than
for the whole equity-related sample.
After verifying that all traded securities are collected, we collect their daily gross price, reflecting
the clean price and accrued interest from Datastream. We also collect the size of each outstanding
security from Datastream, denominated in USD. In addition, we require non-missing information
regarding issue size and that the companies be rated in Bloomberg, from which we collect the data
regarding credit rating.
Industry (2-digit SIC) # Spin-offsBond
Value
Avg. Bond
Value
Spin-off
Value
Avg. Spin-
off Value
Avg.
Relative Size
Apparel, Finished Products from Fabrics & Similar Materials 1 30 30 82 82 31%
Business Services 5 6,145 1,229 8,998 1,800 25%
Chemicals and Allied Products 6 35,655 5,943 11,077 1,846 4%
Communications 4 38,784 9,696 16,724 4,181 12%
Eating and Drinking Places 1 4,588 4,588 552 552 80%
Electric, Gas and Sanitary Services 4 41,408 10,352 15,013 3,753 27%
Electronic & Other Electrical Equipment & Components 1 31,608 31,608 3,225 3,225 4%
Engineering, Accounting, Research, and Management Services 1 594 594 737 737 44%
General Merchandise Stores 3 12,712 4,237 5,780 1,927 24%
Holding and Other Investment Offices 2 1,521 760 358 179 29%
Home Furniture, Furnishings and Equipment Stores 2 5,201 2,601 821 411 2%
Industrial and Commercial Machinery and Computer Equipment 2 1,133 566 4,431 2,216 51%
Measuring, Photographic, Medical, & Optical Goods, & Clocks 2 27,006 13,503 741 371 2%
Motor Freight Transportation 2 750 375 11,742 5,871 62%
Nonclassifiable Establishments 1 347 347 853 853 8%
Nondepository Credit Institutions 2 30,563 15,281 3,019 1,509 9%
Oil and Gas Extraction 6 3,820 637 3,607 601 17%
Paper and Allied Products 1 1,665 1,665 4,034 4,034 5%
Printing, Publishing and Allied Industries 1 12,641 12,641 6,696 6,696 41%
Real Estate 5 4,661 932 3,380 676 23%
Security & Commodity Brokers, Dealers, Exchanges & Services 1 155 155 7,603 7,603 32%
Stone, Clay, Glass, and Concrete Products 1 186 186 157 157 3%
Textile Mill Products 1 105 105 409 409 17%
Tobacco Products 1 347 347 1,502 1,502 23%
Transportation by Air 1 1,940 1,940 7,222 7,222 18%
Transportation Equipment 2 301 150 667 333 48%
Transportation Services 1 439 439 434 434 61%
Water Transportation 1 872 872 2,927 2,927 54%
Wholesale Trade - Durable Goods 1 238 238 43 43 5%
Wholesale Trade - Nondurable Goods 1 1,238 1,238 5,398 5,398 41%
Total 63 266,652 4,233 128,232 2,035 14%

56
6 Hypotheses
Based on existing theory and findings, the following null hypotheses are formulated to test if there
is any wealth effect associated with spin-offs.
Hypothesis I: The announcement effect of spin-offs yields positively significant abnormal
shareholder returns.
Hypothesis II a: The long-term performance effect following spin-off yields insignificant abnormal
returns for parent shareholders.
Hypothesis II b: The long-term performance effect following spin-off yields insignificant
abnormal returns for subsidiary shareholders.
Hypothesis II c: The long-term performance effect following spin-off yields insignificant abnormal
returns for the shareholders’ pro-forma portfolio.
Hypothesis III a: Focus-increasing spin-offs are significant in explaining any wealth effect
associated with spin-offs around the announcement date.
Hypothesis III b: Neither focus-increasing nor non-focus-increasing spin-offs show any significant
relationship with long-term abnormal returns.
Hypothesis IV a: The level of information asymmetry is insignificant in explaining spin-off
abnormal returns around the announcement date.
Hypothesis IV b: Neither a high level nor low level of information asymmetry show any significant
relationship with long-term abnormal returns.
Hypothesis V a: The relative spin-off size is significant in explaining spin-off abnormal returns
around the announcement date.
Hypothesis V b: Neither relatively large nor small spin-offs show any significant relationship with
long-term abnormal returns.
Hypothesis VI a: The announcement effect of spin-offs yields a significant negative bondholder
return.
Hypothesis VI b: The announcement effect of spin-offs yields a significant positive increase in
aggregated firm value for which shareholders earn a positive abnormal return at the expense of
bondholders’ loss.

57
7 Empirical Findings
This section outlines the empirical findings obtained by applying the described methodology to
the collected data. The results are reported in similar order to the Conceptual Framework,
introduced in Section 4. We begin with the spin-off effect on equity, followed by an examination
of the potential factors explaining the gains of shareholders. Finally, we discuss the effect on bond
value and potential wealth expropriation.
7.1 Stock Returns
An analysis of stock returns is carried out on the announcement of the spin-off and for its long-
term performance. Parent firms, subsidiaries, and pro-forma sets are examined. The
announcement tests investigate a sample of 214 firms during the time period 1988–2017. For the
long-term, we investigate 201 observations between 1988 and 2014.
7.1.1 Announcement Effect
Three different time windows before and after the announcement date are used to test whether
there is a shareholder wealth effect associated with the announcement of spin-offs. The window
ranging from one day prior to the announcement to one day after is considered to capture the
main effect, while the time windows ranging ten days before the announcement and ten days after
the announcement will complement the overview. This enables an understanding of any eventual
wealth effect that could arise due to information leakage prior to the event or due to an inefficient
market reaction subsequent to the main event.
Table 7.1 shows the sample characteristics of 214 parent firms around the announcement day. It
can be seen that the proportion of positive to negative abnormal returns in general is equal.
However, the announcement day yields a larger proportion of positive abnormal returns, being
68%. This is similar to the 63% reported by Hite and Owers (1983) and the 60% reported by Veld
and Veld-Merkoulova (2004). A positive average abnormal return on the announcement day can
also be observed. The average abnormal return for this day along with corresponding returns for
the day before and the day after yield the highest average abnormal returns, implying a steep
increase in the cumulative abnormal return for this period.
By analyzing the median AARs post announcement date, we find that the majority of the days
provide negative abnormal median returns. This would suggest a general overreaction to the
announcement, which is neutralized in the following days. However, in analyzing the means, there

58
does not seem to be an overreaction. As such, the market seems to efficiently incorporate the new
information.
Table 7.1 – Spin-off Announcement Effect
The announcement effect is further illustrated in Figure 7.1, where the cumulative abnormal return
of parent firms is depicted over an event window of -10 days to +10 days. The increase starts prior
to the announcement day, which could suggest the existence of information leakage and rumors
that positively affect the share price. Again, the most substantial increases occur the day before the
announcement and on the very day of the announcement. These two days together imply a
cumulative increase of 2.9%.
Day AAR CAAR % Positive Median Min Max
-10 -0.02% -0.02% 53.33% -0.02% -0.09 0.05
-9 0.18% 0.15% 51.11% -0.02% -0.08 0.11
-8 0.15% 0.30% 53.78% 0.02% -0.09 0.11
-7 0.19% 0.49% 51.56% -0.01% -0.08 0.12
-6 -0.07% 0.42% 48.44% -0.14% -0.11 0.10
-5 0.03% 0.46% 53.78% 0.09% -0.13 0.09
-4 0.06% 0.52% 51.56% -0.03% -0.06 0.10
-3 0.39% 0.91% 56.44% 0.14% -0.07 0.24
-2 -0.16% 0.74% 48.89% -0.11% -0.11 0.09
-1 0.97% 1.71% 54.67% 0.17% -0.11 1.18
0 1.89% 3.60% 67.56% 0.84% -0.25 0.54
1 0.43% 4.03% 55.11% 0.11% -0.13 0.25
2 -0.04% 3.99% 48.00% -0.12% -0.13 0.18
3 -0.02% 3.97% 44.89% -0.19% -0.22 0.20
4 0.12% 4.09% 52.44% -0.01% -0.12 0.14
5 0.07% 4.16% 52.44% 0.02% -0.09 0.09
6 -0.44% 3.71% 45.33% -0.21% -0.28 0.16
7 0.03% 3.75% 48.89% -0.24% -0.10 0.33
8 -0.13% 3.61% 51.56% -0.13% -0.08 0.16
9 -0.13% 3.48% 44.00% -0.23% -0.07 0.09
10 0.19% 3.67% 51.56% -0.02% -0.09 0.23
Number of observations = 214

59
Figure 7.1 – Abnormal Return at Announcement
The above-mentioned abnormal returns for the complete studied period, covering 10 days prior
to and 10 days subsequent to the announcement can also be seen in the Figure 7.1.
Table 7.2 – Cumulative Average Abnormal Returns (CAAR)
The observations from Table 7.1 and Figure 7.1 are confirmed by the statistical tests, as can be
seen in Table 7.2. The results show a significant cumulative average abnormal return of 3.3% for
the main event window, which is significant at the 1% level. These results are in line with those of
previous studies on both the European and US markets, although they are lower than those in the
European studies of Kirchmaier (2003) and Sudarsanam and Qian (2007), who report abnormal
announcement returns of +5.4% and +4.8%, respectively, for the same event window. However,
the result is higher than the +2.6% reported by Veld and Veld-Merkoulova (2004). The results
allow us to confirm Hypothesis I, that the announcement effect of a spin-off yields positively
significant abnormal returns.
The event window prior to the announcement day, 𝑡−10 to 𝑡−1, shows a positive abnormal return,
indicated by modest significance. As mentioned above, this tendency could indicate information
-1.0%
-0.5%
0.0%
0.5%
1.0%
1.5%
2.0%
2.5%
-10 -9 -8 -7 -6 -5 -4 -3 -2 -1 0 1 2 3 4 5 6 7 8 9 10
Median AAR
Event Window CAAR T-statistic P-value
t-10 to t-1 1.71%* 1.69 0.09
t-1 to t+1 3.29%*** 2.58 0.01
t+1 to t+10 0.07% 0.10 0.92(***) 1% significance, (**) 5% significance, (*) 10% significance; two-
sided test. Number of observations = 214

60
leakage or rumors prior to the announcement that affect the share prices positively. Consequently,
the true spin-off announcement effect is possibly not entirely isolated.
However, in line with the recognition from Table 7.2 and Figure 7.1, the event window subsequent
the spin-off announcement does not indicate similar positive results. This implies that the market
is relatively efficient in incorporating the spin-off news in the share price.
Figure 7.2 – Announcement Abnormal Return
As can be observed in Figure 7.2 there seems to be a positive reaction to spin-off announcements
for all decades displayed but with some differences in market efficiency. For the period 1988–
1997, the event window does not seem to be as clearly isolated as for the other periods. This is
because the positive abnormal returns are observed first after the main event window. There could
also be an overreaction to the spin-off announcement as interpreted by the negative reaction in
the days subsequent to the positive share price reaction. We note that this could be due to our
limited ability to verify the true announcement date. This will be elaborated on later in the
Discussion, Section 8.1.1. In addition, the share price reaction for the observations after the last
peer-reviewed article seems to be in line with our general findings.
-6%
-4%
-2%
0%
2%
4%
6%
8%
-20 -18 -16 -14 -12 -10 -8 -6 -4 -2 0 2 4 6 8 10 12 14 16 18 20
'88-'97 '98-'07 '08-'17 All

61
7.1.2 Long-term Effect
Based on different methodological approaches, two separate long-term tests are employed to
assess the average performance of parents and subsidiaries for different holding periods.
Furthermore, as spin-offs lead to a pro-rata distribution of shares, a combined firm (“pro-forma”)
is created for the holding periods subsequent to the spin-off. This is created by weighing the parent
and the subsidiary by their respective market value of equity on the initial trading date of the
subsidiary. This way, the return of a spin-off passive investor who holds on to both parent and
subsidiary shares following the spin-off is reflected.
To start, a calendar–time portfolio methodology is employed. Each calendar–time portfolio of the
subsidiaries, parents, and the pro-forma combinations is assessed against the Fama–French Three-
Factor model. This method adjusts for cross-correlation against overlapping observations
(Mitchell & Stafford, 2000). Additionally, as the majority of previous research has assessed the
performance of spin-offs based on excess return over industry peers, we will also apply an industry-
match approach for robustness. Throughout each employed methodology, equal weighted returns
are used because they better reflect the abnormal returns associated with a random spin-off event,
which is what this thesis aim to investigate.
While the calendar–time portfolio approach yields abnormal returns, the industry-match approach
yields excess returns. As these two measurements are not the same, the results will be separately
compared to previous studies that report a corresponding metric.

62
7.1.2.1Calendar–Time Portfolio
Average monthly portfolio returns of equally weighted parents, subsidiaries, and pro-forma
combinations are separately regressed less the contemporaneous risk-free rate against the Fama–
French model’s three contemporaneous risk factors. This is done for each holding portfolio of 6,
12, 24, and 36 months. The results of the regressions are shown in Table 7.3.
Table 7.3 – Fama-French Three-Factor Regressions
For all portfolios and for all holding periods, it can be observed that the market coefficient is
significant at the 1% level, ranging around a value of 1. This implies that the market is highly
significant in explaining the investigated returns of all subsamples.
The SMB factor is significant at a 1% level for all portfolios and holding periods, apart from the
parent portfolio 6-month return that is significant at the 5% level. Again, this significance implies
that parts of the returns are attributable to this factor. The more significant explanatory factors,
the more isolated the spin-off effect becomes, increasing the validity of the abnormal returns.
6M 12M 24M 36M
alpha -4.32% -3.43% -4.33% -1.61%
Mkt 0.98*** 1.07*** 1.07*** 1.08***
SMB 0.37** 0.58*** 0.52*** 0.33***
HML 0.30* 0.00 0.02 0.01
Adj. R2
35.71% 43.78% 57.98% 66.59%
6M 12M 24M 36M
alpha 10.87%** 17.60%*** 13.51%*** 8.30%***
Mkt 1.06*** 0.99*** 1.00*** 0.94***
SMB 0.69*** 1.15*** 0.59*** 0.48***
HML -0.32* -0.34 -0.11 -0.01
Adj. R2
35.09% 21.79% 50.80% 57.98%
6M 12M 24M 36M
alpha -0.43% 3.21% 0.66% 0.51%
Mkt 0.98*** 1.06*** 1.06*** 1.04***
SMB 0.47*** 0.64*** 0.49*** 0.30***
HML 0.08 -0.12 0.01 0.03
Adj. R2
42.88% 50.41% 65.50% 70.32%
Proforma
Parent
Subsidiary
The alphas are converted to annual figures. (***) 1% significance, (**) 5% significance and (*)
10% significance; two-sided test. Number of observations = 201 (6M), 193 (12M), 181 (24M),
176 (36M)

63
In contrast to the SMB, the HML factor displays none or weak significance for all portfolios and
holding periods. This means that this factor fails to explain any of the investigated returns and is
therefore unable to explain the spin-off effect.
The adjusted R-square represents how much of the variation in excess returns can be explained by
the employed benchmark. Seemingly, the applied model serves as a better proxy the longer the
holding period. This is expected, as there are more data points for longer time periods, thus
increasing the number of shares in the portfolio. For a 36-month holding period, 58.0%–70.3%
of the variations of the return less the risk-free rate can be explained by the factors in the model.
Parent Abnormal Return
The parent portfolio shows negative abnormal returns for all holding periods. Although
insignificant, this contradicts the findings of the US studies that report positive abnormal parent
returns (Cusatis et al., 1993; Desai & Jain, 1999; McConnell et al., 2001). European studies show
mixed results regarding the parent firms but generally indicate a positive abnormal return tendency.
The magnitude of the abnormal returns found is similar to the findings of Kirchmaier (2003), who
reports a negative abnormal parent return of -4.9% for the first 100 days subsequent to the spin-
off and -5.9% for the 700 days following the spin-off. Nevertheless, while the abnormal returns
of Kirchmaier appear to decrease over time, the results of our study fluctuate over time.
Furthermore, one should note that Kirchmaier (2003) investigates the effect of demergers and not
particularly spin-offs, thus including observations that are not representative in our study.
Sudarsanam and Qian (2007), however, report an initial negative parent abnormal return of -3.9%
for the holding period of 12 months, followed by positive results of +6.2% and +7.1% for 24 and
36 months, respectively. Again, these results are insignificant.
Subsidiary Abnormal Return
The tests of the subsidiary portfolios yield positive and significant abnormal returns for all holding
periods. The results are in line with the US studies by Desai and Jain (1999) and McConnell and
Ovtchinnikov (2004), who report positive and significant subsidiary abnormal returns. Sudarsanam
and Qian (2007) also report positive abnormal returns for European spin-off subsidiaries;
however, the results are insignificant for all holding periods.
The spin-off subsidiaries yield the largest yearly abnormal return 12 months subsequent to the
spin-off, being 17.6% and significant at the 1% level. The 24-month holding period is slightly

64
lower, being 13.5%. Similarly, the 36-month abnormal return is lower again, being 8.3% and
significant at the 1% level.
It is noteworthy that the subsidiary always load negative on the HML factor. This implies that the
portfolio carries characteristics similar to growth stocks and has a low book-to-market value. In
addition to the 12-month portfolio displaying the largest abnormal return, this is also where the
SMB loads the largest and the HML loads are the most negative. The positive loading on the SMB
factor suggest that the portfolio carries characteristics similar to small stocks. It should be noted
that the portfolios displaying the highest alphas are also the portfolios that are the least explained
by the model, as indicated by the lower adjusted R squared.
Pro-forma Abnormal Return
By adding the spun-off subsidiary with its parent into a weighted portfolio, one can assess the
general wealth effect that is generated for an investor that held shares of a parent firm prior to the
spin-off. The test results show no significant abnormal return for the pro-forma portfolios. A
slight positive but insignificant abnormal return can be noted for longer holding periods, indicating
that the spin-off activity at least does not appear to be unfavorable for the passive investor.
Considering that the abnormal returns generated by the parent portfolios are negative while the
corresponding returns of the subsidiary portfolios are positive, a pro-forma abnormal performance
of around zero is not surprising. On average, previous studies report much more positive but
insignificant abnormal pro-forma returns. Only Desai and Jain (1999) find significant pro-forma
abnormal returns, being 19.8% for the holding period of 36 months. It should also be noted that
the pro-forma portfolios display the highest adjusted R square for all portfolio horizons.
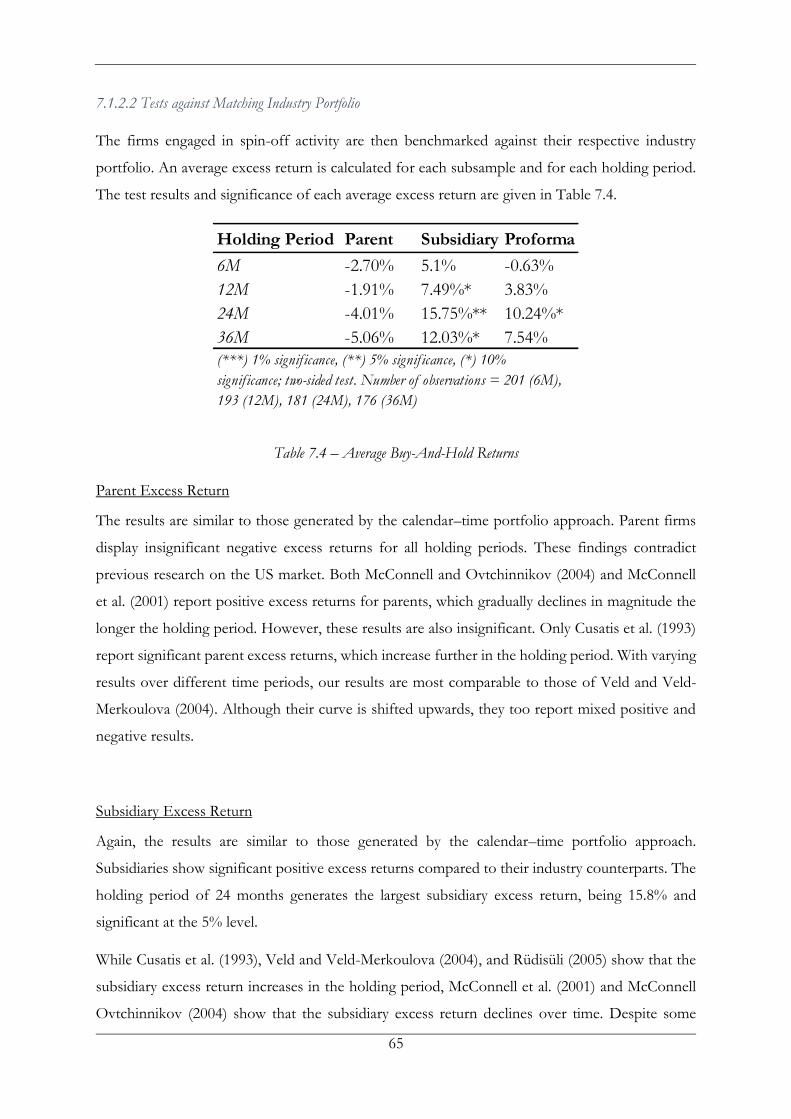
65
7.1.2.2 Tests against Matching Industry Portfolio
The firms engaged in spin-off activity are then benchmarked against their respective industry
portfolio. An average excess return is calculated for each subsample and for each holding period.
The test results and significance of each average excess return are given in Table 7.4.
Table 7.4 – Average Buy-And-Hold Returns
Parent Excess Return
The results are similar to those generated by the calendar–time portfolio approach. Parent firms
display insignificant negative excess returns for all holding periods. These findings contradict
previous research on the US market. Both McConnell and Ovtchinnikov (2004) and McConnell
et al. (2001) report positive excess returns for parents, which gradually declines in magnitude the
longer the holding period. However, these results are also insignificant. Only Cusatis et al. (1993)
report significant parent excess returns, which increase further in the holding period. With varying
results over different time periods, our results are most comparable to those of Veld and Veld-
Merkoulova (2004). Although their curve is shifted upwards, they too report mixed positive and
negative results.
Subsidiary Excess Return
Again, the results are similar to those generated by the calendar–time portfolio approach.
Subsidiaries show significant positive excess returns compared to their industry counterparts. The
holding period of 24 months generates the largest subsidiary excess return, being 15.8% and
significant at the 5% level.
While Cusatis et al. (1993), Veld and Veld-Merkoulova (2004), and Rüdisüli (2005) show that the
subsidiary excess return increases in the holding period, McConnell et al. (2001) and McConnell
Ovtchinnikov (2004) show that the subsidiary excess return declines over time. Despite some
Holding Period Parent Subsidiary Proforma
6M -2.70% 5.1% -0.63%
12M -1.91% 7.49%* 3.83%
24M -4.01% 15.75%** 10.24%*
36M -5.06% 12.03%* 7.54%
(***) 1% signif icance, (**) 5% signif icance, (*) 10%
signif icance; two-sided test. Number of observations = 201 (6M),
193 (12M), 181 (24M), 176 (36M)

66
curvilinearity, the general trend of our results is in line with Cusatis et al. (1993), Veld and Veld-
Merkoulova (2004), and Rüdisüli (2005).
Contradicting the findings related to the downside risk suggested by Cusatis et al. (1993) following
the portfolio rebalancing of institutional investors, our results indicate that an investor is not hurt
by investing in a spin-off from the initial trading date. However, the investor can benefit even
more from a longer holding period.
Again, the results are mostly in line with the findings of Veld and Veld-Merkoulova (2004), who
report positive excess returns for all holding periods that increase over time. Similarly, our results
indicate outperformance for all holding periods. However, our results are significant for all but the
6-month holding period. This implies that European spin-off subsidiaries on average are value
creating in the long-term.
Pro-forma Excess Return
While the calendar–time approach shows no significance for pro-forma abnormal returns, the
matching industry portfolio approach yields some significant results. Similar to the results of
subsidiaries, it can be seen from Table 7.4 that the pro-forma excess return shows a positive trend.
As the pro-forma return is a weighted combination of the parent and subsidiary, it is expected that
its reported excess return will be in between them.
Holding periods up to 12 months yield no statistical significance. However, the holding period of
24 months yields an excess return of 10.2%, being significant at the 10% level. This finding implies
that spin-off activity in European firms creates value for existing shareholders that is visible in the
longer term. Although investigating another market, Cusatis et al. (1993) similarly find a significant
pro-forma excess return of 18.9% in a 24-month holding period.
7.1.2.3 Summary of Long-Term Results
Most of the previous studies find no significant outperformance for parent firms or subsidiaries.
However, these studies document a positive economic effect, primarily with regard to subsidiaries
but also for parents. In general, our results are in line with previous research and prove that the
subsidiaries generate larger abnormal/excess return than the parent firms.
Our results imply no statistical significance for parent firms. Subsidiaries, however, consistently
outperform the market. The evidence is robust to both employed methods. Even though our
results are in line with existing research, no previous peer-reviewed European study has found any
significance for either subsidiaries or pro-forma combinations.

67
The results for the pro-forma returns are ambiguous. While the calendar–time approach yields no
significant results for any period, the matching industry portfolio approach reveals significant pro-
forma excess returns for the holding period of 24 months. This could imply that European spin-
offs are value creating for shareholders. No matter the choice of methodology, almost all pro-
forma results are positive, indicating a positive economic effect. Therefore, it can be said that spin-
off activity at least does not hurt the passive shareholder and might have a positive economic
effect.
The results allow us to accept Hypothesis II a, that the long-term performance effect following
spin-off yields insignificant abnormal returns for parent shareholders. However, Hypothesis II b
is rejected, as the long-term performance effect yields significantly positive abnormal returns for
the subsidiaries. Finally, the rejection of Hypothesis II c is inconclusive. Pro-forma firms display
weak or insignificant outperformance; therefore, it can only be concluded that spin-off activity is
not negative for the passive investor.
7.2 Shareholder Value-creating Factors
To further analyze the spin-off value creation effect, the different factor proxies are tested upon
the announcement and in the long-term. A total sample of 214 observations is used in all tests,
which is the same sample as for the long-term tests.
7.2.1 Value-creating Factors: Spin-off Announcement Effect
Upon announcement, the means, medians, and respective differences of each subsample are tested
for significance. While the mean of a subsample represents the average abnormal return gained for
the announcement period (𝑡−1 to 𝑡+1), the median of a subsample presents a rough overview of
the abnormal return distribution. An investigation of both metrics across the subsamples for each
factor enables a more complete overview.
Table 7.5 shows the abnormal returns for each subsample during the holding period of 𝑡−1 to 𝑡+1.
The significance of each mean and the mean difference is t-tested. The significance of each median
is tested using the Wilcoxon signed rank test, and the median difference is tested using the Mann–
Whitney U-test.

68
Table 7.5 – Announcement Factor Investigation
It can be seen that all means and medians of all subsamples are positive and highly significant. This
in general supports the previous overall finding of spin-off announcements being value-creating.
It can also be observed that the mean is larger for the focus-increasing spin-offs, spin-offs with
high information asymmetry, and relatively larger spin-offs compared to each respective
counterpart. This suggests that the factors are explanatory. The median displays the same pattern
for corporate focus and relative size, being larger for the subsample that has the certain
characteristics. On the contrary, the median for the subsample with high information asymmetry
is lower than the subsample with low information asymmetry.
In order to conclude that any of the investigated variables has an explanatory effect on the
abnormal returns for the spin-off announcement period, the mean and median differences across
the subsamples need to be significant. Nevertheless, the results presented in Table 7.5 show weak
or no significance. The following sections further describe the results for each investigated factor.
7.2.1.1 Improvement in Corporate Focus
Focus-increasing spin-offs yield a larger mean of 3.9% compared to the 2.4% for non-focus-
increasing spin-offs, which is in line with previous findings for both the US and European markets
(Desai & Jain, 1999; Krishnaswami & Subramaniam, 1999; Veld & Veld-Merkoulova, 2004).
Initially, this larger mean suggests that focus-increasing spin-offs are more value-creating
compared to non-focus-increasing spin-offs.
The median displays the same pattern, being larger for the subsample with focus-increasing spin-
offs at 2.6%, while the subsample with non-focus-increasing spin-offs shows 2.3%. Because the
Mean Median n Mean Median n Mean Median
CAAR 3.92% 2.56% 123 2.35% 2.26% 91 1.58% 0.30%
Test stat. 3.70*** 4.82*** 2.74** 0.02*** 1.83 -0.40
Mean Median n Mean Median n Mean Median
CAAR 3.89% 2.37% 139 2.09% 2.55% 75 1.80% -0.18%
Test stat. 3.81*** 5.29*** 2.75*** 3.33*** 1.41 -0.37
Mean Median n Mean Median n Mean Median
CAAR 4.53% 2.50% 108 1.95% 2.32% 106 2.58% 0.18%
Test stat. 3.70*** 5.03*** 2.74*** 3.79*** 0.07 -1.93*
Incr. Corp. Focus Non-incr. Corp. Focus Dif f .
(***) 1% significance, (**) 5% significance, (*) 10% significance; two-sided test. Event window: t-1 to t+1
Relative Size - Large Relative Size - Small Dif f .
High Info. Asym. Low Info. Asym. Dif f .

69
medians are close to each other, the distributions of the subsamples overlap to a large extent. Veld
and Veld-Merkoulova (2004) report similar results.
Furthermore, the tests of mean and median differences are insignificant. While Desai and Jain
(1999) only test the means and base their conclusion on this, Veld and Veld-Merkoulova (2004)
and Rüdisüli (2005) perform similar mean and median difference tests and conclude that the
variable has some importance. Our results are in line with these findings, but are less significant.
In summary, we therefore reject Hypothesis III a, that focus-increasing spin-offs are not
explanatory for any announcement wealth effect.
7.2.1.2 Information Asymmetry
The subsample with high information asymmetry yields a mean of 3.9%, while the low information
asymmetry subsample displays a mean of 2.1%. This is in line with the findings of Krishnaswami
and Subramaniam (1999), suggesting the spin-offs implemented by firms with high information
asymmetry create a relatively larger positive reaction. This result contradicts the findings of Veld
and Veld-Merkoulova (2004), who find the opposite relationship where low information
asymmetry appears to yield larger abnormal returns.
It is noteworthy that the median for the subsample with a high level of information asymmetry is
lower at 2.4% compared to the subsample with a low level of information asymmetry at 2.6%.
While the higher mean for the factor could be generated by a few extreme outlier observations,
the lower median reveals that the whole distribution of the subsample is negatively shifted
compared to the other subsample.
Nevertheless, the mean and median differences presented in Table 7.5 show no significance.
Previous studies report mixed findings for the information asymmetry variable. Krishnaswami and
Subramaniam (1999) conclude the information asymmetry variable to be significant at the 1% level
for the US market. However, our results are in line with the previous European findings of Veld
and Veld-Merkoulova (2004) and Sudarsanam and Qian (2007), who do not find evidence of high
information asymmetry explaining the wealth effect of spin-offs.
To form a solid conclusion, it is desired that the mean, the median, and the differences for these
metrics are significant. The fact that both the mean and the median are significant and larger for
the subsample displaying high information asymmetry suggests that the variable plays a role.
However, as the mean and median differences are insignificant, the importance is limited. This
allows us to accept Hypothesis IV a, that the information asymmetry variable is unable to explain
any wealth effect associated with the announcement of spin-offs.

70
7.2.1.3 Relative Size
On average, larger spin-offs generate a mean of 4.5%, while 2.0% is reported for the relatively
smaller spin-offs. This result is aligned with the findings of Hite and Owers (1983), Miles and
Rosenfeld (1983), Krishnaswami and Subramaniam (1999),Veld and Veld-Merkoulova (2004) and
Rüdisüli (2005). In line with a higher mean for the subsample of larger relative spin-offs, the
median for this sample is also greater at 2.5% while the subsample with small relative spin-off size
shows 2.3%.
When testing the mean and median differences, relative size is the only variable with significant
results. Although the mean difference is insignificant, the median difference is significant at the
10% level. As mean, median, and the median difference for the relative size factor are significant,
thus we can accept Hypothesis V a, that the relative spin-off size significant in explaining abnormal
returns upon announcements. This finding confirms the previous findings of Hite and Owers
(1983), Miles and Rosenfeld (1983), Krishnaswami and Subramaniam (1999), Veld and Veld-
Merkoulova (2004) and Rüdisüli (2005).
7.2.3 Value-creating Factors: Long-Term Effect
A long-term factor investigation is also conducted. Initially, the excess returns of the subsamples
are regressed against the Fama–French Three-Factor model, in line with the calendar–time
approach. Thereafter, the subsample excess returns in relation to the relevant industry portfolio is
regressed on the corresponding factor proxies. Applying both methodologies facilitates a more
robust analysis.
The following section outlines the pro-forma results of the long-term factor investigation, that is,
a weighted combination of the parent firm and spin-off subsidiary. As mentioned in the
methodology, it is our intention to capture the wealth effect generated for the pre-spin-off
shareholder. Therefore, we believe that the pro-forma returns best capture the value effect of the
passive shareholder, as this is the asset base corresponding to the parent firm prior to the spin-off.
However, it is noteworthy that previous research against which we compare our results (Desai &
Jain, 1999; Veld & Veld-Merkoulova, 2004) investigates the factors relevant only to the parent
firm. However, we still find the comparison to be relevant as the parent firm usually corresponds
to more than 80% of the pro-forma asset base.

71
7.2.3.1 Calendar–Time Factor Testing
Table 7.6 displays the results generated by the calendar-time approach.
Table 7.6 – Calendar-time Portfolio Factor Investigation
Regarding the results of the calendar–time approach in Table 7.6, the intercepts of the investigated
subsamples show different levels of significance. However, one can observe that the market
coefficient is significant at the 1% level for all regressions, implying that this coefficient has strong
explanatory power for the returns.
The SMB and HML factors differ in value and in significance across the investigated subsamples.
Generally, significant SMB and HML coefficients mean that these factors have explanatory power
over the returns, thereby increasing the isolation and reliability of the generated abnormal return
Increased Non-increased High Low Large Small
alpha -0.30% -4.47% -4.07% 10.74%* -4.87% 2.12%
Mkt 0.98*** 1.00*** 0.99*** 0.92*** 1.07*** 0.99***
SMB 0.54*** 0.39 0.48** 0.49** 0.74*** 0.25
HML -0.05 0.24 -0.09 0.30 0.18 -0.04
Adj. R2 34.52% 31.69% 34.16% 34.90% 33.48% 37.91%
Increased Non-increased High Low Large Small
alpha 3.54% 1.41% 1.58% 6.23% -0.99% 3.06%
Mkt 1.07*** 1.12*** 1.11*** 0.89*** 1.05*** 1.15***
SMB 0.57*** 0.78*** 0.79*** 0.38** 0.84*** 0.70***
HML 0.23* -0.47** -0.21 0.36** 0.28* -0.58***
Adj. R2 46.73% 32.99% 46.16% 40.54% 40.32% 43.07%
Increased Non-increased High Low Large Small
alpha 0.98% 2.09% -0.63% 9.58%** -1.80% 4.97%
Mkt 1.10*** 0.98*** 1.06*** 1.03*** 1.04*** 1.06***
SMB 0.54*** 0.38*** 0.61*** 0.05 0.66*** 0.44***
HML 0.03 -0.01 0.01 -0.08 0.21* -0.18*
Adj. R2 55.92% 53.64% 43.94% 43.94% 51.64% 55.07%
Increased Non-increased High Low Large Small
alpha 0.63% 1.50% -0.77% 5.83% -2.68% 3.82%
Mkt 1.07*** 0.98*** 1.03*** 1.07*** 1.04*** 1.05***
SMB 0.33*** 0.24** 0.37*** 0.11 0.48*** 0.24**
HML 0.01 0.12 0.08 -0.21* 0.18* -0.18*
Adj. R2 63.43% 61.10% 53.91% 53.91% 61.00% 58.38%
12 Months
6 Months
The table displays regressed monthly excess returns on the Fama French 3-Factor Model. The alphas are converted to annual figures. (***) 1% significance,
(**) 5% significance and (*) 10% significance; two-sided tests. Number of observations = 201 (6M), 193 (12M), 181 (24M), 176 (36M)
24 Months
Corporate Focus Relative SizeInformation Asymmetry
36 Months
Corporate Focus Relative SizeInformation Asymmetry
Corporate Focus Relative SizeInformation Asymmetry
Corporate Focus Relative SizeInformation Asymmetry

72
(intercept/alpha). The R squared ratio explains how much of the returns can be attributable to the
factors in the applied model.
Corporate Focus
The findings in Table 7.6 show that focus-increasing spin-offs yield no statistical significance.
However, the results for holding periods longer than 6 months are positive, which could suggest
that an investor is not hurt by investing in these kinds of spin-offs. Similarly, the results of the
non-focus-increasing sample are insignificant. While the focus-increasing spin-offs display slightly
higher figures for the two shorter holding periods, the non-focus-increasing spin-offs yield higher
outperformance at 24 and 36 months. Still, no results are significant, which is why no conclusions
can be drawn.
With regards to factor loadings (SMB and HML), we find inconclusive results which do not add
any insights to the analysis.
Overall, our results are in line with those of previous European studies because we do not find
any long-term significance for the corporate focus variables. However, Veld and Veld-Merkoulova
(2004) find positive long-term indications for the focus increasing variable to be relatively better
performing. Furthermore, our results contradict the findings of Desai and Jain (1999), who prove
a clear positive relationship between focus-increasing spin-offs and outperformance that increases
over time. They find the opposite negative relationship between non-focus-increasing spin-offs
and outperformance. Following the insignificant results, we can accept Hypothesis III b, that
neither focus-increasing nor non-focus increasing spin-offs show any significant relationship with
long-term abnormal returns.
Information Asymmetry
In contrast to the other factors, the information asymmetry subsample displays significant results.
While the announcement investigation suggested a high level of information asymmetry to yield
larger abnormal returns compared to a lower level, the long-term results in Table 7.6 indicate an
opposite relationship. Firms characterized with a low level of information asymmetry prior to the
spin-off display positive and significant abnormal returns for the 6- and 24-month holding periods.
High information asymmetry, however, indicates on average negative but insignificant abnormal
returns. This can be related to the findings of Veld and Veld-Merkoulova (2004), who also find
firms with low levels of information asymmetry perform better. However, the implications of these
results are discussable, and therefore we refer to Discussion, Section 8.2.2.

73
Turning to the factor loading of each subsample, we recognize that stocks with a high level of
information asymmetry prior to the spin-off have positive and significant loading on the SMB
factor for all time horizons analyzed. This would suggest that the portfolio carries some
characteristics with small stocks, which have a tendency to have poorer information availability.
The stocks with a low level of information asymmetry do not have as significant loadings on the
SMB factor for all time horizons, and therefore the interpretation is not as clear. We recognize the
similar inconclusive loadings on the HML factor, implying that the portfolio neither carries
characteristics of growth stocks nor value stocks. Following the results, we can reject Hypothesis
IV b. Even though a high level of information asymmetry show no significant relationship with
abnormal returns, a significant relationship is found for firms with low level of information
asymmetry.
Relative Size
Upon announcement, a significant positive abnormal return was found for larger relative spin-
offs. The long-term investigations reveal insignificant abnormal return, however here with an
opposite relation between relative size and outperformance. Although the calendar–time portfolio
factor regression yields insignificant abnormal returns, it displays some interesting tendencies. It is
notable that a relatively larger spin-off size displays negative abnormal returns for all holding
periods, while a smaller size shows positive abnormal returns. This suggests a tendency for a larger
relative size to be negative in the long-term for the passive shareholder.
Notable from the Fama–French Three-Factor regression is the significant loading on the different
factors. First, we witness positive and significant loading for the SMB factor for both subsamples,
indicating that the portfolios share risk characteristics with small firms. In addition, relatively larger
spin-offs have a higher loading on the SMB factor than small spin-offs. Second, we recognize a
negative significant loading on the HML factor for the relative small spin-off size subsample for
all time horizons above 6 months. This would suggest that the relative small spin-off subsample
shares risk characteristics with growth stocks.
Veld and Veld-Merkoulova’s findings regarding this variable are mixed. In line with our results,
the 12-month holding period of larger spin-offs yields a negative abnormal return. However, in
contrast to our results, Veld and Veld-Merkoulova report a positive abnormal return for larger
spin-offs for a 24-month holding period. Nonetheless, their results are insignificant. The results
imply that we can accept Hypothesis V b, that a neither a relatively large nor a small spin-off show
any significant long-term relationship with abnormal returns.

74
7.2.3.2 Industry Excess Portfolios Factor Testing
Table 7.7 displays the results generated by the industry-match approach.
Table 7.7 – Industry Match Factor Investigation
Contrary to the calendar–time portfolio regressions, the factor-specific returns in excess of
corresponding industry shows no or weak significance. This is in line with the pro-forma findings
outlined in Section 7.1.2, where no significant long-term abnormal return is found. However, one
should note the low R square measure, indicating that the explanatory power of the regressions is
generally very weak. Therefore, we will only comment on our findings briefly.
The corporate focus coefficients presented in Table 7.7 are all positive, displaying a trend that
grows with the length of the holding period. The coefficient for a 36-month holding period is
larger than the corresponding 12-month coefficient. Veld and Veld-Merkoulova find the opposite
relationship. However, both our results and the results of Veld and Veld-Merkoulova are
insignificant with low R square measures.
The information asymmetry coefficients reported in Table 7.7 do not provide much insight, being
close to zero, insignificant, and with a low R square measure. The tendency of a larger relative size
to be negative in the long-term for the pro-forma investor is confirmed by the simultaneous factor
regression, which displays a negative size coefficient for all holding periods except the 36 months.
The negative coefficient for the 6-month portfolio is -0.1 and significant at the 10% level, thus
supporting the conclusion.
Variable 6M 12M 24M 36M
Intercept 0.23% 2.46% 1.00% 3.96%
Corporate Focus 0.06 0.05 0.12 0.13
Information Asymmetry -0.01 0.00 0.06 -0.10
Relative Size -0.08* -0.03 -0.03 0.04
No. Observations 190 180 168 163
Adj. R2
1.19% 1.29% 1.01% 0.91%(***) 1% significance, (**) 5% significance, (*) 10% significance; two-sided test. Number of observations
= 201 (6M), 193 (12M), 181 (24M), 176 (36M)

75
7.3 Bond Returns
The following sections outline the results of the bond investigation study. The bond returns of the
parent firm are investigated upon the spin-off announcement. A total sample of 63 firms during
the time period 1989 to 2016 is used.
7.3.1 Bond Returns: Spin-off Announcement Effect
Following the methodology described, we are able to identify a significant negative abnormal
return for bondholders over the three-day event window t-1 to t+1 of -0.4%. Applying the
Wilcoxon signed rank test, we can put forward evidence of significance at the 1% level.
Table 7.8 – Announcement Abnormal Bond Return
As can be interpreted from the Table 7.8, bondholders of investment grade issuers suffer more
than those of high yield issuers. Bondholders of investment grade securities suffer on average a
loss of -0.5%, and high-yield bondholders suffer a loss of -0.3%. These results contradict the
findings of Maxwell and Rao (2003), who find high-yield issuers suffer a greater loss than
investment grade issuers. It should be noted that Maxwell and Rao (2003) evaluate the one month
bondholder return following the spin-off announcement, whereas our results represent the three-
day return around the announcement date. In addition, the results for high-yield issuers have low
significance due to a small sample size. For the total sample, independent of credit rating, the
results are in line with yet higher than those reported by Maxwell and Rao (2003), who for US
markets reported a -0.9% mean abnormal return for bondholders.
Following results allow us to accept Hypotheses VI a: the announcement effect of spin-offs yields
a significant negative bondholder return.
7.3.2 Total Announcement Wealth Effect
The below table displays the total change in firm value using our findings from previous
announcement tests for bonds and each corresponding equity announcement test. Similar to all
bond-related tests, we apply the non-parametric Wilcoxon signed rank test to test the significance
of means and medians.
Mean Median % Positive % Negative
Abnormal bond return -0.43%*** -0.28%*** 28.57% 71.43%
Abnormal equity return 2.17%*** 2.73%*** 63.49% 36.51%
Aggregated change in debt and equity 1.74%*** 2.45%*** 63.49% 36.51%
(***) 1% significance, (**) 5% significance, (*) 10% significance; two sided test. Event window = t-1 to t+1. Number
of observations = 63

76
Table 7.9 – Aggregate Return
As can be seen in Table 7.9, shareholders of companies with outstanding public debt gain on
average 2.2% upon the spin-off announcement, whereas bondholders lose -0.4%. Also noticeable
is the positive aggregate change in debt and equity upon the spin-off announcement. Our results
indicate that the aggregate value of the firm increases on average by 2.1% upon announcement.
The fact that the gains to shareholders surpass the loss of bondholders suggests that spin-offs are
not a pure wealth-transferring event, but are actually value creating beyond the bondholders’ loss.
Therefore, the bondholders’ loss can only partially explain the total wealth effect of shareholders
upon spin-off announcement. One should note that the abnormal equity return is lower for firms
with outstanding bonds than for our total sample. Also noteworthy is that the median return of
bonds is lower than the mean. The opposite can be seen for equity and aggregate change in debt
and equity. Our findings are in line with those of Maxwell and Rao (2003), who find significant
aggregate positive change in firm value of 1.6%.
7.3.3 Cross-Sectional Relationship between Shareholders and Bondholders
The following table depicts the cross-sectional relationship between the abnormal change in the
market value of equity and the change in bond value. With a significant negative relationship
between the two, we are able to strengthen the evidence of a wealth transfer from bondholders to
shareholders. The negative coefficient indicates that bondholders’ losses are more severe the larger
the gains of shareholders.
Table 7.10 – Abnormal Value Change
Mean Median % Positive % Negative
Abnormal bond return -0.43%*** -0.28%*** 28.57% 71.43%
Abnormal equity return 2.17%*** 2.73%*** 63.49% 36.51%
Aggregated change in debt and equity 1.72%*** 2.21%*** 63.49% 36.51%
(***) 1% significance, (**) 5% significance, (*) 10% significance; two sided test. Number of observations = 63
Variable Coefficient
Intercept 172.53
Δ Debt -10.44***
Firm Value -0.01
Adj. R2
55.23%
(***) 1% significance, (**) 5% significance, (*) 10% significance;
two-sided test. Number of observations = 63. Values are depicted in
million USD

77
Our findings are in line with those of Maxwell and Rao (2003) but are more significant. In
summary, the results allow us to accept Hypothesis VI b: The announcement effect of spin-offs
yields a significant positive increase in aggregated firm value for which shareholders earn a positive
abnormal return at the expense of bondholders’ loss.

78
8 Discussion
The following sections discuss the empirical findings, which are summarized in Table 8.1. Their
relevance and impact in relation to previous research and theories will be debated. The results will
be discussed according to the perspectives of different investors, where the passive shareholder
remains the main focus. First, the announcement and long-term results for equity returns are
examined. Second, the results of the announcement and long-term consequences of the
explanatory factors are reviewed. Finally, the implications of the bond study are analyzed.
Table 8.1 – Concluding Framework
Abnormal/Excess Outperformance Parent Subsidiary Proforma
Equity
Announcement
Stock Announcement Yes***
Long-term
Calendar-Time Portfolio No Yes*** No
Matching Industry Portfolio No Yes* Possibly*
Factors
Announcement
Corporate Focus Possibly***
Information Asymmetry Possibly***
Relative Size Possibly***
Long-term
Calendar-Time Portfolio
Corporate Focus No
Information Asymmetry Yes, but opposite**
Relative Size Possibly, but opposite
Industry Excess Portfolio
Corporate Focus Inconclusive
Information Asymmetry Inconclusive
Relative Size Inconclusive
Bond
Negative Bondholder Return Yes***
Wealth Transfer Yes***(***) 1% significance, (**) 5% significance, (*) 10% significance; two sided tests

79
8.1 Stock Returns
Our tests provided mixed evidence of the spin-off effect on stock return performance. The
following sections discuss the implications for all investigated horizons. The results are discussed
in relation to existing financial theory and previous research. We begin by discussing the
announcement results, followed by the long-term performance results. Subsequently, the long-
term methodological choices are reviewed.
8.1.1 Impact of Spin-off Announcement
In line with previous research, we are able to identify an abnormal stock return upon spin-off
announcements. Thereafter, the time period subsequent to the announcement does not display
any abnormal returns. These two findings imply that new information is quickly and effectively
incorporated in the average share price upon announcement. In line with the efficient market
hypothesis, this signifies that European markets are semi-efficient, reflecting all publicly available
information.
The fact that we are able to identify a significant abnormal return prior to the announcement is
discussable. One could suggest that it would provide evidence of markets being strong-form
efficient, implying that asset prices in addition to public information reflect non-public
information. However, if the markets were characterized by strong-form efficiency, various
corporate events would continuously be priced. Therefore, there would be no particular
announcement effects and no one would be able to make abnormal returns. Similarly, insider
trading legislation and legal barriers that prevent private information from becoming public makes
the existence of a strong-form efficient market more or less impossible. Our observed pre-
announcement reactions rather support a semi-strong form of efficiency, as possible information
leakage is quickly interpreted and incorporated.
As described in the data collection section, the databases used often provided different dates for
the same observation. Therefore, a manual screening of all announcement dates was necessary.
We identify the importance of these manual adjustments in the results of previous research.
Despite collecting data from a well-recognized database, Sudarsanam and Qian (2007) find that
the announcement date for 157 out of 170 spin-offs needs to be corrected to an earlier date. Veld
and Veld-Merkoulova (2004) use the same database, although they do not mention any manual
adjustments. These studies investigate similar sample sizes and time periods using similar event
study methodology; however, they still report different spin-off announcement effects of +4.8%
(Sudarsanam & Qian, 2007) and 2.6% (Veld & Veld-Merkoulova, 2004). This could partly be a
result of using different announcement dates, indicating the importance of its accuracy.

80
Similar to Sudarsanam and Qian (2007), we had to adjust approximately 62% of the provided
announcement dates to earlier dates. For the majority of these cases, the reported announcement
date was the confirmation date and not the initial press date. The importance of the manual
validation could further help explain the interpretation of the earlier observations, where the event
window did not seem to be as clearly isolated. This could potentially also explain the differences
in the results between the studies of Sudarsanam and Qian (2007) and Veld and Veld-Merkoulova
(2004). While the former seem to investigate press dates, the latter appears to investigate
confirmation dates. It is interesting to note that both events yield significant abnormal returns,
whereas the press date yields the highest. We recognize the press date to be the announcement
date in our study, which we find to be 3.3% cumulative shareholder return.
We recognize some firms release announcement of spin-offs simultaneous with other corporate
news. As such the event window aimed to capture the announcement of spin-offs could be
contaminated with other corporate announcements. This creates a potential bias in our results.
Another interesting discovery is that the availability of information differs significantly for each
firm. Some firms share a lot of information, initially mentioning restructuring considerations that
gradually transform into clear spin-off announcements. Other firm announcements come more as
surprises. In line with the efficient market theory, it could be argued that the more transparent the
firm, the smaller the announcement effect should be, as this information has steadily become
incorporated. Relating this argument to investors who seeks to exploit abnormal return
opportunities, they should aim to invest in less transparent firms that they believe could potentially
benefit from performing spin-offs. However, obviously, the less transparent the information, the
more difficult it is to detect these potentials. Put differently, as spin-off announcements with a
strong positive market reaction are unpredictable, it is rather the long-term spin-off effects that an
investor can benefit from by actively trading the security.
8.1.2 Spin-off Impact on Long-term Performance
In line with the efficient market hypothesis, we should not be able to find any abnormal significant
returns for any of the long-term portfolios. While the event study of the spin-off announcement
results supported semi-strong efficiency for developed European markets, the long-term results
are ambiguous in relation to the theory. The insignificant results for parent and pro-forma firms
do not provide robust evidence against semi-strong efficiency. On the contrary, the spun-off
subsidiaries yielded significant outperformance for all holding periods and for both employed
methodologies. This suggests a rejection of semi-strong efficiency and instead supports weak
efficiency.

81
However, it could be argued that spin-offs introduce new or increased risk. Therefore, new and
increased risk factors might not be fully understood or incorporated in the price. If this is the case,
the observed spin-off outperformance is not abnormal risk-free returns but rather an additional
risk premium. In line with this argument, the European markets could still be considered semi-
efficient.
Loughran and Ritter (2000) highlight the importance of being careful when relating studies on
long-term outperformance to the efficient market hypothesis. This can be recognized by the fact
that equal and value-weighted returns can lead to different conclusions. Our results are generated
by equal-weighted returns, which is why additional research investigating value-weighted returns
is necessary to form a more solid conclusion. Veld and Veld-Merkoulova (2004) apply both value-
weighted and equal-weighted returns but, as previously mentioned, they find no long-term
evidence for any portfolio in any holding period independent of which return type they employ.
For all our Fama-French Three-Factor regressions, the highly significant and positive market beta
loadings suggest that the market exposure is significant in explaining the variations in returns, even
when accounting for more factors. An additional general note regarding our observations is the
relatively high loading on the SMB factor, indicating that our sample carries risks similar to those
of small firms, that is, lower liquidity and/or less transparency (“poorer information availability”).
These findings are relevant for the parent, subsidiary, and pro-forma regressions, however
profound for the subsidiary portfolio. This comes as no surprise given that the spin-offs in our
sample on average had a relative size of 18% of that of the pro-forma portfolio.
As discussed with regard to the announcement effect, it is difficult if not impossible for an investor
to identify non-transparent firms that could benefit from spin-offs without trading on insider
information. Therefore, the potential long-term benefits are more relevant to investigate for an
actively trading shareholder. However, the fact that all samples load significantly on the SMB factor
implies that these stocks share characteristics with small firms, some of which are considered
illiquid. This might limit the investors’ ability to trade the stock and exploit any potential spin-off-
related mispricing.
For the HML factor, we find a less significant loading than for the SMB factor. However, we find
a positive and significant loading on the HML factor for the parent company, suggesting that it is
has characteristics similar to those of a value stock. The effect disappears for longer time horizons
but provides some insights about the market’s perception of spin-offs in the short-term (up to 6
months). It can be argued that investors anticipate that spin-offs create one value stock and one
growth stock, as the subsidiary loads negatively for the HML factor. However, as more information

82
becomes available the effect disappears as the expectations change. However, we do not find the
HML factor to be of any significance or find high loading, positive or negative, for longer time
horizons.
Opposite to the parent, we find a weak negative HML loading for all subsidiary regressions. This
could suggest that the subsidiary portfolio has characteristics similar to those of growth stocks.
Growth stocks, by definition, are expected by investors to grow earnings at an above-average rate.
The finding could be related to the initial motive of the spin-off and its anticipation of increased
managerial efficiency and utilization of the firm’s asset base. This effect is stronger in the short-
term, indicated by the high and significant loading in the 6-month portfolio. However, as the factor
loading decreases the longer the holding period, it seems that the security is priced by the market
differently in the following time horizons. This could suggest that when more information
becomes available over time, perhaps revealing that the spin-off subsidiary is unable to grow
earnings above market average, the investors’ perception of the stock changes. The HML loading
for parent and subsidiary is somewhat puzzling, as it seems irrational for an investor to believe a
spin-off subsidiary is able to grow profitability at an above-average rate in such a short time after
the spin-off. Rather, it seems more logical to assume the effect to become visible on longer time
horizons, as it takes time for the firm to adopt to the new organizational structure.
As previously mentioned, it could be suggested that the identified spin-off abnormal returns in
fact are risk premiums for risk factors that have not been fully anticipated by the investors.
Nevertheless, although the analysis is extended by incorporating additional risk proxies through
the extended Five-Factor model, adding the robust minus weak operating profitability portfolio
(RMW), the conservative minus aggressive investment portfolio (CMA), and the momentum
factor (MOM). The results still yield similar alphas and low/inconclusive loadings for the added
factors. Therefore, the added risk factors fail to capture any of the variations in returns. As we
recognize that the identified alphas are not actual market mispricing but fail to detect these, it could
be of interest for future research to test other factors in order to capture possible non-identified
risk factors associated with spin-offs.
8.1.3 Long-term Methodology Discussion
While the majority of previous research employs a matching-firm methodology, our study obtains
results using both a calendar–time approach and a matching industry portfolio approach. The first
approach uses the Fama–French Three-Factor model as benchmark, and the second employs an
industry index as a benchmark. Investigating the spin-off phenomenon using both methods

83
enables an authentic comparison with existing research and adds power to the analysis, in line with
the critiques put forward by Fama (1998).
McConnell et al. (2001) assess excess returns over matching firms using two different benchmarks
and also employ a Fama–French Three-Factor regression over the returns. Although their results
are similar, they conclude that the final outcome is partially dependent on the choice of
performance benchmark. Likewise, our results differ slightly across the two employed
methodologies for this study. However, they are not directly comparable, as one reports excess
returns and the other reports abnormal returns. Therefore, it is more interesting to examine the
overall pattern, which is very similar across the two methodologies. Both methodologies yield
negative insignificant outperformance for parents, significantly positive outperformance for
subsidiaries, and positive, generally insignificant pro-forma outperformance. In summary, the
similar findings add robustness to the overall analysis.
As previously mentioned, the calendar-time approach is extended with additional risk factors,
assessing returns against an extended five-factor model. However, these risk factors turn out not
to explain any of the variations in returns, which is why the generated results are essentially the
same.
8.2 Value-creating Factors
The results of the possible value-creating factors are discussed in the following sections. These are,
similar to other discussion parts, related to existing financial theories and previous research. The
mean and median tests investigating the wealth effect attributable to each factor upon
announcement suggest they are all explanatory. However, the difference between each factor and
its corresponding subsample that does not have the investigated characteristics does not display
the same strong significance, which weakens the conclusion of its relevance. It is only a larger
relative size that appears to be relatively explanatory upon announcement.
In our assessment of the factors’ long-term effects, we find mixed evidence of each factor’s impact.
The corporate focus factor does not seem to have any impact on the long-term performance of
spin-offs. Additionally, we identify contradictory results for the information asymmetry and
relative size factors compared to what was suggested in our literature review. We start our
discussion with the corporate focus factor and then turn to the information asymmetry factor
before ending with the relative size factor.

84
8.2.1 Corporate Focus
The majority of studies that investigate the corporate focus factor conclude focus-increasing spin-
offs to be more value-creating than non-focus-increasing spin-offs upon the spin-off
announcement. Since the means and medians for both focus-increasing and non-focus-increasing
subsamples are significant, with the first being larger than the other, our results indicate the same.
However, the mean and median differences are still insignificant, preventing us from drawing
conclusions about the implications of this variable.
Our results could possibly be explained by increased management focus. Subsequent all spin-offs,
the asset base split, which leads to an increased managerial concentration of remaining operations
regardless if the spun-off subsidiary belongs to another industry or not. Increased concentration
could be argued to facilitate control and thereby efficiency. This argument could thereupon explain
the positive and significant mean of both focus-increasing and non-focus-increasing spin-offs at
announcement. In line with this, focus-increasing spin-offs could be seen to add an extra value-
creating dimension to the overall spin-off value creation, as they display a tendency to be larger
than non-focus-increasing spin-offs.
The long-term investigations of this variable show inconsistent evidence of what is suggested by
previous research. The results suggest that increased corporate focus performs relatively better up
to 12 months subsequent the spin-off. Thereafter the non-focus increased spin-off indicate a better
performance. Although, all results are insignificant. Similarly, the factor loadings do not provide
any clear insights. It can through the SMB factor be noted that both the increased corporate focus
sample and the corresponding non-increased sample generally share characteristics of small stocks.
However, no clear differences in SMB loadings can be observed between the two subsamples.
With the regards to the HML factor, previous research show that operating performance increases
more for focus-increasing spin-offs than for non-focus-increasing. Thus, it could be expected that
the focus increasing spin-off would load more negative on the HML factor for our long-term
investigation, compared to the non-focus-increasing subsample. The argument lies in growth
stocks ability to grow earnings at an above average rate. However, this does not seem to be the
case in our results. Similar to the SMB factor, we find no clear differences in factor loadings
between the two samples. Hence, we cannot conclude much on the corporate focus factor using
the risk-proxies in the Three-Factor model.
Considering increased corporate focus is a commonly stated spin-off motive, our weak evidence
of its value creation is puzzling. It could thereupon be of interest to see if application of another
proxy for the factor would yield different results. This investigation applies subsamples that have

85
been defined on a two-digit SIC code level. However, potentially, a change in SIC code on a four-
digit level could be argued to imply a focus-increasing action. In line with this argument and
assuming focus-increasing spin-offs are more value-creating, the non-focus-increasing subsample
could be positively biased. We further recognize a potential bias in the measurement of the
corporate focus dummy. In this thesis, we rely on the SIC code from Compustat. If we were to
rely on other industry classifications, such as the industry categories put forward by Kenneth
French, our findings might be different.
Our results contradict those of Desai and Jain (1999) and are more in line with previous European
findings. Compared to our results Veld and Veld-Merkoulova (2004) find a more positive, but still
insignificant, long-term tendency for focus-increasing spin-offs. Veld and Veld-Merkoulova (2004)
employ a notably smaller sample size and also investigate earlier time periods, which could suggest
the corporate focus variable has historically varying explanatory power or simply that there is bias
in the sample returns.
8.2.2 Information Asymmetry
As mentioned in the literature review section, one motive for firms to pursue spin-offs is to
decrease information asymmetry, as they believe their firm is undervalued. It can therefore be
argued that once any possible information asymmetry is evened out, the factor stops being
explanatory for this particular reason. Put differently, it could be a somewhat one-time correction.
In line with this argument, we should not be able to find any long-term implications for this factor.
Similar to other factors, the subsample characterized by high information asymmetry show a larger
mean as opposed to low information asymmetry upon announcement. This suggests the factor to
have some explanatory power. The difference between the two subsamples suggest that high level
of information asymmetry firms are more undervalued than low level of information asymmetry
firms. Nonetheless, the relevance is limited by insignificant mean and median differences,
weakening the conclusion about the factor.
In contrast to the argument of the factor being a one-time correction, it could be argued that firms
engaging in spin-off activity aim to decrease information asymmetry to obtain more transparency
in the long-term. This could for instance be related to the fact that many firms engaging in spin-
off activity later on approach the market to raise capital, why firms pursing spin-offs could be
motivated to maintain transparency in order to avoid any undervaluation. Therefore, the results of
the long-term examination are of interest. Following the calendar–time portfolio method, we are
able to find contradictory evidence of the information asymmetry factor compared to what has
been suggested in previous research. With mixed and relatively poor significance, we find that

86
stocks with low information asymmetry outperform those with high information asymmetry in the
long-term. Although insignificant, the high information asymmetry subsample displays negative
abnormal returns for the majority of the holding periods, while the low information asymmetry
tends to generate positive abnormal returns. The effect is the strongest on our 24-month portfolio,
where we are able to identify significance at the 5% level.
When evaluating the results, it could be argued that the higher abnormal return of high information
asymmetry firms upon announcement followed by a long-term tendency of underperformance
indicate an initial market overreaction, which is adjusted over time. Another explanation could lie
in a disagreement between management and the market about the true firm value. Put differently,
the firm is not as undervalued as the management claims, which becomes visible and corrected for
on long-term.
The SMB factor loading is particularly interesting for the high level information asymmetry
subsample. This is in line with the theory and its explanation behind the SMB factor. Small firms,
as indicated by a high loading on the SMB factor, tend to have, amongst other characteristics,
higher information asymmetry. In line with the significant loading for the subsample with a high
level of information across all our holding periods, it could be questioned whether these spin-offs
have successfully mitigated the information asymmetry issue. As such, it can be argued that spin-
offs in the high level of information asymmetry subsample has failed to decrease the information
asymmetry seen prior to the spin-off.
Nevertheless, it could be argued that the contradictory finding of low level information asymmetry
performing better to be somewhat puzzling. However, as mentioned in the literature review, firms
that pursue spin-offs tend to have a higher degree of information asymmetry than market average.
As such, even though we are measuring a relatively low level of information asymmetry in our
sample, the included firms tend to be worse off than the market average and are therefore more
likely to be undervalued. As seen in the Fama–French Three-Factor regression, the SMB loading
for this subsample is decreasing in time. The non-significant loading for the longer horizons
indicate that these stocks change characteristics and are no longer priced similarly to small firms,
that is, firms that tend to have poor information availability. It could therefore be argued that the
stocks with low-level information asymmetry have achieved one potential purpose of the spin-off,
which is to decrease the information asymmetry.
Before turning to the next factor, we would like to acknowledge the fact that there might be some
bias in the estimation of the dummy variable and its measurement. Some firms have a higher
degree of coverage than others, measured by more equity analysts following the firm. It would be

87
optimal if all firms in a sample had the same amount of coverage, as the standard deviation would
be a clear proof of consensus discrepancy.
8.2.3 Relative Spin-off Size
We now turn to the size factor. In previous research, it has been suggested that relative large spin-
offs generate higher value for shareholders compared to small ones. The asset base split is argued
to facilitate an improved managerial efficiency and/or to eliminate value-destroying activities. The
announcement investigation for this factor confirms that a large spin-off is more value creating
than a relatively small one, regardless if the motive is to improve managerial efficiency or to
eliminate value-destroying activities.
The long-term effect for this factor is more speculative, and in addition one must note that our
results are insignificant. Assuming the spin-off motive is to improve managerial efficiency, our
results imply that the increase in managerial efficiency is not proportional to the relative spin-off
size on long-term, as a smaller relative spin-off size generate higher alphas than a larger one.
However, it could also be argued that a larger relative spin-off size requires longer time before any
desired efficiency improvements are visible. This could explain the fact that the relative large spin-
off subsample experiences a negative pro-forma return for the investigated holding periods.
Relating our results to a potential elimination of value destroying activities is more straightforward.
Our combined findings of a significant abnormal return upon announcement and a non-significant
abnormal return on long-term suggests that the relative size factor is a one-time correction. That
is, by spinning off a larger portion of assets, the firm is able to eliminate more value destroying
activities, creating more value to shareholders.
Turning to the Fama–French regressions of our factor subsamples, we note that there could be a
joint hypothesis problem. In line with the findings of Fama and French (1992, 1993, 1998), small
stocks perform better than stocks of large firms. Therefore, our results might be contaminated by
the fact that relatively small firms (with high book-to-market ratios) outperform larger
counterparties. If this joint hypothesis problem would be true, we would expect a higher loading
on the SMB factor for the subsample containing relative large spin-offs. This argument is based
on that the pro-forma portfolio would contain two relatively smaller firms if the relative size of
the spun-off subsidiary is sufficiently large. This is also seen in our results, as the subsample of
relatively small size subsidiaries consistently has a lower SMB loading compared to the subsample
of relatively large subsidiaries.
We find a consistent negative and mostly significant loading on the HML factor for our relative
small sized spin-off subsample. On the contrary, the HML loading of the relative large size

88
subsample is positive and significant for all observations except the 6-month portfolio. This
suggests that relatively small spin-off securities are priced by the market as growth stocks, with
characteristics such as above-average earnings growth. On the contrary, relatively large spin-offs
are perceived as value stocks. However, the results for large spin-offs is generally less significant
than that of small spin-offs.
8.3 Bond Returns
The Modigliani and Miller theory is challenged by our results. As shown in the wealth transfer
section, we are able to identify that the aggregate firm value increases by 1.7% upon spin-off
announcement. Further, we are able to put forward evidence that shareholders’ gain is larger the
more severe the bondholders’ loss. The fact that shareholders gain at the expense of bondholders
supports the theory. However, as the bondholders’ loss could only partially explain the gain of
shareholders, the value of the firm’s asset base increases upon announcement of the spin-off. Still,
we recognize that each case is unique and that samples show different reactions, some positive and
some negative. In addition, we recognize that the Miller–Modigliani theory assumes frictionless
capital markets and the absence of transaction costs, which is why it cannot be rejected but only
opposed.
Commonly, bondholders are protected by covenants which should disable any wealth transfer
effect. This implies that by including covenants, bondholders should be able to prevent any
reduction in the future cash flow stream, and as such sustain any reduction in wealth. As such, it
seems irrational to observe any negative abnormal return for bondholders. Nevertheless, the
negative bondholder abnormal return at announcement suggests that investors’ perception of the
underlying risk of the security has increased. Consequently, investors could perceive the firm to
have a higher probability of defaulting post announcement of the spin-off. Relating the significant
identified loss to bondholders to the argument of total cash flows being the same, as secured by
covenants, an alteration in debt value could indicate that total cash flows are expected to become
more volatile subsequent to the redeployment of assets. The change in firm value due to cash flow
volatility could be related to shareholders’ perception of equity as a call option on a firm’s asset
base. Similar to a call option, equity value increases the greater the volatility of underlying cash
flows. However, bondholders—who’s claims on the firm assets are similar to a short put option—
experience a decrease in total debt value with the greater volatility of cash flows. As such, we argue
that the negative bondholder abnormal return at announcement is explained by an expected
increased volatility in cash flows produced using the same asset base.

89
Overall, it could be argued that a wealth transfer is somewhat irrational. If spin-off consistently
expropriated bondholder value, the attractiveness of trading bonds in general would be limited. In
line with this argument, our findings could suggestively refer to the process of renegotiating debt
rather than any valuation differences. No matter how secure the debt and well specified the
covenants, any renegotiation of debt it not positive to bondholders. The best-case scenario of the
negotiations is that debtholders collateral and coinsurance effect remain the same post spin-off.
However, this is only one of many scenarios.
We then comment on the abnormal return for shareholders of firms with outstanding bonds which
proved lower than for that of the total sample. As can be seen in Table 7.9, shareholders of firms
with traded debt gained on average 2.2% at announcement, which is lower than the 3.3% reported
for the total sample. One explanation for this finding could lie in the relatively smaller size of spun-
off subsidiaries to firms with traded debt compared to that of the total sample. As seen in the data
collection section, the average relative size of spin-offs with traded debt is 13.9% compared to the
18.1% for the total sample. This could explain the lower return using arguments put forward for
explanatory factors of shareholder wealth. As can be seen in the subsample analysis of relative size
at announcement, relatively smaller spin-offs had a lower average announcement return, 2.0%,
compared to 4.5% of large spin-offs. Furthermore, the difference between the subsamples of
relative size is the only factor proving significantly different from each other. As such, with a
relatively smaller spun-off subsidiary size than the total sample, it seems reasonable to assume a
lower shareholder return for our bond related observations.
As a concluding remark, we recognize that only completed spin-offs have been included in our
investigation. If we were to test for any potential wealth transfer for non-completed or even
cancelled spin-offs, our findings might be different. Also, with a sample of 63 firms, there is risk
of the results being not completely representative. Therefore, one should remain open to the fact
that there could be other reasons apart from the spin-off event itself affecting the valuation of the
bonds
8.4 Reflections
As evidenced from our long-term investigation, we fail to fully capture why spin-offs are value
creating. It is indeed difficult to isolate the effect of spin-off activity over a 36-month period, it
can even be argued to be impossible to detect the exact source of the value gains. Previous research
have investigated additional potential sources of value gains, such as operating performance,

90
takeover activity and regional differences. However, as the findings are mixed or weak, no one
succeeds to entirely prove the spin-off dynamics.
Taking a holistic approach to spin-off activities, it can be argued to signal an active management
and thereupon an active commitment to shareholder value maximization. As such, the market
perception and implied signalling of spin-offs could have a meaningful effect on the results.
Sudarsanam and Qian (2007) confirm the contemporary market psychology to be important,
indirectly strengthening the relevance of signals and market behaviour. Additionally, one has to
remember that each spin-off is unique and not all spin-offs are successful. Whether a spin-off will
be successful in generating shareholder value varies for each individual firm. As such, investors
should attentively evaluate the characteristics of the spun-off subsidiaries and question the
underlying managerial motivations for the transaction. Similarly, conglomerate managers should
be proactive and evaluate whether the optimal value of a business is obtained as an independent
firm or in synergy with other subsidiaries.
8.5 Suggested Further Research
As could be seen in the data collection section, spin-off popularity varies across countries. While
the sample contains two recorded Spanish spin-offs, United Kingdom reports 68 cases. Similarly,
the spin-off characteristics differ across countries. For instance, relative spin-off size varies,
ranging between 16.4% and 26.5% for the three countries with the most recorded spin-off events.
Likewise it is notable that the two countries with the largest number of spin-off observations, UK
and Sweden, also appears to have high relative levels of information asymmetry. At a later point
in time, the number of observations for each country will assumingly be larger. Thus, it could be
advised to investigate the different European countries separately. The impact of different
legislation, tax implications, market efficiencies, motives and signals could possibly generate
disparate wealth effects. We argue that with a more detailed and empirically solid foundation for
each country, investors and managers can more successfully evaluate their options for corporate
divestitures.
Furthermore, the long-term investigations could be extended by including application of additional
benchmarks and analysis of additional risk factors. In line with Loughran and Ritter's (2000)
critique regarding market efficiency evaluation for long-term return investigations, it could be of
interest to apply a value-weighted portfolio and test for any difference against the equal-weighted
portfolio. Although the equal-weighted portfolio represents the abnormal returns associated with
a random event, the value-weighted portfolio is argued to better reflect the total wealth effect. As

91
such, complementary tests would further illuminate the wealth effects associated with corporate
spin-offs.
Future research could also include a more extensive examination of the wealth transfer of
European spin-offs. In this study, we simplify the calculation of expected return by relying on a
bond index carrying similar credit risk over the same time period. We deem this simplification
appropriate, as a more accurate calculation of expected return is a very cumbersome process. As
the first study of European markets, the aim of this thesis has been to explore and test the
hypothesis of wealth transfer now that bond data has become more available and bond markets in
Europe have matured. We therefore suggest that future research examine and test the hypothesis
of wealth transfer with a more accurately calculated expected return to corroborate the validity of
our findings. For example, the accuracy of expected returns would be improved if it had accounted
for the time to maturity of each bond, as the return volatility increases as the time to maturity
lengthens. Additionally, we recognize that the expected return can be more accurately calculated if
the credit risk of each security is better reflected in the matched portfolio. Similarly, return volatility
increases as credit ratings fall.
Finally, future research could also investigate the sources of wealth transfer similar to what was
tested by Maxwell and Rao (2003), who found bondholders’ loss to be associated with factors such
as collateral and coinsurance effects. This has not been accounted for in our study and has not yet
been explored in relation to European markets.

92
9 Conclusion
In this thesis, we investigate the wealth effects associated with corporate spin-offs. Previous
research argues that corporate spin-offs are value-creating restructuring methods. However, peer-
reviewed European studies have put forward weak evidence regarding overall value creation, and
the specific factors explaining the value creation remain unclear.
This thesis contributes the existing research in two ways. First, we improve understanding by using
a larger sample size and a more up-to-date time period. We investigate similar holding periods and
value explaining factors compared to previous research, but apply complementing methodologies
to yield additional robustness. The most common factors that have been suggested to explain
shareholder value gains from spin-offs are an increase in corporate focus, a high level of
information asymmetry and a relative large spin-off size. Next, we are the first study in Europe to
investigate bond price reaction and if any spin-off shareholder wealth effects are attributable
to bondholders’ loss.
We confirm previous findings and conclude that spin-offs create a significant cumulative abnormal
return of 3.3% for the shareholders over the three-day days around the spin-off announcement.
While the increased corporate focus and information asymmetry variables show weak significance,
the relative spin-off size is significantly related to the shareholder value creation. Moreover, we
find evidence of a wealth transfer from bondholders; however only partially explaining the gains.
For firms with publicly traded debt, we provide significant results of an increasing firm value at
the time of the spin-off announcement. The wealth creation proves to be positive for shareholders,
however negative for bondholders, being -0.4%. Furthermore, we find that shareholder gains tend
to be larger the more severe the bondholders’ loss.
Regarding the long-term spin-off effects up to 36 months after the divestiture, we find no
significant outperformance for parent firms. This is in line with previous European studies.
However, it is noteworthy that the parent firms display a negative alpha. Although statistically
insignificant, this could imply a slightly negative economic effect. On the contrary, the spun-off
subsidiary proved to significantly outperform both employed benchmarks for all investigated
holding periods, reaching a peak of 17.6% and 15.8% for a 12-month portfolio and a 24-month,
portfolio respectively.

93
Further investigating the suggested wealth explanatory factors in the long-term, we observe
contradictory evidence to what has been suggested in previous research. A relatively larger spin-
off size and a high level of information asymmetry prior to the spin-off tend to be characteristics
that weaken the outperformance of the spin-off in the long-term, although these findings are
statistically insignificant. More surprisingly, firms with a low level of information asymmetry prior
to the spin-off yield significant positive abnormal returns.
For the passive shareholder, the long-term overall implication of spin-off activity is rather neutral.
The slightly negative parent performance is counterbalanced by the gains of the subsidiary. This
leads to a pro-forma effect with a small positive tendency, implying that the passive investor is at
least not economically hurt by the event. Thus, we conclude that European corporate spin-offs
are value creating for shareholders. The value creation steams from the significant positive
abnormal return at spin-off announcement and the positive, yet insignificant, long-term
performance of the pro-forma portfolio of the initial shareholder.

94
10. Bibliography Allen, J.W., Lummer, S., McConnell, J.J. and Reed, D., (1995). Can Takeover Losses Explain Spin-Off Gains? Journal of Financial and Quantitative Analysis, 30, pp. 465-485.
Ball, J., Rutherford, R. and Shaw, R. (1993). The Wealth Effects of Real Estate Spin-offs. Journal of Real Estate Research, 9, pp. 597-606.
Barber, B.M. and Lyon, J.D. (1997). Detecting Abnormal Operating Performance: The Empirical Power and Specification of Test Statistics. Journal of Financial Economics, 41, pp. 359-399.
Berger, P.G. and Ofek, E. (1995). Diversification’s effect on firm value. Journal of Financial Economics, 37, pp. 39-65.
Berk J. and DeMarzo P. (2014). Corporate Finance, 3rd ed., Pearson Education.
Bessembinder, H., Kahle, K.M., Maxwell, W.F. and Xu, D. (2009). Measuring abnormal bond performance. Review of Financial Studies, 22, pp. 4219-4258.
Bryman, A. and Bell, E. (2005). Företagsekonomiska Forskningsmetoder. Malmö: Liber ekonomi.
Chemmanur, T. J. and Yan, A. (2004). A theory of corporate spin-offs. Journal Of Financial Economics, 72, pp. 259-290.
Chemmanur, T. J., Krishnan, K. and Nandy, D.K. (2014). The Effects of Corporate Spin-offs on Productivity. Journal of Corporate Finance, 27, pp. 72-98.
Copeland, T.E., Lemgruber, E.F. and Mayers, D. (1987). Corporate spinoffs: Multiple announcement and ex-date abnormal performance. In: Copeland, T.E. (Ed.), Modern Finance and Industrial Economics: Papers in honor of J. Fred Weston. Basil Blackwell Inc., Oxford, 114–137.
Crain, M. (2011). A Literature Review of the Size Effect, Working Paper, Florida Atlantic University; University of Manchester – Manchester Business School.
Cusatis, P.J., Miles, J.A. and Woolridge, J.R. (1993). Restructuring through spinoffs: The Stock Market Evidence. Journal of Financial Economics, 33, pp. 293–311.
Daley, L., Mehrotra, V. and Sivakumar, R. (1997). Corporate focus and value creation: Evidence from spinoffs. Journal of Financial Economics, 45, pp. 257–281.
Denning, K.C. (1988). Spin-offs and Sales of Assets: An Examination of Security Returns and Divestment Motivations. Accounting and Business Research, 73, pp. 32-42.
Desai, H. and Jain, P.C. (1999). Firm performance and focus: Long-run stock market performance following spinoffs. Journal of Financial Economics, 54, pp. 75–101.
Ederington, L., Guan, W. and Yang, L. (2015). Bond market event study methods. Journal of Banking & Finance, 58, pp. 281-293.
Fama, E.F. (1965). The Behavior of Stock-Market Prices. The Journal Of Business, 38(1), pp. 34-105.
Fama, L., Fisher, L., Jensen, M.C. and, Roll R.W. (1969). The Adjustment of Stock Prices to New Information. International Economic Review, 10, pp. 1-21.
Fama, Eugene, L. Fisher, M.C. Jensen, and R.W. Roll. "The adjustment of stock prices to new information." International Economic Review, 10, 1969.
Fama, E.F. (1970). Efficient Capital Markets: A Review of Theory and Empirical Work. Journal of Finance, 25, pp. 383-417.
Fama, E. and French, K. (1992). The Cross-Section of Expected Stock Returns. The Journal Of Finance, 47(2), pp. 427-465.

95
Fama, E.F. 1998. Market Efficiency, Long-term Returns, and Behavioral Finance. Journal of Financial Economics, 49, pp. 283-306.
Gertner, R., Powers, E. A. and Scharfstein, D. (2000). Learning about Internal Capital Markets from Corporate Spin-offs, Quarterly Journal of Economics, 109, pp. 1211-1230.
Habib, M.A., Johnsen, B.D. and Naik, N.Y. (1997). Spin-offs and information. Journal of Financial Intermediation, 6(2), pp. 153–176.
Hite, G.L. and Owers, J.E. (1983). Security price reactions around corporate spin-off announcements. Journal of Financial Economics, 12, 409–436.
Johnson, S.A., Klein, D.P. and Thidodeaux, V.L. (1996). The Effects of Spin-Offs On Corporate Investment and Performance, The Journal of Financial Research, 19, pp. 293-307
Kenneth R. French Data Library, accessed 6 April 2018. http://mba.tuck.dartmouth.edu/pages/faculty/ken.french/data_library.html#International
Kenneth R. French Data Library, accessed 12 April 2018. http://mba.tuck.dartmouth.edu/pages/faculty/ken.french/Data_Library/det_49_ind_port.html
Kirchmaier, T.H. (2003). The performance effects of European demergers, Working Paper, London School of Economics.
Krishnaswami, S. and Subramaniam, V. (1999). Information Asymmetry, Valuation, and the Corporate Spin-Off Decision. Journal of Financial Economics, 53, pp. 73–112.
Kothari, S.P. and Warner, J.B. (2006). Econometrics of Event Studies, in Eckbo B.E. (editor). Handbook of Corporate Finance: Empirical Corporate Finance, Elsevier, Oxford, UK.
La Porta, R., Lopez-de-Silanes, F., Shleifer, A. and Vishny, R. (1998). Law and Finance. Journal of Political Economy, 106, pp. 1113–1155.
Loughran, T. and Ritter, J.R. (2000). Uniformly Least Powerful Tests of Market Efficiency. Journal of Financial Economics, 55, pp. 361-389.
MacKinlay, A.C. (1997). Event Studies in Economics and Finance. Journal of Economic Literature, 35, pp. 13-39.
Mann, H.B. and Whitney, D.R. (1947). On a Test of Whether one of Two Random Variables is Stochastically Larger than the Other. Annals of Mathematical Statistics, 18, pp. 50-60.
Markowitz, H. (1952). Portfolio Selection. Journal of Finance, 7 pp. 77–91.
Maxwell W.F. and Rao R.P. (2003). Do Spin-offs Expropriate Wealth from Bondholders? 58, pp. 2087-2108.
McConnell, J.J., Ozbilgin, M. and Wahal, S. (2001). Spin-offs, ex ante. Journal of Business, 74, pp. 245–280.
McConnell, J.J. and Ovtchinnikov, A. (2004). Predictability of Long-term Spin-Off Returns. Journal of Investment Management, 2, pp. 35–44.
McIvor, R. (2007). Outsourcing and the Spin-off Arrangement: Lessons from a Utility Company. Journal of General Management, 33(1), pp. 51-70.
Michaely, R. and Shaw, W.H. (1995). The Choice of Going Public: Spin-offs vs. Carve-outs. Journal of Financial Management, 24, pp. 5-21.
Miles, J.A. and Rosenfeld, J.D., (1983). The Effect of Voluntary Spin-Off Announcements On Shareholder Wealth. The Journal of Finance, 38, pp. 1597–1606.
Mitchell, M.L. and Stafford, E. (2000). Managerial Decisions and Long-Term Stock Price Performance. The Journal of Business, 73, pp. 287-329.

96
Modigliani, F. and Miller, M.H. (1958). The Cost of Capital, Corporation Finance, and the Theory of Investment. American Economic Review, 48, pp. 261-297.
Mulherin, J.H. and Boone, A.L. (2000). Comparing Acquisitions and Divestitures. Journal of Corporate Finance, 6, pp. 117–139.
Parrino, R. (1997). Spin-offs and Wealth Transfers: The Marriott Case. Journal of Financial Economics, 43, pp. 241-274.
Pedersen, L.H. (2015). Efficiently Inefficient, 1st ed., Princeton University Press.
Powers, E.A., 2001: Spin-offs, Sell-offs and Equity Carve-outs: An Analysis of Divestiture Method, Working Paper, University of South Carolina.
Prezas, A.P. and Simonyan K. (2015). Corporate Divestitures: Spin-offs vs. Sell-Offs, Journal of Corporate Finance, 34, pp. 83-107.
Rosenfeld, J.D. (1984). Additional Evidence on the Relation Between Divestiture Announcements and Shareholder Wealth. The Journal of Finance, 39, pp. 1437–1448.
Rüdisüli, R. (2005). Value Creation of Spin-offs and Carve-outs. Doctoral Thesis, University of Basel.
Schauten, M.B.J., Steenbeek, O.W. and Wycisk, E.M. (2001). Waardecreatie Door Spinoffs (transl. Value creation by means of spin-offs), Tijdschrift Financieel Management, 21, pp. 69-77.
Schipper, K. and Smith, A. (1983). Effects of Recontracting on Shareholder Wealth: The Case of Voluntary Spinoffs. Journal of Financial Economics, 12, pp. 437–467.
Seifert, B. and Rubin, B. (1989). Spin-offs and the listing phenomena. Journal of Economics and Business, 41, pp. 1-19.
Seward, J.K. and Walsh, J.P. (1996). The Governance and Control of Voluntary Corporate Spin-offs. Strategic Management Journal, 17, pp. 25-39.
Slovin, M., Sushka, M. and Ferraro, S. (1995). A Comparison of the Information Conveyed by Equity Carve-outs, Spinoffs, and Asset Sell-offs. Journal of Financial Economics, 37, pp. 89-104.
Sudarsanam, P.S. and Qian, B. (2007). Catering Theory of Corporate Spin-Offs: Empirical Evidence for Europe, Working Paper, Cranfield University.
Taheri, S. and Hesamian, G. (2013). A Generalization of the Wilcoxon Signed-Rank Test and its Applications, Statistical Papers, 54, pp. 457-470.
Veld, C. and Veld-Merkoulova, Y. V. (2004). Do Spin-offs Really Create Value? The European Case, Journal of Banking & Finance, 28, pp. 1111-1135.
Veld, C. and Veld-Merkoulova, Y. V. (2009). Value Creation Through Spin-offs: A Review of the Empirical Evidence. International Journal of Management Reviews, 11, pp. 407-420.
Vijh, A.M. (1994). The Spin-Off and Merger ex-date Effects, Journal of Finance, 49, pp. 581-609.
Leinwand, P. and Mainardi, C. (2012). The Coherent Conglomerate. Harvard Business Review. https://hbr.org/2012/06/the-coherent-conglomerate