shareholder value creation in m&as736278/fulltext01.pdf · insights about mergers and...
TRANSCRIPT

Bachelor’s Degree Thesis 15 HE credits
Spring semester 2014
Supervisor: Ignacio Concha-Ferreira
Shareholder Value Creation
in M&As A Comparison of Different Industries in the OECD
Member Countries
Axel Scheutz Godin

2
Abstract
The purpose of this study is to examine the value generated to shareholders due to the
announcement of mergers and acquisitions (M&A) in different industries. Only deals
between firms in the OECD member countries over the period 2004-2014 are analysed.
The value is measured by calculating the cumulative abnormal return for event periods
close to the announcement date. Cumulative abnormal returns is often used for
measuring the impact of events on a stock price and reflect what investors believe will be
the value from resulting synergies to shareholders. Only transactions between target and
acquiring companies that are operating in the industrials, financial services, information
technology and consumer staples industry are examined. Previous research is used to
determine industry conditions affecting value creation and the expected value creation
for each of the four industries is determined. This study find that returns for acquirers are
distributed around zero percent. The mean cumulative abnormal returns for acquirers are
negative for three of the four industries examined. The only positive abnormal return for
acquirers is found in the financial services industry. Target firm shareholders receive
positive returns in all industries. Target firm shareholders in the consumer staples and
industrials industries receive on average statistically significant results above zero
percent for a significance level of 5%. These industries have also the highest target
returns.
Keywords: mergers and acquisitions, OECD, value creation, event study, industry
conditions

3
Glossary
M&A mergers and acquisitions. In this thesis often sometimes
just denoted as mergers.
Zephyr a database for M&A deals. Provides the deal value,
announcement date and more detailed information of the deals.
Alpha, denotes firm-specific risk. Measure the performance on a risk-
adjusted basis.
Beta, Beta is the measure of the volatility i.e. the stock
responsiveness as a result of movements in the overall market.
AR Abnormal return. The difference between the actual return and
the expected return of a security.
CAR Cumulative abnormal return. The sum of abnormal returns.
CAR is often calculated over small event windows to indicate
the change in share price over a period as a consequence of an
event.
CAAR Cumulative average abnormal return. CAAR is often used
in event studies since it provides an estimate of the
total effect of the abnormal returns.
Value Shareholder value.

4
Table of contents
1. Introduction 5
1.1 Problem discussion 5
1.2 Objective and research questions 6
1.3 Disposition 6
2. Literature review 6
2.1 Measurement of mergers and acquisitions profitability 6
2.2 Mergers and acquisitions 7
2.3 Cumulative abnormal returns to target firms 9
2.4 Cumulative abnormal returns to buyer firms 9
2.5 Time frame of event studies 10
2.6 The impact of industry conditions on value creation from mergers 10
3 Methodology 12
3.1 Research design 12
3.2 Data collection 12
3.3 Measurement of abnormal results 13
3.4 Time frame 14
3.5 Regression analysis 15
3.6 Index 15
3.7 Reason for geographical selection 15
3.8 Statistical testing 16
3.9 Adjusting for outliers 16
4 Analysis 16
4.1 Characteristics and description of the different industries 16
4.2 Expected value creation and division of gains in the industries 17
5 Results 22
5.1 Description of the sample 22
5.2 The distribution of acquirer and target returns 24
5.3 Statistical analysis of the results 28
6 Discussion and suggestions for further research 31
7 Conclusions 32
8 References 33

5
1. Introduction
Mergers and acquisitions is an important aspect of corporate strategy that enables
enterprises to quickly grow within their industries or into new fields. The buying or
selling of a company is a strategic decision that changes the organization of the
combining companies as well as the structure of the industries. There are many reasons
why executives want to merge or acquire with another company. Mergers and
acquisitions enable companies to achieve flexibility, share resources, enjoy efficiencies
and leverage core competencies (Seth, 1990). They also create opportunities which
otherwise would be difficult to attain due to high risks, high costs or technological
limitations. Mergers can also be used as strategic moves in order to protect market shares
in a consolidating or declining market (Marks and Mirvis, 2001).
As a result of deregulation of a large number of economic sectors and recent
privatizations of cooperation’s previously controlled by national governments, the
number of mergers and acquisitions has increased rapidly. In this period of time,
characterised by increasing globalisation and rapid technological development, the
number of mergers and acquisitions are likely to continue (Huyghebaert and Luypaert,
2013).
1.1 Problem discussion
Despite their frequency, less than one quarter of mergers and acquisitions achieve their
financial objectives, measured as post combination profitability or return on investment
(Marks and Mirvin, 2001). Similar results are found by in other studies, indicating that
60-80% of all mergers fail to create value (Dyer, Kale and Singh, 2004). During the
recent decades there have been numerous studies that have analysed transactions, both
from the acquirer and target side, and provided a range of theoretical and empirical
explanations regarding the financial impact and motives behind different acquisitions. A
majority have focused on reasons why some transactions fail and some succeed to create
value. Several researchers have tried to explain the potential outcome of mergers based
on the strategic fit or relatedness between the merging firms. The results are inconsistent
(Bruner, 2002). Marks and Mirvin (2001) states that there are many factors accounting
for the number of unsuccessful mergers and acquisitions such as making the deal at the
wrong time, paying a too high price or buying a company that is not fitting the acquiring
companies corporate strategy. Another factor that seems to be crucial is the industry
conditions of the acquiring and target company (Huyghebaert and Luypaert, 2013).
Porter (1980) suggests that it is essential for a company to relate to its environment in
order to formulate a successful, competitive strategy. A firm’s relevant environment
encompasses political, social and economical forces but the key aspect of the firm’s
environment is the industry in which it competes. Industry structure has a strong
influence in determining the strategies available for a company (Porter, 1980). This
raises the importance to study the success rate of mergers and acquisitions within
different industries. Most papers that evaluate the environments influence on shareholder
value creation generally overlook factors such as differences in the regulatory, social,
political and economic environment. Nevertheless, there are studies that are overlooking
differences in industry segments (Huyghebaert and Luypaert, 2013; Gross and Lindstädt,
2005). There has been a lack of attention paid to a comparative analysis of the financial
consequences for the value creation done in mergers across various industries. Instead of
analysing value creation for a sample of M&A’s from all industries, this study will focus
and compare value creation within four different sectors separately. The four industries

6
that will be examined are the industrials, financial services, information technology and
consumer staples sectors.
1.2 Objective and research questions
The object of this thesis is to investigate and compare value created from historical
mergers and acquisitions involving enterprises in the OECD within the industrials,
financial services, information technology and consumer staples industries.
In order to do this, two research questions is posed.
1. Does gains accrue to shareholders of the acquiring and target firms in the
different industries as a consequence of a merger or acquisition transaction?
2. How does the distribution of value creation differ between the four industries
industrials, financial services, information technology and consumer staples?
1.3 Disposition
The aim of chapter one is to give the reader a short background of what mergers and
acquisitions are and why it is important to examine value creation as of M&A in
different industries. Furthermore the two research questions that is answered throughout
the study is presented. Chapter two present the different concepts, methodologies and
theories that exist within the field of M&A up to date. Additionally, the literature used in
this study is reviewed and presented. Chapter three explains the method of the study and
account for how the different data is collected. The different findings about the expected
value creation within the different industries are showed in chapter four. Chapter five
aim to discuss the different results and their statistical value. Suggestions for further
research will be presented in chapter six. Finally the key findings and conclusions are
summarised in chapter seven.
2. Literature review
Value creation through mergers and acquisitions for the shareholders of the acquiring
and target firm is one of the most extensively researched areas in finance and
management. In this chapter some of the concepts, methodologies and theories from
previous studies within the field of research will be presented.
2.1 Measurement of mergers and acquisitions profitability
2.1.1 Definition of value
Studies within the field that examine mergers and acquisition tend to focus on value
creation measured as shareholder value (Bruner, 2002). This implies that a company’s
success in forming mergers and acquisitions is determined by the extent these deals
enrich the acquirers and targets shareholders. This is usually measured in changes in
stock price and dividend payments. Campa and Hernando (2004) argue that shareholder
value is only a partial measure of the net value generated by mergers and acquisitions.
However, this is criticism is often disregarded because of the simplicity of focusing on
shareholder returns.
7
2.1.2 Ways to measure profitability
The numerous amount of studies conducted in this field usually measure the value
creating effect from a merger using one of four different approaches stated below.
Event studies
Event studies examine abnormal returns over a period of time before and after the
announcement date of a transaction. The parameter measured in this type of study is the
cumulative abnormal return. This parameter is a commonly used tool to evaluate the
impact of news on a stock. The cumulative abnormal return is defined as the sum of the
daily differences between the actual return less the expected return of a company stock
over a period of time. Abnormal returns will reflect investor’s opinion of value creation
from the deal as well as the changes in expected future cash flows from the business to
the shareholders (Bruner, 2002). At the time of the transaction this method therefore
represent the best estimate of the discounted value generated from the transaction to the
shareholders (Campa and Hernando, 2004). Because of this event studies has during the
last decades been the most common way to estimate the generation of shareholder value
from M&A.
Accounting studies
Accounting studies examine, often over periods covering several years, how the financial
results change from before the acquisitions to after (Bruner, 2002). These studies often
compare accounting metrics such as return on equity, earnings per share or the net
income. Often benchmark models are used to verify how the examined transaction
generates value compared to its nonacquirer peers.
Surveys of executives
These methods present a sample of executives with a questionnaire with the aim that the
results with yield knowledge that can be generalized for a bigger sample.
Clinical studies
These studies focus on one or a few transaction that is analysed very detailed. By getting
a comprehensive overview of the transaction the researchers anticipate to gain new
insights about mergers and acquisitions (Bruner, 2002).
2.2 Mergers and acquisitions
2.2.1 Distinction between mergers and acquisitions
An acquisition is the purchase of one business or company by another business entity
(Seth, 1990). The acquisition could be of particular assets, divisions or an entire firm. A
merger is defined as the legal union of two or more firms into a single entity (Seth,
1990). The merger can be described as a fusion process where the assets and liabilities of
the selling firm are absorbed by the buying firm. The acquisition or merger process is
very complex, with a range of dimensions influencing the outcome for the acquiring and
target firm.
2.2.2 Different types of mergers and acquisitions
Mergers and acquisitions can be classified into three different categories depending of
their characteristics: horizontal, vertical and conglomerate. Horizontal merger occur
when the acquiring and the target company are competing firms in the same business
8
area. The global restructuring of several industries as a response to technological
innovation and liberalization of markets has resulted in that horizontal mergers and
acquisitions have grown rapidly over the recent years. The trend is observed especially
in several industries, such as the automobile, petroleum and pharmaceuticals (PwC,
2014).
Vertical mergers classify takeovers between companies producing different goods or
services for one specific finished product. These types of mergers are completed in order
to increase efficiency along the supply chain, resulting in higher profits for the acquiring
company. Several authors have tried to make findings connecting industry characteristics
to the use of vertical mergers within an industry. Firms in industries characterized by a
high degree of innovation and strong property right are more likely to take part of
mergers in order to vertical integrate (Frésard, Hoberg and Philips, 2013). The same
authors also find a positive link between the use of vertical mergers and industry
maturity. Firms tend to avoid vertical mergers during the earlier phases of an industry’s
life cycle, however the use increases when industries become more stable. This is
explained by the characteristics of the supply chain. Mergers often result in
reorganization, typically associated with a high level of fixed costs. Firms in unstable
supply chains is therefore less willing to vertically integrate through merging since the
possible return may not be adequate to the exposed risk.
Conglomerate mergers and acquisitions classify mergers between firms with no
related business activities (Dyer, Kale and Singh, 2004). Because M&A’s occur between
two strategically unrelated companies, these types of mergers tend to generate less value
to shareholders.
2.2.3 Drivers of value and reasons for M&A
The dominant rationale used to explain mergers and acquisitions activity is the positive
aspects that enable the acquiring firm to expand and pursue corporate goals such as
improved financial performance (Gaughan, 2005). In previous research three main value
drivers has been identified: synergies, management involvement and the importance of
value investing (Campa and Hernando, 2004). Campa and Hernando (2004) also
acknowledge that elimination of duplicate activities or cost reductions are almost always
mentioned as the reasons for mergers. This is most commonly achieved through
economies of scale and scope (Hitt, Harrison, Ireland and Best, 2011). Economies of
scale refer to declines in unit costs of a product as a result of increased size, usually as a
result of that the fixed costs are spread out over a larger amount of outputs. Another
result of economies of scale is a reduction of overlapping costs between different
activities within the firm, increasing the efficiency.
Similar to economies of scale are the economies of scope, which refer to factors that
make it cheaper for a company to produce a range of products together, rather than each
one of them separately. Mergers and acquisitions also enable the acquiring firm the gain
a potential higher market share and at the same time reduce competitive rivalry.
Another reason for mergers and acquisitions is diversification. Diversification
reduces an investor’s exposure to firm-specific risk and provides a hedge against risk in
earnings volatility. Diversification through acquisitions also provides an efficient way to
enter a new market and new lines of business (Sudarsanam, 1995).
Synergy in the context of mergers and acquisitions refer to the ability of two or more
firms to generate more value together than as single entities. Usually M&A synergies
take one of six different forms (Goold and Campbell, 1998):

9
Shared know-how
Coordinated strategies
Shared intangible resources
Vertical integration
Pooled negotiating power
Combined business creation
Shared know-how denotes how company can achieve improved results by combining
their insights and knowledge about functions or processes. This can result in better
internal efficiencies. After a finalized merger, the new entity can increase its efficiency
and competitiveness by coordinating the two previously separately units. This is
beneficial, since it implies better access to critical resources and capabilities. The merged
firm can also divide the markets among its units in order to reduce interunit competition
and strengthen competitive position (Goold and Campbell, 1998). Two of the synergy
forms, shared tangible resources and vertical integration, are similar to the phenomena’s
economies of scale and scope, already explained in the sections above. Another factor
causing M&A synergies was pooled negotiating power. As a larger combined entity the
merged company has a greater leverage and more bargaining power over stakeholder
such as suppliers, customers and governments. This is likely to result in cost-reductions
or improved quality in the goods purchased. Combined business creation synergies refer
to improved financial results as of value created from extracting discrete activities from
several of the units within the new company and combining them into new units (Goold
and Campbell, 1998).
2.3 Cumulative abnormal returns to target firms
(Bruner, 2002) summarize the evidence from 130 event studies from 1971 to 2001.
Despite variations in time period, type of industry and method for measuring the
cumulative abnormal returns his research reveal that target firm shareholders enjoy, in
almost all cases, on average significantly positive returns. These findings are consistent
with previous reports such as (Datta, Pinches and Narayanan, 1992), (Sudarsanam and
Mahate, 2003) and (Seth, 1990). On average these surveys report an average cumulative
abnormal return of between 20-30%. The range of returns is however wide, ranging from
7,45% (Eckbo and Thorburn, 2000) to 41,65% (Maquieria, Megginson and Nail, 1998).
However, there is an extensive amount of studies showing that mergers and acquisitions
deliver premium return and positive stock returns to target firm shareholders (Bruner,
2002).
2.4 Cumulative abnormal returns to buyer firms
While the research of target firms is quite straightforward, studies concerning value
creation for acquiring firms are less conclusive. Studies up to date have had different
findings, evenly distributed between those who report negative cumulative abnormal
returns and those who report slightly positive cumulative abnormal returns (Campa and
Hernando, 2004). Bruner (2002) summarize the findings of 41 studies conducted during
the period 1977-2001. Bruner report that 20 of the studies show negative returns varying
between one and three percent. The results are also statistically analysed and 13 of the 20
studies present significantly negative returns. A little bit more than half of the sample, 24
studies, presents positive returns with 17 of the 24 reporting significantly positive
returns. According to Bruner the findings of the studies validate that about a third of the
transactions indicate value creation, a third value conservation and one third value

10
destruction. The results are quite similar to ones presented by Campa and Hernando
(2004), but according to Bruner (2002) it is fair to conclude that the returns to the
acquiring firm shareholders from mergers and acquisition activity is around zero percent.
2.5 Time frame of event studies
Most of the previous studies focus on analysing cumulative abnormal return that
arises around the announcement date of the deal. The reason for this is the possibility of
new information, which has nothing to do with the transaction, might be released. This
might have an impact on the returns and therefore lead to inconclusive results. Also,
according to the efficient market hypothesis, stock prices will react immediately to new
information, and the markets opinion of a possible deal will therefore be visible in a very
short time period (Eriksen et al., 2008; Goergen et al., 2003). A majority of studies find
that cumulative abnormal returns occur in the days following the announcement.
2.6 The impact of industry conditions on value creation from mergers
There are few studies that links industry conditions to gains from acquisitions.
According to (Huyghebaert et al., 2013), they are the first to investigate various industry
characteristics on value creation as a result of mergers or acquisitions. In their study they
found strong statistical significant results that show that industry conditions affect value
creation of mergers. The same author investigates the influence of five key industry
characteristics: the concentration of sales within an industry, industry foreign
competition, the operating scale of industry incumbents, industry sales growth, industry
technological intensity and the industry deregulation.
There are several studies that confirm that industry characteristics and conditions
impact M&A activity (Harford, 2005). Mergers and acquisitions are less likely to occur
in industries dominated by a few large firms (Andrade and Stafford, 2004). Huyghebeart
and Luypaert (2013) finds that the industry sales concentration, i.e. the distribution of
market share among companies in an industry, is significantly negative to value creation
from mergers and acquisitions. This might seem contradictory, since one would expect
that acquisitions in already concentrated industry would allow firms in the industry to
realize market power and therefore create value to the shareholders. Huyghebaert and
Luypaert (2013) however provides three reasons why this is not the case. Studies have
shown that stock returns of firms operating in concentrated industries are lower than in
fragmented industries. The reasons for this is that a high industry concentration might
result in those firms are less efficient due to market disciplining (Berger and Hannan,
1998). Companies in concentrated industries engage less innovation due to high entry
barriers and the absence of competition (Hou and Robinson, 2006). In concentrated
industries the number of potential bidders is small which reduce the probability of a
bidding war. As a result of few potential buying firms the bargaining power of the
acquiring company is also bigger (Huyghebeart and Luypaert, 2013). This implies that
gains of target firms in M&A should be lower than in fragmented ones. Furthermore, not
all deals in concentrated industries are completed since these are subject to inspection
from antitrust authorities. Interventions sometimes occur and these then dampen the
effect of value creation as an effect of high industry concentration levels.
Competition from foreign companies increases the takeover activity within an
industry (Marks and Mirvin, 2005). Huyghebaert and Luypaert (2013) find no statistical
proof for it but suggest that gains from mergers and acquisitions deals are positively
related to industry foreign competition. The reason for this is that industries with a high

11
foreign competition are assumed to have a higher competition. Since mergers and
acquisitions essentially is a kind of cooperation between two companies to better face the
competition within an industry, it is therefore expected that investors react more
positively to M&A announcements in these types of industries.
Similar to the industry sales concentration and foreign industry competition the
optimal scale of firms operating in an industry affect the expected value creation.
Optimal scale of firms defines the potential of achieving economies of scale, the cost
reduction that occur when fixed costs for parts of the value chain such as administration
and production are spread out over a larger output volume. (Huyghebeart and Luypaert,
2013) find statistical evidence for a negative relation between an industries minimum
efficient scale and value creation.
The relationship between industry sales growth and value creation from mergers and
acquisitions is U-shaped (Huyghebaert and Luypaert, 2013). This implies that industries
with very low or very high growth are the ones enjoying high value creation. The reason
for this being is that investors are likely to be more positive to high growth industries,
since companies operating in these industries are likely to benefit from the high growth
in the industry, and therefore achieve substantial growth synergies, motivating a positive
reaction (Schoenberg and Reeves, 1999). Target companies in high sales growth are also
more likely to receive higher bid premiums. The reason for this is that the rapid growth
allows acquiring companies to capitalize on investment opportunities (Huyghebeart and
Luypaert, 2013). The bidding company’s investment is also seen as less risky, resulting
in that the acquirer is more confident and aggressive when determining the bid. Similarly
to high growth industries, investors are also positive to mergers and acquisitions in low
growth industries. Firms in these types of industries have in general more difficult to find
alternate ways to grow and instead often focus to find ways to reduce costs (Huyghebeart
and Luypaert, 2013). Mergers and acquisitions represent an easy ways for these
companies to expand, grow and achieve economies of scale (Marks and Mirvis, 2001).
As a result of this M&A gains is high in industries with low growth.
Mergers and acquisitions is an effective way to transfer intellectual knowledge and
know-how between different firms (Lehto and Lehtoranta, 2006). If the know-how and
other intangible assets from the target company are better used with the acquiring
company, value is created. (Ahuja and Katila, 2001) also acknowledges that acquisitions
in industries with high technological intensity have the ability to result in economies of
scale for research and development. This is something pharmaceuticals companies have
found to be essentially necessary in order to be profitable and carry the overheads
associated with R&D. Generally, targets in high-tech industries are also more likely to
possess unique, valuable assets (Huyghebaert and Luypaert, 2013). These unique
intangibles improve the bargaining power of target companies when negotiating deals.
As a result of these factors Huyghebaert and Luypaert (2013) hypnotise that investors
may react more positively to M&A announcement in industries with high technological
intensity.
The last industry characteristic that Huyghebeart and Luypaert (2013) suggest affect
value creation from mergers is the industry deregulation. Deregulation is the process of
reducing or removing regulations and other constraints from companies. Mergers and
acquisitions is one of the most efficient ways for industries to respond and adapt to new
industry conditions as a consequence of deregulation (Mitchell and Mulherin, 1996). As
a consequence of this Huyghebaert and Luypaert (2013) suggests that announcements of
M&A in recently deregulated industries are likely to create more value than regular
industries. The same authors also state that recent deregulated industries often result in

12
an increased number of interested acquirers for target firms, suggesting especially high
bid premium to target firms in recent deregulated industries.
3 Methodology
3.1 Research design
In this paper a deductive approach was used in order to conduct an analysis. In line with
the deductive approach, this paper overview previous theories and research in order to
study a phenomenon (Bryman, 2008).
Quantitative research methods focuses on measuring data and have a deductive
approach in order to connect theory and research (Bryman, 2008). This study is
conducted using numerical data from the databases Zephyr and Datastream that is
analysed using statistical methods. Hence, the study is considered to be quantitative.
Quantitative research methods are associated with positivism, the view that it is possible
to establish valid scientific knowledge by analysing empirical data (Djurfeldt, 2003).
This study use only quantitative method in order to analyse data and has therefore a
positivistic view on scientific knowledge. Positivism tries to reach the same level of
objective science as natural sciences such as mathematics and physics (Djurfeldt, 2003).
Positivism is therefore connected to objectivism.
Objectivism is a philosophical concept stating that there is an objective truth,
meaning a state true and not subject to a biases, interpretations and feelings (Bryman,
2008). Objectivism therefore usually implies that conclusions and research is done using
existing theories and previous studies (Bryman, 2008). As stated before, the data used in
this paper was received through external resources. However, these resources subject to
constant inspection and have a framework of standards that is being controlled. Similar
to the data, the methods used have also been peer reviewed by several competent
students and scholars in academia. Because of this the material used for analysing and
the data examined is considered available and reliable.
3.2 Data collection
The data collection in this study was done similarly to other event studies in this field
(Campa and Hernando, 2004; Gross and Lindstädt, 2005; Bruner, 2002). By using the
database Zephyr a comprehensive list of successful mergers and acquisitions in the
OECD completed between 2004 and 2014 was collected. Zephyr contains detailed
information on M&A, IPO and venture capital deals and was chosen as a source because
of its extensive range of transactions.
Each merger in the acquired sample was subject to several constraints.
1. The merging companies are or have been publicly listed and traded on a major
stock exchange during a sufficient period before and after the announcement
date of the merger.
2. The deal types have to be either an acquisition or a merger. This study only
overlooks value creation in M&A and other deal types such as joint ventures
and private equity deals were therefore disregarded.
3. The transaction involves the purchase of a majority stake (>50%) in the target
firm. This reason for this was to verify a shift in hierarchical power from target
to acquiring company.
4. The merger or acquisition has to be completed between 1/1/2004 and 1/1/2014.

13
5. The deal value is above 10 million USD. This was set in order to remove small
deals not very representative for listed companies.
6. Both the target and acquiring companies are from OECD countries.
7. No deals with other extraordinary events within the timeframe of the
announcement data are allowed in order to exclude events possibly affecting or
confusing the results.
8. Information about the deal, prices and dividends about the bidder and target has
to be available. This implies that the both the acquiring and the target company
has to exist in the Datastream database.
The initial event sample consisted of 68113 transactions where both the acquirer and
target company was listed. Of these deals 5511 transactions were acquisitions or
mergers. 3307 of these involved the purchase of a majority stake. Accounting for the 4th
constraints the sample consisted of 1416 deals. Between these deals 608 had a deal value
above 10 million. Finally in 289 of these 608 transactions, both the acquirer and target
originated from OECD countries. This final sample was divided into 4 different
industries based on the business the company is in. These industries were industrials,
financials, information technology and consumer staples.
There is a great deal of controversy over the appropriate definition of an industry and
one of the main difficulties associated an industry level analysis is to determine which
industry classification to use and then to choose which firms to allocate to which
industry (Andrade and Stafford, 2004). (Porter, 2004) defines an industry as the group of
firms producing products that are close substitutes for each other. Critics of this
definition argue for that it doesn’t account for how close the substitutability needs to be
in terms of process, product or geographic market boundaries (Andrade and Stafford,
2004). For this paper the classification of each industry was acquired from Zephyr.
Industries with no or few mergers during the time period looked upon, such as
pharmaceuticals, were disregarded because of possible low statistical significance.
Financial data and historical stock quotes were obtained from the database
Datastream. The data from Zephyr and Datastream were extracted separately and
validated so that index- and share prices actually match.
3.3 Measurement of abnormal results
In order to measure the market assessment of a mergers value creation potential,
abnormal return was used. The abnormal return is defined as the difference between the
actual and expected return. Abnormal returns are often used as a measurement to
interpret the shareholders evaluation of a merger transaction and the impact they expect
the transaction to have on the companies’ future profitability (Gross and Lindstädt,
2005). Assuming to the efficient market hypothesis (Fama, 1970), cumulative abnormal
shareholder return as a result of the announcement of a merger therefore reflect the long-
term value created when a acquiring and target company merge into one.
According to (Gross and Lindstädt, 2005) the daily abnormal return (AR) is
calculated as
where Ri,t is the actual return and E(Ri,t) is the expected return for a company’s stock at a
arbitrarily day t. In this thesis the expected return is calculated using the capital asset
pricing model, CAPM, presented below.

14
( ) ( )
where is a measure of the volatility, or systematic risk, of a company i in comparison
to general market movements.
The two equations combined result in the market model
where, is the rate of return for stock i and the rate of return for the market
portfolio over period t. The parameters express the firm specific risk. The different
parameters are calculated using.
( )
Similar to the method used by (Campa and Hernando, 2004), the values of αj and βj were
estimated using stock prices corresponding to 150 days prior to the initial date of the
considered window. The random error term, is, similarly to (Seth, 1990) set to zero.
Also, in this study, the rate of the return for a market will instead be replaced by the rate
of return for a market portfolio for each specific industry (Gross and Lindstädt, 2005).
In contrast to the daily abnormal returns the cumulative abnormal returns indicates
the total change of a securities value over a period of time. The cumulative abnormal
return is in this thesis is therefore calculated using the equation below.
∑
In order to calculate the estimated valuation effect within a whole industry the total
cumulative abnormal returns is divided across the number of securities N, examined for
the industry.
∑
r and t are arbitrary numbers that are set according to the chosen time frame of the event
window.
3.4 Time frame
Campa and Hernando 2004 conclude that there is weak evidence in favour of a price run-
up, starting months prior to the announcement date. Same author verifies that no
significant post-announcement returns are usually found months after the announcement.
This paper will therefore only evaluate measurement of abnormal returns within the two
time windows (t-3, t+3) and (t-10, t+10). (t-3, t+3) indicate that the cumulative abnormal
return will be studied over a period that start three days before and end three days after

15
the announcement date . Similarly, (t-10, t+10) specify that the event period start ten
days before and ends ten days after the announcement date.
Fig 1. Graphic illustration of an event study.
3.5 Regression analysis
A regression model is a statistical tool that is used to find a relationship between one or
more variables. It focuses on the relationship between an independent- and a dependent
variable. More specific, regression analysis presents information of how the dependent
variable will vary and change when the independent variable is varied. In this paper
simple linear regression analysis was applied. Using this method a straight line is fitted
through a set of observations while at the same time minimizing the sum of squared
residuals (the vertical distances between observations and the fitted line). The dependent
variable in this study is the abnormal return and the independent variable used to explain
the dependent variable is the daily return for the market (or industry). The daily price is
defined as the perceptual change in price from day t compared to the day before, t-1. The
implementation of these statistical models was done in Microsoft Excel.
3.6 Index
When determining the different systematic parameters of the market model, in this case
and , a market portfolio that includes the most important single influence should
be used (Sharpe, 1963). Because of this, industry-specific portfolios were in this study
used to determine market returns of different industries.
The different indexes used were the S&P Global 1200 index for each of the four
different industries (industrials, financials, information technology and consumer
staples) reviewed. These indexes are free-float weighted and cover 31 countries.
Together they cover roughly 70 percent of the global stock market capitalization
(McGraw Hill Financials, 2014). The different companies represented by each index are
categorized by the Global Industry Classification Standard (GICS). The S&P indexes
were chosen due to its strong reputation, its method to calculate the market capitalization
of the underlying companies and its exposure to the global equity market.
The market model’s parameters for each company were obtained by using regression
analysis over a period of 150 days before the start of the event window. This period is
denoted as the estimation period as seen in Fig 1. The parameters were then assumed to
be constant when calculating the daily expected return for each of the days in the event
window.
3.7 Reason for geographical selection
This study has chosen only to overlook transactions that have occurred inside or between
countries in the Organisation for Economic and Co-operation and Development, OECD.
There are several reasons why only OECD countries are examined. First of all these
16
countries is regarded as developed countries with a developed economy and advanced
technological infrastructure (Focarelli and Pozzolo, 2001). The member countries are
committed to democracy and the market economy. Together they aim to contribute to the
expansion of world trade on a multilateral, non-discriminatory basis. Based on this the
OECD countries is chosen as they represent a number of countries with low national
boundaries. Even though there is clear indication that there are still a large number of
legal, economic and cultural deterrents to a free market. However similar to (Focarelli
and Pozzolo, 2001), the OECD represent an international, representative sample of the
developed world.
3.8 Statistical testing
In this thesis the null hypothesis will review if the cumulative abnormal returns for each
of the four industries analysed can be statistical proved to be equal or different to zero
for the buyer or seller.
The statistical significance was examined using a t-test in MATLAB. The results are
presented and analysed in chapter five.
3.9 Adjusting for outliers
When conducting test statistics, for example t-tests, normal distribution among the
sample is often assumed. This is problematic since the distribution of stock returns often
is skewed (Sudarsanam and Mahate, 2003). This problem can however be eliminated
through winsorizing. Winsorizing is the process of erasing extreme values in statistical
data in order to reduce possible misleading test results as a result of outliers. This is, in
this thesis, similar to Sudarsanam and Mahate (2003), eliminated by removing all
cumulative abnormal returns beyond three standard deviations from the sample mean.
An outlier may possibly indicate an experimental error and extreme variability in the
measurement. Studies do therefore suggest that there is less likely to produce false
positive results using this method (Corwan and Sergeant, 2001).
4 Analysis
4.1 Characteristics and description of the different industries
4.1.1 Industrial sector
The industrials sector includes manufacturers and distribution of goods such as electrical
equipment, machinery, construction material and other engineering services. The
performance and growth rate in the industrials industry is to a large extent driven by
demand for building construction. As a result of this the industry is cyclical. When the
consumers save more and spend less, companies will postpone expansion and produce
fewer goods, resulting in a downturn within the sector.
4.1.2 Financial sector
The financial services sector includes banks, asset management services, investment
banking, brokerages and insurance companies. Companies in the financial sector are

17
heavily dependent on the rate environment. A large share of the revenue to this industry
comes from mortgages and loans, which generate more value the lower the interest rates
(Berger and Hannan, 1998).. As a result of these companies in this sector is very
cyclical. This is reinforced by additional investments that the industry benefits from
when the business cycle is in an upswing. A positive business cycle also leads to that
new project require financing, resulting in a larger number of loans and more revenue to
the companies working in the industry. The banking industry is characterised by high
switching costs (Berger and Hannan, 1998). A banking client usually has a variety of
services such as mortgage, loans and savings at the same bank. As a result of this
changing bank is perceived as complicated. In order to gain customers banks do rather
not spend capital on marketing and advertising. Instead they tend to make acquisitions or
merge with other banks. High switching costs is therefore one factor shaping the nature
of the financial industry and is one of the reasons why it is expected to see further
consolidation within the industry (Berger and Hannan, 1998).
4.1.3 Information technology
The information technology industry consists of manufacturers of technology hardware
such as communications equipment, computers and semiconductors among many other
things. Firms that offer software and technology services is also covered by this industry
definition. The information technology sector is growing rapidly and is characterised by
high competition.
4.1.4 Consumer staples
The consumer staples sector includes distributors and manufacturers or food, food,
tobacco and other personal products. Food and drug retailers and other consumer super
markets are also included in this industry definition. The companies in the consumer
staples industry provides products that always has an specific demand since people
always need this kind of products, regardless of their financial situation. As a result of
this the industry is less sensitive to economic cycles compared to other industries.
4.2 Expected value creation and division of gains in the industries
As previously stated in section 3.6, there are few studies connecting industry
characteristics to value creation in mergers and acquisitions. However, the framework
developed by (Huyghebaert et al., 2013) gives suggestions on the divisions of gains
between different industries and will therefore be applied to the four industries examined
in this study. A summary of the expected value creation and division of gains among the
four industries is found in Table 3. Motivation for these expectations is found in the
subsections below.
4.2.1 Industry sales growth
Huyghebeart and Luypaert (2013) measure industry sales growth by calculating the
annual growth for each corresponding industry. Using this method in this study would be
inefficient and misleading. Since the sample in this study is composed of 10 years of
mergers transactions, the industry sales growth should represent the growth over the
whole period.
In this study the historical growth rate in earnings for each industry put together by
NYU Stern Professor Aswath Damodaran was used. The data was retrieved and updated
in January 2014 and present growth values for the last 5 years. Since (Damodoran, 2014)
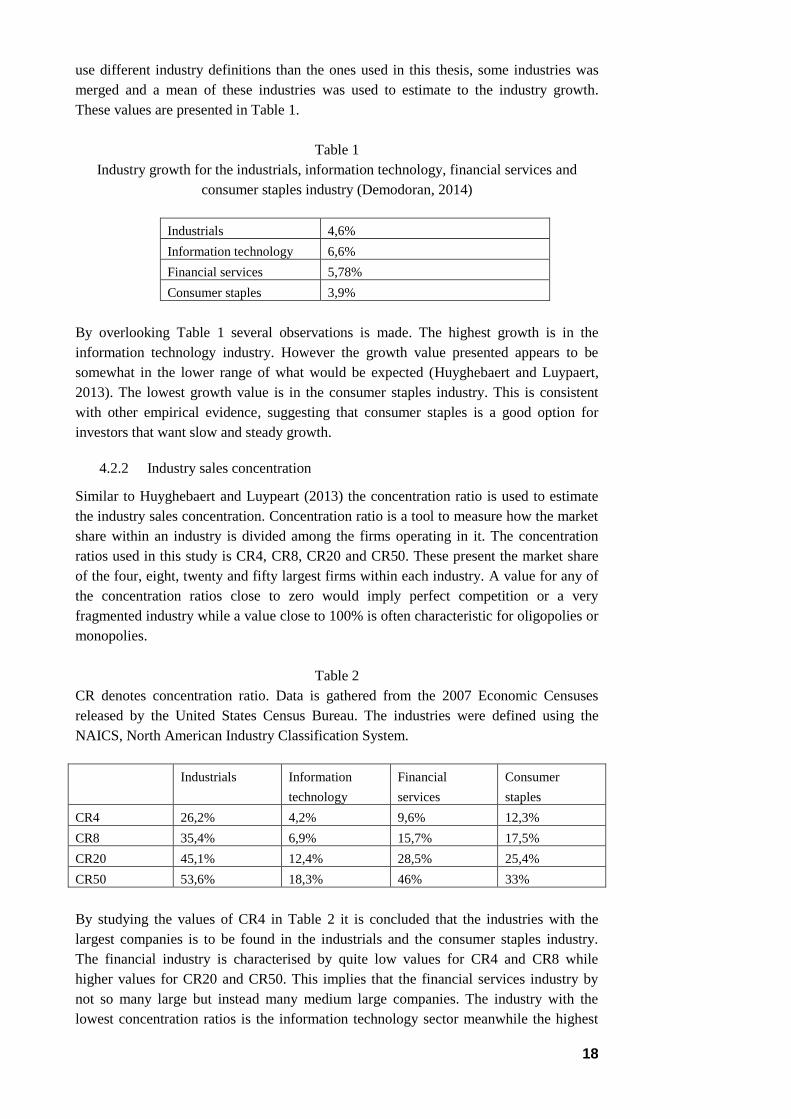
18
use different industry definitions than the ones used in this thesis, some industries was
merged and a mean of these industries was used to estimate to the industry growth.
These values are presented in Table 1.
Table 1
Industry growth for the industrials, information technology, financial services and
consumer staples industry (Demodoran, 2014)
Industrials 4,6%
Information technology 6,6%
Financial services 5,78%
Consumer staples 3,9%
By overlooking Table 1 several observations is made. The highest growth is in the
information technology industry. However the growth value presented appears to be
somewhat in the lower range of what would be expected (Huyghebaert and Luypaert,
2013). The lowest growth value is in the consumer staples industry. This is consistent
with other empirical evidence, suggesting that consumer staples is a good option for
investors that want slow and steady growth.
4.2.2 Industry sales concentration
Similar to Huyghebaert and Luypeart (2013) the concentration ratio is used to estimate
the industry sales concentration. Concentration ratio is a tool to measure how the market
share within an industry is divided among the firms operating in it. The concentration
ratios used in this study is CR4, CR8, CR20 and CR50. These present the market share
of the four, eight, twenty and fifty largest firms within each industry. A value for any of
the concentration ratios close to zero would imply perfect competition or a very
fragmented industry while a value close to 100% is often characteristic for oligopolies or
monopolies.
Table 2
CR denotes concentration ratio. Data is gathered from the 2007 Economic Censuses
released by the United States Census Bureau. The industries were defined using the
NAICS, North American Industry Classification System.
Industrials Information
technology
Financial
services
Consumer
staples
CR4 26,2% 4,2% 9,6% 12,3%
CR8 35,4% 6,9% 15,7% 17,5%
CR20 45,1% 12,4% 28,5% 25,4%
CR50 53,6% 18,3% 46% 33%
By studying the values of CR4 in Table 2 it is concluded that the industries with the
largest companies is to be found in the industrials and the consumer staples industry.
The financial industry is characterised by quite low values for CR4 and CR8 while
higher values for CR20 and CR50. This implies that the financial services industry by
not so many large but instead many medium large companies. The industry with the
lowest concentration ratios is the information technology sector meanwhile the highest

19
concentration ratios are found in the industrials sector. An explanation for the low
concentration rate in the information technology sector could be explained by the low
entry barriers that exist within the industry. Developing Internet software and services
has been something that a single individual has been able to do, without any larger
capital requirements.
4.2.3 Industry technological intensity
The definition of what is considered technological varies. When determining which
industries that are operating in a high-tech industry (Huyghebeart and Luypaert, 2013)
chose only to consider firms operating with computer hardware, telephone equipment,
communication equipment, electronics, navigation equipment, medical instruments,
communications services and software.
The reason for identifying high-tech firms and industries is based on the fact that
technology competencies were one of the key motives for justifying recent acquisitions
in Europe (Frey and Hussinger, 2011). Industries with a high technological intensity are
also believed to result in higher target returns since these companies usually possess
valuable unique assets (Huyghebaert and Luypaert, 2013). Using this information the
author of this study argues that the two sectors information technology and industrials
are to be considered industries with a high technological intensity.
4.2.4 Industry deregulation
Deregulation is the process of removing or reducing rules or laws designed to limit or
control different behaviour. In their investigation, (Huyghebaert and Luypaert, 2013)
only overlook industries that were recently deregulated. They also only examine specific
years. The sample studied in this thesis contains data covering multiple years as well as
all different countries in the OECD organisation. This causes a problem since individual
countries are the usually the ones responsible for deregulations actions. One observation
is that Europe is well represented in the sample. During the last decades the European
Union has strived for deregulation and promotion of an integration of the national market
within its membership countries. This has resulted in a restructuring of the European
corporate sector (Campa and Hernando, 2004). A reduction of government regulation is
likely to make it easier to exploit economies of scale and transfer of knowledge (Bruner,
2004). According to Huyghebaert and Luypaert (2013), this might imply higher return
for target shareholders for all industries compared to other studies of other geographical
locations.
4.2.5 Industry foreign competition
Shahrur (2005) and Huyghebaert & Luypaert (2013) measure the extent of industry
foreign competition by the studying the industry import penetration ratio for each
industry. The import penetration ratio is the total imports divided by the total industry
supply. Since these values is time consuming to both retrieve and calculate, Porters
sources of global competitive advantage will be used to explain which industries will be
characterised by a high industry foreign competition (Porter, 1980).
Porter (1980) argues that some industries benefit more from globalization and
operating in foreign countries. According to Porter, industries that possess global
advantage, is the ones operating in foreign countries. Global advantages can origin from
four different causes (Porter, 1980). These are described more detailed in bullet points
below.

20
Comparative advantage
Comparative advantage is the ability and advantage to achieve better quality or cost for
production by producing a product or service in a foreign country. In the type of
industries or countries that possess a comparative advantage, the industry foreign
competition will be higher (Porter, 1980).
Economies of scale
If there are economies of scale that has the possibility to extend production beyond the
size of its central national markets, the firm can change its movements of exports among
several countries. This results in that the cumulative volume per model will increase and
a cost advantage is achieved. The ability of selling products in many national markets
also posses several other benefits, such as faster learning (Porter, 1980). Potential
marketing economies of scale can also possess an advantage. The most obvious is where
a common sales force is employed worldwide. In the industrials sector the sales task is
usually very complex and deals are done infrequently with a small amount of buyers. A
firm operating at a global level in several foreign countries has the advantage of
spreading the fixed costs of expensive salespersons over many national markets. The
consumer staples industry possesses similar advantages.
Advantages from product differentiation
In some industries, global competition can give companies within the industry higher
credibility and reputation. An example of this is the fashion and cosmetics industry,
where companies such as Hermés and Louis Vuitton enjoy benefits from operating in
Paris. Porter (1980) argues that this is a competitive advantage, resulting in that
industries that possess this type of characteristic are likely to have a higher foreign
industry competition.
Public-good character of market information and technology
Companies with proprietary technology strive to reach beyond the national borders of
the company (Huyghebaert and Luypaert, 2013). The reasons for this are the larger
potential sales as well as improved technological competiveness as a result of
technological developments as of global competition. Porter (1980) suggests that
information technology and industrials sector is industries where global competition is
especially common due to technological advantages.
4.2.5.1 Conclusion of foreign industry competition
Based on these characteristics it is implied that the financial industry is the industry with
the least foreign competition. The reason for this being is that a bank does not enjoy the
same economies of scale benefits as companies in other industries do by expanding. The
industrials, information technology and consumer staples industries should all, according
to Porters global advantages enjoy foreign competition. Companies in the industrials and
consumer staples industry do in particular enjoy the potential economies of scale that the
industries characteristics offer.
4.2.6 Industry minimum efficient scale
Huyghebeart and Luypaert (2013) recommend measuring the potential for scale
economies between different industries by comparing the ratios of the natural logarithm
of the sum and target assets to the industry minimum efficient scale, MES. In this study

21
the potential for scale economies was calculated the same way and the conclusion of
these results are presented in Table 3.
4.2.7 Expected returns for each industry
Table 3.
Hypotheses on the industry determinants of value creation as a result of mergers. A plus
indicates a positive effect on M&A value creation and a minus the opposite.
Industrials Financial
services
Information
technology
Consumer
staples
Industry sales
concentration
- +/- + +/-
Industry foreign
competition
+ +/- +/- +
Industry minimum
efficient scale
+ - +/- +
Industry sales
growth
+/- +/- + +
Industry
technological
intensity
+ +/. + -
Industry
deregulation
+/- + +/- +/-
The extent of foreign industry competition, industry deregulation and industry
technological intensity does not have any statistical significance to value creation in
mergers and acquisitions (Huyghebeart and Luypaert, 2013). However the same author
still states hypotheses that a connection between these industry connection and M&A
returns does exists. The predicted value creation among the industries examined is
presented in Table 3. Studying the results it is seen that the most favourable industries
for mergers and acquisitions is anticipated to be the information technology sector,
followed by the consumer staples and industrials industries.

22
5 Results
5.1 Description of the sample
5.1.1 Geographical distribution of targets and acquirers
Table 4.
Distribution of number of M&A announcements by country
Breakdown by country
Acquirers Share in
percentage
Targets Share in
percentage
Austria 1 1.9% 1 1.9%
Belgium 1 1.9% 1 1.9%
Canada 1 1.9% 1 1.9%
China 1 1.9% 0 0
France 3 5.6% 2 3.7%
Germany 2 3.7% 6 11.1%
Greece 0 0 1 1.9%
Iceland 1 1.9% 0 0
Israel 2 3.7% 2 3.7%
Japan 18 33.3% 19 35.2%
Korea 3 5.6% 3 5.6%
New Zealand 1 1.9% 0 0
Netherlands 1 1.9% 1 1.9%
Norway 1 1.9% 0 0
Portugal 0 0 1 1.9%
Singapore 1 1.9% 1 1.9%
Spain 2 3.7% 0 0
Sweden 0 0 1 1.9%
United States 15 27.8% 14 25.9%
Total 54 100% 54 100%
The distribution of M&A announcement for each country is presented in Table 4. As
seen the sample is dominated by merger deals from Japan and the United States (US).
More specifically, Table 4 reveals that Japan accounts for roughly a third of the sample,
33.3% of the acquirers and 35.2% of the targets. The US accounts for approximately a
quarter of the sample, 27.8% of the acquirers and 25.9% of the targets. This is however
not representative for the overall M&A statistic. During the recent decades the US and
the United Kingdom (UK) has been market leaders in the number and aggregate deal
value of acquisitions (Zephyr, 2013). A reason for this could possibly be the
characteristics of the financial industry in the US. US have one of the most saturated
banking market and historically small number of banks dominating the US banking
industry. The reason for this is the legislation established in the 1930s that resulted that
the US banking industry is one of the most concentrated in the world. This is evident in
the sample where the number of acquirers and targets from the US is very small for the
financial industry.
In the sample mergers within Europe appear to be underrepresented. A reason could
this could be the economic worries in the Eurozone, that have caused a significant

23
slowdown in M&A activity (Zephyr, 2013). These most active countries in the Eurozone
in the sample are Germany, France and Spain.
5.1.2 Distribution of M&A announcement by industry
Table 5.
Distribution of number of M&A announcement by industry.
Breakdown by industry Number of transactions
Information technology
9
Industrials
22
Financials
13
Consumer staples 12
Table 5 presents the number of deals within each industry. Deals within the industrials
sector appear to occur much more frequently compared to other industries in this sample.
In total, the number of deals in the industrial industry are almost twice the size compared
to the information technology and consumer staples industries. The industrial industry is
the industry with the highest contribution of acquirers and targets from one country,
Japan, accounting for approximately 42% of the total number of deals in the industrials
sample. This can also be explained by the nature of the different industries.
5.1.3 Distribution of the M&A announcement by year
Fig 2. Distribution of the number of M&A announcements for every year within the
obtained sample.

24
Comparing the sample used in this study with the total M&A population presented by
(Zephyr, 2013), the number of global deals appears to different. During the period
2004-2014, the number of deals has been lowest during 2004 and 2009, as a result of the
dot-com bubble and the financial crisis of 2007-2008. According to Zephyr (2013) the
global number of deals was at its peak in 2007, as a result of low inflation and stable
growth – fostering complacency and risk-taking. The downturn in economic activity
leading to the recession of 2008 appear not to be visible in the sample used in this study.
Contradictory a majority of deals in the sample are centered around 2012.
5.2 The distribution of acquirer and target returns
Figure 3, 4, 5 and 6 displays the distribution of cumulative abnormal returns to targets
and acquirers for the event window (t-10, t+10). The results for the shorter event window
(t-3, t+3) will not be commented. The statistical results for both event windows will be
presented in section 6.1.5.
Viewing the different images it can be seen that the returns for different industries
appear to have different characteristics. Therefore, the distribution will be analysed and
explained more in detail in the following sections. Furthermore possible reasons for the
distribution will also be analysed.
Fig 3. Acquirer and target cumulative abnormal returns in the industrials sector.
By studying Fig. 3, information about the distribution of return can be obtained. It is
seen that a majority of the target returns, 16 out of 22, is above zero percent. For the
acquirers it is the opposite, with an almost equal number of returns, 15 of 22, being
below zero percent. At the same time as target companies in the industrials sector enjoy
positive returns, they also enjoy fairly high positive returns. Of the total industrials target
companies, 32% receive an increase in stock price of over 30% as a consequence of the
acquisition announcement. This implies that acquisitions or takeovers in the industrials
sector are very beneficial for target company shareholders.

25
It is also identified that the returns for both acquirers and targets seems to be
somewhat symmetrical. Although acquirers returns are centralized around zero, there are
some deals generating high negative returns for the acquirer such -16.2% and -20.6%.
Fig 4. Acquirer and target cumulative abnormal returns in the financial sector.
The sample used for the analysis of the financial sector is substantially smaller than the
one for the industrials sector. At the same time the results are not as conclusive. From
Fig 4 it can be identified that a small majority of the target companies receives positive
returns. Two companies achieve extremely high returns above 30% and a few deals are
in the 10-20% return range. However, a vast majority of the target returns seems to be
just a few percent above or below zero. The distribution for the acquiring companies is
more straightforward and a majority of the deals accrue CAR in the range from negative
to positive 5%.

26
Fig 5. Acquirer and target cumulative abnormal returns in the information technology.
Because of the small sample gathered from the information technology sector it is quite
difficult to draw any conclusions from the distribution of returns. The deals that result in
negative acquirer returns within the information technology are special in the way that
they are high compared to other industries. The most interesting deals in this samples are
the ones generating -22.9% and 56.7% to the acquirer. The distribution of the returns in
the other industries indicates that this type of relationship between acquirer and target
returns is fairly uncommon. Studying Fig. 3, Fig. 4 and Fig. 5 it is seen that a high
positive return for the target also often happened together with a high, or at least positive
target return. When examining the other transaction returns it is observed that the
returns, similar to the other industries, are around zero for both acquirers and targets.
There is however a high percentage (30%) of the target deals that result in returns above
40%.
27
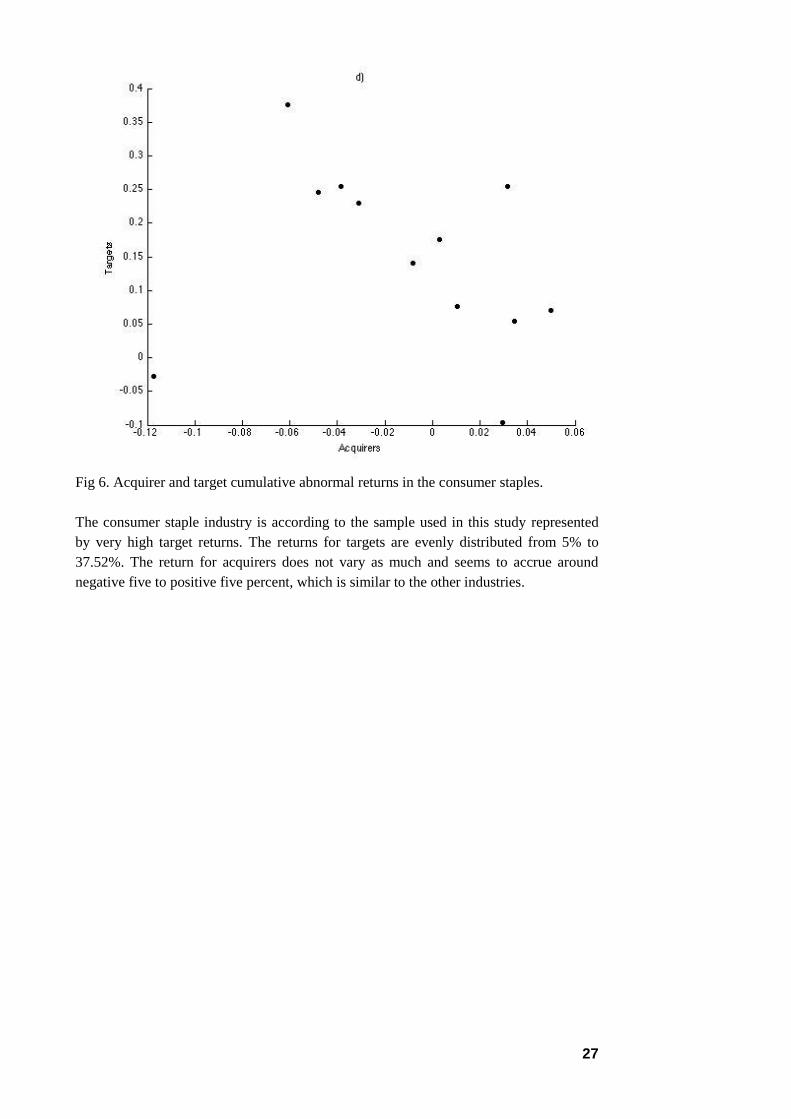
Fig 6. Acquirer and target cumulative abnormal returns in the consumer staples.
The consumer staple industry is according to the sample used in this study represented
by very high target returns. The returns for targets are evenly distributed from 5% to
37.52%. The return for acquirers does not vary as much and seems to accrue around
negative five to positive five percent, which is similar to the other industries.

28
5.3 Statistical analysis of the results
Table 3.
Cumulative abnormal returns for acquirers by type of industry.
The sample mean, standard deviation, confidence interval limits and t-statistic for each
industry are included in the table.
Acquirers (t-3, t+3) (t-10, t+10)
Industrials CAAR -0.013 -0.029
Standard deviation
Confidence interval
0.046
-0.0332
0.0075
0.077
-0.0636
0.005
t-statistic -1.301 -1.776
Financials CAAR 0.078 0.094
Standard deviation
Confidence interval
0.231
-0.1295
0.3179
0.389
-0.056
0.2109
t-statistic 1.254 0.909
Information
technology
CAAR -0.019 -0.028
Standard deviation
Confidence interval
t-statistic
0.065
-0.0695
0.303
-0.905
0.106
-0.1098
0.053
-0.803
Consumer staples CAAR -0.030 -0.019
Standard deviation
Confidence interval
0.0692
-0.0836
0.0228
0.0518
-0.0583
0.0212
t-statistic -1.317 -1.076
From Table 3 it is identified that the CAAR for each of the industries appear to be
distributed close to zero percent. It is also observed that the mean cumulative abnormal
return for acquirers is negative for three of the four industries examined.
The results from the t-tests verify that the null hypothesis cannot be rejected for any
industry at the 5% significance level. It is seen that the acquired results for the
information technology sector possess least statistical significance in the study. The
results for the consumer staples sector provided higher t-values, implying that these
results give a better estimation of what acquirer returns within this sector usually are.
The only industry presenting average CAR’s above zero percent for acquirers is the
financial service industry. The acquirers within the industry yield an average return of
7.8% (t-3, t+3) and 9.4% (t-10, t+10). It is also seen that the return varies the most within

29
the financial sector, which is also displayed in Fig 4. From the results presented in Table
3 it is concluded that the results will vary between -12.95% to 31.79% with 95%
accuracy.
In the industrials sector acquirers enjoy negative average cumulative abnormal
returns of -1.3% (t-3, t+3) and -2.9% (t-10, t+10). It is also for industrials acquirer, in the
time frame (t-3, t+3), that the smallest standard deviation is measured. This indicates that
acquirers within this industry seems very likely to achieve either slightly positive or
negative returns close to zero percent. Overlooking the confidence interval for the
sample in this study it is verified that acquirers in the industrials sector achieve returns
between -3.332% and 0.75% with the probability of 95%.
There does not seem be any trend for the two different time frames concerning the
returns for the acquirers. For two of the industries, consumer staples and industrials, a
longer event period resulted in a higher return, while for the remaining two the results
are opposite. For the industrials sector the CAAR vary the most and is more than twice
as low for the small time frame as for the larger one. This is however just an observation
and cannot no conclusion can be drawn from this.

30
Table 4.
Cumulative abnormal returns for target company by type of industry.
The sample mean, standard deviation, confidence interval limits and t-statistic for each
industry is included in the table.
Targets (t-3, t+3) (t-10, t+10)
Industrials CAAR 0.116 0.130
Standard deviation
Confidence interval
0.204
0.0254
0.2063
0.077
0.0357
0.2248
t-statistic 2.6629 2.865
Financials CAAR 0.074 0.074
Standard deviation
Confidence interval
0.1904
-0.0357
0.1841
0.2095
-0.0464
0.1955
t-statistic 1.456 1.331
Information
technology
CAAR 0.041
0.137
Standard deviation
Confidence interval
0.174
-0.0925
0.1754
0.277
-0.0755
0.3507
t-statistic 0.714 1.489
Consumer staples CAAR 0.155 0.142
Standard deviation
Confidence interval
0.124
0.0595
0.2502
0.0518
0.024
0.2595
t-statistic 3.746 2.775
The calculated parameters for the target companies in the sample are more conclusive
than the data for the acquirers. The cumulative abnormal average return, CAAR, is for
target companies positive in all industries for all time periods except for the industrials
sector during the time frame (t-10, t+10).
Studying the t-statistics in Table 4 we can see two interesting results. For two of the
industries, industrials and consumer staples, the null hypothesis is rejected. For the
industrials sector the results for both time frames result in t-values higher than 2.58. As a
result of this the null hypothesis, that the average CAR will be equal to zero, can be
rejected with 99% probability. This is an important finding and implies that the return for
target companies in industrials sector will, with 99% probability, have returns greater
than zero percent in merger and acquisitions transaction. We can also see that the target
returns for this industry will vary between 2.54% to 20.63% will the probability of 95
percent.
Studying the results for the consumer staples industry values with even higher
statistical value is found. For the time frame (t-3, t+3) the t-statistic is higher than 3.29,
which implies that the null hypothesis can be rejected with the probability of 99,9%.
31
This is supported by the high average cumulative abnormal return and low standard
deviation within this industry. Overlooking the confidence interval it is concluded that
the average CAR within this industry will be between 5.95% to 25.02% with a
probability of 95 percent.
The information technology and consumer financial sector also enjoy positive target
CAAR’s. For these industries the null hypothesis cannot be rejected. Target companies
in the financial industry enjoy a CAAR of 7.4% for both time frames meanwhile target
companies in the information technology enjoy returns of 4.1% (t-3, t+3) and 13.7% (t-
10, t+10). Even though the null hypothesis is not rejected for the industry, it can from the
results in Table 4 be concluded that the returns for the target companies will vary
between -4.64% to 19.55% (t-10, t+10).
From the parameters results of the sample it is seen that the transactions between the
different industries has different characteristics. The standard deviation for the CAR of
the transaction is almost four times as high for the financial industries compared to the
consumer staples industries for the long period time frame. This indicates that the
transactions of the sample analysed is more uniform for the consumer staples industry
while the financial industry is characterised by a large variety in target returns between
the different transactions.
There is no dramatic difference between the two different time frames analysed in for
the financial and consumer staples industry. For the information technology and
industrials industries there are however major changes in both CAR and standard
deviation. In the information technology sector sample the CAAR increases dramatically
when the examined event period is increased from 3 days before and after the
announcement date to 10 days before and after the announcement date. This indicates
that positive (or negative) stock price changes, as a consequence of a merger
announcement, in general occur more than 3 days before or after the announcement date
for target companies in this industry. For target companies in the industrials sector the
situation is the opposite. In this sector the CAAR for target companies decreases from
11.6% to -2.9%. This could possibly indicate a change in investors opinion about a deal,
that initially the investors and stakeholders value the deal positively and then later on not
so much, resulting in a decrease in CAAR.
6 Discussion and suggestions for further research
The sample presented in this paper is not representative for the distribution of
acquisitions over the period looked upon. As a result of this the reliability of the
presented results might be questioned. A suggestion for further research would therefore
be to conduct the same type of research with a possibly more representative sample. This
could be accomplished by extending the number of countries analysed in order to
achieve a bigger and possible more similar distribution as the results presented for the
global world (Zephyr).
In order to characterize the different industries the Zephus classification was used.
This could however possibly have resulted in some problems in the calculation in the
results because of the indexes used for calculation of the different market model
parameters. Therefore in order to eliminate this possibly source of error further research
should try to be consistent in the choice of industry definition. After conducting the
study, the author, based on experience, recommend using the Global Industry
Classification Standard. Finally, in this study only four selected industries was

32
examined. A suggestion for further research could therefore be to be review even more
industries.
7 Conclusions
The cumulative abnormal average return is positive for target companies within all
industries. The CAAR return varies between the smallest value 4,1% for information
technology to the highest 15,5% for consumer staples. The null hypothesis is rejected for
target companies in the industrials and consumer staples industries at the 5%
significance level. It is also concluded that it is in these industries that target companies
enjoy the highest returns among the four industries reviewed. Target companies in the
financial services sector appear to be attaining somewhat lower returns than target
companies in other industries. The most lucrative deals, i.e. deals with a premium above
30%, occur most frequently within the information technology and industrials industries.
Overall there is a big difference in return between acquiring and target companies.
Meanwhile target companies enjoy positive returns, often in two digits, acquiring
companies for all industries have significantly lower returns. The return for acquirers
does not vary as much and seems to accrue around negative to positive five percent for
all industries. In both time periods acquiring companies for all industries except the
financial industry has a negative CAAR. The financial industry enjoy an average
cumulative abnormal return of 7,8% (t-3, t+3) and 9,4% (t-10, t+10). The financial
services industry is also the industry with the highest standard deviation, implying big
differences in return between the companies within the industry. The industrials sector is
the industry with the lowest standard deviation. With a CAAR of -1,3% (t-3, t+3) this
industry is therefore possibly the least favourable industry for companies to go through
with acquisitions as a part of a corporate strategy. The results for the t-tests showed that
the null hypothesis could not be rejected at the 5% significance level for the acquiring
companies in any of the industries examined.
Over the different time periods examined target companies do, over the longer time
period (t-10, t+10), enjoy lower returns with the exception of information technology
where there is a 9,6% difference in return between the two time periods. In opposite for
the target companies there are no substantial difference in the two time periods reviewed
for acquiring companies. For Table 6 it can be seen that acquiring companies within the
consumer staples industry is the ones enjoying the smallest return (CAAR -3%).
The distribution of acquirer and target return is somewhat accurate to what was
expected according to the results of (Huyghebeart et al., 2013) research that predicted
that the information technology sector, followed by the consumer staples and industrials
sector would be the industries with the highest value creation among the transactions.

33
8 References
Ahuja, Gautam, and Riitta Katila. "Technological acquisitions and the innovation
performance of acquiring firms: A longitudinal study." Strategic Management Journal
22.3 (2001): 197-220.
Andrade, Gregor, and Erik Stafford. "Investigating the economic role of mergers."
Journal of Corporate Finance 10.1 (2004): 1-36.
Berger, Allen N., and Timothy H. Hannan. "The efficiency cost of market power in the
banking industry: A test of the “quiet life” and related hypotheses." Review of
Economics and Statistics 80.3 (1998): 454-465.
Brage, V. & Eckerstom, G. Measuring Value Creation in M& As- A comparison
between Related and unrelated firms. Göteborg University, School of Business
Economics and Law.
Bruner, Robert F. "Does M&A pay? A survey of evidence for the decision-maker."
Journal of Applied Finance 12.1 (2002): 48-68.
Bryman, Alan. Social research methods. Oxford university press, 2008.
Campa, José Manuel, and Ignacio Hernando. "Shareholder value creation in European
M&As." European Financial Management 10.1 (2004): 47-81.
Cowan, Arnold R., and Anne Sergeant. "Interacting biases, non-normal return
distributions and the performance of tests for long-horizon event studies." Journal of
banking & finance 25.4 (2001): 741-765.
Datta, Deepak K., George E. Pinches, and V. K. Narayanan. "Factors influencing wealth
creation from mergers and acquisitions: A meta‐analysis." Strategic management journal
13.1 (1992): 67-84.
Djurfelt, Göranm Larsson, Rolf & Stjärnhagen, Ola Statistisk verktygslåda -
samhällsvetenskaplig orsaksanalys med kvantitativa metoder. Lund: Studentlitteratur,
2003.
Dyer, Jeffrey H., Prashant Kale, and Harbir Singh. "When to ally and when to acquire."
Harvard business review 82.7-8 (2004): 109-115.
Eckbo, B. Espen, and Karin S. Thorburn. "Gains to bidder firms revisited: domestic and
foreign acquisitions in Canada." Journal of Financial and Quantitative Analysis 35.01
(2000): 1-25.
Focarelli, Dario, and Alberto Franco Pozzolo. "The patterns of cross-border bank
mergers and shareholdings in OECD countries." Journal of banking & Finance 25.12
(2001): 2305-2337.

34
Frésard, Laurent, Gerard Hoberg, and Gordon Phillips. "The Incentives for Vertical
Mergers and Vertical Integration." Available at SSRN 2242425 (2013).
Frey, Rainer, and Katrin Hussinger. "European market integration through technology-
driven M&As." Applied Economics 43.17 (2011): 2143-2153.
Goold, Michael, and Andrew Campbell. "Desperately seeking synergy." Harvard
Business Review 76.5 (1998): 131-143.
Gross, Stephan KH, and Hagen Lindstädt. "Horizontal and vertical takeover and sell-off
announcements: Abnormal returns differ by industry." Corporate Ownership (2005): 23-
30.
Harford, Jarrad. "What drives merger waves?." Journal of financial economics 77.3
(2005): 529-560.
Hitt, M., Harrison, J., Ireland, R. D., & Best, A. (1998). Attributes of successful and
unsuccessful acquisitions of US firms. British Journal of Management, 9(2), 91-114.
Hou, Kewei, and David T. Robinson. "Industry concentration and average stock returns."
The Journal of Finance 61.4 (2006): 1927-1956.
Huyghebaert, Nancy, and Mathieu Luypaert. "Value creation and division of gains in
horizontal acquisitions in Europe: the role of industry conditions." Applied Economics
45.14 (2013): 1819-1833.
Jing, FAN Cong-lai YUAN. "An Empirical Analysis on M&A Performance of the Public
Companies of the Growing, Mature and Declining Industries." China Industrial
Economy 8 (2002): 008.
Lehto, Eero Lauri Oskari, and Markku Olavi Lehtoranta. "Becoming an acquirer and
becoming acquired." Technological Forecasting and Social Change 71.6 (2004): 635-
650.
Malkiel, Burton G., and Eugene F. Fama. "Efficient capital markets: A review of theory
and empirical work*." The journal of Finance 25.2 (1970): 383-417.
McGraw Hill Financials. (2014) S&P Dow Jones Indices. [Online] Available from:
http://us.spindices.com/indices/equity/sp-global-1200. [Accessed: May 9 2014]
Maquieria, C., W. Megginson, and L. Nail,. “Wealth Creation versus wealth
redistributions in pure stock-for-stock mergers,” Journal of Financial Economics,
48(April 1998):3-33.
Marks, Mitchell Lee, and Philip H. Mirvis. "Making mergers and acquisitions work:
Strategic and psychological preparation." The Academy of Management Executive 15.2
(2001): 80-92.

35
Mitchell, Mark L., and J. Harold Mulherin. "The impact of industry shocks on takeover
and restructuring activity." Journal of financial economics 41.2 (1996): 193-229.
Porter, Michael E. Competitive strategy: Techniques for analyzing industries and
competitors. Simon and Schuster, 1980.
PwC. (2014) Engineering growth: First quarter 2014 engineering & construction
industry mergers and acquisitions analysis. [Online] Available from:
http://www.pwc.com/us/en/industrial-products/publications/engineering-growth.jhtml.
[Accessed May 27 2014]
Schoenberg, Richard, and Richard Reeves. "What determines acquisition activity within
an industry?." European Management Journal 17.1 (1999): 93-98.
Seth, Anju. "Sources of value creation in acquisitions: an empirical investigation."
Strategic Management Journal 11.6 (1990): 431-446.
Shahrur, Husayn. "Industry structure and horizontal takeovers: Analysis of wealth effects
on rivals, suppliers, and corporate customers." Journal of Financial Economics 76.1
(2005): 61-98.
Sudarsanam, Sudi, and Ashraf A. Mahate. "Glamour Acquirers, Method of Payment and
Post-acquisition Performance: The UK Evidence." Journal of Business Finance &
Accounting 30.12 (2003): 299-342.
Sudarsanam, P. Sudi, and P. Sudi Sudarsanam. The essence of mergers and acquisitions.
Vol. 230. Hemel Hempstead: Prentice Hall, 1995.
Zephyr (2013). Yearly M&A report, 2013. [Online] Available from:
http://www.mandaportal.com/Content/MA-Reports/Half-yearly-Annual. [Accessed May
27 2014]

Stockholm University School of Business
106 91 Stockholm
Telephone: +46 (0)8 16 20 00
www.fek.su.se