shaping the next one hundred years - rand corporation
TRANSCRIPT

Robert J. LempertSteven W. PopperSteven C. Bankes
New Methods forQuantitative, Long-Term PolicyAnalysis
Shapingthe Next One Hundred Years
Prepared for

This research in the public interest was supported by a generousgrant from Frederick S. Pardee to develop new methods forconducting longer term global policy and improving the futurehuman condition.
RAND is a nonprofit institution that helps improve policy anddecisionmaking through research and analysis. RAND® is aregistered trademark. RAND’s publications do not necessarily reflectthe opinions or policies of its research sponsors.
© Copyright 2003 RAND
All rights reserved. No part of this book may be reproduced in anyform by any electronic or mechanical means (includingphotocopying, recording, or information storage and retrieval)without permission in writing from RAND.
Published 2003 by RAND1700 Main Street, P.O. Box 2138, Santa Monica, CA 90407-2138
1200 South Hayes Street, Arlington, VA 22202-5050201 North Craig Street, Suite 202, Pittsburgh, PA 15213-1516
RAND URL: http://www.rand.org/To order RAND documents or to obtain additional information,
contact Distribution Services: Telephone: (310) 451-7002; Fax: (310) 451-6915; Email: [email protected]
Library of Congress Cataloging-in-Publication Data
Lempert, Robert J.Shaping the next one hundred years : new methods for quantitative, long-term
policy analysis / Robert J. Lempert, Steven W. Popper, Steven C. Bankes.p. cm.
“MR-1626.”Includes bibliographic references.ISBN 0-8330-3275-5 (pbk.)1. System analysis. 2. Decision making. 3. Information technology. I. Popper,
Steven W., 1953– II. Bankes, Steven C. III.Title.
T57.6 .L46 2003320'.6'0113—dc21
2003012438
Cover design by Barbara Angell Caslon

iii
PREFACE
Is there any practical value in considering the long term—25, 50, or100 years into the future—when debating policy choices today? If so,how is it possible to use these considerations to actually inform theactions we will take in the near term? This study is an initial effort bythe RAND Pardee Center to frame a role for long-term policy analy-sis. It considers the history of attempts to treat the future in an ana-lytical manner and then offers a new methodology, based on recentadvances in computer science, that shows promise for making suchinquiries both practicable and useful. It suggests a new approach forsystematic consideration of a multiplicity of plausible futures in away that will enhance our ability to make good decisions today in theface of deep uncertainty.
This research was undertaken through a generous gift from FrederickS. Pardee to develop improved means of systematically dealing withthe uncertainties of a longer-range future. This report should be ofinterest to decisionmakers concerned with the long-term effects oftheir actions, those who conduct long-term planning, and anyonewho deals more generally with decisionmaking under deep uncer-tainty. The report should also interest those concerned with the lat-est advances in computer technology in support of human reasoningand understanding.
ABOUT THE RAND PARDEE CENTER
The RAND Frederick S. Pardee Center for Longer Range Global Policyand the Future Human Condition was established in 2001 through agift from Frederick S. Pardee. The Pardee Center seeks to enhance

iv Shaping the Next One Hundred Years
the overall future quality and condition of human life by improvinglonger-range global policy and long-term policy analysis. In carryingout this mission, the center concentrates on five broad areas:
• Developing new methodologies, or refining existing ones, toimprove thinking about the long-range effects of policy options.
• Developing improved measures of human progress on a globalscale.
• Identifying policy issues with important implications for thelong-term future—i.e., 35 to 200 years ahead.
• Using longer-range policy analysis and measures of globalprogress to improve near-term decisions that have long-termimpact.
• Collaborating with like-minded institutions and colleagues,including international organizations, academic research cen-ters, futures societies, and individuals around the globe.
Inquiries regarding the RAND Pardee Center may be directed to
James A. DewarDirectorRAND Pardee Center1700 Main StreetSanta Monica, CA 90401Phone: (310) 393-0411 extension 7554E-mail: [email protected] site: http://www.rand.org/pardee/

v
CONTENTS
Preface ......................................... iii
Figures ......................................... vii
Tables.......................................... ix
Summary ....................................... xi
Acknowledgments................................. xix
Abbreviations .................................... xxi
Chapter OneTHE CHALLENGE OF LONG-TERM POLICY ANALYSIS .. 1Quantitative LTPA May Now Be Possible ............. 3The Challenge of Global Sustainable Development...... 7Surprise: The Constant Element ................... 8Organization of This Report....................... 8
Chapter TwoA HISTORY OF THINKING ABOUT THE FUTURE ...... 11Narratives: Mirrors of the Present, Visions of the
Future................................... 12Group Narrative Processes: Delphi and Foresight ...... 16Simulation Modeling ........................... 20Formal Decision Analysis Under Conditions of Deep
Uncertainty............................... 25Scenarios: Multiple Views of the Futures ............. 29Assessing the State of the Art ...................... 36
Chapter ThreeROBUST DECISIONMAKING ..................... 39

vi Shaping the Next One Hundred Years
Decisionmaking Under Conditions of DeepUncertainty................................... 40Consider Ensembles of Scenarios .................. 45Seek Robust Strategies .......................... 52Employ Adaptive Strategies ....................... 57Combine Machine and Human Capabilities
Interactively .............................. 62Concluding Thoughts ........................... 66
Chapter FourA FRAMEWORK FOR SCENARIO GENERATION........ 69The Challenge of Global Environmental Sustainability ... 69The “XLRM” Framework ......................... 70
Chapter FiveIMPLEMENTING ROBUST DECISIONMAKING ........ 87Overview: Interactive Analysis of Sustainable
Development.............................. 87Landscapes of Plausible Futures ................... 91No Fixed Strategy Is Robust ....................... 96Exploring Near-Term Milestones................... 103Identifying a Robust Strategy...................... 110Characterizing Irreducible Risks ................... 117Confronting Surprise in Sustainable Development ...... 121
Chapter SixPOLICY-RELEVANT LONG-TERM POLICY ANALYSIS.... 125Building Policy-Relevant Scenario Generators ......... 126Improved Navigation ........................... 131A Diversity of Measures and Values ................. 135Engaging the Community of Stakeholders ............ 137Improving Long-Term Decisionmaking .............. 141
Chapter SevenCONCLUSION: MOVING PAST FAMILIAR SHORES..... 145
Appendix
A. DESCRIPTION OF THE WONDERLAND SCENARIOGENERATOR.................................. 149
B. ASSESSING ROBUST STRATEGIES ................. 165
Bibliography..................................... 179

vii
FIGURES
2.1. Global Trajectories for Per-Capita Income andPopulation in Six GSG Scenarios ................ 34
3.1. Integration of Computers and Humans in LTPA ..... 644.1. Two-Period Decision with Fixed Near-Term
Strategy .................................. 835.1. Landscape of Plausible Futures as a Function of
Global Economic Growth Rates and Decoupling Ratesover the Twenty-First Century .................. 92
5.2. Comparative Trajectories of Output per Capita andPopulation for Three Futures for the Stay the CourseStrategy .................................. 94
5.3. Comparative Trajectories of Output per Capita andPopulation for Three Futures for the Slight Speed-UpStrategy .................................. 95
5.4. Performance of Slight Speed-Up Near-Term Strategyover a Landscape of Plausible Futures Using theNorth Quasi-HDI Measure .................... 97
5.5. Performance of Slight Speed-Up Near-Term Strategyover a Landscape of Plausible Futures Using WorldGreen Measure ............................. 99
5.6. Performance of Stay the Course Near-Term Strategyover a Landscape of Plausible Futures Using WorldGreen Measure ............................. 99
5.7. Performance of Crash Effort Near-Term Strategy overa Landscape of Plausible Futures Using North Quasi-HDI and World Green HDI Measures............. 100
5.8. Milestone Strategy .......................... 104

viii Shaping the Next One Hundred Years
5.9. Performance of No Increase Near-Term MilestoneStrategy over a Landscape of Plausible Futures UsingNorth Quasi-HDI and World Green Measure ....... 105
5.10. Performance of No Increase Strategy over aLandscape of Plausible Futures, Including NoIncrease’s Worst-Case Future .................. 107
5.11. Comparative Trajectories of Output per Capita for theTwenty-First Century for the No Increase and M0XStrategies in the No Increase Worst-Case Future .... 109
5.12. Safety Valve Strategy ......................... 1115.13. Performance of Safety Valve Near-Term Strategy over
a Landscape of Plausible Futures Using North Quasi-HDI and World Green Measures ................ 112
5.14. Performance of Safety Valve Near-Term Strategy overa Landscape of Plausible Futures, Including SafetyValve’s Worst Case .......................... 113
5.15. Trajectories of Output per Capita in the South for theSafety Valve and M22 Strategy in the Safety Valve’sWorst-Case Future .......................... 114
5.16. Trajectories of Death Rates in the South for the SafetyValve and M22 Strategy in the Safety Valve’s Worst-Case Future................................ 115
5.17. Expected Regret of the Safety Valve Strategy and ItsBest Alternative in Futures Where Safety ValvePerforms Worst............................. 120
5.18. Performance of the Safety Valve Strategy over a Rangeof Surprising Futures ........................ 123
6.1. Distribution of Regret for Various Milestone andContingent Strategies ........................ 132
6.2. Results of Sobol Global Sensitivity Analysis on the NoIncrease and Safety Valve Strategies.............. 134
B.1. Performance of Safety Valve Strategy over aLandscape of Plausible Futures Using the WorldGreen-HDI Measure ......................... 174
B.2. Optimum Strategy over a Landscape of PlausibleFutures................................... 176

ix
TABLES
4.1. Key Factors Used to Construct Ensembles ofSustainability Scenarios ...................... 72
4.2. Four Measures Used to Assess Ensemble ofSustainability Scenarios ...................... 80
4.3. World Quasi-HDI Measure Applied to PastCenturies ................................. 81
A.1. Uncertain Parameters in Wonderland ScenarioGenerator ................................. 160
A.2. Parameter Values Defining Four Measures Used inThis Report................................ 163
B.1. Parameters Describing GSG Scenarios withWonderland Scenario Generator ................ 166
B.2. Fixed Near-Term Strategies .................... 169B.3. Milestone Strategies Considered in This Report ..... 170B.4. Parameters Describing No Increase and Safety Valve
Worst Cases ............................... 171B.5. Safety Value Strategy and Milestone Strategies to
Which It Is Compared ........................ 175


xi
SUMMARY
New analytic methods enabled by the capabilities of modern com-puters may radically transform human ability to reason systemati-cally about the long-term future. This opportunity may be fortuitousbecause our world confronts rapid and potentially profound transi-tions driven by social, economic, environmental, and technologicalchange. Intentionally or not, actions taken today will influenceglobal economic development, the world’s trading system, environ-mental protection, the spread of such epidemics as AIDS, the fightagainst terrorism, and the handling of new biological and genetictechnologies. These actions may have far-reaching effects onwhether the twenty-first century offers peace and prosperity or crisisand collapse.
In many areas of human endeavor, it would be derelict to makeimportant decisions without a systematic analysis of availableoptions. Powerful analytic tools now exist to help assess risks andimprove decisionmaking in business, government, and private life.But almost universally, systematic quantitative analysis rarelyextends more than a few decades into the future. Analysts and deci-sionmakers are neither ignorant of nor indifferent to the importanceof considering the long term. However, well-publicized failures ofprediction—from the Club of Rome’s “Limits to Growth” study to theunexpected, sudden, and peaceful end of the Cold War—have donemuch to discourage this pursuit. Systematic assessments of thelong-term future are rare because few people believe that they can beconducted credibly.

xii Shaping the Next One Hundred Years
A PROSTHESIS FOR THE IMAGINATION
This report describes and demonstrates a new, quantitativeapproach to long-term policy analysis (LTPA). These robust deci-sionmaking methods aim to greatly enhance and support humans’innate decisionmaking capabilities with powerful quantitative ana-lytic tools similar to those that have demonstrated unparalleledeffectiveness when applied to more circumscribed decision prob-lems. By reframing the question “What will the long-term futurebring?” as “How can we choose actions today that will be consistentwith our long-term interests?” robust decisionmaking can harnessthe heretofore unavailable capabilities of modern computers tograpple directly with the inherent difficulty of accurate long-termprediction that has bedeviled previous approaches to LTPA.
This report views long-term policy analysis as a way to help policy-makers whose actions may have significant implications decadesinto the future make systematic, well-informed decisions. In thepast, such decisionmakers, using experience, a variety of heuristics,rules of thumb, and perhaps some luck, have occasionally met withimpressive success, for example, in establishing the West’s Cold Warcontainment strategy or in promoting the first U.S. transcontinentalrailroads to forge a continent-sized industrial economy. Providinganalytic support to improve such decisionmaking must contend witha key defining feature of the long term—that it will unavoidably andsignificantly be influenced by decisions made by people who live inthat future. Thus, this study defines the aim of LTPA as identifying,assessing and choosing among near-term actions that shapeoptions available to future generations.
LTPA is an important example of a class of problems requiring deci-sionmaking under conditions of deep uncertainty—that is, whereanalysts do not know, or the parties to a decision cannot agree on, (1)the appropriate conceptual models that describe the relationshipsamong the key driving forces that will shape the long-term future, (2)the probability distributions used to represent uncertainty about keyvariables and parameters in the mathematical representations ofthese conceptual models, and/or (3) how to value the desirability ofalternative outcomes. In particular, the long-term future may bedominated by factors that are very different from the current drivers

Summary xiii
and hard to imagine based on today’s experiences. Meaningful LTPAmust confront this potential for surprise.
Advances in LTPA rest on solid foundations. Over the centuries,humans have used many means to consider both the long-termfuture and how their actions might affect it. Narratives about thefuture, whether fictional or historical, are unmatched in their abilityto help humans viscerally imagine a future different from the pres-ent. Such group methods as Delphi and Foresight exploit the valu-able information often best gathered through discussions amonggroups of individuals. Analytic methods—e.g., simulation modelsand formal decision analyses—help correct the numerous fallacies towhich human reasoning is prone. Scenario planning provides aframework for what if–ing that stresses the importance of multipleviews of the future in exchanging information about uncertaintyamong parties to a decision. Despite this rich legacy, all these tradi-tional methods founder on the same shoals. The long-term futurepresents a vast multiplicity of plausible futures. Any one or smallnumber of stories about the future is bound to be wrong. Any policycarefully optimized to address a “best guess” forecast or well-under-stood risks may fail in the face of inevitable surprise.
This study proposes four key elements of successful LTPA:
• Consider large ensembles (hundreds to millions) of scenarios.
• Seek robust, not optimal, strategies.
• Achieve robustness with adaptivity.
• Design analysis for interactive exploration of the multiplicity ofplausible futures.
These elements are implemented through an iterative process inwhich the computer helps humans create a large ensemble of plau-sible scenarios, where each scenario represents one guess about howthe world works (a future state of the world) and one choice of manyalternative strategies that might be adopted to influence outcomes.Ideally, such ensembles will contain a sufficiently wide range ofplausible futures that one will match whatever future, surprising ornot, does occur—at least close enough for the purposes of craftingpolicies robust against it. Robust decisionmaking then exploits theinterplay between interactive, computer-generated visualizations

xiv Shaping the Next One Hundred Years
called “landscapes of plausible futures” that help humans formhypotheses about appropriate strategies and computer searchesacross the ensemble that systematically test these hypothesis.
In particular, rather than seeking strategies that are optimal for someset of expectations about the long-term future, this approach seeksnear-term strategies that are robust—i.e., that perform reasonablywell compared to the alternatives across a wide range of plausiblescenarios evaluated using the many value systems held by differentparties to the decision. In practice, robust strategies are often adap-tive; that is, they evolve over time in response to new information.Adaptivity is central to the notion that, when policymakers considerthe long term, they seek to shape the options available to futuregenerations. Robustness reflects both the normative choice and thecriterion many decisionmakers actually use under conditions of deepuncertainty. In addition, the robustness criterion is admirably suitedto the computer-assisted discovery and testing of policy argumentsthat will prove valid over a multiplicity of plausible futures.
At its root, robust decisionmaking combines the best capabilities ofhumans and computers to address decision problems under con-ditions of deep uncertainty. Humans have unparalleled ability torecognize potential patterns, draw inferences, formulate newhypotheses, and intuit potential solutions to seemingly intractableproblems. Humans also possess various sources of knowledge—tacit, qualitative, experiential, and pragmatic—that are not easilyrepresented in traditional quantitative formalisms. Humans alsoexcel, however, at neglecting inconvenient facts and at convincingthemselves to accept arguments that are demonstrably false. Incontrast, computers excel at handling large amounts of quantitativedata. They can project without error or bias the implications of thoseassumptions no matter how long or complex the causal chains, andthey can search without prejudice for counterexamples to cherishedhypotheses. Working interactively with computers, humans can dis-cover and test hypotheses about the most robust strategies. Thus,computer-guided exploration of scenario and decision spaces canprovide a prosthesis for the imagination, helping humans, workingindividually or in groups, to discover adaptive near-term strategiesthat are robust over large ensembles of plausible futures.

Summary xv
DEMONSTRATING ROBUST DECISIONMAKING
This study demonstrates new robust decision methods on anarchetypal problem in long-term policy analysis—that of global sus-tainable development. This topic is likely to be crucially important inthe twenty-first century. It is fraught with deep uncertainty. It incor-porates an almost unmanageably wide range of issues, and it engagesan equally wide range of stakeholders with diverse values and beliefs.This sustainable-development example demonstrates the potentialof robust decisionmaking to help humans reason systematicallyabout the long-term implications of near-term actions, to exploitavailable information efficiently, and to craft potentially imple-mentable policy options that take into account the values and beliefsof a wide variety of stakeholders.
The project team began by reviewing and organizing the relevantbackground information, particularly from the extensive literatureon sustainability. The team also assembled a group of RAND expertsto act as surrogate stakeholders representing a range of opinions inthe sustainability debate. To help guide the process of elicitation anddiscovery and to serve as an intellectual bookkeeping mechanism,the study employed an “XLRM” framework often used in this type ofanalysis The key terms are defined below.1
• Policy levers (“L”) are near-term actions that, in various combi-nations, comprise the alternative strategies decisionmakers wantto explore.
• Exogenous uncertainties (“X”) are factors outside the control ofdecisionmakers that may nonetheless prove important indetermining the success of their strategies.
• Measures (“M”) are the performance standards that decision-makers and other interested communities would use to rank thedesirability of various scenarios.
• Relationships (“R”) are potential ways in which the future, and inparticular those attributes addressed by the measures, evolve
______________1This discussion continues the long-standing practice of ordering the letters XLRM.However, in this instance, a clearer exposition was achieved by presenting the factorsin a different order.

xvi Shaping the Next One Hundred Years
over time based on the decisionmakers’ choices of levers and themanifestation of the uncertainties. A particular choice of Rs andXs represents a future state of the world.
In the approach described in this report, the first three factors—near-term actions (L), uncertainties (X), and performance measures (M)—are tied together by the fourth (R), which represents the possiblerelationships among them. This decision-support system thusbecomes a tool for producing interactive visual displays (i.e., land-scapes of plausible futures) of the high-dimensional decision spacesinherent in LTPA problems. The system employs two distinct typesof software:
• Exploratory modeling software enables users to navigate throughthe large numbers of scenarios required to make up a scenarioensemble and to formulate rigorous arguments about policychoices based on these explorations.
• A scenario generator uses the relationship among the variables tocreate members of scenario ensembles. In contrast to a tradi-tional model that is typically designed to produce a com-paratively small number of predictive conclusions, a scenariogenerator should yield a full range of plausible alternatives .
In combination, these two types of software enable humans to workinteractively with computers to discover and test hypotheses aboutrobust strategies.
The robust decision analysis reported in this study begins with adiverse scenario ensemble based on XLRM information. A modifiedversion of the "Wonderland" system dynamics model functions asthe scenario generator. The analysis examines and rejects a series ofcandidate robust strategies and, by appropriate use of near-termadaptivity, it eventually arrives at a promising near-term policyoption. The robust strategy sets near-term (10-year) milestones forenvironmental performance and adjusts policies annually to reachsuch milestones, contingent on cost constraints. Compared to thealternatives, it performs well over a wide range of plausible futures,using four different value systems for ranking desirable futures.
A steering group of surrogate stakeholders was then challenged toimagine surprises representing distinct breaks with current trends or

Summary xvii
expectations. These surprises were added to the scenario generatorand the policy options stress-tested against them. The analysis con-cludes by characterizing the wager decisionmakers would make ifthey choose not to hedge against those few futures for which the pro-posed robust strategy is not an adequate response. This iterativeprocess thus provides a template for designing and testing robuststrategies and characterizing the remaining “imponderable” uncer-tainties to which they may be vulnerable.
SEIZING THE NEW OPPORTUNITIES FOR LTPA
This report does not provide specific policy recommendations for thechallenge of sustainable development. The analysis involves neitherthe level of detail nor the level of stakeholder participation necessaryfor policy results that can be acted on. Rather, the study aims todescribe the new analytic capabilities that have become available tosupport long-term decisionmaking. The report concludes with adescription of how future work might improve on the robust decisionapproach to LTPA as well as some of the challenges and potentialsuggested by this limited demonstration. In particular, policy-rele-vant LTPA will require improved scenario generators, better algo-rithms to support navigation through large scenario ensembles,improved treatment of measures of the future human condition, andrefined protocols for engaging the parties in a decision in a robustpolicymaking exercise and widely disseminating the results.
The lack of systematic, quantitative tools to assess how today’sactions affect the long-term future represents a significant missedopportunity. It creates a social context where values relating to long-term consequences cannot be voiced easily because they cannot beconnected to any practical action. Across society, near-term resultsare often emphasized at the expense of long-term goals. However,our greatest potential influence for shaping the future may often beprecisely over those time scales where our gaze is most dim. By itsnature, where the short term is predictable and subject to forces wecan quantify, we may have little effect. Where the future is ill-defined, hardest to see, and pregnant with possibilities, our actionsmay well have their largest influence in shaping it.
Only in the last few years have computers acquired the powerto support directly the patterns of thought and reason humans

xviii Shaping the Next One Hundred Years
traditionally and successfully use to create strategies in the face ofunpredictable, deeply uncertain futures. In today’s era of radical andrapid change, immense possibilities, and great dangers, it is time toharness these new capabilities to help shape the long-term future.

xix
ACKNOWLEDGMENTS
We have spent much of the last decade struggling with the relatedquestions of how to craft methods for decisionmaking under deepuncertainty and finding the value of computer simulations in situa-tions where it is obvious any predictions will be wrong. Along theway we have drawn inspiration and good advice from many col-leagues at RAND and elsewhere, including Carl Builder, ThomasSchelling, James Hodges, John Adams, David Robalino, and MichaelSchlesinger. One of the great pleasures of this particular project hasbeen the much-welcomed opportunity to work closely with JamesDewar. His seminal work on Assumption Based Planning providesone key inspiration for our work with robust decision methods, andhis input during this project has been that of a thoughtful, encourag-ing, and engaged colleague.
Frederick Pardee’s passion for improving the long-term futurehuman condition provided the support for this work. Fred has madean important and astute choice for his philanthropy. He under-stands that the overwhelming focus of government, business, andmost foundations on the short term may blind society to some of themost important and much-needed actions we could take today toshape the decades ahead. We hope that use of the robust decisionmethods we describe in this study may make systematic and effectivethinking about the long-term future far more common and enablemany to blaze the path that Fred has envisioned.
Many colleagues have contributed to the work described here.RAND graduate fellow Kateryna Fonkych helped with explorations ofthe International Futures and Wonderland scenario generators, fel-

xx Shaping the Next One Hundred
low David Groves assisted with data analysis, and fellow Joseph Hen-drickson helped with the analytic methods for navigating throughscenario spaces discussed in Chapter Six. Our advisory group—Robert Anderson, Sandra Berry, Robert Klitgaard, Eric Larson, JuliaLowell, Kevin McCarthy, David Ronfeldt, and George Vernez—gavegenerously of their time and provided numerous inputs of valuableadvice. Our reviewers, William Butz, Al Hammond, and Bruce Mur-ray, offered well-targeted suggestions that did much to improve ourmanuscript. Caroline Wagner offered many probing questions as weinitially formulated this effort.
Judy Larson proved invaluable in shepherding three authors withdifferent styles toward a unified prose and in gathering 10 years ofmusings into a single story. Our editor, Dan Sheehan, helped turnWord files into a published document, and Mary Wrazen helpedmold computer printouts into presentable graphics.
Additional funding for the analytic methodology development wasprovided by the U.S. National Science Foundation under Grant BCS-9980337 and the Defense Advanced Projects Research Agency.Evolving Logic provided the CARs™ software used to support thisproject.
We hope that this work helps many others launch their own explo-rations into how today’s actions can best shape our long-term future.We accept full and sole responsibility for any errors remaining in thisreport.

xxi
ABBREVIATIONS
CARsTM Computer-Assisted Reasoning® system by EvolvingLogic
CPU Central Processing Unit
GDP Gross domestic product
GSG Global Scenarios Group
HDI Human Development Index
ICIS International Centre for Integrative Studies
ICSU International Council of Scientific Unions
IFs International Futures computer simulation by BarryHughes
IPCC Intergovernmental Panel on Climate Change
LTPA Long-term policy analysis
NISTEP National Institute of Science and Technology Policy
NRC Nuclear Regulatory Commission
OECD Organization for Economic Cooperation andDevelopment
PPP Purchasing power parity
RAPTM Robust Adaptive Planning by Evolving Logic
SRES Special Report on Emissions Scenarios
UNDP United Nations Development Programme
XLRM A framework that uses exogenous uncertainties, policylevers, relationships, and measures


1
Chapter One
THE CHALLENGE OF LONG-TERM POLICY ANALYSIS
Our world confronts rapid and potentially profound transitionsdriven by social, economic, environmental, and technologicalchange. Countries that have achieved political stability and wealthcoexist uneasily among regions with fragile governments andeconomies whose people often live in dire poverty. Pressures growon the natural environment. Technology has created tremendousopportunities but has also unleashed awesome destructive powermore readily accessible than imagined a few decades ago. It isincreasingly clear that today’s decisions could play a decisive role indetermining whether the twenty-first century offers peace and pros-perity or crisis and collapse.
In many areas of human endeavor one would be derelict in makingimportant decisions without undertaking a systematic analysis of theavailable options. Before investing in a new business venture, man-aging a large financial portfolio, producing a new automobile,deploying a modern army, or crafting a nation’s economic policy onewould identify a range of alternatives and use available informationto make quantitative comparisons of the likely consequences of eachalternative.
However, beyond a certain time horizon quantitative analysis israrely attempted. For example, quantitative modeling of nationaleconomic performance informs fiscal policy only a few quartersaway. In business planning, time frames longer than one year areconsidered strategic. Military planning looks farther ahead, yetdefense analysis directed more than 10 years into the future is rareand longer than 15 years is virtually nonexistent. Civic planning

2 Shaping the Next One Hundred Years
sometimes, but not often, encompasses two decades. Official gov-ernment forecasts of energy production and consumption rarelyextend beyond 20 years.
This is not to say that analysts and decisionmakers are ignorant of orindifferent to the importance of planning for the long term. In somecases, people have taken actions intended to shape the long-termfuture and have on occasion met with impressive success. At thestart of the Cold War, for example, the United States and its allies laidout a plan to defeat Soviet Communism by containing its expansionuntil the system ultimately collapsed from its own internal contra-dictions (Kennan, 1947). This policy was often implemented informs that differed from the original design, was on occasion invidi-ous to some developing countries’ aspirations for self-determination,and produced moments when the world was closer to nuclear warthan anyone could wish. Nonetheless, through a combination ofgood planning, skillful implementation, and luck, the policy workedafter 40 years almost exactly as intended. Similarly, U.S. policy-makers in the late 1860s offered massive financial incentives forentrepreneurs to build risky and expensive rail lines across NorthAmerica (Bain, 1999). While this policy launched a process rife withamazing determination, thievery, heroism, cruelty, and corruption,over the following decades it accomplished precisely what wasintended. The transcontinental railroad stitched together a nationrecently shattered by civil war and enabled the world’s first, and stillthe strongest, continental industrial economy.
Of course, in many cases decisionmakers deem potential long-termbenefits less important than such immediate concerns as the resultsof the next election or an upcoming quarterly report to shareholders.But even when decisionmakers obviously value the long term, theyare often uncertain about how to translate their concerns into usefulaction. Broadly speaking, people do not conduct systematic, long-term policy analysis (LTPA) because no one knows how to do itcredibly.
The inability of the policy and analytic communities to plan for thelong term in a manner perceived as rigorous, credible, and demon-strably useful has major consequences for society. The lengthy his-tory of failed forecasts encourages a general belief that it is pointlessto think about a far future that cannot be predicted with any degree

The Challenge of Long-Term Policy Analysis 3
of assurance. This creates a social context in which values relating tolong-term consequences cannot be voiced easily because they can-not be connected to any practical action. Thus, there is a generaltendency across the social spectrum to emphasize near-term resultsat the expense of long-term goals. Paradoxically, people often have agreat deal of analytic support for short-term decisions, many ofwhich may be easily adjusted when new information suggests a needto change course. When they make decisions with long-term conse-quences, potentially shaping the world they and their descendantswill occupy for decades, people are, in effect, flying blind.
QUANTITATIVE LTPA MAY NOW BE POSSIBLE
For the purposes of this report, long-term policymakers are thosewho consider the implications of their actions stretching out manydecades into the future. Stated another way, long-term policy-making takes place when the menu of near-term policy optionsconsidered by decisionmakers and the choices they make from thatmenu are significantly affected by events that may occur 30 or moreyears into the future.
LTPA helps policymakers make systematic, well-informed, long-termpolicy decisions. As discussed in later chapters, a key defining fea-ture of the long term is that it will be influenced unavoidably andsignificantly by decisions made by people in the future. Thus, LTPAaims to identify, assess, and choose among near-term actions thatshape options available to future generations.
There are many types of LTPA. In this report, we focus on quantita-tive methods similar to those that have proved so indispensable forother types of decision problems—that is, ones that rely on data andknown laws of logical, physical, and social behavior expressed inmathematical form.
Deep Uncertainty Challenges LTPA
LTPA is an important example of a class of problems requiring deci-sionmaking under conditions of deep uncertainty. Deep uncertaintyexists when analysts do not know, or the parties to a decision cannotagree on, (1) the appropriate models to describe the interactions

4 Shaping the Next One Hundred Years
among a system’s variables, (2) the probability distributions to repre-sent uncertainty about key variables and parameters in the models,and/or (3) how to value the desirability of alternative outcomes.1
Humans often confront conditions of deep uncertainty. They fre-quently respond successfully, provided that their intuition about thesystem in question works reasonably well. Often, decisionmakersidentify patterns based on a wealth of past experience that suggest anappropriate response to some new situation. For instance, seasoneddecisionmakers, such as fire chiefs arriving at the scene of a blaze,will rapidly classify a situation as some familiar type: Is this a casewhere people may be trapped inside a building, where the buildingmay collapse, where the fire can be extinguished, or where it canmerely be contained? Next, they choose an appropriate course ofaction and run a mental simulation to test their plan against the par-ticulars of the situation before them (Klein, 1998).2 Humans mayalso employ heuristics, or rules of thumb, to serve as quick surro-gates for complex calculations. Many firms will adjust the hurdlerate for the return on investment required to go forward with a largecapital project in response to changes in market opportunities or thestate of the economy (Lempert et al., 2002). Humans have alsodeveloped iterative, sometimes collaborative processes to produceand test plans under such conditions and they likewise have the pro-cedures and institutions for implementing them. Capitalizing on afacility for storytelling, U.S. officials during the Cuban Missile Crisisdebated alternative courses of action by challenging each other with
______________1A number of different terms are used for concepts similar to what we define as deepuncertainty. Knight (1921) contrasted risk and uncertainty, using the latter to denoteunknown factors poorly described by quantifiable probabilities. Ellsberg’s (1961)paradox addresses conditions of ambiguity where the axioms of standard probabilisticdecision theory need not hold. There is an increasing literature on ambiguous andimprecise probabilities (de Cooman, Fine, and Seidenfeld, 2001). Ben-Haim’s (2001)Info-Gap approach addresses conditions of what he calls severe uncertainty. We takethe phrase “‘deep”’ uncertainty from a presentation by Professor Kenneth Arrow(2001) describing the situation faced by climate change policymakers. The precisedefinition of this term is our own.2This report’s definition of long-term policymaking assumes that decisionmakers areoperating in a mode in which they lay out several options, assess their consequences,and choose among them—that is, that they choose differently from the fire chiefdescribed here. Nonetheless, the quantitative methods proposed in this study buildon this human ability to draw inferences from recognized patterns and test strategieswith mental simulations.

The Challenge of Long-Term Policy Analysis 5
“what if” scenarios to probe for weaknesses in proposed plans(Allison and Zelikow, 1999).3 These processes frequently succeedbecause the best response to deep uncertainty is often a strategythat, rather than being optimized for a particular predicted future, isboth well-hedged against a variety of different futures and is capableof evolving over time as new information becomes available.
The process of mining experiential information and repeatedlyexamining proposed strategies over a range of contingencies can,however, easily break down, especially when humans are con-fronting novel conditions or extensive amounts of information. Insuch situations, humans rapidly lose the ability to track long causallinks or the competing forces that may drive the future along onepath or another. Biases may focus undue attention on expectedfutures or the performance of desired strategies. The human abilityto recognize the correct patterns or trace the “what if” implicationsof proposed plans may quickly prove inadequate to such challenges.
The quantitative tools of decision analysis can help people systemat-ically assess the implications of extensive information and exposebiases and flaws in their reasoning.4 Under conditions of deepuncertainty, however, the application of these traditional quantita-tive methods is fraught with problems. At the most basic level, theprocess may simply terminate in gridlock if more than one individualis responsible for making the decision and the participants cannotagree on the assumptions that will form the basis of the analysis.Even if this hurdle is overcome and candidate strategies are forth-
______________3The main theme of Allison’s famous book, first published in 1972, that “multiple,overlapping, competing conceptual models are the best that the current understand-ing of foreign policy provides” (p. 401) resonates with the type of uncertainty thisstudy report aims to address.4During the past 50 years, statisticians and operations researchers have developed ahost of powerful analytic techniques for addressing uncertainty and risk management.The tools have a wide variety of names, but fundamentally they are based on the con-cepts of Bayesian decision analysis. This approach assumes that knowledge about thefuture may be described with a system model that relates current actions to futureoutcomes and that uncertainty may be described by subjective probability distribu-tions over key input parameters to the model. (For a review of these methods seeMorgan and Henrion, 1990). Many of these tools were originally developed in the1950s when computer power was meager. Thus, to reduce the computational burden,they placed a premium on reducing information about the future into a small set ofbest estimates.
6 Shaping the Next One Hundred Years
coming, a traditional approach is likely to suggest policies that mayprove brittle against surprise or unworkable in application. Mostpolicymakers recognize that a deeply uncertain long-term future issure to offer surprises. Policies put forth by traditional quantitativemethods may perform poorly in the face of unexpected contingen-cies and thus provide a poor guide to shaping the long term.
Modern Computational Power Creates New Possibilities
When human intuition about cause and effect breaks down, mathe-matics and computers can become crucial supports to decisionmak-ing. This report argues that new capabilities conferred by moderncomputers may now enable useful and relevant LTPA. The wide-spread availability of fast processing, virtually unlimited memory,and interactive visualizations can link the innate human capacity forheuristics with powerful quantitative analytic tools that havedemonstrated unparalleled effectiveness in dealing with more cir-cumscribed decision problems.
Traditional quantitative tools use the computer as a calculator.Humans assemble data and assumptions and feed them into thecomputer, which then reports what appears to be the most desirablestrategy based on the limited data provided. This approach encour-ages people to narrow the range of their speculations so that theanalysis can recommend a definitive course of action.
In contrast, new robust decision methods use the computer as aninteractive tool to help people think creatively across the multiplicityof futures they face and come to concrete conclusions about the bestways of shaping those futures to their liking. The computer can thenbe used to test those conclusions systematically against the full rangeof available information.
Under conditions of deep uncertainty, we suggest that analysts usecomputer simulations to generate a large ensemble of plausible sce-narios about the future.5 Each scenario represents one guess about
______________5The methods described in this report can also be used with statistical models, neural-nets, and other mathematical representations that unlike simulation models do notcontain explicit assumptions about causality by using such mathematical repre-sentations to create multiple fits to available data.

The Challenge of Long-Term Policy Analysis 7
how the world works and one choice among many alternativestrategies that might be adopted to influence outcomes. In an inte-grated division of labor, the computer generates visualizations thatallow humans to form hypotheses about their best decisions. As partof the reasoning process, the computer is then used to conductsearches systematically across the scenarios to test these hypotheses.The goal is to discover near-term policy options that are robust overa wide range of futures when assessed with a wide range of values.Robust strategies will often be adaptive—that is, they will be explic-itly designed to evolve over time in response to new information.6
THE CHALLENGE OF GLOBAL SUSTAINABLEDEVELOPMENT
The basic approach described in this report has been applied toproblems in defense, government, and business. Here, we presentthe first complete application to LTPA. In the course of our discus-sion, we will address the typical why and how questions that emergewhen LTPA and strategic decisionmaking intersect: “Why botherlooking at the long-term future when accurate prediction is not pos-sible?” “How can considerations of the long-term future be crediblyincorporated into serious deliberations about policy?”
For purposes of demonstration, this report centers on the issue ofglobal sustainable development, a paradigmatic candidate for LTPA.This topic is likely to be crucially important in the twenty-first cen-tury. It is fraught with deep uncertainty. It incorporates an almostunmanageably wide range of issues, and it engages an equally widerange of stakeholders with diverse values and beliefs. We do notclaim to have solved the problem. Rather, through this example we
______________6 The robust decisionmaking approach is related to the Monte Carlo analyses increas-ingly applied to decisionmaking and risk assessment. As generally employed, MonteCarlo analysis scans over a large number of plausible futures by assuming probabilitydistributions for the uncertainties in key input parameters to some system model. Thecomputer then randomly samples some of these inputs and calculates a probabilitydistribution of outputs. These output distributions may be used to calculate theexpected value of alternative policy options and/or the risk (that is, likelihood) of vari-ous adverse outcomes. In contrast, robust decision approaches use the computer toscan over many plausible futures to identify those that may be particularly useful tohumans in designing and stress testing robust strategies. Monte Carlo sampling is onetype of method that can be used to identify such futures.

8 Shaping the Next One Hundred Years
intend to show that it is possible to reason about the long-termimplications of near-term actions, to exploit available informationefficiently, and to craft potentially implementable policy options thattake into account the values and beliefs of a wide variety of stake-holders.
SURPRISE: THE CONSTANT ELEMENT
One assertion about a deeply uncertain long-term future would seemto be inarguable. No matter how inclusive the information-gatheringefforts, how effective the analytic tools and techniques, how pro-found our insights, and how careful the resulting preparations, thefuture is certain to follow paths and offer events we did not imagine.Surprise takes many forms, all of which tend to disrupt plans andplanning systems.
However, this very certainty of surprise underscores the advantagesof the robust decision method for conducting LTPA. Rather thanoffering predictions about the future, an iterative, interactiveapproach provides the analytic framework for encouraging peopleand groups to think systematically and creatively about potentialsurprises and the possible responses to them (Lempert, Popper, andBankes, 2002). The approach employs a diverse collection ofplausible futures to stress test candidate strategies and to helpdiscover policy options demonstrably robust to known uncertainties.It is through robustness, whether obtained from adaptability orarmoring, that biological organisms and human institutions cansurvive surprises. Although it will never be possible to anticipateevery surprise before it happens, the method described here cangreatly increase the likelihood that policymakers have chosen actionsthat are robust against whatever the future has in store.
ORGANIZATION OF THIS REPORT
This report is intended for decisionmakers who may wish to improvetheir ability to shape the long term, policy analysts who wish toassess a new approach they might wish to add to their toolkit, andthe lay reader interested in new ways to understand and influencethe future we shall all inhabit. As with any such document that

The Challenge of Long-Term Policy Analysis 9
addresses multiple audiences, different readers will find differentparts of greater interest.
Chapter Two briefly surveys the principal means humans have tradi-tionally used to ponder the problem of long-term decisionmaking. Itlays out the common, main stumbling block—an inability to addressa multiplicity of plausible futures. Chapter Three presents a newrobust decisionmaking approach to LTPA. This approach combinesmodern computer technology with the innate capacities of thehuman mind in an iterative process that discovers and repeatedlytests near-term strategies robust against a large ensemble of plausi-ble futures. The information in both of these chapters will, we hope,prove useful to all readers.
Chapters Four and Five describe in detail a demonstration applica-tion of LTPA to the problem of global sustainable development in thetwenty-first century. This demonstration employed only a simple setof models and data and engaged only a small group of surrogatesrepresenting larger stakeholder groups. Chapter Six suggests appro-priate next steps for expanding this demonstration to producepolicy-relevant results. More technical in nature, these chaptersshould prove most relevant to analysts and analytically inclineddecisionmakers whose responsibilities require them, on the onehand, to gather and interpret data and, on the other, to make deci-sions that have implications for the long term.
Chapter Seven offers some summary observations that should beaccessible and helpful to all readers.
The appendices describe the “Wonderland” scenario generator usedin this study, and they also supply supporting detail for the analysispresented in Chapter Five. This nuts-and-bolts material should pri-marily interest members of the modeling and simulation communi-ties and analysts who seek deeper insight into the new approach toLTPA described in this report.

11
Chapter Two
A HISTORY OF THINKING ABOUT THE FUTURE
Interest in the future is not new. Human reason and imaginationhave always compelled people to reflect on the past and speculate onwhat will be. This chapter surveys the principal means humans haveused over the millennia to consider the long-term future and howtheir actions might affect it. This broad view and a focus on theessence of each approach leads to two basic findings. The first pro-vides a source of comfort. Tools that support thinking about thelong-term consequences of today’s actions have a lengthy pedigree.Much has been done, providing a trove of experience and insightfrom which to draw. This rich heritage enables consideration ofmeaningful LTPA and provides the foundation for the rest of the dis-cussion to follow.
At the same time, a second theme suggests the key challenge.Despite the often profound capabilities any traditional method pro-vides, none supports a truly satisfactory LTPA. All suffer a commonweakness—the inability to come to grips with the multiplicity ofalternative plausible futures. Clearly, LTPA must struggle with thiscentral problem no matter what the actual substance of the analysis.
This chapter will briefly highlight the many strengths and this centralweakness of the traditional methods for LTPA. The rest of the reportwill argue that modern computer technology can break throughprevious constraints. In particular, the unprecedented capability ofmodern computers to handle a huge ensemble of plausible futuresoffers a means to exploit the profound insights from the traditionalmethods for thinking about the future and weave them into a power-ful new approach to LTPA.

12 Shaping the Next One Hundred Years
NARRATIVES: MIRRORS OF THE PRESENT, VISIONS OFTHE FUTURE
Narratives about the future are an extraordinarily powerful means ofengaging the imagination. From earliest times, storytelling1 was theprincipal vehicle for developing and communicating explanations ofthe way things were and how they came to be. It was also a tool foraddressing anxiety about matters related to future survival—that is, ifone could somehow acquire information about events that werelikely to occur, it might be possible to prepare for them and toachieve desirable outcomes.
For many centuries, seers and prophets have provided descriptionsof the future to help human beings understand their place in the uni-verse and to suggest codes of behavior and courses of action consis-tent with that knowledge. At the highest levels of policy, this is also acourse prudence suggested. Such narratives often took the forms oforacles. King Saul consulted the Witch of Endor against the specificproscriptions of the prophets of Israel; that he did so indicates boththe power of belief and the anxiety he felt about future outcomes.When the elders of Pericles’s Athens received (typically cryptic) fore-warning of the coming Peloponnesian War from the oracle at Delphi,they were engaging in what the norms of their time held to be duediligence.
Formal fictional forms have considered the future. Written accountsof utopias—ideal societies whose citizens live in a condition of har-mony and well-being—date back at least as far as Plato’s Republic(c. 360 BC). Perhaps the best-known American example of a utopianwork is Edward Bellamy’s Looking Backward, 2000–1887 (publishedin 1888), where a nineteenth century man awakes to find himselftransported to Boston in the year 2000. There he encounters asocialistic society in which inequities of education, health care,
______________1The process of mythmaking is relevant in this context. As noted in the EncyclopediaBritannica, myth “has existed in every society… [and] would seem to be a basic con-stituent of human culture.” Unburdened by a requirement for empirical proof, mythsoffer comprehensive explanations of the natural and supernatural worlds andmankind’s relationship to both. A point of particular interest for readers of this reportis the assertion that “The function of models in physics, biology, medicine, and othersciences resembles that of myths as paradigms, or patterns, of the human world”(http://www.search.eb.com/eb/article?eu=115608>).

A History of Thinking About the Future 13
career opportunity, social status, and material wealth have beenengineered out of existence.2 In more recent times, science fictionhas used the dynamics of social and scientific-technical change as aspringboard to explore the currents propelling people away fromtheir familiar worlds.3
From the perspective of LTPA, the principal value of narratives is thatthey provide a tool to help people confront the long-term future andframe what appear reasonable courses of action by imagining what itmay be like to live there. It is exactly the relationship between near-term actions and long-term consequences that is the crux of LTPA. Aclassic modern example is Rachel Carson’s Silent Spring (1962), avivid depiction of a future world whose wildlife has been extermi-nated by pollution. Silent Spring was a best seller, and it had thedesired effect of helping to spark a worldwide movement in supportof societal action for environmental protection. Yet, like SilentSpring, most futuristic narratives are created with the aim of com-menting on and shaping the present rather than supplying an accu-rate roadmap for what is to come.
Lessons from History Can Help Anchor Speculations Aboutthe Future
The obvious problem with using narratives about the long term toinform present-day actions is that while these stories may offer com-pelling, insightful commentary about current options they are usu-ally wrong in many important details about the future. Cognizant ofthis deficiency, people who wish to develop and communicate theirideas about the future have tried several techniques to improve thenarrative approach to LTPA. Relying on the lessons of history pro-vides one means of grounding narrative predictions. Because, in thebroadest sense, history is the story of the past, it contains a motherlode of data relevant to what may be. It also offers a temporal van-tage point that sets some bounds on the extent to which things maychange or stay the same over decades and centuries.
______________2Of course, not all visions of the future were so blissful nor were planned societies soappealing. Aldous Huxley’s Brave New World (1932) and George Orwell’s 1984 (1949)are powerful examples of “dystopias.”3For more discussion see, for example, Aldiss (1986) and Alkon (1987).

14 Shaping the Next One Hundred Years
In applying knowledge of history, some analysts focus on a specificperiod in the past and draw parallels to contemporary and futuretimes. For instance, James A. Dewar (1998) attempted to understandthe potential social consequences of the Internet by examining thesocial effects of the printing press. Among the most significant ofthose consequences was the printing press’s dramatic reduction ofthe cost and scope of one-to-many communication. This leap intechnological capability, Dewar argued, led to profound changes inhuman society ranging from the Reformation to the scientific revo-lution. He then observed that the Internet for the first time allowsmany-to-many communication on a global scale, and he assertedthat this capability is of similar magnitude to that of the printingpress. Rather than formulating specific predictions, Dewar used his-torical parallels as the basis for inferences regarding forces that couldbear importantly on the information revolution. Such insights maybe used to suggest points to consider in framing long-term policy.4
Attempting to discern key historical trends is another way of appre-hending the long-term future. This approach to history ideally leadsto detection, then interpretation, of large-scale patterns or “granddesigns,” which become the basis for prediction by extension. Theancient Chinese, Hindus, Greeks, and Mayans all noted archetypalpatterns in time. To them, history represented a series or recurrenceof alternating phases where periods of unity and peace were suc-ceeded by division and disintegration, followed by rehabilitation andrestoration of harmony, perhaps occurring on a higher plane thanbefore. Later philosopher-historians pursued a similar concept. Inearly eighteenth century Italy, Giambattista Vico described the suc-cessive stages of growth and decay that characterize human soci-eties. G. W. F. Hegel developed his dialectical concept of thesis,antithesis, and synthesis. Nineteenth century thinkers Karl Marx andFriedrich Engels placed Hegel’s philosophy in a more distinctly social
______________4Dewar (1998) stated that the main social ramifications of the printing press wereunintended, and he believed that the information revolution would be similarlydominated by unpredictable and unintended consequences. Therefore, he positedtwo general lessons for information-age policymakers. First, noting that those coun-tries benefiting most from the printing press regulated it least, Dewar argued that theInternet should remain unregulated. Second, he suggested that policy toward theInternet should emphasize experimentation as well as quick exposure of and responseto unintended consequences.

A History of Thinking About the Future 15
context through their elaboration of the continual struggle betweenthe proletariat and the bourgeoisie that would one day culminate in aclassless society, the overthrow of capitalism, and the elimination oforganized government. In the twentieth century, Oswald Spenglercontended that human civilizations followed the path of naturalorganisms in a pattern of birth, development, and decay. In contrast,Arnold Toynbee believed that civilizations grew and prospered byresponding to a series of challenges, and he did not share Spengler’snotion that rejuvenation was impossible. The retrospective inabilityof these grand architectures of history to anticipate the changes theworld has already witnessed has caused interest in this approach tospeculating about the future to decline in recent years.
Herman Kahn’s treatise, The Next 200 Years (1976), is a more con-temporary example of this approach. In a sweeping narrative, Kahnsought to ground his speculations in careful quantitative analysis ofhistorical data and potential future trends.5 Kahn was one of the firstto combine detailed quantitative forecasts with imaginative descrip-tions purportedly written by people living in the future.6
The narrative situates itself at the midpoint of a four-hundred yearspan that begins with the advent of the Industrial Revolution in Eng-land and culminates with its completion in every country of theworld by the year 2176. Kahn traces key economic, demographic,resource, and environmental trends over these four centuries; and heextrapolates those trends, along with growth patterns in materialsprices and availability and a host of other factors, into the distantfuture.7 The basic structure of his argument is common to manyfutures studies, both quantitative and qualitative.
______________5In this regard, Kahn’s work was similar to Nikolai Kondratieff’s analysis of nineteenthcentury price behavior (including wages, interest rates, prices of raw materials, foreigntrade, bank deposits, etc.). Kondratieff observed economic growth and contractionwithin 50-year cycles—or waves—and used the emerging patterns as a basis for pre-dicting future economic growth.6Kahn, who then worked at the RAND Corporation in Santa Monica, California, calledthese vignettes “scenarios,” a term he reportedly adopted when nearby Hollywoodstudios switched to the term “screenplay.”7The arguments are based on assumptions that the growth of populations, economies,and other key factors that are currently expanding exponentially will begin to saturateand level off, thereby replicating on a global scale those patterns so often seen locallyin the past.
16 Shaping the Next One Hundred Years
Writing at a time of increasing pessimism about the world’sprospects for continued economic expansion, Kahn supplied an exis-tence proof that an adequate standard of living can eventually beprovided for the entire population of the Earth. Kahn explicitlysought to influence his contemporaries’ views. Worried that con-cerns about “limits to growth” would cause societies to slow the eco-nomic growth and technological innovation needed to fulfill thepromise of the Industrial Revolution, he aimed to bolster his readers’confidence in the future. But like all narratives of the future, Kahn’swork could say nothing about the implications of the many plausiblepaths he did not have the time or inclination to describe.
Such historical lessons are insightful and useful, but as any historianwould caution, they are susceptible to many interpretations. Whatproves to be different about the future is likely to be as important asany similarities it has with the past. It is clear then that, at the veryleast, a rich collection of alternative views needs to be assembled toimprove the probability that the past will be a reliable guide for deci-sionmaking aimed at future outcomes.
GROUP NARRATIVE PROCESSES: DELPHI AND FORESIGHT
Traditionally, narratives of the future are the work of one individualor of a collaborative team laying out a particular vision. It is clear,however, that the factors affecting the long-term future can greatlyexceed the range of expertise of any small group. Thus, great interesthas arisen in developing formal methodologies in which large groupsof experts can combine their knowledge systematically and createnarratives of the far future.
The Delphi Method Produces a Consensus-Based Response
Among the first group processes, the “Delphi” technique was devel-oped by RAND researchers in the 1950s as a way to amalgamateexpertise from a wide range of knowledge areas and divergent viewsand to achieve eventual consensus.8 The Delphi process is iterative
______________8The earliest mention of Delphi in RAND’s currently available publications is Dalkeyand Helmer-Hirschberg (1962), described as an abridgment and revision of a 1951

A History of Thinking About the Future 17
in nature. In successive rounds, a group of experts is asked to supplyresponses to a list of questions. At the conclusion of every round, theparticipants view each other’s answers and may then change theirviews in light of what others believe. The answers are presentedanonymously to eliminate the possibility that undue weight will beplaced on the responses of persons who hold particularly high statuswithin the group.
In one early example of this approach, T. J. Gordon and Olaf Helmer(1964) led an expert panel through a series of speculations about keycharacteristics of the world in 1984, 2000, and beyond. Gordon andHelmer prefaced their study with disclaimers suggesting that theydid not intend to predict the long-term future. Nonetheless, it isclear that they conceived their role as adding authority to predictionstheir policymaking audience presumably required. They describedthe work as driven by a desire to “lessen the chance of surprise andprovide a sounder basis for long-range decisionmaking.” However,anyone relying on their answers would have been surprised indeed.
Of the eight specific projections for 2000 reported in this study, sevenfailed to transpire as conceived by the panel.9 Wrong guesses gen-erated by such studies often seem humorous in retrospect, but theimportant thing is to recognize why the predictive task is impossibleto carry out. Delphi is designed to bring a disparate group ofinformed opinion holders to consensus about the future, if only onranges of probabilities. Yet, many of the topics of most interest tothose organizing Delphi exercises are simply unpredictable, no mat-ter how much is known about them. While Delphi can provide adisciplined reification of conventional wisdom, it does not provideany guarantee that the output will bear any relation to how the futureunfolds.
______________________________________________________________document that reports one experiment in a series performed at RAND, designatedinternally as “Project Delphi.”9The predictions included the following: a world population of 5.1 billion, large-scaleocean farming and synthetic protein production, regional weather control and con-trolled thermonuclear power as a source of new energy, development of a universallanguage and “high IQ” robotic machines, mining on the Moon and a landing onMars, weather manipulation for military purposes, and effective anti-ICBM defenses(“air-launched missiles and directed-energy beams”). The panel was closer to themark in forecasting “general immunization against bacterial and viral diseases”though still a bit premature in forecasting the correction of hereditary defects through“molecular” engineering (pp. 40–41).

18 Shaping the Next One Hundred Years
The issue of future technology development provides a good illustra-tion. A familiar general pattern describes the entry path of many newtechnologies into the market (Utterback, 1994). First a period ofexperimentation occurs when many small companies compete withdifferent, innovative versions of the same fundamental idea. Forexample, in the early development of the automobile, it was not clearwhether a car was to have three wheels or four; be steered by a wheelor a tiller; be powered by internal combustion, electricity, or steam,and so forth. In the second phase, after an initial period of experi-mentation, a dominant design emerges. For the automobile, thisoccurred in the early 1920s with the steel-body, four-wheel, internalcombustion-powered vehicle. Finally, the many small stakeholderscoalesce into a few large firms that compete to most efficientlydeliver the new product.
While this general pattern is discernible in retrospect, no panel ofexperts can reliably identify the ultimate winners and losers or theinstances that will break the pattern. Delphi groups often identifyand trace many plausible paths into the future but they cannotdetermine which is most likely to occur. Thus, the method errs whenit encourages experts to reach consensus on the latter rather thanfully articulate the former.
The use of Delphi and its derivatives has waned in the United States,but the approach continues to be employed elsewhere in the world.The Japanese government has conducted large-scale Delphi studiesof expert opinion in science and technology at regular five-yearintervals since 1970. And in the early 1990s, Japanese Delphi expertscarried out a similar exercise jointly with Germany (NISTEP, 1994).Exercises such as these gather input from thousands of participantsto cover the widest range of fields and ensure a broad canvass ofexpert input from each sector. This apparent strength is also aweakness because, in addition to its reliance on prediction, the Del-phi method is too limited by reason of the scale of effort required tobe a practical means of informing long-range policy planning.
Foresight Exercises
Unlike Delphi, which emphasizes the product of its deliberations as aprincipal goal, Foresight exercises focus on the deliberations them-selves. The Foresight method aims to create venues where leaders

A History of Thinking About the Future 19
from government, business, science, technology, and various othergroups can come together to discuss and share both normative andpositive views on future technology developments and their effectson important economic sectors and social structures. These deliber-ations are intended to create channels for communication as well asa better vision of what might lie over the horizon.
In the years since the United Kingdom’s original exercise, Foresight-type efforts have become relatively common in Europe and Asia.10
However, many of these exercises have adopted a substantiallybroader focus. In addition to technology, Foresight now also toucheson social, economic, and even political issues to gain insight intotrends across a broad cross section of a country’s public life. Detailsof the method may vary, but all Foresight processes are characterizedby disciplined group inquiries into the trends affecting future out-comes as well as the actions by which these trends and outcomesmay be adjusted.
In practice, Foresight also struggles with the multiplicity of plausiblefutures. There is no fundamental reason for a Foresight exercise tobe an exercise in prediction. The deep uncertainty surrounding theexploration of future possibilities in the context of Foresight repre-sents no failure of due diligence. Rather, it is inherent in the systemsthat a society deems most important. Nonetheless, many Foresightparticipants, especially those engaged in massive efforts to canvasslarge numbers of individuals and communities, often share anunspoken assumption that the goal of the process is to minimize theirreducible uncertainties inherent in the forces driving toward anunknown future.
This perception may flow from the conviction that predictions arenecessary precursors to effective action. Certainly, Foresight as cur-rently practiced lacks mechanisms that can make effective use ofmultiple futures. The process cannot acknowledge deep uncertaintyand simultaneously provide operational policy recommendations.
______________10This discussion does not touch on closely related efforts, such as technologyroadmapping, that usually have a less grand, generally industry-specific focus than iscommon in Foresight exercises. The U.S. federal government does not formallyengage in Foresight to inform policy choices. However, there are examples of Fore-sight being practiced at state and regional levels. See Ben R. Martin and John Irvine(1989).

20 Shaping the Next One Hundred Years
When it achieves the one, it invariably sacrifices the other (Popper,2002). Foresight can create alternative views of the future and thussupport discussion of uncertainty, but it has no means of recom-mending practical strategies to address that uncertainty. To providepolicy conclusions, Foresight must downplay the multiplicity ofplausible futures and settle on one or a very small number of fore-casts.
SIMULATION MODELING
When narrative and group processes employ quantitative data tosupport their visions of the far future they often rely on some type oftrend analysis. That is, they extrapolate one or more technological,economic, or demographic trends on the assumption that thosetrends will continue into the future just as they have emerged fromthe past. Certainly, most physical and human processes seem highlycorrelated in serial fashion so that the best naive prediction is thatthe contours of tomorrow will be the same as those of today. Manycommon and successful strategies—for instance, the bureaucraticrules governing most organizations—rest on such expectations.However, shifts or discontinuities in today’s trends often prove mostsalient in creating future dangers and opportunities and thereforedetermine the success policymakers have in shaping the long-termfuture.
Computer simulation models can play an important role in the prac-tice of LTPA. Such models provide one of the few means to tracemethodically how key components of a system will change over timeas they interact with one another and, in particular, how such inter-actions might cause significant deviations from past trends. Simula-tion models generally use mathematical expressions to representsuch key real-world processes as economic growth, environmentalquality, and technological advances. These representations are fit toreal-world data and theoretical understandings from the physical,biological, and social sciences. The simulation model can trace theevolution of the system over time, based on these representations ofits parts. Thus, simulation models combine data from past trendswith assumptions about the key causal relationships among relevantfactors to suggest how those factors may change over time.

A History of Thinking About the Future 21
The World3 Simulation Model
Relatively few simulation models designed expressly for LTPA exist.11
Those few exemplars are generally global in scope, thus reflecting theassumption that over the long term the fate of any one region of theworld will depend on that of others. Some models focus on address-ing specific policy questions. Others attempt to paint a more generalpicture of the future.12
The most well-known, long-term simulation model is World3, whichprovided the foundation for the seminal and controversial Limits toGrowth study. Developed by Donella Meadows, Dennis Meadows,Jorgen Randers, and others in the early 1970s for the Club of Rome,an international group of businessmen, statesmen, and scientists,World3 was used to make three main arguments: current rates ofeconomic development would outstrip the Earth’s capacity to sus-tain human society within a century; human society could bebrought into a sustainable balance; and the sooner the transition tosustainability began, the more likely it would be to succeed(Meadows and Meadows, 1972; also see Meadows, Meadows, andRanders, 1993).
World3 is a systems dynamics model, tracking long-term growth inand interactions among population, industrial capital, food produc-tion, resource consumption, and pollution.13 Relatively simple for a
______________11This discussion draws from Kateryna Fonkych, “Modeling for Long-Term PolicyAnalysis: The Case of World3 Model,” prepared for the RAND Graduate School semi-nar on LTPA, September 2001.12Examples of simulation models with century-long spans include the InternationalFutures (IFs) model developed in the 1990s by Barry Hughes, the Regional Worldmodel (RM) developed in the 1970s by Fred Kile and Arnold Rabehl, and the WorldIntegrated Model (WIM) developed in 1979 by Mihajlo Mesarovic and others. Modelsspanning several decades, often exploring economic futures, include the GLOBUSmodel developed by the Science Center Berlin in the early 1980s and the FUGIeconometric model developed by Akira Onishi. See Peter Brecke (1993) for a review ofthese global models.13It includes 149 equations and tables, with 18 for population, 81 for economics, and18 for natural resources and pollution. World3 represents all nations of the world as asingle entity and simulates exponential growth in such key system components aspopulation, economic growth and investment, resource usage and pollution, and foodsupply for up to a century. The model also tracks stocks of industrial capital, pollu-tion, cultivated land, and a single-state variable that represents all of the Earth’s non-renewable natural resources.

22 Shaping the Next One Hundred Years
global model, the fundamental dynamic in World3 is that economicgrowth engenders exponentially increasing demand for resourcesthat eventually overwhelms the inelastic or fixed sources of supply.The world economy and population then collapse from lack of nec-essary resources.
World3 focuses on the interactions, called “feedbacks,” among itskey components—i.e., relationships among two or more variableswhere change in one variable causes a change in others. This, inturn, causes an additional change in the first. Positive feedbacksamplify the effects of change while negative feedbacks reduce them.Technological innovation represents a key negative feedback inWorld3. As environmental resources become scarce, the model allo-cates capital to create new technology to permit more-efficientresource use. However, the model also assumes lags that make theresponse less than instantaneous. Despite such technology feed-backs, four central assumptions give the World3 model a strong ten-dency to yield scenarios where economic growth eventually strainsavailable resources and collapses. These assumptions are as follows:
• Growth will be exponential.
• There are natural limits on both needed resources and the sinksthat absorb pollution.
• The signals society receives about impending resource scarcity,and its response to them, are distorted and delayed.
• The system’s limits degrade when they are overstressed andoverused.
Not surprisingly, the Limits to Growth study spawned a good deal ofcriticism (see, for example, Cole et al., 1973). That debate provides acanonical example of the weaknesses of computer simulation modelsfor LTPA. Simulation models, despite their strengths, can still runafoul of the multiplicity of plausible long-term futures because themodel-generated set of scenarios is limited by the assumptions builtinto the model relationships. The debate over World3—as is typicalfor discussions about the policy analyses stemming from simulationmodels—therefore focused on what relationships were included inor excluded from the model. Criticism came from many quarters,but the common theme was that the model makes assumptions that

A History of Thinking About the Future 23
might be unwarranted and, if changed, would lead to different con-clusions. In particular, the critics point to important feedbacksabsent from the World3 model.
Economists criticized World3 because it fails to represent the effectof prices and markets that in the real world can work to allocatescarce resources more efficiently. As the price of diminishing naturalresources rises, people will demand less, either by developing waysto use those resources more effectively or by substituting otherresources. At the same time, while World3 assumes that a fixed pro-portion of capital goes to each of the agriculture, industry, resourceextraction, and other sectors, in reality markets operate to determinehow available capital is allocated among competing needs. Thiscould avert the collapse in the model caused in part by society run-ning out of capital to counter emerging resource constraints in dif-ferent sectors.
Several critics argued that World3 incorporates fundamentally pes-simistic assumptions about the rate of technological progress that donot reflect the experience of past centuries. They emphasized thispoint by suggesting that a late nineteenth century modeler con-cerned with limits to growth and using the World3 model would havepredicted similar catastrophe for the coming century because no onein 1900 could have foreseen, for example, the Green Revolution.Similarly, a contemporary observer cannot predict the ramificationsof today’s biotechnology revolution.
Critics also argued that human society has far more foresight thanwas assumed in World3. In practice, societies faced with growingproblems often take action to correct them. Faced with impendingcollapse, people might limit the rate of industrial growth or slow therate of population growth. In short, human foresight provides apowerful feedback mechanism. World3 acknowledges such deci-sions and feedbacks, but it does so in a way that critics find overlysimplistic and insufficient to capture the extraordinary adaptabilityof human society.
Structure of Simulation Models Under Deep Uncertainty
World3’s shortcomings are by no means unique. The creator of anymodel must make choices that determine its structure, and this

24 Shaping the Next One Hundred Years
structure in turn determines the futures it can represent. For anycomputer simulation model that addresses the long-term future, nodefinite proof or test can determine absolutely what the structure ofthe model ought to be. This inconvenient fact is implied by the term“deep uncertainty.” While prediction is possible for well-definedproblems and isolated systems, deeply uncertain problems are sub-ject to surprise. No finite model can contain all the potential rich-ness of the actual, future world. Any computer simulation modelused as a basis for predictive argument in support of LTPA is vulner-able to the challenge that it has neglected some factor or relationshipthat could prove decisive in shaping the long-term future. When amodel’s predictions can be repeatedly compared to actual data, itsdesigners can appeal to this comparison to validate their selection offactors. By definition, such validation is not available for thoseengaged in LTPA.14
In recent years interest in newer simulation techniques hasincreased, in particular agent-based modeling, where the represen-tations of macroscopic structure in the model can emerge from sim-ple rule-based interactions of more microscopic entities. A classicexample is Schelling’s (1978) simulation, originally conducted withcheckers on a board, representing the decisions of individual home-owners about where to live. This simulation showed that stronglysegregated neighborhoods could emerge from very mild individualracial biases. Increased computational capabilities have enabledconstruction of similar bottom-up simulations that can reproducemany of the structures of modern society, such as markets (Epsteinand Axtell, 1996) and states (Cederman, 1997), without specifyingthem a priori. Such models hold promise for LTPA because they maysimulate future changes in the structure of society that the modeldesigners did not specify or even perhaps anticipate. Nonetheless,these new simulation techniques do not escape the challenge of deepuncertainty since any macroscopic structures emerging from such
______________14In some cases it is informative to assume, for the sake of argument, that the futurewill be just like the past. It can then be possible to validate a model using historicaldata and to use the resulting model to make forecasts. However, such a model is onlyas reliable as the assumption that there will be no surprises, and the frequent failure ofsuch assumptions limits the usefulness of this approach. (For a more extensive dis-cussion of models that cannot be validated but are still useful, see Bankes, 1993;Bankes and Gillogly, 1994a; Hodges, 1991; Dewar et al., 1996.)

A History of Thinking About the Future 25
models flow from the specifications of the rules whose particulars arethemselves deeply uncertain.15
Narratives help provide compelling visions of the future. Group nar-ratives combine the insights of many individuals. Computer simula-tion models keep extrapolations consistent with the known factsabout the future and help to explore the implications of a wide rangeof plausible futures. Yet absent a means for systematically defendingthe choice of factors they do and do not include under conditions ofdeep uncertainty, simulation models will not achieve their fullpotential to support LTPA because these choices must be credible tothose asked to believe the simulation modeling results. To con-tribute to LTPA, simulation models should be utilized within a for-malized decision processes that recognizes the many avenues foralternative model construction created by deep uncertainty.
FORMAL DECISION ANALYSIS UNDER CONDITIONS OFDEEP UNCERTAINTY
Humans’ impressive ability to reason is nonetheless heir to a numberof persistent, well-documented limitations when used to makejudgments about uncertain futures (Dawes, 1998). Faced withmasses of data, humans often recognize desirable trends where noneexist or ignore unwanted but real patterns. Humans are notoriouslybad at estimating likelihoods because they greatly overestimate theirconfidence in the course of future events and simultaneously holdbeliefs that violate basic laws of probability. Human biases, coupledwith an inability to track the implications of long causal chains, mayskew judgments in ways not easily recognized. The premise of thisreport is that patterns of reasoning that deviate from those of formaldecision analysis may often be appropriate for the real problemspeople face. Nonetheless, when faced with a complex and difficultproblem, human beings, working alone or in groups, often convincethemselves of arguments that are demonstrably not true.
______________15The authors have argued elsewhere that the lack of a decision analytic frameworksuitable for agent-based models has been a key limitation to their more widespreaduse for policymaking and have suggested that robust decisionmaking provides thenecessary decision analytic approach (Bankes, 2002a, 2002b; Lempert, 2002a).

26 Shaping the Next One Hundred Years
Traditional Decision Theory Relies on AssumptionsInappropriate for LTPA
In recent years, an explosion of public and private sector interest inscientific, quantitative methods for decisionmaking in the presenceof uncertainty has occurred. The most common approach, stem-ming from pioneering work of the 1960s (Raiffa, 1968), is based on apredict-then-act paradigm that combines economic models of ratio-nal decisionmaking with methods for treating uncertainty derivedfrom science and engineering. These formal decision-analysismethods allow the comparison of proposed decisions against nor-mative criteria of what constitutes good and bad choices. Decision-makers first obtain predictions of the likely outcomes from eachdecision option. All the potential consequences of each alternativeare enumerated and then assigned a value (utility). A decision resultsfrom discovering and implementing the alternative with the mostadvantageous consequences.
When uncertainty is present, the consequences of alternative actionsare weighted by their likelihood. The choice should then fall to thealternative that provides on average the best value (optimum expect-ed utility). This framework has been applied successfully in a widevariety of fields, such as policy analysis, business decisionmaking,finance, and engineering. When the assumptions behind the theoryhold, formal decision analysis can be shown to be the only logicallyconsistent basis for making decisions.
These quantitative methods offer key insights but also present adilemma when used for LTPA. They can organize vast quantities ofinformation and ensure that any decisions based on such informa-tion are logically consistent. Yet, some key assumptions underlyingtraditional decision theory do not hold when one looks to the longterm.16 In particular, traditional decision theory addresses the mul-tiplicity of plausible futures by assigning a likelihood to each andaveraging the consequences. This makes sense for many short-term
______________16A leading decision scientist, Granger Morgan (1999), and his colleagues distinguishpolicy problems by the time scale and number of stakeholders involved in order tocharacterize the ability of traditional, predict-then-act decision analyses to addressthem. They find global, long-term policy problems the least amenable to traditionalmethods.

A History of Thinking About the Future 27
policy problems when some solid basis exists both for limiting thenumber of reasonable alternatives and for estimating their probabili-ties. However, probabilistic treatments do not solve the predictionproblem. There is simply no way of knowing the likelihood of the keyevents that may shape the long-term future. A radical technologicalinnovation or a revolutionary change in the political order coulddominate future outcomes. Because experts consistently under-estimate the likelihood that they will be surprised (Kahneman, Slovic,and Tversky, 1982), sophisticated elicitation of expert opinion doesnot solve the problem of predicting the far future.
In addition, formal decision theory seeks an optimal policy solution.That is, the ideal policy is that single option that performs “best”given some set of assumptions about the likelihood of variousfutures. However, such an assessment is strongly tied to the validityof the assumptions that underpin the particular analysis. Suchapproaches make recommendations that can be relied on only if allthe assumptions made about the future turn out to be correct. Quiterightly, these are not the criteria individuals actually use when mak-ing long-term policy decisions (Rosenhead, Elton, and Gupta, 1972).
The difficulties in applying predict-then-act decision tools to LTPAarise because of the requirement for decisionmaking under condi-tions of deep uncertainty. Therefore, such traditional methods asdecision analysis that rely on optimization for a particular future willnot produce policies that have the necessary robustness to seizeunexpected opportunities, adapt when things go wrong, or supportthe forging of consensus.
Traditional Decision Analysis Has Proven Problematic WhenApplied to LTPA
The problem of global climate change provides an example of thestrengths and weaknesses of traditional decision analysis whenapplied to LTPA. Climate change is the quintessential example of along-term policy problem. Emissions of greenhouse gases—carbondioxide, methane, and a host of other gas molecules—trap excessheat in the atmosphere and warm the surface of the earth. Onceresident in the atmosphere, these gases can persist for decades orcenturies. The thermal inertia of the oceans means that today’s

28 Shaping the Next One Hundred Years
actions can commit the earth to future warming whose effects willnot become apparent for decades. In addition, the majority ofanthropogenic greenhouse gases are emitted from society’s capitalinfrastructure—power plants, factories, and transportation sys-tems—that, once built, can operate for decades (Lempert et al.,2002). All told, decisions made today can have profound effects ongreenhouse gas emissions and future environmental quality fordecades and centuries. Given the inertia in the climate system andthe human sources of emissions, any quantitative study of theimpacts of alternative climate change policies must necessarily looka century or more into the future.
To compare alternative policies, researchers often develop “inte-grated assessment” computer simulation models to represent themutually interactive behavior of the future economy and the climatesystem. These models relate alternative decisions to particular out-comes. For instance, a model might calculate the effects climatechange could have on economies and ecosystems over the course ofthe twenty-first century, along with the costs of changing society’senergy infrastructure in an attempt to reduce climate change. Ana-lysts treat uncertainty about the long-term future by assigning prob-ability distributions to such key parameters as the sensitivity of theclimate system to increased greenhouse gas concentrations or thedamages a changed climate might cause to human society. In themost sophisticated treatments, these distributions are elicited fromleading experts in the field. Propagating these probabilities throughthe model gives likelihoods for each of the many plausible futuresgenerated by the model.
Formal decision methods have yielded some important insights forthe long-term problem of climate-change policymaking. Theyinclude a better understanding of the trade-offs between early anddelayed action and an appreciation of the importance of efficientlyallocating burden-sharing among different firms, economic sectors,and nations to lower the costs of responding to climate change.Nonetheless, the formal decision-analysis framework has importantweaknesses when applied to LTPA. In particular, it assumes that themany plausible futures can be addressed by assigning a likelihood to

A History of Thinking About the Future 29
each one and then averaging across the spectrum.17 In the case ofthe far future, such probabilities, even if elicited from experts in thefield, are neither much different nor much more accurate than thosederived from such group processes as Delphi and Foresight.
Of course, it might be possible for a decisionmaker to become confi-dent about a particular estimate of probabilities over a multiplicity oflong-term futures. However, most LTPA challenges, including cli-mate change, involve many decisionmakers whose interests, expec-tations, value systems, and interpretations of available scientificevidence may be widely divergent.18 Decisionmakers and otherpolitical actors well understand that certain assumptions lend sup-port to certain policies and that available data support a wide rangeof plausible futures. It therefore stands to reason that contendingstakeholders will do their best to choose subjective probabilities thatbest support the position they wish to adopt on ideological, financial,or other grounds. Thus, when applied to LTPA, the powerful tools offormal decision analysis neither reliably provide a normatively soundbasis for decisions nor, in practice, a framework that can coax con-sensus from multiple decisionmakers eager to champion theirfavorites from among a multitude of plausible futures.
SCENARIOS: MULTIPLE VIEWS OF THE FUTURES
All of the approaches discussed heretofore find their strengths tem-pered by their inability to confront the challenge of multiple plau-sible futures. In contrast, scenario-based planning is designedprecisely to grapple with this multiplicity and unpredictability.
______________17Three key probabilities that emerge as drivers from such exercises are the following:in the absence of any policy actions, emissions of greenhouse gases will be large overthe twenty-first century compared to the likelihood that they will be small; key tech-nologies that might reduce greenhouse gas emissions, such as hydrogen-poweredautomobiles or carbon sequestration facilities for coal power plants, will be inexpen-sive rather than expensive; and the climate might experience an abrupt change inresponse to human interference (National Academy Press, 2002).18To be sure, empirical evidence and scientific arguments can narrow the differentexpectations among different groups. For instance, the scientific community mightgenerate a consensus about the subjective probability distribution for some physicalparameter, such as climate sensitivity, sufficient to convince any reasonable stake-holder. For many key parameters, this is just not possible—e.g., the likelihood thatnew technology will substantially lower the cost of greenhouse-gas abatement.

30 Shaping the Next One Hundred Years
Scenario-planning can crystallize the understanding that the long-term future may be very different from the present, and it can alsohelp decisionmakers choose strategies based on this recognition.Even so, scenario-based planning as currently practiced does notprovide a systematic foundation for comparing alternative near-termstrategies that must be the ultimate goal of LTPA.
Scenario-planners conduct group processes to create narrativesabout the long-term future. Rather than tell a single story, the plan-ners craft a suite of several complementary, yet fundamentally dif-ferent, tales. A family of scenarios aims to span the range of plausiblefutures relevant to the decision at hand. In concept, such scenariofamilies capture the fundamental truth that the future is influencedand constrained, but not determined, by the past and present. Incommon parlance, the word “scenario” connotes a postulatedsequence of future events. Yet, in the modern practice of scenarioplanning, a single scenario is like a one-legged stool: it is useful onlyas one element of a whole that, in its entirety, spans a wide range ofplausible futures.
In practice, scenario-based planning exercises lay out a small num-ber—usually three or four—of alternative, self-consistent storiesabout the future. Some exercises, especially those incorporatingcomputer simulation models in addition to detailed narratives,include calculations for dozens of cases but in the end will summa-rize all of those runs by reducing them to a small number of storiesrepresenting general scenario classes. Every scenario in the exerciseis meant to be plausible, that is, logically self-consistent in the sensethat each postulated event follows from those that come before.Some parties to the exercise may regard certain scenarios as exceed-ingly unlikely and undesirable, but no one should be able to proveany scenario impossible. Taken as a set, the scenarios should becompelling and acceptable to all the individuals involved.
The scenario-planning literature describes a series of steps by whicha group may develop a set of scenarios. In one widely applied formu-lation (Schwartz, 1996), the group first identifies the decisions thescenarios are meant to inform. For instance, a firm may need todecide whether or not to invest in a new manufacturing facility. Thegroup next lists key factors in the external environment that mayaffect the decision and the key driving forces that may in turn influ-

A History of Thinking About the Future 31
ence those factors.19 The group then ranks the key factors and driv-ing forces on the bases of degree of importance to the success of thedecisions and the degree of uncertainty surrounding them. The mostimportant driving forces and uncertainties are selected to differenti-ate the scenarios. Once the set of cases is so identified, the groupcrafts a “scenario logic,” turning each case into the outline of a story.Then each scenario’s story is fleshed out, checked for plausibility,and given a name. Finally, the group can begin to test alternativepolicies against the resulting scenarios. Some scenario-planningexercises also identify “leading indicators” that decisionmakers cantrack as they move into the future and that will give them earlywarning of which scenario is coming to pass.
Scenario-Based Planning Provides a Structure forConsidering Risk
By considering multiple views of the future, scenario-based planningprovides a powerful framework for organizational learning, allowingdifferent parts of the organization to share and understand informa-tion about risk.20 Decisionmakers will often reject projections of thefuture that deviate from what they expect or what they regard ascomfortable. Families of scenarios help overcome this barrier byincluding in a package both scenarios that decisionmakers find com-fortable and those that challenge them. In addition, a family of dif-ferent scenarios can help groups of stakeholders with the inclinationto argue for different views of the future acknowledge and acceptthat many alternative futures are plausible. Finally, families of sce-narios help organizations respond more quickly to changing circum-stances by providing them an opportunity to think through thewarning signs of differing futures and the responses they might maketo such signposts. In one famous example, Shell Oil responded morenimbly to the collapse of oil prices in the early 1980s because its
______________19For example, the future state of the economy and customer demand for the firm’sproduct may affect the investment decision. These two factors may also be recognizedas being driven, at least in part, by interest rates and competitor’s offerings, respec-tively.20The “constructivist” literature on risk also stresses the importance of multiple viewsof the future in transmitting and receiving information about risk to decisionmakersand stakeholders (van Asselt, 2000).

32 Shaping the Next One Hundred Years
management had thought through a set of scenarios that includedsuch an eventuality (Schwartz, 1996).
Scenarios have been used to help think through a variety of long-term policy challenges including those centering on twenty-first cen-tury sustainability. The Special Report on Emissions Scenarios(SRES) (Nakicenovic, 1999) produced by the UN’s IntergovernmentalPanel on Climate Change is an example of how such efforts may belinked to simulation modeling. SRES used six different integratedassessment models to create 40 scenarios to examine the implica-tions of a range of economic, demographic, and technological driv-ing forces. These scenarios were gathered into four families, eachrepresenting a distinct storyline: “Rapid Convergent Growth,” “Frag-mented World,” “Convergence with Environmental Emphasis,” and“Local Sustainability.” The storylines spanned two key drivingforces: the degree of global integration versus regionalism and therelative regard for economic versus environmental concerns.
Each of the 40 runs of each of the six models represented a particularquantitative interpretation of one of these storylines. As a consensusreport of the United Nations, the SRES scenarios were not made toyield any deeply unpleasant future scenarios. Nonetheless, the fourcanonical scenarios defined by the two sets of driving forces didadmit to a wide range of plausible future greenhouse gas emissionspaths inasmuch as they were intended to convey the uncertaintyabout emissions to scientists studying potential future effects of cli-mate change and policy analysts assessing alternative policyresponses.
The Global Scenarios Group (GSG) provides another importantexample of this genre (Raskin et al., 2002). In contrast to SRES, whichsought to support policymakers but not make policy recommenda-tions, the GSG, convened in 1995 by the Stockholm EnvironmentalInstitute, was an international group of scholars who wanted to makespecific recommendations about the actions needed for a transitionto sustainability. GSG created sustainability scenarios that com-bined detailed results of quantitative simulation modeling to capturekey demographic, economic, and environmental trends with literarynarratives that attempted to describe what it would be like to livethrough the scenarios.

A History of Thinking About the Future 33
To organize the myriad possibilities, the GSG laid out three generalclasses of scenarios and labeled them “Conventional Worlds,”“Barbarization,” and “Great Transition.” These archetypes wereintended to capture the essence of the long-term challenges facingthe world today. The “Conventional Worlds” family of scenariosenvisions a future of incremental change, evolving without majordiscontinuities and surprises, leaving human values and institutionsat century’s end similar to those of today. The “Barbarization” familyenvisions a future in which escalating crises overwhelm the capaci-ties of today’s institutions, and social, economic, and moral under-pinnings collapse, plunging civilization into anarchy or tyranny. The“Great Transitions” family captures a future that develops from pro-found, near-term shifts in human values and institutions. Societiesworldwide emphasize and achieve quality of life, material suffi-ciency, social solidarity, and the preservation of nature.
Figure 2.1 summarizes the trajectories of population and wealth fortwo representatives of each scenario family over the twenty-firstcentury. The differing courses illustrate some of the most importantquantifiable differences among the scenario groups (Gallopin et al.,1997). Within the Conventional Worlds family, the “Reference”(business-as-usual) scenario extrapolates current policies across thetwenty-first century leading to great aggregate global wealth,unequally distributed, and extensive damage to the environment.The “Policy Reform” scenario explores the extent to which compre-hensive and coordinated government action within the context ofexisting institutions and values can alleviate concerns about equityand the environment raised by the Reference scenario (Raskin et al.,1998). “Eco-Communalism” and “New Sustainability Paradigm”envision two different Great Transitions. The former embracesstrong decentralization and local economic self-sufficiency. Thelatter represents a global civilization focused on equity and environ-ment. The “Breakdown” scenario represents a complete collapseinto small, poor, warring tribes. In “Fortress World” authoritarianrulers protect small enclaves of wealth amidst an impoverishedmajority.
GSG provides detailed narratives for these scenarios, called “futurehistories,” presented in a form that might appear in a late twenty-

34 Shaping the Next One Hundred Years
RANDMR1626-2.1
250
20
Gro
ss w
orld
pro
duct
($
trill
ions
)
Population (billions)5 10
Great TransitionConventional
Worlds
Barbarization1990
New sustainabilityparadigm
Breakdown
Policy reform
Reference
Fortress world
Eco-communalism
Figure 2.1—Global Trajectories for Per-Capita Income and Population inSix GSG Scenarios
first century magazine article that sought to help its readers under-stand the events of the early 2100s that had created their world. TheGSG laid out their scenarios to argue for specific near-term actionsand framed their arguments as risk-management strategies. Bar-barization clearly represents a future to be avoided. ConventionalWorlds, embodying current conventional wisdom, appeared super-ficially attractive, but the GSG argued that it was unreliable. Theysuggested that today’s institutions and values, which balance thedesire for economic growth with quality of life, may be insufficientlyflexible and responsive to cope with the challenges that could appearin the twenty-first century. With luck, Conventional Worlds mightendure. If it did not, Barbarization would likely result. Only GreatTransition could reliably weather the storms ahead and avoid dele-terious consequences. Thus, the GSG scenarios suggest that themost important step society could take to address long-term sustain-able development would be near-term actions to transform the val-ues that would shape humanity’s future institutions and choices.

A History of Thinking About the Future 35
GSG’s scenarios and similar tales provide a powerful stimulus to theimagination by helping people envision what each of the postulatedfutures might be like and by giving them some understanding ofwhat driving forces might bring them about. The narrative structureof scenario families is crucial. For instance, the set of names—Bar-barization, Conventional Worlds, and Great Transition—can providea concise, memorable synopsis of the argument.21
Scenario-Based Planning Also Has Several ImportantWeaknesses for LTPA
Scenario-based planning does grapple with the multiplicity of plau-sible futures but has two important weaknesses for LTPA. First, thechoice of any small number of scenarios to span a highly complexfuture is ultimately arbitrary. A scenario exercise will necessarilymiss many important futures that do not make the cut into the topfew. Despite best efforts, the logic used to sort the scenarios mayseriously bias any conclusions drawn from them. As one smallexample, research in the psychology of decisionmaking indicatesthat humans gravitate to stories whose plot revolves around a singledramatic event rather than to those where the ending is driven by theslow accumulation of incremental change (Kahneman and Tversky,1982). Thus, scenario-based planning exercises may make it difficultto think about responses to slowly emerging problems. Certainlythey will fail to address many of the challenges that the future willhold.
Second, scenario-based planning provides no systematic means tocompare alternative policy choices. Some of the literature (van derHeijden 1996) suggests means for seeking policies robust over the set
______________21Similarly, the “Mount Fleur” scenarios developed for South Africa in the 1980s arecredited with creating a shared language for South Africans to debate the dismantlingof apartheid (van der Heijden, 1996). These scenarios were popularized in publicspeeches and a best-selling book. The scenarios were labeled with names evocative offlight: “Ostrich” reflected an attempt by the apartheid government to conduct busi-ness as usual, “Lame Duck” envisioned a weak government overseeing a long periodof transition, “Icarus” envisioned a majority government coming rapidly to power on awave of unfulfillable promises, and “Flamingos” envisioned a black-white coalitiongovernment whose members rise slowly but fly high together. Even people who hadnot read about them could discuss the implications of alternative decisions using thescenario names as shorthand.

36 Shaping the Next One Hundred Years
of scenarios. Dewar et al. (1993) and Dewar (2001) have developed aform of narrative scenario-based assessment called Assumption-Based Planning, which systematically finds weaknesses in existingplans and helps decisionmakers improve those plans with strategiescomprising shaping actions intended to influence the future thatcomes to pass, hedging actions intended to reduce vulnerability ifadverse futures come to pass, and signposts—observations that warnof the need to change strategies.
Although the scenario-based planning literature has systematizedthe process for developing scenarios, the approach for developingpolicy based on the results is not similarly systematic. Although bestpractice can incorporate scenario processes into long-range plan-ning, most often scenario exercises by their nature stand apart asexceptional practice not formally incorporated into usual decisionprocesses. The links making such inquiry integral to the evolvingpattern of actions that must be taken to craft actual strategies, putthem in place, and monitor their progress are often tenuous. Moreimportant, the largely narrative approaches used and the limitationson the ability of humans to comprehend large masses of informationmake it likely that scenarios with important implications for detect-ing opportunities, highlighting pitfalls, or informing strategic actionmay be missed. Scenario techniques are tremendous boons toforward-looking strategic thinking but are not formally linked to theoperations of decisionmaking.
ASSESSING THE STATE OF THE ART
This brief survey suggests that traditional methods for engaging inlong-term thinking and decisionmaking all grapple in different wayswith the core challenge of confronting multiple, plausible futures.Taken together, these methods provide a rich foundation of wisdomon which to construct a new approach to LTPA. Narratives areunmatched in their ability to help audiences viscerally imagine whatthe future might be like. Delphi and Foresight exploit the fact thatvaluable information about the future is often best gathered throughdiscussions among groups of informed individuals. Simulationmodeling provides a quantitative structure for constructing inquiresinto alternatives. Decision-analysis methodology helps correct thenumerous fallacies to which human reasoning is prone. Finally,

A History of Thinking About the Future 37
scenario-based planning stresses the importance of multiple views ofthe future in transmitting and receiving information about uncer-tainties to decisionmakers and stakeholders.
However, each technique in itself proves insufficient to support theprocesses humans actually rely on to reason through complex anddeeply uncertain issues pertaining to the long-term future. It istherefore useful to consider how best to combine the strengths ofeach approach while mitigating their common weakness. The guidefor doing so should be a return to first principles: an explicit consid-eration of how the natural human mechanism for reasoning underdeep uncertainty operates. Our goal is to undergird this faculty withthe same level of analytic support that has been constructed forstandard decision problems and, in the process, create a new way toconduct standard LTPA—or, indeed, any type of decisionmakingunder conditions of deep uncertainty.


39
Chapter Three
ROBUST DECISIONMAKING
Often in the history of science, new tools have launched new ways oflooking at the world. Galileo altered conventional views about thehuman place in the cosmos when he pointed his telescope, newlyinvented as an aid to maritime navigation, into the sky and discov-ered in the orbits of Jupiter’s moons the existence of more than onecenter of motion in the universe. The microscope revealed the exis-tence of a hitherto unsuspected world requiring new explanations.The steam engine prompted Sadi Carnot’s inquiries into the intimaterelationship between heat and motion, launching energy as a centralconcern for science and profoundly deepening the concept of thefundamental unity of nature.
Today, the computer has also become a tool poised to reshape ourthinking in many fields. In particular, this technology can revolu-tionize the way we plan for the long-term future. The computer willnot solve the intractable problems of prediction (though in someareas it may improve our ability to predict), but instead it can enabledecisionmakers to ask a fundamentally different and more sensiblequestion. Rather than first predicting the future in order to act on it,decisionmakers may now gain a systematic understanding of theirbest near-term options for shaping a long-term future in the absenceof any reliable predictions.
This chapter introduces a new approach to LTPA based on com-puter-supported, robust decisionmaking methods.1 This discussion
______________1Section 10.1.5 in Metz et al. (2001) surveys a variety of robust decisionmaking meth-ods applied to the long-term policy problem of global climate change.
40 Shaping the Next One Hundred Years
describes the general methods and technology used in this study andthe philosophy informing its development. Chapters Four and Fivedemonstrate the application of a particular robust decisionmakingmethod to the problem of global sustainability.
DECISIONMAKING UNDER CONDITIONS OF DEEPUNCERTAINTY
The previous chapter’s discussion suggests the rich legacy of insightsinto the practice of LTPA. The power of the modern computer nowmakes it possible to build on previous concepts, rendering many ofthem operational for the first time, to construct robust decisionmethods. These methods can overcome past limitations in LTPA byproviding analytic support for systematic human assessment ofoptions that accounts for the multiplicity of plausible futures. Inbrief, a robust decision approach allows analysts to use the computerto lay out a wide range of plausible paths into the long term. Theythen look for robust near-term policy options—i.e., those that whencompared to the alternatives perform reasonably well across a widerange of futures using many different values to assess performance.Often strategies are robust because they are adaptive—that is, theyare explicitly designed to evolve in response to new information.
Complementary Capabilities of Humans and Computers
Computer-supported robust decisionmaking at its root combines thebest capabilities of humans and machines. Humans have unparal-leled ability to recognize potential patterns, draw inferences, formu-late new hypotheses, and intuit potential solutions to seeminglyintractable problems. Humans also possess various sources ofknowledge—tacit, qualitative, experiential, and pragmatic—not eas-ily represented in traditional quantitative formalisms. Workingwithout computers, humans can often successfully reason their waythrough problems of deep uncertainty, provided that their intuitionabout the system in question works tolerably well. They can employnarrative mental simulations to test how strategies will perform incomplex situations (Kahneman and Tversky, 1982). Expert deci-sionmakers can use analogies from the past to suggest which strate-gies should work most effectively in the future (Klein, 1998). Iterativegroup processes can tap vast stores of relevant information. Framed

Robust Decisionmaking 41
around their facility for storytelling, humans can challenge eachother with “what if” scenarios to probe for weaknesses in proposedplans. These processes succeed because the best response to deepuncertainty is often a strategy that, rather than being optimized for aparticular predicted future, is well hedged against a variety of dif-ferent futures and evolves over time as new information becomesavailable. Humans design successful adaptive strategies by usingavailable information to repeatedly subject candidate strategies toexamination over a range of future contingencies.
These time-tested processes can break down, however, whenhumans are faced with complex futures for which past experienceand intuition provide an unreliable guide. Under conditions ofcomplexity, humans rapidly lose the ability to track long causal linksand the competing forces that may drive the future along one path oranother.2 Their ability to trace the “what-if” implications of pro-posed plans fails. When operating in organizations where individualintuition may not be easily employed or shared, humans can find iteven more difficult to explore mental simulations as a group effort,even in the rare cases where many individuals share values andexpectations about the future. Thus, among organizations with vary-ing agendas or within communities that have wide-ranging interests,it becomes nearly impossible to engage in a formal commerce ofideas using these means.
Whereas humans have limited capability to process and retaininformation, computers excel at handling large amounts of quantita-tive data. They can project without error or bias the implications ofthose assumptions, no matter how long or complex the causalchains, and search without prejudice for counterexamples to cher-ished hypotheses. The process of creating computer simulationmodels often forces clear explication of many underlying assump-tions.3 The traditional methods of using computers to support poli-
______________2Klein (1998) reports that humans’ mental simulations are generally quite simple.They usually contain no more than three key variables and no more than six transi-tions from one situation to the next.3Simulation models can be crucial in helping policy analysts formalize and structuretheir assumptions about key driving forces. Humans generally reason with symbolicmodels—mental representations of real-world processes portraying cause-effect rela-tionships among different variables based on their assumptions and observations.

42 Shaping the Next One Hundred Years
cymaking required analysts to make certain key assumptions—inparticular that widely agreed on models, values, and likelihoods foralternative futures exist—that are simply not true for LTPA. Thusanalysts faced a Hobson’s choice. They could reason with computersand reject basic tenets of the successful approaches humans use toaddress problems of deep uncertainty, or they could adhere to theseapproaches and lose the ability of computers to augment humanreasoning and correct errors that often creep into human reasoning.
Building a New Approach
In recent years, the capabilities of modern computers—fast process-ing, often over multiple CPUs; virtually unlimited memory; andpowerful, interactive visualizations—have spawned many newquantitative approaches to the ubiquitous, yet previously intractable,problems of decisionmaking under deep uncertainty. The policyanalysis and integrated assessment literatures increasingly empha-size an emerging school of computational, multiscenario simulationapproaches in which analysts use models to construct different sce-narios (Morgan et al., 1999; van Asselt, 2000; Metz et al., 2001; Davis,2003). Rather than aggregate the results using probabilistic weight-ings, this school uses the multiplicity of scenarios to make argumentsfrom comparisons of fundamentally different, alternative cases.Statisticians and mathematicians now generate a literature onimprecise and ambiguous probabilities (de Cooman, Fine, and Sei-denfeld, 2001) that allows analysts to consider the constraints ofprobability theory without assuming greater accuracy of informationabout actual probability values than is warranted.4 The engineering
However, mental models permit imprecision and inconsistency. Computer models donot exhibit these shortcomings. Therefore, interaction between humans and com-puter models is highly complementary.
Jay Forrester (1994) has observed that “a two-way street runs between mental modelsand computer models.” Mental models contribute much of the input for computermodels. Creating a computer model requires that the mental models be clarified, uni-fied, and extended. From the computer simulations come new insights about behav-ior that give new meaning to mental models. Mental models will continue to be thebasis for most decisions, but those mental models can be made more relevant andmore useful by interacting with computer models.4The web site of the imprecise probabilities project (http://ippserv.rug.ac.be/webdb/ipp_bibliography_server.cgi) provides many papers on the topic of imprecise andambiguous probabilities.

Robust Decisionmaking 43
and operations research literatures have begun to use the criterion ofrobustness, as opposed to optimality, to address such situations ofambiguity (Zhou, Doyle, and Glover, 1996; Kouvelis and Yu, 1997;Ben-Haim, 2001). Advances in information technology have alsoresulted in the explosion of new approaches to computer simulation,such as agent-based modeling (Epstein and Axtell, 1996).
The approach to robust decisionmaking used in this report becomesfeasible through the marriage of multiscenario simulationapproaches with the concept of exploratory modeling (Bankes, 1993;Bankes and Gillogly, 1994; Bankes, Lempert, and Popper, 2001;Bankes, 2002b).5 Exploratory modeling emphasizes a conceptualframework for using computer experiments to learn about the world,particularly by exploiting the interplay between computer-generatedvisualizations that help humans form hypotheses about properties ofan ensemble of computational experiments and then conduct com-puter searches across that ensemble to test these hypotheses sys-tematically. When applied to robust decision analysis, exploratorymodeling uses the computer to create a large ensemble of plausiblefuture scenarios. Here, the term “scenario” is used to represent oneguess about how the world works combined with one choice amongmany alternative strategies people might adopt to influence out-comes. The approach then uses computer visualization and searchtechniques to extract information from this ensemble of scenariosthat is useful in distinguishing among alternative decision options.
Robust decision methods are appropriate for many problems involv-ing decisionmaking under conditions of deep uncertainty but areparticularly powerful tools for LTPA, one of the most stressing chal-lenges in this genre. When applied to global, long-term policyanalysis, a robust decision approach aims to produce consensus on
______________5In “Exploratory Modeling for Policy Analysis,” Bankes (1993) described what was thenconsidered the standard approach to modeling—using the term “consolidative model-ing”—as “building a model by consolidating known facts into a single package andthen using it as a surrogate for the actual system.” When knowledge was insufficientor other uncertainties precluded building such a surrogate, modelers were obliged toguess at details and mechanisms. “While the resulting model cannot be taken as areliable image of the target system, it does provide a computational experiment thatreveals how the world would behave if the various guesses were correct. Exploratorymodeling is the use of series of such computational experiments to explore the impli-cations of varying assumptions and hypotheses” (p. 435).

44 Shaping the Next One Hundred Years
some sensible course of near-term action among the many differentparties to a decision. This requires the discovery of policy optionsconsistent with the parties’ different expectations about the futureand the range of values they hold.
Traditional prediction-based policy analysis pursues argumentsbased on an if-then framework. If the framing of the problem as avalue function and a model (with its associated predictions of thefuture) is correct, then policymakers should take some specifiedaction. In contrast, robust decision methods may be used to framearguments about near-term policy actions that hold true for the fullrange of plausible futures and that are acknowledged as useful andvalid by all concerned parties. For example, analysts might claimthat a certain near-term strategy always performs well no matterwhat future comes to pass. An analysis seeking a robust decisionwould then use the computer in an attempt to falsify such hypothe-ses by searching for plausible futures in which the strategy would fail.The argument for the strategy is strengthened if the computer findsno future where the strategy performs poorly. The converse caseweakens the argument for the strategy.
Four Key Elements for a Robust Decision Approach
Chapter Two reviewed the difficulties preventing more traditionaltechniques from fully addressing the needs of LTPA. A robust deci-sion method approach would address these shortcomings by pro-ceeding in multiple iterations as humans and computers alternatelychallenge each other’s conclusions about futures and strategies.Four key elements or principles should govern the form and designof these interactions. These are summarized below and thendescribed in detail in subsequent sections of this chapter:
• Consider ensembles of large numbers of scenarios. Suchensembles should contain a set of plausible futures as diverse aspossible to provide a challenge set against which to test alterna-tive near-term policies. Scenario ensembles can represent awide range of different types of information about the long-termfuture. They can also facilitate group processes designed to elicitinformation and achieve buy-in to the analysis from stakeholderswith very different values and expectations about the future.

Robust Decisionmaking 45
• Seek robust, rather than optimal, strategies that perform “wellenough” by meeting or exceeding selected criteria across a broadrange of plausible futures and alternative ways of ranking thedesirability of alternative scenarios. Robustness provides a use-ful criterion for LTPA because it reflects the approach manydecisionmakers actually use under conditions of deep uncer-tainty.
• Employ adaptive strategies to achieve robustness. Adaptivestrategies evolve over time in response to new information.Near-term adaptive strategies seek to influence the long-termfuture by shaping the options available to future decisionmakers.The near-term strategies are explicitly designed with the expecta-tion that they will be revisited in the future.
• Design the analysis for interactive exploration of the multiplicityof plausible futures. Humans cannot track all the relevant detailsof the long term. Working interactively with computers, theycan, however, discover and test hypotheses that prove to be trueover a vast range of possibilities. Thus, computer-guided explo-ration of scenario and decision spaces can help humans, workingindividually or in groups, discover adaptive near-term strategiesthat are robust over large ensembles of plausible futures.
Let us now consider each key element in more detail.
CONSIDER ENSEMBLES OF SCENARIOS
To celebrate the World’s Columbian Exposition in Chicago in 1893,the American Press Association asked 74 noted commentators frommany fields to predict what American life would be like in the 1990s(Walter, 1992). While some writers successfully produced visionsthat were accurate in overall concept though rarely in detail, othersamusingly extrapolated trends that have since radically changed. Forinstance, one essayist presciently envisioned that by the 1990s mostbusinesses would communicate by means of electric transmissions,while another suggested that rising productivity would render threehours a long day’s work. While this group included some whoemerged as reasonable seers, in 1893 it was not possible to knowwhich ones they would turn out to be.

46 Shaping the Next One Hundred Years
This set of essays exemplifies LTPA’s central challenge and opportu-nities. Any single description or model of the future is almost cer-tainly to prove wrong. However, a diverse set of future visions maycapture something important about the future that will actually tran-spire, though no one can identify the accurate scenarios ex ante.
Work with multiple views of the future now exists in several fields.For instance, some quantitative approaches from the machine-learning (Breiman, 1996) and weather-prediction literatures employmultiple models to improve predictions. The multiple models (gen-erated for example from time series data) project different futurestates of the world that are averaged to create a single prediction fre-quently more accurate than that obtained by any single model(Bankes, Popper, and Lempert, 2000). Planners with specific pur-poses in mind also create groupings that contain small numbers ofscenarios. The GSG assembled its three scenarios to argue for near-term actions to foster a Great Transition. The IntergovernmentalPanel on Climate Change created its 40 SRES to identify key drivingforces and characterize the range of uncertainty in future greenhousegas emissions.6
Unlike the collection of 1893 essays whose only purpose was toentertain, the needs of LTPA require conscious consideration of thetypes of futures needed to serve a specific policy purpose. Thus,although the word “scenario” and phrase “alternative future” aregenerally taken as synonyms, for the purposes of LTPA it is useful tomake a distinction. In this usage a “scenario” is a combination ofsome alternative configuration of future exogenous circumstances orrelationships with the playing out of some strategic action or actionsbeing examined.7 The robust decision approach assembles futuresas a challenge set against which to test the robustness of alternativestrategies. We call any such purposefully assembled set an ensembleof scenarios (Bankes, 1993).8
______________6Earth scientists have long considered multiple views to capture uncertain informa-tion (Chamberlain, 1890).7These concepts will be examined in greater detail in Chapter Four.8This use is based on the meaning of ensemble as a group of complementary partsthat contribute to some single effect.

Robust Decisionmaking 47
A robust decision approach profits from deriving scenario ensemblesthat provide the greatest possible diversity of plausible futures con-sistent with available information. Analysts can then assess policiesby testing for arguments that hold true across the ensemble. If theensemble is sufficiently diverse, it will most likely also contain auseful approximation of the future that will actually occur. Thus, anargument true for every member of an ensemble will be true of theactual future as well.
Scenario ensembles can usefully support such arguments becausehumans possess much information, even about unpredictable long-term futures, that constrains the plausible members of the ensemble.Without such constraints, a completely diverse scenario ensemblewould include every future that could possibly be represented andthus would support no useful arguments about policy choices.Information about the future might be in the form of quantifiablephysical or economic laws—e.g., matter is conserved, currentaccounts must balance—or as intuitive judgments on the part ofdecisionmakers—e.g., the average annual rate of economic growthover the entire twenty-first century is unlikely to exceed four percent.Frequently, information about the future describes correlationsamong events. For instance, analysts may not be able to predictwhich new technology will become dominant in the decades ahead,but they can describe the well-known patterns of diffusion that anysuccessful technology will follow (Davis, 1979; Utterback, 1994). Aplausible future is one consistent with the known constraints—thatis, one that cannot be refuted by any currently available information.
Probabilistic information can be incorporated with the use ofensembles in several ways. Most directly, a probability distributioncan be asserted across an ensemble of scenarios that would allow thecomputation of the implied probabilities of outcomes. This tech-nique is only useful when the probability distribution representssolid information. In engineering applications, probabilities basedon measured frequencies can be used, in which case this techniqueis rigorous. Such data is not available for LTPA by definition. Inprinciple, probability distributions can be used to represent humanknowledge through subjective probabilities. In practice, subjectiveprobabilities do not provide a natural representation for such knowl-edge, especially when dealing with a large number of mutuallydependent uncertainties, as is the case with LTPA. Probability distri-

48 Shaping the Next One Hundred Years
butions can be a more useful construct late in an analysis, when thenumber of salient uncertainties has been reduced to a small num-ber.9
If one does use a probability distribution as part of an LTPA, it isimportant to ask whether the conclusions of the analysis are robustto specification of that distribution. That is, how different would theassumed probabilities need to be to result in a different conclusion?This idea can be generalized by considering the ensemble of plausi-ble probability distributions that can be explored using the sametechniques described here for ensembles of scenarios. This is thecomputational equivalent to methods of imprecise probabilities nowbeing developed by some statisticians and decision theorists.10
Only recently have computers become sufficiently powerful toexploit this concept of scenario ensembles. As indicated above, acompletely diverse ensemble of plausible long-term futures wouldhave a staggeringly large number of members. Fully enumeratingthem remains beyond present or prospective means, but moderncomputers can provide a useful approximation in the form of a “vir-tual” representation of the ensemble of all plausible futures that ana-lysts can effectively use to inform policy choices. This representationrequires two distinct types of software: a scenario generator that cancreate any member of the ensemble on demand and exploratory-modeling software that allows the facile generation and managementof the scenario generator runs necessary to address arbitrarily com-plex queries about a diverse ensemble of plausible futures (Bankes,1993).
Exploratory-Modeling Software Is the Key to the Problem ofMultiple Futures
Exploratory-modeling software describes a potentially “infinite” sce-nario ensemble by creating a data structure that indexes every
______________9An example of this use of probability distributions can be found in Chapter Five.10There are conceptually a variety of extensions of the basic use of ensemblesdescribed here. Any information used as input to the analysis could be systematicallyvaried, including not only probability distributions but also constraints, functionalforms, and strategies for searching ensembles as well. These more advanced applica-tions of ensembles will not receive further consideration here.

Robust Decisionmaking 49
potential member of that ensemble.11 Any member of the ensemblemay be created on demand by sending the vector of input parame-ters specified by the desired element in the data structure to the sce-nario generator. The scenario generator then conducts a run andreturns the desired vector of outputs, which then completes thedesired element in the data structure. Each such query may bethought of as a computational experiment that yields informationabout properties of the ensemble as a whole.
The specific policy arguments in each analysis define the computa-tional experiments that need to be conducted and, hence, the sam-pling strategy over the ensemble. For instance, analysts might wishto test the claim that a particular strategy is a good choice by findingand characterizing futures where the strategy performs especiallypoorly. This effort might employ some combination of search andsensitivity-analysis algorithms with results presented to human ana-lysts as interactive visualizations. The particular questions analystsshould ask of a scenario ensemble and the algorithms and visualiza-tions used to address those questions generally emerge during thecourse of the analysis and cannot be specified a priori. Thus,exploratory-modeling software should allow analysts to performarbitrary sequences of large numbers of computational experiments,often with complex relationships to one another, in the service ofadvancing or refuting a specific line of policy argument.
For our research, the CARs™ computer environment was utilized tohandle generation and manipulation of necessary scenarios.12 Thissoftware provides a general environment that can encapsulatealmost any type of scenario-generating software and represent(virtually) any scenario ensembles of arbitrary size and structure.The software represents each scenario as a data structure that
______________11This is part of the reason that ensembles are more than just sets. An underlyingstructure ties together the members of the ensemble, enabling their manipulation as agroup as well as a purposeful rationale that originally guided the construction of anygiven ensemble.12The Evolving Logic Computer Assisted Reasoning® system (CARs™) software pro-vides the means for using any model or modeling techniques to run the requiredcompound computational experiments, selecting methods for generating and examin-ing the results of such experiments, and visualizing the output in a manner that pro-vides integrated interaction between human operator, computational engine, andavailable information.

50 Shaping the Next One Hundred Years
includes input parameters (representing one plausible future andone alternative strategy) and output parameters that represent thecomputed desirability of that scenario for today’s decisionmakersmeasured according to one or more value systems. In addition tosupporting the generations of arbitrary scenarios on demand, thesoftware provides caching of previously run cases and services forinteractively revising ensemble definitions.
Scenario Generating Software Creates the EnsemblePopulation
A scenario generator is a computational mechanism that can provideany scenario of the ensemble of plausible scenarios on demand. Ingeneral, they could be embodied in a wide variety of software tools—e.g., one or more computer simulation models, statistical models fitto the data, neural networks, rules capturing expert knowledge, oreven an explicit look-up table relating scenario descriptors and out-comes.
While retrofitted computer simulations most frequently provide thesoftware for scenario generation, it is important to emphasize theterm “scenario generator” rather than the word “model.” Scenariogenerators and models may look alike, but the two software artifactsare used for very different purposes.
Computer simulation models are generally used for prediction. Thevery word “model” bespeaks an attempt to provide an accurate por-trayal of some system. Well-established standards and statisticaltools exist for validating such computer models as those used byengineers to simulate the performance of aircraft they are designing.In contrast, to properly create a challenge set for testing alternativedecisions, a scenario generator should produce an ensemble with asdiverse a range of plausible alternatives as possible. No widelyaccepted standards of rigor for assessing the quality of such scenariogenerators currently exist. However, it is clear that such standardsshould be very different from those used for predictive models. Theideal scenario generator would produce only plausible scenarios, butin constructing the software, analysts should err on the side ofincluding potentially implausible futures. Too-early rejection ofpotential futures could result in making decisions that prove fragile

Robust Decisionmaking 51
to the reality that actually unfolds because a seemingly erroneous orinitially unimportant factor may prove plausible and decisive later inthe analysis. Traditional decision analysis will produce erroneousresults if it relies on predictive models that produce erroneous pre-dictions. In contrast, a robust decision method application is mostvulnerable to errors from using scenario ensembles that are not suf-ficiently diverse. Thus, on balance, including some impossible sce-narios presents less of a problem than leaving out scenarios thatcould prove important. During the process of analysis, scenariosthat appear to be pivotal can be subjected to scrutiny and removedfrom the ensemble should they, on proper reflection, be deemedimplausible.
During the course of analysis, humans may suggest new futures andstrategies for testing and examination. It is impossible to avoid thepossibility that modifications to the desired ensemble will requirereimplementation of the scenario generator. However, constructingthe scenario generator to produce the widest possible diversity ofscenarios and using the exploratory modeling software to restrict thescenarios to be generated can clearly reduce the number of modifi-cations required later.
Scenario generators must often produce alternative scenarios arisingboth from parametric uncertainty, where the values of some inputvariables are unknown, and from structural uncertainty, where therelationship among such factors is unknown. Exploring alternativestructural relationships is more difficult to automate than explo-ration of parameters, but nonetheless it is often vital to respond tothe questions or insights of the people involved in the analysis. As aconsequence, a robust decision analysis may require varyingassumed structural relationships as well as parameter values.
Scenario Ensembles Provide Best Means to CaptureInformation About Long-Term Futures
The flexibility inherent in the use of scenario ensembles permitsamalgamation of different sources of knowledge in a way that is noteasy and often not possible with models designed for prediction. Ifthe computer simulations suggest scenarios that violate knowledgepossessed by humans, such scenarios can be excluded as implausi-

52 Shaping the Next One Hundred Years
ble. If humans suggest a future that requires heroic assumptions orviolations of basic scientific, economic, or other principles, theseotherwise undiscovered assumptions will be revealed in trying tocreate this future within a simulation. If humans disagree about theplausibility of scenarios, this information can be captured in sam-pling strategies across the ensemble. Judgments about the plausibil-ity of futures are generally embodied both as constraints within thescenario generators—e.g., certain paths are excluded because theyviolate known principles of economics—and as constraints on thesampling mechanisms used to create the scenario ensemble—e.g.,some parameters can never be large if certain others are small.
Scenario ensembles are powerful artifacts for eliciting informationfrom groups and for communicating information about risk to wideaudiences. Like the multiple narratives used in scenario planning,scenario ensembles offer stakeholders familiar, desired, or expectedfutures that make it easier for them to buy into the analysis. Ensem-bles also offer compelling alternative futures that can force stake-holders to question their assumptions and provide a framework tounderstand the views of others who might hold very different expec-tations about the future. In addition to its role in providing a suitablechallenge set for analysis, the diversity requirement that guides theconstruction of scenario ensembles is crucial to building credibilityamong parties to a decision.
SEEK ROBUST STRATEGIES
What criterion should decisionmakers use to compare alternativesolutions for long-term policy challenges? Traditional decisionanalysis seeks the optimal strategy, that is, the one that performs bestfor a fixed set of assumptions about the future. In contrast, LTPArequires a standard that allows analysts to make policy argumentstrue across a multiplicity of unpredictable futures.
The analysis in this report employs robustness as the appropriate cri-terion to assess alternative strategies in LTPA. An argument that isinsensitive to significant variation in its underlying assumptions issaid to be robust. In this sense, a strategy should be consideredrobust if it performs reasonably well compared to the alternativesacross a wide range of plausible futures. The use of the normativeconcept of performing “well” therefore also suggests robustness

Robust Decisionmaking 53
should be assessed with respect to the many different value systemsfor assessing the performance of the strategies. When applied toLTPA, the concept of robustness has several virtues. It provides acomputationally convenient basis for identifying policy argumentsthat are true over an ensemble of plausible futures. It offers a nor-mative description of good choices under the conditions of deepuncertainty and multiple stakeholders that characterize LTPA.Finally, it matches the criteria decisionmakers often use when facedwith such conditions.
Benefits of Robust Criteria
For many decisionmakers, robustness represents the normative cri-terion one ought to use when confronting deep uncertainty. Whenmuch about the future remains unknowable and many parties mustconcur on a path forward, those who formulate policy should seekstrategies that, ideally, will not fail to minimize perceived costs oryield tangible benefits no matter which future comes to pass or whojudges the success of the strategies. This concept of robustnessdraws from, but is not identical to, L. J. Savage’s criterion of minimiz-ing the maximum regret. Savage describes his mini-max rule as apractical rule of thumb for cases where individuals or groups are“vague” about the probabilities they attach to certain events andwhere all parties to the decision are certain that, for some strategies,the largest degree of loss will still seem acceptably small.13
Observers also suggest that many decisionmakers use the robustnesscriterion under conditions of deep uncertainty (Gupta and Rosen-head, 1972; Rosenhead, Elton, and Gupta, 1972). Organizations that
______________13In Chapter 13, Savage (1950) also describes a variety of pathologies associated withthe mini-max rule. For instance, the rule often yields neither a best strategy nor asimple ordering among strategies. Furthermore, in a group context, the rule can beundemocratic because the importance of a view is independent of the number ofpeople who hold it. Participants can easily manipulate outcomes by lying about theweights they assign to alternative futures. In some cases, the mini-max rule can be toosensitive to low-probability, high-consequence events, thereby producing clearlyunreasonable results. The approach used in this study was designed to address theseshortcomings by explicitly considering an interactive group process that attempts tofind strategies robust across a wide range of values and expectations and that providesa systematic means of characterizing those values and expectations in which a par-ticular choice of robust strategy will not perform well.

54 Shaping the Next One Hundred Years
conduct scenario-based planning often look for strategies that per-form well across their scenarios (van der Heijden, 1996). Assump-tion-Based Planning (Dewar et al., 1993; Dewar, 2001) has helped theU.S. Army and other organizations involved in long-term planningmodify their strategies to reduce their vulnerabilities across a widerange of potential scenarios. A robustness criterion is implicit in thecapital investment behavior of U.S. firms (Lempert et al., 2002). Her-bert Simon’s (1959) concept of “satisficing” also bears similarities torobustness. Decisionmakers engage in satisficing to seek strategiesthat will perform above a specified performance benchmark; thoseusing robustness seek strategies that have some minimum thresholdof performance over a variety of contingencies. Engineers implicitlyuse a robust criterion when they design buildings and bridges tostand in a wide range of stressing weather and earthquake condi-tions. Ecologists have begun to use resilience, a concept related torobustness, as a measure for how a social and economic system maysuccessfully respond and adapt to shocks and other external changes(ICSU, 2002).14
Robustness is not the only possible criterion for evaluating strategiesunder deep uncertainty. For example, decisionmakers dissatisfiedwith their current status—e.g., entrepreneurs willing to risk much inpursuit of great wealth or leaders who see their nations or groups asrequiring great redress for past grievance—may define failure asmissing a fleeting chance to overturn the established order. There-fore, they may be far more concerned with assessing strategies suitedfor those few scenarios where huge gains are possible than in thosemany scenarios where the best they can do is maintain the statusquo. To address such cases, Ben-Haim (2001) proposes an oppor-tunity function that helps decisionmakers find and exploit favorableopportunities inherent in the uncertainty. But the audience for mostlong-term, global policy analyses will be those who tend to balancethe desire to exploit upside opportunities with a considerable con-cern for avoiding downside risks. For such decisionmakers, robust-ness is a powerful criterion for assessing options.
______________14Resilience and robustness are similar concepts, though the ecological communitytends to use the former to describe the properties of an ecosystem while decision ana-lysts use the latter as a criterion to compare alternative strategies.

Robust Decisionmaking 55
Implementing the Robustness Criterion
Long recognized as an important objective, robustness has not beenwidely used in quantitative studies because it is computationallyharder to implement than optimization. In recent years, however,new approaches have begun to transcend previous limitations.Researchers at the International Centre for Integrative Studies (ICIS)have developed methods that use integrated assessment models tocompare alternative management styles (represented by differentchoices of strategies) across different worldviews (represented bydifferent assumptions about model parameters). They assess howthe former fare when faced with a world different than the one thatwas assumed (van Asselt, 2000). Kouvelis and Yu (1997) have devel-oped methods for robust discrete optimization that provide analyticmini-max solutions to a variety of problem types without any need toassign priors to alternative scenarios. Their work also draws on thescenario-planning literature for methods to help choose the scenar-ios that are inputs to their analysis. Researchers have also developedmethods to find strategies robust against multiple priors, using for-mal treatments based on Bayesian analysis (Berger, 1985) and robustcontrol theory (Zhou, Doyle, and Glover, 1996).
The robustness criterion is admirably suited to discovery of usefulpolicy arguments that are true over a multiplicity of plausible futures.In contrast to such techniques as robust control theory or robustoptimization, which place analytic constraints on the mathematicsemployed, iterative robust decisionmaking methods allow analysts avery wide range of choices in the mathematical representations theyuse in the scenario generators needed to populate the scenarioensemble. This flexible quantitative approach stems from calculat-ing the regret of alternative strategies.
Regret is defined as the difference between the performance of afuture strategy, given some value function, and that of what wouldhave been the best performing strategy in that same future scenario.Following Savage (1950), the regret of strategy j in future f using val-ues m is given as
Regret (j,f)= Max Performance j ,f – Performance j,fmj
m m′
′( )[ ] ( ) (3.1)

56 Shaping the Next One Hundred Years
where strategy j’ indexes through all strategies in a search to deter-mine the one best suited to the conditions presented by future f.
A regret measure envisions people in the future benchmarking theresult of a strategy against the one that would have been chosen bypast decisionmakers if they had had perfect foresight. It also sup-ports the desire of today’s decisionmakers to choose strategies that,in retrospect, will not appear foolish compared to available alterna-tives.
It is also sometimes useful to consider the relative regret where theregret is
Relative_Regret (j,f)=
Max Performance j ,f – Performance j,f)
Max Performance j ,f
m
jm m
jm
′
′
′( )[ ] ( )′( )[ ]
(3.2)
scaled by the best performance attainable among the candidatestrategies in a given scenario (Kouvelis and Yu, 1997). This measurecaptures the notion that decisionmakers may be more concernedwith a $100 deviation from the best strategy when the best strategyearns $200 than when it earns $1,000,000.
Using either regret measure, a robust strategy is quantitativelydefined as one with small regret over a wide range of plausiblefutures, F, using different value measures, M. This definition pro-vides a natural basis for organizing explorations across the ensembleof plausible futures. Computer searches across the ensemble canhelp identify robust strategies—that is, ones with consistently smallregret across many futures, F, using many value measures, M. Addi-tional searches across the scenario ensemble can test the robustnessof proposed strategies by searching for combinations of futures andvalues where the strategies perform poorly—that is, have high regret.Robustness based on regret also provides a good selection criterionfor determining what constitutes an adequately diverse ensemble ofplausible futures. The ideal ensemble would include every plausiblefuture in which at least one of the candidate strategies might fail,according to some value system. Thus, the most interesting futures

Robust Decisionmaking 57
to explore and add to the ensemble are often those for which somecandidate strategy has large regret.
Of course, one is rarely fortunate enough to engage in LTPA thatresults in an ideal strategy with good performance properties in allplausible futures judged by all relevant value systems. In practice,long-term decisionmaking becomes an exercise in juggling difficulttrade-offs and in judging which values and scenarios should weighmore heavily and which should be downplayed. The choice rests, ofcourse, on a complicated amalgam of moral, political, and goal-defined judgments.15 The methods of LTPA being presented in thisstudy allow decisionmakers who are confronting all types of prob-lems to find robust strategies that reduce as much as possible thevalues they must balance and the wagers they must make. At the endof an LTPA exercise, they should emerge with a robust strategy and aclear understanding of the values and futures for which it performsadequately. They should also be explicitly aware of the futures andvalues that, by virtue of selecting the candidate strategy, have beenimplicitly classed as unimportant.
EMPLOY ADAPTIVE STRATEGIES
People learn. Over time, they will gain new information.16 Accord-ingly, adaptive decision strategies are the means most commonlyused to achieve robustness because they are designed to evolve inresponse to new data.17 Faced with a multiplicity of plausiblefutures, a decisionmaker may settle on near-term actions but plan toadjust them in specific ways as new information renders somefutures implausible and others more likely. For instance, a firmlaunching a new product in a test market follows an adaptive strat-
______________15In a robust decision analysis, these ethical and political judgments should be framednot in the abstract but in the context of the choice among specific alternative strate-gies. Decisionmakers are often most comfortable making such judgments precisely insuch contexts (Lindblom, 1959).16Sometimes, however, our perceived uncertainty increases over time if, for instance,new information causes us to question previous certainties. In addition, organizationsand people sometimes forget (Benkard, 1999).17Rosenhead (1989) explicitly links the ideas of robustness and adaptivity by describ-ing them as tools to assess the flexibility achieved or denied by particular choices ofnear-term actions.

58 Shaping the Next One Hundred Years
egy. If the product sells well, the firm expands distribution. If not,the firm may cancel or revise the offering.
In recent years, analysts concerned with decisionmaking under deepuncertainty have embraced the concept of adaptive decision strate-gies (Payne et al., 1993). Business publications emphasize the impor-tance of achieving adaptivity and flexibility (Haeckel and Slywotzky,1999). Such quantitative tools as real options analysis, which mea-sures the value of investments in manufacturing plants and inresearch and development using tools first developed for valuingstock and other financial options, have allowed firms to begin toassign a value to flexibility in ways that were previously not possible(Trigeorgis, 1996). Dewar’s Assumption-Based Planning process(1993, 2001) provides a framework for designing adaptive strategies.This approach comprises shaping actions intended to influence thefuture that comes to pass, hedging actions intended to reduce vul-nerability if adverse futures come to pass, and signposts or observa-tions that warn of the need to change the mix of actions. Increas-ingly, researchers are modeling the effects of alternative decisionsabout organizational structures for both private-sector (Carley, 2002)and public-sector policymakers (DeCanio, 2000). The environmentalcommunity has seen a surge of interest in adaptive management thatalso formalizes the concept of adaptive-decision strategies in the faceof uncertainty (Walters, 1986).
The concept of adaptive decision strategies underlies even some ofthe most basic institutions of our society. Market economies andrepublican governments both rest on the idea that the future isunpredictable, that any human decision is prone to error, and thatthe social good is best served by creating and defending mechanismsthat help identify and correct these errors over time. Thus, marketeconomies encourage continual experimentation with new productsand services, reward those that meet the wants of the time, and shiftresources away from those producers and providers who guesswrong.18 Many of our most fundamental freedoms, such as freedomof speech and assembly, have value as much for their instrumental
______________18McMillan (2002) argues that the institution of owning property is a means forenabling great flexibility in the face of unpredictable futures. For instance a biotechentrepreneur initially chooses to own her invention because no contract with a largefirm could possibly anticipate all the paths the invention might take.

Robust Decisionmaking 59
benefit in supporting adaptive correction to the system as a whole asfor the liberty they guarantee to individuals. These freedoms ensurethat governments are subject to a constant barrage of criticism that,when combined with periodic elections, helps expose and correct thestate’s errors. The constitutional scholar Stephen Holmes (1995, p.179) captures this information-processing and adaptive-decisioncharacter precisely when he describes “representative governmentitself as a cognitive process, fashioned to maximize the production,accumulation, and implementation of politically relevant truths.”
Adaptive strategies are not always appropriate, however. In somecases, decisionmakers can feign adaptivity to delay hard choices inthe hopes that time will solve the problem or will pass responsibilityto somebody else. On occasion, they may also find that an aura ofinflexibility can force concessions from others.19
Nonetheless, the types of problems confronted by those who mustformulate long-term policy generally demand adaptive responses. Iffor no other reason, decisionmakers of the future play an unavoid-able role in any long-term policy process enacted in the presentbecause their choices will ultimately determine whether or nottoday’s strategies prove successful. The concept of adaptivity is socentral to LTPA that we include it in our core definition: identifying,assessing, and choosing among near-term actions that shape optionsavailable to future generations.20
LTPA’s very time horizon flows from this notion of adaptivity. Inprediction-based policy analysis, the far horizon is often determinedby how far one can accurately forecast. In LTPA, that horizon shiftsto how far into the future today’s actions can influence events. Insome areas, such as many financial investments in a well-function-
______________19Thomas Schelling provides the classic example of the benefits of inflexible deci-sionmaking in his description of the game of “chicken” wherein two cars speed head-on toward each other down a narrow road and the winner is the driver who swervessecond. Analysis should help determine when such inflexible strategies are morerobust than ones that explicitly embrace flexibility.20The analysis described in this report entails computational search for near-termpolicies that are robust to a range of plausible behaviors of future actors. This is, ineffect, an application of computational game theory. Computational game theorybased on computational experiments can investigate a wider range of assumptionsthan can mathematical game theory but cannot produce deductive proofs of generalfacts.

60 Shaping the Next One Hundred Years
ing economy, the time value of money (as well as the internal dis-count rate) clearly applies and the influence of today’s actions dissi-pates within a few years. In other areas—e.g., decisions about roads,buildings, and other capital infrastructure; the creation of new tech-nology; decisions affecting the environment; decisions that shape thepolitical institutions within and among nations—today’s actions canhave effects that reverberate for decades or centuries.21
In general, the most successful near-term strategies will foreclosesome future options while leaving others open. For instance, parentsoften strive to give their children a great deal of opportunity to pur-sue their own interests but little chance and inclination to deviatefrom the parents’ values. In the political arena, achieving consensuson an adaptive strategy often requires the ability to foreclose certainfuture options contingent on future events or information thatbecomes available. For example, a decision to conduct an environ-mental-impact assessment prior to a construction project maygather the greatest support if all parties believe the construction willgo forward or not depending on the conclusions of the assessment.The proper functioning of the adaptive, error-correcting capabilitiesof democratic governments requires that their constitutions restrictcertain behaviors, such as the ability to silence minorities or ignorethe results of elections (Holmes, 1995). Similarly, market economiesrely on government power to enforce private contracts entered intoin anticipation of future events that may or may not unfold as envi-sioned. In general, economies operate in a manner that causesresources to flow to those whose risk-taking is successful and awayfrom those whose risk-taking is not.
The most successful long-term policymakers not only work toexpand their successor’s capabilities. By influencing future values,
______________21A large body of research exists about discount rates and their impact on long-termdecisionmaking. See Weitzman (1998); Cropper and Laibson (1998); and Newell andPizer (2001) for discussions of low, hyperbolic, and uncertain discount rates, respec-tively. LTPA presents a multiattribute decision problem whose various elements mayhave different discount rates depending on their degree of substitutability. This, too,represents a factor in which preferences vary, just as they do across other aspectswhere preferences and value systems enter. Different discount rates would of coursehave very different implications in decision systems. This important point is dis-cussed further in Chapters Four and Five. However, the example presented in ChapterFive of this report uses a common discount rate for each of the multiattribute ele-ments.
Robust Decisionmaking 61
expectations, institutions, physical endowments, and experiences,today’s decisionmakers also aim to constrain the choices of futuredecisionmakers, and thus the paths adaptive strategies will follow asthey unfold over generations.
Previous analytic approaches to LTPA have not typically supportedthe crafting of adaptive strategies, despite their obvious importance.Instead, those tools subtly reinforce the predisposition of analysts tothink in terms of once-and-for-all policy decisions. Approachesfocused on prediction do not reward adaptivity. In a predictableworld, any course other than the “best” strategy is, by definition,suboptimal. On occasion, LTPA conducted with traditional decisionanalyses will usefully examine very simple types of adaptive strate-gies (Hammitt, Lempert, and Schlesinger, 1992; Manne and Richels,1992; Nordhaus, 1994). In general, however, representing adaptivestrategies in simulation models makes it computationally muchmore difficult, if not impossible, to use standard optimizationapproaches to discover good policies.
In this report, near-term strategies are explicitly presented as algo-rithms that initially prescribe a particular set of actions. Over time,however, the algorithms incorporate new information by monitoringone or more key trends in the internal or external environment. Theymay then specify new actions contingent on these observations.Often the concepts and techniques of agent-based modeling areused to represent these algorithms. Precedents exist in the psycho-logical and organizational literatures to support representing deci-sionmaking in the form of algorithms. Humans generally reasonusing heuristics to determine which information they should trackamong an infinite sea of possibilities and how they should respond tothe expected observations (Gigerenzer and Todd, 1999).
The design of successful adaptive decision strategies is difficult.Human policymakers often conduct mental simulations to play outthe implications of decision algorithms and to appeal to experiencein determining the decisionmaking heuristic they ought to use. Thisrule-of-thumb approach works well as long as the future is similar tothe past. As the long-term future deviates from familiar experience,trusted rules of thumb can break down. To surmount this obstacle,robust decision methods compare the performance of alternativeadaptive decision strategies looking for those that are robust across a

62 Shaping the Next One Hundred Years
large ensemble of plausible futures. These systematic explorationshelp decisionmakers assess alternative algorithms and choose thosenear-term actions that can best shape the choices available to futuregenerations.
COMBINE MACHINE AND HUMAN CAPABILITIESINTERACTIVELY
Traditional approaches to decision support use the computer as anelaborate calculator. Analysts initially carry out detailed exercises inreasoning to draft the best model and examine all the assumptionsrelevant to a particular decision before feeding the results into thecomputer. The computer produces a ranking of alternative strategiescontingent on these assumptions and, in particular, identifies theoptimum. More-sophisticated efforts may also include analysis ofhow sensitive the optimal strategy is to the various assumptionsmade at the start of the analysis (Saltelli, Chan, and Scott, 2000).Then, leaving the computer aside, analysts provide a synopsis of theresults to decisionmakers who engage in a subsequent and separateprocess to integrate the results—along with a great deal of informa-tion not included in the computer’s calculations—into the institu-tional and political fabric of decisionmaking.22
Modern information technology makes possible a new and morepowerful form of human-machine collaboration, one better suited tofinding adaptive strategies that are robust over time. Rather thanrestrict the computer’s province to serving as a calculator, its capa-bilities may be used to handle, display, and summarize vast quanti-ties of information. The computer thus becomes a device that, fromthe outset of the analytical process, helps humans shape and testhypotheses about the most robust near-term actions to take in theface of multiple long-term futures. Such information is often mostusefully presented in the form of interactive computer-generated
______________22Seen in this light, the basis for the multimillion dollar industry of selling and buyingforecasts of prices, markets, political outcomes, and other future developmentsbecomes clearer. Rather than the people buying (or selling) such information havingfull confidence in any particular prognostication, the value proposition that sustainsthis market may be that consumers find it the best available means to constantly test,modify, and add to their own internal set of plausible stories about future outcomes.They base their decisionmaking on that set of stories.

Robust Decisionmaking 63
visualizations that can be regarded metaphorically as maps of themany potential paths into the long-term future. The computer helpshumans identify, create, and explore the maps most useful to chartthe next steps of the journey. These artifacts can become a crucialstructure for a conversation among the parties to a decision. Humandebates that remain unaided by data and the causal informationcontained in computer simulations often degenerate into contests ofconvincing narrative. The best-told story becomes the most com-pelling argument, whether or not it reflects available information. Incontrast, a robust decision approach can free humans to pursue thefull range of their imaginations, tethered only by the constraints ofwhat is known.
Gathering Information
The tools used in this study allow humans to conduct a systematic,interactive, computer-aided exploration across a multiplicity ofplausible futures with the goal of reaching consensus on near-termactions to shape the long-term future favorably. The particularrobust decision method used in this study, RAP™23, begins as ana-lysts define the decision problem faced by their intended audience—e.g., government officials, business leaders, a community of stake-holders party to a decision—and gather a wide variety of informationrelevant to that decision. This might include quantitative data; rele-vant theoretical understanding from the scientific, economic, andbehavioral science literatures; existing computer simulation models;existing forecasts; public positions staked out by parties to thedebate; and elicitations of qualitative understandings, intuitions, andvalues from key parties. Analysts embody the available informationin scenario generators—i.e., the computer code designed to trace outthe consequences of each alternative set of assumptions.
______________23Evolving Logic’s Robust Adaptive Planning (RAP™) method has been applied inboth the public and private sectors to several previously intractable problems thatrequired decisionmaking under conditions of complexity and deep uncertainty. Por-tions of the method have been used in such policy realms as science and technologyplanning (Lempert and Bonomo, 1998), higher education (Park and Lempert, 1998),military procurement (Brooks, Bankes, and Bennett, 1999), national security strategy(Dewar et al., 2000; Szayna et al., 2001), and environmental policy (Lempert andSchlesinger, 2000; Lempert, 2001). This report presents a first application of themethod in its full form to LTPA.
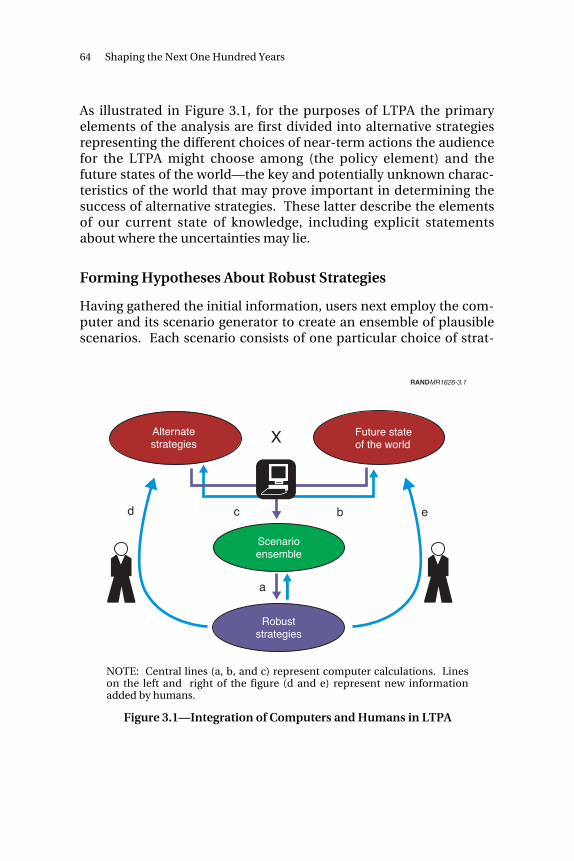
64 Shaping the Next One Hundred Years
As illustrated in Figure 3.1, for the purposes of LTPA the primaryelements of the analysis are first divided into alternative strategiesrepresenting the different choices of near-term actions the audiencefor the LTPA might choose among (the policy element) and thefuture states of the world—the key and potentially unknown charac-teristics of the world that may prove important in determining thesuccess of alternative strategies. These latter describe the elementsof our current state of knowledge, including explicit statementsabout where the uncertainties may lie.
Forming Hypotheses About Robust Strategies
Having gathered the initial information, users next employ the com-puter and its scenario generator to create an ensemble of plausiblescenarios. Each scenario consists of one particular choice of strat-
RANDMR1626-3.1
Future stateof the world
Alternatestrategies
Scenarioensemble
Robuststrategies
X
d c b e
a
NOTE: Central lines (a, b, and c) represent computer calculations. Lineson the left and right of the figure (d and e) represent new informationadded by humans.
Figure 3.1—Integration of Computers and Humans in LTPA

Robust Decisionmaking 65
egy, often adaptive, and one particular manifestation of a future stateof the world. At this point, users can explore these scenarios by cre-ating interactive computer visualizations referred to as “landscapesof plausible futures.” These two- or three-dimensional graphicsapply one or more values to compare the performance of alternativestrategies across a range of futures. We have used a wide variety ofsuch visualizations in our research (see, for instance, the review inBankes, Lempert, and Popper, 2001). Chapter Five will employ manytwo-dimensional colored region plots that represent slices throughthe multidimensional input and output space.
Guided by the computer, users select landscapes that appear usefulto address the policy questions of interest. The parameter rangesthat define a particular landscape of plausible futures might bedrawn from the poles of the debate over the issue at hand as well asfrom the analysts’ intuitions about potential solutions. In addition,the choice of parameters to display on the axes of the visualizationsand the values of those parameters held constant over the plot areoften suggested as ones particularly interesting by computer searchand sensitivity analysis. Chapter Five will demonstrate that by exam-ining such landscapes, users can systematically explore the multi-plicity of plausible futures, expand the diversity of the ensemble,detect significant patterns, and gain insight into key system drivers.Most important, by considering these ensembles of scenarios, thehuman-computer team then identifies strategies that are potentiallyrobust over the range of plausible futures (path “a” in Figure 3.1)
Testing Hypotheses
Once they have formed initial claims about robust strategies, userscan test and revise these hypotheses through computer search forother futures that would invalidate that claim (path “b”), and thenhelp identify additional promising alternative strategies (path “c”).Computer-search algorithms can suggest futures that could causecandidate robust strategies to fail and find alternatives that mightperform well under the newly specified conditions. Again, inter-active visualization is a powerful means to help people judgewhether these futures pose sufficient risks to warrant revising thestrategy. The particular landscapes that display such comparisons

66 Shaping the Next One Hundred Years
are termed “robust regions” in harmony with the policy regionanalysis of Watson and Buede (1987).
These searches for “breaking” scenarios24 may occur entirely withinthe space of futures and strategies contained in the initial ensem-ble—that is, within the capabilities of the current scenario genera-tors. As the analysis proceeds, human participants in the analysis areencouraged to hypothesize about strategic options that might provemore robust than the current alternatives (path “d”) or to suggest“surprises” that might occur in the future to cause an apparentlyrobust strategy to fail (path “e”). These new candidates can be addedto the scenario generator and their implications dispassionatelyexplored by the computer.
Information gathering occurs throughout the analysis. Given theunpredictability of the future, no one can determine a priori all thefactors that may ultimately prove relevant to the decision. Thus,users will frequently gather new information that helps define newfutures relevant to the choice among strategies, that proves somefutures implausible and thus removes them from the ensemble, orthat represents new, potentially promising strategies.
CONCLUDING THOUGHTS
This chapter discussed the mechanics of one particular robust deci-sion method that will be used in the analysis that follows. It is usefulnow to rise above the level of detail for a broader consideration ofwhat such methods are intended to provide.
Robust decisionmaking under conditions of deep uncertainty maywell fail to yield a demonstrably definitive answer of the type gener-ally provided by traditional quantitative decision analysis. Any suchexercise will surely leave futures and options unexplored. However,this iterative process does help humans and computers create adiverse ensemble of plausible futures consistent with availableinformation and systematically identify near-term actions that arerobust across the ensemble. Rather than prove conclusively that oneparticular strategy is the best choice, the process generates inductive
______________24This term will be discussed extensively in Chapter Five.

Robust Decisionmaking 67
policy arguments based on a structured exploration over the multi-plicity of plausible futures.
By their very nature, robust decision methods have no means toprove that Strategy A always performs better than Strategy B over allpossible futures. Rather, they seek to make persuasive claims basedon comparing the performance of those strategies over a large, well-chosen sample of scenarios. This approach stands in contrast todeductive arguments of traditional quantitative policy analysis thatseeks to prove claims about the performance of alternative strategies.However useful, such methods usually achieve their rigor at a price.They require one or more highly restrictive assumptions about therepresentation of the problem that may well exclude a vast range ofplausible futures.
The approach to combining human and machine reasoning outlinedin this section is quite similar to what occurs within and amonghuman communities discussing strategy. One person or communitymay argue for a decision while others attempt to discover facts orpossibilities that break that argument. Similarly, one communitymay pose a problem; another, devise an answer. There is no guaran-tee that this process will produce a correct outcome, just as scienceprovides no certainty that the next experiment will not produceunexpected results and overturn currently accepted theories.25
Nonetheless, such competition among individuals and communitiesis at least one element of effective organizational decisionmakingand, indeed, the process of science itself. The goal of the present dis-cussion is to illustrate how the computer may facilitate this powerfulmode of testing and discovery and in so doing provide decision-makers and interested communities with a different paradigm forapproaching policy and strategic choice in the realm of deep uncer-tainty. The balance of this study will provide such an illustration.
______________25The parallelism stems from the recognition of how much of a role inductive reason-ing plays in each. The usual simple story about the scientific process emphasizes therole of deductive approaches to falsifying hypotheses. It rarely discusses the origin ofthose hypotheses for testing or how the results fit into a larger frame of belief. Induc-tive reasoning is common in the experimental physical sciences (Popper, 1959).


69
Chapter Four
A FRAMEWORK FOR SCENARIO GENERATION
This chapter begins the demonstration of a robust decisionmakingapproach to LTPA. This report aims not to produce specific policyrecommendations but rather to reveal the new capabilities that arenow available to those concerned with the long term. The analysishere involves neither the level of detail nor the level of stakeholderparticipation necessary for practical policy results. Its novelty restsin the framing of means for applying robust decision methods toproblems of LTPA. By focusing on a specific challenge—the issue ofglobal sustainability—the relative simplicity of the treatment thatfollows permits a greater focus on the main methodological themes.
An analysis of this type needs to begin with the gathering of informa-tion and the formation of the analytical framework that will sustainall that follows. This chapter will describe how this effort can bemost usefully pursued to support a robust decision method LTPA.
THE CHALLENGE OF GLOBAL ENVIRONMENTALSUSTAINABILITY
What Near-Term Strategy Will Help Ensure Strong EconomicGrowth and a Healthy Environment over the Course of theTwenty-First Century?
Sustainability presents a serious global policy challenge, one suffi-ciently novel that decisionmakers are likely to make serious mistakesif their actions are not based on quantitative policy analysis. Thesustainability debate is well developed. It has identifiable camps thathave generated articulate, conflicting arguments that cannot, at pre-

70 Shaping the Next One Hundred Years
sent, be proven to be false. A considerable store of data andcomputer-simulation modeling is available to inform the debate.Finally, sustainability represents a type of policy problem in whichthe pursuit of one widely shared goal—in this case, economicgrowth—can undermine other important objectives—in this case,environmental quality. Each is intrinsically valuable and necessaryto the pursuit of the original goal.1
THE “XLRM” FRAMEWORK
As with any formal analysis, the approach used in this study requiresassembling and organizing the relevant, available information.Because the process is cyclical and iterative, this step recursthroughout the course of the analysis. To help guide the process ofelicitation and discovery and to serve as a formal intellectual book-keeping mechanism, it is useful to group the elements of the analysisinto four categories. Policy levers (“L”) are near-term actions that, invarious combinations, comprise the strategies decisionmakers wantto explore. Exogenous uncertainties (“X”) are factors, outside thecontrol of the decisionmakers, which may nonetheless prove impor-tant in determining the success of their strategies. In the language ofscenario planning the Xs help determine the key driving forces thatconfront decisionmakers. Measures (“M”) are the performancestandards that decisionmakers and other interested communitieswould use to rank the desirability of various scenarios. Relationships(“R”) describe the ways in which the factors relate to one another andso govern how the future may evolve over time based on the deci-sionmakers’ choices of levers and the manifestation of the uncer-tainties, particularly for those attributes addressed by the measures.The relationships are represented in the scenario generatorcomputer simulation code. As described in Chapter Three, theremay often be considerable structural uncertainty about many rela-tionships.
______________1Many long-range policy challenges have this character. For instance, the pursuit ofphysical security in the face of internal or external threats can undermine civil libertiesthat are both revered and necessary to support the public criticism required to correcterrors in the government’s security policy. In addition, the pursuit of economicgrowth may undermine the social stability and trust that make capitalism possible.

A Framework for Scenario Generation 71
The primary source of information for this study was the existing lit-erature on sustainability. However, the project team also assembleda group of RAND experts in various fields who provided methodolog-ical guidance as project advisors and acted as surrogate stakeholdersfrom whom we could elicit opinions and information on sustainabil-ity.2 We used the “XLRM” framework to organize our internal delib-erations and to structure discussions with the advisory group.3 Inthis and other work, XLRM has proven a powerful method for elicit-ing and organizing information relevant to decisionmaking chal-lenges under conditions of deep uncertainty.
The remainder of this chapter provides a tour of the XLRM factorsconsidered in the current analysis and gives additional informationabout how the framework can be applied to LTPA. Table 4.1 displaysthese factors. Those included from the outset are shown in Romantype; those added later in the process are shown in italics. In keepingwith the didactic purpose of this exercise, no specific group of deci-sionmakers has been envisioned as having responsibility for imple-menting the recommendations of this study. Imagine the analysis asbeing placed at the disposal of such global gatherings as the UnitedNations environmental summits.4
Exogenous Uncertainties Affecting the Future (X)
Those who participate in the sustainability debate make importantassumptions about the factors likely to guide the course of eventsover the twenty-first century. These assumptions often prove crucialto supporting their views about desirable near-term policy actions.
______________2The members of the panel of experts included Robert Anderson (information tech-nology), Sandra Berry (survey techniques), James Dewar (long-term policy analysis),Robert Klitgaard (economics and development), Eric Larson (defense analysis), JuliaLowell (economics), Kevin McCarthy (demographics), David Ronfeldt (political sci-ence), and Georges Vernez (demographics).3This discussion continues the long-standing practice of ordering the letters XLRM,notwithstanding the fact that it provided clearer exposition in this treatment to discussthese factors in the order found below.4This work was briefed at the Science Forum, a parallel event of the World Summit onSustainable Development held in Johannesburg, South Africa, on August 31, 2002(Lempert, 2002b).

72 Shaping the Next One Hundred Years
Table 4.1
Key Factors Used to Construct Ensembles of Sustainability Scenarios
(X) Exogenous Uncertainties (L) Policy Levers
EconomyGrowth ratesDecoupling ratesEffect of environmental degradation
on growthCost and effectiveness of policy inter-
ventionsCoupling between North and SouthPotential surprises
EnvironmentEffect of pollution on environmental
carrying capacityResiliency of environmentPotential surprises
DemographicsPopulation trajectoriesEffect of economic growth and envi-
ronmental quality on populationPotential surprises
Future DecisionmakersInformationValuesCapabilitiesPotential surprises
Policies to speed decoupling rateNear-term milestones
Ability to relax near-term milestones
(R) Relationships (M) Measures for Ranking Scenarios
Equations contained in modified“Wonderland” scenario generator
Rate of improvement inGDP per capitaLongevityEnvironmental quality
WeightingsNorth versus Southa
Environmental versus nonenviron-mental measures
Discount rateVantage years
a“North” here is shorthand for Organization for Economic Cooperation and Devel-opment (OECD) countries and “South” is shorthand for countries that are not mem-bers of the OECD.
A Framework for Scenario Generation 73
The project team reviewed the sustainability literature and extractedwhat appeared to be the key, sometimes implicit, assumptionsunderlying the proposals of the various camps and then, as shown inthe upper left quadrant of Table 4.1, divided them into four cate-gories: those affecting the economy, environment, demographics,and behavior of future decisionmakers. This section will reviewthese exogenous uncertainties and describe how they were repre-sented in the computer to conduct the LTPA.
Sustainability has become a key agenda item for many businesses,governments at all levels, and for a wide variety of nongovernmentalorganizations and other citizen’s groups. At one extreme of the sus-tainability debate lie those who believe that catastrophe awaits ifsociety fails to take immediate and aggressive steps to reduce pollu-tion. Perhaps the most famous exemplars of this camp are the“Limits to Growth” advocates, such as Paul Ehrlich and the Club ofRome (Meadows and Meadows, 1972). Noting the properties ofexponential growth and the astounding fact that up to 40 percent ofall the energy in the Earth’s biosphere is currently consumed byhumans (Vitousek et al., 1986), these commentators argue that theenvironment imposes real physical limits on the growth of bothhuman populations and economic activity. Other commentatorssuch as Bill McKibbon (1989), following in the tradition of AldoLeopold (1949), focus on moral rather than physical constraints.They assert that human activities are threatening to engulf all ofnature, thereby creating a sterile planet where nothing lives that isunmanaged by humans. They question whether material posses-sions are worth such a cost.
At the other extreme are those such as Julian Simon (Myers, Myers,and Simon, 1994) and, more recently, Bjorn Lomborg (2001), whoargue that human ingenuity mobilized by scarcity can eliminatealmost any credible environmental constraint. They note that, overthe decades, the forecast price increases of most resources deemed“nonrenew-able” have failed to materialize because the incentivesand technologies for extraction or for substitution have alwaysimproved at a faster rate than society’s demand has increased. Thereal price of oil, for example, is now lower on average than it has everbeen except when shortages induced by political crisis or war tem-porarily inflate the price. The “Unlimited Growth” advocates rec-ommend faster economic growth as a means of alleviating poverty

74 Shaping the Next One Hundred Years
and a host of other human miseries. Many in this camp take a liber-tarian bent, focusing on human ingenuity that draws its incentivesfrom markets. Others, such as Gregg Easterbrook (1995), argue thatthe dramatic improvement in environmental quality in developedcountries is the most significant, unsung success story of the lastthree decades.5 However, they credit innovations in governmentinstitutions and regulations that give expression to new human val-ues as the prime movers of this promising trend.
Of course, most commentators and policymakers lie between thesetwo extremes. As commonly conceived, sustainable developmentseeks to eliminate the seemingly irreconcilable conflicts between“Limits To” and “Unlimited” Growth. As first expressed by theBruntland Commission, sustainability is often defined as meeting theneeds of the present while not compromising the ability of futuregenerations to meet their needs. A vast body of literature attempts tohelp governments and businesses balance the goals of economicgrowth and environmental protection. For example, in the GSG sce-narios described in Chapter Two, the “Conventional Worlds” scenar-ios capture the worldview of those who believe that well-regulatedmarkets as currently constituted can meet the challenges of sustain-able development. “Barbarization” scenarios represent those whobelieve that future challenges may cause such institutions to fail.“Great Transition” offers an alternative set of near-term policiesdesigned to help humankind avoid the potential dangers some see inour current path.
The key economic assumptions that distinguish the positions of theparticipants in the sustainability debate include the exogenous ratesof economic growth—i.e., what the base growth rates will be in theabsence of environmental degradation and policy designed to pre-vent such degradation—and the decoupling rate (Azar, Holmberg,and Karlsson, 2002)—that is, that rate at which technological andother forms of innovation reduce the amount of pollution generatedper unit of economic output. Some of the most important differ-ences between the Limits to Growth and Unlimited Growth campsrest on assumptions about whether or not the future decoupling ratewill outpace the future rate of economic growth. Other core
______________5The story is often different in the developing countries of the Southern Hemisphere.

A Framework for Scenario Generation 75
assumptions include the effect of any environmental degradation oneconomic growth; the costs, effectiveness, and time lags associatedwith any policy interventions; and the extent to which changes inpatterns of growth in either the North or the South affect growth inthe other region. While much information exists that can informjudgments about each of these factors, they cannot be predicted withany certainty even a decade, much less a century or more, into thefuture.
Key environmental assumptions include the effect of annual levels ofpollution on environmental quality, particularly whether and at whatlevel there exist any critical pollution thresholds beyond whichemerge abrupt, discontinuous changes in environmental damage.6
In addition, different parties have different views of the resilience ofthe environment under stress. Some see the environment as fragile(e.g., push it too far and it will collapse) while others see it as funda-mentally resilient (e.g., even if pollution destroys the most vulnerableecosystems, the remaining ones will be more difficult to damage).
Key demographic assumptions include trends in birth and deathrates in different regions of the world,7 how these trends would beaffected by changes in wealth per capita, and the effect of environ-mental degradation on birth and death rates.
Finally, the parties to the sustainability debate often hold radicallydifferent views about the capabilities of future decisionmakers todetect and successfully respond to the environmental problems thisgeneration bequeaths to them. One of the crucial differencesbetween the GSG’s “Conventional Worlds” and “Barbarization” sce-narios is the set of assumptions about the ability of future genera-tions to respond to increasing environmental stress. In the formerscenarios, far-sighted decisionmakers pay attention to warning signsand adapt to emerging challenges. In the latter, society cannotsummon the will to respond in time. In fact, a strong theme of moralequivalency among generations underlies many of the arguments ofthose who favor near-term actions to address sustainability con-
______________6There is, for instance, increasing interest in and understanding of potential abruptchanges in the climate system that might be caused by human actions. See NationalAcademy Press (2002).7Migration rates are also important, but not included in Table 4.1.

76 Shaping the Next One Hundred Years
cerns. Very much in the spirit of the adaptive decisionmakersdescribed in Chapter Three who attempt to shape the values andexperience of those in the future, these parties assert that future gen-erations will need to respond wisely to early warning signs of envi-ronmental dangers and that one of the most important legacies thisgeneration can bequeath to its descendants is the example of its hav-ing taken such actions.
Near-Term Policy Levers (L)
In the face of deep uncertainty, potential actions nevertheless couldbe taken in the present to decisively shape the long-term future. Thesustainability literature is replete with suggestions for policies rang-ing from environmental regulations to enhancing innovation, chang-ing values, creating institutions, or conducting environmentalresearch. The policy community is struggling with strategies forcombining these potential actions into coherent and effectiveimplementation plans.
A key simplification in this demonstration analysis, and the primaryreason it cannot support actionable policy conclusions, is that itconsiders a greatly truncated menu of policy levers. In fact, theanalysis begins by presuming that only one option is available: apollution tax that can speed the decoupling rate—that is, the rate atwhich innovation reduces the pollution society generates per unit ofeconomic output. Any chosen lever will have associated costs andtime lags. The actual values of these factors are among the keyuncertainties. This analysis takes a global perspective and thus doesnot consider questions of a game-theoretic character regarding howpolicy choices in one region might affect the choices made inanother, even though it is clear that regions are linked economicallyand environmentally.
In later stages of the analysis, we introduce an important, though stillhighly limited, addition to the menu of policy levers. Decisionmak-ers may set near-term milestones for the rate at which emissions areallowed to grow. As described in detail in Chapter Five, once a mile-stone is set, the prevailing assumption is that society then adjusts itspolicies to achieve an innovation rate that will allow attainment ofwhatever emission-intensity reduction level is required to meet themilestones. Such milestones are of much current interest to policy-

A Framework for Scenario Generation 77
makers. For example, this is the philosophy that informs the effort toframe and meet the UN Millennium Development Goals. Our pro-ject might well be characterized as one designed to develop hithertounavailable quantitative means for assessing and choosing suchmilestones.
A simplified set of policy levers allowed us to focus on developingstraightforward (though complex) methodology to apply to muchmore complicated cases than we used in our demonstration. It alsoyields what appears to be a surprisingly interesting policy story. It isimportant to note, however, that the methodology itself is com-pletely general in the types of uncertainties, levers, relationships, andmeasures that may be considered and, thus, should be applicable toa very wide range of policy problems.
Measures for Ranking Scenarios (M)
In addition to their vastly different expectations about the future,many of the parties to the global sustainability debate also have fun-damentally different value systems. Citizens of wealthy or develop-ing nations, environmentalists, industrialists, and public officialsmay hold decidedly contrary views about what constitutes a desir-able long-term future. Any attempt to compare the efficacy of alter-native near-term policies must not only be robust across many futurescenarios, but it must also accommodate a range of viewpointsregarding desirable outcomes.
In the language of decision analysis, the challenge of global envi-ronmental sustainability is unavoidably a multiattribute problem(Keeney, 1976). This goes beyond issues of subjective taste or differ-ing utilities. Even an internally consistent set of desires may generatea number of success measures that may not be completely synony-mous. For example, a business firm might consider such indicatorsof success as profitability, market share, and shareholder asset valueto be equally important, to say nothing of measures that might ariseout of the particular nature of corporate culture. Therefore, therealm of measurement must be included in formal explorations ofLTPA.
An extensive literature exists on the proper way to measure sustain-ability and the betterment of the human condition. Many alterna-

78 Shaping the Next One Hundred Years
tives have been proposed to serve a variety of purposes. Standardeconomic national-income accounting measures gross domesticproduct, current account balances, and a family of related concepts.Although they have few competitors for commonality of use, suchmetrics were not designed or intended to address fundamental con-cepts such as human development and environmental soundness.To remedy some of the perceived shortcomings, the UN Develop-ment Programme (UNDP) annually issues the Human DevelopmentIndex (HDI) for 162 countries (UNDP, 1990, 2001). The HDI aims tosummarize and compare trends in development among countriesrather than to comprehensively measure the progress in individualnations. The index for any country is a weighted sum of its incomeper capita and levels of education and longevity.8 Many other sum-mary and comparative measures have also been proposed to focuson additional or different measures of the human condition. Forinstance, since 1972 Freedom House has published its annual Free-dom Index ranking countries according to the degree they respecthuman rights and are democratically governed (available at http://www.freedomhouse.org). There are also ongoing, though as yetunadopted, efforts to define a “Green GDP” to account for changes inenvironmental quality as well as economic growth (Nordhaus andKokkelenberg, 1999).9 These Green GDP measures often account fornatural resource depletion and pollution levels. They do not, how-ever, generally address the health of ecosystems and their ability todeliver important services to society, also potentially critical compo-nents of a healthy environment.
In this report, evaluation of the desirability of alternative scenarios isperformed by using a family of measures modeled after both the HDIand the concept of a Green GDP. This choice was driven by the needto use measures that could be compiled from computer simulationoutput derived from our simple scenario generator. The desire wasnot to take a particular stance regarding which of the many proposals
______________8The UNDP describes the HDI as measuring “the overall achievements in three basicdimensions of human development: longevity, knowledge, and a decent standard ofliving. It is measured by life expectancy, educational attainment (adult literacy com-bined with primary, secondary, and tertiary enrollment), and adjusted income percapita in purchasing power parity (PPP) U.S. dollars.”9See Prescott-Allen (2001) for an attempt to provide a comprehensive set of measuresfor human and ecological well-being.

A Framework for Scenario Generation 79
for measuring the future human condition are most appropriate.Rather, the point was to make explicit the need to use multiple mea-sures of the relative desirability of alternative scenarios. For ananalysis in an actual decision-support role intended to producepolicy-relevant conclusions, it would be necessary to craft measuresthat better capture the full range of aspirations held by all of theindividuals and groups who must participate in any near-term deci-sions about long-term sustainability. The treatment here merelysuggests measures that appear to characterize key points of view rep-resented in the sustainability literature. While the selected measurescannot be claimed to represent the values of actual individuals, theydo support a demonstration of how sets of such measures can beused in LTPA.
The measures used in this report focus on three key time series pro-duced by the scenario generator: output per capita, longevity, andenvironmental carrying capacity. The first two are represented in theHDI, albeit in somewhat different forms. The third time series repre-sents one plausible component often proposed for a Green GDP. Aseries for level of educational attainment could not also be includedbecause the scenario generator used in this robust decision analysiscontains no module for education. The environmental carryingcapacity considered here is clearly an abstraction that serves to sidestep important problems of data availability and interpretation con-fronting those currently trying to construct comprehensive measuresof environmental quality.
Appendix A fully describes the measures used in this report to rankthe desirability of various scenarios. In brief, however, each measuresummarizes the average rate of annual change exhibited by two orthree time series for a century or more into the future. These averagerates of change are discounted to the present so that near-termimprovements (or degradations) in output per capita, longevity, orenvironmental carrying capacity count more heavily than those inthe far future. Many economically focused measures of the humancondition use such rate-based approaches. The HDI does not, focus-ing instead on annual snapshots of the relative performance of alarge number of countries. The rate-of-change measure is preferablefor this study, which must assess trajectories for a small number ofregions over a large number of years.

80 Shaping the Next One Hundred Years
This approach yielded four distinct measures of the desirability ofalternative scenario outcomes from the discounted time series byapplying different weightings across them. As shown in Table 4.2,the weightings differ in the emphases they place on the balancebetween outcomes in the developed “North” and the developing“South” and between the economic and environmental time series.The first measure, called the “North Quasi-HDI,” considers only out-put per capita and longevity in the North. The second, “WorldQuasi-HDI,” uses a population-based weighting for the output percapita and longevity in both the North and South in aggregate. Thethird, “North Green-HDI,” again focuses on the North only but bal-ances losses in environmental carrying capacity by weighting themequally with any gains in output per capita and longevity. Thefourth, “World Green-HDI,” uses the same weighting scheme popu-lation weighted for the entire world.10
The best way to get a sense of how these measures perform is toapply them to past epochs. Table 4.3 shows a World Quasi-HDIranking for several historical periods using a 2 percent discount rate.The long-lasting U.S. economic boom in the late twentieth century(post-1950) would score 3 percent annualized growth in the quasi-HDI measure while the twentieth century in its entirety would rank a2.1 percent, with rapid growth at the beginning and end balanced by
Table 4.2
Four Measures Used to Assess Ensemble of Sustainability Scenarios
North World
Quasi-HDI N$, includes North GDP/capitaand longevity
W$, includes Global GDP/capitaand longevity
Green-HDI NG, includes North GDP/capita,longevity, and environmentalcarrying capacity
WG, includes GlobalGDP/capita, longevity, andenvironmental carryingcapacity
______________10One could create additional measures by using different discount rates and/or dif-ferent vantage years—that is, the year at which the time series are discounted to. Vari-ations in discount rate addresses different weightings of the far-term versus the near-term future and variations in vantage year describe how people 25 or 50 years in thefuture might rank various scenarios. This report does not cover such explorations.

A Framework for Scenario Generation 81
Table 4.3
World Quasi-HDI Measure Applied toPast Centuries
Period World Quasi-HDI
1800 to 2000 1.2%1900 to 2000 2.1%1950 to 2000 3.0%
two World Wars and a Depression in the middle. Not shown inde-pendently in the table, the decades of the 1930s and 1940s wouldscore less than 1 percent. Although this illustration is for only one ofthe measures, the four alternatives were scaled so that each producesa similar range of numerical values. Thus, Table 4.3 suggests that ascore of 3 percent using any of the four measures is an excellent out-come while a score of 1 percent is bleak, given the experience ofrecent decades. Calculating the “regrets” of alternative strategies (asrequired to assess robustness) focuses on differences among scores.Table 4.3 suggests that a regret of 1 percent or more (roughly the dif-ference between a score of 2.1 percent and the score of less than 1percent for the years of Depression and World War) would mean theequivalent of exchanging the performance of the twentieth centuryas a whole for that of the 1930s and 1940s stretched across a full 100years.
Ultimately, the emphasis placed on measures is crucial for LTPAwhere a homogeneous set of values by which one might measure thedesirability of outcomes may not be assumed across time or even inthe contemporary setting across interest communities. Just as theuncertainties, levers, and alternative relationships must be fullyinvestigated, so too must the metrics and values of assessment bemade an explicit part of the analytical exploration required for LTPA.
Relationships in the Scenario Generator (R)
In the XLRM framework, the Rs—or relationships—signify the linksamong the Xs and Ls as inputs or descriptors of a scenario and theMs that measure the relative desirability of alternative scenarios.These linkages define the steps and mathematical calculations car-ried out by the scenario generator computer software. The method-

82 Shaping the Next One Hundred Years
ological focus of this research effort argued against creating a sce-nario generator from scratch, even though the design requirementsfor writing the necessary code are different from those of computermodels intended for prediction. It seemed more prudent to take amodel from the existing literature and use it to frame the scenario-generation effort because our goal was to emphasize the overallmethod and avoid inappropriate concentration on modeling details.
We therefore conducted a survey of computer models relevant toglobal sustainability. Several offered significantly more detail andwere more widely utilized than the one ultimately selected. How-ever, none could produce a sufficiently wide range of scenarios toeffectively address the issue of robustness. In general, a modeldesigned for prediction will strive for validity through as precise aspossible a representation of particular phenomenology. Thus pre-dictive models may often prove ill-suited to producing the necessarydiversity of scenarios and will require important modifications toserve as scenario generators. The more complicated models consid-ered for use as scenario generators would have been much more dif-ficult to modify because of their complexity, the lack of access tosource code, or both. Consequently, they would not have offered anacceptable starting point for representing crucial aspects of therobust decision approach—e.g., consideration of near-term adaptivepolicies and the adaptive responses of future generations. As a con-sequence of these considerations, a simple systems-dynamics modelknown as “Wonderland,” based on the work of Herbert and Leeves(1998), was chosen as the scenario generator for this analysis.
The Wonderland Model. Wonderland tracks changes in the econ-omy, demographics, and environment. The original one-regionmodel was modified for this project to represent a two-region worldconsisting of the current OECD (Organization for Economic Cooper-ation and Development, that is, the North) and non-OECD (South)countries. The economic module tracks GDP per capita. The demo-graphic module tracks birth and death rates and total population.The environmental module tracks an abstract construct reinter-preted for this work as a natural “carrying capacity” that can bedegraded when pollution exceeds some threshold level. Neither thethreshold level nor the damage sustained by the environment isobservable until the threshold is actually reached, and the carryingcapacity then declines as a result. In Wonderland, growing popula-

A Framework for Scenario Generation 83
tion and wealth can increase annual pollution. Innovation of varioustypes can speed the rate of decoupling—that is, the rate at which thepollution generated per unit economic output decreases. The netchange in pollution depends on competition between these trends.
The scenario generator derived from Wonderland has 43 inputparameters that embrace the XLRM framework’s key uncertainties.Parameter values are constrained by requiring the model to repro-duce past trends as well as a range of future forecasts of economicgrowth, population, and environmental performance. The details ofthe scenario generator and its parameters are found in Appendix A.
When conducting LTPA, it is crucial to distinguish between policyactions taken in the present and those potentially available to futuregenerations. To capture this distinction, a second modification toWonderland represents sustainability policy in the twenty-first cen-tury as a two-period decision problem as shown in Figure 4.1. In thenear-term, decisionmakers must formulate policies even when theylack solid information on the extent of the sustainability problem—i.e., they do not know the actual values of any of the exogenous
RANDMR1626-4.1
Present Future
Select near-term policy
Implement policy
Does the carryingcapacity change?
Choose policies tomaximize utility
YES
NO
NOTE: Numerical values and equations describing the strategies are given inTable B.2.
Figure 4.1—Two-Period Decision with Fixed Near-Term Strategy

84 Shaping the Next One Hundred Years
uncertainties. At some future date, those uncertain values will berevealed if and when society observes a change in the environmentalcarrying capacity as described above. Observation of actual damagethen signals the beginning of the second, future decision period. Atthat time, decisionmakers will choose a strategy that maximizes theirutility, given their then-current circumstances and information.
At the beginning of the first period, near-term decisionmakerschoose policies that will accelerate the exogenous rate of innovationby some fixed amount. This policy remains in force until future deci-sionmakers detect a change in environmental carrying capacity. Atthis point, we assume future decisionmakers have sufficient infor-mation to choose policies based on their expected utility asdescribed below.
The modified Wonderland scenario generator represents futuredecisionmakers as choosing a strategy based on one or both of twopolicy levers. They can engage in policies designed to speed decou-pling rates, and they can make investments intended to reduce theirsociety’s vulnerability to decline in carrying capacity. This secondoption may reduce the need for future decisionmakers to pay forlarge increases in the decoupling rate. This second option is impor-tant to consider in this analysis because scenarios in which futuredecisionmakers choose it may be valued quite differently by the vari-ous parties to today’s sustainability debate. For instance, thosegreatly concerned with the natural environment would be aghast toview a future where people save themselves but allow the environ-ment to perish. Those who value only the more traditional economicmeasures of well-being might find such a scenario acceptable. Theparameters describing future decisionmakers include their ability todetect changes in carrying capacity, the exponents of their utilityfunctions, the relative weight they place on economic growth versusenvironmental quality, their discount rates, and the costs and effec-tiveness of their adaptation policies. These factors are all treated asexogenous uncertainties within the XLRM framework.
There is a long list of reasons why runs of the Wonderland computercode cannot be construed as reliable forecasts of the future, but fore-casting is not our intent. To be valid for our purposes, a scenariogenerator must be able to represent the crucial aspects of the prob-lem as captured by the XLRM framework and it must generate a suf-

A Framework for Scenario Generation 85
ficient diversity of plausible worlds to challenge candidate robuststrategies. As will be discussed in subsequent chapters, the modifiedWonderland scenario generator does well with the second criterionbut is deficient in the first.
It is important to recognize that, while Wonderland’s lack of detailseriously affects the policies it can compare, the model’s simplicityhas nothing to do with its inability to predict the long-term future.Too often analysts and policymakers demand increasingly compli-cated models in a vain attempt to increase the predictive power oftheir models.11 Adding detail to a model can usefully admit moreinformation into the analysis, some of which may help establish cer-tain scenarios as implausible or prove important to comparisonsamong alternative strategies. Additional detail may also permitmore-insightful examination of important policy levers. Forinstance, this study was unable to consider how investments in edu-cation or scientific research might add to a robust near-term sustain-ability strategy because Wonderland does not include either factor.But complicating a model as a means of reducing uncertainty is oftenlike a dog chasing its tail. No matter how many times analysts fur-ther elaborate their models, no additional level of detail can everenable a model to reliably predict an unpredictable future.
Wonderland suits the purposes of this study because of its ability,given a sufficiently wide range of input parameter values, to generatethe range of outcomes frequently observed in scenario-based think-ing about the future of the planet. Its simplicity and publicly avail-able source code permit ease of modification and exploration overalternative mathematical relationships between the uncertainties,levers, and measures. Wonderland has many obvious deficiencies.To the extent that its simplicity makes abundantly clear that predic-tion is not its goal, Wonderland’s manifest shortcomings can, for thisstudy, also serve as virtues.
______________11The costs of more-complicated models include the increased resources needed toconstruct them and the decreased ability of analysts and decisionmakers to under-stand why they behave the way they do.

87
Chapter Five
IMPLEMENTING ROBUST DECISIONMAKING
The preceding chapter described a framework (XLRM) and a sce-nario generator, and it explained how the wide variety of informationcontained in them defines a multiplicity of plausible long-termfutures relevant to sustainable development. The present chapterapplies the approach described in Chapter Three to the problem ofglobal sustainability and shows how this information may be appliedto identify society’s best near-term strategies for shaping this futureto achieve positive outcomes. It should not be a surprise that com-puter simulation model(s) using a wide range of inputs can trace amultitude of paths into the long-term future. The challenge is usingthis information to support useful policy arguments.
Both to demonstrate clearly a robust decision strategy for conductingLTPA and to provide a detailed explanation of the process, this chap-ter is organized into two principal parts. The first describes theoverall “story” of the analysis, emphasizing the methodology. Sub-sequent sections provide details of each step in that analysis.
OVERVIEW: INTERACTIVE ANALYSIS OF SUSTAINABLEDEVELOPMENT
Chapter Three described an iterative procedure in which robustdecision methods (RAP™, in particular,) supported by modern com-putation, create an analytic methodology that combines the bestfeatures of narrative scenario-based planning, group processes, sim-ulation modeling, and quantitative decision analysis. This newapproach is characterized by the four key elements of LTPA, as enu-

88 Shaping the Next One Hundred Years
merated in Chapter Three: ensembles, robustness, adaptivity, andinteractive exploration.
Each of these four elements will now be demonstrated in the contextof the problem of sustainable development following the procedureshown in Figure 3.1. Because the illustrations in this chapter containicons indicating at what point in that process diagram each one wascreated, the reader may find it useful to refer to Figure 3.1 during thefollowing description.
This chapter emphasizes the iterative nature of the robust decisionanalysis process. The explication will contrast strongly with the dis-cussions that usually stem from traditional analytic approaches thattend to conceal the actual “sausage making” with its inevitable falsestarts and struggles. While the traditional approach is certainlyappropriate for many types of decision problems, quantitative LTPArequires frequent and systematic revisiting of assumptions because,no matter how clever an analysis of long-term policy may be, there isnever a final conclusion and no end of the need for subjecting thecurrent best ideas to continual stress testing.
The analytic process begins by defining initial ensembles of alterna-tive strategies and future states of the world. The cross product ofthese two sets forms the scenario ensemble, defined by all the possi-ble combinations of exogenous uncertainties, levers, and configura-tions of the scenario generator(s) shown in Table 4.1.
Once these ensembles have been defined, and the needed scenariogenerator(s) created, surveying the ensemble of potential scenariosbecomes possible. The next step, then, is to conduct such a survey,with a focus on discovering strategies with properties that suggesttheir promise in meeting long-term challenges. We are particularlyinterested in strategies that are robust across broad ranges of differ-ent futures and alternative value systems. This step is marked “a” inFigure 3.1.
The next section describes a landscape of cases created in this fash-ion. With users considering alternative values of a few key uncer-tainties while keeping other indices into the ensemble of plausiblefutures at their nominal values, one or more strategies may emergethat are robust over a wide range of futures. The candidatestrategy/strategies will each increase by some fixed amount the rate

Implementing Robust Decisionmaking 89
of decoupling—that is, the rate at which the environmental impact ofa unit of economic activity is reduced. The node labeled “RobustStrategies” in Figure 3.1 indicates the discovery of such candidatestrateg(ies).
In the traditional decision analysis approach to this problem, thedetermination of the “optimal” improvement in decoupling ratewould be viewed as a conclusion. This conclusion would, however,be a prime target for any stakeholders who objected to its implica-tions and could find fault (often very easily accomplished) with theassumptions embedded in the analysis. By contrast, viewed as theinitial result in a robust decision exercise, a strategy is merely astarting point for stress testing and evolving a more insightful stanceto formulating strategy. From the “Robust Strategies” node, theanalysis may take multiple paths, depending on whether or not acandidate robust policy has been discovered. The first pass throughthe diagram produces one or more candidate robust strategies. Con-sequently, the focus of the next stage of the analysis is to attempt tobreak a candidate strategy by finding a future (or a relevant valuesystem) for which it performs too poorly to be acceptable. In thechapter’s third section, this is accomplished by means of a morethorough search through the ensemble of plausible futures (path “b”in Figure 3.1). That search (mediated in this case by human analystsexploring alternative futures) reveals in particular that the candidatestrategy does not perform satisfactorily in many futures for valuesystems sensitive to environmental concerns or the fate of the less-developed regions of the planet (the “South”).
The success in breaking the previous candidate strategy returns us tothe bottom of the figure. But this time there exists no robust strategy,and so the analysis moves along path “c,” searching for a new strat-egy that will be robust across all futures discovered to be importantto this point. If that search finds a new robust candidate, the processiterates, seeking futures to break the strategy, and so forth. Thistime, however, exploration demonstrates that there is no policy-driven increase in the decoupling rate that performs acceptably forall futures. As the scenario generator was initially constructed toexamine only this one type of strategy, the failure presents a problemcommon to studies based on simulation models.

90 Shaping the Next One Hundred Years
When preparing for LTPA, it is desirable to build as much flexibilityinto the scenario generator as possible so that changes to theensemble of futures or strategies can be made without changes to thesoftware. However, given the unpredictability of the long-termfuture, it will always be possible to exhaust the ability of the scenariogenerator to create the cases users will wish to examine. In suchinstances, direct intervention by humans to revise the tools of theanalysis can become necessary. Thus, the full interactive methodol-ogy allows for the human users to modify the ensembles and pursuethe analysis wherever its insights lead. These are the arcs “d” and “e”in Figure 3.1, which represent human augmentation of the frame-work for the analysis, modifying as needed the ensemble of plausiblescenarios or the universe of possible strategies.
In this demonstration analysis, once it has been determined that noincrease in decoupling rate suffices to provide a robust strategy, it isup to human ingenuity to devise an elaboration of the ensemble ofstrategies to allow for greater robustness (arc “d”). For long-termpolicy analysis, adaptivity becomes a vital tool. The fourth sectiondescribes enhancement of the ensemble’s strategies to include aclass of adaptive strategies based on setting milestones. This expan-sion of the range of policies is a product of human creativity, stimu-lated by the results of computational experiments done to this point.The computer can be used, through appropriate interactive tools andgraphical visualization, to highlight the properties of the challengingscenarios. In response to these observed properties, policy devicescan be crafted to meet the challenges.
With a newly enlarged set of possible strategies, the search can con-tinue for those that do well across wide ranges of futures and forfutures that break candidate strategies. As surmised, there existadaptive milestone strategies more robust than any static strategy.More aggressive computer searching reveals futures in which thesenew candidates also fail. Consequently, the process again follows arc“d.” This results, in the fifth section, in building another adaptivelayer on top of milestones, which results in a new policy candidate,“Safety Valve.” This strategy appears to be robust in nearly allfutures, but additional search still discovers some exceptional casesthat break it.

Implementing Robust Decisionmaking 91
At this point, one could follow the arc one more time and buildadaptive mechanism into this safety valve strategy to deal with thetroublesome cases. But analyses of long-term policy will often reacha point where, due to a shortage of time, resources, or creativity, aconclusion must be reached without further experimentation. So, adecision is made at this point to consider the question of whether, inspite of the remaining troubling futures, society should choose toadopt the Safety Valve strategy. Thus, the sixth section finallyinvokes probabilistic weighting, but not by guessing what the correctprobabilities should be. Instead, the probabilities associated withthe troublesome futures may be varied to determine what one wouldhave to believe about the relative likelihood of such futures to betthat the Safety Valve strategy has a lower expected outcome thandoes a competitor. As described in the seventh section, thisapproach provides a powerful and systematic means to characterizedeeply uncertain, heretofore “unquantifiable” surprises. The analy-sis takes a complex problem with a huge number of dimensions andreduces it to a small number of crucial bets that can be passed alongto senior decisionmakers who must make the final judgment call.
In the absence of predictability, no conclusion is ever final. How-ever, the human-machine collaborative search for robust policyoptions, interleaved with human-machine collaborative search forplausible scenarios that will break a given candidate strategy, can beused to ensure that available resources are brought to bear to dis-cover the best policy option possible.
LANDSCAPES OF PLAUSIBLE FUTURES
At each stage of the robust decisionmaking process, interactive com-puter visualizations provide a powerful tool to help humans explorepatterns and other properties of the large, multidimensional datasets created during this disciplined search for robust decision strate-gies. Figure 5.1 shows one such “landscape” of plausible futures.The landscape’s horizontal and vertical axes depict two key uncer-tainties that the sustainability debate suggests are particularlyimportant in distinguishing among alternative futures: the averageglobal rates for economic growth and for decoupling—that is, thereduction in emissions intensity per unit of economic output duringthe twenty-first century. Each point of intersection of the possible

92 Shaping the Next One Hundred Years
values for the two variables defining this landscape represents a par-ticular scenario, in this case defined narrowly by holding all othervariables constant.1 The upper left-hand region portrays futureswhere decoupling reduces pollution much faster than the economygrows. The lower right-hand region portrays futures where the
RANDMR1626-5.1
Economic growth rate (%)1 2 3 4 50
-1
0
1
5
6
3
4
2
Dec
oupl
ing
rate
(%
)
Brazil since1963
India since 1960
Chinasince1978
Russiasince 1993
Conventional Worldscenario
Barbarizationscenario
Great Transitionscenario
U.S.1890–1930
U.S. in 20thcentury
U.S. since1950
+
++
NOTE: Labeled points show actual economic growth rates (in GDP per capita) anddecoupling rates (for CO2) of the United States, China, India, Brazil, and Russia overvarious periods. Plus signs show the economic growth and decoupling rates used inWonderland recreations of the GSG Conventional World, Barbarization, and GreatTransition scenarios as shown in Figures 5.2 and 5.3. Assumptions about other keydriving forces for these scenarios not shown on this landscape are given in Table B.1.
Figure 5.1—Landscape of Plausible Futures as a Function of GlobalEconomic Growth Rates and Decoupling Rates over the
Twenty-First Century
______________1The views are static representations generated using Computer Assisted Reasoning®
system (CARs™) software. CARs operates dynamically so that, in using the system,those variables not actively represented in any view are present as slider bars in thegraphic user interface. These may be moved individually or in groups to see howchanges in other variables would affect the landscape views on the screen.

Implementing Robust Decisionmaking 93
economy grows much faster than decoupling reduces pollution.Inwhat follows, color-coded patterns will be employed to comparethe performance of alternative strategies across this landscape.Here, the figure shows only a blank landscape in order to describehow it portrays the relationships among scenarios.
The landscape aims to capture the full range of plausible scenariosfor the twenty-first century. It depicts average economic growthrates ranging from a catastrophic century-long deflationary trend toan unprecedented level of sustained high global growth. The span ofdecoupling rates is similarly heroic. They range from negative rates(indicating economies growing increasingly pollution-intensive overtime) characteristic of history’s most environmentally unfriendlyperiods of industrialization to unprecedented rapid diffusion of envi-ronmentally friendly technology and practices. Anchor points (blackdots) on the landscape serve to compare its scenarios to the range ofhistorical trends. This landscape spans a much wider range thancharacterized the changes in the United States over the nineteenthand twentieth centuries but a narrower range than that spanned bythe performance of several other nations over the last severaldecades.2 The landscape portrays global, century-long futures,whose plausible range should be less than that experienced over
______________2For the purposes of this illustrative exercise, the anchor points on this figure onlyshow the data for CO2 emissions. As the United State industrialized between 1890 and1930, its GDP per capita grew annually at about 1.5 percent on average while theamount of pollution per economic activity increased annually by 0.45 percent (a neg-ative decoupling rate of –0.45 percent). Over the entire twentieth century, both eco-nomic growth and decoupling were higher, and higher still during the half centurysince 1950. Even as economic growth has increased, the decoupling rate has alsoimproved. This acceleration in both economic growth and decoupling that reduces itsadverse consequences is a prime driver of the optimists’ confidence that sustainabilityis not a problem. During the past few decades, a number of developing countries havegrown much faster than the United States, but they have had a wide range of decou-pling rates. China has been high in both, in large part because it has retired a legacy ofinefficient Communist-era plants. In contrast, India’s per capita economic growthsince 1960 has come with negative decoupling rates. U.S. GDP data for 1929 to the pre-sent are from the U.S. Bureau of Economic Analysis (BEA); 1869–1929 data are fromRomer (1989); U.S. population from 1929 to the present is from the U.S. BEA; 1880–1928 population data are from the U.S. Department of Commerce’s Historical Statis-tics of the United States; economic and population data for China, India, and Brazilare from the International Monetary Fund website (http://imfStatistics.org); data forRussia are from the European Bank’s Transition Report Updates (April 2001 and 2002);all CO2 emissions data are from Marland et al. (2002).

94 Shaping the Next One Hundred Years
RANDMR1626-5.2700
600
500
400
300
200
100
0
Gro
ss w
orld
pro
duct
($
trill
ions
)
Population (billions)
5 6 7 8 9 10 11 12
GreatTransition
ConventionalWorld
BarbarizationN W
$
G
N W
$
G
N$ W$
NG WG
0% 0%
0% 0%1.8%1.8%
5.5%
2.2%
6.4%
0%
0%
0.1%
2.5%
N W
$
G
Stay the Course
NOTE: These futures were inspired by GSG’s Conventional World, Barbarization, andGreat Transition scenarios. Boxes show regret of the Stay the Course strategy in eachfuture for each of four measures of the future human condition: North Quasi-HDI(N$), World Quasi-HDI (W$), North Green HDI (NG), and World Green HDI (WG). SeeTable B.1 for values of Wonderland input parameters used to create these scenarios.
Figure 5.2—Comparative Trajectories of Output per Capita and Populationfor Three Futures for the Stay the Course Strategy
smaller regions and shorter periods. Thus these historical anchorpoints suggest that, at least as an initial assumption, the landscape issufficiently expansive to capture the plausible range of future scenar-ios for the twenty-first century.Of course, many factors other than global economic growth anddecoupling rates may prove decisive over the twenty-first century. Itis thus important to note that the landscape shown in Figure 5.1actually represents a two-dimensional slice through a multidimen-sional space whose axes are defined by each of the uncertainties inthe analysis. This makes an important point: Rather than assumeaway uncertainties by either dropping poorly understood factorsfrom consideration or assigning them arbitrary values, they areretained and explored over their full plausible range. From among

Implementing Robust Decisionmaking 95
RANDMR1626-5.3
700
800
600
500
400
300
200
100
0
Gro
ss w
orld
pro
duct
($
trill
ions
)
Population (billions)
5 6 7 8 9 10 11 12
Barbarization averted
N$ W$
NG WG
GreatTransition
N W
$
G
0.1%
0.1%
0.1%
0.1%
ConventionalWorld
0.1%
0.1%
0.1%
0.1%
N W
$
G
Slight Speed-Up
N W
$
G
0% 0%
0% 0%
NOTE: These futures were inspired by GSG’s Conventional World, Barbariza-tion, and Great Transition scenarios. Boxes show regret of the Slight Speed-Upstrategy in each future for each of four measures of the future human condition:North Quasi-HDI (N$), World Quasi-HDI (W$), North Green HDI (NG), andWorld Green HDI (WG). See Table B.1 for values of Wonderland input parame-ters used to create these scenarios.
Figure 5.3—Comparative Trajectories of Output per Capita and Populationfor Three Futures for the Slight Speed-Up Strategy
the very large number of potential low-dimensional landscapes onecould create, successful tools for LTPA must help users identify asmall set that reveals important patterns and then discover anycaveats or surprises caused by parameter combinations not shown inthese particular views. For instance, during the course of this exer-cise, we will confirm the importance of the two uncertaintiesexplored in Figure 5.1, using human-guided, interactive explorationsacross many alternative landscapes, computer-generated searchesfor special cases, and formal sensitivity analysis that gives statisticalsummaries of the properties of the scenario ensemble.
A key purpose of such landscapes of plausible futures is to clarify therelationship among different scenarios. For instance, in Figure 5.2
96 Shaping the Next One Hundred Years
the modified “Wonderland” scenario generator reproduces threepaths into the future corresponding to one representative scenariofrom each of GSG’s Conventional Worlds, Barbarization, and GreatTransitions families. These three futures may be represented bychoosing appropriate input parameters for average economic growthrates and decoupling rates, relative rates of economic growth in theNorth and South, seriousness of future environmental constraints,and criteria/values used by future decisionmakers in responding tothe sustainability challenges they face. Comparison of Figure 5.2with Figure 2.1 demonstrates that the Wonderland-generated pathshave somewhat higher economic growth rates but otherwise roughlycorrespond to those of GSG.
These points may be laid on the landscape to understand their rela-tionship to each other. The points marked with plus signs on Figure5.1 show that the generated Conventional Worlds and Barbarizationscenarios have the same rate of exogenous growth, 1.8 percent, anddiffer in their innovation rate by only 0.5 percent (1.5 percent and 1percent for the two scenarios, respectively). Barbarization and GreatTransitions share the same decoupling rate, but the latter has aslightly lower growth rate. These three divergent futures are, in fact,rather closely grouped. The landscape of plausible futures suggeststhat the three GSG scenarios represent only a narrow slice of thepotential triumphs and pitfalls of the twenty-first century.
NO FIXED STRATEGY IS ROBUST
The pieces are now in place for a first attempt to identify robust near-term strategies that can ensure long-term sustainable growth by pro-ceeding along the “a” path in the procedure illustrated in Figure 3.1.Creation of the scenario ensemble uses the range of futures shown inFigure 5.1. The initial strategies consider fixed near-term strategiesof the type shown in Figure 4.1 in which policymakers pursuespecific near-term actions, such as R&D and environmental taxes,that increase the decoupling rate by some prescribed amount.
Figure 5.4 depicts the performance of one such strategy, SlightSpeed-Up, across the landscape of plausible futures. Slight Speed-Up increases by 1 percentage point the rate of decoupling in bothNorth and South over the respective rates that would otherwise hold

Implementing Robust Decisionmaking 97
RANDMR1626-5.4
Dec
oupl
ing
rate
(%
)
–1
1
5
3
4
2
0
3.02.01.00 4.0Economic growth rate (%)
Great Transitionscenario
Barbarizationscenario
ConventionalWorld scenario
U.S. in 20th century
U.S.1890–1930
U.S. since 1950
N$ W$
NG WG
+++
Slight Speed-Up
No regret A lotMild Overwhelming
NOTE: Green areas have no regret; blue areas have relative regret of less than 0.1percent; yellow areas have relative regret less than 2 percent; red areas have rela-tive regret greater than 2 percent. The small four-quadrant box indicates themeasure of human condition used in each panel: N$ for North Quasi-HDI, NG forNorth Green, W$ for World Quasi-HDI, and WG for World Green. Dots show his-torical data for U.S. economic growth rates (in GDP per capita) and decouplingrates (for CO2) for the United States over various periods. Plus signs show theeconomic growth and decoupling rates used in our Conventional World, Bar-barization, and Great Transition scenarios (these scenarios also differ in the valueof factors not shown on this landscape).
Figure 5.4—Performance of Slight Speed-Up Near-Term Strategy over aLandscape of Plausible Futures Using the North Quasi-HDI Measure
in the absence of any policy intervention. The figure shows theregret of Slight Speed-Up compared to the 15 other alternativestrategies shown in Table B.2, across the range of plausible futuresusing the North Quasi-HDI measure of the future human condition.For each future depicted in this landscape, the computer uses thescenario generator to calculate the performance of Slight Speed-Up.3
______________3Having selected a particular granularity for dividing the full span of values on eachaxis, the landscape presents the results for Slight Speed-Up across 121 alternativefutures.

98 Shaping the Next One Hundred Years
It then finds the fixed strategy that produces the highest (optimal)performance in that future using the North Quasi-HDI measure.Slight Speed-Up’s regret in any future is defined as the differencebetween its performance and the optimum (see Equation 3.1). Thelandscape uses colors to indicate patterns in Slight Speed-Up’sregret.
Slight Speed-Up has mild regret throughout almost the entire land-scape and has no regret in several futures where economic growthrates greatly exceed the decoupling rate. While this landscape showsscenarios with a wide variation of assumptions about future globalaverage economic growth and decoupling rates, the uncertainties ina wide range of other factors remain unexplored. For instance, allthe futures in the landscape use a single value for the costs of imple-menting Slight Speed-Up, calibrated to the estimate that the currentlevel of environmental protection in the developed world has costabout 2 percent of GDP. Nonetheless, this first view across the sce-nario ensemble suggests that Slight Speed-Up might be robust.
However, Figure 5.5 forces a change in our assessment. This land-scape is identical to the first except that it assesses Slight Speed-Up’sperformance in each future using the World Green-HDI measure.From this vantage point, the strategy has mild regret over thoseregions where the decoupling rate exceeds economic growth. Itsregret is overwhelming in futures where economic growth ratesexceed decoupling rates. In fact, viewed from the perspective of theWorld Green-HDI measure, Slight Speed-Up offers few advantagesover the landscape than does the Stay the Course strategy, shown inFigure 5.6, which takes no near-term actions to address sustainabil-ity. As shown in Figure 5.6, Stay the Course depicts no regret overthose regions where the decoupling rate exceeds economic growthbecause, in such futures, no policy response is necessary. Resem-bling Slight Speed-Up, Stay the Course has overwhelming regret infutures in which economic growth rates exceed decoupling rates.Only in a narrow band of futures would Slight Speed-Up offer betteroutcomes than Stay the Course. Slight Speed-Up no longer appearsto be so robust.
In fact, no fixed near-term strategy of the form shown in Figure 4.1appears robust over all four measures as well as over the full range of

Implementing Robust Decisionmaking 99
RANDMR1626-5.5D
ecou
plin
g ra
te (
%)
–1
1
5
3
4
2
0
3.02.01.00 4.0Economic growth rate (%)
Slight Speed-Up
Barbarization scenario
ConventionalWorld scenario
+++
N$ W$
NG WG
No regret A lotMild Overwhelming
Great Transitionscenario
U.S. in 20th century
U.S.1890–1930
U.S. since1950
Figure 5.5—Performance of Slight Speed-Up Near-Term Strategy over aLandscape of Plausible Futures Using World Green Measure
RANDMR1626-5.6
Dec
oupl
ing
rate
(%
)
–1
1
5
3
4
2
0
3.02.01.00 4.0Economic growth rate (%)
Stay the Course
Barbarization scenario
ConventionalWorld scenario
+++++
N$ W$
NG WG
No regret A lotMild Overwhelming
Great Transitionscenario
U.S. in 20th century
U.S.1890–1930
U.S. since 1950
Figure 5.6—Performance of Stay the Course Near-Term Strategy over aLandscape of Plausible Futures Using World Green Measure

100 Shaping the Next One Hundred Years
plausible futures described by the variables discussed in the contextof XLRM in Chapter Four. Figure 5.7 shows the performance of aCrash Effort strategy, which increases decoupling in both North andSouth by 2 and 4 percentage points, respectively, above their exoge-nous values over the landscape for both the North Quasi-HDI andWorld Green-HDI measures. This strategy has mild or no regret inthose futures where Slight Speed-Up has overwhelming regret.However, Crash Effort has a lot of regret in those futures where SlightSpeed-Up performs well. Clearly, Slight Speed-Up offers an insuffi-cient response in futures that most demand near-term action, whileCrash Effort represents an overreaction in the futures where thesustainability problem will largely solve itself.
RANDMR1626-5.7
Dec
oupl
ing
rate
(%
)
–1
1
5
3
4
2
0
3210 4Economic growth rate (%)
Dec
oupl
ing
rate
(%
)
–1
1
5
3
4
2
0
3210 4Economic growth rate (%)
Crash Effort
U.S. in 20thcentury
U.S. 1890–1930
U.S. since1950
N$ W$
NG WG
N$ W$
NG WG
No regret A lotMild Overwhelming
U.S. in 20thcentury
U.S. 1890–1930
U.S. since1950
NOTE: Regret was calculated in comparison to 15 other alternative innovativestrategies shown in Table B.2. Green areas have no regret; blue areas haverelative regret of less than 0.1 percent; yellow areas have relative regret of lessthan 2 percent; red areas have relative regret greater than 2 percent. Anchorpoints show historical U.S. economic growth rates and decoupling rates.
Figure 5.7—Performance of Crash Effort Near-Term Strategy over aLandscape of Plausible Futures Using Quasi-HDI and World
Green HDI Measures

Implementing Robust Decisionmaking 101
This dilemma appears inescapable for any fixed near-term strategy.We examined 16 strategies representing a wide range of differentcombinations of decoupling rate increases in North and South.(These 16 were all combinations of policies that increase decouplingin North and South by 4, 2, 1, or 0 percentage points. Three of the 16have names: Crash Effort [2 percent, 4 percent], Slight Speed-Up [1percent, 1 percent], and Stay the Course [0 percent, 0 percent].) Acomputer search was constructed for each strategy using each of thefour measures to look for regions of large regret over the full range ofplausible futures.4 Each of the 16 innovation strategies fails over-whelmingly over a wide range of futures using one or more measures.This failure is no surprise because these strategies poorly exploit thethird element of LTPA: They are not sufficiently adaptive.
Given this result, it is interesting to compare the fate of the scenariosinspired by those from the three GSG families under the SlightSpeed-Up and Stay the Course strategies. The paths shown in Figure5.3 assume Stay the Course. The four quadrants by each path showthis strategy’s regret with respect to each of the four measures of thefuture human condition. The labeled points in Figure 5.6 show theassumptions about the economic and decoupling rates used to cre-ate the paths in Figure 2.1. In Barbarization, Stay the Course hasconsiderable regret when the results are assessed using the NorthQuasi-HDI measure and overwhelming regret viewed with the otherthree measures. In Conventional Worlds, the strategy has no regretviewed with the North Quasi-HDI and World Quasi-HDI measures,mild regret viewed with the North Green-HDI, and overwhelmingregret viewed with World Green-HDI measure. This last result,which is also seen in Figure 5.6, occurs because in this scenariofuture decisionmakers avail themselves of an option to adapt to theirrapidly degrading environment, thus preserving economic growthbut not environmental quality. Only in Great Transitions does Staythe Course prove uniformly successful. The strategy has no regretwhen viewed with all four measures of the future human condition.Great Transitions assumes near-term changes in values that alter
______________4The simple global search routine launched “downhill” searches at each of a hundredrandomly chosen starting points in the space. While this algorithm is not necessarilyan efficient means of finding a global maximum, it is sufficient to generate breakingscenarios to demonstrate that the fixed strategies are not robust.

102 Shaping the Next One Hundred Years
economic growth paths and make additional increases in decouplingrates unnecessary.
In contrast, Figure 5.3 shows the path produced by the same futuresas shown in Figure 5.2 but with a choice of the near-term SlightSpeed-Up strategy. The results are dramatically different. In par-ticular, the strategy has rendered Barbarization a no longer unpleas-ant future. It now follows virtually the same path as ConventionalWorlds. If the future were guaranteed to follow either the Conven-tional World, Barbarization, or Great Transitions futures, SlightSpeed-Up could lay strong claim as a robust strategy. It performswell, yielding no or mild regret, in all three futures using all four mea-sures of the future human condition.
GSG proposed its three scenarios to support a risk managementargument leading to the conclusion that a near-term effort to pro-mote a Great Transitions future is necessary to avoid the risks offalling into Barbarization. However, Slight Speed-Up’s ability todivert the Barbarization future along a more desired path while per-forming well in the Conventional World and Great Transition futuresundercuts this claim.5 As suggested by Figures 5.4 and 5.5, SlightSpeed-Up might eliminate the need for Great Transitions if policy-makers were certain that Conventional Worlds a n d Barbarizationwere the only other futures that might lie ahead. GSG would quiterightly object that their families of scenarios contain much greaterrichness and detail than the three Wonderland-generated pathsshown here. They would point to other potential weaknesses of Bar-barization not addressed by Slight Speed-Up. This is precisely thepoint. Given the multiplicity of plausible futures, any policy argu-ment based on a small number of scenarios or families can be easilychallenged by questioning assumptions and pointing to paths notincluded in the analysis.
Proponents on many sides of the sustainability debate make risk-based arguments. Environmentalists, such as the GSG, point to the
______________5The GSG’s simulation models include a far greater range of factors than the simplescenario generators used here. It is unlikely that small changes in any single inputparameter would cause one of their scenarios to follow a significantly different course.However, small changes in a number of key assumptions could well make one of theirmodel-generated scenarios tell a very different story.

Implementing Robust Decisionmaking 103
environmental and social risks of society’s current developmentpath. Many international businesses and governments of developingcountries emphasize the risks posed by sustainability policies thatmight hamper economic growth. A robust decision analysis full-scenario ensemble provides a much firmer foundation to assess sucharguments than do any small set of scenarios. While Slight Speed-Upis robust over GSG’s Conventional Worlds, Babarization, and GreatTransitions, it can easily fail catastrophically for a variant of Bar-barization described by a slightly different set of assumptions. Thisis clearly seen by the proximity of Barbarization to the regions ofoverwhelming regret in Figure 5.5. Such landscapes thus makeexplicit the concerns policymakers naturally have with any LTPAbased on a small number of scenarios. With a restricted sample, it isnever clear how the conclusions might change if some seeminglyinnocuous assumptions, whether made by industrialists or environ-mentalists, were subtly changed. A strategy found robust across thefull landscape of plausible futures will be less vulnerable to suchcriticisms.
EXPLORING NEAR-TERM MILESTONES
In the analysis so far, no fixed near-term strategy appears robustacross the full range of plausible futures and values. Moderate near-term actions fail in futures requiring drastic interventions. Aggres-sive near-term strategies impose unwarranted costs in futures wheresustainability is no problem. No fixed strategy appears to guaranteethe appropriate level of policy-induced decoupling across the entirelandscape of plausible futures. We thus begin another pass throughthe procedure shown in Figure 3.1. Based on what we have learned,we augment our menu of alternative strategies with the aim of craft-ing ones that may prove more robust.
Policymakers have a well-established, often successful approachwhen deep uncertainty prevents them from prescribing in detail theseries of steps needed to reach well-understood goals. In such cir-cumstances, they often set performance milestones to be achieved atsome point. They then implement an adaptive strategy, adjustingactions over time in an attempt to achieve the desired ends. This, forinstance, is the approach the UN has attempted in setting its Mil-lennium Development Goals.
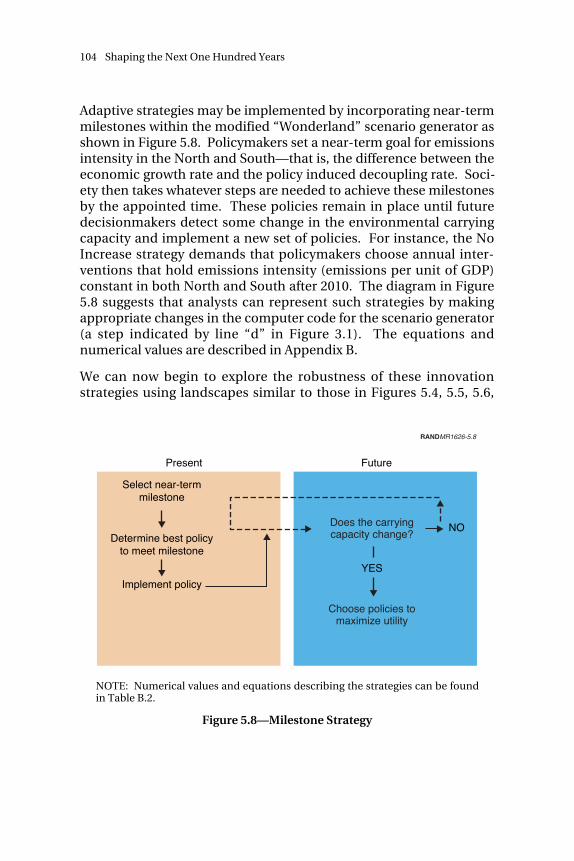
104 Shaping the Next One Hundred Years
Adaptive strategies may be implemented by incorporating near-termmilestones within the modified “Wonderland” scenario generator asshown in Figure 5.8. Policymakers set a near-term goal for emissionsintensity in the North and South—that is, the difference between theeconomic growth rate and the policy induced decoupling rate. Soci-ety then takes whatever steps are needed to achieve these milestonesby the appointed time. These policies remain in place until futuredecisionmakers detect some change in the environmental carryingcapacity and implement a new set of policies. For instance, the NoIncrease strategy demands that policymakers choose annual inter-ventions that hold emissions intensity (emissions per unit of GDP)constant in both North and South after 2010. The diagram in Figure5.8 suggests that analysts can represent such strategies by makingappropriate changes in the computer code for the scenario generator(a step indicated by line “d” in Figure 3.1). The equations andnumerical values are described in Appendix B.
We can now begin to explore the robustness of these innovationstrategies using landscapes similar to those in Figures 5.4, 5.5, 5.6,
RANDMR1626-5.8
Present Future
Select near-termmilestone
Determine best policyto meet milestone
Implement policy
Does the carryingcapacity change?
Choose policies tomaximize utility
YES
NO
NOTE: Numerical values and equations describing the strategies can be foundin Table B.2.
Figure 5.8—Milestone Strategy
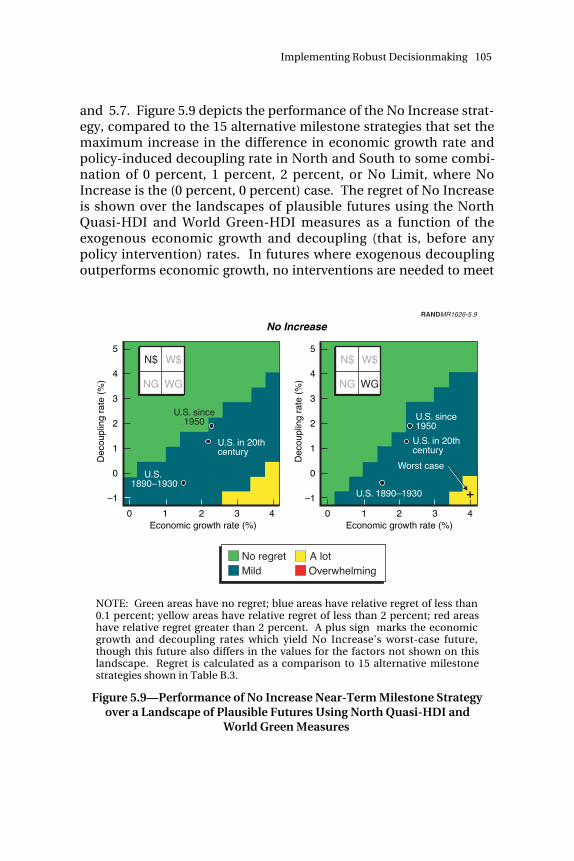
Implementing Robust Decisionmaking 105
and 5.7. Figure 5.9 depicts the performance of the No Increase strat-egy, compared to the 15 alternative milestone strategies that set themaximum increase in the difference in economic growth rate andpolicy-induced decoupling rate in North and South to some combi-nation of 0 percent, 1 percent, 2 percent, or No Limit, where NoIncrease is the (0 percent, 0 percent) case. The regret of No Increaseis shown over the landscapes of plausible futures using the NorthQuasi-HDI and World Green-HDI measures as a function of theexogenous economic growth and decoupling (that is, before anypolicy intervention) rates. In futures where exogenous decouplingoutperforms economic growth, no interventions are needed to meet
RANDMR1626-5.9
Dec
oupl
ing
rate
(%
)
–1
1
5
3
4
2
0
3210 4Economic growth rate (%)
Dec
oupl
ing
rate
(%
)
–1
1
5
3
4
2
0
3210 4Economic growth rate (%)
No Increase
N$ W$
NG WG
N$ W$
NG WG
No regret A lotMild Overwhelming
Worst case
+
U.S. in 20thcentury
U.S. 1890–1930
U.S. since1950
U.S. in 20thcentury
U.S. 1890–1930
U.S. since1950
NOTE: Green areas have no regret; blue areas have relative regret of less than0.1 percent; yellow areas have relative regret of less than 2 percent; red areashave relative regret greater than 2 percent. A plus sign marks the economicgrowth and decoupling rates which yield No Increase’s worst-case future,though this future also differs in the values for the factors not shown on thislandscape. Regret is calculated as a comparison to 15 alternative milestonestrategies shown in Table B.3.
Figure 5.9—Performance of No Increase Near-Term Milestone Strategyover a Landscape of Plausible Futures Using North Quasi-HDI and
World Green Measures
106 Shaping the Next One Hundred Years
the milestone and the strategy therefore imposes no costs. In futureswhere decoupling lags, the strategy calls for policies that increasedecoupling. In all but the most severe cases (the lower right-handcorner), these policies impose small near-term costs but prove suffi-cient to preserve sustainability over the long term.6
At first glance, No Increase appears robust. The analytic process thusshifts to testing this hypothesis. Policymakers who have risen to thetop usually also have a good working understanding of Murphy’sLaw and frequently ask, “What can go wrong?” The computer canhelp address this question by finding and assessing plausible futureswhere No Increase does poorly—that is, where it has high regret. Inparticular, a computer search can identify sets of input parameters tothe scenario generator that yield high regret, and sensitivity analysiscan suggest which of those key inputs—i.e., the key driving forces—are most responsible for the strategy’s poor performance.7
The landscape in Figure 5.10 suggests how such information canhelp answer the policymakers’ critical question. The figure depictsthe performance of No Increase, viewed with the World Green-HDImeasure across a landscape that includes the strategy’s worst-casefuture. A simple computer search (represented by line “b” in Figure3.1) identified this worst case.8 The landscape’s horizontal and verti-
______________6This report does not compare No Increase to other potential milestone strategies.The discussion in Chapter Six suggests that other strategies perform better than NoIncrease. This does not change the conclusions of any of the discussions here.7Global sensitivity analysis uses statistical methods on a very large sample of pointsover the multidimensional landscape to identify those input factors whose variation ismost important in producing variation in the output parameter of interest, in this casethe strategy’s regret. See discussion in Chapter Six.8A simple “downhill” search was launched at each of 500 randomly chosen startingpoints in the space of input parameters representing the exogenous uncertainties (Xparameters of Table 4.1) in the Wonderland scenario generator. The search aimed tomaximize the regret of the No Increase strategy. This process yielded 1,502 scenariosbecause we retained in our scenario ensemble all the intermediate steps produced bythe search algorithm. Only those scenarios were kept whose demographic inputparameters produced plausible future population scenarios, defined as a 2050 popu-lation between 700 million and 1.5 billion in the North and a 2050 population between7 billion and 15 billion in the South. The 837 cases that did not meet this criteria werediscarded. Of the remaining 665 cases, the one with the largest No Increase regret wasselected as the worst case.

Implementing Robust Decisionmaking 107
RANDMR1626-5.10
Dec
oupl
ing
rate
(%
)
–1.0
1.0
5.0
3.0
4.0
2.0
0
Cost to speed decoupling, South
No Increase
x10 -2
0.1 0.2 0.3 0.40 0.5 0.6 0.7 0.8 0.9 1.0
+
Nominal caseWorst case
N$ W$
NG WG
No regret A lotMild Overwhelming
NOTE: Landscape includes worst-case future for No Increase found by computersearch. Assumed values for other uncertainties are shown in Table B.4. A plus signmarks the costs and decoupling rates used in the landscapes in Figures 5.4, 5.5, 5.6,5.7, and 5.9 although the values for other factors differ from those shown in thislandscape.
Figure 5.10—Performance of No Increase Strategy over a Landscape ofPlausible Futures, Including No Increase’s Worst-Case Future
cal axes depict two key uncertainties that the computer’s sensitivityanalysis suggests are critical to the strategy’s performance9: cost ofspeeding decoupling in the South and exogenous decoupling rate(that is, before application of any policy intervention).10 The nomi-nal case for the former uncertainty, used in landscapes of Figures 5.4,5.5, 5.6, 5.7, and 5.9, corresponds to assumptions that current levels
______________9We discuss these sensitivity analysis results in Chapter Six.10In theory, the analyst may search for such modes manually by changing the axesand types of views requested by the computer and moving the slider bars through thefull range of uncertainty for each variable. As a practical matter, this would be subjectto possible unintentional bias or merely fatigue. Hence, the value in automating suchsearches for failure modes.

108 Shaping the Next One Hundred Years
of environmental quality have been purchased at a cost of about 2percent of GDP and that future policies in the North and South willshow similar costs. In the worst case for No Increase, the future costsof increasing decoupling in the South are about 10 times higher thanthe historic values. The decoupling rate in the Conventional Worldscenario is 1.8 percent. This landscape suggests that, with this levelof exogenous decoupling, No Increase can fail (have overwhelmingregret) in cases where the costs of increasing future decoupling haveany value greater than about three times historic levels.
Yet in this landscape No Increase performs poorly even with thenominal assumptions about cost and decoupling (indicated by thepoint marked “Nominal Case”) as opposed to the strategy’s goodperformance in the nominal case in the landscape of Figure 5.9. Thisvariation results from the different values for the parameters notshown in the two landscapes. In particular, the computer searchsuggests that the No Increase worst case also occurs with very higheconomic growth rates of 4 percent in the North and 7.5 percent inthe South and few environmental constraints as represented by alevel of sustainable pollution nearly 10 times current levels. In addi-tion, it is also blessed with future decisionmakers who have littleinclination or capability to respond to sustainability threats as repre-sented by high discount rates and poor ability to detect changes incarrying capacity. (Table B.4 provides a full listing of parameter val-ues for the No Increase worst case.)
Drilling down at selected points on the landscape yields insight intothe factors that shape the No Increase patterns of regret. In particu-lar, Figure 5.11 compares the trajectories for two types of output percapita: those in a twenty-first century North and South that resultfrom a near-term choice of the No Increase strategy in its worst-casefuture and those that result from a near-term choice of the optimalstrategy in that future. The best alternative to No Increase in itsworst case is M0X, which sets a stringent milestone in the North (nodifference between decoupling rate and economic growth rate) andno milestone in the South. The strategy successfully exploits thisfuture’s low sustainability threat (represented by high sustainablepollution thresholds) and the low costs to speed decoupling in theNorth to yield a World Green-HDI performance of 6, a truly signifi-cant improvement of the human condition. In contrast, the stringent

Implementing Robust Decisionmaking 109
RANDMR1626-5.11
Out
put p
er c
apita
(th
ousa
nds
of d
olla
rs)
0.001
0.010
0.100
1.000
10.000
100.000
1,000.000
10,000.000
2000 '10 '20 '30 '40 '50 '60 '70 '80 '90 2100
Year
North (No increase)North (M0X)South (No increase)South (M0X)
NOTE: The trajectories will result from the strategies in the worst-case futuredepicted in Figure 5.10.
Figure 5.11—Comparative Trajectories of Output per Capita for theTwenty-First Century for the No Increase and M0X Strategies
in the No Increase Worst-Case Future
Southern milestone imposed by No Increase collapses economicgrowth in the South because of the extremely high costs of speedingdecoupling in this region. Viewed in context of the World GreenHDI, No Increase results in a dismal performance of –7 percent.Compared to the possibilities this future offers, the results from NoIncrease yield an enormous regret of 13 percent.
Once the computer has revealed this result, the analysts, experts, andpolicymakers can address the issue of whether such poorly perform-ing futures are sufficiently plausible to cast doubts on the efficacy ofthe No Increase strategy. There is certainly much to question aboutNo Increase’s worst case. Economic growth rates, the resilience ofthe environment, and the costs of reducing pollution are exceedinglyhigh compared to today’s norms. The scenario assumes policymak-ers would cling to the Southern decoupling milestone in the face of a

110 Shaping the Next One Hundred Years
catastrophic drop in economic output. It is worth noting that one ofthis future’s most salient features is that, by century’s end, the Southwill be as much richer relative to the North as the North is richerrelative to the South today. This is not a prognostication likely to beincluded in the result from any group of experts generating narrativescenarios in today’s world of American hegemony.
Nonetheless, the basic outlines of this scenario are precisely thosearticulated by the camp in the sustainability debate that argues thattoo-aggressive policies to protect the environment will prevent oth-erwise attainable and spectacular improvements in the human con-dition. The vast sea of red in Figure 5.10 suggests that one need notfully embrace the potentially extreme assumptions underlying theNo Increase worst case to entertain doubts about the strategy’srobustness. Computer-guided explorations of the scenario ensemblecould test this judgment by allowing stakeholders to modify keyassumptions about growth rates, costs, environmental resilience,and the behavior of future decisionmakers and determine the extentto which No Increase still fails among a more restrictive set of cases.It is not hard to show that No Increase and all the other alternativemilestone strategies can fail in futures to which many stakeholderssubscribe and that cannot now be disproven by conclusive evidence.
IDENTIFYING A ROBUST STRATEGY
Ultimately, judgments about the robustness of strategies depend onthe available alternatives. The adaptive Milestone strategies performgenerally better than nonadaptive Innovation strategies but are stillnot robust. In particular, No Increase fails when the cost of reachingits near-term goals proves too high. Once again, we pass along path“d” in Figure 3.1, attempting to design new strategies that may bemore robust than the current alternatives.
Policymakers often set contingent goals. For instance, an agreementto buy a house may be subject to the property’s passing an inspec-tion. In the climate-change arena, some have proposed contingenttargets as a means to address the deep uncertainties over the costs ofmeeting the near-term emissions reduction milestones of the KyotoProtocol. Such a Safety Valve strategy (Victor, 2001) might beimplemented, for instance, with a tradeable pollution system in

Implementing Robust Decisionmaking 111
which the government agrees to sell an unlimited number of permitsat some maximum price.
Such adaptive, contingent strategies may be represented within themodified “Wonderland” scenario generator as shown in Figure 5.12.Policymakers set a near-term goal for emissions intensity in theNorth and South—that is, the difference between economic growthand policy-induced decoupling rates. However, the annual costs aremonitored and, if they ever exceed some predetermined threshold,the policies are relaxed to meet the cost target, irrespective ofwhether or not society will achieve the level of decoupling improve-ment required to meet the emissions intensity milestone. The SafetyValve strategy used here aims for no increase in emissions intensityby 2010 in both North and South, achieved at a cost of no more than1 percent of GDP in each region.
Figure 5.13 depicts Safety Valve’s performance over the landscape ofplausible futures compared to the 16 alternative milestone strategies
RANDMR1626-5.12
Present Future
Select near-termmilestone
Determine best policyto meet milestone
Is milestoneachievable with
current approach?
Relax milestone
Implement policy
Does the carryingcapacity change?
Choose policies tomaximize utility
YES
NO
YES
NO
NOTE: Numerical values and equations describing the strategies can be foundin Appendix B.
Figure 5.12—Safety Valve Strategy

112 Shaping the Next One Hundred Years
shown in Table B.5. Across these futures, its performance is similarto that of No Increase except in the high-growth, low-decouplingcorner, where it performs much better. In these futures, the level ofpolicy intervention needed to achieve No Increase’s milestonesproves too costly relative to Safety Valve’s more measured response.
Is Safety Valve robust? Once again, the computer can help addressthe policymaker’s key question, “What can go wrong?” A computersearch reveals that Safety Valve can still fail, but the search also pro-vides important information that can help human decisionmakerscharacterize and assess these potential failures and thus makeinformed judgments as to the robustness of the Safety Valve strategyand its potential alternatives.
RANDMR1626-5.13
Dec
oupl
ing
rate
(%
)
–1
1
5
3
4
2
0
3210 4Economic growth rate (%)
Dec
oupl
ing
rate
(%
)
–1
1
5
3
4
2
0
3210 4Economic growth rate (%)
Safety Valve
N$ W$
NG WG
N$ W$
NG WG
No regret A lotMild Overwhelming
Worstcase
+U.S. in 20thcentury
U.S. 1890–1930
U.S. since1950
U.S. in 20thcentury
U.S. 1890–1930
U.S. since1950
NOTE: Green areas have no regret; blue areas have relative regret of less than0.1 percent; yellow areas have relative regret of less than 2 percent; red areashave relative regret greater than 2 percent. A plus sign marks the economicgrowth and decoupling rates used in Safety Valve’s worst-case future, thoughthis future differs in the values for the factors not shown on this landscape.
Figure 5.13—Performance of Safety Valve Near-Term Strategy over aLandscape of Plausible Futures Using North Quasi-HDI and World
Green Measures

Implementing Robust Decisionmaking 113
Figure 5.14 shows the performance of Safety Valve as a function oftwo key parameters identified by a sensitivity analysis as most criticalin producing large regret for this strategy: the importance futureSouthern decisionmakers place on the environment as representedby the weightings in their utility function (horizontal axis) and thesustainable level of pollution in the South (vertical axis). The inputparameters not shown by the axis of this landscape are, as before,those defined by the worst-case regret found by the search as listedin Appendix B. The slice of the landscape shown in this figure ischaracterized by high economic growth rates in the North (3.9 per-cent) and South (6.2 percent), relatively slow decoupling rates in theNorth (1.9 percent) and South (–1 percent), future decisionmakers
RANDMR1626-5.14
Sus
tain
able
pol
lutio
n, S
outh
Importance future decisionmakers place on environment, South
Safety Valve
0.1 0.2 0.3 0.40 0.5 0.6 0.7 0.8 0.9 1.0
0
1
3
4
2
5
6
10
9
8
7
Nominal case
Worst case
No regret A lotMild Overwhelming
+
N$ W$
NG WG
NOTE: Landscape includes worst-case future for Safety Valve found by computersearch. Assumed values for other uncertainties are shown in Table B.4. A plus signmarks the parameter values used in the landscapes in Figures 5.4, 5.5, 5.6, 5.7, 5.9,and 5.13 although the values for other factors differ from those shown in thislandscape.
Figure 5.14—Performance of Safety Valve Near-Term Strategy over aLandscape of Plausible Futures, Including Safety Valve’s Worst Case

114 Shaping the Next One Hundred Years
who are not particularly effective at responding to sustainabilitychallenges (modeled by high discount rates and relatively low abilityto detect changes in natural capital), and high costs of implementingnear-term innovation policies (five and eight times the nominal casein North and South, respectively).
The “nominal” values for the level of sustainable pollution and theimportance future decisionmakers place on the environment areshown in the lower left-hand corner. These are the values used in thelandscapes in Figures 5.4, 5.6, 5.7, 5.9, and 5.13. The worst case forthe Safety Valve strategy, shown in the lower right-hand side of thefigure, has roughly the same level of sustainability challenge (a sus-tainable level two times current emissions) but a much higherimportance placed by future decisionmakers on the environment.The strategy’s performance is highly nonlinear over this landscape.
Figures 5.15 and 5.16 suggest the reasons for Safety Valve’s poor per-formance in its worst-case future. The figure compares the trajecto-
RANDMR1626-5.15
161514131211109876543210
2.00 2.00 2.00 2.00 2.00 2.00
Time (x103)
Out
put p
er c
apita
2.00 2.00 2.00 2.00 2.00
Safety ValveM22
Figure 5.15—Trajectories of Output per Capita in the South for the SafetyValve and M22 Strategy in the Safety Valve’s Worst-Case Future

Implementing Robust Decisionmaking 115
ries for output per capita in the South (Figure 5.15) and for Southerndeath rates (Figure 5.16) for Safety Valve in its worst case and for theoptimum strategy in that future. The optimum strategy is M22,which sets relatively lax, but nonetheless inviolate, milestones forboth North and South. Given the high growth rates and high costs ofspeeding decoupling, the M22 strategy devastates the Southerneconomy. In contrast, Safety Valve makes only mild attempts tospeed decoupling and thus preserves the economic expansion.Nonetheless, Safety Valve does much worse in advancing the humancondition because, in stark contrast to No Increase’s worst case, thisfuture contains significant environmental constraints. In particular,the human population proves extremely sensitive to environmentaldegradation. Thus, in allowing the pollution to grow unabated,Safety Valve precipitates waves of epidemics that devastate thepopulation. In this unenviable future, M22 yields a dismal World
RANDMR1626-5.161.6
1.4
1.2
1.0
0.8
0.6
0.4
0.20.0
2.00 2.01 2.02 2.03 2.04 2.05Time (x103)
2.06 2.07 2.08 2.09 2.10
Dea
th r
ate
(x10
2 )
Safety ValveM22
Figure 5.16—Trajectories of Death Rates in the South for the Safety Valveand M22 Strategy in the Safety Valve’s Worst-Case Future

116 Shaping the Next One Hundred Years
Green HDI of –2 percent. But Safety Valve yields a horrible –10 per-cent for a regret of 8 percent.
The Safety Valve worst case is in many ways a perverse scenario.Future Southern decisionmakers care nothing about human health(this term is not included in their utility function). The frequentpopulation collapses reduce the impact of economic growth on theenvironment, so these decisionmakers take no action to slow theincrease in pollution. M22 succeeds because it reduces pollutionsufficiently and carrying capacity never drops, the second decisionperiod of Figures 5.8 and 5.12 never begins, and thus the future deci-sionmakers are never placed in a position where they can make thesedecisions that we find so perverse. In an analysis meant to informactual policy judgments, this scenario would likely provoke tworesponses. Participants might reject it out of hand, remove it fromthe scenario ensemble, and search for other, more credible futureswhere Safety Valve fails. Participants might also return to the sce-nario generator code and modify its representation of future deci-sionmakers to eliminate their perverse behavior.
Nonetheless, this worst-case scenario also raises two importantmethodological points that are our main interest here. First, thefuture shown in Figures 5.15 and 5.16 differs in at least one profoundway from that shown in Figure 5.11: It offers policymakers no goodoptions. The Safety Valve worst case presents a future when even theoptimal combination of policy levers considered in Table 4.1 pro-duces a dismal outcome. Faced with such a situation, participants inan actual policy-relevant exercise might follow path “d” in Figure 3.1and seek other policy options that might prove effective in suchfutures. A variety of levers would be potentially useful in SafetyValve’s worst case. Public health and education policies mightreduce the vulnerability of human population to declines in envi-ronmental carrying capacity and, thus, the high death rates shown inFigure 5.16. R&D funding and institutional reform might lower thecost of speeding the decoupling rate. Near-term policies that pro-moted improved environmental monitoring, shaped people’s futurevalues, and improved the efficiency of governing institutions mightincrease the ability of future policymakers to detect and respond toimminent collapse of carrying capacity. The simple Wonderlandscenario generator used in this study will not, however, supportconsideration of any such policies. Modifications that would enable

Implementing Robust Decisionmaking 117
it to do so lie well beyond the scope of this study. An improved sce-nario generator would, however, allow analysts to continue iteratingthrough the steps of Figure 3.1, design actions effective against suchfutures as the Safety Valve worst case, assess their performanceacross a wide range of plausible futures, and eventually find strate-gies that are even more robust.
No matter how sophisticated the scenario generators become, anylong-term policy analysis in a sufficiently challenging policy envi-ronment may ultimately reveal futures against which no strategy isentirely robust. This situation may be an unavoidable characteristicof the world itself rather than any computer code used to describe it.In some futures, no combination of available policy levers may offera good outcome. More vexingly, some stressing futures may demanda strategy that has unavoidably high regret in a wide range of othercases. For instance, successfully addressing the Safety Valve worstcase might demand expensive measures to reduce costs and to adaptto environmental changes unneeded in most other futures. Thus, itmight be tempting to ignore such potentially perverse scenarios.Before discarding them entirely, however, it is worth rememberingthat perverse scenarios do occasionally unfold. The Safety Valveworst case thus raises a second important methodological point:How should robust decision analysis characterize the risks of seem-ingly unlikely, hard-to-hedge-against futures?
CHARACTERIZING IRREDUCIBLE RISKS
In the standard Bayesian approach, decision analysis begins byeliciting the probabilities of a wide variety of uncertain input param-eters from experts and stakeholders. The analysis then provides thestrategy with optimum performance contingent on these expecta-tions. The optimum strategy may perform poorly in some futuresthat the elicitations have suggested are highly unlikely. The strate-gy’s ultimate success may depend strongly on the correct characteri-zation of these risks.
RAP™ takes an opposite approach, consistent with Bayesian theorybut inverting Bayesian practice. The iterative process illustrated inFigures 3.1 helps participants design one or several alternativestrategies robust across a wide range of plausible scenarios withoutthe need for consensus judgments on the likelihood of these scenar-

118 Shaping the Next One Hundred Years
ios (although the process can use any reliable, widely accepted prob-abilistic information available). Each candidate robust strategy mayhave some small number of futures in which it unavoidably fails.The final step in a robust decision long-term policy analysis is tocharacterize the risks inherent in adopting a candidate robust strat-egy. We can make such a characterization by estimating the maxi-mum likelihood that policymakers would have to assign to that strat-egy’s “breaking scenarios” before choosing some other action(including possibly doing nothing). For instance, how likely mustscenarios that cause Safety Valve to entail great regret be before poli-cymakers should choose some alternative strategy? Under condi-tions of deep uncertainty, this approach offers important advantagesover the traditional use of probabilities in quantitative decisionanalysis. Rather than suggest optimal strategies based on experts’estimates of the likelihood of a long list of uncertainties, a robustdecision analysis helps decisionmakers craft well-designed strategiesthat present a small number of irreducible tradeoffs. Policymakerscan then focus their attention on these few key uncertainties.
To perform this calculation,11 the scenario generator produced anensemble of 2,278 scenarios to span the uncertainty space.12 Thosefutures for which the regret of the Safety Valve strategy is high,defined here as greater than 2 percent, were identified. This proce-dure identified 51 such scenarios, about 2 percent of the total sam-ple. Larger numbers of cases and more sophisticated experimentaldesigns (designed, for example, to oversample in regions of highregret) could increase the number of breaking scenarios, and thesemeasures might be justified in the context of some analyses. Thissmaller sample is sufficient for the demonstration purposes here.
The next step is to identify the strategy that performed best in those51 futures where the Safety Valve strategy does poorly. Assuming
______________11An early version of this procedure was initially reported in Lempert et al. (2000).12This ensemble resulted from conducting a Latin Hypercube sample of 5,000 points.(Latin Hypercube is a method of sampling that produces values uniformly spread overhigh-dimensional spaces.) We then kept only those runs whose demographic inputparameters produce plausible future population scenarios, defined as a 2050 popula-tion between 700 million and 1.5 billion in the North and a 2050 population between 7billion and 15 billion in the South. We discarded the 2,729 cases that did not meet thiscriteria.

Implementing Robust Decisionmaking 119
that all these “breaking scenarios” are equally likely, the strategy thatsets and enforces near-term emissions intensity milestones of 1 per-cent increase in the North and 2 percent increase in the South hasthe lowest average regret of any option considered. This strategy,labeled M12, does not ask the question “Is this milestone achiev-able?” shown in Figure 5.12. Unlike Safety Valve, M12 enforces itsnear-term milestones whether or not they are costly.
The next question is how likely these “breaking scenarios” wouldneed to be in order for policymakers to choose a strategy other thanSafety Valve. The 2,278 point uncertainty space sample in this exer-cise falls into two classes: the NSucceeds = 2,227 points for whichSafety Valve has low regret and the NFails = 51 points for which itdoes not. Define φ as the odds of a breaking scenario relative to afuture where Safety Valve succeeds.13 The expected regret of strategyj can then be written as
EN E N E
N NjSucceeds j,S fails j,F
Succeeds Fails
=++
φφ
(5.1)
where E j,S and E j,F are the expected regret of strategy j across the2,227 and 51 scenarios where Safety Valve succeeds and fails, respec-tively.14
Figure 5.17 compares the resulting expected regrets for Safety Valveand M12, its Best Alternative as a function of the odds that deci-sionmakers ascribe to a breaking scenario. Both strategies performpoorly when the odds of a breaking scenario are high relative to theirperformance when such futures are unlikely. However, SafetyValve’s expected regret is over twice that of its best alternative when
______________13Again, at this stage the analysis seeks to provide decisionmakers with information ina form that will support their final reasoning process. There exist studies indicatingthat the intuitive appreciation of likelihoods stated in the form of odds is more readilyaccommodated by most people than in the form of probabilities more familiar tostatisticians.14The calculations assume that the scenarios have uniform probability within theN Succeeds and N
Failssets. In general, analysts could calculate the expected regret of
strategies within each sample using one or more alternative probability distributions.Similarly, they could also differentiate among different types of breaking scenarios forthe strategy of interest and assign different odds to each type.

120 Shaping the Next One Hundred Years
the odds of a breaking scenario are high. However, the crossoverpoint of the lines in Figure 5.17 suggests that, if decisionmakers areto abandon Safety Valve for its best alternative, they must believethat the odds of any individual breaking scenario are nearly 10 timesgreater than those of any other future. That is, decisionmakersshould choose Safety Valve unless they believe the odds of a futuresuch as that shown in Figures 5.15 and 5.16 are an order of magni-tude more likely than that shown in Figures 5.2, 5.3, 5.11, or any of awide range of other cases.
At present there exists no sound science or any panel of experts whocan definitively assign such odds. Rather, decisionmakers, whether
RANDMR1626-5.17
Exp
ecte
d re
gret
(pe
rcen
t)
Relative odds of a future where Safety Valve fails
0.00
1.00
2.00
3.00
4.00
5.00
6.00
0.1 1 10 100 1,000
SVM12SV surpriseM2X surprise
NOTE: The horizontal axis shows the odds of a future where Safety Valve per-forms worst relative to those where it performs well. The odds are given by φ inEquation (5.1). Solid lines show cases with no surprise. Dashed lines show caseswith technology surprise described below.
Figure 5.17—Expected Regret of the Safety Valve Strategy and Its BestAlternative in Futures Where Safety Valve Performs Worst

Implementing Robust Decisionmaking 121
citizens or their representatives, must ultimately judge the likelihoodof these key futures through their choice of strategy. Analysis canperform a valuable service in providing a framework for characteriz-ing the irreducible risks of potentially robust strategies. Rather thanput pressure on science and experts to seek more certain judgmentsthan are warranted or possible, the robust decision approach appliesa wide range of available information to the clever design of a smallnumber of strategies that minimize as much as possible the keyuncertainties that must be characterized. In doing so, the approachcombines the insights available through data and computer calcula-tion with judgments best left to humans. Decisionmakers are oftenmost comfortable making judgments about how they weigh alterna-tive values and expectations, not in abstract isolation but in the con-text of the choice among specific alternative policies (Lindblom,1959). The role of the analyst is to help decisionmakers minimizeand characterize as much as possible such key, irreducible tradeoffs.In performing this final characterization of probabilistic risk, weleave to groups of stakeholders a final, informed, and focused judg-ment of the futures they wish to bet against.
CONFRONTING SURPRISE IN SUSTAINABLEDEVELOPMENT
As described in Chapter Four, this analysis also involved a group ofRAND experts from a variety of fields who acted as “stakeholders” inthe sustainability debate. We met with the group members individu-ally over several months to familiarize each with the scenario genera-tor, explore the scenario landscapes, and acquaint them with theparticular robust decision method and software system being used.The entire group then met to be presented with the argument forSafety Valve as a robust strategy and was then challenged to suggestsurprises that might defeat the Safety Valve strategy. This processwas intended to match that shown in Figure 3.1.
The group’s suggestions are summarized below as three future sur-prises that could be represented with relatively simple structuralchanges to the modified Wonderland scenario generator:
• Technology Surprise: Unforeseen technological advances intro-duce discontinuous change in the nature of the economy and its

122 Shaping the Next One Hundred Years
relation to the environment. This was represented by doublingthe exogenous decoupling rate in 2030 and beyond.
• Population Surprise: A global epidemic occurs. This was repre-sented by doubling the death rates between 2030 and 2050.
• Values Surprise: Future generations live in a virtual world oftheir own creation and care nothing for any of the things familiarto us or our ancestors. We represent this by varying the parame-ters of future decisionmakers in our model beginning in 2030.
As is often the case, these surprises are best represented by structuralrather than parametric uncertainty. That is, referring to the XLRMparsing of the policy problem introduced in Chapter Four, the sur-prises related not to new values of the parameters of the X quadrantrepresenting factors outside our control (future oil prices, regionalwars breaking out, etc.). Rather they occur in the R quadrant, thefundamental relationships tying these factors together. This reflectsthe fact that the very fabric of the systems we rely upon may alsoshift.
How might these surprises affect a decisionmaker’s views on therobustness of the Safety Valve strategy? Figure 5.18 shows the per-formance of Safety Valve over the landscape of plausible futuresshown in Figure 5.13 for the surprise-free case and each of the threesurprises.15 These surprises do have some small effect on the regretof this strategy as viewed from today. In particular, there are regionswhere Safety Valve’s relative performance degrades compared toother alternatives in the face of the technology surprise. However,the results in Figure 5.18 cast only little doubt on Safety Valve as therobust choice.
These views, of course, represent only a narrow slice across the fullrange of plausible scenarios. To understand the effects of the sur-prises across the uncertainty space, we ask how they would changedecisionmakers’ judgments about the likelihood of futures thatwould cause them to choose an alternative to the Safety Valve
______________15Note that this figure differs from that in Lempert, Popper, and Bankes (2002)because the surprises occur in 2030 rather than 2050.

Implementing Robust Decisionmaking 123
RANDMR1626-5.18D
ecou
plin
g ra
te (
%)
–1
1
5
3
4
2
0
3210 4Economic growth rate (%)
3210 4Economic growth rate (%)
Safety Valve
U.S. in 20thcentury
U.S.1890-1930
U.S. since1950
U.S. since1950
Demographic surprise Values surprise
N$ W$
NG WG
N$ W$
NG WG
U.S. in 20thcentury
U.S.1890-1930
No regret A lotMild Overwhelming
Dec
oupl
ing
rate
(%
)
–1
1
5
3
4
2
0
3210 4Economic growth rate (%)
3210 4
Economic growth rate (%)
Safety Valve
U.S. in 20thcentury
U.S.1890–1930
U.S. since1950
No surprise Technology surprise
N$ W$
NG WG
N$ W$
NG WG
U.S.in 20th
century
U.S.1890–1930
U.S. since1950
NOTE: Futures are defined by potential surprises identified by our advisory panel: nosurprise, a large advance in the decoupling rate, an epidemic that radically reducespopulation, and a shift in the values of future generations, which causes them to notvalue environmental quality.
Figure 5.18—Performance of the Safety Valve Strategy over a Range ofSurprising Futures

124 Shaping the Next One Hundred Years
Addressing this question involves repeating the expected regret cal-culations discussed above for the case where the surprises occur. Asbefore, the scenario generator produces an ensemble of scenariosthat span the uncertainty space, but this time technology surprisesare allowed to occur.16 The 5,000-point Latin hypercube experimen-tal design yields 2,264 futures with plausible population trajectories.Of these, 61 have high regret (greater than 2 percent) for Safety Valve.Assuming that all these “breaking scenarios” are equally likely, thestrategy M2X, which has no milestone in the South and sets andenforces a near-term emissions intensity milestone of a 2 percentincrease in the North, emerges as the one with the lowest averageregret of any option considered. Compared to the case withouttechnology surprises, this Best Alternative to Safety Valve has lessaggressive milestones because the technology surprise can increasefuture decoupling rates and thus reduce the need for aggressivenear-term actions.
The dashed lines in Figure 5.17 show the overall effects of the tech-nology surprise on the Safety Valve strategy. The surprise marginallyreduces the performance of the candidate robust strategies so thatone needs only to assume that the breaking scenarios are five timesmore likely than Figures 5.2, 5.3, 5.11, or any of a wide range of othercases.
Nonetheless, this analysis suggests that the surprises proposed bythe advisory group do not significantly challenge the robustness ofthe Safety Valve strategy. Undoubtedly, had we conducted a moreeffective stakeholder process, given them more time to consider, orbeen willing to modify the model to include more extensive effects,our experts could have succeeded in suggesting surprises that wouldhave called Safety Valve’s robustness into question. Armed with suchproposals, we could have repeated the analysis to determine howand whether it would be worthwhile to hedge against these proposedsurprises.
______________16Specifically, an input parameter indicates that the new scenario generator codedescribing a technology surprise should be employed. The Latin hypercube experi-mental design then includes a sampling over the years (2002 to 2100) in which thatsurprise occurs.

125
Chapter Six
POLICY-RELEVANT LONG-TERM POLICY ANALYSIS
This report demonstrates a methodology for thinking seriously andsystematically about near-term steps that can purposefully shape thelong-term, unpredictable future. Work in this study and in otherefforts (cited in Chapter Three) suggests that the method and tech-nology hold considerable promise for addressing not only problemsassociated with long-term policy and long-range thinking, but also inapplication to a wide range of other venues where deep uncertaintyinhibits or frustrates more traditional decision support approaches.The promise is there. Nevertheless, it is also appropriate to point outthose features that will require further elaboration for this promise tobe fully realized in tools widely used by decisionmakers.
The analysis in Chapter Five offers policy recommendations thatappear both interesting and plausible, but it falls short of a policy-relevant exercise for two important reasons. First, the scenario gen-erator lacks sufficient resolution to address the actual policy levers ofinterest to real world decisionmakers and to embrace the full rangeof scientific, economic, social, and political information available tohelp adjudicate among alternative strategies. Second, while anyrobust decision method applied to LTPA is intended as an iterative,interactive process among the stakeholders to a decision, this exer-cise did not engage such parties. Addressing these challenges raisestwo additional issues: the need for improved analytic tools for navi-gating through large, multidimensional scenario spaces and the needfor improved treatment of the ways in which current and future gen-erations value the long-term future.

126 Shaping the Next One Hundred Years
This chapter describes how future work might improve the robustdecision methodology implemented here and describes some of thechallenges and potential this limited demonstration suggests for thepractice of policy-relevant LTPA.
BUILDING POLICY-RELEVANT SCENARIO GENERATORS
Despite its shortcomings, the scenario generator used in ChapterFive was particularly convenient for our demonstration project.Focused on methodology, this proof-of-principle effort worked bestbased on an existing model. Had the authors created their own sce-nario generator from scratch, readers might focus undue attentionon the idiosyncrasies and complexities of its design rather than onthe general demonstration of how any scenario generators ought tobe used to make arguments about the best policies to shape unpre-dictable futures. The Wonderland model, the precursor for the sce-nario generator used here, is also simple enough to allow the easyaddition of key elements—e.g., the adaptive response of future gen-erations. Often downplayed in models designed for prediction, suchelements are essential to scenario generators designed for LTPA.
Clearly, a policy-relevant exercise, particularly on a topic as expan-sive and complex as global sustainability, requires greatly improvedscenario generators. To be effective, the scenario generators need toexplore the full range of policy levers stakeholders and decision-makers might propose as robust near-term solutions to the sustain-ability problem, represent the full range of measures that individualsmight use to compare the desirability of alternative future scenarios,and exploit the vast array of knowledge relevant to the debates andconcerns of those struggling with this policy problem. For example,Wonderland does not represent education, so education levels can-not be included as a measure of a desirable future, and neither cangovernment policies that promote education as a means of achievingrobust near-term strategies. Thus, those who believe that educationis a crucial element of sustainability could easily challenge the analy-sis here. In the normal process of employing the iterative methoddescribed in Figure 3.1, analysts would address this challenge byaugmenting the scenario generator to incorporate the requisitelevers and measures. Such augmentation was beyond the scope ofthis project.

Policy-Relevant Long-Term Policy Analysis 127
Similarly, the relationships embodied in the Wonderland-based sce-nario generator, while plausible, do not capture the available rangeof knowledge and beliefs that could be brought to bear on the sus-tainability debate. For instance, there exists a vast literature relevantto GSG’s claim that their Conventional Worlds scenario, which inessence reflects the so-called Washington Consensus vision of glob-alization, can easily slide into Barbarization. Policy-relevant LTPAmight use multiple scenario generators to capture the full range ofrelationships among near-term policies, uncertain factors, and mea-sures of desirable futures implicit in today’s different schools of eco-nomic, demographic, social, and environmental thought and thenexamine the robustness of alternative near-term policies with thesemultiple models.
Policy-relevant scenario generators may require much greater reso-lution than the Wonderland-based system used here. For instance, asustainability scenario generator should represent many morecountries or regions than just an aggregated North and South.Greater regional resolution would allow users to consider the effectson global trends of important differences between such countries asNigeria, China, and India as well as enable consideration of thedesirability of scenarios based on the fates of individual countries. Itis crucial to note, however, the reasons for including greater resolu-tion in a scenario generator for LTPA. Traditional computer model-ers will often add detail to a model in a futile search for a greater real-ism that yields more accurate predictions. In contrast, the need touse available information to adjudicate among alternative policychoices drives the resolution needed for LTPA scenario generation.This contrast stems from a difference in directionality. Predictionbegins with an attempt to create a true representation of the realworld. LTPA begins from the “back end” with the policy question,which in turn drives the design of the scenario generator. Successiveiterations of the analysis can produce scenario generators with theever-higher resolution necessary to answer more-detailed questionsabout strategies. At each stage, however, the search for robuststrategies must drive the choice of information to include.
The ideal scenario generators for LTPA would also be built andoperated very differently from most computer models designed forprediction. Most existing models, including Wonderland, assumespecific equations that embody the “best” representation of relation-

128 Shaping the Next One Hundred Years
ships in the real world. In contrast, an analysis seeking robust long-term policy options should aim to capture the full range of dynamicrelationships plausible, given current knowledge that, in many cases,is consistent with several alternatively constructed equations. Thus,the scenario generator must not only support exploration acrossparametric uncertainty but also across alternative systems of equa-tions to explore implications of structural uncertainty as well. Thequestion of whether such a scenario generator is built as one piece ofsoftware or as multiple alternatives (an ensemble of scenario genera-tors) is one of implementation and is not crucial here. However con-structed, the software supporting LTPA should allow easy explo-ration over structural uncertainty, ideally during the course of anexercise in response to challenges and hypotheses raised by partici-pants—e.g., “Would you still favor that policy if the economyresponded as claimed by Milton Friedman as opposed to Paul Krug-man?” Further, the ideal software infrastructure would support real-time extension to the scenario generator.
The pragmatics of software engineering may require that analystsinitially design scenario generators to contain a wide range of poten-tially relevant representations and phenomena, many of which mayremain suppressed and unused during any given stage of the analy-sis. Some new ideas generated by human interlocutors, stimulatedby interim results, may always require revision to the software.However, pragmatic engineering constraints imposed by technologi-cal limits should not be confused with methodological foundations.LTPA requires that the most diverse ensemble of plausible scenariosbe made available for analytic use. This goal is very different frombuilding a single model that is as correct as can be managed.
The International Futures Global Simulation Model
A useful example of the contrast between predictive models and sce-nario generators can be found in International Futures (IFs), one oftoday’s most frequently used long-range, global simulation models(Hughes, 1999). The project team examined IFs extensively but ulti-mately chose to not use it for scenario generation. IFs containsimpressive levels of geographic, demographic, and economic resolu-tion as it simulates population, food, energy, environmental,economic, and political developments from 1995 through 2100. It

Policy-Relevant Long-Term Policy Analysis 129
simulates trends in 162 countries that may then be aggregated into14 to 18 fixed regions. These regions are connected by trade, finan-cial flows, and migration as well as by the threats and conflicts aris-ing from international politics. The economic module balancessupply, demand, and trade in each of five economic sectors: agricul-ture, primary energy, raw materials, manufactures, and services.1
IFs aims to represent all major processes in the world to forecast thefuture and investigate how various uncertainties and policy choicescan affect that future. Users can create a vast array of alternativescenarios by changing various model input parameters and, in somecases, even by changing the underlying equations. Quite appropri-ately acknowledged as the current state-of-the-art in its field, IFs hasbeen used widely to investigate the implication of various long-runtrends. For instance, the model has been recently and successfullyadopted by a major European Union study on the potential impactsof information technology in Europe.
IFs is intended to reflect best available theory rather than any par-ticular world view. Nonetheless, the model embodies key assump-tions that limit its utility as the sole base for an LTPA exercise. Inparticular, IFs’ underlying structure assumes that markets and pricesignals will work effectively to allocate resources throughout thetwenty-first century. As such, it embodies the assumptions underly-ing the GSG Conventional Worlds scenario. But IFs cannot addressGSG’s concern that these mechanisms might fail.2 That is, the mod-el’s equations cannot represent the market and institutional break-downs at the heart of the GSG Barbarization scenario. Thus, IFs can-not assess whether or not near-term policies are sufficient to preventBarbarization because the model cannot produce that future what-ever the choice of near-term policies may be.
______________1Information on the International Futures (IFs) platform, developed by Barry B.Hughes at the University of Denver is available at http://www.du.edu/~bhughes.2The IFs model was explicitly constructed to address many of the shortcomings of theWorld3 model used in the Limits to Growth study. The Limits to Growth work wasbroadly criticized for ignoring the adaptive capacity of human society and, in particu-lar, the potential of the market to take rising prices as a signal to innovate and changebehaviors. IFs goes to great effort to model the effects of markets and prices lacking inWorld3, but the markets in IFs may work too well. The real-world frictional effects ofinstitutions, culture, and human frailty might prove more important than the modelassumes.

130 Shaping the Next One Hundred Years
From Models to Scenario Generators
IFs is but one example of a vast library of existing models often usedfor scenario analysis but implicitly built from a template originallyconceived for prediction. Fortunately, LTPA can employ such mod-els in a variety of ways. First, LTPA might confine itself to policyquestions that can be handled by relatively minor modifications ofan existing model. For instance, an analysis might use IFs to exam-ine the robustness of alternative near-term policies—for instance,levels of investment in education—across different manifestations ofConventional Worlds. Such an application might require addingcode to IFs that would represent the adaptive responses of futuredecisionmakers, but would otherwise allow the model to be usedlargely as is. Second, LTPA might create its ensemble of plausiblescenarios using multiple existing models, each representing a dis-tinct set of assumptions about the key driving forces in the futureworld. Compared to other options, this formulation requires lessrewriting of computer code but would make it difficult to create setsof scenarios that smoothly interpolate between different views of thefuture. Finally, analysts might build an entirely new piece of com-puter code, drawing on the code and data assembled from existingmodels but explicitly designed for LTPA, whose equations containeda wide variety of alternative and competing representations of theplausible relationships among uncertainties, levers, and outcomemeasures.
These last two options raise an important question: How shouldanalysts assess the accuracy and utility of a scenario generator forLTPA? A predictive model fails if its forecasts are inconsistent withthe future that actually occurs. Based on the practice of the physicalsciences, the creator of a predictive model ideally aims to create asystem that generates a forecast different from those predicted bycompeting models and subsequently borne out by future events. Tothe extent such analyses treat uncertainty, it enters as a perturbationon the main results, blurring the predictions and hence making itmore difficult to distinguish conclusively whether or not events fal-sify one theory or another. This contrasts strongly with the philo-sophical precepts guiding construction of scenario generators forLTPA. Scenario generators must aim first to embrace the full rangeof uncertainty to be as expansive as possible, consistent with avail-able information. The ideal scenario generator fails if it cannot be

Policy-Relevant Long-Term Policy Analysis 131
made to represent a plausible future suggested by a party to the pol-icy debate or the LTPA in which it is being used suggests a robustpolicy that performs poorly in the actual future in a way unantici-pated by the analysis.
IMPROVED NAVIGATION
Policy-relevant scenario generators for LTPA will often be morecomplex, both in run time and number of input parameters, than thesimple Wonderland-based system used here. Navigating throughlarger scenario spaces will require more capable search, sensitivityanalysis, and other analytic tools. There exists a vast repertoire ofsuch analytic methods, largely developed for purposes somewhatdifferent than those required for LTPA. In other work, we have begunto review these methods and select those most useful for guiding thesearch for robust strategies. In particular, we have focused on sensi-tivity analysis and other statistical methods that can help identifypotentially robust strategies and characterize their most importantweaknesses.
The current exercise assesses the robustness of alternative strategiesby comparing visualizations. For instance, Figures 5.9 and 5.13 sug-gest that Safety Valve is more robust than No Increase. Such visual-izations will always remain important because they can display therelationship among scenarios and clearly illustrate the influence of asmall number of uncertainties on a small number of strategies. Theyare limited, however, in their ability to summarize the performanceof many strategies over many dimensions of uncertainty.
Figure 6.1 employs a commonly used type of statistical visualizationthat can quickly display the comparative performance of strategies.3
This “box-and-whisker” plot compares the range of regrets over theuncertainty space for four milestone strategies— M00 (No Increase),M11, M22, and MXX—and the Safety Valve.4 This visualization wasproduced by calculating the regret of each strategy at each of 5,000points in the 41-dimensional uncertainty space defined by all the X
______________3Our thanks to RAND graduate fellow Joe Hendrickson for performing the calculationsin Figures 6.1 and 6.2.4Table B2 defines the No Increase, M11, M22, and MXX strategies.

132 Shaping the Next One Hundred Years
and L parameters in Table 4.1.5 (The parameters are described indetail in the appendix.) The particular set of points was createdusing a Latin hypercube (Iman, Davenport, and Ziegler, 1980)“space-filling” experimental design that samples the entire space ascompletely and uniformly as possible without undue clustering inany one region. Figure 6.1 shows the range of regrets for each strat-egy. The upper and lower edges of each box indicate the first andthird quartile of the distribution of regrets for each strategy. (Thefirst quartile is indistinguishable from zero regret.) The lines lie 1.5times the interquartile range past the top of each box, and the dotsshow individually the 100 highest regrets for each strategy. Suchbox-and-whisker plots are common, but this is the first applicationof this display we are aware of for comparing the regrets of strategies.
Figure 6.1—Distribution of Regret for Various Milestone andContingent Strategies
______________5Table 4.1 shows 43 uncertainties. Here we held the Future_Action_N and Future_Action_S parameters constant at Decouple+Adapt.

Policy-Relevant Long-Term Policy Analysis 133
This figure can help users identify potentially robust strategies forfurther examination. As expected, the Safety Valve strategy has lowerregret over most futures compared to the milestone strategies, asmeasured by the third quartile of their distributions. The best mile-stone strategy appears to be M22. Interestingly, No Increase hashigher regret over many more futures than does the Stay the Coursestrategy MXX. (MXX has no near-term milestones and thus calls forno near-term policy actions in all futures.) No Increase also has thelowest maximum regret of all the strategies. This result is consistentwith the observation that Safety Valve will sometimes allow an oth-erwise preventable environmental catastrophe. This pattern is alsoconsistent with some of the pathologies of the mini-max criteriaoriginally pointed out by Savage (1950).
While rich in possibilities, Figure 6.1 only provides an initial guide tothe robustness of alternative strategies. Implicitly, the figureassumes that all futures are equally important, which might not bethe case. To assess robustness, the weaknesses of each strategy mustbe understood—that is, the futures where each has high regret. Inthe current exercise, we used a global sensitivity analysis (Saltelli,Chan, and Scott, 2000) to suggest the uncertainties most importantin generating high regret for each strategy. This sensitivity analysishelped the project team choose the axes for all the landscape visual-izations in Chapter Five, and in particular for Figures 5.10 and 5.14.
Figure 6.2 shows the results of a global, nonlinear sensitivity analysison the regret of the No Increase and Safety Valve strategies. Globalsensitivity analyses are statistical methods that assess the inputparameters whose variation is most important in determining varia-tions in outputs, with full consideration of all the interactions amonginput parameters. The extended Sobol (1990) method was used toconduct these calculations because it is one of the most efficient—i.e., it produces accurate results with the least amount of computa-tion—and because it can employ the same space-filling experimentaldesign as that used for Figure 6.1. (Other sensitivity analysis meth-ods require special space-filling designs less useful for multiple pur-poses.) The horizontal axis lists 41 input parameters of the Won-derland scenario generator, divided into four categories governingeconomics, demographics, environment, and actions by future deci-sionmakers. The vertical axis shows the relative importance of eachparameter in producing a large regret for the strategies. Such sensi-

134 Shaping the Next One Hundred Years
tivity analyses are increasingly common, though the analysis here isnovel in one important respect. That analysis is conducted on theregret of strategies, not on the direct model output, which providesinformation about the parameters most important in determiningthe choice among strategies, not, as is more common, on theparameters that cause the largest swings in the model outputs.
These sensitivity analysis results suggest that the strategies each havesignificantly different patterns of weaknesses. The success of themilestone strategies depends most heavily on economic uncertain-ties, in particular the exogenous rates of decoupling and economicgrowth and the cost of policies to speed decoupling, and to a lesserextent environmental uncertainties, such as the sustainabilitythreshold. In contrast, the success of Safety Valve strategy dependsmost strongly on environmental uncertainties and, interestingly, on
RANDMR1626-6.02
EconG
rowth
N
InnovR
ateN
MaxD
eclin
eN
FlatIn
itialN
CostIn
novN
Inerti
aN
ConvYear
InnovR
ateS
MaxD
eclin
eS
FlatIn
itialS
CostIn
novS
Inerti
aS
EconL
ink
Tech
Link
PoorDeath
rt
RichDeath
rt
IncR
ichDeath
rt
MaxD
eathr t
Inc
FlatIn
crease
PoorB
irthr
t
RichBirt
hrt
IncR
ichBirt
hrt
SustPollN
DropRate
N
ChangeFSustain
N
SustPollS
DropRate
S
ChangeFSustain
S
EnvLi
nk
Detect
KapChange
Future
DiscountN
IncU
tility
N
Weig
htEnv
N
AdaptCost
N
AdaptRate
N
Detect
CapChange
Future
DiscountS
IncU
tility
S
Weig
htEnv
S
AdaptCost
S
AdaptRate
S
.25
.20
.15
.10
.05
0
.25
.20
.15
.10
.05
0
Per
cent
age
of v
aria
nce
Economy Population Environment Futuredecision-makers
Safety Valve
No Increase
NOTE: Curves show importance of each input parameter to variation in each strate-gy’s regret.
Figure 6.2—Results of Sobol Global Sensitivity Analysis on the No Increaseand Safety Valve Strategies

Policy-Relevant Long-Term Policy Analysis 135
the values and capabilities of future decisionmakers. This informa-tion adds richness to the comparison between the two types ofstrategies because one might regard decoupling rates and economicgrowth rates as being more readily influenced by near-term policychoices—i.e., by adding additional options to the list of policy leversin Table 4.1—than would be the fragility of the environment or thevalues of future decisionmakers. Indeed, arguments by thoseopposed to the Safety Valve proposals for climate change may corre-spond to the comparative weaknesses of the strategies shown in Fig-ure 6.2. That is, opponents may shun reliance on the actions offuture generations in favor of optimism about their ability to swaycurrent technological or economic trends. In a policy-relevant exer-cise, these results might suggest extensions of the scenario generatorand create landscapes that could explore such questions.
The examples shown here only touch on the rich array of analyticand statistical routines that further research might prove useful forpolicy-relevant LTPA. In future research, we hope to explore the useof these resources, determine those most helpful in such work, andmake their use routine.
A DIVERSITY OF MEASURES AND VALUES
To find robust near-term policies that will improve the human con-dition and that can serve as a basis for a consensus for action, LTPAmust employ measures meaningful to a wide variety of individualsand groups. This demonstration employed a set of four measuresloosely based on the UN’s Human Development Index and conceptsof a “Green GDP.” The Wonderland-based scenario generator ren-dered only incomplete version of these indices. More important, theHDI is far from the last word in measuring human progress, as theindex’s creators would be the first to point out. Policy-relevant LTPAmust compare the desirability of alternative scenarios using a set ofconcise analytic measures that grip the imagination and embrace thegoals of many people holding diverse views.
Driven by the conviction that such purely economic indices as GDPpresent a highly incomplete picture, the quest to develop better indi-cators of human progress, or lack thereof, has garnered much recentattention. As described in Chapter Four, a growing body of literaturehas emerged on measures of human progress that correspond to a

136 Shaping the Next One Hundred Years
rich array of human goals. The UN’s HDI aims to capture quality-of-life measures, in particular life span and level of educational attain-ment, in addition to GDP per capita. However, these additional fac-tors tend to be highly correlated with the economic measure.Researchers interested in sustainability have crafted proposed mea-sures for Green GDP, and broader indicators of environmental qual-ity that also address biodiversity and ecosystem services. Theseattempts have struggled with a lack of key data and uncertainties inthe relationships among observable indicators and the overall con-dition of the environment. Nonetheless, application of Green GDPmeasures has suggested that some developing nations have achievedapparently high rates of economic growth only by seriously depletingtheir natural resources. Research on new measures of humanprogress has been a particular interest at the Pardee Center. Forinstance, Robert Klitgaard and his colleagues are examining the sta-tistical correlation between self-reported happiness and a variety ofdatabases relating to life expectancy, measures of liberty, and free-dom, and they use the results to propose an index of human progressbased on the goals of “life, liberty, and the pursuit of happiness.”
Additional research on measures of human progress that character-izes the past performance of nations and other entities using actualtime series data would be useful. The findings of such research couldinform LTPA by suggesting engaging measures that, when adapted asdone here for the HDI, can compare the desirability of the alterna-tive, simulated time series created as the scenario generator exploresdifferent paths into the future. The robust decisionmaking approachalso provides interesting opportunities to address current challengesin creating reliable measures of environmental quality. For instance,proposals to increase the availability of environmental data mightbecome potentially important policy levers to include in strategies.Given the uncertainty in the relationships between observable indi-cators (e.g., rate of deforestation, extinction rates) and future envi-ronmental quality, long-term policy analysts might also explore thetypes of near-term indicators that, when employed in an appropriateadaptive strategy, can most robustly lead to long-term environmen-tal health.6
______________6Lempert et al. (2000) provides an initial attempt to examine indicators most useful toa robust strategy.
Policy-Relevant Long-Term Policy Analysis 137
The great diversity of beliefs and values among those who must par-ticipate in confronting many long-term challenges poses a keyimpediment to generating consensus for action. In our demonstra-tion exercise, a handful of researchers chose alternative weightingsfor terms in the HDI-derived index to craft four measures of futureprogress intended to represent the range of worldwide values rele-vant to sustainability. Policy-relevant LTPA must enable diversestakeholders to grasp a common view of their challenges and takeownership of the resulting policy recommendations. To that end,LTPA must accomplish two tasks. First, it must partake of theemerging body of research on improved measures of humanprogress. Second, it must develop and employ group processes withactual communities of stakeholders to create from these innovativenew indices an engaging and meaningful set of measures appropri-ate for each policy challenge.
In addition to employing measures of future human progress thatrepresent the current views of parties to today’s decisions, LTPAshould also pay careful attention to the evolution of values andworldviews. Many of the most profound historic changes in humansociety, from the Enlightenment to the spread of democracy and civilrights, resulted in large part from significant changes in how peopleviewed their world. Near-term actions that influence the evolutionof such values may be among the most important levers available totoday’s policymakers. The GSG argues, for instance, that near-termefforts to change society’s current values toward consumption andenvironment are crucial to enabling the Great Transition scenariosand, thus, long-term sustainability. To address such issues, scenariogenerators for LTPA must represent the impact of and changes invalues over time. The Wonderland-based scenario generator crudelyhandled the effect of future values by representing future decision-makers as utility-maximizing agents whose preferences and discountrates will be governed by currently uncertain parameters unaffectedby any of today’s policies. Enriching such descriptions should be amajor emphasis of future LTPA research.
ENGAGING THE COMMUNITY OF STAKEHOLDERS
Ultimately, long-term policy analysis aims to influence long-termdecisionmaking. Thus the analysis must include and engage the

138 Shaping the Next One Hundred Years
people responsible for such decisions. The robust decision approachto LTPA was conceived in part to address this challenge. The itera-tive process in Figure 3.1 aims to produce a series of landscapes thatallow people to see the relationships among the stories they and oth-ers tell about the future and then to seek common solutions thatspan their differing views. When the results remain counterintuitiveor unsatisfactory, people can repeat the process until they can arriveat a common vision about the way to move forward.
In particular, a robust decision method aims to address key short-comings that previous approaches to LTPA face in engaging com-munities of stakeholders. The classic image of quantitative policyanalysis envisions researchers observing the system of interest withdetached objectivity, pursuing intellectual solutions in “ivory tower”isolation from the problem’s biases and passions, and presentingfinal recommendations as completed works. Policymakers and otherinterested parties must then struggle to fit these recommendationsinto their multifaceted debates, which generally address a widerrange of issues than were contained in the analysis. Practical experi-ence suggests that such detached, deductive approaches do a poorjob of eliciting knowledge and opinions from the relevant parties andin promoting a common view among them on the very difficultproblems that are the object of LTPA.
Such group processes as Delphi, Foresight, and scenario planningoften engage the parties in a debate, but they can fail to subjecthuman deliberations to the stern test of consistency with availableinformation. In particular, such group processes can lack a clearpurpose and focus for the exercise, the means for conducting aninterpersonal or interorganizational process that will provide ameaningful methodological core without distorting the process itselfto fit a predetermined mold, and a way of translating the output andnetwork-building results from the exercise directly into positiveplans for action. These lacunae match precisely the aspirations forrobust decision methods of LTPA.
This exercise has taken a small but significant step toward fulfillingthis vision. The entire LTPA exercise from start to finish was con-ducted with ongoing interaction, both individually and collectively,with the members of our advisory panel. We addressed some of thechallenges they raised and achieved some degree of consensus on

Policy-Relevant Long-Term Policy Analysis 139
the results. In other work, we have also gained experience usingthese methods to help diverse stakeholders achieve a commonvision, albeit in exercises focused on less long-term problems andonly traversing a limited number of steps among the pathways laidout in Figure 3.1. For instance, in work supporting strategic planningfor the public higher education systems of four U.S. states, land-scapes of plausible futures have helped interested parties—includingstatewide elected officials; chancellors of major university systems;elected governing boards; and business, faculty, and citizen groups—to understand the relationships between different groups’ projec-tions of future enrollment and financial pressures and to debate con-structively the potential synergies and tradeoffs among the long-termgoals favored by different groups (Park and Lempert, 1998). In workfor major automobile manufacturers, such visualizations havehelped senior managers and design teams to demonstrate that pro-posed new product plans are robust across the differing forecastsand concerns of diverse parts of their organizations, such as engi-neering, marketing, and finance.
Two broad steps are required to build from these initial demonstra-tions the capability for stakeholder interactions necessary for trulypolicy-relevant LTPA. First, researchers must demonstrate the abilityto conduct start-to-finish LTPA exercises with small groups of actualstakeholders who disagree about a policy debate, eliciting theirknowledge and concerns, convincing them the landscapes includeeach of their visions of the future, and moving them toward a com-mon view of necessary policy actions despite their differences in val-ues and beliefs about the future. Second, researchers must show thatthe common vision produced by such LTPA can engage broad audi-ences who have not personally participated in the original exercise.Scenario planners, for instance, claim success on both grounds withtheir well-developed methods for creating scenarios in intensiveworkshops with stakeholders and then publishing the resulting sce-narios to sway a broad audience.
Work to date has laid the foundation for this first step. The XLRMmethods described in Chapter Four have proved highly useful ineliciting from decisionmakers and other parties the full range ofinformation—uncertainties, policy levers, multiple measures of thedesirability of alternative scenarios, and the relationships amongthese factors—needed to construct scenario generators for LTPA.

140 Shaping the Next One Hundred Years
The process in Figure 3.1 can generate visualizations that, with someexplanation, engage the participants who spend time in an exercise.Robustness arguments based on such landscapes have demonstratedsome ability to dislodge debate participants from entrenched posi-tions and move contending parties toward a more common view.
Only experimentation can determine how best to employ thesemethods for different policy problems and with different types ofgroups. For instance, one could conduct parallel workshops eachusing different types of visualizations presented in different orders.Before-and-after surveys could compare the extent to which the dif-ferent exercises shaped diverse views into a common vision ofaction. Another area of research might focus on means to makesome small number of scenarios drawn from abstract generatedlandscapes more concrete. For example, in a sustainability exerciseusing a scenario generator with the level of regional detail containedin a model resembling IFs, one might imagine drilling down atselected points in a landscape to produce a variety of tables andcolor-coded world maps, such as those that populate the HumanDevelopment Reports, showing the future fate of each country ineach scenario. Alternatively or in tandem, one might invent a hand-ful of characters—e.g., three 10-year-olds living in America, India,and Nigeria in 2003—and imagine users drilling down at any pointon a landscape to learn the fate of each child and his or her descen-dants in each scenario. Their fates would be displayed in tables fol-lowing a few key parameters—e.g., income, health, domicile, numberof children, professions, and emigration—images, or perhaps a shortcomputer-generated movie. Only research can determine which, ifany, of these techniques make sense under what circumstances.
Less groundwork has been laid to support the second step of dissem-inating LTPA results so that they influence those who have not partic-ipated in a robust decision analytic exercise. Means for doing somight include oversight panels and review boards, distribution ofintermediate research products and peer review, workshops andconferences, distribution of software tools to allow distributed col-laborative discourse, and community access through web portals.7
______________7Examples of this approach may be found on the Web at http://www.hf.caltech.edu/hf/ and in Lempert and Bonomo (1998).
Policy-Relevant Long-Term Policy Analysis 141
Of course, determining an effective mix of techniques requires muchpractical experimentation and some systematic research.
IMPROVING LONG-TERM DECISIONMAKING
This report adds robust decisionmaking to the roster of availableapproaches for LTPA. By reframing the question from “what is thelong-term future?” to “how can we shape it to our liking?” this newapproach can harness the capabilities of modern computers tograpple directly with the multiplicity of plausible futures that hasbedeviled previous approaches. Even using a very simple scenariogenerator, the demonstration described here suggests a processpotentially more complicated and difficult to understand than exist-ing methods. How might robust decisionmaking overcome thechallenges of becoming a widely used method of LTPA?
First, perceptions of complication often flow from novelty andunfamiliarity. At first, innovations in any field generally appear moreclumsy to use than more established practices. But the balance canchange over time. First-year business school students now countamong their skills analytic methods once practiced only by a fewhighly trained specialists. Such familiarity makes tools easier to usebut not inherently less complicated. Complication also arises frominadequate infrastructure. A rich body of tools and artifacts nowexists to help implement traditional methods for quantitative analy-sis. The absence of such tools makes robust decision methods forproblems of deep uncertainty seem more complicated by compari-son. As computers become even more capable, they will providemore fertile ground in which to build and apply such tools. The pre-sent research provides a step toward addressing this opportunity.
Second, new decisionmaking tools can influence people well beyondthose who actually use them. They can help change the way peoplethink. Decisionmakers often justify policies using conceptualframeworks—optimum choices, cost-benefit analysis—that theycould not implement as analytic methodologies. Indeed, the litera-ture holds many examples of highly ingenious and technicallysophisticated applications of traditional analytic approaches whoseparticulars rarely survive first contact with the process of policy for-mulation. Only a synthesis of the results and a simplified caricature

142 Shaping the Next One Hundred Years
of the original, more-complicated analytic design ultimately influ-ence the decision process.
As one example, the preceding discussion raised the relatively nar-row technical issue of how one validates a scenario generator that isnot intended to predict the future. A related and deeper questionasks what constitutes a proper standard of proof or convincingargumentation when conducting LTPA. The methods discussed inthis report depend on a line of argumentation different from the onecommonly employed in analytic policy exercises. Traditionalapproaches depend in large part on principles derived from the sci-entific method. An extensive literature addresses the nature of sci-entific arguments and refutations and provides a philosophical basefor understanding the nature of scientific proof.8 Prediction plays acentral role in the scientific method, enabling the controlled experi-ments that will support or refute scientific hypotheses.
This archetype provides a decisive and often unacknowledged modelfor those who apply analytic techniques to policy problems and thebroader audience who judge the relevance of these contributions.This archetype can persist even when considerable evidence sug-gests its inapplicability to some particular case. For instance, it iswidely acknowledged that predictions of the regional impacts of cli-mate change—that is, on particular nations or localities—are highlyunreliable. Yet one finds ubiquitous exhortations to produce suchpredictions as a prelude to decisionmaking. Consider the recentcomments of Rajendra Pachauri, chair of the United Nation’s scien-tific body, the Intergovernmental Panel on Climate Change: “I amaware that there is an opportunity for much political debate whenyou start to predict the impact of climate change on specific regions.But if you want action you must provide this information”(Nature,2003).
This report advocates a new model profoundly simple in concept.Under conditions of deep uncertainty policymakers should identify
______________8Some standard works in this literature are Thomas S. Kuhn (1962), The Structure ofScientific Revolutions; Karl R. Popper (1962), Conjectures and Refutations; and ImreLakátos, Proofs and Refutations (1976). It would also be fruitful, in this connection toconsider the commonalities and differences between experimentally based sciences(e.g., physics) and others based more on argumentation from acquired evidence (e.g.,paleontology).

Policy-Relevant Long-Term Policy Analysis 143
near-term strategies robust across a wide range of plausible futuresand seek information that alternatively challenges and improves therobustness of alternative policy options. Its full elaboration may becomplicated—but not necessarily more so—than any other sophisti-cated analytic procedure. Human decisionmakers, whether at theindividual, organizational, or societal level, commonly confrontproblems of deep uncertainty with informal reasoning processessimilar to the systematic, analytic procedures advocated here. Thus,the results of robust decision-based LTPA should ultimately proveresonant and compelling to broad audiences. By its nature, such arobust-decision approach depends more on open-ended, inductivereasoning than on the conclusive, deductive argument appropriatefor policy problems where prediction is feasible. Such lines of argu-mentation are quite different from what is usually expected from theanalytic realm. Unfamiliarity with such types of arguments, andinexperience in disseminating their results to multiple organizationsand interest groups helps make these new methods seem compli-cated. Expanding use and the increasing availability of such toolsmay ease these problems and help provide a growing analytic foun-dation for a simple and powerful concept of how decisionmakersought to think about the long-term.


145
Chapter Seven
CONCLUSION: MOVING PAST FAMILIAR SHORES
What should people do today to shape the next hundred years to theirliking?
Based on experience, a sophisticated reader ought to view with greatskepticism the prospect of successfully answering such a question.The checkered history of attempts to predict the long-term future—from the famous declarations that man would never fly, to the Limitsto Growth study, the unanticipated end of the Cold War, to claimsabout the “New Economy”—should humble anyone who claims toextend their gaze past the well-charted inner seas on into the deepwaters where the future is not tightly constrained by the past. Likenavigators sailing before the days of the reliable compass, those whoshould engage in the vast enterprise of peering into the future oftenfind greater comfort staying focused on the next fiscal quarter, thenext year, the next election. They hug that familiar shore where theycan feel greater confidence that their predictions need not deviatetoo far from the known and familiar and still remain credible.
Yet, the long-term future continues to fascinate and beckon—withgood reason. The very characteristic that makes it so hard to predict,its relative independence from the constraints of the present, alsomake it fraught with the greatest dangers and endowed with oppor-tunities. It is only over the course of decades that we can imagineextending freedom and opportunity across a world where vast num-bers of people still live with oppression and deprivation. Only as theproject of decades can we imagine changing values and technologysufficiently to enable great worldwide wealth to coexist with a richnatural environment. Over that same sweep of time, we can also

146 Shaping the Next One Hundred Years
imagine undermining the rich foundations of democracy, markets,and law, so painfully built up over the centuries, and descending intobarbarism and chaos. The biggest paradox is that our greatestpotential influence for shaping the future may often be precisely overthose time scales where our gaze is most dim. By its nature, wherethe near-term future is predictable and subject to forces we canquantify today we may have little effect. Where the future is ill-defined, unpredictable, hardest to see, and pregnant with possibility,our actions may well have the largest effects in shaping it.
This report offers an exploration into how it may now be possible tosystematically and analytically assess the actions society can taketoday to shape this long-term future. Given the grand challengesposed by the twenty-first century, the world community needsmethods to reconcile our different views the better to define what itis we wish to do and how we can best go about it in a variety ofrealms that currently resist our attempts at analysis and navigation.In this exploration, the authors offer no way to extend the resolutionand depth of our gaze. We suggest no means to change the funda-mental, unpredictable nature of this long-term future. Instead, wepresent an approach based on capability we did not possess yester-day to answer a fundamentally different question. Rather than pre-dict what the day after tomorrow may bring, we will consider howbest, given our persistent inability to predict, we may frame ouractions today to shape a future of our liking.
Implementation may be complex in several particulars, yet the basicconcept is very simple:
• Computers can help humans create and consider a very largenumber of plausible long-term futures. This capability meansthat we now have the tools to create and probe an ensemble offutures sufficiently diverse that it could well include some similarto the one that will actually occur in those aspects important toassessing our choice among strategies.
• Humans can then use the computer to assess which near-termactions perform well, compared to the alternatives, over all thesefutures using a wide range of values. In general, such actions willattempt to exploit latent opportunities, hedge against unpre-
Conclusion: Moving Past Familiar Shores 147
dictable dangers, and adapt over time as the path into futurebecomes more clear.
• Humans and computers then search for plausible futures that“break” the chosen strategy. Humans and computer are bothvery good at such challenges but in different ways. If humans orthe computer can find a breaking scenario, they repeat the pro-cess. If they still cannot break it, the resulting strategy shouldsupport a consensus for successful action.
The outlines of this approach are not new. Humans have probablyimagined alternative futures and how their actions help shape thosefutures for as long as they have been human. In recent decades,computers have helped buttress weaknesses in human decisionmak-ing, particularly the ability to handle masses of data, ensure consis-tency with known laws of numbers, behavior, and the physical world,and trace long causal chains. Only in the last few years have com-puters acquired the power to support directly the patterns of thoughtand reason humans traditionally and successfully use to createstrategies in the face of unpredictable, deeply uncertain futures. Intoday’s era of radical, rapid change; immense possibilities; and greatdangers, it is time to harness these new capabilities to help shape ourlong-term future.


149
Appendix A
DESCRIPTION OF THE WONDERLAND SCENARIOGENERATOR
Chapter Four uses the “XLRM” framework to organize the informa-tion collected for this study’s robust decision approach analysis ofnear-term sustainability policies. The Relationships (R) connect theexogenous uncertainties (X) and policy levers (L) to the metrics (M)used to assess the relative desirability of alternative scenarios. Thisappendix describes the relationships, uncertainties, and metricswithin the XLRM framework. Appendix B describes the policy leversused to construct robust strategies.
RELATIONSHIPS (R)
The relationships in the scenario generator are based on the mathe-matical equations in Herbert and Leeves’s (1998) simple systemsdynamics model called Wonderland.1 The simulation projects futuredevelopment paths as a function of a wide variety of assumptionsabout the properties of the future economy, demographics, and theenvironment. This section reviews its basic equations, while thesections below describe in detail its various parameters, the variationin which represents the exogenous uncertainties, policy levers, andmeasures.
______________1Herbert and Leeves “Troubles in Wonderland,” is available at http://journal-ci.csse.monash.edu.au//ci/vol06/herbert/herbert.html. The name Wonderland derives fromthe pleasant scenarios produced by the model in which per capita income can growwithout limit. Troubles descend on Wonderland in scenarios where environmentalconstraints dominate.

150 Shaping the Next One Hundred Years
Herbert and Leeves’s Wonderland has an economic, population, andenvironmental module. We made several key modifications toimprove the original model’s ability to serve as the scenario genera-tor for this study. First, two world regions are included to representthe current developed and currently developing countries. Thedynamics of the two regions are coupled through their economicgrowth rates, their decoupling rates, and the state of their carryingcapacities. Additional modifications include introducing an “inertia”that represents a delay in the time it takes for policy interventions totake effect and developing measures that value the output of alter-native scenarios. The final addition is a representation of the way inwhich future generations may respond to concerns about sustain-ability.
Economy
The economy in region r = N or S of the Wonderland scenario gen-erator is represented by output per capita Yr,t which grows at anexogenous rate g r which can be slowed by policy and environmentalchanges in each region. Thus
Y Y 1 – –r,t 1 r,t r r,tadj
1 r ,tadj
+ ¢= +[ ]g g j g(A1)
where the drag on economic growth can be caused by decreases inthe “carrying capacity” of the environment Kr,t and the impositionof any policies aimed at preserving the carrying capacity. We write
g g mtt
lr,tadj
r reff
r,t rr,t
r,trdisconnectK C
1-Cr= +( )( ) + +1– (A2)
where the coefficient Cr scales the amount that innovation policies(represented by the pollution tax tr,t ) may slow growth; mr
eff is afactor describing the rate at which decreases in the carrying capacityslows economic growth; and Cr
disconnect is the cost of policies,described in Equation (A16), that can reduce mr
eff . The carryingcapacity, whose dynamics are described by Equation (A9) below, isan abstraction representing the ability of the natural environment tosupport economic growth. It ranges in value from an undiminished

Description of the Wonderland Scenario Generator 151
1 to a totally depleted 0. The growth in region r can be affected byenvironmental changes and policy interventions in both the sameregion, r, and the other region, ¢r . The latter effect is proportional tothe factor j j1 10 1£ £( ), which characterizes the economic linkagesbetween the regions.
Population
The population in each region grows at a rate proportional to thedifference between birth and death rates
N NB – D
1,000r,t 1 r,tr,t r,t
+ = +È
ÎÍÍ
˘
˚˙˙
1 , (A3)
where the birth and death rates are functions of regional income andcarrying capacity given by
Be
er,t r
Y
Y
r, t
r, t=
+
È
ÎÍÍ
˘
˚˙˙
b bb
b01
– (A4)
and
De
1+eKr,t r,t
r, t
r, t=
È
ÎÍÍ
˘
˚˙˙
+ ( )ÈÎÍ
˘˚
a a aa
a
q0 1 21 1– –
Y
Y. (A5)
We assume that the parameters in Equations (A4) and (A5) governingthe dynamics of the population are the same for both regions.

152 Shaping the Next One Hundred Years
Environment
The annual flow of pollutants in each region is given by the productof regional population, per capita output, and Pr,t the pollution perunit output2
F N Y Pr,t r,t r,t r,t= , (A6)
where the pollution per unit economic output improves due to theregion’s exogenous technology innovation cr (related to thedecoupling rate as shown below) and the cumulative effects of inno-vation policies in both regions
P Pr,t 1 r,teff
r ,teff
r r,t+ ¢= ( )1 2– –t j t c . (A7)
The first two factors on the right-hand side of Equation (A7) arerelated to the policy-induced decoupling rate. The factorj j2 20 1£ £( ) represents the extent to which improvements in inno-vation in one region flow to the other and where the cumulativeeffect of the innovation policy in region r is given by
t h t h tr,teff
r r,t r r,t–1eff= + -( )1 . (A8)
The inertia hr can delay the full effect of the policy and can be animportant determinant of the ability of future generations to adapt tosustainability challenges, as discussed below.
The annual flow of pollution can reduce the environmental carryingcapacity, which also regenerates itself, according to the expression
______________2The Herbert and Leeves Wonderland model also includes a pollution controlexpenditure that can reduce the annual flow of pollution. We have dropped this factorbecause it is superseded by the response of future generations described in the nextsection.

Description of the Wonderland Scenario Generator 153
Ke
e
r,t 1
nK
1–KK F
nK
1–KK F
r, t
r, treff
r, tr
r r, t
r, t
r, treff
r, tr
r r, t
+
Ê
ËÁ
ˆ
¯˜+
Ê
ËÁ
ˆ
¯˜+
=
+
1
1
1
d w
d w
r
r
–
–
(A9)
Whether carrying capacity grows or declines over time depends onwhether the annual flow of pollution exceeds the sustainable levelgiven by F Ksustain,r r
effr,t r
r= d wr / . We assume that the level of sustain-able pollution in one region can be affected by changes in the carry-ing capacity in the other region, so that
d d fr
reff
rr ,t
r ,0
K
K
r
=È
Î
ÍÍ
˘
˚
˙˙
ÏÌÔ
ÓÔ
¸˝Ô
Ô¢
¢
¢
1 13– – , (A10)
where the factor j j3 30 1£ £( ) represents the extent to which adecline in carrying capacity in one region affects the level of sustain-able pollution in the other region.
We limit the carrying capacity to a maximum value of 0.999. If carry-ing capacity becomes too close to 1, the pollution flow can becomewhat appears to be unrealistically brittle, allowing an overly largeovershoot of the sustainable level of pollution and too great a strainon the ability of future generations to respond to changes in the car-rying capacity.
Response of Future Generations
One of the most significant changes we made to the Wonderlandscenario generator was to add a representation of the response offuture generations to sustainability concerns. We assume that futuregenerations will follow the policy set by today’s decisionmakers untilthey detect concrete warning of an imminent sustainability problem.This puts the issue into the form of a two-period, adaptive-decisionproblem that, although crude, should capture the key features wewish to address.
In the Wonderland scenario generator, a region’s carrying capacitygrows to or remains at a high level Kr,t ª( )1 until the annual flow of

154 Shaping the Next One Hundred Years
pollution in that region exceeds the sustainable level, as described inEquation (A9). Once the sustainable flow is exceeded, the carryingcapacity begins a slow-to-start, but rapidly accelerating decline,whose rate depends on the amount by which the annual flowexceeds the sustainable level. We assume that future (and present)decisionmakers are uncertain of the level of this sustainable flow andother key parameters describing the state of their world until theydetect a decrease in their region’s carrying capacity. Once such achange is detected, we assume decisionmakers can act with perfectinformation about these parameters. We assume that the decision-maker can observe changes of DK r
or larger, so that the decision-makers in a region start their second, perfect information decisionperiod in the first time interval when K – Kr,t–1 r,t K r
> D .
We assume future decisionmakers act to maximize the expected,present value of their utility as they look out into the future. We writethe utility of this future decisionmaker at time t as
U t 1– d N WY
YW Kr r r,t+ r
env r,t
N,2000renv
r,t
r
( ) = ( ) ( )ÈÎÍÍ
˘
˚˙˙
+ [ ]ÏÌÔ
ÓÔ
¸˝Ô
Ô+
+=Â t
tt
e
tt
1 1
1
0
50
– –
–
,(A11)
where dr is the discount rate used by decisionmakers in region r, eris their marginal utility of additional income, and Wr
env is the weightthey put on future changes in the environment as opposed to futureincreases in income. Both income and environmental terms arenormalized with respect to present-day conditions in the developedworld.
We assume future decisionmakers can take two actions to maximizetheir utility as expressed by Equation (A11). They can choose aninnovation policy (represented by an annual tax, t t, on the pollutionflow), which, as shown in Equations (A6), (A7), and (A8) and Equa-tion (A2), respectively, reduces the annual flow of pollution at thecost of slowing economic growth. In addition to any choice aboutthe tax, future decisionmakers can also choose to invest in actionsthat will to some extent reduce the effects of environmental declineon economic growth. If such an investment is made at time ¢t , theenvironmental decline parameter in Equation (A2) is given by

Description of the Wonderland Scenario Generator 155
m mr,teff
rdisconnect
t t
rr= ( ) ¢1–
–, (A12)
where rrdisconnect is the rate at which dependence on the environment
is reduced and mr is the rate of decline in the absence of any policyintervention. The cost of such investments, cr
disconnect, can slow eco-nomic growth as shown in Equation (A2).
Every five years, starting in the period they first detect a decline incarrying capacity, future decisionmakers can adjust the tax level orchoose investments that reduce the effect of any collapse of envi-ronmental carrying capacity on subsequent economic growth. How-ever, we assume that such investments are irreversible—that is, oncemade, they cannot be undone. In calculating the utility resultingfrom alternative choices, we assume that the decisionmakers in eachregion assume that the decisionmakers in the other region will con-tinue their then-current policies indefinitely into the future.
UNCERTAINTIES (X)
The exogenous uncertainties are represented by the range of plausi-ble values for the input parameters to Wonderland. The CARscontrol panel for Wonderland lists the following parameter names toprovide values for the factors in Equations (A1–A12):
Economic Parameters
Base_Economic_Growth_Rate_N is the exogenous rate of economicgrowth given by the g N parameter in Equation (A1).
Decoupling_Rate_N is the rate at which technology innovationreduces pollution flow per unit output in the North. It is related tothe innovation rate cN i n E q u a t i o n ( A 7 ) b ycN 1– Decoupling_Rate_N= .
Convergence_Year is the year in which per capita income in theSouth reaches parity with that in the North. It is related to the g Sparameter in Equation (A1) by

156 Shaping the Next One Hundred Years
g gS NConvergence_Year–2000= +( ) ( )1 6 93 1
1
. –,
where 6.93 is the current ratio of income in North and South.
Del_Decouple_Rate_S is the difference in the decoupling rates inNorth and South. It is related to the innovation rate cS in Equation(A7) by c cS N Del_Decoupling_Rate_S= – .
Max_Rate_of_Decline is the maximum rate at which a decline innatural capital can reduce economic growth given by the m parame-ter in Equation (A2). There are separate values for each region.
Flatness_of_Initial_Decline governs the steepness of the initial dropin economic growth, given by the exponent l in Equation (A2).There are separate values for each region.
Cost_to_Speed_Decoupling governs the effect of innovation policies(represented by pollution taxes) on growth, given by the C parameterin Equation (A2). There are separate values for each region.
Inertia governs the time it takes for pollution taxes to achieve theirfull effect on the flow of pollution. The h parameter above is givenby h =1n(50)/ Inertia . Inertia ranges from 0 to 50 years with a nomi-nal value of 20 years. There are separate values for each region.
Econ_link governs the extent to which economic changes in oneregion affect the other, given by the j1 parameter in Equation (A1).
Tech_link governs the extent to which innovation rate changes inone region affect the other, given by the j2 parameter in Equation(A7).
Population Parameters
Poor_Deathrate is the population’s death rate at small output percapita.
Rich_Deathrate is the population’s death rate at high output percapita.

Description of the Wonderland Scenario Generator 157
Income_for_Rich_Deathrate is the output needed to yield theRich_Deathrate.
The Wonderland parameters in Equation (A5) are related to theseparameters by the following:
a =È
ÎÍ
˘
˚˙1
1 0101
n Income_for_Rich_Deathrate–..
a0 2= ( )Poor_Deathrate – Rich_Deathrate
a a10
2= ( )Poor_Deathrate – Rich_Deathrate
.
Max_Deathrate_Increase is the maximum increase in death rate dueto a decline in natural capital, given by the a2 parameter in Equation(A5).
Flatness_of_Increase governs the steepness of the initial increase indeath rate as natural capital first begins to decline, given by the qexponent in Equation (A5).
Poor_Birthrate is the birthrate at zero output per capita.
Rich_Birthrate is the birthrate at high output per capita.
Income_for_Rich_Birthrate is the output needed to yield theRich_Birthrate.
The Wonderland parameters in Equation (A4) are related to theseparameters by the following:
b =È
ÎÍ
˘
˚˙1
1 0101
n Income_for_Rich_Birthrate–..
b0 2= ( )Poor_Birthrate – Rich_Birthrate
b a10
2= ( )Poor_Birthrate – Rich_Birthrate
.
158 Shaping the Next One Hundred Years
Environment Parameters
Sustainable_Pollution is the sustainable level of pollution, Fsustain .There are separate values for each region.
Rate_of_Drop is the rate at which natural capital falls when pollutionflows are above the sustainable level. Specifically, it is the rate ofdecline when natural capital is equal to 0.99 and the pollution flow is10 percent above Fsustain . There are separate values for each region.
Change_in_F_Sustain is the change in Fsustain when natural capital iscut in half. When it is less than one, Fsustain drops with decliningnatural capital. When it is greater than one, Fsustain increases withdeclining natural capital. There are separate values for each region.
The Wonderland parameters in Equation (A9) are related to theseparameters by the following:
r = ( )( )
1n Change_in_F_Sustain
1n 0.5
d = [ ]12 1
1 99.
n Rate_of_Drop
w d=Sustainable_Pollution
.
Env_link governs the extent to which environmental changes in oneregion affect the other, given by the j3 parameter in Equation (A10).
Future Response
Future_Action specifies the type of future response in region r. It canspecify no future response (No Response), a future response basedon innovation policies that increase decoupling rates only (Decou-pling), and a future response that can employ both decoupling aswell as investments that reduce any effects of environmentaldegradation on economic growth (Decouple+Adapt). There are sep-arate values for each region.

Description of the Wonderland Scenario Generator 159
Detect_Capital_Change, DK , is the minimum decline in naturalcapital detectable by the adaptive decision strategy. There are sepa-rate values for each region.
Future_discount, d, is the discount rate used by future decision-makers in calculating the utility they will get from alternative poli-cies. There are separate values for each region.
Income_utility, e , is the marginal utility future decisionmakers getfrom an increase in output per capital. There are separate values foreach region.
Weight_env, W env , is the weight future decisionmakers place onenvironmental change as opposed to income increases. There areseparate values for each region.
Table A.1 lists the range of values we used for each of these parame-ters in this study. For each parameter the table lists the nominalvalue used for all the visualizations in this study, except where oth-erwise specified. The table also lists the low and high values used toconstrain the searches and the experimental designs used for thesensitivity analyses. For some parameters, these high, low, andnominal values were chosen based on available data. For instance,the discussion surrounding Figure 5.1 provides our estimates ofplausible ranges for the economic growth and decoupling rateparameters. Where data was not readily available, it was sufficientfor the purposes of this demonstration exercise to take nominal val-ues from Herbert and Leeves (1998) and arbitrarily choose high andlow values to define the parameter ranges.
MEASURING OUTCOMES (M)
In this report we also added to the original Wonderland model mea-sures to compare the desirability of alternative long-term futures.3
The first is a Quasi-HDI measure, a weighted, discounted average ofthe annual improvement in four factors: net output per capita (that
______________3These measures are actually described in the Wonderland “run method,” the com-puter code that connects the simulation to the CARs software environment.

160 Shaping the Next One Hundred Years
Table A.1
Uncertain Parameters in Wonderland Scenario Generator
Parameter North SouthEconomyBase_Economic_Growth_Rate_N 0%, 1.5%, 4% NADecoupling_Rate_N –1%, 1.5%, 5% NAConvergence_Year NA 2050, 2140, 2400Del_Decouple_Rate_S NA –3%, 1%, 3%Max_Rate_of_Decline 0%, 3%, 16% 0%, 3%, 16%Flatness_of_Initial_Decline 0, 2, 4 0, 2, 4Cost_to_Speed_Decoupling 0, 0.001, 0.01 0, 0.001, 0.01Inertia 5, 30, 50 years 5, 30, 50 yearsEcon_link 0, 0.5, 1 NATech_link 0, 0.5, 1 NAPopulationPoor_Deathrate 15, 20, 25 NARich_Deathrate 5, 15, 30 NAIncome_for_Rich_Deathrate $5, $10, $50 NAMax_Deathrate_Increase 0, 1, 10 NAFlatness_of_Increase 0, 15, 100 NAPoor_Birthrate 30, 35, 40 NARich_Birthrate 5, 15, 20 NAIncome_for_Rich_Birthrate $10, $40, $100 NAEnvironmentSustainable_Pollution 0, 2, 10 0, 2, 10Rate_of_Drop 0, 0.005, .01 0, 0.0005, 01Change_in_F_Sustain 0.5, 0.871, 1.3 0.5, 0.871, 1.3Env_link 0, 0, 1 NAFuture DecisionmakersFuture_Action No Response,
Decouple,Decouple+Adapt
No Response,Decouple,
Decouple+AdaptDetect_Capital_Change 0%, 1%, 10% 0%, 1%, 10%Future_discount 0%, 2%, 10% 0%, 2%, 10%Income_utility 0, 0, 1 0, 0, 1Weight_environment 0, 0, 1 0, 0, 1Disconnect_cost 0, 0.2, 10 0, 0.2, 10Disconnect_rate 0, 0.1, 0.2 0, 0.1, 0.2
NOTE: Triplets of numbers show low, nominal, and high parameter values. (ForFuture_Action, the nominal value is Decouple+Adapt.)
is, output minus environmental control costs), death rates, theannual flow of pollution, and the carrying capacity. The second is a“Worst Decade” measure, a weighted average of the worst 10-year

Description of the Wonderland Scenario Generator 161
decrease in the net output per capita, death rate, and pollution flowtime series. Each measure is a weighted average of each time seriesin each region.
The Quasi-HDI measure is given by
Quasi-HDI
W 1– d Index 1– W 1– d IndexNt
N,t Nt
S,tt
Last_Year
t
Last_Year
t
t t
=
( ) + ( ) ( )+ +==ÂÂ
00
, (A13)
where the index for each region is given by
Index
WY
Y1 W
D
D1 W
F
F1 W
K
K1
r
1r,t
r,t–12
r,t–1
r,t3
r,t–1
r,t4
r,t
r,t
=
-Ê
ËÁˆ
¯+ -
Ê
ËÁˆ
¯+ -
Ê
ËÁˆ
¯+ -
Ê
ËÁˆ
¯
. (A14)
The first term is proportional to changes in income per capita. Thesecond, death rate term is a proxy for lifespan in the actual HDI mea-sure. The two pollution terms allow an environmental component,which can depend on the annual flow of pollution or the state of thecarrying capacity. The Worst Decade measure uses the same com-ponents as the Quasi-HDI measure and is given by
Crash W Index 1– W Indext N N,t N S,t= + ( ) , (A15)
where the index for each region is given by
Index
W MinY
Y–1 W Min
D
D–1
W MinF
F–1 W
r,t
1t T Last_Year
r,T
r,T–10
110
2t T Last_Year
r,T
r,T–10
110
3t T Last_Year
r,T–10
r,T
110
4
=
Ê
ËÁˆ
¯
È
Î
ÍÍÍ
˘
˚
˙˙˙+
Ê
ËÁˆ
¯
È
Î
ÍÍÍ
˘
˚
˙˙˙
+Ê
ËÁˆ
¯
È
Î
ÍÍÍ
˘
˚
˙˙˙+
< < < <
< <MinMin
K
K–1
t T Last_Year
r,T
r,T–10
110
< <
Ê
ËÁˆ
¯
È
Î
ÍÍÍ
˘
˚
˙˙˙
.(A16)
162 Shaping the Next One Hundred Years
The CARs control panel for the Wonderland Scenario generator liststhe following parameter names to provide input to Equations (A13–A16):
Measure specifies the choice of output measure, either Quasi-HDI orCrash.
Vantage is the year from which the measures are assessed. It cantake values of “Today,” “Milestone Year,” “Year Adaptive Begins,”2025, and 2050.
Weight_North is the weight WN placed on the North as opposed toSouth outputs.
Weight_Output is the weight W1 on the output per capita term.
Weight_LifeSpan is the weight W2 on the death rate term.
Weight_Env is the weight W3 on the pollution term.
Weight_Capacity is the weight W4 on the carrying capacity term.
Discount_Rate is the discount rate d used in the HDI-like measure.
Last_Year is the last year considered by the HDI-like and crash mea-sures.
In this study, we used the Quasi-HDI measure to describe four differ-ent value systems—North Quasi-HDI, World Quasi-HDI, NorthGreen-HDI, World Green-HDI—that roughly characterize the valuesof the diverse participants in the sustainability debate. Table A.2shows the parameters used to describe each of the value systems.

Description of the Wonderland Scenario Generator 163
Table A.2
Parameter Values Defining Four Measures Used in This Report
North Quasi-HDI
World Quasi-HDI
North Green-HDI
World Green-HDI
Measure Quasi-HDI Quasi-HDI Quasi-HDI Quasi-HDI
Last_Year 100 100 100 100Vantage Today Today Today TodayWeight_North 1.0 0.2 1.0 0.2Weight_Output 1.0 1.0 1.0 1.0Weight_LifeSpan 1.0 1.0 1.0 1.0Weight_Env 0.0 0.0 0.0 0.0Weight_Capacity 0.0 0.0 1.0 1.0Discount_Rate 2% 2% 2% 2%


165
Appendix B
ASSESSING ROBUST STRATEGIES
This appendix provides more details on the assessment of robuststrategies presented in Chapter Five.
REPRODUCING THE GSG SCENARIOS
The “Overview” section of Chapter Five reproduces the three GlobalScenario Group (GSG) scenarios using the Wonderland scenariogenerator. Table B.1 lists the input parameter values that generatethe time trajectories shown in Figure 5.2. The table divides theparameters into four categories: economy, population, environ-ment, and the response of future decisionmakers. We chose the val-ues used here through manual experimentation, starting with thenominal parameters values presented in Appendix A and making theminimal changes needed to reproduce as best as possible the eco-nomic and population trajectories shown in Figure 2.1. There is noclaim that these are a unique set of parameters that reproduce theGSG scenarios.
The italicized entries in the table show parameters that differ amongthe three scenarios. In particular, Conventional World and Bar-barization have faster overall economic growth rates, but the Southreaches economic parity with the North 40 years earlier in GreatTransitions. The exogenous decoupling rates in Barbarization areslower than in the other two futures. The rates at which an environ-mental collapse drags down the economy, Max_Rate_of_Decline, ishigher in Barbarization than in the other two cases.

166 Shaping the Next One Hundred Years
Table B.1
Parameters Describing GSG Scenarios with WonderlandScenario Generator
ConventionalWorld Barbarization
GreatTransition
Economy Base_Economic_Growth_Rate_N 1.80% 1.80% 1.20%
Decoupling_Rate_N 1.50% 1.10% 1.50%
Max_Rate_of_Decline_N 3% 4% 3%
Flatness_of_Initial_Decline_N 2 2 2
Cost_to_Speed_Decoupling_N 0.001 0.001 0.001
Inertia_N 30 30 30
Convergence_Year 2140 2140 2100
Del_Decouple_Rate_S 1% 1% 1%
Max_Rate_of_Decline_S 3% 4% 3%
Flatness_of_Initial_Decline_S 2 2 2
Cost_to_Speed_Decoupling_S 0.001 0.001 0.001
Inertia_S 30 30 30
econ_link 50% 50% 50%
tech_link 50% 50% 50%
Population
Poor_Deathrate 20 20 20
Rich_Deathrate 15 15 10
Income_for_Rich_Deathrate 10 10 10
Max_Deathrate_Increase 1 1 1
Flatness_of_Increase 15 15 15
Poor_Birthrate 35 35 35
Rich_Birthrate 15 15 10
Income_for_Rich_Birthrate 40 40 17
Environment
Sustainable_Pollution_N 2.00 1.25 2.00
Drop_Rate_N 0.0005 0.0005 0.0005
Change_in_F_Sustain_N 0.871 0.871 0.871
Sustainable_Pollution_S 2.00 1.50 2.00
Drop_Rate_S 0.0005 0.0005 0.0005
Change_in_F_Sustain_S 0.871 0.871 0.871
env_link 0% 50% 0%
Future_Response

Assessing Robust Strategies 167
Table B.1—continued
ConventionalWorld Barbarization
GreatTransition
Future_Action_N Decouple+Adapt
Decouple+Adapt
Decouple+Adapt
Detect_Capital_Change_N 1.0% 10.0% 1.0%Future_Discount_N 2.0% 10.0% 2.0%
Income_Utility_N 0 0 0.9
Weight_Env_N 0 0 0.5
Adaptation_Cost_N 0.20 1.00 0.20
Adaptation_Rate_N 0.10 0.02 0.10
Future_Action_S Decouple+Adapt
Decouple+Adapt
Decouple+Adapt
Detect_Capital_Change_S 1.0% 10.0% 0.1%
Future_Discount_S 2.0% 10.0% 2.0%
Income_Utility_S 0 0 0.9
Weight_Env_S 0 0 0.5
Adaptation_Cost_S 0.20 1.00 0.20
Adaptation_Rate_S 0.10 0.02 0.10
NOTE: Italicized lines indicate parameters that differ among scenarios.
The population parameters in Great Transitions differ from the othertwo scenarios, showing lower birth and death rates in richer soci-eties, and a lower level of wealth needed before the transition tothese lower rates.
The environment is more fragile in Barbarization, with lower levels ofsustainable pollution in the North and South and stronger couplingbetween the carrying capacity in the two regions.
The values and capabilities of future decisionmakers also differstrongly among the three cases. In Conventional World and GreatTransitions, decisionmakers in both North and South have good abil-ity to detect environmental damage and have sufficiently low dis-count rates that they react to information about oncoming problems.In contrast, future decisionmakers in Barbarization have littledetection capability and heavily discount the future. They thus havelittle ability or inclination to respond to any sustainability challengesthat confront them. Future decisionmakers in Great Transitions holddifferent values, described by utility functions which more heavilyweight the environment as per-capita income grows compared to

168 Shaping the Next One Hundred Years
decisionmakers in the other two cases. Finally, decisionmakers inConventional World and Great Transitions have an option of adapt-ing to deleterious environmental changes that is not available todecisionmakers in Barbarization.
FIXED NEAR-TERM STRATEGIES
The Wonderland scenario generator provides today’s decision-makers one basic action they can take to influence the developmentof the economy, environment, population, and ultimately thesituation in which future decisionmakers find themselves. Today’sdecisionmakers can set an annual tax,t t, on the pollution flow. Therobust decision approach in Chapter Five describes a variety of waysin which today’s decisionmakers can prescribe the evolution of thesetax rates, one in the North and one in the South, over time in theirattempt to ensure long-term sustainability.
The section “Landscapes of Plausible Futures” in Chapter Fiveassesses the most basic type strategy, one that specifies today theprecise path each tax rate will take into the future. We call thesestrategies “fixed” because they seek to encourage some specificimprovement in the exogenous decoupling rate. We consider 16such fixed strategies across the three GSG scenarios and a wide rangeof other plausible futures. These strategies differ in their near-termprescribed pollution tax policy. The annual pollution tax tr,t asshown in Equation (A8) in each region from the present (2002)through the time Tinit,r is given by
t tr,t init,rinit,r
tT
= ––
20022002 , (B1)
where decisionmakers choose today the Initial_Tax, t init,r , the maxi-mum pollution tax and the Tax_Date, Tinit,r , the date that the pollu-tion tax reaches its maximum level. After Tinit,r the tax in eachregion stays constant at the value t init,r , until and if future decision-makers decide to adopt a different policy. The values of the initial taxand period when it goes fully into effect are listed in Table B.2. Inparticular, Figures 5.2 and 5.3 show the effects, respectively, of theStay the Course and Slight Increase strategies on the three GSG sce-narios.

Assessing Robust Strategies 169
Table B.2
Fixed Near-Term Strategies
Innovation Policies t init,N t init,S Tinit,N Tinit,S
Stay the Course 0% 0% 2010 2010NS01 0% 1% 2010 2010NS02 0% 2% 2010 2010NS04 0% 4% 2010 2010NS10 1% 0% 2010 2010
Slight Increase 1% 1% 2010 2010NS12 1% 2% 2010 2010NS14 1% 4% 2010 2010NS20 2% 0% 2010 2010NS21 2% 1% 2010 2010NS22 2% 2% 2010 2010
Crash Effort 2% 4% 2010 2010NS40 4% 0% 2010 2010NS41 4% 1% 2010 2010NS42 4% 2% 2010 2010NS44 4% 4% 2010 2010
FINDING WORST CASES FOR THE NO INCREASEMILESTONE STRATEGY
After finding that none of the fixed strategies in Table B.1 are robust,Chapter Five next explored a class of strategies that set a near-termgoal and then adjusted policies adaptively over time to reach thegoal. The annual pollution tax in each region from the presentthrough the time Tinit,r is given by
t h cr,t
r
rT
rinit,r
r
r
init,r
tT
if
0 if
= ( )ÈÎÍ
˘˚( )
<
Ï
ÌÔÔ
ÓÔÔ
D D
D
1 1 1
20022002
0
0
2000– – –
–––
, (B2)
where Dr N Decoupling_Rate_N_Goal= g – and DS S= g – Decou-pling_ Rate_N – Del_Decouple_Rate_S_Goals. When used in Equa-tions (A7) and (A8), tr,t produces a decoupling rate at the desiredgoal by the desired time. Today’s decisionmakers choose the goalsand the date the goals will be met. The annual tax then adjusts itself

170 Shaping the Next One Hundred Years
based on the revealed values of economic growth, exogenousdecoupling rates, and inertia. After Tinit,r the tax stays constant at itsTinit,r value until decisionmakers decide to adopt a different policy.
Table B.3 shows the parameters that define these 16 milestonestrategies. Note that in contrast to the fixed strategies, a smallernumber here indicates a more aggressive strategy because it indi-cates a smaller allowed deviation between the rate of decoupling andeconomic growth—that is, the expression in the parenthesis in thenumerator of Equation (B1).
“Exploring Near-Term Milestones” in Chapter Five explored therobustness of the No Increase milestone strategy. In particular, weconducted a computer search to find the future with the largestregret for this strategy. A vast literature on global optimization andmany algorithms are available to help find such extreme cases. Inthis study, it was sufficient to conduct a relatively crude but simpleprocedure. First, a “downhill” search was launched at each of 500randomly chosen starting points in the ensemble of plausiblefutures. The intermediate steps in each downhill search were kept,rather than discarded, which yielded 1,502 futures. Next, those runs
Table B.3
Milestone Strategies Considered in This Report
Goal Strategies Goal_N Goal_S Tinit,N Tinit,S
No Increase 0% 0% 2010 2010M01 0% 1% 2010 2010M02 0% 2% 2010 2010M04 0% none 2010 2010M10 1% 0% 2010 2010M11 1% 1% 2010 2010M12 1% 2% 2010 2010M14 1% none 2010 2010M20 2% 0% 2010 2010M21 2% 1% 2010 2010M22 2% 2% 2010 2010M24 2% none 2010 2010M40 none 0% 2010 2010M41 none 1% 2010 2010M42 none 2% 2010 2010
Stay the Course none none 2010 2010

Assessing Robust Strategies 171
whose input parameters produced what we regarded as implausibledemographic futures were eliminated. We defined implausiblepopulation trajectories as a 2050 population less than 700 million orgreater than 1.5 billion in the North and less than 7 billion or greaterthan 15 billion in the South. A total of 665 of the original cases metthis criteria. Finally, the case with the largest No Increase regret,using any of the four value systems defined in Table A.2, was chosenfrom these remaining 665 futures. Table B.4 shows the resultingworst-case future for the No Increase strategy. This worst caseoccurs for the World Green-HDI value system.
Table B.4
Parameters Describing No Increase and Safety Valve Worst Cases
No Increase WorstCase
Safety Valve WorstCase
Economy Base_Economic_Growth_Rate_N 4.0% 3.9%
Decouple_Rate_N –0.7% 1.9%
Max_Rate_of_Decline_N 0.063 0.068
Flatness_of_Initial_Decline_N 0.266 1.134
Cost_to_Speed_Decoupling_N 0.00012 0.005
Inertia_N 42.9 14.8
Convergence_Year 2059 2087
Del_Decouple_Rate_S 2.4% –2.9%
Max_Rate_of_Decline_S 0.011 0.142
Flatness_of_Initial_Decline_S 3.876 3.938
Cost_to_Speed_Decoupling_S 0.007 0.008
Inertia_S 49.5 8.3
econ_link 99.0% 16.1%
tech_link 92.8% 67.2%
Population
Poor_Deathrate 17.14 17.435
Rich_Deathrate 20.363 23.29
Income_for_Rich_Deathrate 23.117 42.607
Max_Deathrate_Increase 1.859 9.369
Flatness_of_Increase 81.294 13.933
Poor_Birthrate 38.942 35.074
Rich_Birthrate 17.089 8.3
Income_for_Rich_Birthrate 24.939 90.94

172 Shaping the Next One Hundred Years
Table B.4—continued
No Increase WorstCase
Safety Valve WorstCase
EnvironmentSustainable_Pollution_N 7.54 9.52
Drop_Rate_N 0.001 0.004
Change_in_F_Sustain_N 1.02 0.57
Sustainable_Pollution_S 8.49 6.13
Drop_Rate_S 0.004 0.006
Change_in_F_Sustain_S 0.95 1.15
env_link 12% 97%
Future_Response
Future_Action_N Decouple+Adapt Decouple+Adapt
Detect_Capital_Change_N 9.4% 3.2%
Future_Discount_N 1.6% 9.1%
Income_Utility_N 0.71 0.36
Weight_Env_N 0.51 0.30
Adaptation_Cost_N 4.73 4.91
Adaptation_Rate_N 0.19 0.07
Future_Action_S Decouple+Adapt Decouple+Adapt
Detect_Capital_Change_S 5.1% 4.3%
Future_Discount_S 4.6% 5.5%
Income_Utility_S 0.34 0.56
Weight_Env_S 0.08 0.90
Adaptation_Cost_S 9.59 4.80
Adaptation_Rate_S 0.12 0.01
NOTE: Italics indicate parameters identified as most important by sensitivityanalysis.
The italicized entries in Table B.4 correspond to the parametersfound to be most important in the sensitivity analysis described in“Improving Long-Term Decisionmaking” in Chapter Six. In particu-lar, economic growth rates, the exogenous decoupling rate, thestrength of linkages between the Northern and Southern economies,and the cost of policies to speed decoupling in the South are impor-tant to the regret of the No Increase strategy and are exceptionallyhigh compared to their nominal values in this strategies’ worst case.The Southern environment in this worst case is also highly sensitivecompared to the nominal cases. Combined with Figure 5.10, thisinformation suggests that the No Increase strategy fares poorly in

Assessing Robust Strategies 173
those futures where exogenous rates of economic growth anddecoupling, combined with the high costs of speeding decoupling,make it difficult to reach the milestone.
FINDING WORST CASES FOR THE SAFETY VALVESTRATEGY
After finding significant breaking scenarios for the No Increase strat-egy in Table B.3, Chapter Five next explores the performance of aSafety Valve strategy, which sets a near-term goal and a cost thresh-old and then adjusts policies to reach that goal to the extent possiblewithout exceeding the cost threshold. Under Safety Valve, theannual pollution tax in each region from the present through thetime Tinit,r is given by
)t
t t
et
r,t
r,teff
r r,teff
r
rr r,t
effr
if C Limit
Limit if C Limit
=
[ ] £
[ ] >
Ï
Ì
ÔÔÔ
Ó
ÔÔÔ
2
2
, (B3)
where
t h cr,teff
r
rT
rinit,r
r
r
init,r
tT
if
if
= ( )ÈÎÍ
˘˚*( )
<
Ï
ÌÔÔ
ÓÔÔ
D D
D
1 1 1
20022002
0
0 0
2002– – –
–––
(B4)
Today’s decisionmakers choose the near-term goals, Goalr , the datethey will be met, Tinit,r , and the cost limit, Limitr . The annual taxthen adjusts itself to meet the prescribed goal at the appointed timegiven the revealed values of economic growth, exogenous decou-pling, and inertia, unless the costs required in any year exceed thecost threshold, in which case the tax is constrained by the cost target.As with the other strategies, the tax stays constant after Tinit,r untilfuture decisionmakers decide to adopt a different policy.
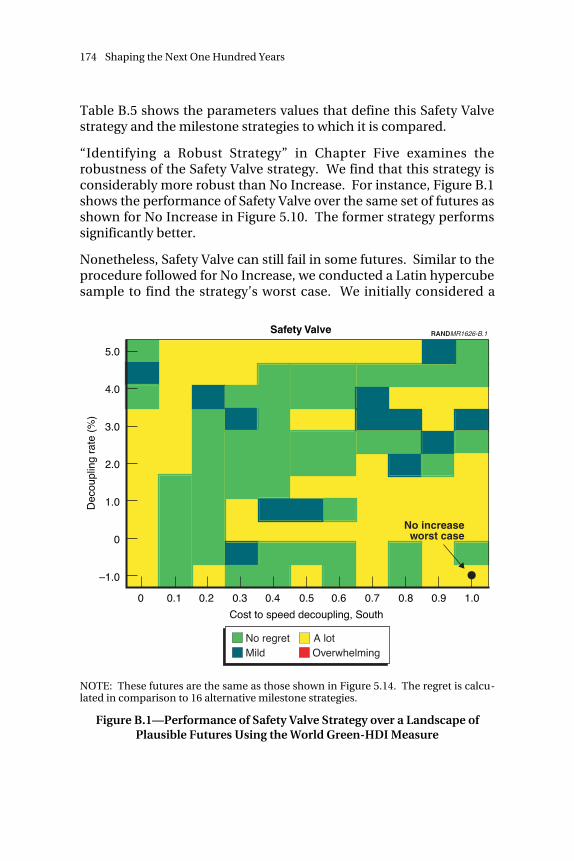
174 Shaping the Next One Hundred Years
Table B.5 shows the parameters values that define this Safety Valvestrategy and the milestone strategies to which it is compared.
“Identifying a Robust Strategy” in Chapter Five examines therobustness of the Safety Valve strategy. We find that this strategy isconsiderably more robust than No Increase. For instance, Figure B.1shows the performance of Safety Valve over the same set of futures asshown for No Increase in Figure 5.10. The former strategy performssignificantly better.
Nonetheless, Safety Valve can still fail in some futures. Similar to theprocedure followed for No Increase, we conducted a Latin hypercubesample to find the strategy’s worst case. We initially considered a
RANDMR1626-B.1
Dec
oupl
ing
rate
(%
)
–1.0
1.0
5.0
3.0
4.0
2.0
0
Cost to speed decoupling, South
Safety Valve
0.1 0.2 0.3 0.40 0.5 0.6 0.7 0.8 0.9 1.0
No increaseworst case
No regret A lotMild Overwhelming
NOTE: These futures are the same as those shown in Figure 5.14. The regret is calcu-lated in comparison to 16 alternative milestone strategies.
Figure B.1—Performance of Safety Valve Strategy over a Landscape ofPlausible Futures Using the World Green-HDI Measure

Assessing Robust Strategies 175
Table B.5
Safety Value Strategy and Milestone Strategies to Which It Is Compared
Safety Valve andGoals Strategies Goal_N Goal_S LimitN LimitS Tinit,N Tinit,S
Safety Valve 0% 0% 0.01 0.01 2010 2010No Increase 0% 0% none none 2010 2010
M01 0% 1% none none 2010 2010M02 0% 2% none none 2010 2010M04 0% none none none 2010 2010M10 1% 0% none none 2010 2010M11 1% 1% none none 2010 2010
Best Alternative 1% 2% none none 2010 2010M14 1% none none none 2010 2010M20 2% 0% none none 2010 2010M21 2% 1% none none 2010 2010M22 2% 2% none none 2010 2010M24 2% none none none 2010 2010M40 none 0% none none 2010 2010M41 none 1% none none 2010 2010M42 none 2% none none 2010 2010
Stay the Course none none none none 2010 2010
sample of 5,000 cases, which yielded 2,278 cases consistent with ourconstraints on the range of plausible population levels in 2050. Thecase that produced the highest regret for Safety Valve is shown inTable B.4. As with No Increase, this largest regret occurs for theWorld Green-HDI measure.
Figure 6.2 showed the results of the global sensitivity analysis forSafety Valve’s regret. The most important input parameters are ital-icized in Table B.4. In contrast to No Increase, Safety Valve was rela-tively less sensitive to economic uncertainties and relatively moresensitive to the extent of the Southern sustainability challenge andthe capabilities of future decisionmakers. We used these results toguide our choice of axes for the visualization in Figure 5.14.
It is also useful to examine the best performing strategy in thosecases where Safety Valve fails. Figure B.2 shows the best strategyover the same set of futures shown in Figure 5.14. Note that in thosefutures where Safety Valve does worst the optimal response is gen-erally Stay the Course or a similar strategy.
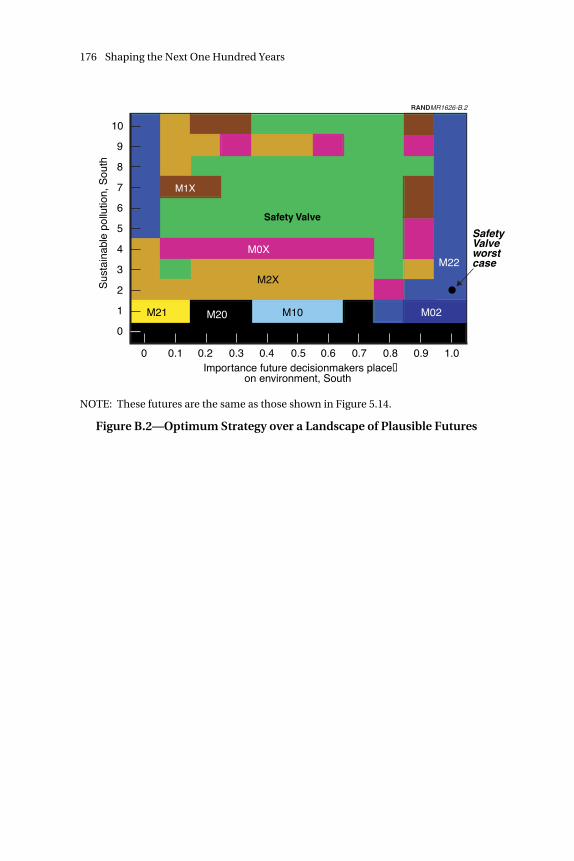
176 Shaping the Next One Hundred Years
RANDMR1626-B.2S
usta
inab
le p
ollu
tion,
Sou
th
Importance future decisionmakers place�on environment, South
Safety Valve
SafetyValveworstcase
0.1 0.2 0.3 0.40 0.5 0.6 0.7 0.8 0.9 1.0
0
1
3
4
2
5
6
10
9
8
7
M2X
M1X
M0X
M21 M10M20
M22
M02
NOTE: These futures are the same as those shown in Figure 5.14.
Figure B.2—Optimum Strategy over a Landscape of Plausible Futures

177
BIBLIOGRAPHY
Aldis, Brian W., Trillion Year Spree, New York: Atheneum, 1986.
Allison, Graham, and Philip Zelikow, Essence of Decision: Explainingthe Cuban Missile Crisis, second edition, Boston: Addison-Wesley,1999.
Alkon, Paul K., Origins of Futuristic Fiction, Athens, Ga.: Universityof Georgia Press, 1987.
Azar, Christian, John Holmberg, and Sten Karlsson, Decoupling—Past Trends and Prospects for the Future, Stockholm, Sweden:Environmental Advisory Council, Ministry of the Environment,2002.
Bain, David H., Empire Express: Building the First TranscontinentalRailroad, New York: Penguin Books, 1999.
Bankes, Steven C., “Exploratory Modeling for Policy Analysis,”Operations Research, Vol. 41, No. 3, 1993, pp. 435–449.
_____, “Agent-Based Modeling: A Revolution?” Proceedings of theNational Academy of Sciences, Vol. 99, Supplement 3, 2002a, pp.7199–7200.
_____, “Tools and Techniques for Developing Policies for Complexand Uncertain Systems,” Proceedings of the National Academy ofSciences, Vol. 99, Supplement 3, 2002b, pp. 7263–7266.
Bankes, Steven C., and James Gillogly, “Validation of ExploratoryModeling,” in Adrian Tentner, ed., High Performance Computing:

178 Shaping the Next One Hundred Years
Grand Challenges in Computer Simulation, San Diego, Calif.: TheSociety for Computer Simulation, 1994a.
_____, Exploratory Modeling: Search Through Spaces of Computa-tional Experiments, Third Annual Conference on EvolutionaryProgramming, World Scientific, 1994b.
Bankes, Steven C., Robert J. Lempert, and Steven W. Popper,“Computer-Assisted Reasoning,” Computing in Science andEngineering, 2001, pp. 71–77.
Bankes, Steven C., Steven W. Popper, and Robert J. Lempert,Incorporating Adversarial Reasoning in COAA Planning, Topanga,Calif.: Evolving Logic, 2000.
Ben-Haim, Yakov, Information-Gap Decision Theory: DecisionsUnder Severe Uncertainty, Burlington, Mass.: Academic Press,2001.
Benkard, C. Lanier, Learning and Forgetting: The Dynamics ofAircraft, Stanford, Calif.: Stanford Graduate School of Business,1999.
Berger, James O., Statistical Decision Theory and Bayesian Analysis,New York: Springer-Verlag, 1985.
Brecke, Peter, “Integrated Global Models that Run on Personal Com-puters,” Simulation, Vol. 60, No. 2, 1993.
Breiman, L., “Bagging Predictors,” Machine Learning, Vol. 26, No. 2,1996, pp. 123–140.
Brooks, Arthur, Steven Bankes, and Bart Bennett, “An Application ofExploratory Analysis: The Weapon Mix Problem,” Military Opera-tions Research, Vol. 4, No. 1, 1999.
Carley, Kathleen, “Computational Organizational Science: A NewFrontier,” Proceedings of the National Academy of Sciences, Vol. 99,supplement 3, 2002, pp. 7257–7262.
Cederman, Lars-Erik, Emergent Actors in World Politics: How Statesand Nations Develop and Dissolve, Princeton, N.J.: Princeton Uni-versity Press, 1997.
Bibliography 179
Chamberlin, Thomas C, “The Method of Multiple Working Hypothe-ses,” Science, 1890.
Cole, H. S. D., Christopher Freeman, Marie Jahoda, and K. L. Pavitt,eds., Models of Doom: A Critique of the Limits to Growth, NewYork: Universe Books, 1973.
Cropper, Mauren, and David Laibson, The Implications of HyperbolicDiscounting for Project Evaluation, World Bank DevelopmentResearch Group, 1998.
Dalkey, N. C., and O. Helmer-Hirschberg, An Experimental Applica-tion of the Delphi Method to the Use of Experts, Santa Monica,Calif.: RAND, RM-727-PR, 1962.
Davis, Paul K., “Exploratory Analysis and Implications for Modeling,”in Stuart E. Johnson et al., New Challenges, New Tools for DefenseDecisionmaking, Santa Monica, Calif.: RAND, MR-1576-RC, 2003,pp. 255–283.
Davis, Steven, The Diffusion of Process Innovations, Cambridge, UK:The Cambridge University Press, 1979.
Dawes, Robyn M., Rational Choice in an Uncertain World, Orlando,Fla.: Harcourt Brace College Publishers, 1998.
DeCanio, Steve J., Catherine Dibble, and Keyvan Amir-Atefi, “TheImportance of Organizational Structure for the Adoption of Inno-vations,” Management Science, Vol. 46, No. 10, 2000, pp. 1285–1299.
_____, “Organizational Structure and the Behavior of Firms: Implica-tions for Integrated Assessment,” Climate Change, Vol. 48, 2001,pp. 487–514.
Dewar, James A., The Information Age and the Printing Press:Looking Backward to See Ahead, Santa Monica, Calif.: RAND, P-8014, 1998.
_____, Assumption-Based Planning: A Tool for Reducing AvoidableSurprises, Cambridge, UK: Cambridge University Press, 2001.

180 Shaping the Next One Hundred Years
Dewar, James A., Steven C. Bankes, Sean J. A. Edwards, and James C.Wendt, Expandability of the 21st Century Army, Santa Monica,Calif.: RAND, MR-1190-A, 2000.
Dewar, James A., Steven C. Bankes, James S. Hodges, Thomas W.Lucas, Desmond K. Saunders-Newton, and Patrick Vye, CredibleUses of the Distributed Interactive Simulation (DIS) Environment,Santa Monica, Calif.: RAND, MR-607-A, 1996.
Dewar, James A., Carl H. Builder, William M. Hix, and Morlie H.Levin, Assumption-Based Planning: A Tool for Very UncertainTimes, Santa Monica, Calif.: RAND, MR-114-A, 1993.
de Cooman, G., T. L. Fine, and T. Seidenfeld, Proceedings of the Sec-ond International Symposium on Imprecise Probabilities and TheirApplications, The Netherlands: Shaker Publishing, 2001.
Easterbrook, Gregg, A Moment on the Earth: The Coming of Age ofEnvironmental Optimism, Viking Press, 1995.
Ellsberg, Daniel, “Risk, Ambiguity, and the Savage Axioms,” QuarterlyJournal of Economics, Vol. 75, 1961, pp. 644–661.
Epstein, Joshua, and Robert L. Axtell, Growing Artificial Societies:Social Science from the Bottom Up, Cambridge, Mass.: MIT Press,1996.
Fonkych, Kateryna, Modeling for Long-Term Policy Analysis: TheCase of World3 Model, RAND Graduate School: 15, 2001.
Forrester, Jay W., “Learning Through System Dynamics as Prepara-tion for the 21st Century, Systems Thinking and Dynamic Model-ing for K–12 Education,” Concord Academy, 1994.
Gallopin, Gilberto, Al Hammond, Paul Raskin, and Rob Swart,Branch Points: Global Scenarios and Human Choice, Stockholm,Sweden: Stockholm Environmental Institute, 1997.
Gigerenzer, G., and P. M. Todd, Simple Heuristics That Make UsSmart, New York: Oxford University Press, 1999.
Gordon, T. J., and Olaf Helmer, Report on a Long-Range ForecastingStudy, Santa Monica, Calif.: RAND, P-2982, 1964.

Bibliography 181
Gupta, S. K., and J. Rosenhead, “Robustness in Sequential Invest-ment Decisions,” Management Science, Vol. 15, No. 2, 1972 pp. 18–29.
Haeckel, S., and Adrian Slywotzky, Adaptive Enterprise: Creating andLeading Sense-and-Respond Organizations, Harvard BusinessSchool, 1999.
Hammitt, J. K., R. J. Lempert, and M. E. Schlesinger, “A Sequential-Decision Strategy for Abating Climate Change,” Nature, Vol. 357,1992, pp. 315–318.
Herbert, Ric. D., and Gareth D. Leeves, “Troubles in Wonderland,”Complexity International, Vol. 6, 1998.
Hodges, J., “Six (or so) Things You Can Do with a Bad Model,” Opera-tions Research, Vol. 39, 1991, pp. 355–365.
Holmes, Stephen, Passions and Constraints: On the Theory of LiberalDemocracy, Chicago: University of Chicago Press, 1995.
Hughes, Barry B., International Futures: Choices in the Face of Uncer-tainty (Dilemmas in World Politics), third edition, Boulder, Colo.:Westview Press, 1999.
Human Development Report, Oxford: Oxford University Press, 1990.
Human Development Report 2001: Making New Technologies Workfor Development, Oxford: Oxford University Press, 2001.
ICSU, Resilience and Sustainable Development, International Councilfor Science, 2002.
Iman, R. L., J. M. Davenport, and D. K. Ziegler, Latin Hypercube Sam-pling, Sandia National Laboratory, 1980.
Kahn, Herman, William Brown, and Leon Martel, The Next 200Years—A Scenario for America and the World, New York: WilliamMorrow and Company, Inc., 1976.
Kahneman, Daniel, Paul Slovic, and Amos Tversky, Judgment UnderUncertainty: Heuristics and Biases, New York: Cambridge Uni-versity Press, 1982.

182 Shaping the Next One Hundred Years
Kahneman, Daniel, and Amos Tversky, The Simulation Heuristic,New York: Cambridge University Press, 1982.
Keeney, Ralph L. and Howard Raiffa, Decisions with MultipleObjectives: Preferences and Value Tradeoffs, New York: Wiley andSons, 1976.
Kennan, George, “The Sources of Soviet Conduct,” Foreign Affairs,1947.
Klein, Gary, Sources of Power: How People Make Decisions,Cambridge, Mass.: MIT Press, 1998.
Knight, Frank H., Risk, Uncertainty, and Profit, Boston: HoughtonMifflin, 1921.
Kouvelis, P., and G. Yu, Robust Discrete Optimization and Its Applica-tions, Dordrecht, the Netherlands: Kluwer Academic Publishers,1997.
Kuhn, Thomas S., The Structure of Scientific Revolutions, Chicago:University of Chicago Press, 1962.
Lakátos, Imre, Proofs and Refutations, Cambridge, UK: CambridgeUniversity Press, 1976.
Lempert, Robert J., “Finding Transatlantic Common Ground on Cli-mate Change,” International Spectator, Vol. 36, No. 2, 2001.
Lempert, Robert. J., “New Decision Sciences for Complex Systems,”Proceedings of the National Academy of Sciences, Vol. 99, supple-ment 3, 2002a, pp. 7309–7313.
Lempert, Robert. J., Transition Paths to a New Era of Green Industry:Technological and Policy Implications, Santa Monica, Calif.:RAND, P-8067, 2002b.
Lempert, Robert J., and James Bonomo, New Methods for Robust Sci-ence and Technology Planning, Santa Monica, Calif.: RAND, DB-238-DARPA, 1998.
Lempert, Robert J., Steven W. Popper, and Steven C. Bankes,“Confronting Surprise,” Social Science Computing Review, Vol. 20,No. 4, 2002, pp. 420–440.

Bibliography 183
Lempert, Robert J., Steven W. Popper, Susan Resetar, and S. Hart,Capital Cycles and the Timing of Climate Change Mitigation Policy,Arlington, Va.: Pew Center on Global Climate Change, 2002.
Lempert, Robert J., and Michael E. Schlesinger, “Robust Strategies forAbating Climate Change,” Climate Change, Vol. 45, Nos. 3/4, 2000,pp. 387–401.
_____, Adaptive Strategies for Climate Change. Innovative EnergyStrategies for CO2 Stabilization, R. Watts, ed., Cambridge, UK:Cambridge University Press, 2002.
Lempert, Robert J., Michael E. Schlesinger, Steven C. Bankes, andNatalie G. Andronova, “The Impact of Variability on Near-TermClimate-Change Policy Choices,” Climate Change, Vol. 45, No. 1,2000, pp. 129–161.
Leopold, Aldo, A Sand County Almanac, New York: Oxford Univer-sity Press, 1949.
Lindblom, C. E., “The Science of Muddling Through,” PublicAdministration Review, Vol. 19, 1959, pp. 79–88.
Lomborg, Bjorn, The Skeptical Environmentalist: Measuring the RealState of the World, Cambridge University Press, 2001.
Manne, A. S., and R. G. Richels, Buying Greenhouse Insurance: TheEconomic Costs of Carbon Dioxide Emissions Limits, Cambridge,Mass.: MIT Press, 1992.
Marland, Gregg, Tom Boden, and Bob Andres, “National CO2 Emis-sions from Fossil-Fuel Burning, Cement Manufacture, and GasFlaring,” 2002, available at http://cdiac.esd.ornl.gov/ftp/trends/emissions/usa.dat and http://cdiac.esd.ornl.gov/trends/emis/em_cont.htm.
Martin, Ben R., and John Irvine, Research Foresight, London: PinterPublishers, 1989.
McKibbon, Bill, The End of Nature, New York: Random House, 1989.
McMillan, John, Reinventing the Bazaar: A Natural History of Mar-kets, New York: W. W. Norton & Company, 2002.

184 Shaping the Next One Hundred Years
Meadows, Donella H., and Dennis Meadows, eds., The Limits toGrowth: A Report for the Club of Rome’s Project on the Predica-ment of Mankind, second edition, New York: Universe Books,1972.
Meadows, Donella H., Dennis L. Meadows, and Jorgen Randers,Beyond the Limits: Confronting Global Collapse, Envisioning aSustainable Future, White River Junction, Vt.: Chelsea Green Pub-lishing Co., 1992.
Metz, Bert, Ogunlade Davidson, Rob Swart, and Jiahua Pan, eds.,Climate Change 2001: Mitigation, Contribution of Working GroupIII to the Third Assessment Report [TAR] of the IntergovernmentalPanel on Climate Change (IPCC), Cambridge, UK: CambridgeUniversity Press, 2001.
Morgan, Millett G., and Max Henrion, eds., Uncertainty: A Guide toDealing with Uncertainty in Quantitative Risk and Policy Analysis,Cambridge, UK: Cambridge University Press, 1990.
Morgan, M. G., Milind Kandlikar, James Risebey, and Hadi Dow-latabadi, “Why Conventional Tools for Policy Analysis Are OftenInadequate for Problems of Global Change,” Climatic Change, Vol.41, 1999, pp. 271–281.
Myers, Norman, Nancy J. Myers, and Julian Simon, Scarcity or Abun-dance?: A Debate on the Environment, New York: W. W. Norton &Company, 1994.
Nakicenovic, N., IPCC Special Report on Emissions Scenarios, Cam-bridge, UK: Cambridge University Press, 1999.
National Academy Press, Abrupt Climate Change: Inevitable Sur-prises, Washington, D.C., 2002.
National Institute of Science and Technology Policy (NISTEP) andFraunhofer Institute for Systems and Innovation Research, Out-look for Japanese and German Future Technology, NISTEP ReportNo. 33, April 1994.
Nature, “Climate Panel to Seize Political Hot Potatoes,” Vol 421, p.879, 2003.

Bibliography 185
Newell, Richard, and William Pizer, Discounting the Benefits ofFuture Climate Change Mitigation: How Much Do Uncertain RatesIncrease Valuations? Arlington, Va.: Pew Center on Global ClimateChange, 2001.
Nordhaus, W. D., Managing the Global Commons: The Economics ofGlobal Change, Cambridge, Mass.: MIT Press, 1994.
Nordhaus, W. D., and Edward C. Kokkelenberg, eds., Nature’s Num-bers: Expanding the National Economic Accounts to Include theEnvironment, National Research Council, 1999.
Park, George, and Robert J. Lempert, The Class of 2014: PreservingAccess to California Higher Education, Santa Monica, Calif.:RAND, MR-971-EDU, 1998.
Payne, John. W., James R. Bettman, and Eric J. Johnson, The AdaptiveDecision-Maker, New York: Cambridge University Press, 1993.
Popper, Karl A., The Logic of Scientific Discovery, London: Hutchin-son, 1959.
_____, Conjectures and Refutations, New York: Basic Books, 1962.
Popper, Steven W., Caroline Wagner, and Robert Lempert, “MovingBeyond Foresight,” Foresight-Scenarios-Landscaping Workshop,Brussels, Belgium, July 5, 2003.
Prescott-Allen, Robert, The Wellbeing of Nations, Washington, D.C.:Island Press, 2001.
Raiffa, Howard, Decision Analysis: Introductory Lectures on ChoicesUnder Uncertainty, Reading, Mass.: Addison-Wesley, 1968.
Raskin, Paul, Tariq Banuri, Gilberto Gallopin, Pablo Gutman, AlHammond, Robert Kates, and Rob Swart, Great Transition—ThePromise and Lure of the Times Ahead, Stockholm, Sweden:Stockholm Environment Institute, 2002.
Raskin, Paul, Gilberto Gallopin, Pablo Gutman, Al Hammond, andRob Swart, Bending the Curve: Toward Global Sustainability,Stockholm, Sweden: Stockholm Environment Institute, 1998.

186 Shaping the Next One Hundred Years
Resilience and Sustainable Development, International Council forScience, 2002.
Romer, C. D., “The Prewar Business Cycle Reconsidered: New Esti-mates of Gross National Product, 1969–1908,” Journal of PoliticalEconomy, Vol. 98, No. 1, pp. 1–37.
Rosenhead, M. J., “Robustness Analysis: Keeping Your OptionsOpen,” in Rational Analysis for a Problematic World: ProblemStructuring Methods for Complexity, Uncertainty, and Conflict,New York: Wiley and Sons, 1989.
Rosenhead, M. J., M. Elton, and S. K. Gupta, “Robustness and Opti-mality as Criteria for Strategic Decisions,” Operational ResearchQuarterly, Vol. 23, No. 4, 1972, pp. 413–430.
Saltelli, A., K. Chan, and M. Scott, Sensitivity Analysis, New York:Wiley, 2000.
Savage, L. J., The Foundations of Statistics, New York: Wiley, 1950.
Schelling, Thomas, Micromotives and Macrobehavior, New York: W.W. Norton and Company, 1978.
Schwartz, Peter, Art of the Long View, New York: Doubleday, 1996.
Simon, Herbert, “Theories of Decision-Making in Economic andBehavioral Science,” American Economic Review, 1959.
Sobol, I. M., “Sensitivity Estimates for Nonlinear MathematicalModels,” Matematicheskoe Modelirovanie, Vol. 2, 1990, pp. 112–118.
Szayna, Thomas S., Daniel Byman, Steven Bankes, Derek Eaton, SethG. Jones, Robert Mullins, Ian O. Lesser, and William Rosenau, eds.,The Emergence of Peer Competitors: A Framework for Analysis,Santa Monica, Calif.: RAND, MR-1346-A, 2001.
Trigeorgis, L., Real Options: Managerial Flexibility and Strategy inResource Allocation, Cambridge, Mass.: MIT Press, 1996.
United Nations Development Programme (UNDP), Human Devel-opment Report, Oxford, UK: Oxford University Press, 1990.

Bibliography 187
_____, Human Development Report 2001: Making New TechnologiesWork for Development, New York: Oxford University Press, 2001.
Utterback, James M., Mastering the Dynamics of Innovation, Boston:Harvard Business School Press, 1994.
van Asselt, Marjolein B. A., Perspectives on Uncertainty and Risk,Dordrecht, the Netherlands: Kluwer Academic Publishers, 2000.
van der Heijden, K., Scenarios: The Art of Strategic Conversation,Chichester, UK: Wiley and Sons, 1996.
Victor, David, The Collapse of the Kyoto Protocol and the Struggle toSlow Global Warming, Princeton, N.J.: Princeton University Press,2001.
Vitousek, Peter, Paul R. Ehrlich, Anne H. Ehrlich, and PamelaMatson, “Human Appropriation of the Products of Photo-synthesis,” BioScience, 1986.
Walter, Dave, ed., Today Then: America’s Best Minds Look 100 Yearsinto the Future on the Occasion of the 1893 World’s ColumbianExposition, Helena, Mont.: American & World Geographic Pub-lishing, 1992.
Walters, Carl, Adaptive Management of Renewable Resources, Cald-well, N.J.: The Blackburn Press, 1986.
Watson, Stephen R., and Dennis M. Buede, Decision Synthesis, Cam-bridge, UK: Cambridge University Press, 1987.
Weitzman, Martin L., “Why the Far-Distant Future Should BeDiscounted at Its Lowest Possible Rate,” Journal of EnvironmentalEconomics and Management, Vol. 36, 1998, pp. 201–208.
Zhou, K., J. Doyle, and K. Glover, Robust and Optimum Control The-ory, Englewood Cliffs, N.J.: Prentice-Hall, 1996.