shape, shape has meaning - stanford university · data has shape, shape has meaning, meaning drives...
TRANSCRIPT
Data has Shape, Shape has Meaning, Meaning drives Value
Topological Data Analysis
Data Basics
Q: What is the fundamental assumption when working with data?
Data Basics
Q: What is the fundamental assumption when working with data?
Data Basics
A: Distance between two data points
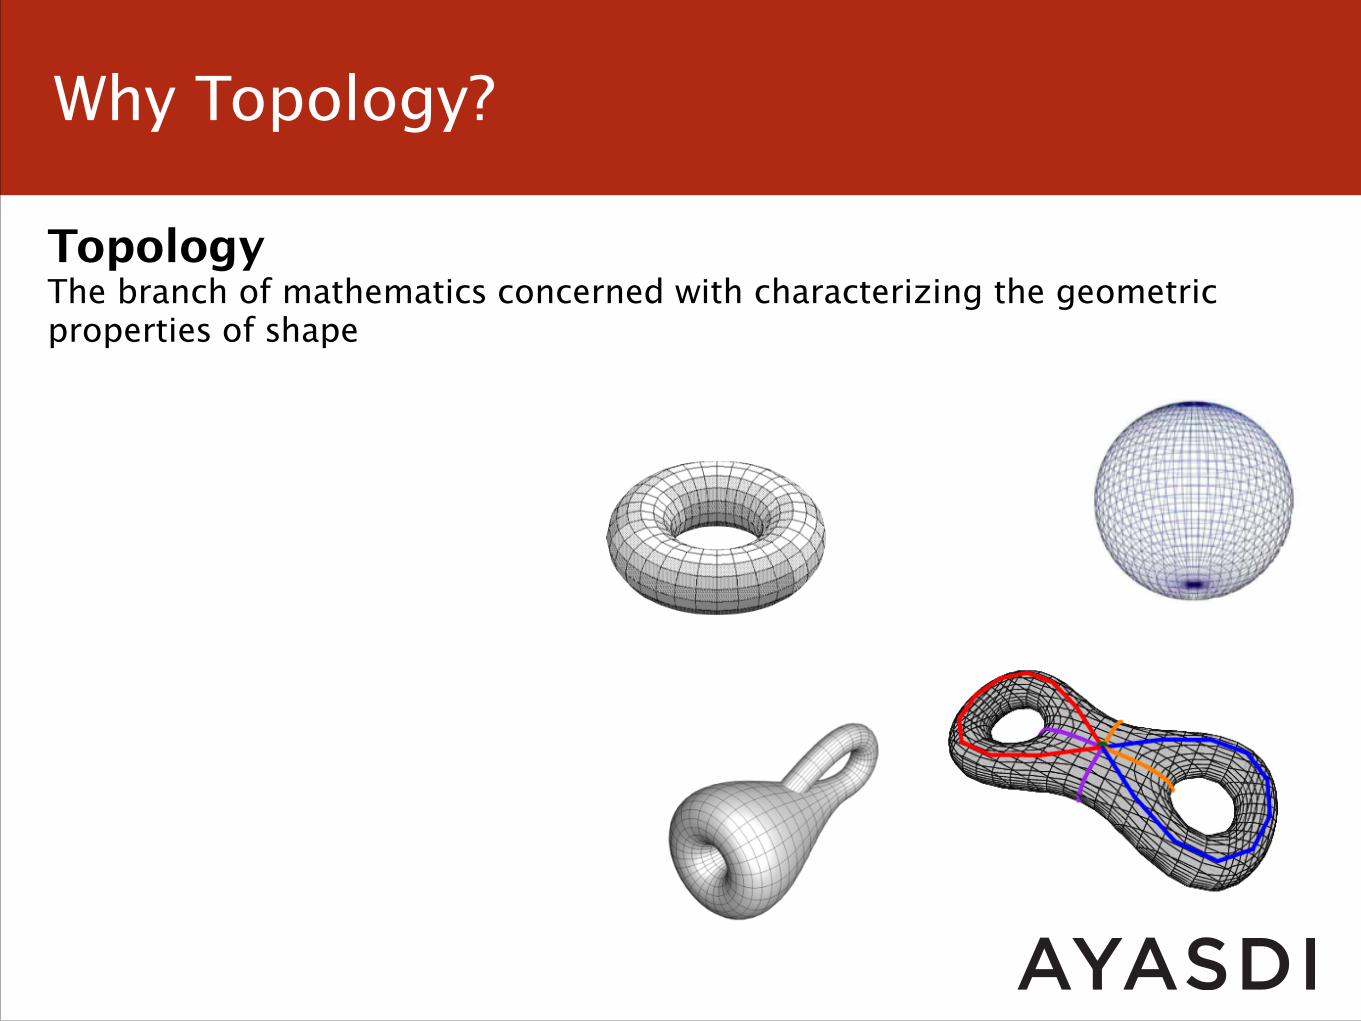
Why Topology?
Topology The branch of mathematics concerned with characterizing the geometric properties of shape
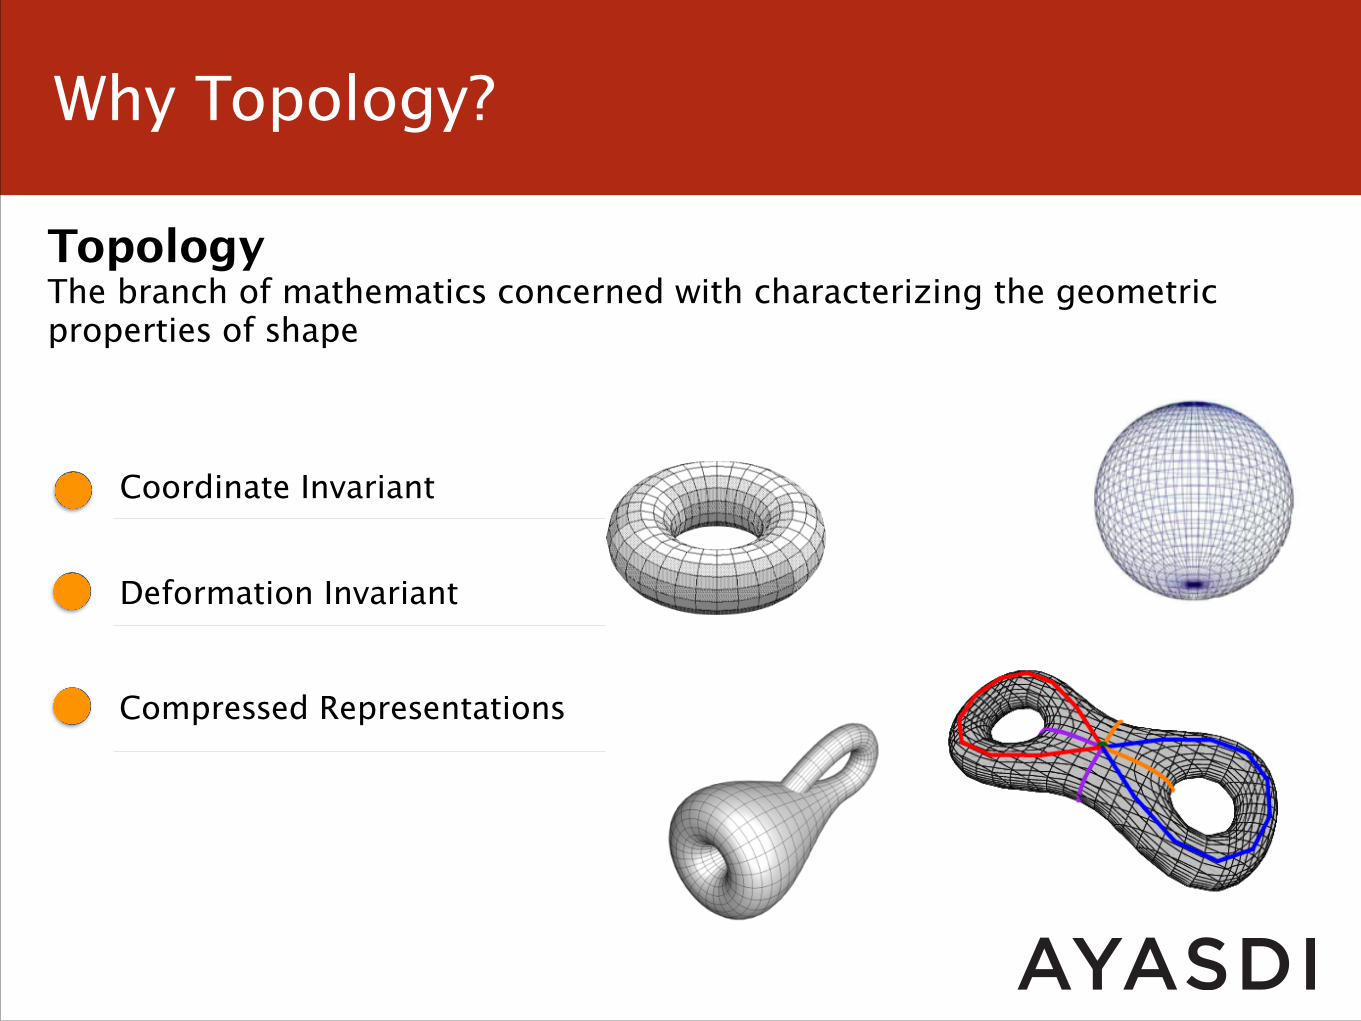
Why Topology?
Topology The branch of mathematics concerned with characterizing the geometric properties of shape
Coordinate Invariant
Compressed Representations
Deformation Invariant
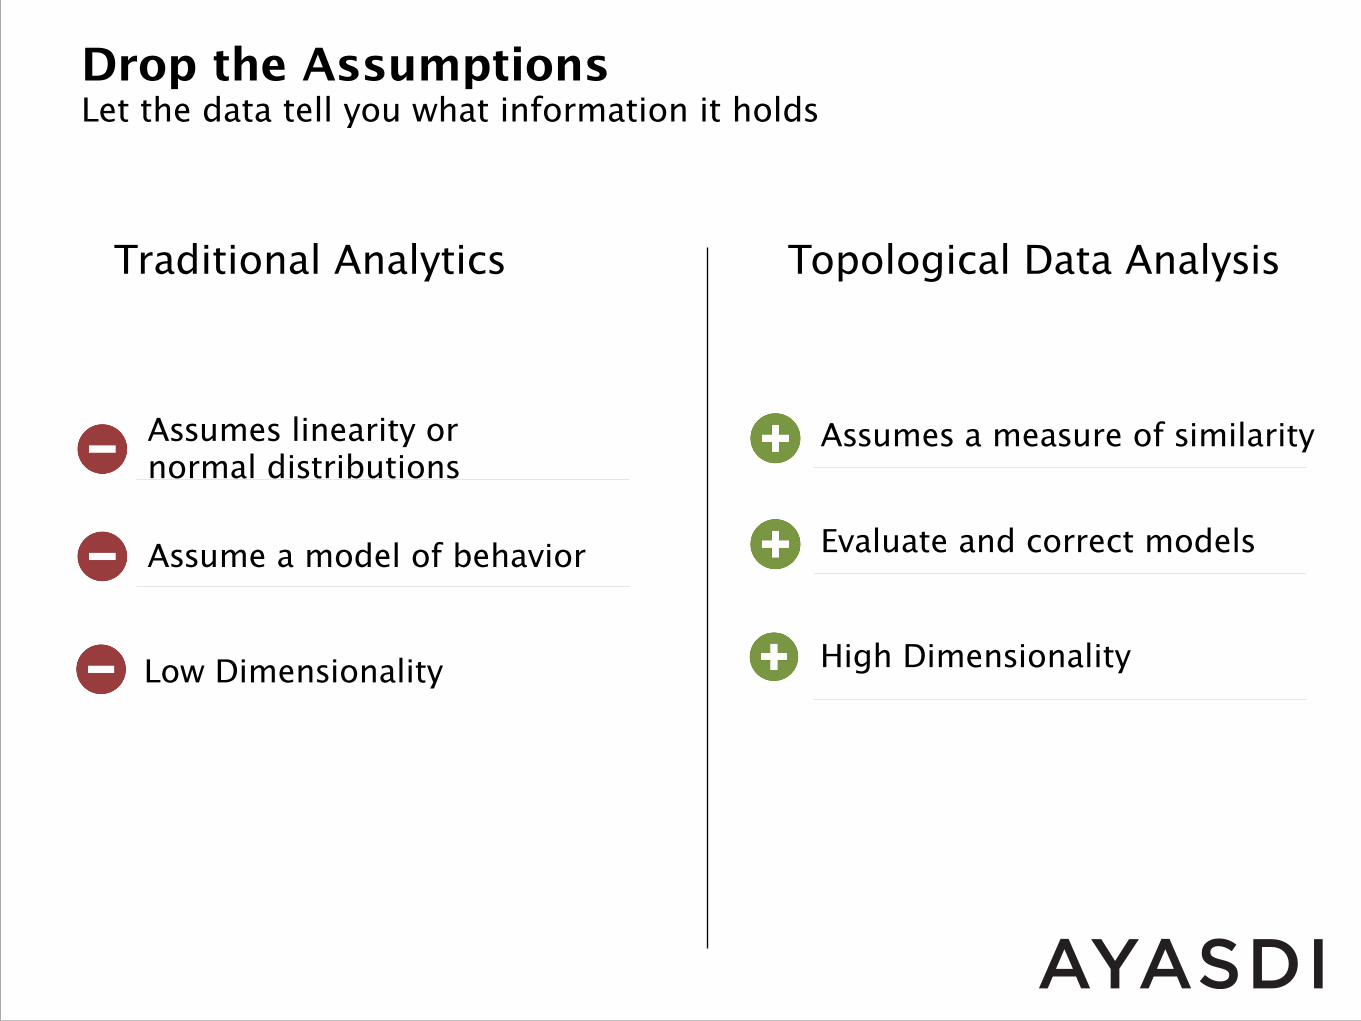
Drop the Assumptions Let the data tell you what information it holds
Assumes linearity or normal distributions
Low Dimensionality
Assume a model of behavior
Assumes a measure of similarity
High Dimensionality
Evaluate and correct models
Traditional Analytics Topological Data Analysis
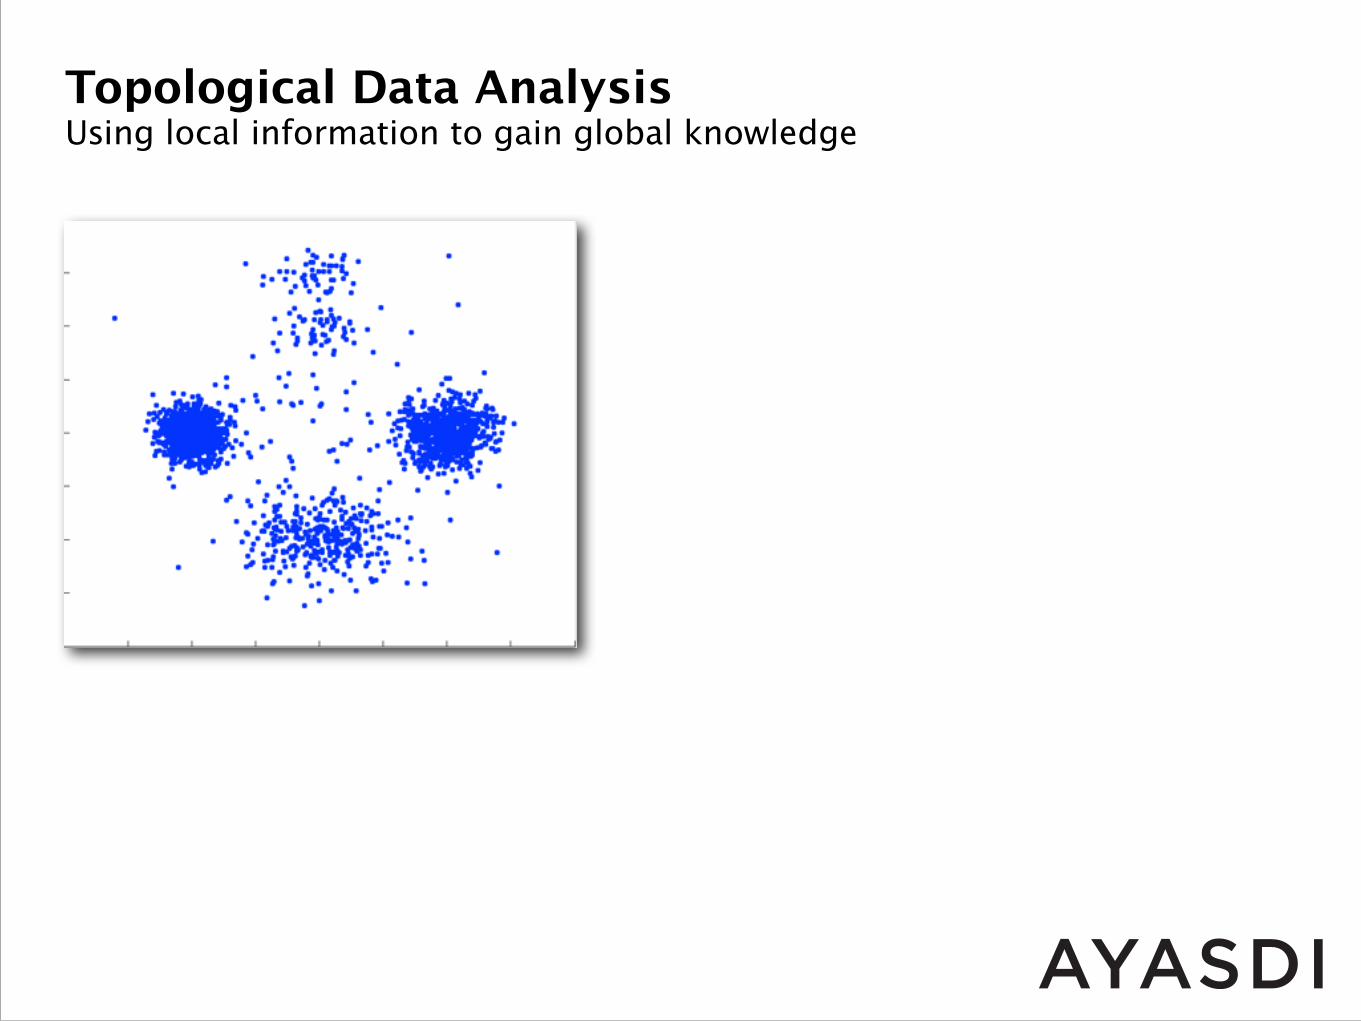
Topological Data Analysis Using local information to gain global knowledge
........ ...... . ...... ........ ...... . ......
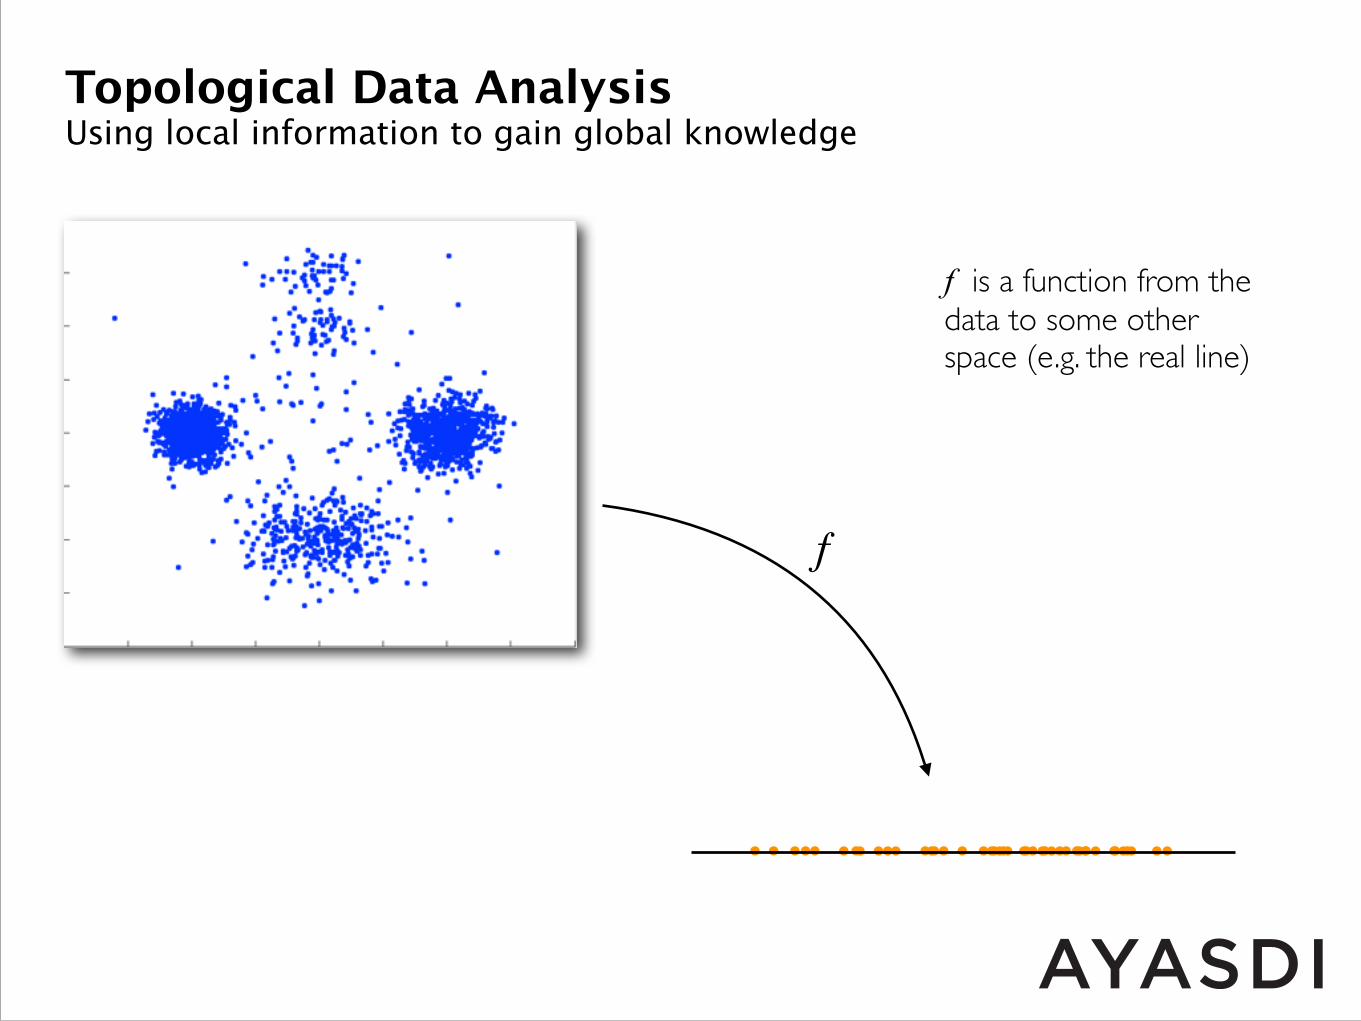
Topological Data Analysis Using local information to gain global knowledge
f
f is a function from the data to some other space (e.g. the real line)
........ ...... . ...... ........ ...... . ......
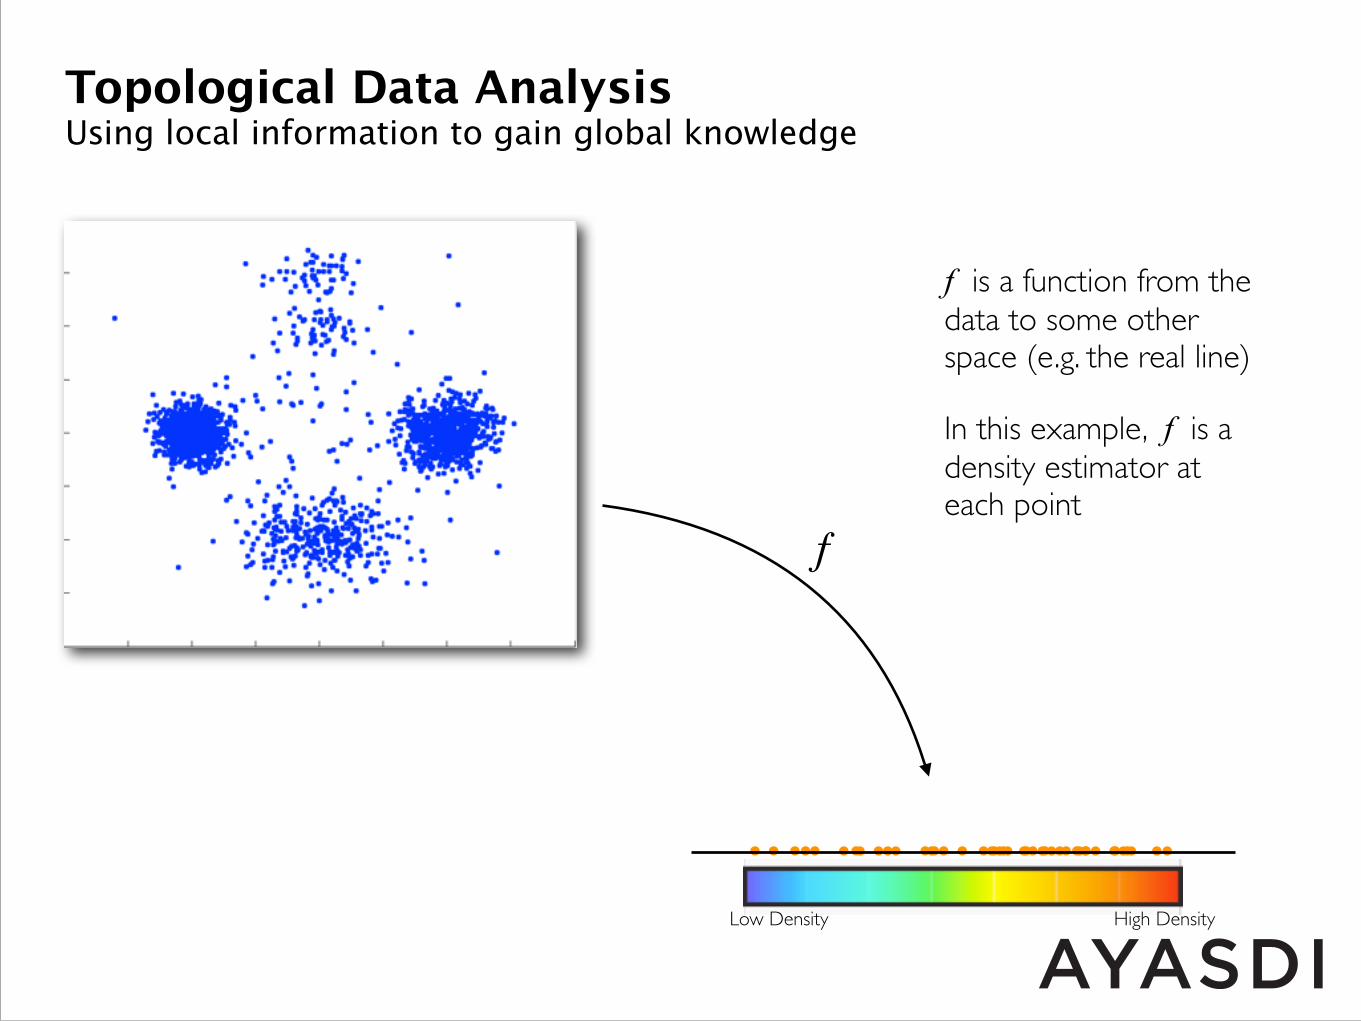
Topological Data Analysis Using local information to gain global knowledge
f
f is a function from the data to some other space (e.g. the real line)
In this example, f is a density estimator at each point
Low Density High Density
........ ...... . ...... ........ ...... . ......
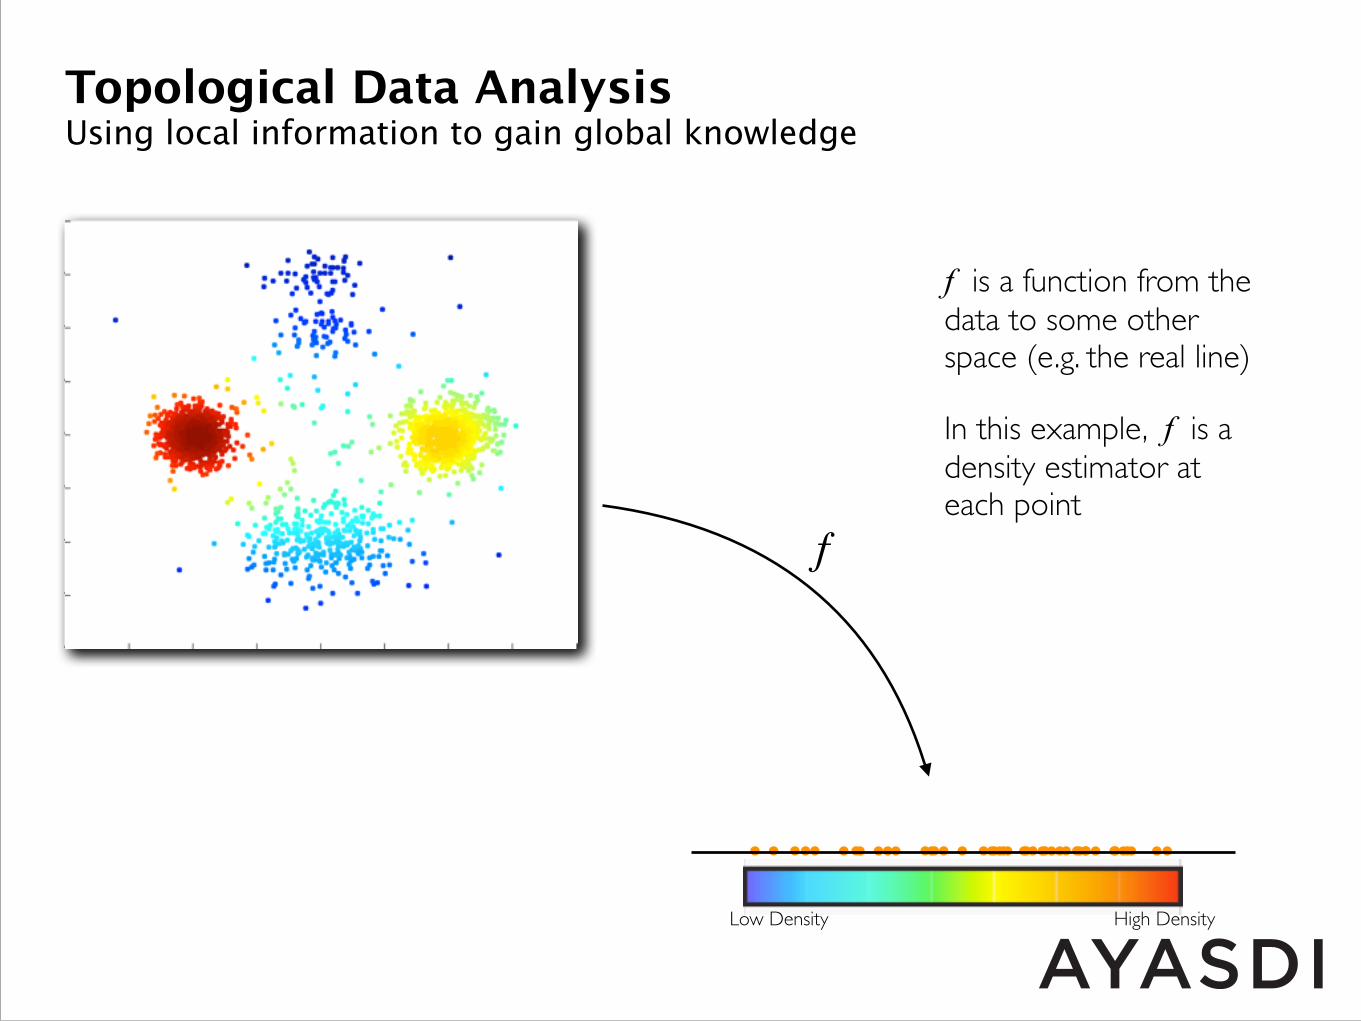
Topological Data Analysis Using local information to gain global knowledge
f
f is a function from the data to some other space (e.g. the real line)
In this example, f is a density estimator at each point
Low Density High Density
........ ...... . ...... ........ ...... . ......
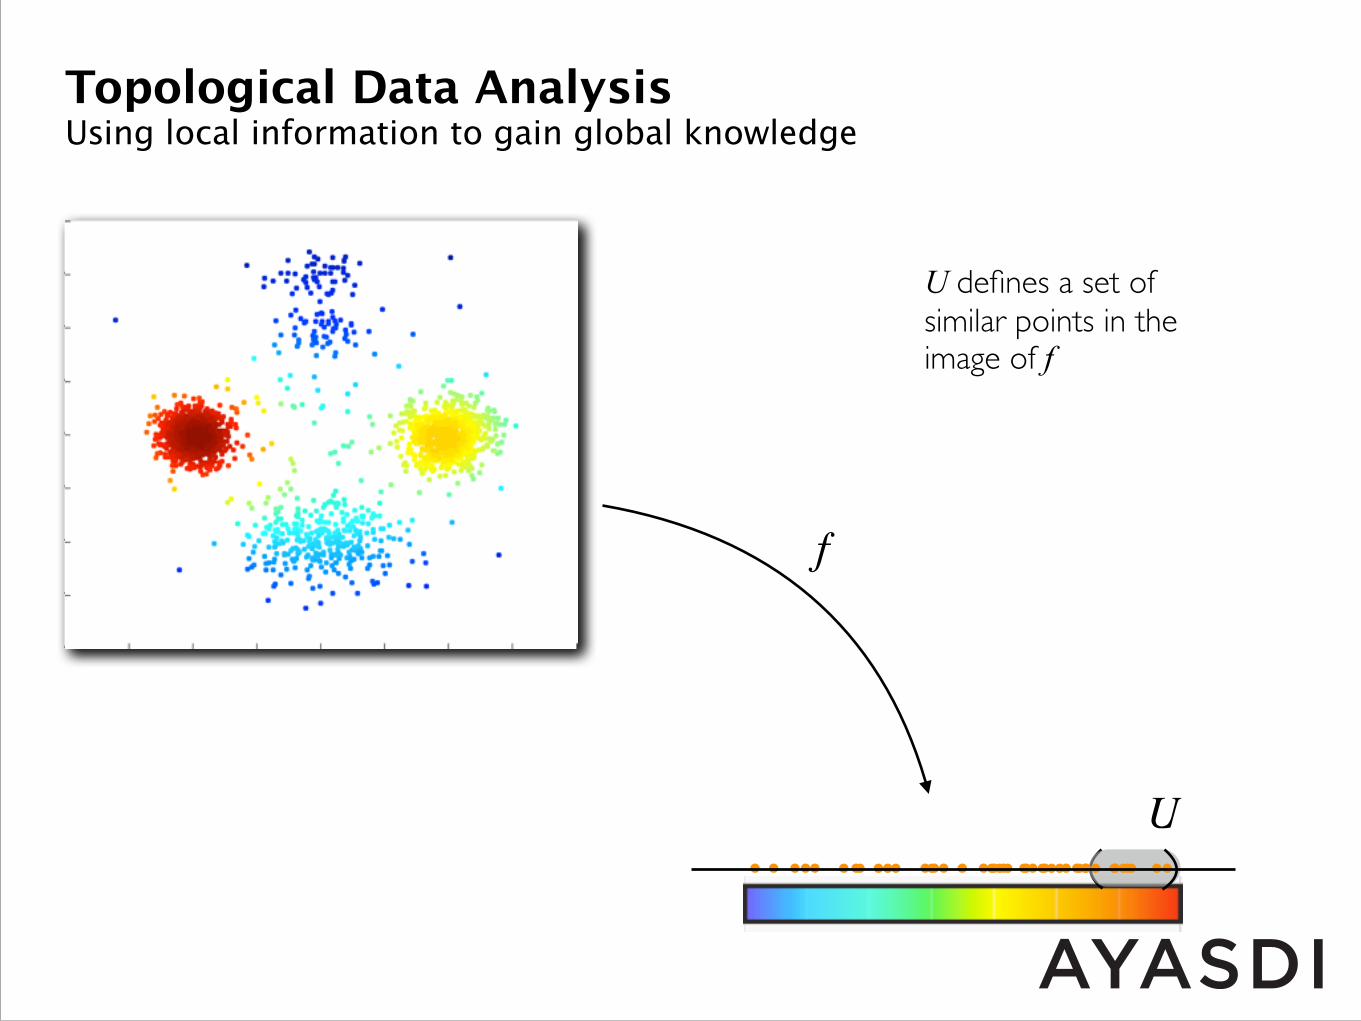
Topological Data Analysis Using local information to gain global knowledge
f
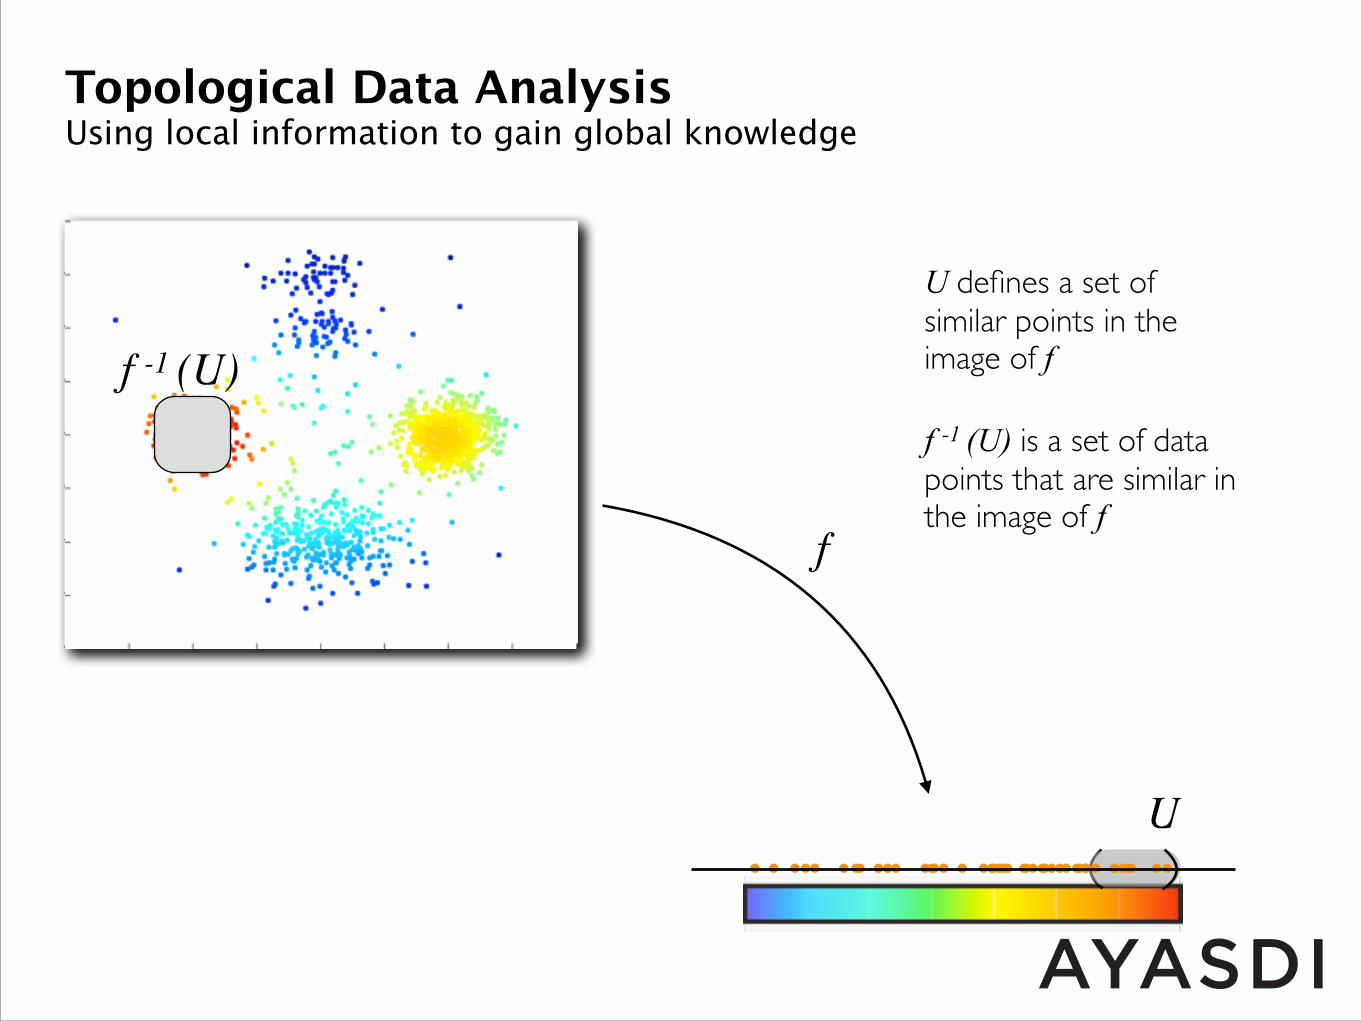
U
U defines a set of similar points in the image of f
........ ...... . ...... ........ ...... . ......
Topological Data Analysis Using local information to gain global knowledge
f
U
U defines a set of similar points in the image of ff -1 (U)f -1 (U) is a set of data points that are similar in the image of f
........ ...... . ...... ........ ...... . ......
Topological Data Analysis Using local information to gain global knowledge
f
U
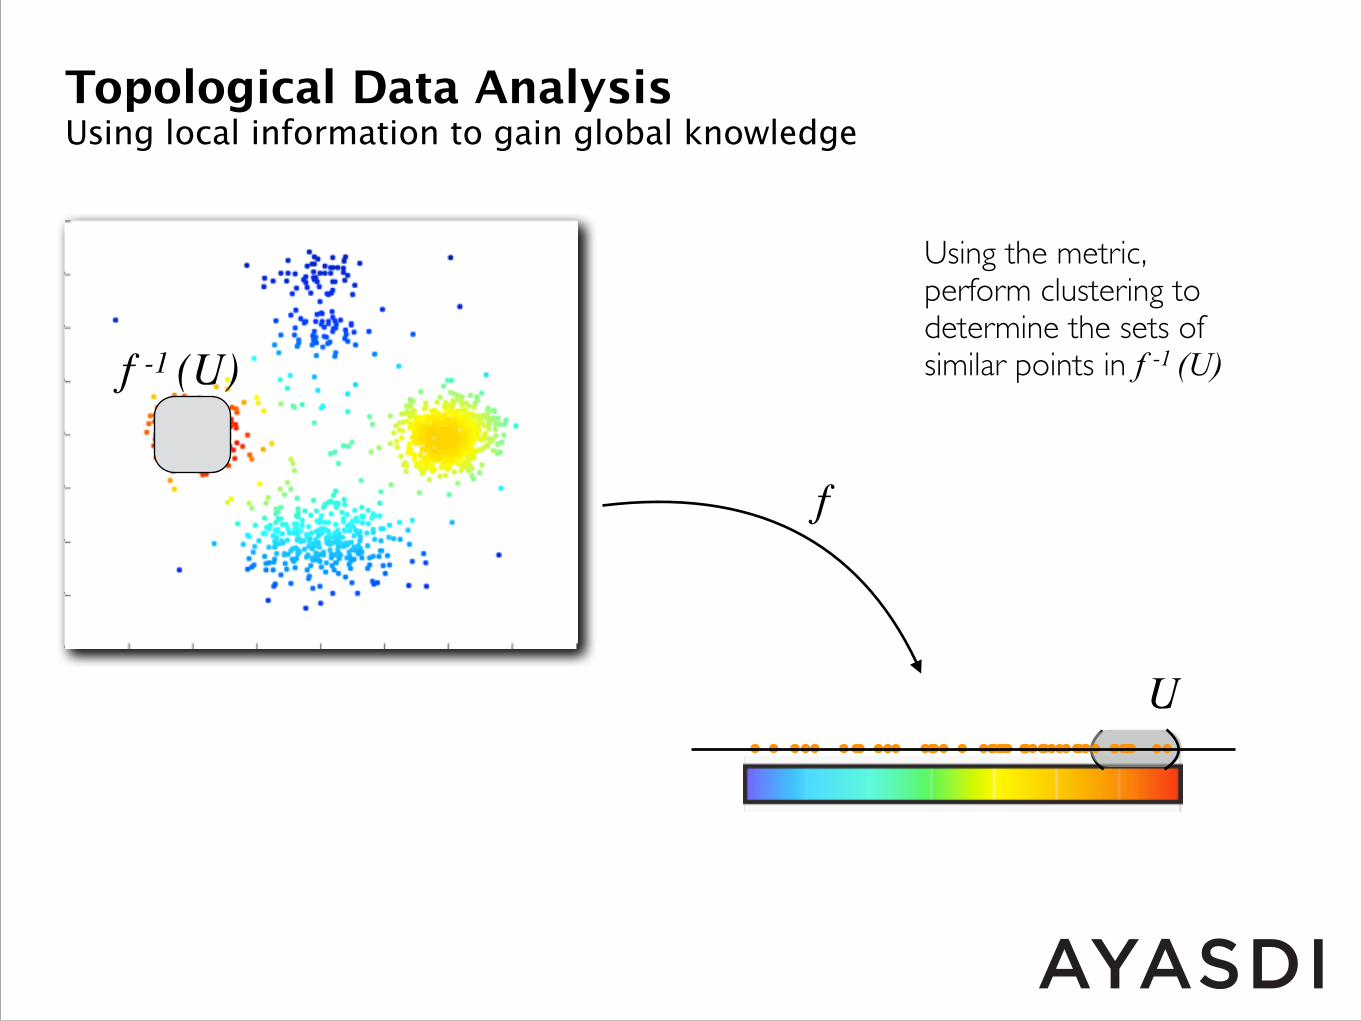
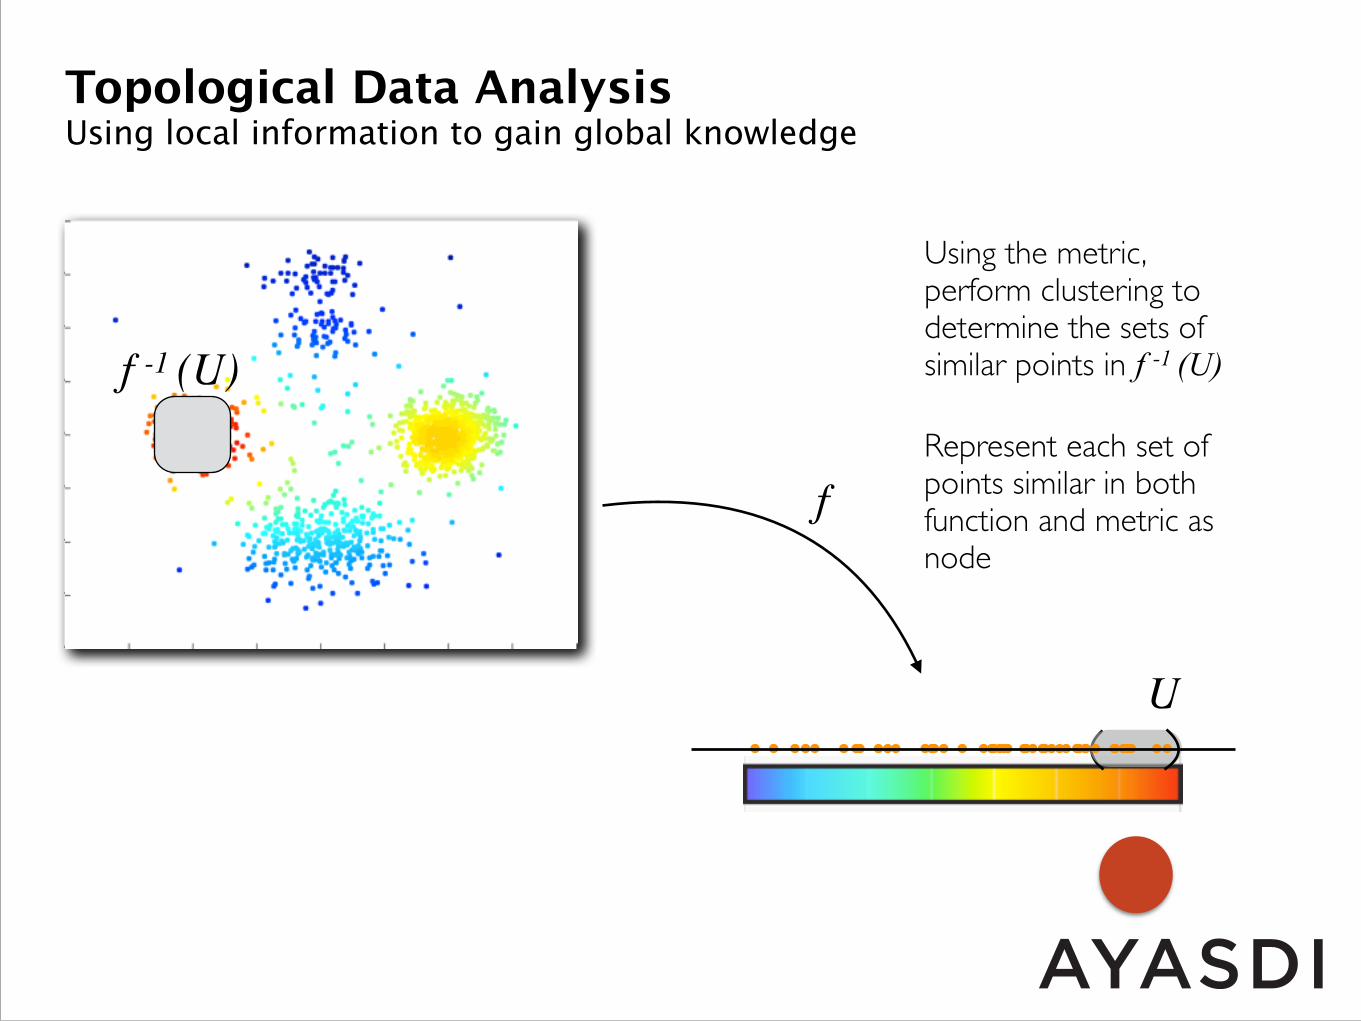
Using the metric, perform clustering to determine the sets of similar points in f -1 (U)f -1 (U)
........ ...... . ...... ........ ...... . ......
Topological Data Analysis Using local information to gain global knowledge
f
U
Using the metric, perform clustering to determine the sets of similar points in f -1 (U)f -1 (U)Represent each set of points similar in both function and metric as node
........ ...... . ...... ........ ...... . ......
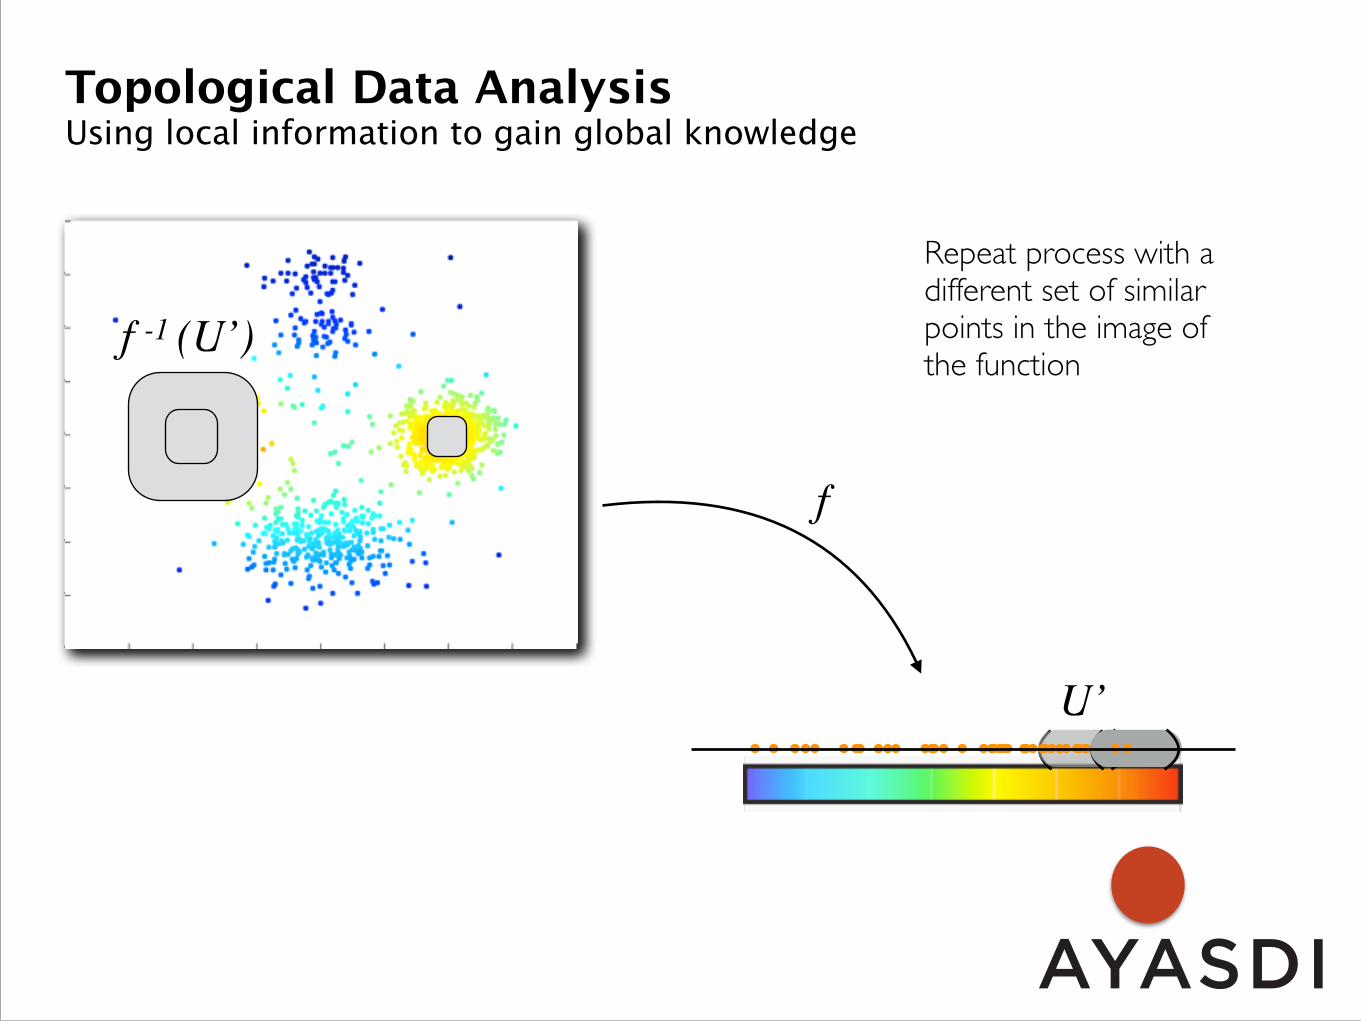
Topological Data Analysis Using local information to gain global knowledge
f
U’
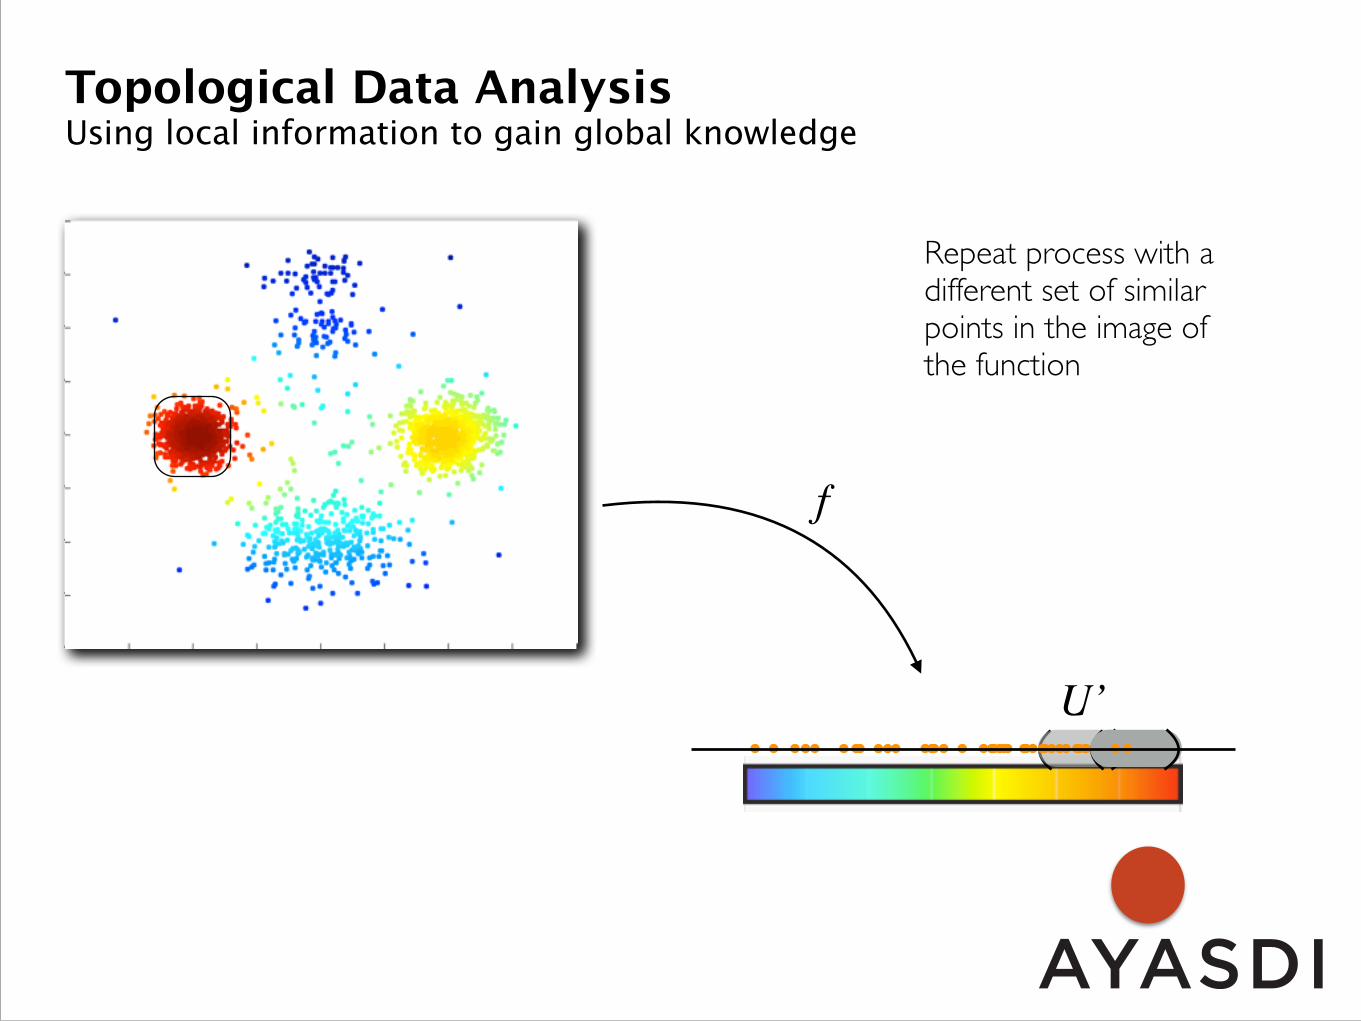
Repeat process with a different set of similar points in the image of the function
........ ...... . ...... ........ ...... . ......
Topological Data Analysis Using local information to gain global knowledge
f
U’
Repeat process with a different set of similar points in the image of the function
f -1 (U’)
........ ...... . ...... ........ ...... . ......
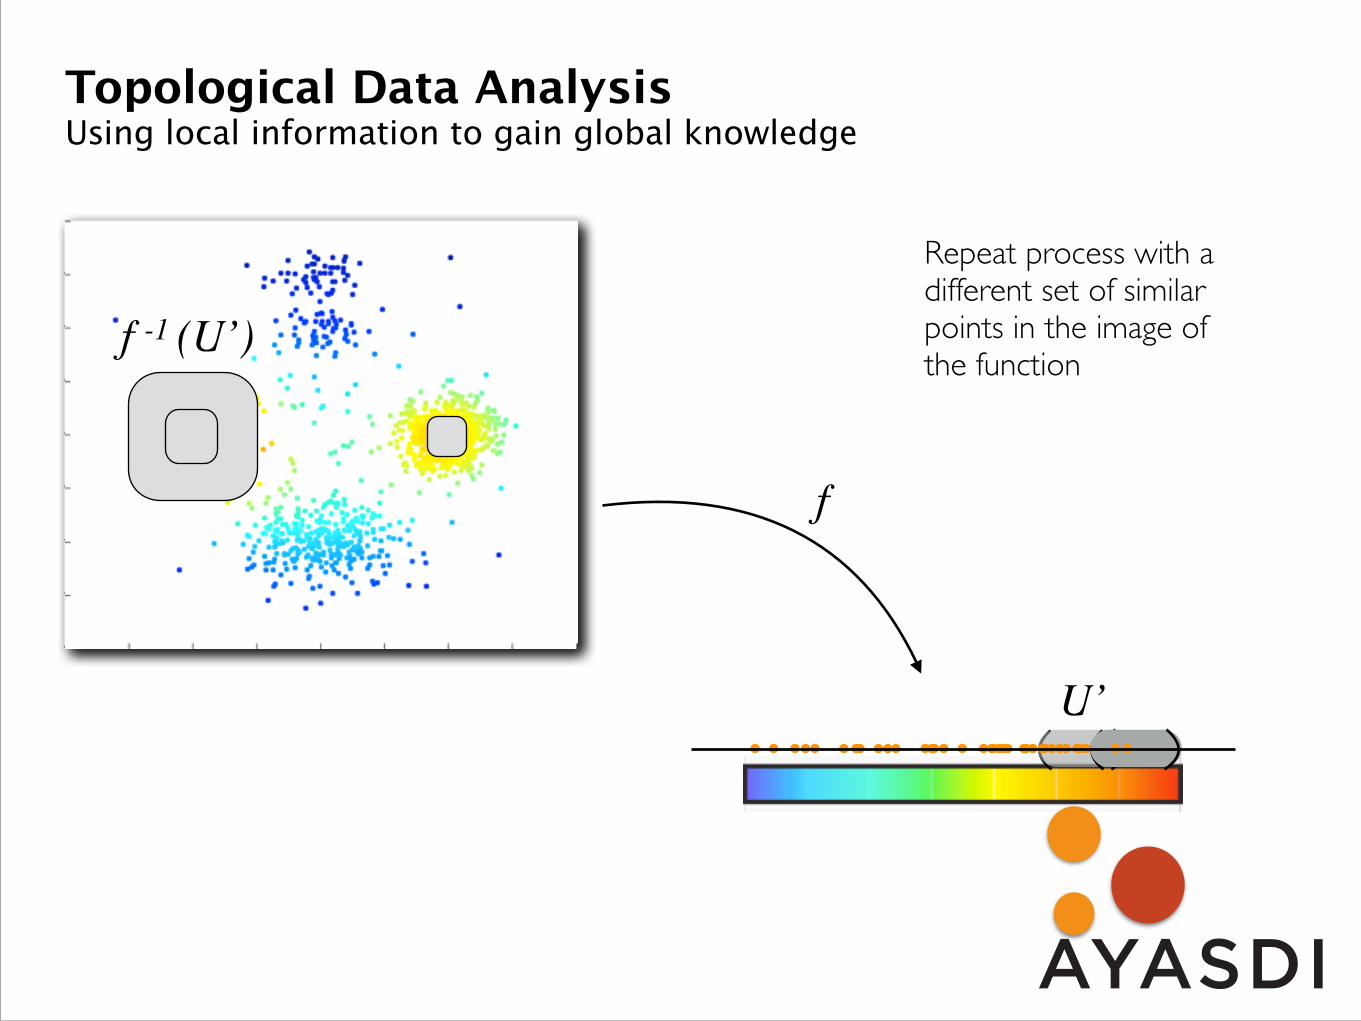
Topological Data Analysis Using local information to gain global knowledge
f
U’
Repeat process with a different set of similar points in the image of the function
f -1 (U’)
........ ...... . ...... ........ ...... . ......
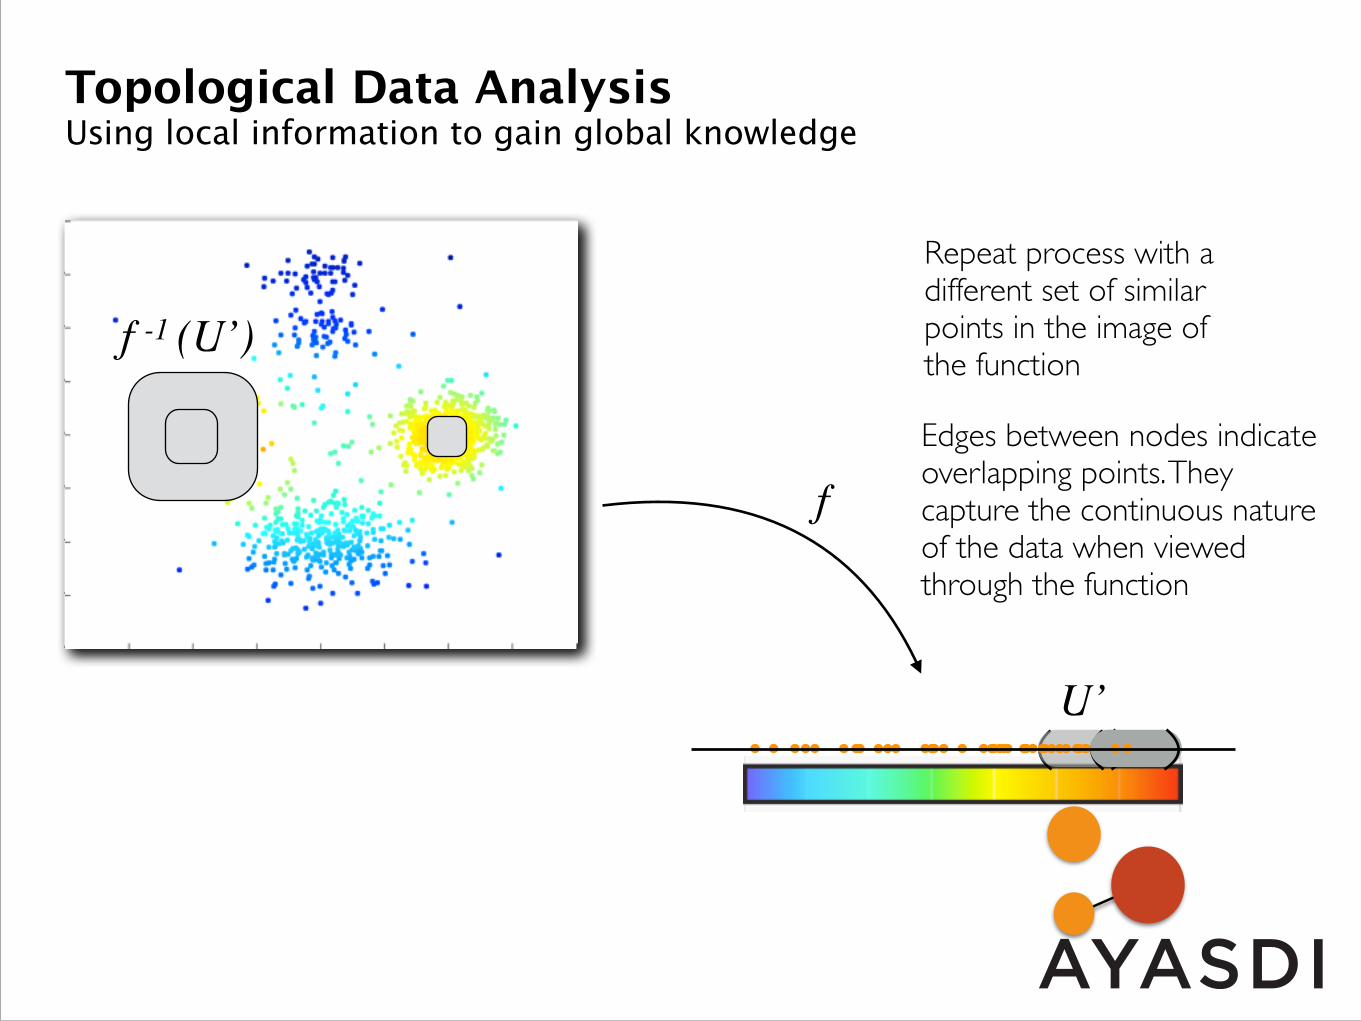
Topological Data Analysis Using local information to gain global knowledge
f
U’
Repeat process with a different set of similar points in the image of the function
f -1 (U’)
Edges between nodes indicate overlapping points. They capture the continuous nature of the data when viewed through the function
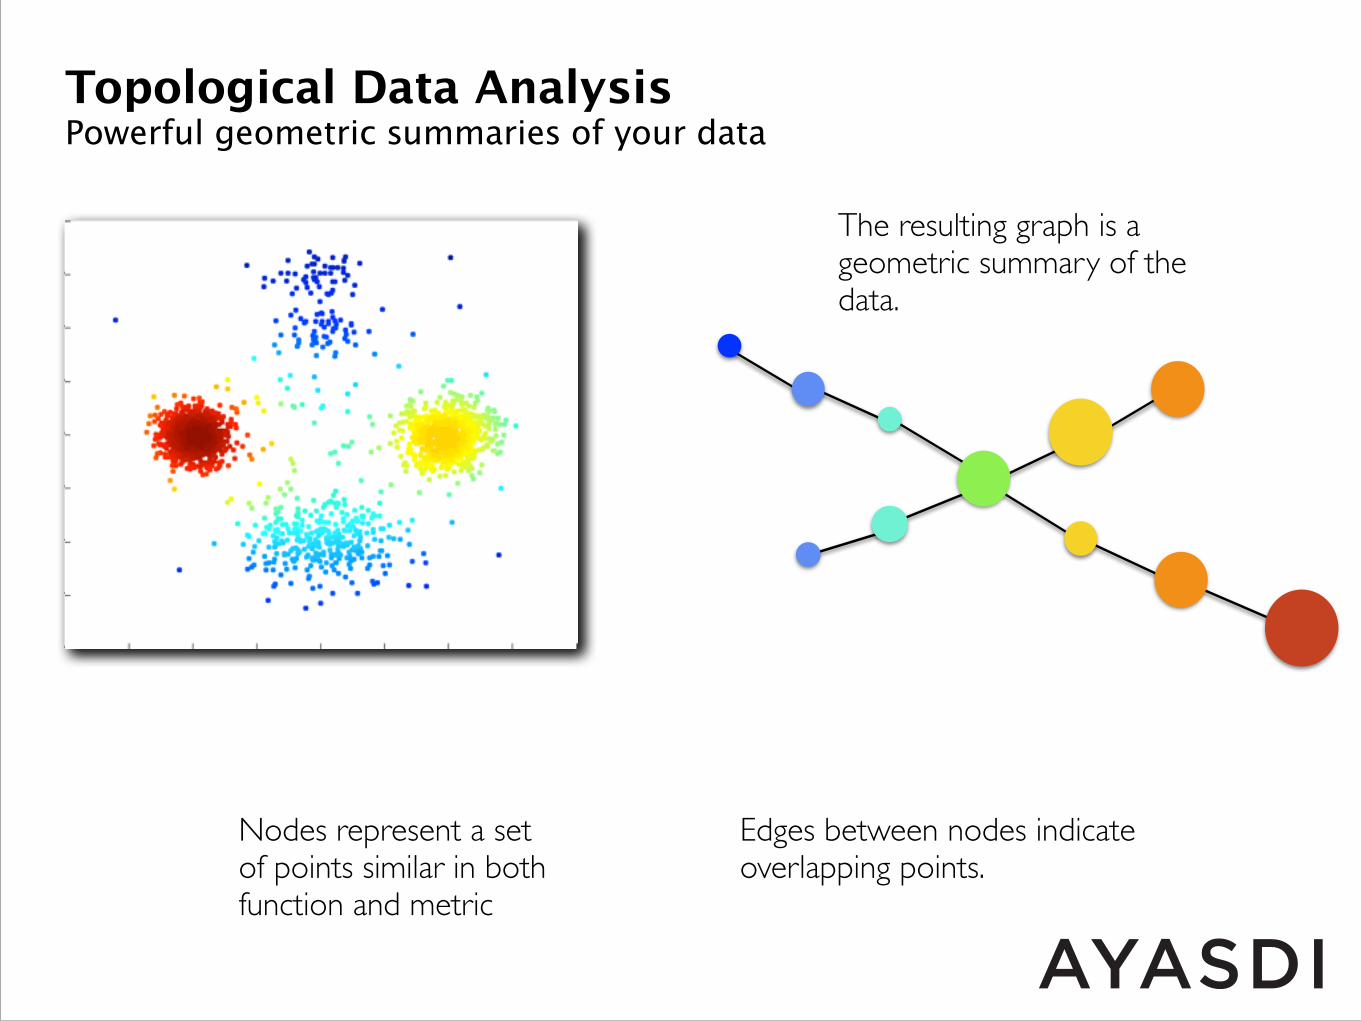
Topological Data Analysis Powerful geometric summaries of your data
Edges between nodes indicate overlapping points.
The resulting graph is a geometric summary of the data.
Nodes represent a set of points similar in both function and metric
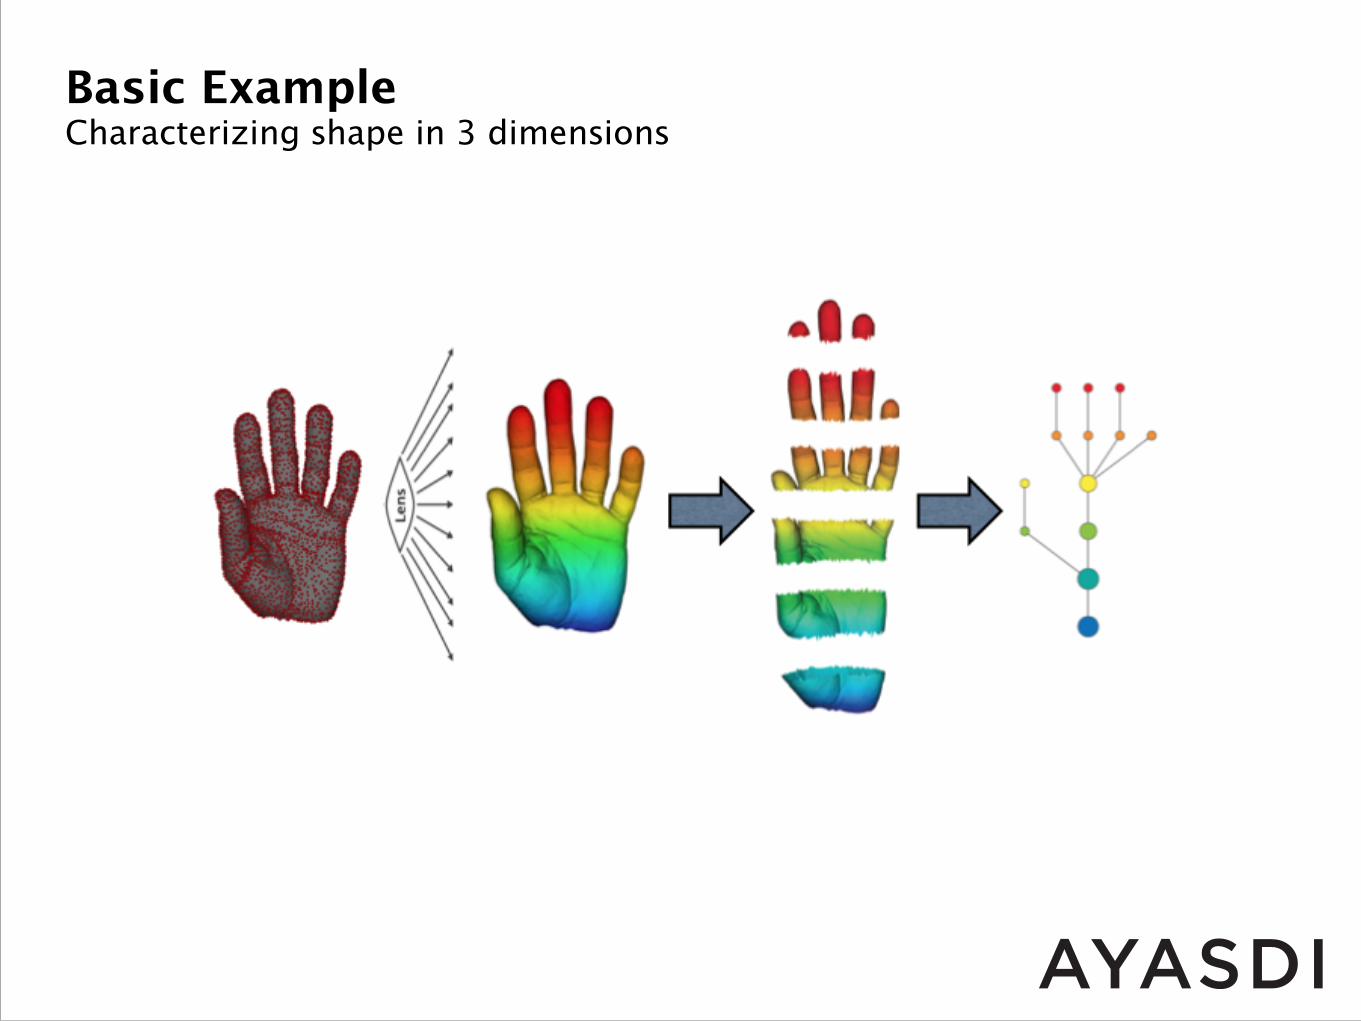
Basic Example Characterizing shape in 3 dimensions
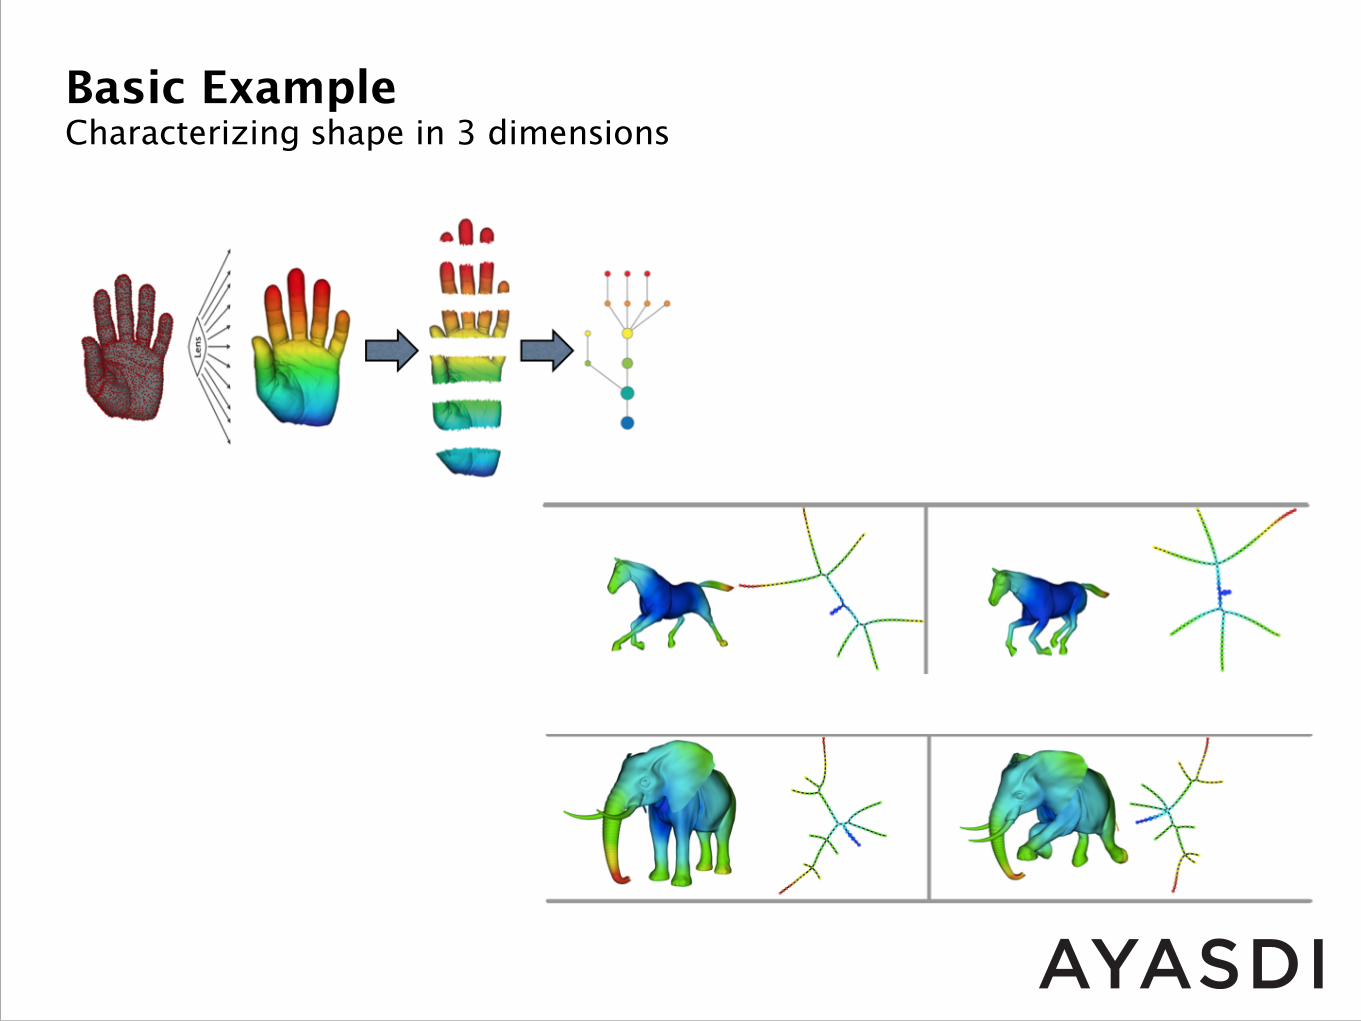
Basic Example Characterizing shape in 3 dimensions
Machine Learning and TDA
Machine Learning and TDA
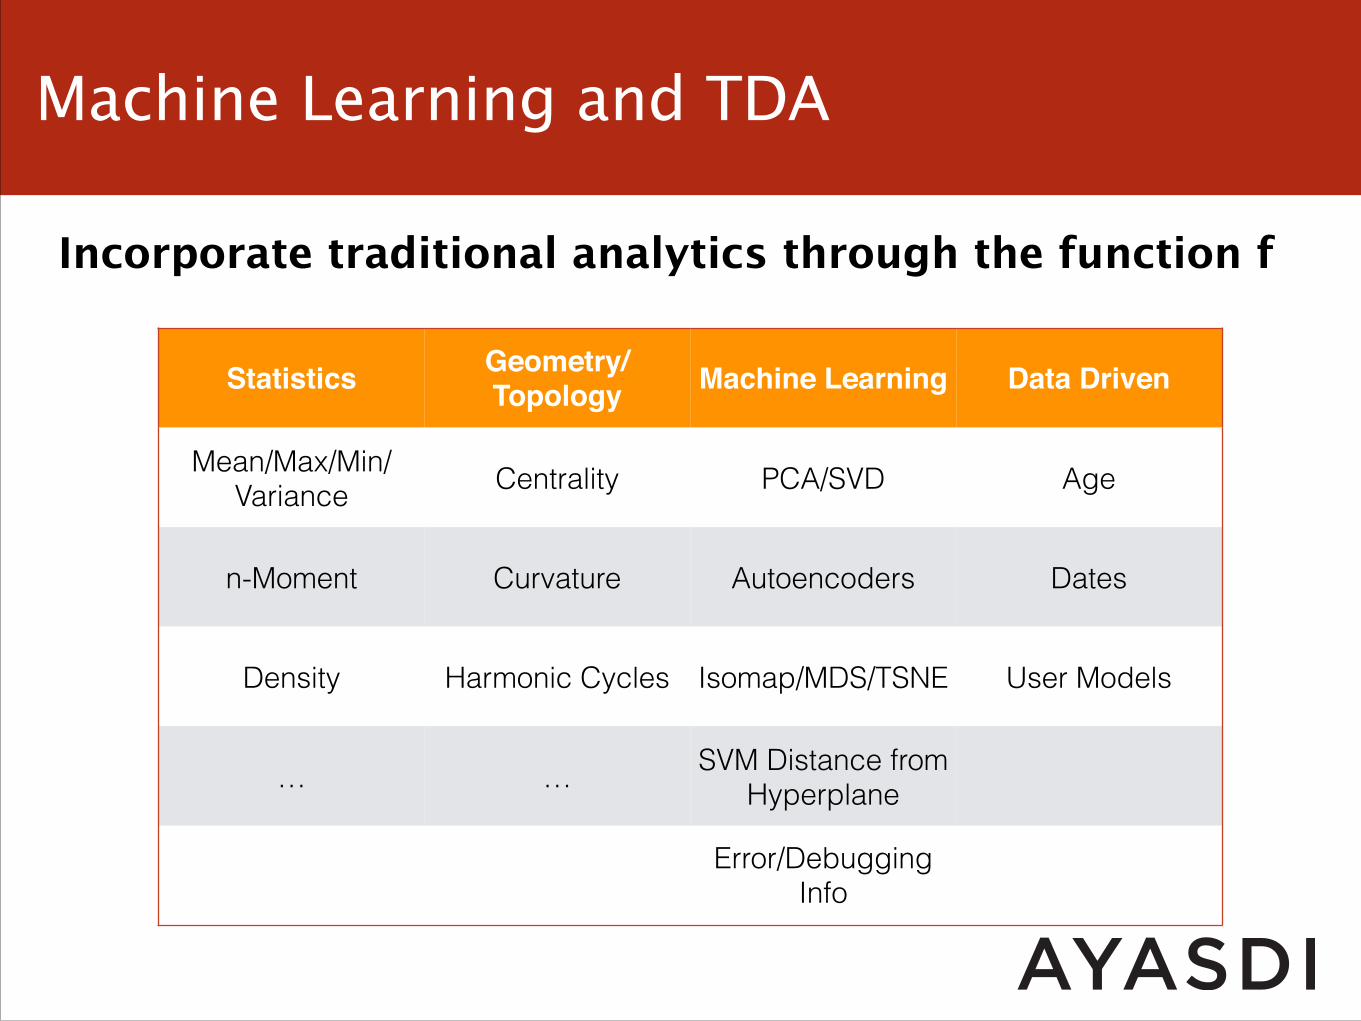
Incorporate traditional analytics through the function f
Machine Learning and TDA
Incorporate traditional analytics through the function f
Statistics Geometry/Topology Machine Learning Data Driven
Mean/Max/Min/Variance Centrality PCA/SVD Age
n-Moment Curvature Autoencoders Dates
Density Harmonic Cycles Isomap/MDS/TSNE User Models
… … SVM Distance from Hyperplane
Error/Debugging Info
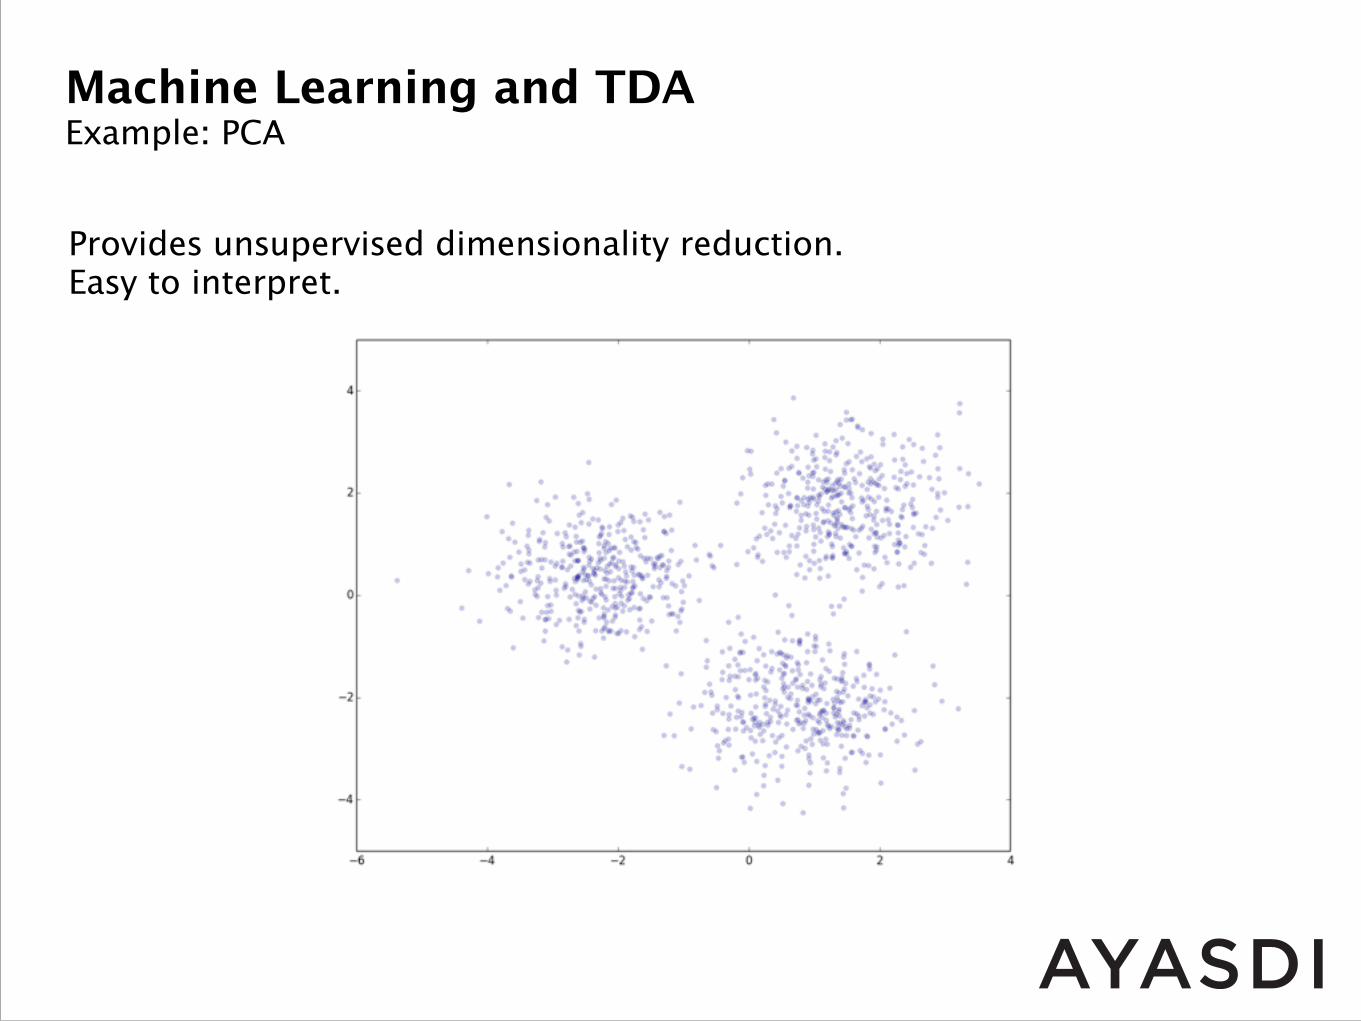
Machine Learning and TDA Example: PCA
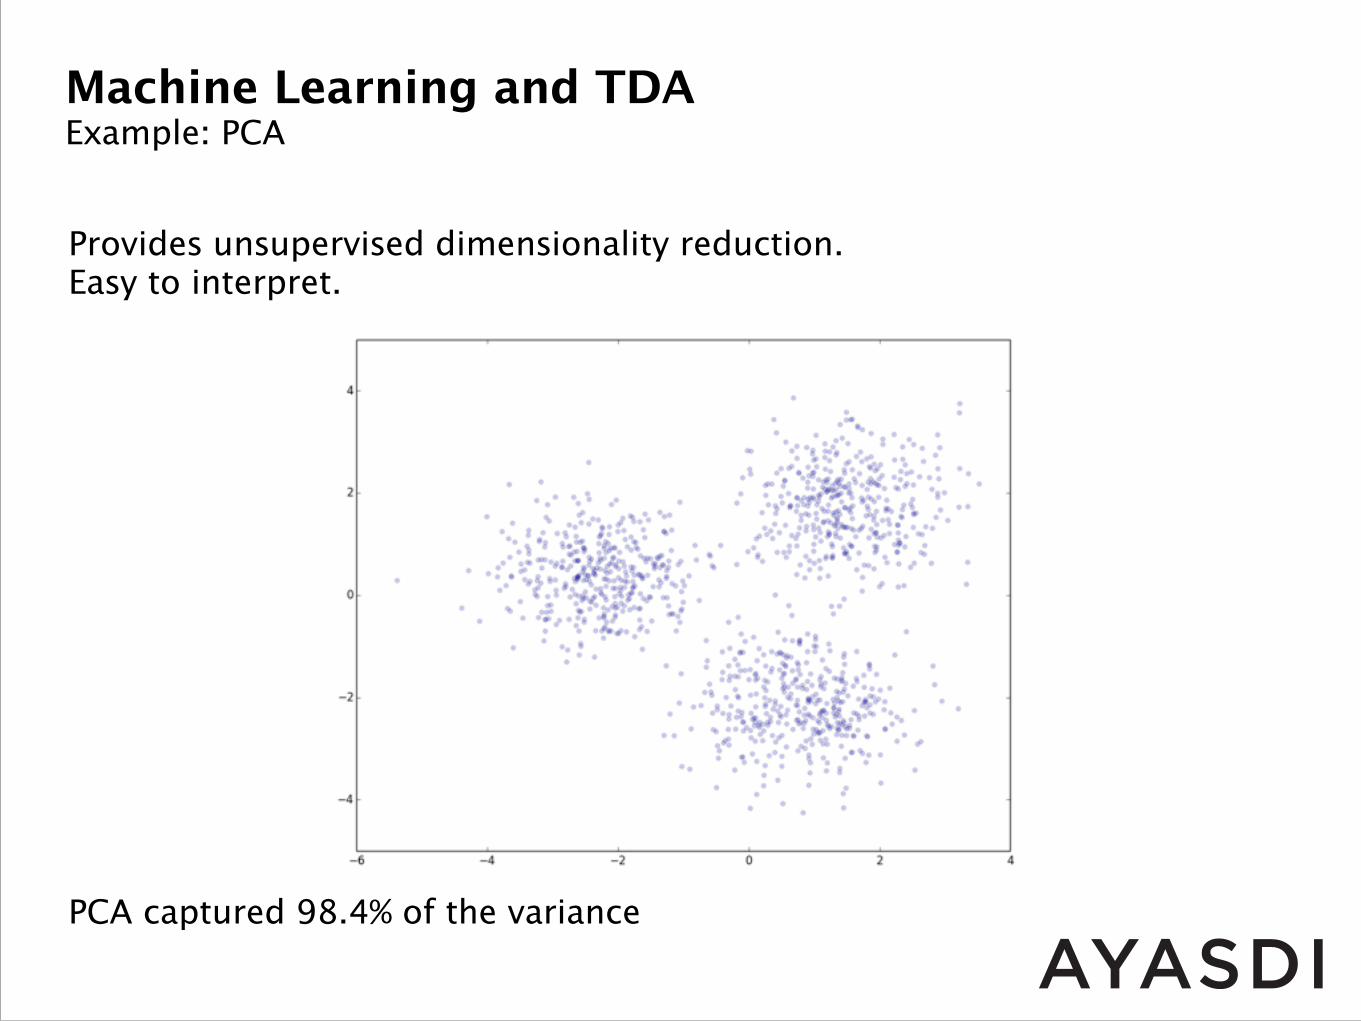
Provides unsupervised dimensionality reduction. Easy to interpret.
Machine Learning and TDA Example: PCA
Provides unsupervised dimensionality reduction. Easy to interpret.
PCA captured 98.4% of the variance
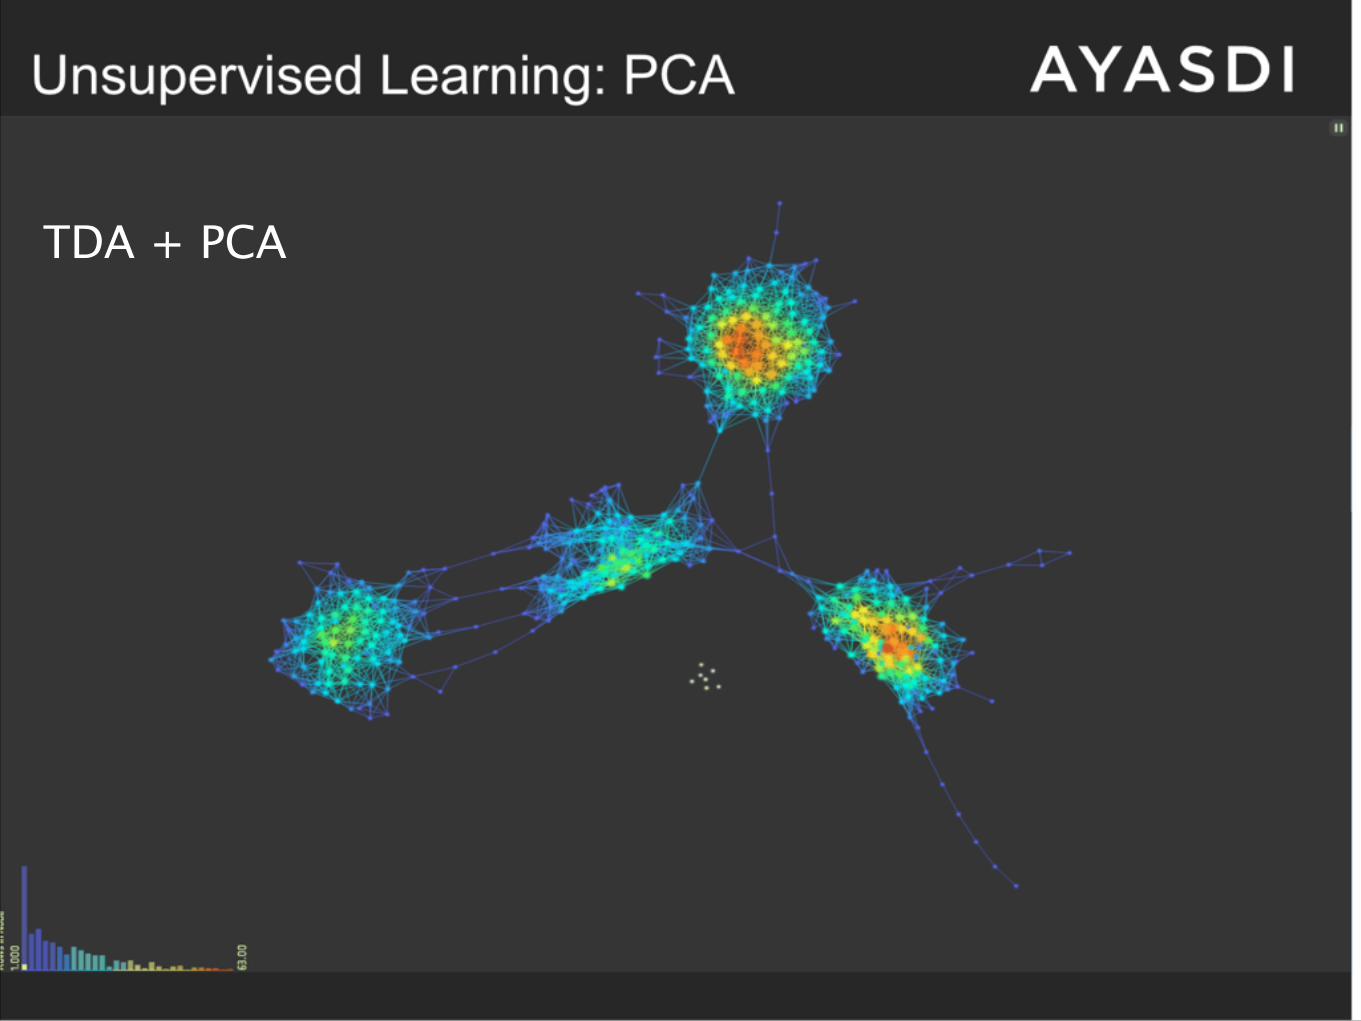
TDA + PCA

TDA + PCA
PCA falsely clusters the data because of the projection !TDA clusters in the inverse image
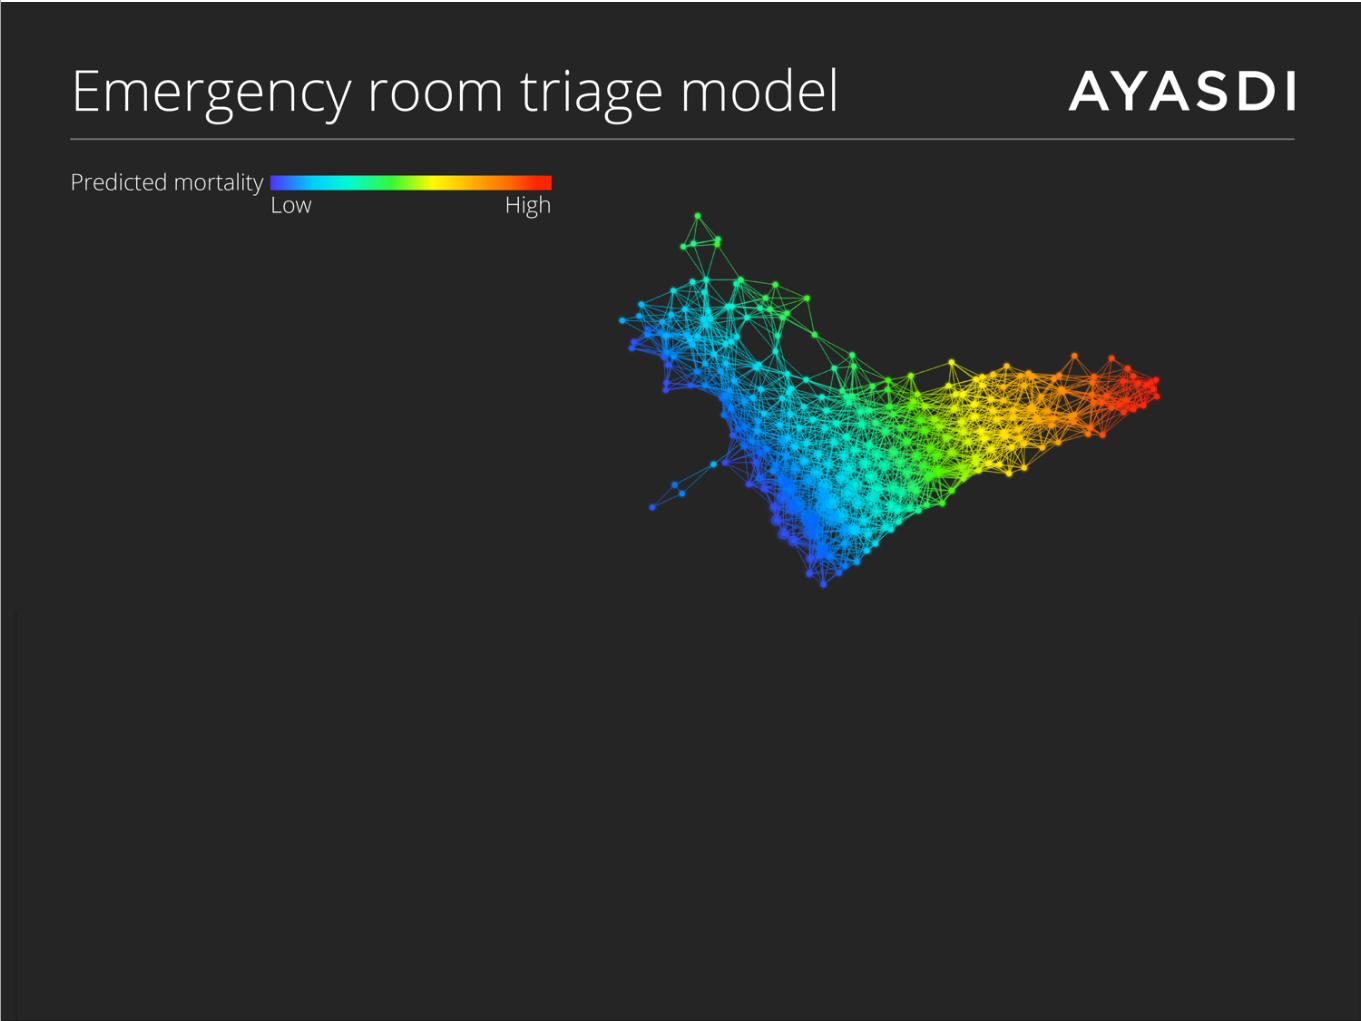
Machine Learning and TDA Example: Model Introspection
TDA tells us where to look for problems and questions
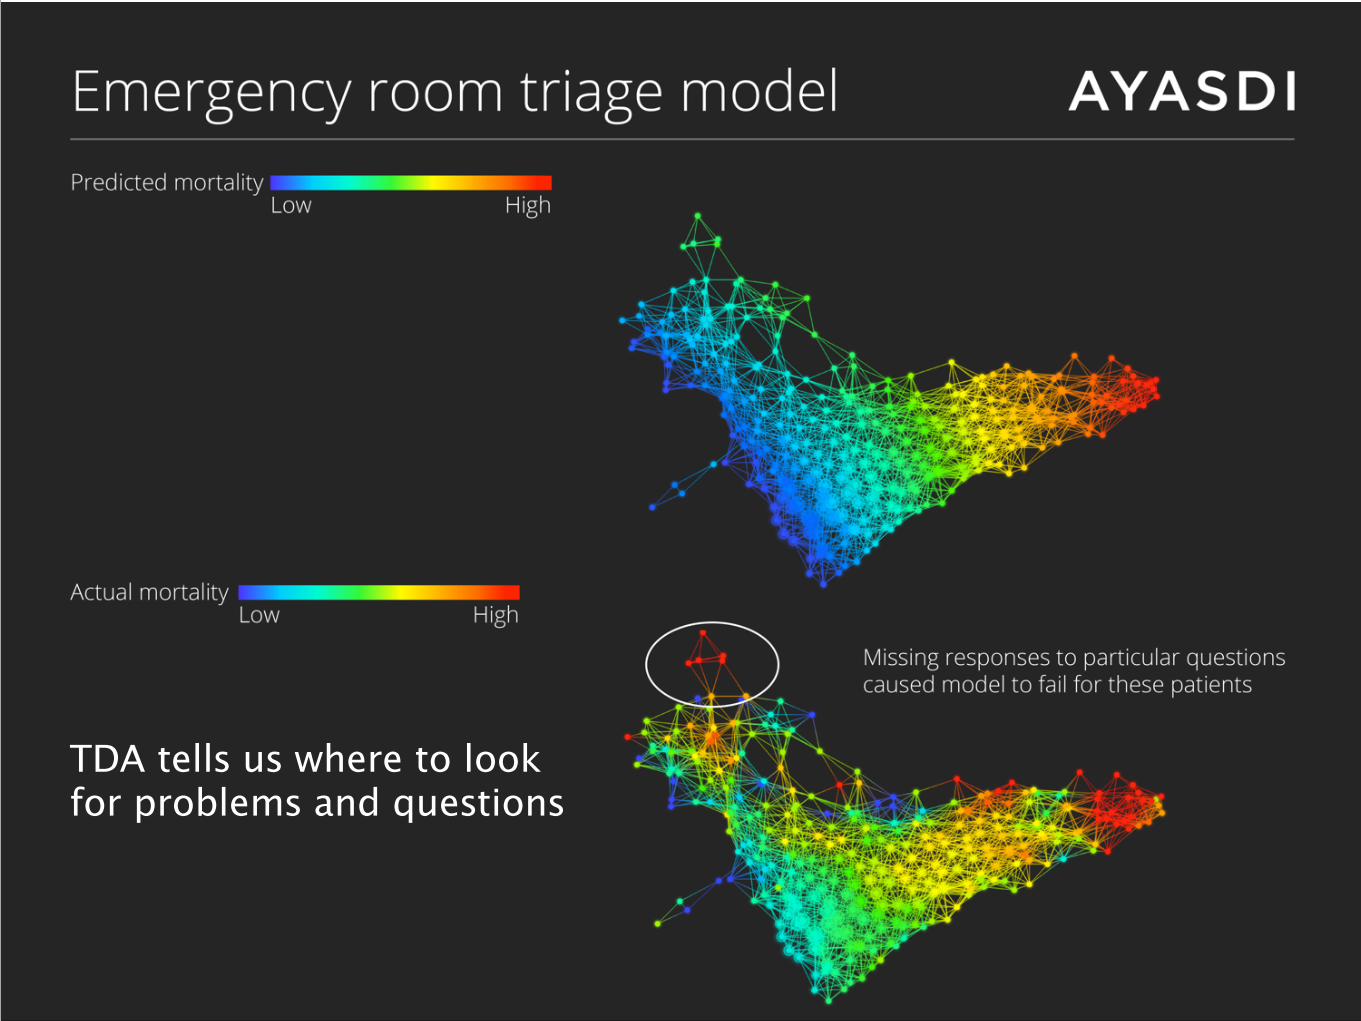
Machine Learning and TDA Example: Model Introspection
TDA tells us where to look for problems and questions
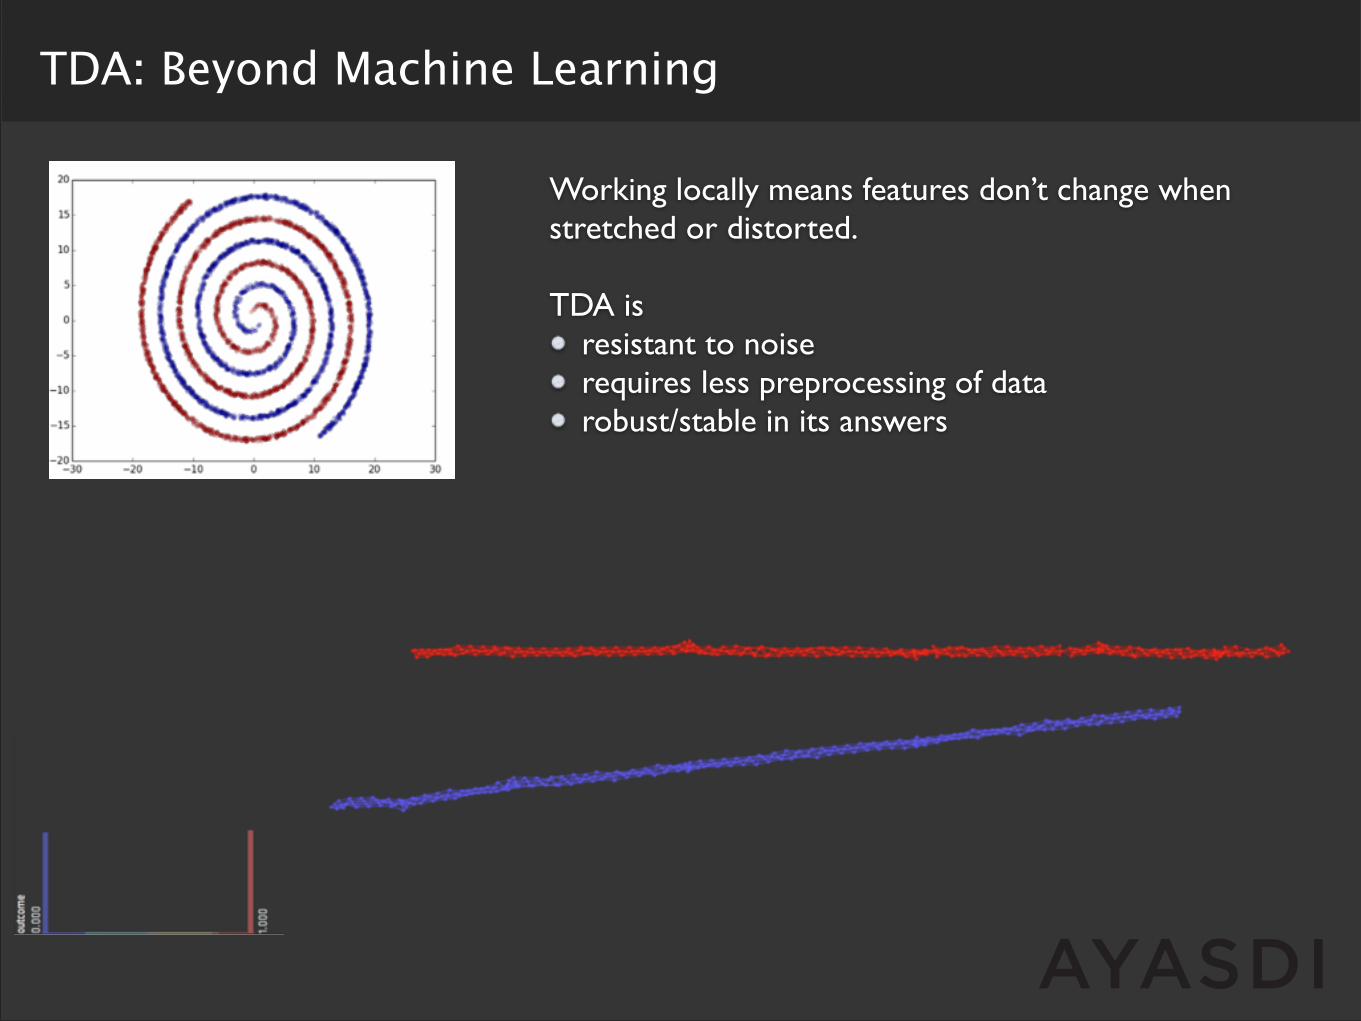
TDA: Beyond Machine Learning
Working locally means features don’t change when stretched or distorted. !TDA is
resistant to noise requires less preprocessing of data robust/stable in its answers
Customer Use Cases
Predictive Maintenance: Industrial Machinery
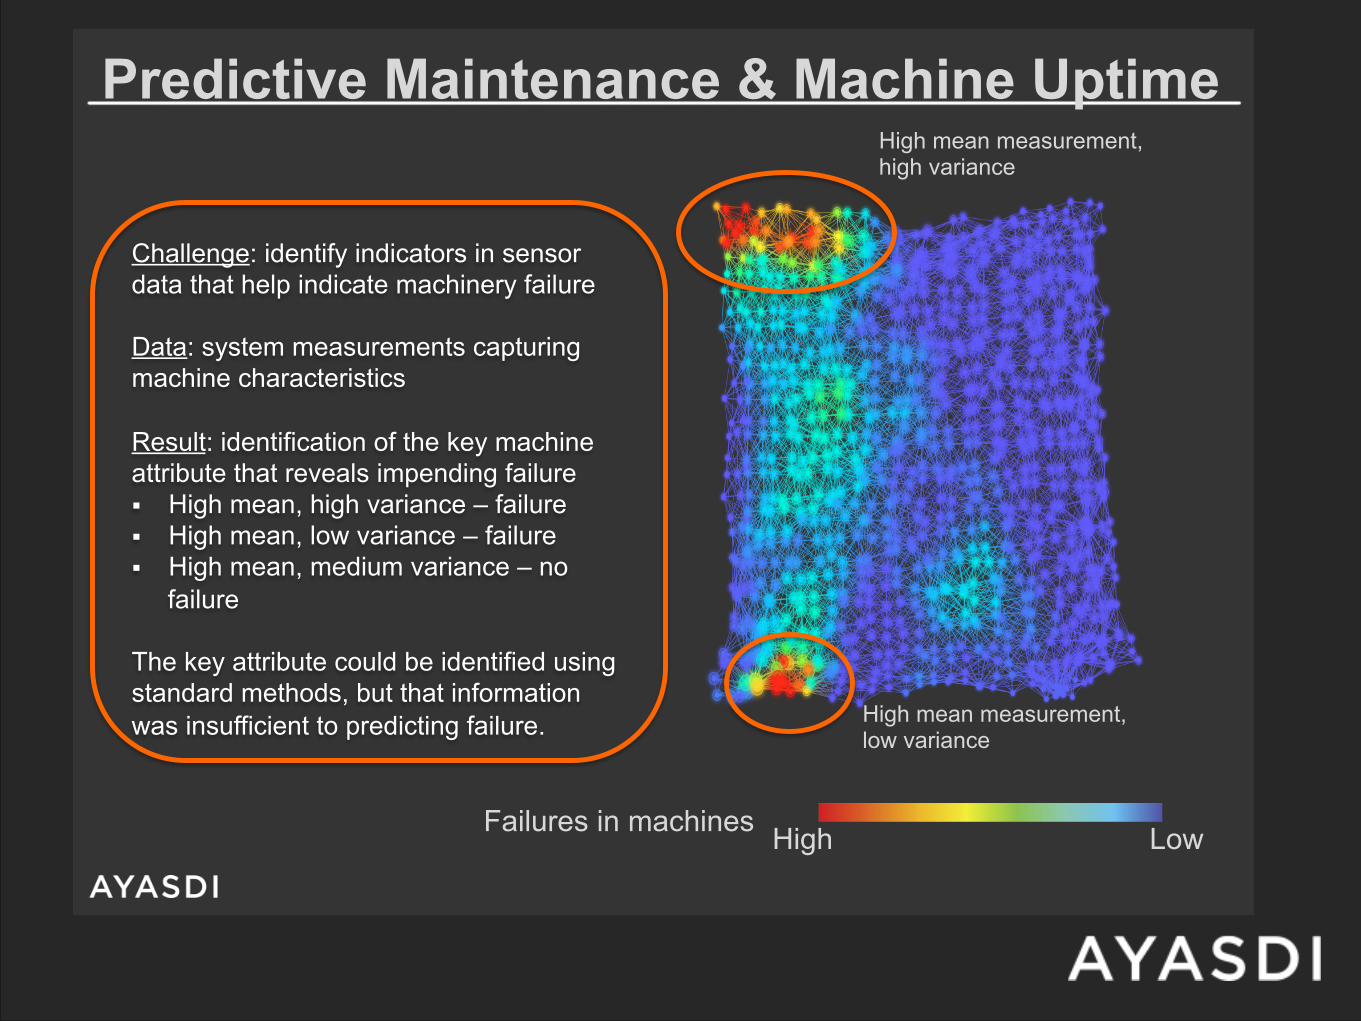
Failures in machines High Low
Predictive Maintenance & Machine Uptime
Challenge: identify indicators in sensor data that help indicate machinery failure Data: system measurements capturing machine characteristics Result: identification of the key machine attribute that reveals impending failure ! High mean, high variance – failure ! High mean, low variance – failure ! High mean, medium variance – no
failure
The key attribute could be identified using standard methods, but that information was insufficient to predicting failure.
High mean measurement, high variance
High mean measurement, low variance
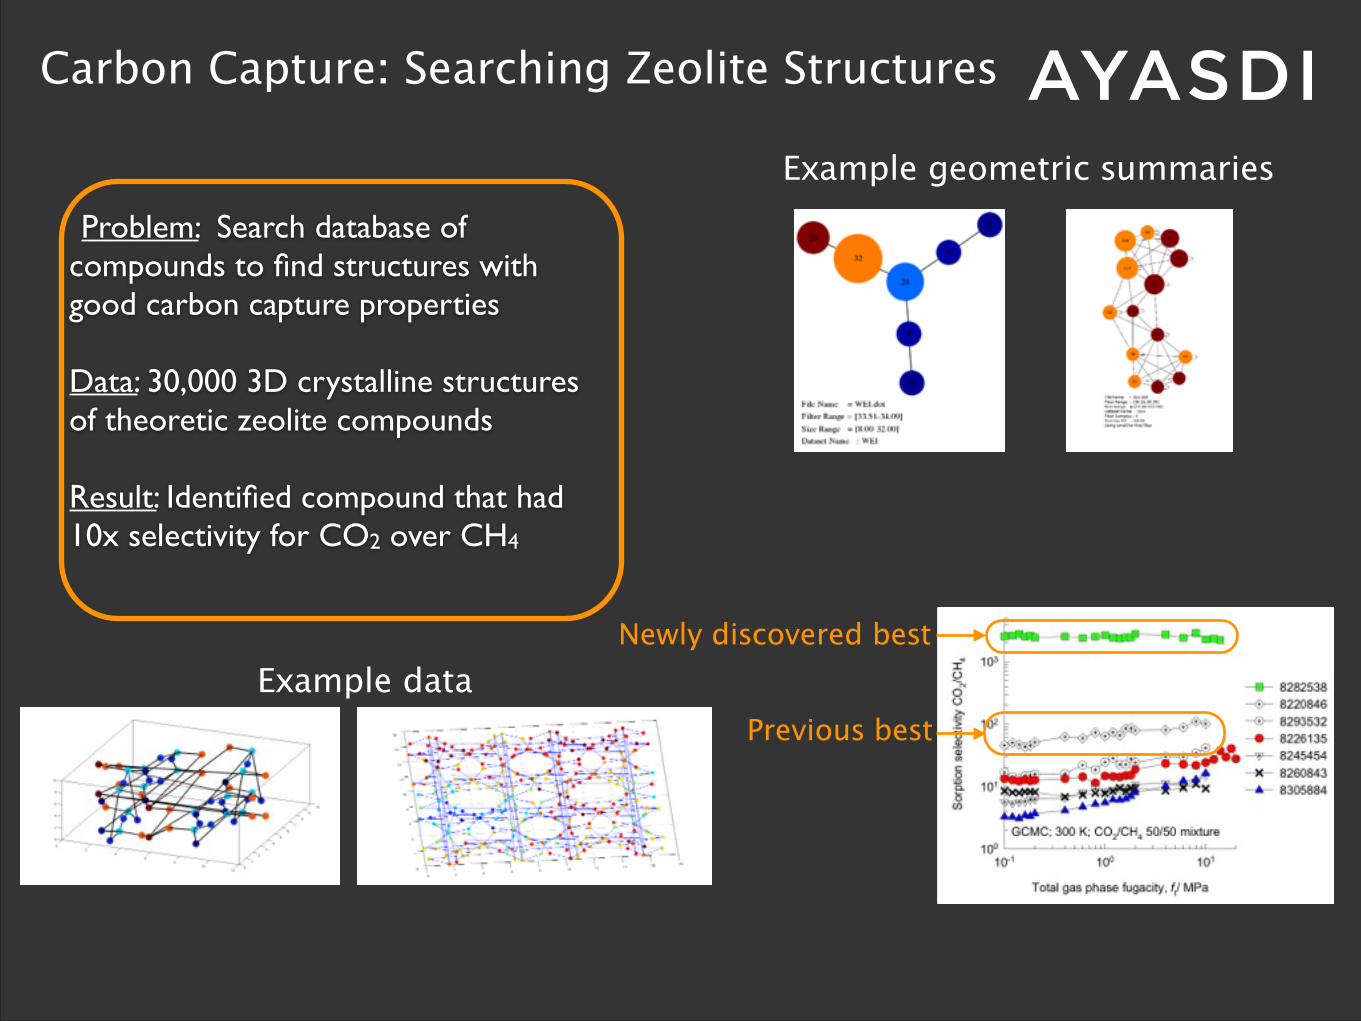
Carbon Capture: Searching Zeolite Structures
Problem: Search database of compounds to find structures with good carbon capture properties !Data: 30,000 3D crystalline structures of theoretic zeolite compounds !Result: Identified compound that had 10x selectivity for CO2 over CH4
Example data
Example geometric summaries
Newly discovered best
Previous best
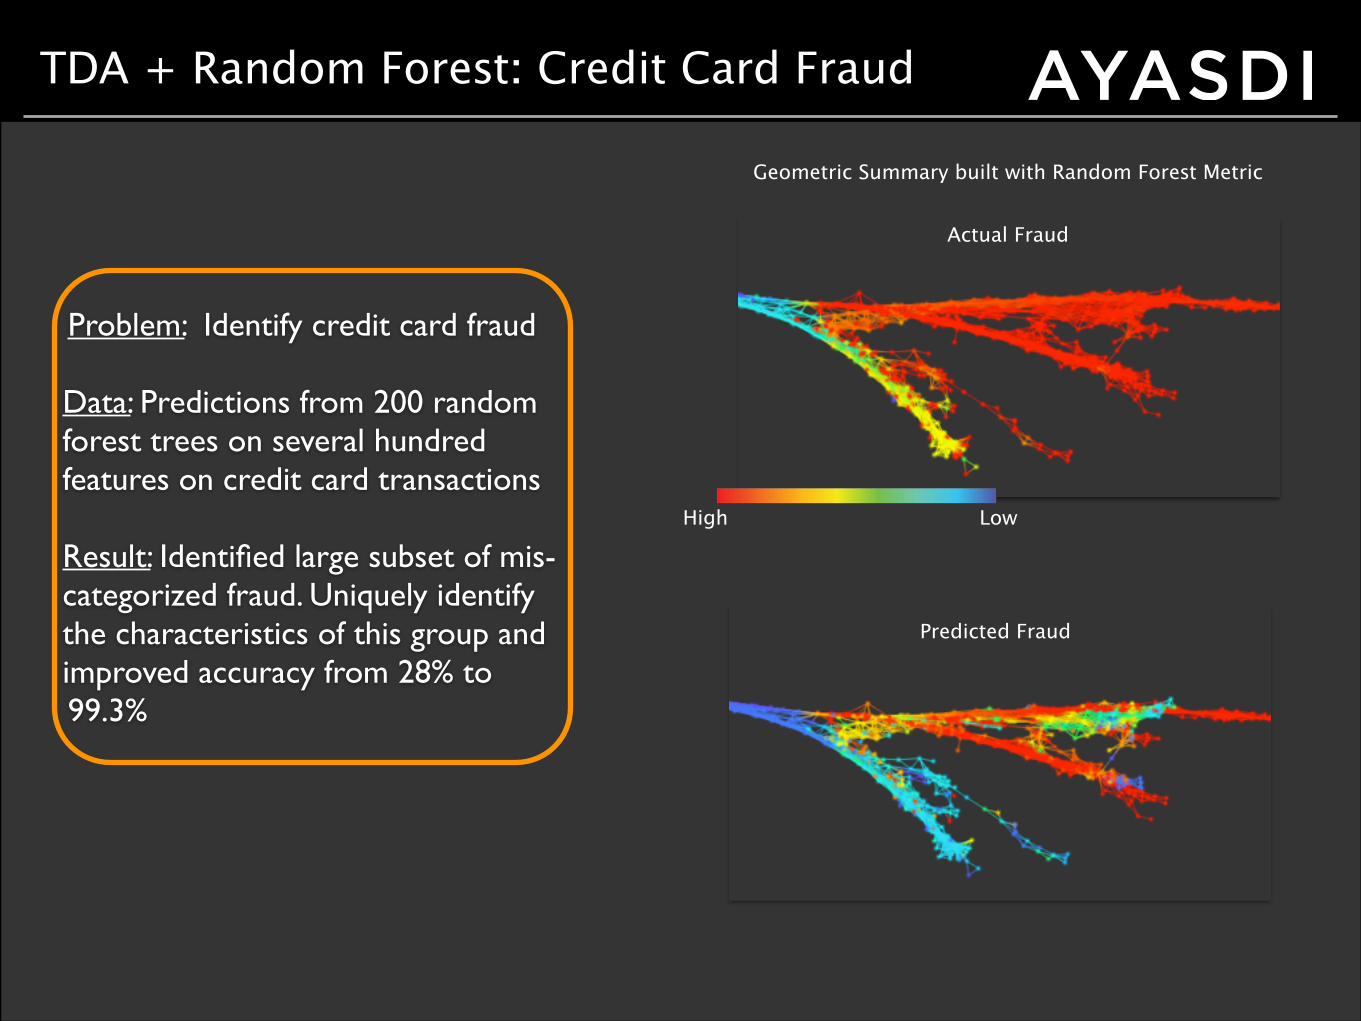
TDA + Random Forest: Credit Card Fraud
Problem: Identify credit card fraud !Data: Predictions from 200 random forest trees on several hundred features on credit card transactions !Result: Identified large subset of mis-categorized fraud. Uniquely identify the characteristics of this group and improved accuracy from 28% to 99.3%
High Low
Geometric Summary built with Random Forest Metric
Actual Fraud
Predicted Fraud
Data has Shape, Shape has Meaning, Meaning drives Value
Topological Data Analysis
Thank you