shape factor calculation and … factor calculation and visualization for the influence of the...
TRANSCRIPT

SHAPE FACTOR CALCULATION AND VISUALIZATION FOR THE INFLUENCE OF THE THERMAL ENVIRONMENT ON THE HUMAN BODY
Masaki Manabe1, Hitoshi Yamazaki2, Koji Sakai1 1Oita University, 700, Dan-no-haru, Oita, 870-1192, Japan
2Kanto Gakuin University, kanazawa-ku, Yokohama, 236-8501, Japan
ABSTRACT The purpose of this paper is to explain the indoor thermal radiation environment of the human body in detail. Using a 3-D human body model, shape factor calculations between a human body and surroundings are executed. First, the shape factor between the human body and each surface of the room is calculated. The human body is placed in the center of the room. The shape factor results are visualized by VRML. Generated VRML images indicate the influence of thermal radiation, which the human body receives from the room surfaces. Second, the shape factor between the human body and surroundings (the room surfaces and some people) is calculated. Some "people influence" on the subject's human body is shown. And the shape factor variation with body position in the room is shown in detail. INTRODUCTION The human body always receives thermal radiation from the environment. Usually, however, each body part receives a different amount of thermal radiation. In order to measure this indoor thermal radiation, it is necessary to calculate shape factors between each fraction of the human body and each surrounding surface. In previous studies, shape factors for the whole body were obtained by photography (Fanger, 1970), or by numerical methods (Olsen, 1989, Tanabe, 2000, Manabe, 2002). In this paper we report the development of a program for these shape factor calculations. SHAPE FACTOR CACULATION BASIC CACULATION PROCEDURE There are several calculation methods to obtain these shape factors. The Hemi-Cube algorithm (Cohen, 1985) is one of the typical methods of calculating shape factor. The algorithm uses the hemi-cube, but we have adopted a calculation method using a virtual cube (Manabe, 2001). The shape factor calculation procedure is outlined as follows. (1) Each face of the cube, except the bottom, is divided into small grid cells. (2) Calculate the shape factor between a fraction of the center of the bottom cube face and each cell (Yamazaki, 1983). (3) Place a virtual cube on a calculation point (Figure 1). (4) Execute a perspective projection of human body on each cubic face (except for the bottom face). (5) The total shape factor for each cell containing the drawn perspective produces the shape factor of the human body.
Figure 1 Virtual cube and calculation point Since the number of grid cells decides the shape factor accuracy, it is necessary to choose a suitable number of divisions. We adopted 90000 divisions of each cubic face. EFFECTIVE RADIATION AREA The effective radiation area is calculated from the shape factor between each fraction of the human body and each surrounding surface. The human body is viewed as consisting of n fractions, in an enclosure consisting of m surfaces. Fij is the shape factor between surface i of the body with area Ai, and surrounding surface j. A part of the body consists of fractions n1 to n2. The following equations represent the effective radiation area Aeff and part of the effective radiation area PAeff.
SHAPE FACTOR OF WALLS Shape factor Fhk between a body and a surrounding surface k is calculated from the following equation using the effective radiation area Aeff.
Therefore, the shape factor Fpk between a surrounding surface and a human body part p is represented by the following equation.
Eighth International IBPSA Conference Eindhoven, Netherlands
August 11-14, 2003
- 791 -- 799 -

Figure 2 Standing nude and clothed models
Figure 3 Seated nude and clothed models
Figure 4 Two walking nude models
EFFECTIVE RADIATION AREA CALCULATION HUMAN BODEY MODEL The cross-sectional shape of a standing nude body (young boy, height 167 cm, weight 60 kg) was measured. Generating triangles between measurement sections, the 3D solid nude human body model was created. Also, measuring the standing body in a business suit, the 3D clothed human body model was created. The 3D standing nude body model consists of 2972 triangles, and the 3D standing clothed body model has the same number of triangles. Rotating joints of the 3D standing body using the body data generation program, the other 3D posture models were created. The created four posture models are: standing nude, standing clothed, seated nude and seated clothed. The other created two models are walking body models: one model is beginning to walk (moving leg) and the other model is walking (moving trunk).
FFECTIVE RADIATION AREA OF HUMAN BODY Shape factor calculations between a human body and surfaces of enclosure have been performed, and the effective radiation area of a human body obtained. Figure 2 shows the standing nude and clothed body model. Figure 3 shows the seated nude and clothed body model. Figure 4 shows two walking nude body models. These figures have colored corresponding parts. Body parts are head, trunk, hands and legs. Table 1 summarizes the calculation results and shows the effective radiation area and factor of the body and parts. Table 1 of (1) - (6) is the body model type and table 1 of (A) - (F) is the body and body parts. Each cell of table 1 consists of two values: body area (upper) and effective radiation area factor (lower). In (1) - (4) line, cells of body parts (E) and (F) have values for a hand or a leg, because of their symmetrical shape. But In (5) - (6) line, cells of body parts (E) and (F) are right and left. These values of cells indicate that different postures have different values. The effective radiation area factor of the nude body is from large to small in the order of the seated body, standing body and walking body. And clothed bodies are in the same order. Because body posture has shifted to a more open state from a more compact state, the body is more easily influenced by thermal radiation. SHAPE FACTOR DISTRIBUTION MAP OF HUMAN BODY Shape factor simulations between a human body and room surfaces are executed and the results are visualized for the purpose of understanding the details of the influence of the thermal radiation environment on the human body. A human body was placed at the center on the floor, and the shape factor between the body and a room surface was calculated. The subject human body is the standing nude, and the room size (WDH) is 10x9x3 [m]. The simulation model is shown in Figure 5.
(A)Body
(B)Head
(C) Trunk (front)
(D) Trunk (back)
(E) Arm
(F)Leg
(1)Standing Nude
1.71 0.80
0.13 0.96
0.29 0.82
0.28 0.82
0.27 0.56
0.73 0.84
(2)StandingClothed
2.13 0.76
0.13 0.95
0.35 0.79
0.33 0.80
0.36 0.51
0.95 0.80
(3)Seated Nude
1.72 0.75
0.13 0.96
0.26 0.75
0.32 0.84
0.27 0.56
0.74 0.74
(4)Seated Clothed
2.18 0.71
0.13 0.94
0.30 0.71
0.39 0.85
0.36 0.50
1.00 0.71
(right) 0.14 0.65
(right) 0.37 0.85
(5) Walking1 Nude
1.71 0.82
0.13 0.96
0.29 0.85
0.28 0.84
(left) 0.14 0.65
(left) 0.37 0.82
(right) 0.14 0.65
(right) 0.37 0.87
(6) Walking2 Nude
1.71 0.83
0.13 0.96
0.29 0.85
0.28 0.85
(left) 0.14 0.65
(left) 0.37 0.87
Table 1 Effective radiation area factor (Upper: body area [m2], Lower: effective radiation area factor)
- 792 -- 800 -
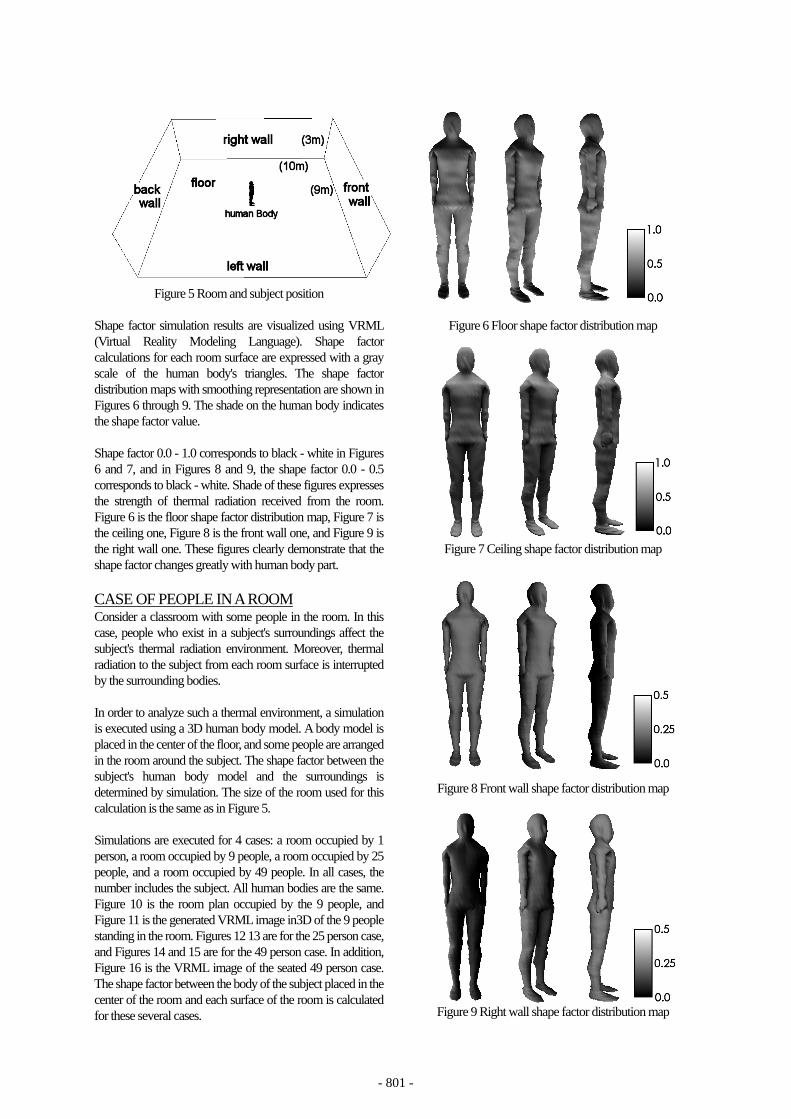
Figure 5 Room and subject position Shape factor simulation results are visualized using VRML (Virtual Reality Modeling Language). Shape factor calculations for each room surface are expressed with a gray scale of the human body's triangles. The shape factor distribution maps with smoothing representation are shown in Figures 6 through 9. The shade on the human body indicates the shape factor value. Shape factor 0.0 - 1.0 corresponds to black - white in Figures 6 and 7, and in Figures 8 and 9, the shape factor 0.0 - 0.5 corresponds to black - white. Shade of these figures expresses the strength of thermal radiation received from the room. Figure 6 is the floor shape factor distribution map, Figure 7 is the ceiling one, Figure 8 is the front wall one, and Figure 9 is the right wall one. These figures clearly demonstrate that the shape factor changes greatly with human body part. CASE OF PEOPLE IN A ROOM Consider a classroom with some people in the room. In this case, people who exist in a subject's surroundings affect the subject's thermal radiation environment. Moreover, thermal radiation to the subject from each room surface is interrupted by the surrounding bodies. In order to analyze such a thermal environment, a simulation is executed using a 3D human body model. A body model is placed in the center of the floor, and some people are arranged in the room around the subject. The shape factor between the subject's human body model and the surroundings is determined by simulation. The size of the room used for this calculation is the same as in Figure 5. Simulations are executed for 4 cases: a room occupied by 1 person, a room occupied by 9 people, a room occupied by 25 people, and a room occupied by 49 people. In all cases, the number includes the subject. All human bodies are the same. Figure 10 is the room plan occupied by the 9 people, and Figure 11 is the generated VRML image in3D of the 9 people standing in the room. Figures 12 13 are for the 25 person case, and Figures 14 and 15 are for the 49 person case. In addition, Figure 16 is the VRML image of the seated 49 person case. The shape factor between the body of the subject placed in the center of the room and each surface of the room is calculated for these several cases.
Figure 6 Floor shape factor distribution map
Figure 7 Ceiling shape factor distribution map
Figure 8 Front wall shape factor distribution map
Figure 9 Right wall shape factor distribution map
- 793 -- 801 -
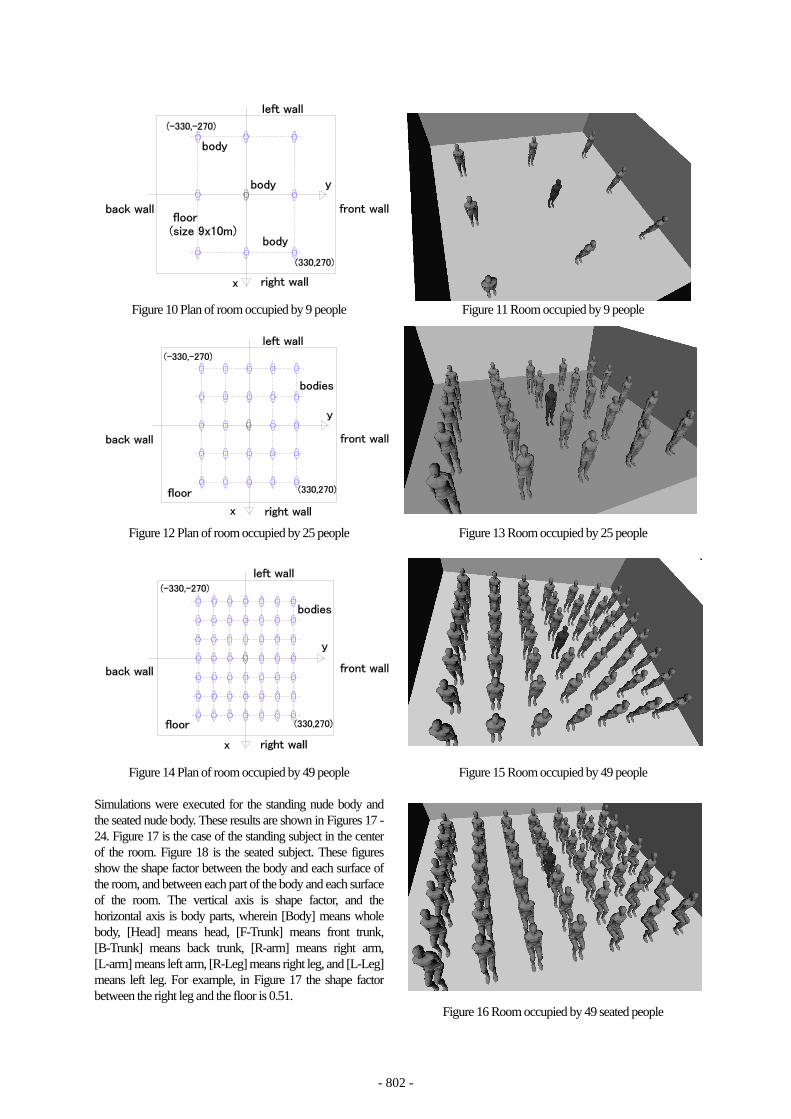
Figure 10 Plan of room occupied by 9 people
Figure 12 Plan of room occupied by 25 people
Figure 14 Plan of room occupied by 49 people
Simulations were executed for the standing nude body and the seated nude body. These results are shown in Figures 17 - 24. Figure 17 is the case of the standing subject in the center of the room. Figure 18 is the seated subject. These figures show the shape factor between the body and each surface of the room, and between each part of the body and each surface of the room. The vertical axis is shape factor, and the horizontal axis is body parts, wherein [Body] means whole body, [Head] means head, [F-Trunk] means front trunk, [B-Trunk] means back trunk, [R-arm] means right arm, [L-arm] means left arm, [R-Leg] means right leg, and [L-Leg] means left leg. For example, in Figure 17 the shape factor between the right leg and the floor is 0.51.
Figure 11 Room occupied by 9 people
Figure 13 Room occupied by 25 people
Figure 15 Room occupied by 49 people
Figure 16 Room occupied by 49 seated people
- 794 -- 802 -
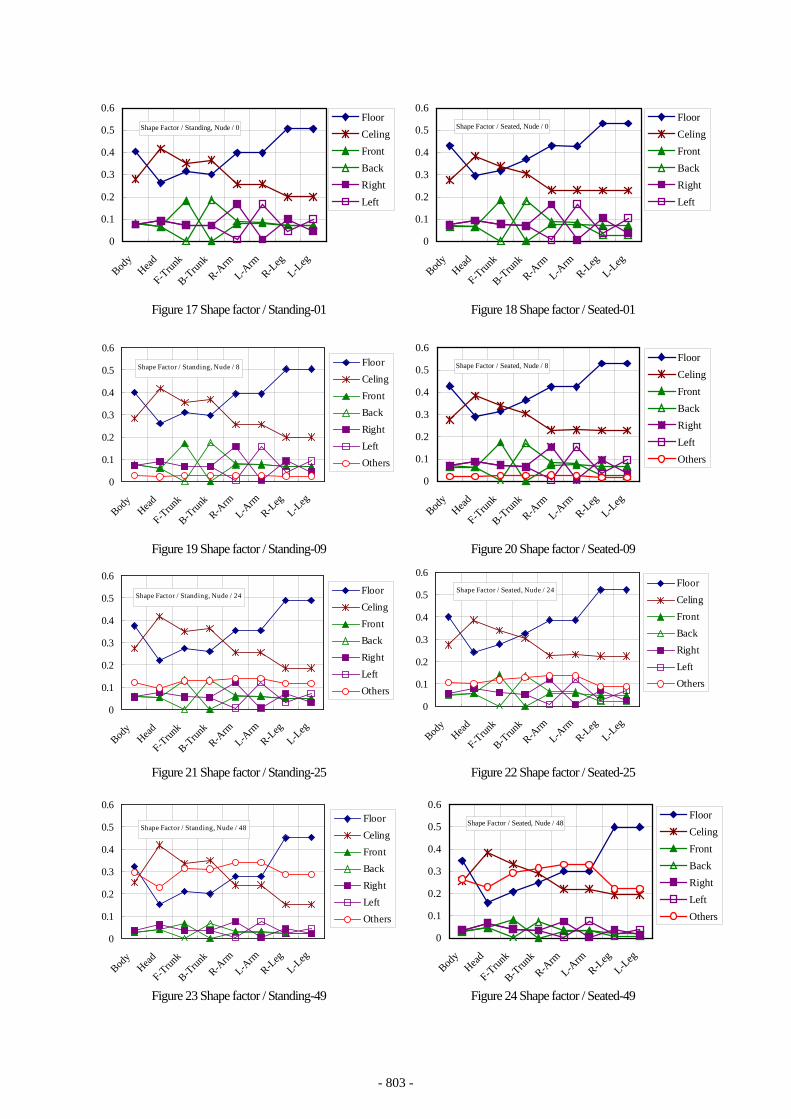
Figure 17 Shape factor / Standing-01
Figure 19 Shape factor / Standing-09
Figure 21 Shape factor / Standing-25
Figure 23 Shape factor / Standing-49
Figure 18 Shape factor / Seated-01
Figure 20 Shape factor / Seated-09
Figure 22 Shape factor / Seated-25
Figure 24 Shape factor / Seated-49
Shape Factor / Standing, Nude / 0
0
0.1
0.2
0.3
0.4
0.5
0.6
Body
Head
F-Trun
k
B-Trun
kR-A
rmL-A
rmR-L
egL-L
eg
FloorCelingFrontBackRightLeft
Shape Factor / Standing, Nude / 8
0
0.1
0.2
0.3
0.4
0.5
0.6
Body
Head
F-Trun
k
B-Trun
kR-A
rmL-A
rmR-L
egL-L
eg
FloorCelingFrontBackRightLeftOthers
Shape Factor / Standing, Nude / 24
0
0.1
0.2
0.3
0.4
0.5
0.6
Body
Head
F-Trun
k
B-Trun
kR-A
rmL-A
rmR-L
egL-L
eg
FloorCelingFrontBackRightLeftOthers
Shape Factor / Standing, Nude / 48
0
0.1
0.2
0.3
0.4
0.5
0.6
Body
Head
F-Trun
k
B-Trun
kR-A
rmL-A
rmR-L
egL-L
eg
FloorCelingFrontBackRightLeftOthers
Shape Factor / Seated, Nude / 0
0
0.1
0.2
0.3
0.4
0.5
0.6
Body
Head
F-Trun
k
B-Trun
kR-A
rmL-A
rmR-L
egL-L
eg
FloorCelingFrontBackRightLeft
Shape Factor / Seated, Nude / 8
0
0.1
0.2
0.3
0.4
0.5
0.6
Body
Head
F-Trun
k
B-Trun
kR-A
rmL-A
rmR-L
egL-L
eg
FloorCelingFrontBackRightLeftOthers
Shape Factor / Seated, Nude / 24
0
0.1
0.2
0.3
0.4
0.5
0.6
Body
Head
F-Trun
k
B-Trun
kR-A
rmL-A
rmR-L
egL-L
eg
FloorCelingFrontBackRightLeftOthers
Shape Factor / Seated, Nude / 48
0
0.1
0.2
0.3
0.4
0.5
0.6
Body
Head
F-Trun
k
B-Trun
kR-A
rmL-A
rmR-L
egL-L
eg
FloorCelingFrontBackRightLeftOthers
- 795 -- 803 -
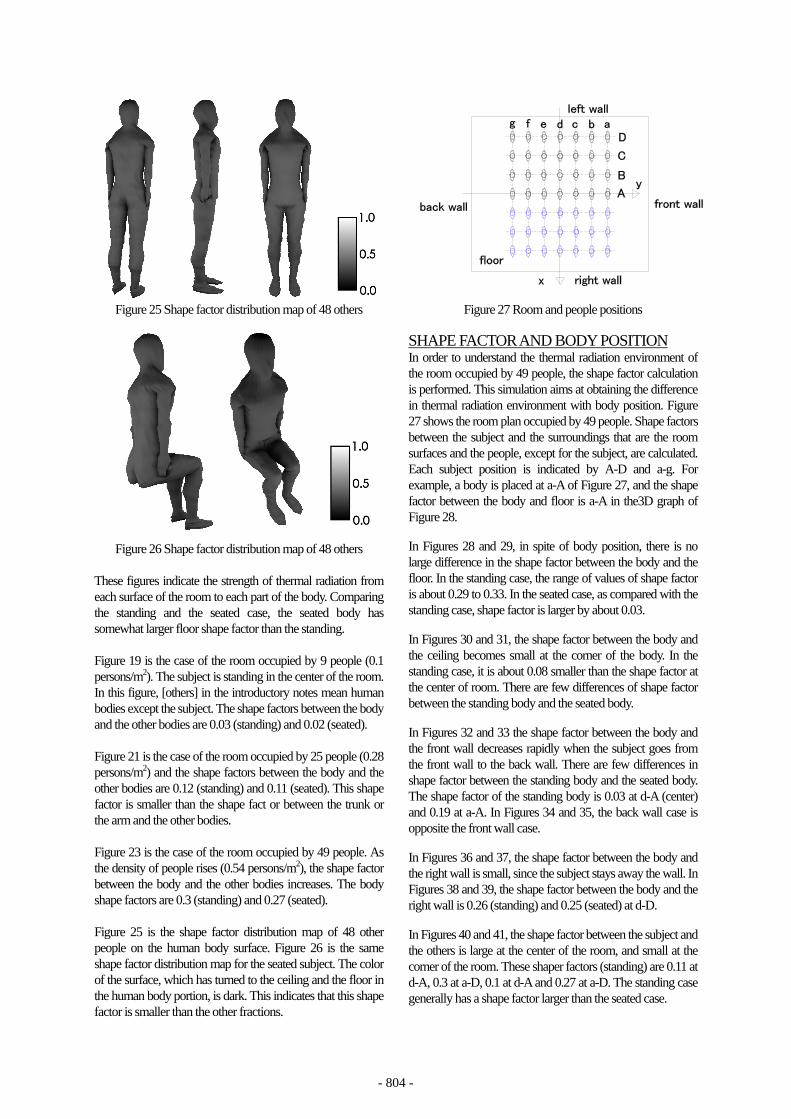
Figure 25 Shape factor distribution map of 48 others
Figure 26 Shape factor distribution map of 48 others
These figures indicate the strength of thermal radiation from each surface of the room to each part of the body. Comparing the standing and the seated case, the seated body has somewhat larger floor shape factor than the standing. Figure 19 is the case of the room occupied by 9 people (0.1 persons/m2). The subject is standing in the center of the room. In this figure, [others] in the introductory notes mean human bodies except the subject. The shape factors between the body and the other bodies are 0.03 (standing) and 0.02 (seated). Figure 21 is the case of the room occupied by 25 people (0.28 persons/m2) and the shape factors between the body and the other bodies are 0.12 (standing) and 0.11 (seated). This shape factor is smaller than the shape fact or between the trunk or the arm and the other bodies. Figure 23 is the case of the room occupied by 49 people. As the density of people rises (0.54 persons/m2), the shape factor between the body and the other bodies increases. The body shape factors are 0.3 (standing) and 0.27 (seated). Figure 25 is the shape factor distribution map of 48 other people on the human body surface. Figure 26 is the same shape factor distribution map for the seated subject. The color of the surface, which has turned to the ceiling and the floor in the human body portion, is dark. This indicates that this shape factor is smaller than the other fractions.
Figure 27 Room and people positions SHAPE FACTOR AND BODY POSITION In order to understand the thermal radiation environment of the room occupied by 49 people, the shape factor calculation is performed. This simulation aims at obtaining the difference in thermal radiation environment with body position. Figure 27 shows the room plan occupied by 49 people. Shape factors between the subject and the surroundings that are the room surfaces and the people, except for the subject, are calculated. Each subject position is indicated by A-D and a-g. For example, a body is placed at a-A of Figure 27, and the shape factor between the body and floor is a-A in the3D graph of Figure 28. In Figures 28 and 29, in spite of body position, there is no large difference in the shape factor between the body and the floor. In the standing case, the range of values of shape factor is about 0.29 to 0.33. In the seated case, as compared with the standing case, shape factor is larger by about 0.03. In Figures 30 and 31, the shape factor between the body and the ceiling becomes small at the corner of the body. In the standing case, it is about 0.08 smaller than the shape factor at the center of room. There are few differences of shape factor between the standing body and the seated body. In Figures 32 and 33 the shape factor between the body and the front wall decreases rapidly when the subject goes from the front wall to the back wall. There are few differences in shape factor between the standing body and the seated body. The shape factor of the standing body is 0.03 at d-A (center) and 0.19 at a-A. In Figures 34 and 35, the back wall case is opposite the front wall case. In Figures 36 and 37, the shape factor between the body and the right wall is small, since the subject stays away the wall. In Figures 38 and 39, the shape factor between the body and the right wall is 0.26 (standing) and 0.25 (seated) at d-D. In Figures 40 and 41, the shape factor between the subject and the others is large at the center of the room, and small at the corner of the room. These shaper factors (standing) are 0.11 at d-A, 0.3 at a-D, 0.1 at d-A and 0.27 at a-D. The standing case generally has a shape factor larger than the seated case.
- 796 -- 804 -

Figure 28 Floor shape factors in the room (Standing)
Figure 30 Ceiling shape factors in the room (Standing)
Figure 32 Front wall shape factors in the room (Standing)
Figure 34 Back wall shape factors in the room (Standing)
Figure 29 Floor shape factors in the room (Seated)
Figure 31 Ceiling shape factors in the room (Seated)
Figure 33 Front wall shape factors in the room (Seated)
Figure 35 Back wall shape factors in the room (Seated)
gf
ed
cb
a A
B
C
D
00.050.1
0.150.2
0.250.3
0.35
0.4
shape factor
FloorStanding, Nude / 48
0.35-0.4
0.3-0.350.25-0.30.2-0.25
0.15-0.20.1-0.150.05-0.1
0-0.05
gf
ed
cb
a A
B
C
D
00.050.1
0.150.2
0.250.3
0.350.4
shape factor
CeilingStanding, Nude / 48
0.35-0.4
0.3-0.350.25-0.30.2-0.25
0.15-0.20.1-0.15
0.05-0.10-0.05
gf
ed
cb
a A
B
C
D
00.050.1
0.150.2
0.250.3
0.35
0.4
shape factor
Front wallStanding, Nude / 48
0.35-0.4
0.3-0.350.25-0.30.2-0.25
0.15-0.20.1-0.15
0.05-0.10-0.05
gf
ed
cb
a A
B
C
D
00.050.1
0.150.2
0.250.3
0.35
0.4
shape factor
Back wallStanding, Nude / 48
0.35-0.4
0.3-0.350.25-0.30.2-0.25
0.15-0.20.1-0.15
0.05-0.10-0.05
gf
ed
cb
a A
B
C
D
00.050.1
0.150.2
0.250.3
0.350.4
shape factor
FloorSeated, Nude / 48
0.35-0.4
0.3-0.35
0.25-0.3
0.2-0.25
0.15-0.2
0.1-0.15
0.05-0.1
0-0.05
gf
ed
cb
a A
B
C
D
00.050.1
0.150.2
0.250.3
0.350.4
shape factor
CeilingSeated, Nude / 48
0.35-0.4
0.3-0.35
0.25-0.3
0.2-0.25
0.15-0.2
0.1-0.15
0.05-0.1
0-0.05
gf
ed
cb
a A
B
C
D
00.050.1
0.150.2
0.250.3
0.35
0.4
shape factor
Front wallSeated, Nude / 48
0.35-0.4
0.3-0.35
0.25-0.3
0.2-0.25
0.15-0.2
0.1-0.15
0.05-0.1
0-0.05
gf
ed
cb
a A
B
C
D
00.050.1
0.150.2
0.250.3
0.35
0.4
shape factor
Back wallSeated, Nude / 48
0.35-0.4
0.3-0.35
0.25-0.3
0.2-0.25
0.15-0.2
0.1-0.15
0.05-0.1
0-0.05
- 797 -- 805 -

Figure 36 Right wall shape factors in the room (Standing)
Figure 38 Left wall shape factors in the room (Standing) Figure 40 Other persons shape factors in the room (Standing) CONCLUSION In order to understand the indoor thermal radiation environment in detail, the shape factor simulation is executed. Shape factors are calculated by the method shown in this paper. The calculation result is visualized by VRML. The shape factor distribution map, which indicates the influence of thermal radiation from the surroundings to the human body, is expressed as shading on the 3D human body model. The simulation is executed for situations where the room is occupied by various numbers of people, and the influence of thermal radiation from the others on the subject is presented. In the case of the room occupied by 49 people, the shape factor between the subject in the center of the room and the others is 0.3. Moreover, the simulation indicates the difference in thermal radiation environment depending on body position in the room.
Figure 37 Right wall shape factors in the room (Seated)
Figure 39 Left wall shape factors in the room (Seated) Figure 41 Other persons shape factors in the room (Seated)
REFERENCES Cohen,F and Greenberg,P, 1985. The Hemi-Cube A Radiosity
Solution for Complex Environments, SIGRAPH85. Fanger, P.O.,et al., 1970. Radiation Data for the Human Body,
ASHARE Trans., Vol.76-II. Manabe,M., et al. 2002. Shape Factor Simulation Between a
Human Body and a Room Using Scan Line, The 10th ICEE. Manabe,M, et al., 2001. Daylighting Simulation of Japanese
Architecture Using All Sky Model, Building Simulation 2001. Olsen,B.W, et al., 1989. Methods for Measuring and Evaluating
the Thermal Radiation in a Room, ASHARE Trans., Vol.95-II. Tanabe,S., et al. 2000, Effective radiation area of human body
calculated by a numerical simulation, Energy and Buildings 32.
Yamazaki,H., 1983. Shape Factor Calculation and Computer Graphics. The 4th International Symposium on the Use of Computers for Environmental Engineering Related Buildings.
gf
ed
cb
a A
B
C
D
00.050.1
0.150.2
0.250.3
0.35
0.4
shape factor
Right wallStanding, Nude / 48
0.35-0.4
0.3-0.35
0.25-0.3
0.2-0.25
0.15-0.2
0.1-0.15
0.05-0.1
0-0.05
gf
ed
cb
a A
B
C
D
00.050.1
0.150.2
0.250.3
0.35
0.4
shape factor
Left wallStanding, Nude / 48
0.35-0.4
0.3-0.35
0.25-0.3
0.2-0.25
0.15-0.2
0.1-0.15
0.05-0.1
0-0.05
gf
ed
cb
a A
B
C
D
00.050.1
0.150.2
0.250.3
0.35
0.4
shape factor
Other personsStanding, Nude / 48
0.35-0.4
0.3-0.35
0.25-0.3
0.2-0.25
0.15-0.2
0.1-0.15
0.05-0.1
0-0.05
gf
ed
cb
a A
B
C
D
00.050.1
0.150.2
0.250.3
0.35
0.4
shape factor
Right wallSeated, Nude / 48
0.35-0.4
0.3-0.35
0.25-0.3
0.2-0.25
0.15-0.2
0.1-0.15
0.05-0.1
0-0.05
gf
ed
cb
a A
B
C
D
00.050.1
0.150.2
0.250.3
0.350.4
shape factor
Left wallSeated, Nude / 48
0.35-0.4
0.3-0.35
0.25-0.3
0.2-0.25
0.15-0.2
0.1-0.15
0.05-0.1
0-0.05
gf
ed
cb
a A
B
C
D
00.050.1
0.150.2
0.250.3
0.35
0.4
shape factor
Other personsSeated, Nude / 48
0.35-0.4
0.3-0.35
0.25-0.3
0.2-0.25
0.15-0.2
0.1-0.15
0.05-0.1
0-0.05
- 798 -- 806 -