shane theriault pierre-olivier lachance garik theriault sierra daigle
TRANSCRIPT

Strategic Management Plan
Shane TheriaultPierre-Olivier Lachance
Garik TheriaultSierra Daigle
2
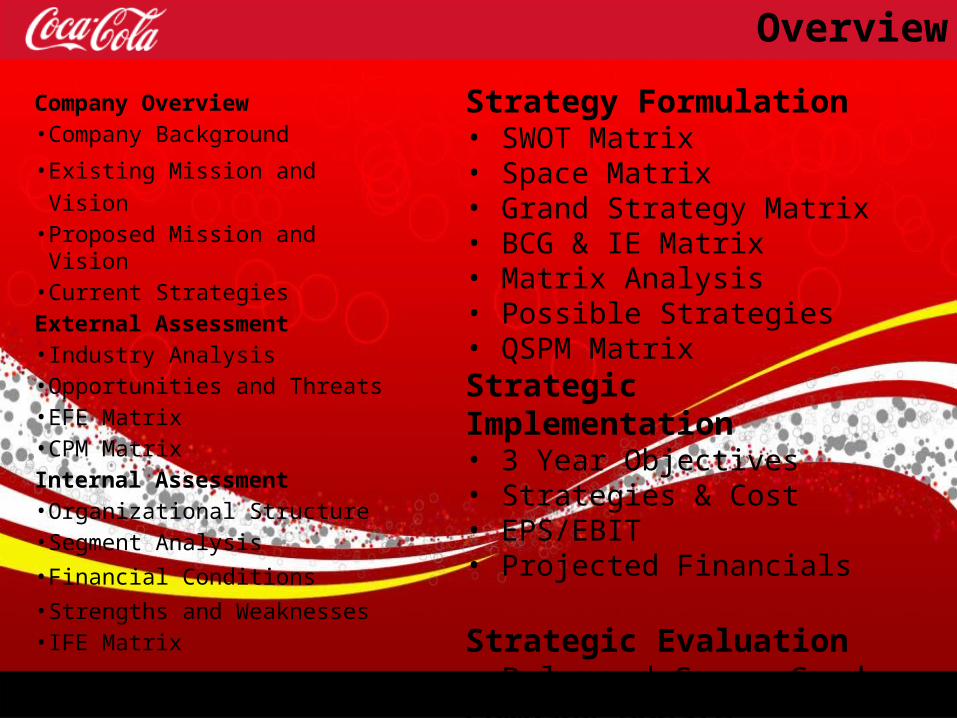
Overview
Company Overview• Company Background
• Existing Mission and Vision• Proposed Mission and Vision• Current StrategiesExternal Assessment• Industry Analysis• Opportunities and Threats • EFE Matrix• CPM MatrixInternal Assessment• Organizational Structure• Segment Analysis• Financial Conditions• Strengths and Weaknesses• IFE Matrix
Strategy Formulation• SWOT Matrix• Space Matrix• Grand Strategy Matrix• BCG & IE Matrix• Matrix Analysis• Possible Strategies• QSPM MatrixStrategic Implementation• 3 Year Objectives• Strategies & Cost• EPS/EBIT• Projected FinancialsStrategic Evaluation• Balanced Score CardCompany Update

3
Company Background: Origins
Coca Cola Animated History

4
Company Background: History
• 1928 – Coca-Cola traveled with the US Olympics team to Amsterdam, and began global expansion
• 1935 – Coca-Cola was certified Kosher by Rabbi Tobias Geffen
• 1941 – Fanta is introduced in World War II during a trade embargo against Germany on cola syrup
• 1944 – The one billionth gallon of Coca-Cola Syrup was made
• 1963 – Coca-Cola’s first attempt to make a diet drink using saccharin
• 1982 - Coca-Cola purchased Columbia Pictures, sold to Sony in 1989
• 1985 – New Coke was presented to test tasters who enjoyed it better then Coke and Pepsi; however, top management kept the old formula “Coca-Cola Classic” (which uses a high fructose corn syrup as sweeter instead of the proposed sugar can) in order to avoid possible backlash from customers. It is now only available in select countries
• 1990s – Introduction of healthier beverages including Minute Maid Juices to Go, Powerade sports beverage, flavored tea Nestea (in a joint venture with Nestle), Fruitopia fruit drink and Dasani water
• 2007 – World of Coca-Cola was built

5
Company Background: Owned Brands
6
Existing Vision Statement
People: Be a great place to work where people are inspired to be the best they can be.Portfolio: Bring to the world a portfolio of quality beverage brands that anticipate and satisfy people's desires and needs.Partners: Nurture a winning network of customers and suppliers, together we create mutual, enduring value. Planet: Be a responsible citizen that makes a difference by helping build and support sustainable communities.Profit: Maximize long-term return to shareowners while being mindful of our overall responsibilities.Productivity: Be a highly effective, lean and fast-moving organization.

7
Existing Mission Statement
To refresh the world...To inspire moments of optimism and happiness...To create value and make a difference.
8
Proposed Vision Statement
Coca-Cola aspires to refresh the world, to inspire moments of optimism and happiness, and to
create value and make a difference.

9
Proposed Mission Statement
People: Be a great place to work where people are inspired to be the best they can be(9)(6).Portfolio: Bring to the world(3) a portfolio of quality beverage brands that anticipate and satisfy people's desires and needs(2).Partners: Nurture a winning, network of customers(1) and suppliers, together we create mutual, enduring value. Planet: Be a responsible citizen that makes a difference by helping build and support sustainable communities(5).Profit: Maximize long-term return to shareowners(8) while being mindful of our overall responsibilities(7).Productivity: Be a highly effective, lean and fast-moving organization(4). 1. Customers
2. Products or services3. Markets4. Technology5. Concern for survival, growth, and profitability6. Philosophy7. Self-concept8. Concern for public image9. Concern for employees
10
Current Strategies
• Vision 2020• Profit, People, Portfolio, Partners, Planet, Productivity• Double the numbers of servings of its products -- water,
soft-drinks, juices and the like -- consumed per day to more than 3 billion.
• 12 month multicultural plans • 5by20™ program• Expedition 206• 2020 water use reduction and replenishment

11
Million Dollar Question
“Should Coke strive to enter the snack or food business in order to remain competitive with
Pepsi Co”?
12
External Assessment
13
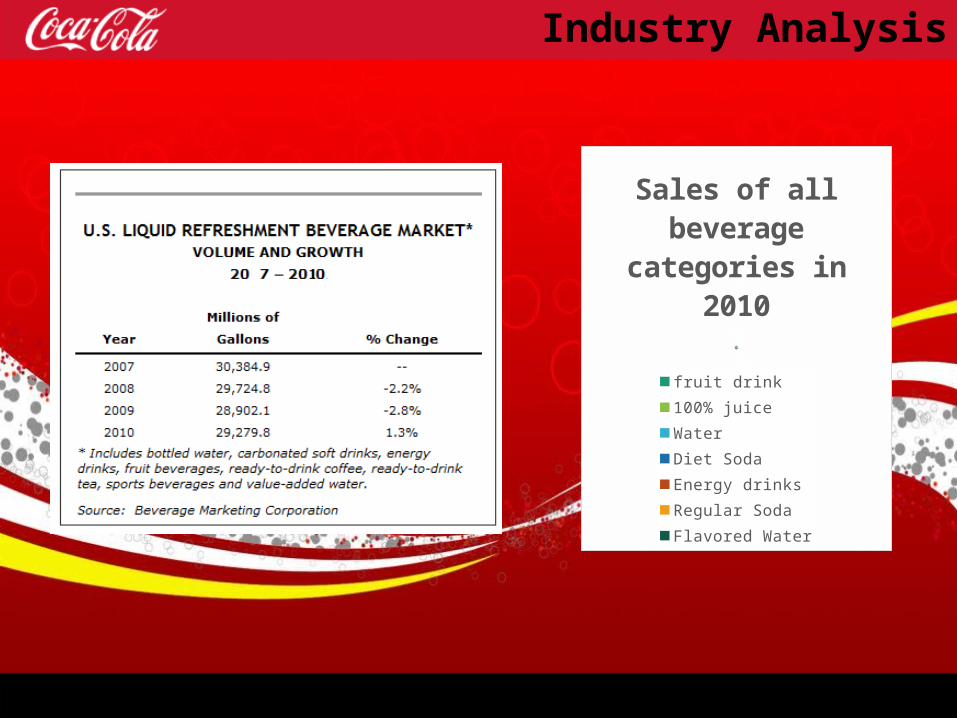
Industry Analysis
11%
13%
13%
14%14%
32%
2%
Sales of all bev-erage categories
in 2010
fruit drink 100% juiceWater Diet SodaEnergy drinks Regular SodaFlavored Water
14
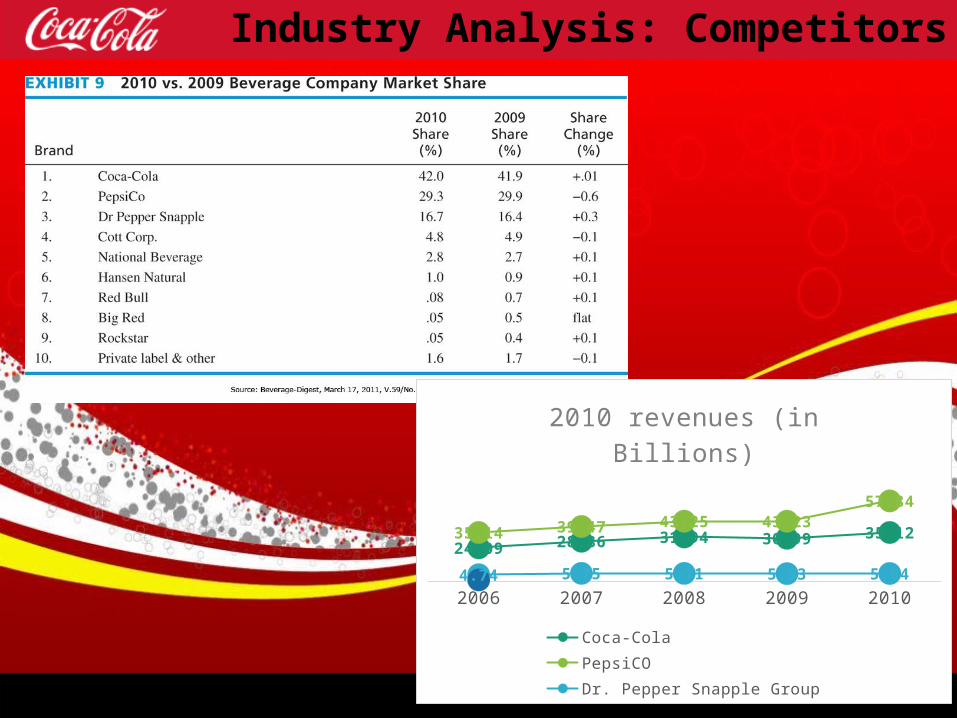
Industry Analysis: Competitors
2006 2007 2008 2009 2010
24.0928.86 31.94 30.99
35.1235.1439.47
43.25 43.23
57.84
4.74 5.75 5.71 5.53 5.64
2010 revenues (in Billions)
Coca-Cola PepsiCODr. Pepper Snapple Group
15
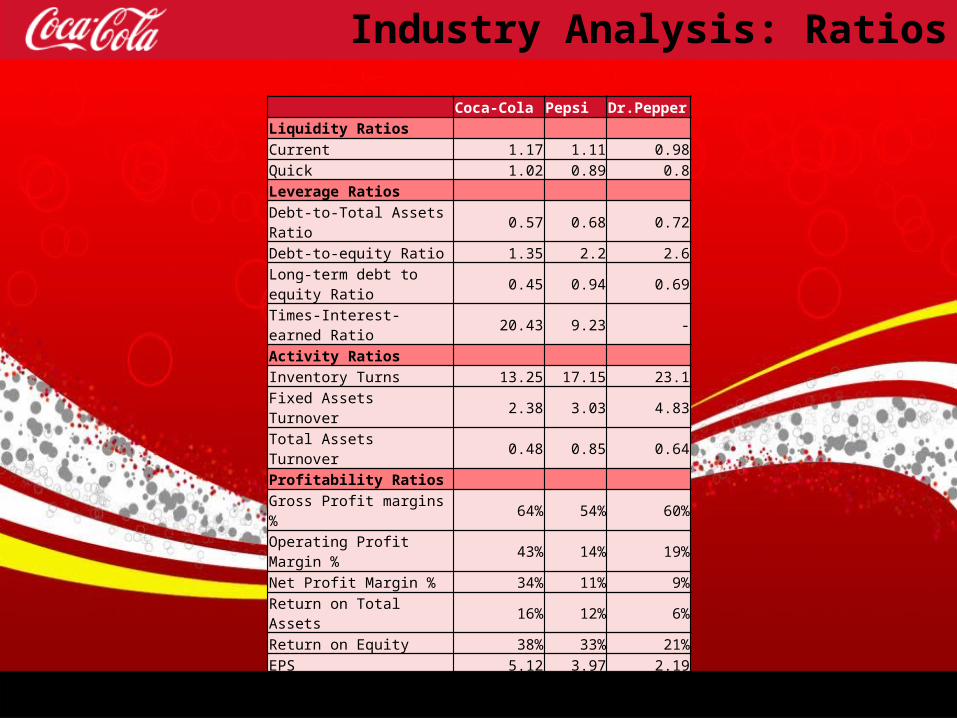
Industry Analysis: Ratios
Coca-Cola Pepsi Dr.PepperLiquidity Ratios Current 1.17 1.11 0.98Quick 1.02 0.89 0.8Leverage Ratios Debt-to-Total Assets Ratio 0.57 0.68 0.72Debt-to-equity Ratio 1.35 2.2 2.6
Long-term debt to equity Ratio 0.45 0.94 0.69
Times-Interest-earned Ratio 20.43 9.23 -Activity Ratios Inventory Turns 13.25 17.15 23.1Fixed Assets Turnover 2.38 3.03 4.83Total Assets Turnover 0.48 0.85 0.64Profitability Ratios Gross Profit margins % 64% 54% 60%Operating Profit Margin % 43% 14% 19%Net Profit Margin % 34% 11% 9%Return on Total Assets 16% 12% 6%Return on Equity 38% 33% 21%EPS 5.12 3.97 2.19P/E ratio 6.03 15.35 16.o5Growth Ratios (5 years) Sales 8.74% 12.18% 11.95%Net Income 19.37% 9.16% 2.05EPS 19.92% 10.35 -
16
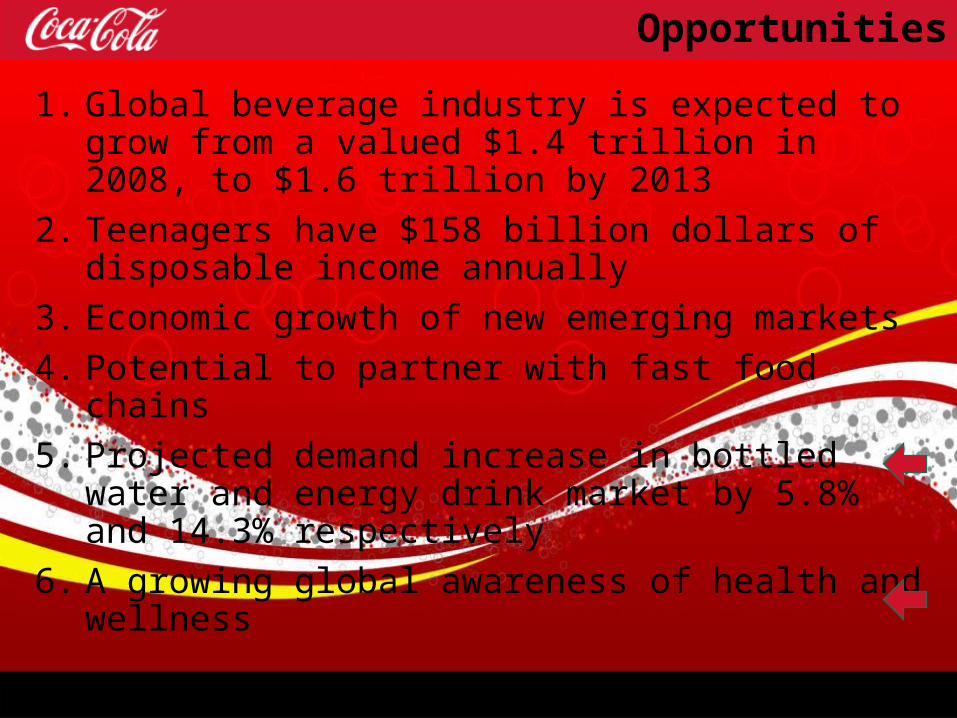
Opportunities
1. Global beverage industry is expected to grow from a valued $1.4 trillion in 2008, to $1.6 trillion by 2013
2. Teenagers have $158 billion dollars of disposable income annually
3. Economic growth of new emerging markets
4. Potential to partner with fast food chains
5. Projected demand increase in bottled water and energy drink market by 5.8% and 14.3% respectively
6. A growing global awareness of health and wellness
17
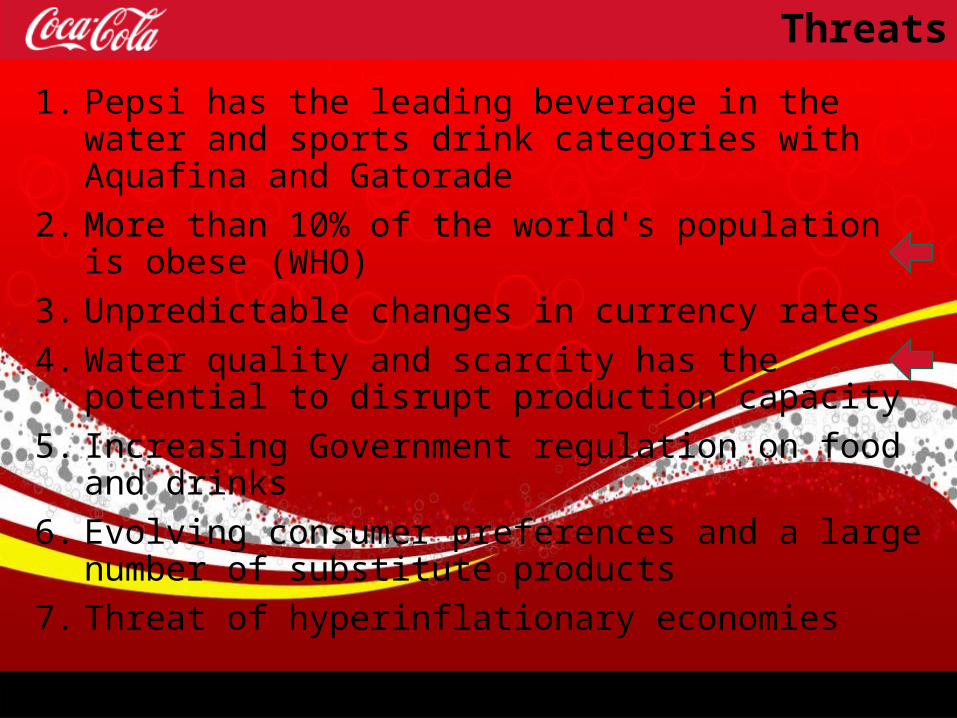
Threats
1. Pepsi has the leading beverage in the water and sports drink categories with Aquafina and Gatorade
2. More than 10% of the world's population is obese (WHO)
3. Unpredictable changes in currency rates
4. Water quality and scarcity has the potential to disrupt production capacity
5. Increasing Government regulation on food and drinks
6. Evolving consumer preferences and a large number of substitute products
7. Threat of hyperinflationary economies
18
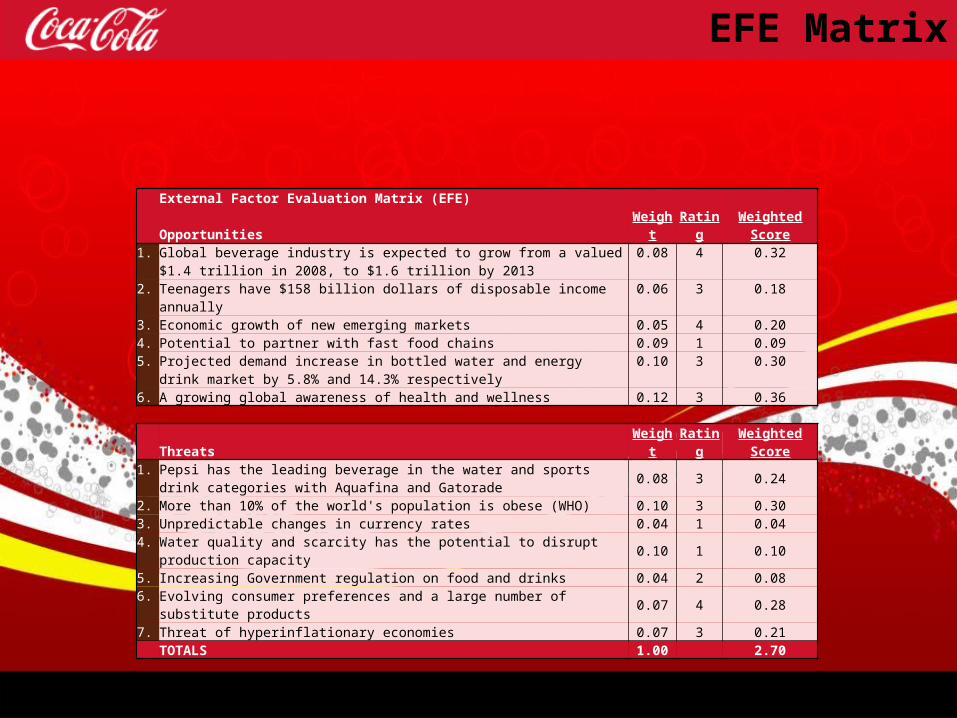
EFE Matrix
External Factor Evaluation Matrix (EFE) Opportunities Weight Rating Weighted Score1. Global beverage industry is expected to grow from a valued $1.4 trillion in 2008, to
$1.6 trillion by 20130.08 4 0.32
2. Teenagers have $158 billion dollars of disposable income annually 0.06 3 0.183. Economic growth of new emerging markets 0.05 4 0.204. Potential to partner with fast food chains 0.09 1 0.095. Projected demand increase in bottled water and energy drink market by 5.8% and
14.3% respectively0.10 3 0.30
6. A growing global awareness of health and wellness 0.12 3 0.36
Threats Weight Rating Weighted Score1. Pepsi has the leading beverage in the water and sports drink categories with Aquafina
and Gatorade 0.08 3 0.24
2. More than 10% of the world's population is obese (WHO) 0.10 3 0.303. Unpredictable changes in currency rates 0.04 1 0.044. Water quality and scarcity has the potential to disrupt production capacity 0.10 1 0.10
5. Increasing Government regulation on food and drinks 0.04 2 0.086. Evolving consumer preferences and a large number of substitute products 0.07 4 0.28
7. Threat of hyperinflationary economies 0.07 3 0.21
TOTALS 1.00 2.70
19
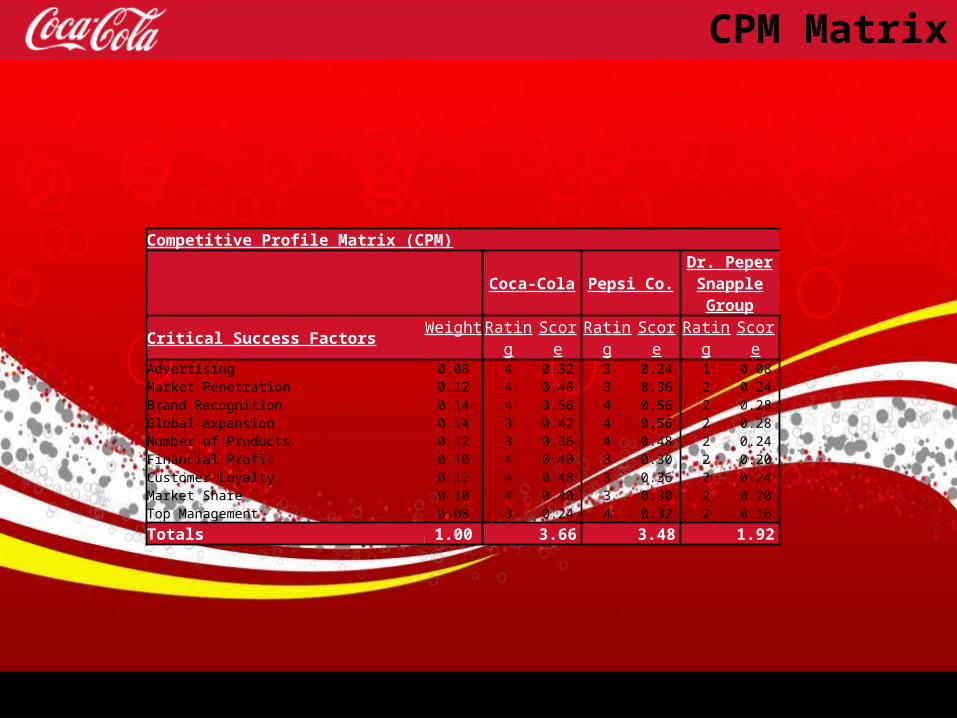
CPM Matrix
Competitive Profile Matrix (CPM)
Coca-Cola Pepsi Co.Dr. Peper Snapple Group
Critical Success Factors Weight Rating Score Rating Score Rating ScoreAdvertising 0.08 4 0.32 3 0.24 1 0.08
Market Penetration 0.12 4 0.48 3 0.36 2 0.24Brand Recognition 0.14 4 0.56 4 0.56 2 0.28Global expansion 0.14 3 0.42 4 0.56 2 0.28Number of Products 0.12 3 0.36 4 0.48 2 0.24Financial Profit 0.10 4 0.40 3 0.30 2 0.20Customer Loyalty 0.12 4 0.48 3 0.36 2 0.24Market Share 0.10 4 0.40 3 0.30 2 0.20
Top Management 0.08 3 0.24 4 0.32 2 0.16
Totals 1.00 3.66 3.48 1.92

20
Internal Assessment

21
Organizational Structure
Mahtar Kent, CEO, Chairman of the Board of
Directors
Gary P. Fayard, EVP &
VPO
Joseph V. Tripodi, EVP
& Chief Marketing/ Commercial
Officer
Jerry S. Wilson, SVP,
Chief Customer
and commercial
Officer
Harry L. Anderson, SVP, Global
Business and Technology
Services
Alexander B. Cummings Jr.
EVP, Chief Administrative
Officer
Ahmet C. Bozer,
President of Eurasia &
Africa Group
J Alexander M Douglas Jr., President of
the North America Group
Glenn G. Jordan S.,
President of Pacific Group
Dominique Reiniche,
President of Europe Group
Steven A. Cahillane,
President/ CEO of Coca-Cola
Refreshments
José Octavio Reyes,
President of the Latin America Group
Irial Finan, EVP & President,
Bottling Investments/ Supply Chain
Geoffrey J. Kelly,
SVP, General Counsel
Guy Wollaert, SVP and
Chief Technical
Officer
Clyde C Tuggle, SVP,
Global Affaires/
Communica-tions
Ingrid Saunders
Jones, SVP, Global
Community Connections
Ceree Eberly, Chief
People Officer

22
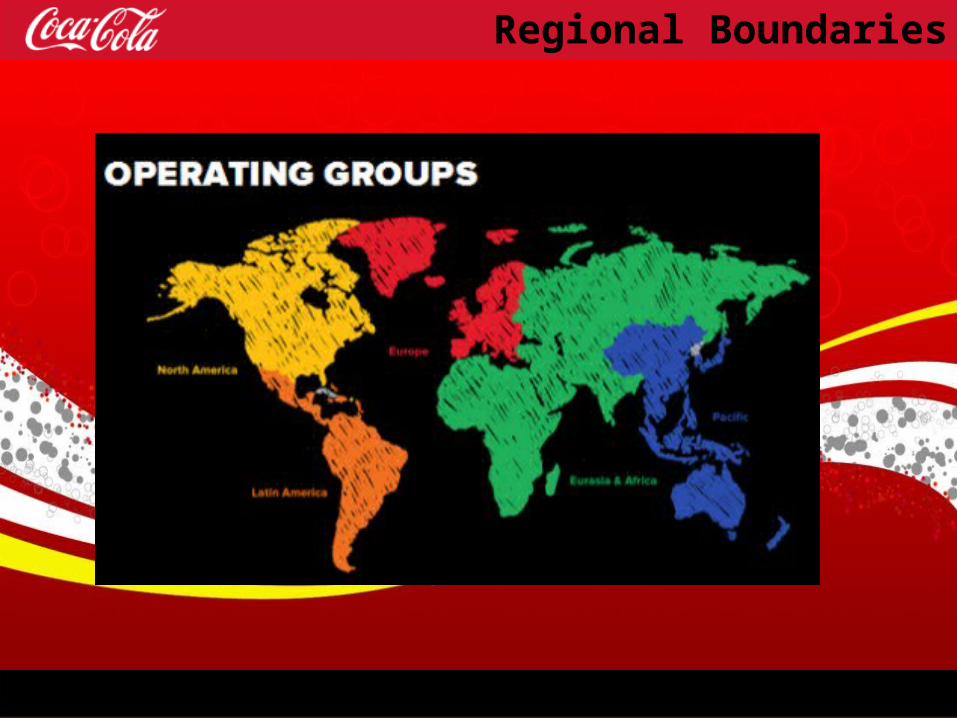
Segment Analysis
Eurasia & Africa7%
Europe13%
Latin America11%
North America32%
Pacific14%
Bottleing Investments23%
Coporate0%
Revenues by segment in 2010 (%)
23
Regional Boundaries
24
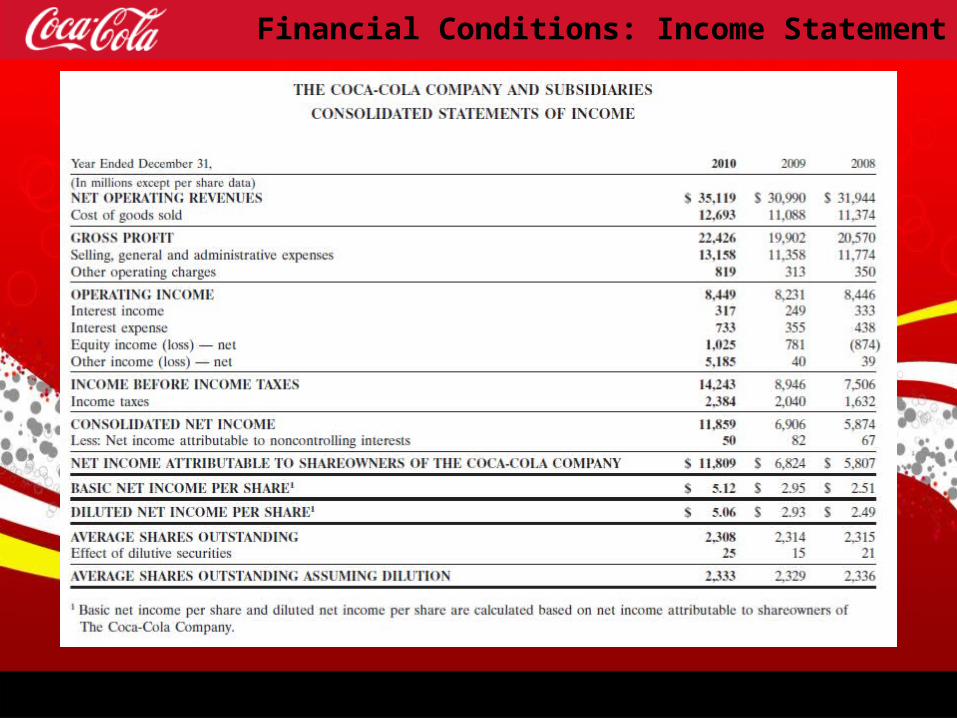
Financial Conditions: Income Statement
25
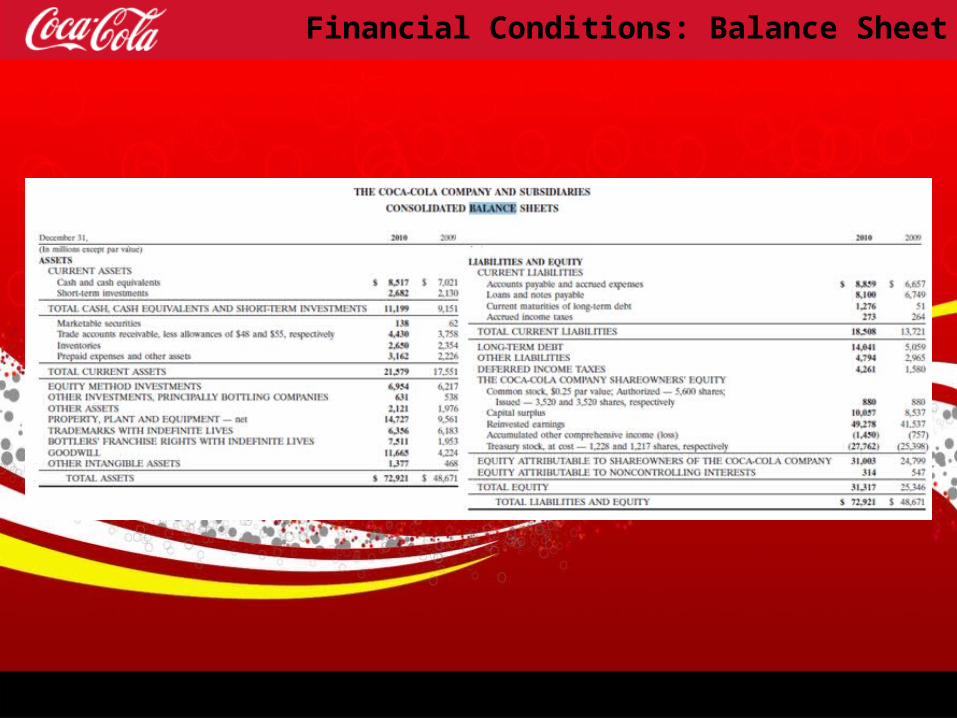
Financial Conditions: Balance Sheet
26
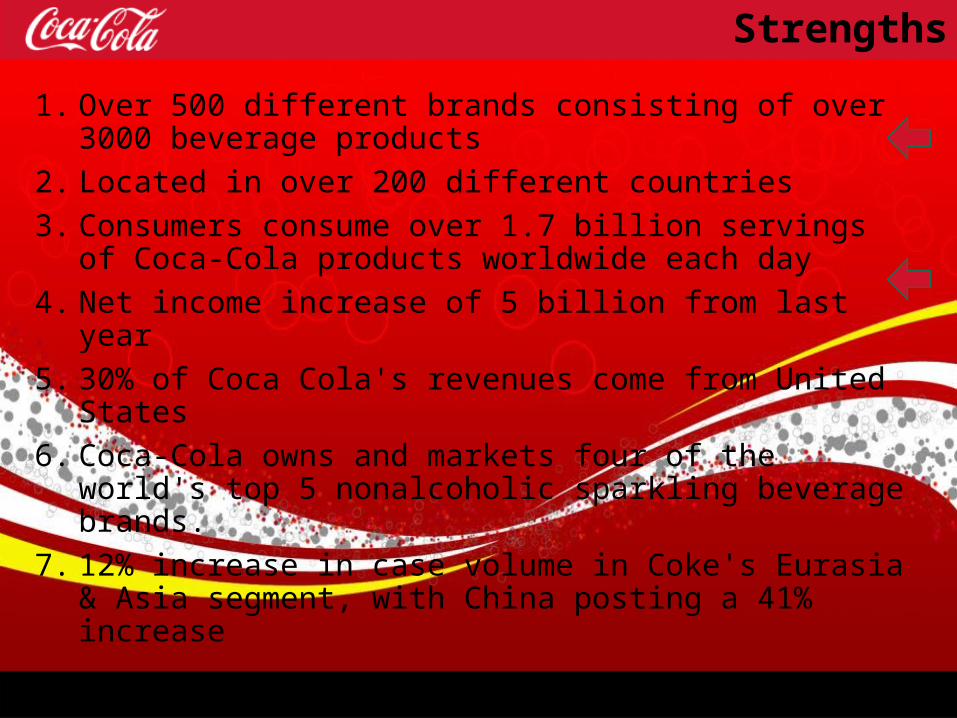
Strengths
1. Over 500 different brands consisting of over 3000 beverage products
2. Located in over 200 different countries
3. Consumers consume over 1.7 billion servings of Coca-Cola products worldwide each day
4. Net income increase of 5 billion from last year
5. 30% of Coca Cola's revenues come from United States
6. Coca-Cola owns and markets four of the world's top 5 nonalcoholic sparkling beverage brands.
7. 12% increase in case volume in Coke's Eurasia & Asia segment, with China posting a 41% increase

27
Weaknesses
1. Coke is not competing in the snack and food industries
2. 20% of the bottle supply are from companies Coca Cola does not have controlling interest
3. There are not a huge amount of sub-industries in the beverage market in which Coca-Cola does not operate
4. Only 3 of the 18 top executives are women
5. Long-term debt of 14 billion, up from last year's 5 billion
6. Trademark Coca-Cola beverages accounted for 51% of US case volume
28
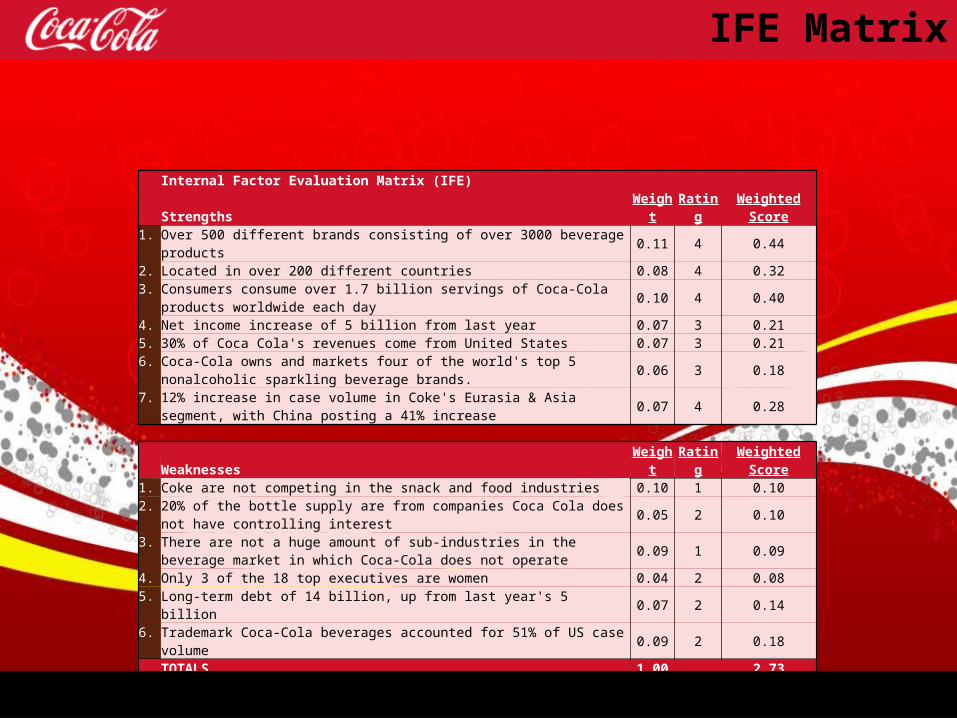
IFE Matrix
Internal Factor Evaluation Matrix (IFE) Strengths Weight Rating Weighted Score1. Over 500 different brands consisting of over 3000 beverage products 0.11 4 0.442. Located in over 200 different countries 0.08 4 0.323. Consumers consume over 1.7 billion servings of Coca-Cola products worldwide each
day 0.10 4 0.40
4. Net income increase of 5 billion from last year 0.07 3 0.215. 30% of Coca Cola's revenues come from United States 0.07 3 0.216. Coca-Cola owns and markets four of the world's top 5 nonalcoholic sparkling beverage
brands. 0.06 3 0.18
7. 12% increase in case volume in Coke's Eurasia & Asia segment, with China posting a 41% increase 0.07 4 0.28
Weaknesses Weight Rating Weighted Score1. Coke are not competing in the snack and food industries 0.10 1 0.102. 20% of the bottle supply are from companies Coca Cola does not have controlling
interest 0.05 2 0.10
3. There are not a huge amount of sub-industries in the beverage market in which Coca-Cola does not operate 0.09 1 0.09
4. Only 3 of the 18 top executives are women 0.04 2 0.085. Long-term debt of 14 billion, up from last year's 5 billion 0.07 2 0.146. Trademark Coca-Cola beverages accounted for 51% of US case volume 0.09 2 0.18
TOTALS 1.00 2.73
29
Strategy Formulation

30
SWOT Matrix
SO Strategies
SO1 - Move to the alcoholic beverage industry (S2, O1)SO2 - Increase expedition 206 (S6, O2, O6)SO3 - Increase number of healthy products(S1, S2, O5, O6)SO4 - Increase number of culturally specific products (S2, S5, O1)
ST Strategies
ST1 - Increase health programs (S1, S2, T2, T5)ST2 – Expansion and increased marketing for energy drinks (S6, T1)
WO Strategies
WO1 - Move to the snack and foods industry (W1, W3, O2, O3, O4,)
WT Strategies
WT - Increase Marketing and Advertising (W3, T1, T6)
31
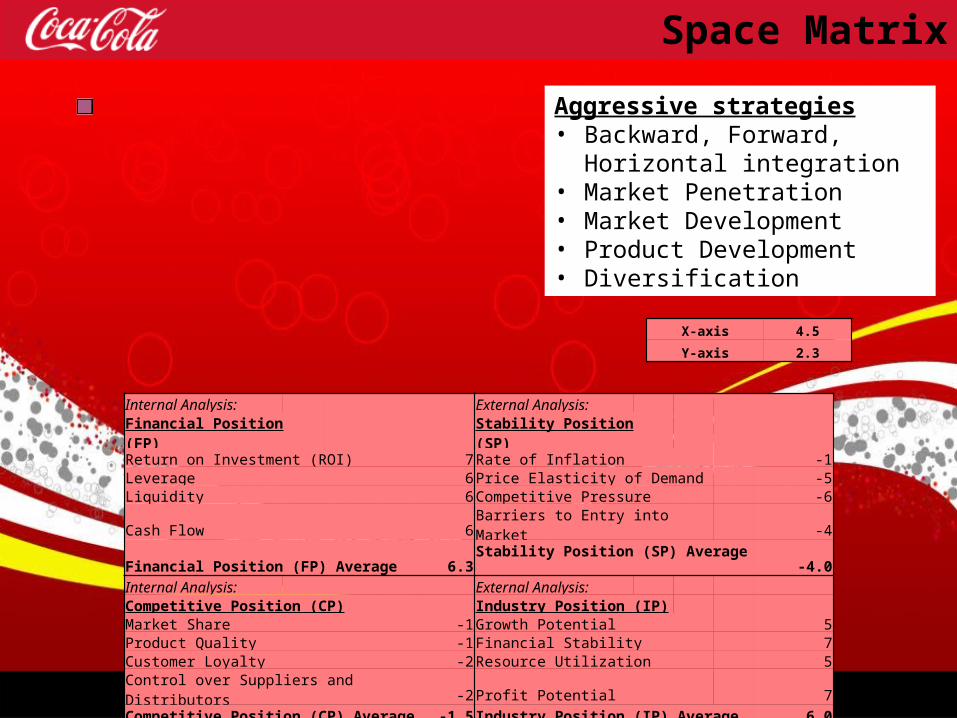
Space Matrix
Aggressive strategies• Backward, Forward, Horizontal
integration• Market Penetration• Market Development• Product Development• Diversification
X-axis 4.5
Y-axis 2.3
Internal Analysis: External Analysis: Financial Position (FP) Stability Position (SP) Return on Investment (ROI) 7Rate of Inflation -1Leverage 6Price Elasticity of Demand -5Liquidity 6Competitive Pressure -6Cash Flow 6Barriers to Entry into Market -4Financial Position (FP) Average 6.3Stability Position (SP) Average -4.0Internal Analysis: External Analysis: Competitive Position (CP) Industry Position (IP) Market Share -1Growth Potential 5Product Quality -1Financial Stability 7Customer Loyalty -2Resource Utilization 5Control over Suppliers and Distributors -2Profit Potential 7Competitive Position (CP) Average -1.5Industry Position (IP) Average 6.0

32
Grand Strategy Matrix
Rapid Market Growth
Quadrant II Quadrant I
Weak Competitive
Position
Strong
Competitive Position
Quadrant III Quadrant IV
Slow Market Growth
Quadrant IV Strategies• Related Diversification• Unrelated diversification• Joint ventures
33
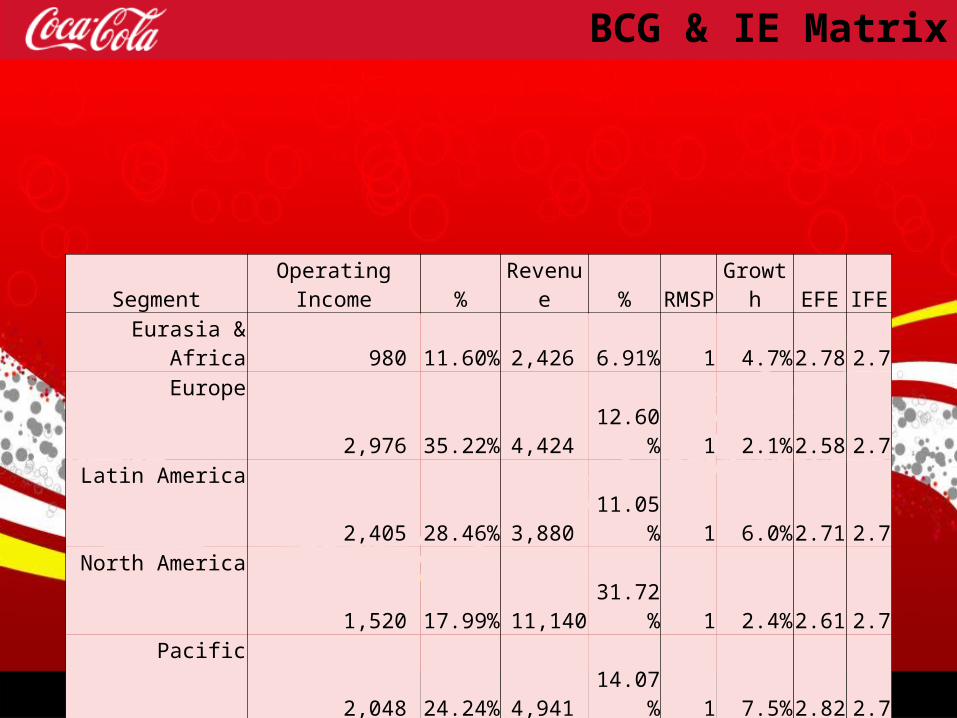
BCG & IE Matrix
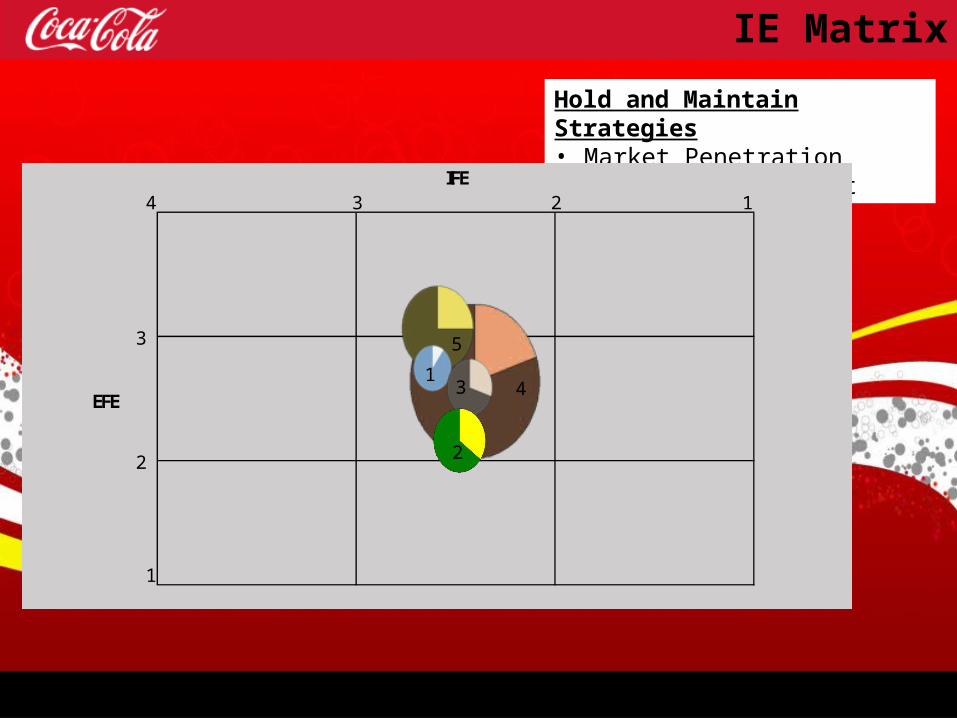
Segment Operating Income % Revenue % RMSP Growth EFE IFE
Eurasia & Africa 980 11.60% 2,426 6.91% 1 4.7% 2.78 2.7Europe 2,976 35.22% 4,424 12.60% 1 2.1% 2.58 2.7
Latin America 2,405 28.46% 3,880 11.05% 1 6.0% 2.71 2.7North America 1,520 17.99% 11,140 31.72% 1 2.4% 2.61 2.7
Pacific 2,048 24.24% 4,941 14.07% 1 7.5% 2.82 2.7Bottling Investments 227 2.69% 8,216 23.39%
Corporate (1,707) -20.20% 92 0.26% Total 8,449 1 35,119 1

34
BCG Matrix
1 010
-10
0.5Relative Market Share
0Growth Rate
4
53
1
2
Star Strategies• Backward, Forward, Horizontal
integration• Market Penetration• Market Development• Product Development
35
IE Matrix
4 1
EFE
1
IFE23
3
2
4
5
13
2
Hold and Maintain Strategies• Market Penetration• Product Development
36
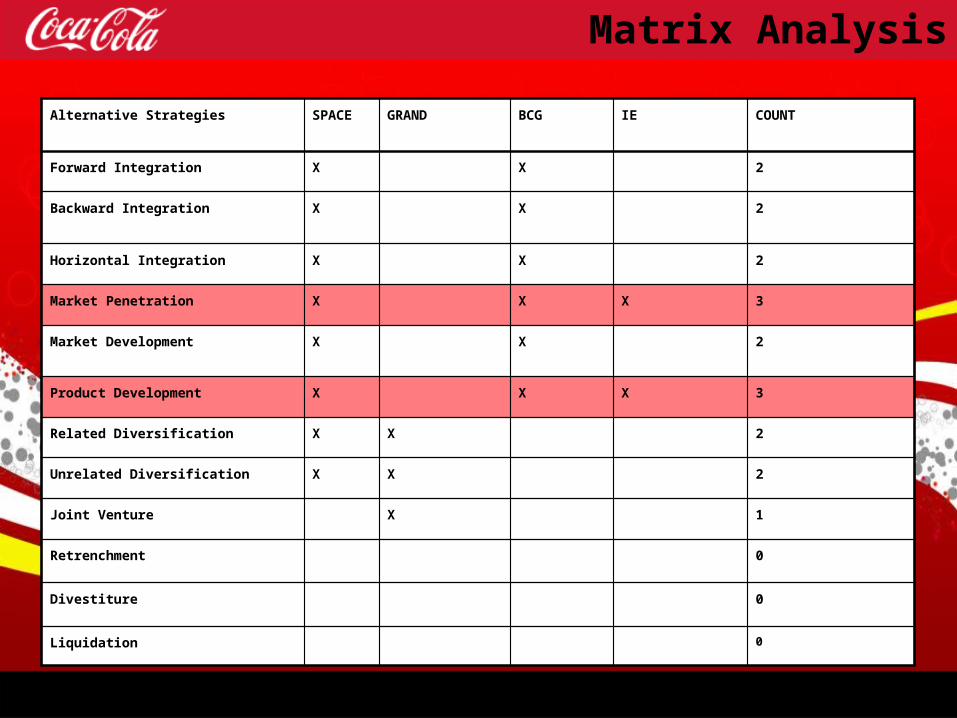
Matrix Analysis
Alternative Strategies SPACE GRAND BCG IE COUNT
Forward Integration X X 2
Backward Integration X X 2
Horizontal Integration X X 2
Market Penetration X X X 3
Market Development X X 2
Product Development X X X 3
Related Diversification X X 2
Unrelated Diversification X X 2
Joint Venture X 1
Retrenchment 0
Divestiture 0
Liquidation 0

37
Million Dollar Question
“Should Coke Strive to enter the snack or food business in order to remain competitive with
Pepsi Co”?
38
Million Dollar Question
No
39
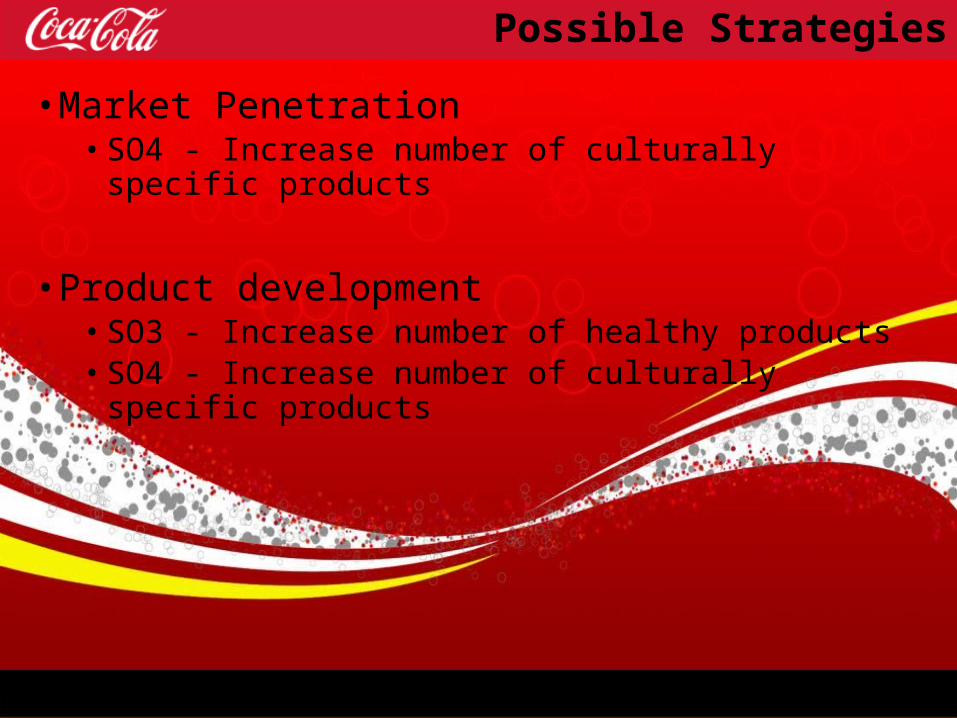
Possible Strategies
• Market Penetration• SO4 - Increase number of culturally specific products
• Product development• SO3 - Increase number of healthy products• SO4 - Increase number of culturally specific products
40
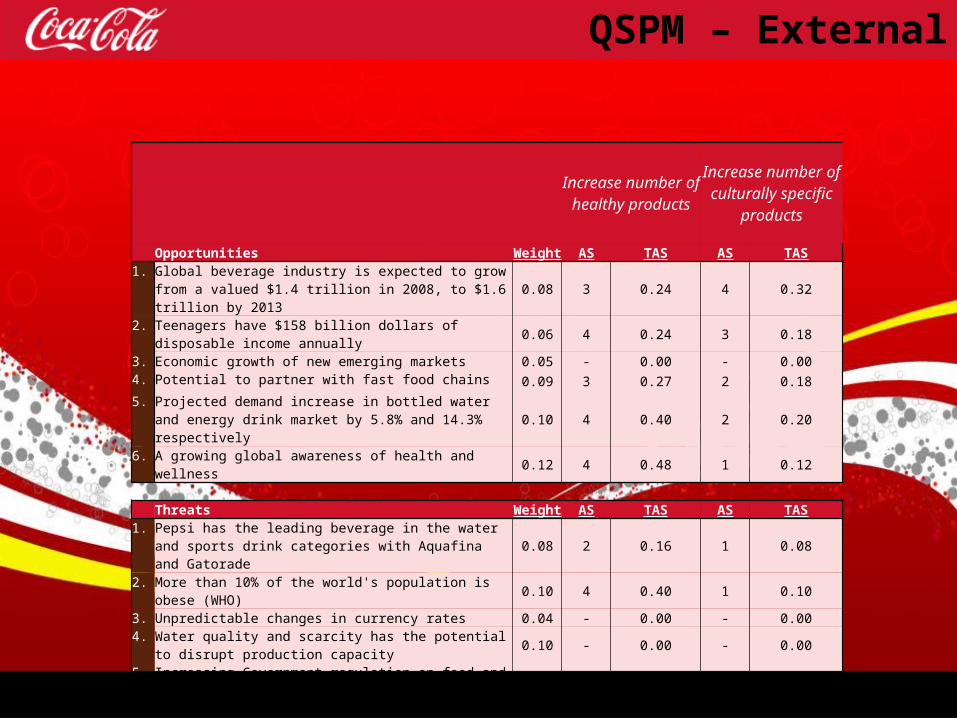
QSPM – External
Increase number of healthy products
Increase number of culturally specific
products
Opportunities Weight AS TAS AS TAS1. Global beverage industry is expected to grow from a valued $1.4
trillion in 2008, to $1.6 trillion by 2013 0.08 3 0.24 4 0.32
2. Teenagers have $158 billion dollars of disposable income annually0.06 4 0.24 3 0.18
3. Economic growth of new emerging markets 0.05 - 0.00 - 0.004. Potential to partner with fast food chains 0.09 3 0.27 2 0.185. Projected demand increase in bottled water and energy drink
market by 5.8% and 14.3% respectively 0.10 4 0.40 2 0.20
6. A growing global awareness of health and wellness 0.12 4 0.48 1 0.12
Threats Weight AS TAS AS TAS1. Pepsi has the leading beverage in the water and sports drink
categories with Aquafina and Gatorade 0.08 2 0.16 1 0.08
2. More than 10% of the world's population is obese (WHO) 0.10 4 0.40 1 0.103. Unpredictable changes in currency rates 0.04 - 0.00 - 0.004. Water quality and scarcity has the potential to disrupt production
capacity 0.10 - 0.00 - 0.00
5. Increasing Government regulation on food and drinks 0.04 - 0.00 - 0.006. Evolving consumer preferences and a large number of substitute
products 0.07 3 0.21 4 0.28
7. Threat of hyperinflationary economies 0.07 - 0.00 - 0.00
41
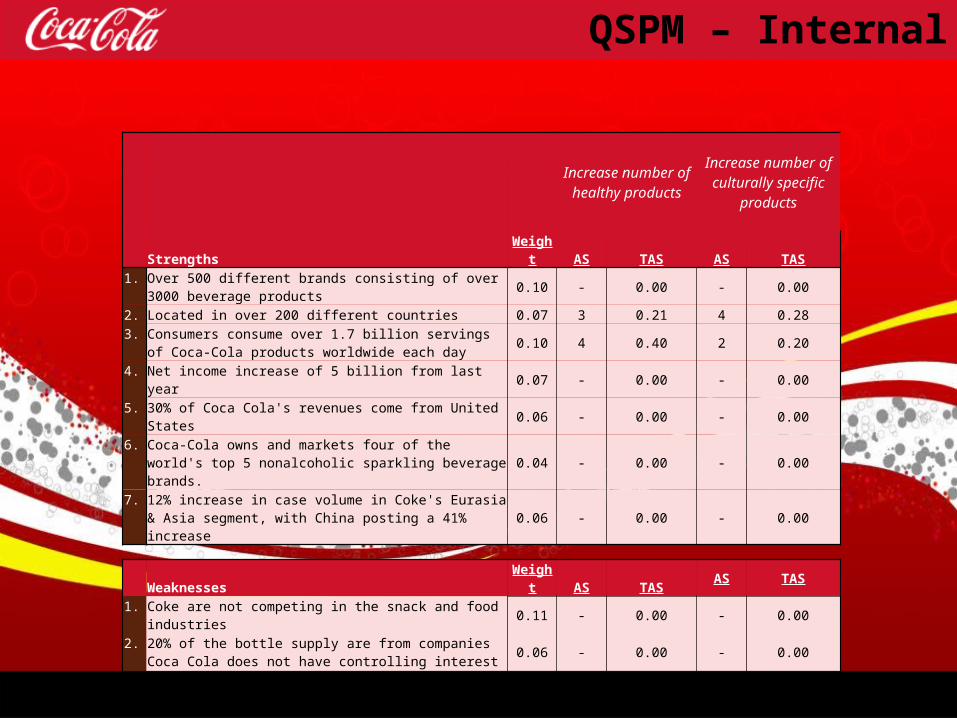
QSPM – Internal
Increase number of healthy products
Increase number of culturally specific
products
Strengths Weight AS TAS AS TAS1. Over 500 different brands consisting of over 3000 beverage
products 0.10 - 0.00 - 0.00
2. Located in over 200 different countries 0.07 3 0.21 4 0.283. Consumers consume over 1.7 billion servings of Coca-Cola
products worldwide each day 0.10 4 0.40 2 0.20
4. Net income increase of 5 billion from last year 0.07 - 0.00 - 0.005. 30% of Coca Cola's revenues come from United States 0.06 - 0.00 - 0.006. Coca-Cola owns and markets four of the world's top 5
nonalcoholic sparkling beverage brands. 0.04 - 0.00 - 0.00
7. 12% increase in case volume in Coke's Eurasia & Asia segment, with China posting a 41% increase 0.06 - 0.00 - 0.00
Weaknesses Weight AS TAS AS TAS1. Coke are not competing in the snack and food industries 0.11 - 0.00 - 0.002. 20% of the bottle supply are from companies Coca Cola does not
have controlling interest 0.06 - 0.00 - 0.00
3. There are not a huge amount of sub-industries in the beverage market in which Coca-Cola does not operate 0.10 3 0.30 4 0.40
4. Only 3 of the 18 top executives are women 0.05 - 0.00 - 0.005. Long-term debt of 14 billion, up from last year's 5 billion 0.08 - 0.00 - 0.006. Trademark Coca-Cola beverages accounted for 51% of US case
volume 0.10 - 0.00 - 0.00
TOTALS 3.31 2.34

42
Strategy Implementation
43
3 Year Objectives
Objectives:
• Provide healthy alternatives beverages
• Diversify revenues amongst products
• Increase revenue to over 50 billion• currently at 35.119
44
Strategies and 1 Year Costs
• R&D for new products: $65 million (Pepsi spent $45m for similar initiative in Japan)
• Marketing: current budget is 2.9 billion• New healthy products: 15% increase – ~435 Million
Total expense: $500 MillionDesired return : 5.2 billion(15%) revenue increase
45
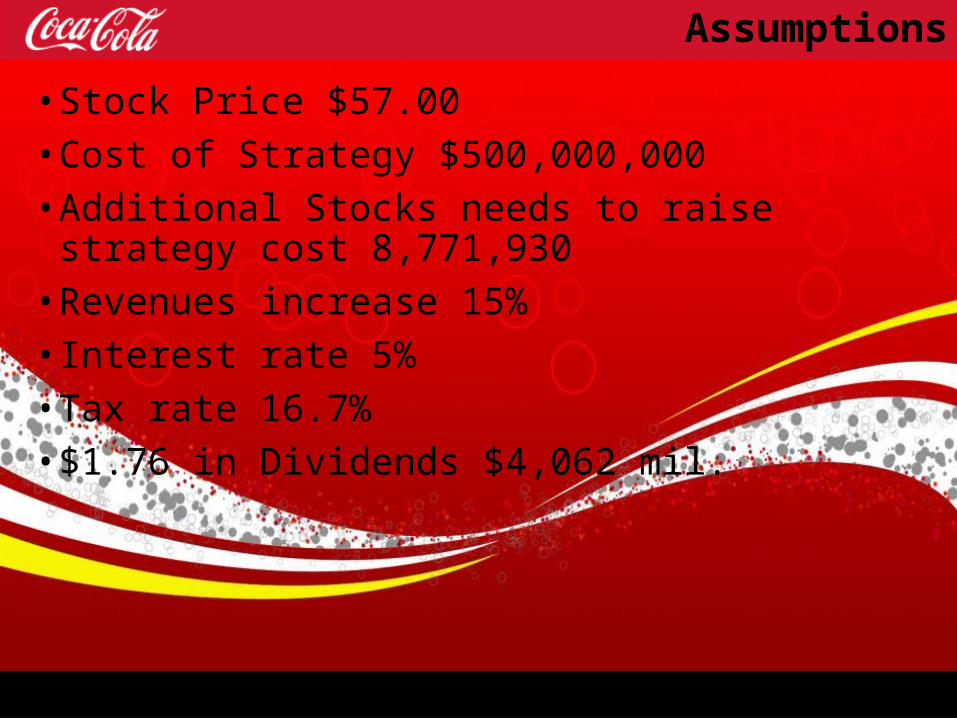
Assumptions
• Stock Price $57.00
• Cost of Strategy $500,000,000
• Additional Stocks needs to raise strategy cost 8,771,930
• Revenues increase 15%
• Interest rate 5%
• Tax rate 16.7%
• $1.76 in Dividends $4,062 mil.
46
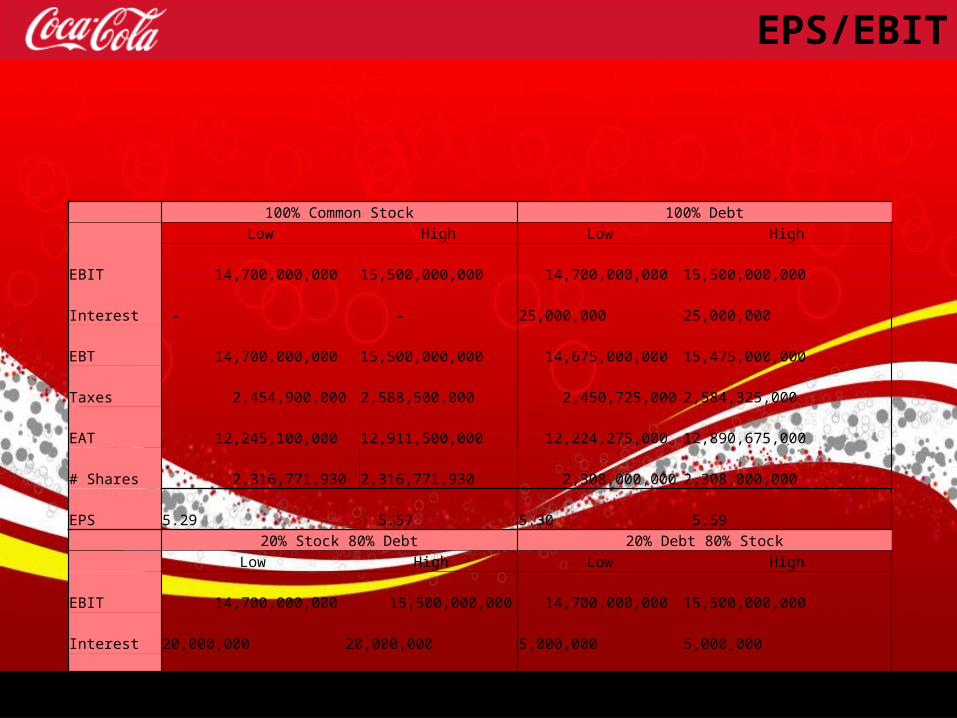
EPS/EBIT
100% Common Stock 100% Debt Low High Low HighEBIT 14,700,000,000 15,500,000,000 14,700,000,000 15,500,000,000 Interest - - 25,000,000 25,000,000 EBT 14,700,000,000 15,500,000,000 14,675,000,000 15,475,000,000 Taxes 2,454,900,000 2,588,500,000 2,450,725,000 2,584,325,000 EAT 12,245,100,000 12,911,500,000 12,224,275,000 12,890,675,000 # Shares 2,316,771,930 2,316,771,930 2,308,000,000 2,308,000,000 EPS 5.29 5.57 5.30 5.59 20% Stock 80% Debt 20% Debt 80% Stock Low High Low HighEBIT 14,700,000,000 15,500,000,000 14,700,000,000 15,500,000,000 Interest 20,000,000 20,000,000 5,000,000 5,000,000 EBT 14,680,000,000 15,480,000,000 14,695,000,000 15,495,000,000 Taxes 2,451,560,000 2,585,160,000 2,454,065,000 2,587,665,000 EAT 12,228,440,000 12,894,840,000 12,240,935,000 12,907,335,000 # Shares 2,309,754,386 2,309,754,386 2,315,017,544 2,315,017,544 EPS 5.29 5.58 5.29 5.58
47
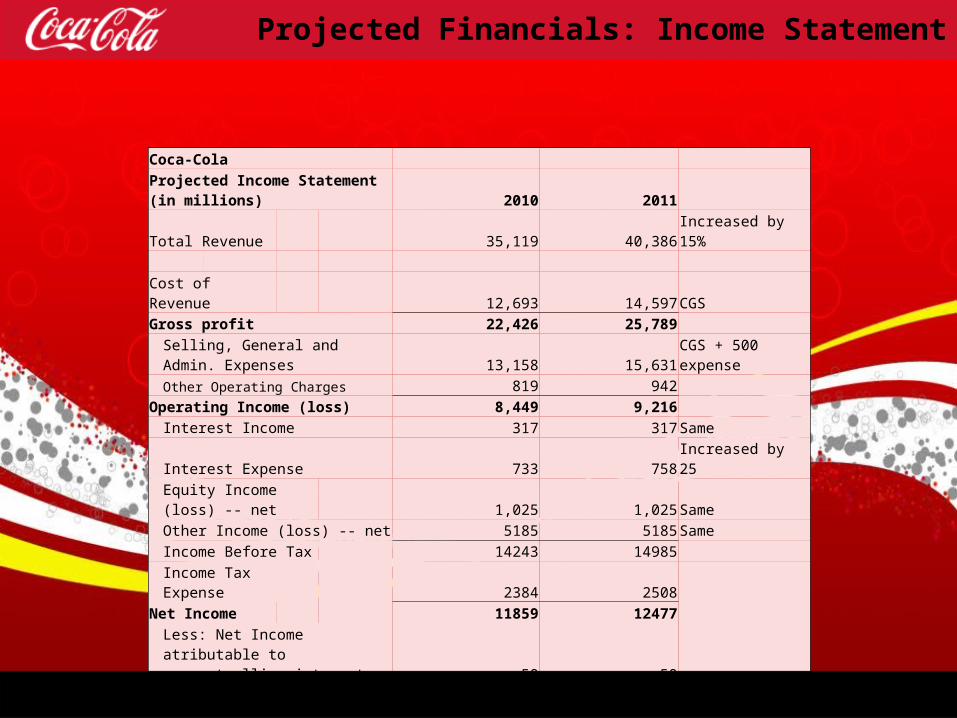
Projected Financials: Income Statement
Coca-Cola Projected Income Statement (in millions) 2010 2011 Total Revenue 35,119 40,386 Increased by 15% Cost of Revenue 12,693 14,597 CGSGross profit 22,426 25,789
Selling, General and Admin. Expenses 13,158 15,631 CGS + 500 expenseOther Operating Charges 819 942
Operating Income (loss) 8,449 9,216 Interest Income 317 317 SameInterest Expense 733 758 Increased by 25Equity Income (loss) -- net 1,025 1,025 SameOther Income (loss) -- net 5185 5185 SameIncome Before Tax 14243 14985 Income Tax Expense 2384 2508
Net Income 11859 12477
Less: Net Income atributable to noncontrolling interests 50 50
Net Income Attributable to Shareowners of The Coca-Cola Company 11809 12427
48
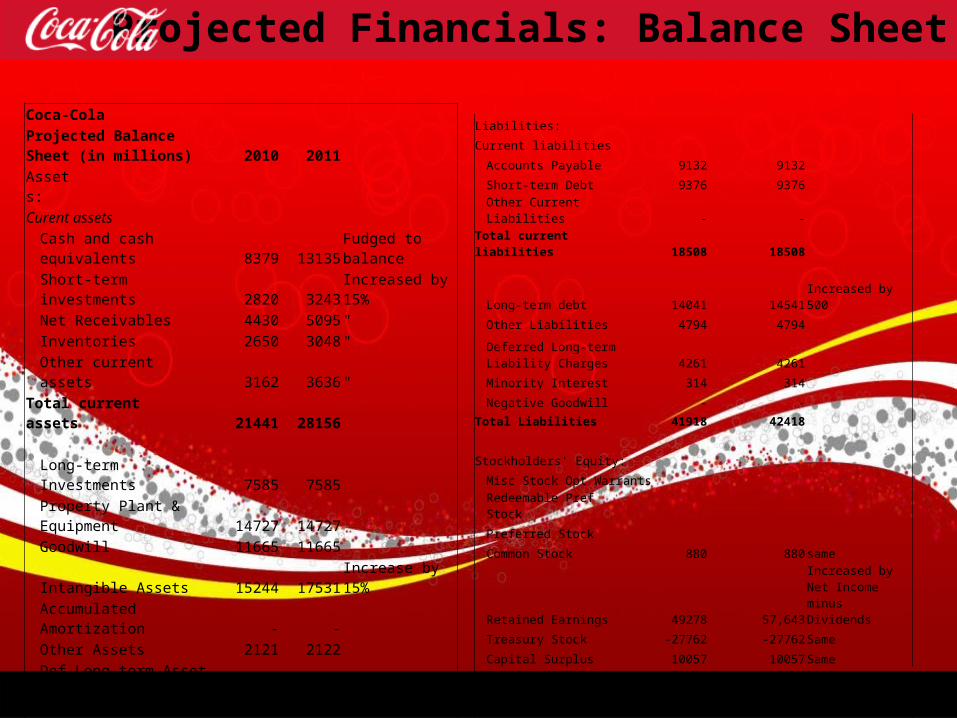
Projected Financials: Balance Sheet
Coca-Cola Projected Balance Sheet (in millions) 2010 2011 Assets: Curent assets
Cash and cash equivalents 8379 13135 Fudged to balanceShort-term investments 2820 3243 Increased by 15%Net Receivables 4430 5095 "Inventories 2650 3048 "Other current assets 3162 3636 "
Total current assets 21441 28156
Long-term Investments 7585 7585 Property Plant & Equipment 14727 14727 Goodwill 11665 11665 Intangible Assets 15244 17531 Increase by 15%Accumulated Amortization - - Other Assets 2121 2122 Def Long-term Asset Charges - -
Total Assets 72783 81786
Liabilities:
Current liabilities
Accounts Payable 9132 9132
Short-term Debt 9376 9376
Other Current Liabilities - -
Total current liabilities 18508 18508
Long-term debt 14041 14541 Increased by 500
Other Liabilities 4794 4794
Deferred Long-term Liability Charges 4261 4261
Minority Interest 314 314
Negative Goodwill - -
Total Liabilities 41918 42418
Stockholders' Equity:
Misc Stock Opt Warrants
Redeemable Pref Stock
Preferred Stock
Common Stock 880 880 same
Retained Earnings 49278 57,643
Increased by Net Income minus Dividends
Treasury Stock -27762 -27762 Same
Capital Surplus 10057 10057 Same
Other Stockholders' equity -1450 -1450
Total Stockholders' Equity 31003 39368
Total Liabilities and SE 72921 81786
49
Projected Financials: Ratios
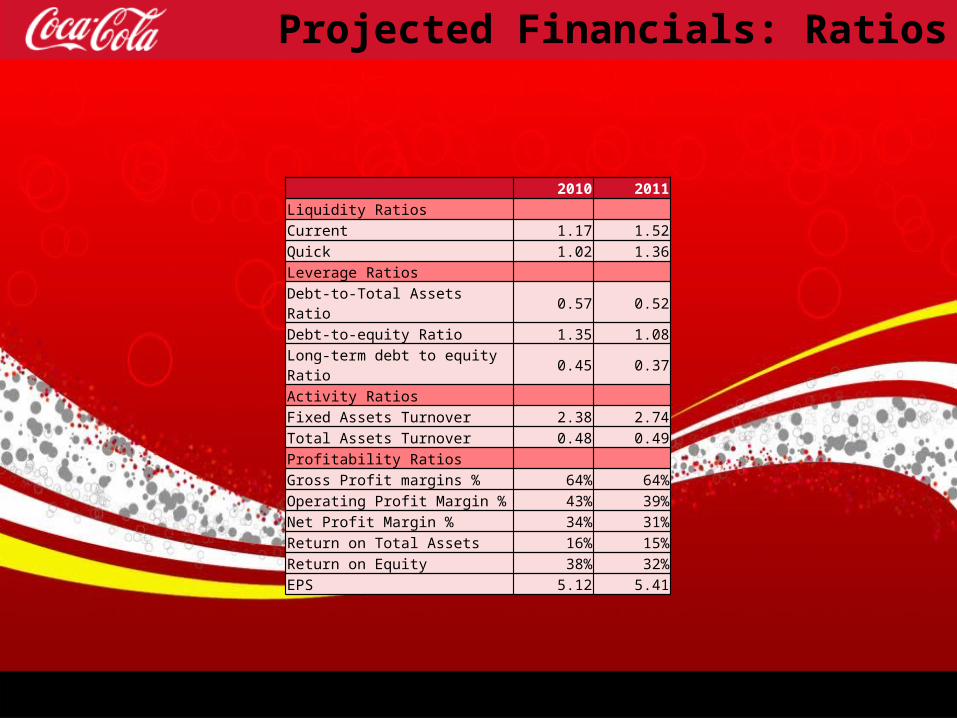
2010 2011Liquidity Ratios Current 1.17 1.52Quick 1.02 1.36Leverage Ratios Debt-to-Total Assets Ratio 0.57 0.52Debt-to-equity Ratio 1.35 1.08Long-term debt to equity Ratio 0.45 0.37Activity Ratios Fixed Assets Turnover 2.38 2.74Total Assets Turnover 0.48 0.49Profitability Ratios Gross Profit margins % 64% 64%Operating Profit Margin % 43% 39%Net Profit Margin % 34% 31%Return on Total Assets 16% 15%Return on Equity 38% 32%EPS 5.12 5.41
50
Foreseeable problems
• Lack of recognition from efforts
• Keeping related development costs under control
• Cost of goods sold may be higher for healthy alternatives

51
Strategic Evaluation

52
Balanced Scorecard
Area of Objectives Measure or TargetTime
Primary ResponsibilityExpectation
Consumers
1 Satisfaction Customer Survey results Yearly Chief Customer and commercial officer
2 Brand recognition Industry Reports Yearly Chief Customer and commercial officer
3 Customer loyalty Customer Survey results Yearly Chief Customer and commercial officer
Employees
1 Quality and service training On site and webinars Yearly Chief People Officer
2 Employee Satisfaction Survey Yearly Chief People Officer
Product Quality
1 Number of healthy alternatives Number of pruducts YearlyChief Customer and commercial Officer
Financial
1 Revenues increase 15% (2011), over 10% for following 2 years Quarterly VPO
2 Ratio analysis Better than Industry & PepsiCo Yearly VPO
Business Ethics/Natural Environment
1 Waste reduction Volume of recyclable materials Quarterly Global community connections Officer
2 Ethics Training number of ethics training sessions Yearly Global community connections Officer

53
Company Update
54
Update
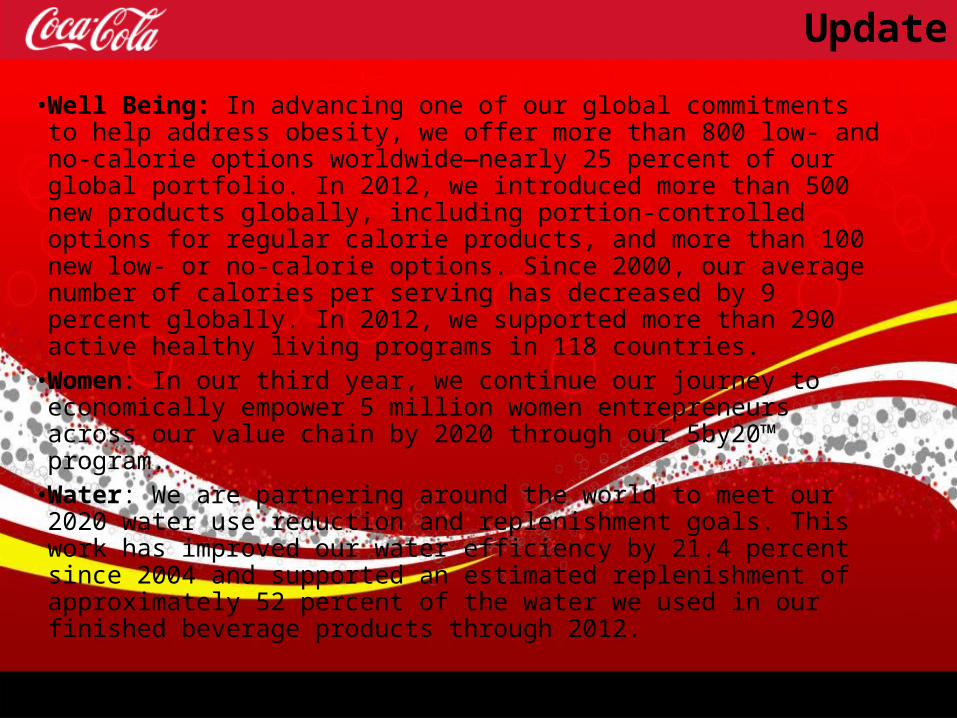
• Well Being: In advancing one of our global commitments to help address obesity, we offer more than 800 low- and no-calorie options worldwide—nearly 25 percent of our global portfolio. In 2012, we introduced more than 500 new products globally, including portion-controlled options for regular calorie products, and more than 100 new low- or no-calorie options. Since 2000, our average number of calories per serving has decreased by 9 percent globally. In 2012, we supported more than 290 active healthy living programs in 118 countries.
• Women: In our third year, we continue our journey to economically empower 5 million women entrepreneurs across our value chain by 2020 through our 5by20™ program.
• Water: We are partnering around the world to meet our 2020 water use reduction and replenishment goals. This work has improved our water efficiency by 21.4 percent since 2004 and supported an estimated replenishment of approximately 52 percent of the water we used in our finished beverage products through 2012.

55
Update

56
Questions
57
References
• Babal, A. (2013). Coca-Cola Company - 2011. In F. R. David, Strategic Management; A competitive approach (pp. 235-243). Florence: Pearson.
• Coca-Cola Corporation. (2011). 2010 Annual Report. Atlanta.• David, F. R. (2013). Strategic Management; A Competitive Advantage
Approach. Florence: Pearson.• Harrison, J. S. (2013). Dr. Pepper Snapple Group. In F. R. David, Strategic
Management; A Competitive Approach (pp. 224-234). Florence: Pearson.• PepsiCo. (2011). 2010 Annual Report. Purchase.• Press Release: The U.S. Liquid Refreshment Beverage Market Remained
Flat in 2013. (2014, March 31). Retrieved from Beverage Marketing Corporation: http://www.beveragemarketing.com/news-detail.asp?id=299
• Wikinvest. (2014, April 27). Coca-Cola Company (KO). Retrieved from Wikinvest: http://www.wikinvest.com/stock/Coca-Cola_Company_%28KO%29
• Zmuda, N. (2009, November 22). Coca-Cola Lays Out Its Vision for the Future at 2010 Meeting. Retrieved from Advertizing Age: http://adage.com/article/news/coca-cola-lays-vision-future-2010-meeting/140664/