shakemap atlas 2.0: an improved suite of recent historical
TRANSCRIPT

ShakeMap Atlas 2.0: An Improved Suite of Recent Historical Earthquake ShakeMaps for Global Hazard Analyses and Loss Model Calibration D. García, R.T. Mah, K.L. Johnson, M.G. Hearne, K.D. Marano, K.W. Lin & D.J. Wald U.S. Geological Survey, National Earthquake Information Center, Golden, Colorado, USA C.B. Worden Synergetics, Inc., 1520 S. College Ave., Fort Collins, Colorado, USA E. So Cambridge Architectural Research Ltd., Cambridge, UK
SUMMARY: We introduce the second version of the U.S. Geological Survey ShakeMap Atlas, which is an openly-available compilation of nearly 8,000 ShakeMaps of the most significant global earthquakes between 1973 and 2011. This revision of the Atlas includes: (1) a new version of the ShakeMap software that improves data usage and uncertainty estimations; (2) an updated earthquake source catalogue that includes regional locations and finite fault models; (3) a refined strategy to select prediction and conversion equations based on a new seismotectonic regionalization scheme; and (4) vastly more macroseismic intensity and ground-motion data from regional agencies All these changes make the new Atlas a self-consistent, calibrated ShakeMap catalogue that constitutes an invaluable resource for investigating near-source strong ground-motion, as well as for seismic hazard, scenario, risk, and loss-model development. To this end, the Atlas will provide a hazard base layer for PAGER loss calibration and for the Earthquake Consequences Database within the Global Earthquake Model initiative. Keywords: strong ground-motion, ShakeMap, PAGER, Global Earthquake Model, secondary hazards. 1. INTRODUCTION The products created in near-real time by the U.S. Geological Survey (USGS) Global ShakeMap and Prompt Assessment of Global Earthquakes for Response (PAGER) systems are now commonly used in the aftermath of potentially damaging earthquakes by a wide range of users, from seismological services and seismic-hazard modellers to decision makers, first responders, and insurance companies. In particular, PAGER human and economic loss estimations rely on models derived from the ShakeMap Atlas, which is a compilation of nearly 5,000 ShakeMaps of the most significant global earthquakes between 1973 and 2007 (Allen et al., 2008). This Atlas, which is openly available at http://earthquake.usgs.gov/earthquakes/shakemap/atlas.php, is a formidable resource for investigating strong ground-motions near the source, as well as for seismic hazard, risk, and loss-modelling analyses. Since the Atlas' inception and release in 2007, a number of studies and calibration tests have revealed some inconsistencies and showed room for improvement in different aspects of the database. Simultaneously, there have been developments in both the software and the source catalogue that had to be considered in further versions. There has also been a growing need to add the most significant earthquakes that have occurred since 2007, since several of them have greatly fostered our understanding of seismic hazard and loss modelling. Moreover, most international efforts in this arena are being integrated into the Global Earthquake Model (GEM) initiative. Given the key role that PAGER plays in GEM, it seemed a natural step to include the Atlas within this project. Here we introduce the second version of the ShakeMap Atlas, summarizing the main additions and modifications incorporated into it. We also describe two relevant ShakeMap subsets of the Atlas 2.0: the events considered in the GEM Earthquake Consequences Database (GEMECD) and a compilation of earthquakes that represent the best case studies on landslide and liquefaction effects.

2. SHAKEMAP ATLAS 2.0: MAIN FEATURES The new version (2.0) of the ShakeMap Atlas represents a significant improvement of the previous release that includes relevant changes in almost all aspects of the catalogue. These changes are related with four main areas: (1) a new version of the ShakeMap software; (2) an updated and extended source catalogue; (3) a refined way to select prediction and conversion equations for a given earthquake; and (4) additional macroseismic intensity and ground-motion data. In the following subsections we explain in some detail the main characteristics of these changes. 2.1. ShakeMap software The ShakeMap software combines ground-truth observations, wherever available, and prediction equations, where no data are present, to compute maps for two layers: macroseismic intensity and ground motion. The first layer uses the Modified Mercalli Intensity (MMI) scale. For the ground-motion layer maps are produced for five parameters: peak ground acceleration (PGA), peak ground velocity (PGV), and 5% damped pseudo-spectral acceleration (PSA) at three different periods (0.3, 1.0, and 3.0 s). Additionally, uncertainty maps are also created for each parameter. The Atlas 2.0 now uses a considerably modified version of the software, ShakeMap 3.5 (Worden et al., 2010), publicly released in December 2009 and continuously updated since then. One key addition in this software version is the distinction in the nature of the available data depending on the map layer considered. In ground-motion maps (PGA, PGV, and PSA) we call native observations to any ground-motion data obtained from seismic stations, while we define converted observations as those derived from macroseismic intensity data transformed into ground-motion parameters through the use of an intensity-to-ground-motion conversion equation (IGMCE). Conversely, in the intensity layer MMI assignments constitute the native data, while ground-motion parameters converted into MMI values via a ground-motion-to-intensity conversion equation (GMICE) are the converted data. Due to the added uncertainty related with the use of conversion equations, converted data always carry additional uncertainties, which are incorporated through a weighted-average approach in the computations. For example, for a given ground-motion parameter, Y, the computed value on a certain grid point with coordinates (x,y) on the map, Yxy, is a combination of the value given by the ground-motion prediction equation (GMPE) at that point (YGMPE,xy) and the weighted average of all the surrounding observations, both native (Yobs,xy) and converted (Yconv,xy). These data are simultaneously weighted by their distance to the grid point, as shown in Figure 1, and by their uncertainty, where the mentioned differences between native (σobs,xy) and converted (σconv,xy) uncertainties are taken into account. This can be expressed through the equation:
, , ,2 2 2
1 1, , , ,
2 2 21 1, , , ,
1 1 1
obs conv
obs conv
n nGMPE xy obs xy i conv xy j
i jGMPE obs xy i conv xy jxy n n
i jGMPE obs xy i conv xy j
Y Y Y
Yσ σ σ
σ σ σ
= =
= =
+ +=
+ +
∑ ∑
∑ ∑
, ,
(1)
where the denominator is the inverse of the total uncertainty (variance) at the grid point. See Worden et al. (2010) for more details. This approach treats native and converted data in a logically consistent way when mapping each parameter, and allows for a more precise computation of uncertainty. Moreover, this new way of handling data is especially important for intensity observations, which are the main source of data for many earthquakes in the Atlas, since it allows for the inclusion of direct intensity prediction equations (IPEs) in the macroseismic intensity layer. This strategy also proves valuable when directly and automatically incorporating internet-reported intensities like those from the USGS's ‘Did You Feel it?’ system (Wald et al., 2011).

(a) (b)
Figure 1. (a) Sketch of the relative geometry considered in computing the amplitude of a ShakeMap parameter at a given grid point. (b) Weight assigned to an observation relative to the weight of the prediction equation (given by its variance, σ2
PE) as a function of distance to the grid point (in this case the radius of influence of the observation is taken as 10 km, and the maximum radius as 15 km, but these parameters can be changed). Adapted from Worden et al. (2010).
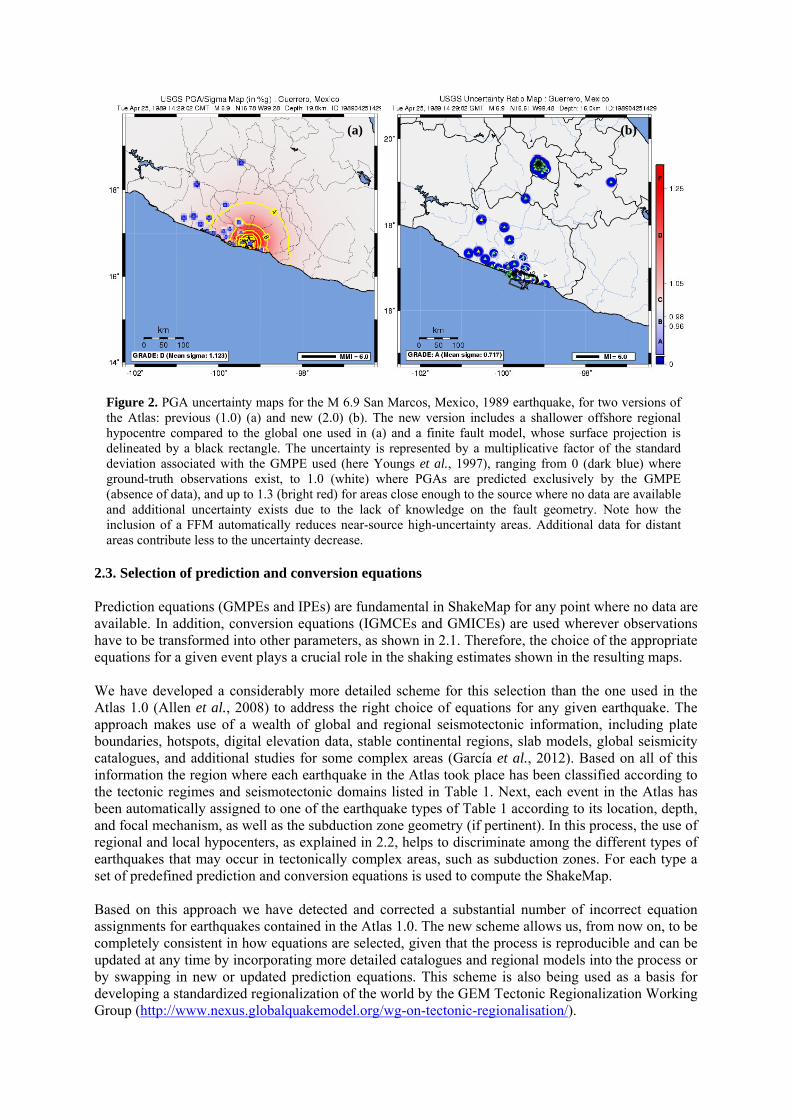
2.2. Source catalogue The first version of the Atlas (Allen et al., 2008) mostly included earthquake locations from global compilations, such as the USGS Preliminary Determination of Epicentres bulletin, or the Engdahl, van der Hilst, and Buland (Engdahl et al., 1998), the Centennial (Engdahl and Villaseñor, 2002), and the Global Centroid Moment Tensor (GCMT) catalogues. Though these are well-documented databases, regional locations tend to be more accurate than global hypocentres in countries with dense-enough networks. Additionally, for moderate-to-large earthquakes (M ≥ 6) a finite fault model (FFM) is needed in order to use any of the more precise distance measurements, such as the closest distance to the source, considered in most modern prediction equations. The Atlas 2.0 source information is based on the PAGER-CAT catalogue (Allen et al., 2009), which in its present form includes information not only from the above mentioned databases, but from the GEM Global Instrumental Earthquake Catalogue, the Utsu Catalogue of Damaging Earthquakes in the World (Utsu, 2002), the NOAA Significant Earthquakes Database, regional catalogues provided by national and local agencies, and a vast amount of source studies on individual earthquakes. Whenever the reliability of regional and local sources was confirmed, we have substituted global hypocentres by regional ones. This is particularly important for depth estimations, since global catalogues tend to suffer from considerable depth errors, sometimes as large as 30-50 km depending on the region, which can cause substantial under or overestimation of the ground shaking depicted in the maps. For most relevant earthquakes we have also conducted a thorough search on the literature to add finite source models, resulting in the inclusion of FFMs for more than 60% of M ≥ 8 events and 20% of M ≥ 7 events, plus many others in the M 5.5-7.0 range. As of April 2012 there are more than 240 FFMs incorporated into the Atlas, covering the majority of the most destructive earthquakes in the 1973-2011 period, and the list is continuously being updated. Figure 2 shows an example of the changes in shaking uncertainty due to the update of the source catalogue (use of a regional hypocenter and addition of a FFM) in one of the Atlas events. The previous version of the Atlas reached till mid-2007 and excluded some potentially relevant events based on simplistic magnitude and depth criteria. These criteria have now been refined to consider more accurately the potential damage of a given earthquake, and the Atlas span has been extended through June 30th 2010, resulting in a broader catalogue containing nearly 8,000 events. Most of the key earthquakes that occurred in the second half of 2010 and 2011, such as Darfield and Christchurch (New Zealand), Tohoku (Japan), Lorca (Spain), and Virginia (USA), are also available in this version.
(a) (b)
Figure 2. PGA uncertainty maps for the M 6.9 San Marcos, Mexico, 1989 earthquake, for two versions of the Atlas: previous (1.0) (a) and new (2.0) (b). The new version includes a shallower offshore regional hypocentre compared to the global one used in (a) and a finite fault model, whose surface projection is delineated by a black rectangle. The uncertainty is represented by a multiplicative factor of the standard deviation associated with the GMPE used (here Youngs et al., 1997), ranging from 0 (dark blue) where ground-truth observations exist, to 1.0 (white) where PGAs are predicted exclusively by the GMPE (absence of data), and up to 1.3 (bright red) for areas close enough to the source where no data are available and additional uncertainty exists due to the lack of knowledge on the fault geometry. Note how the inclusion of a FFM automatically reduces near-source high-uncertainty areas. Additional data for distant areas contribute less to the uncertainty decrease.
2.3. Selection of prediction and conversion equations Prediction equations (GMPEs and IPEs) are fundamental in ShakeMap for any point where no data are available. In addition, conversion equations (IGMCEs and GMICEs) are used wherever observations have to be transformed into other parameters, as shown in 2.1. Therefore, the choice of the appropriate equations for a given event plays a crucial role in the shaking estimates shown in the resulting maps. We have developed a considerably more detailed scheme for this selection than the one used in the Atlas 1.0 (Allen et al., 2008) to address the right choice of equations for any given earthquake. The approach makes use of a wealth of global and regional seismotectonic information, including plate boundaries, hotspots, digital elevation data, stable continental regions, slab models, global seismicity catalogues, and additional studies for some complex areas (García et al., 2012). Based on all of this information the region where each earthquake in the Atlas took place has been classified according to the tectonic regimes and seismotectonic domains listed in Table 1. Next, each event in the Atlas has been automatically assigned to one of the earthquake types of Table 1 according to its location, depth, and focal mechanism, as well as the subduction zone geometry (if pertinent). In this process, the use of regional and local hypocenters, as explained in 2.2, helps to discriminate among the different types of earthquakes that may occur in tectonically complex areas, such as subduction zones. For each type a set of predefined prediction and conversion equations is used to compute the ShakeMap. Based on this approach we have detected and corrected a substantial number of incorrect equation assignments for earthquakes contained in the Atlas 1.0. The new scheme allows us, from now on, to be completely consistent in how equations are selected, given that the process is reproducible and can be updated at any time by incorporating more detailed catalogues and regional models into the process or by swapping in new or updated prediction equations. This scheme is also being used as a basis for developing a standardized regionalization of the world by the GEM Tectonic Regionalization Working Group (http://www.nexus.globalquakemodel.org/wg-on-tectonic-regionalisation/).

Table 1. Regionalization scheme for equation selection in the ShakeMap Atlas Tectonic Regime Seismotectonic Domain Possible Earthquake Types
Generic Stable Continental Stable Continental Region Above a Slab Stable Continental
Intraslab Generic Stable Oceanic
Stable Oceanic Region Above a Slab Stable Oceanic Intraslab
Shallow Continental Active Continental (shallow)
Deep Continental Active Continental (shallow) Active Continental (deep)
Oceanic Boundary Oceanic Boundary
Shallow Continental Active Continental (shallow) Intraslab
Deep Continental Active Continental (shallow) Active Continental (deep) Intraslab
Above a Slab
Oceanic Boundary Oceanic Boundary Intraslab
Active Non-Subduction Region
Hotspot Hotspot
Generic
Outer-trench Active Continental (shallow) Active Continental (deep) Interface Intraslab
Outer-trench Outer-trench Intraslab
Onshore
Active Continental (shallow) Active Continental (deep) Interface Intraslab
Subduction Zone
Inland/Backarc Active Continental (shallow) Active Continental (deep) Intraslab
2.4. Macroseismic intensity and ground-motion data The first version of the Atlas included most of the macroseismic intensity and ground-motion observations easily available online, which were also amendable to incorporation via automatic processing. This included global and regional repositories, such as the Consortium of Organizations for Strong Motion Observation Systems (COSMOS) database, the Next Generation Attenuation project, the European Strong-Motion Database, the Regional Centre for Seismology in South America (CERESIS) macroseismic intensity database, as well as some national datasets from Australia, Iran, Japan, New Zealand, and the USA. In this second version of the Atlas we have first carried out a thorough review of the available data, in order to remove redundancies, inconsistencies, wrong intensity assignments (such as those related to the X, XI, and XII levels of the MMI scale, no longer in use), and other problems not detected during the automatic processing of the previous data. Following Musson et al. (2010), we have also assumed that the intensity levels of all macroseismic intensity scales currently in use are roughly equivalent, except for the Mercalli-Cancani-Sieberg (MCS) scale. The MCS scale is used systematically in Italy and thus for events in this country we keep a separate set of prediction and conversion equations specifically developed there. In a second step we have requested additional macroseismic and ground-motion data mostly from national and local agencies. This is a time-consuming and less-efficient effort than the one made for the Atlas 1.0, since it requires personal contact with each institution, often long waiting times, and in

most cases numerous data format changes. However, it is still a rewarding process that has significantly increased the number of available ground motions, exceeding 20,000 PGA values and 18,000 PGV and PSA values (42% more data than in the Atlas 1.0), and especially of macroseismic intensity assignments, which have been almost doubled (more than 61,000 data), as seen in Figure 3. This vast amount of new data makes the Atlas 2.0 one of the most comprehensive openly-accessible global repositories on near-source ground shaking observations available to date.
0 100 200 300 400 500 600
FFM
MMI
GM
No. of earthquakes
Atlas 1.0Atlas 2.0
0 10000 20000 30000 40000 50000 60000 70000
PGV&PSA
PGA
MMI
No. of observations
Atlas 1.0Atlas 2.0
(a) (b)
Figure 3. Changes in available data between the previous (1.0) and the new (2.0) version of the ShakeMap Atlas. (a) Changes in the number of earthquakes with finite-fault model (FFM), and ground-motion (GM) and macroseismic intensity (MMI) observations (the rest of the events in the Atlas lack any data and are purely based on prediction equations). (b) Changes in the number of MMI, PGA, PGV, and PSA observations.
Intensity data are especially valuable, since they usually provide wider coverage of near-source areas than ground-motion data, as shown in Figure 4. Moreover, MMI values often represent the only available observations for many significant earthquakes included in the Atlas that took place in countries with a lack of dense seismic networks at the time of the event. As a summary of the discussed improvements, Figure 5 shows an overview of all the changes involved in this second version of the ShakeMap Atlas. Note, however, that not all the earthquakes included in the Atlas have undergone all the steps.
(a) (b)
Figure 4. PGA uncertainty maps for the M 6.5 Aigion, Greece, 1995 earthquake, for two versions of the Atlas: previous (1.0) (a) and new (2.0) (b). In the new version native PGA values from 13 strong-motion stations are represented by green triangles, while converted PGA values from 409 MMI assignments are shown as blue dots. See Figure 2 for a complete explanation of the uncertainty scale used on these maps.

Figure 5. Summary of the changes involved in the new Shakemap Atlas version 2.0 (bottom) compared with the previous version 1.0 (top). The process is shown for the PGA map of the Aigion, Greece, 1995 (left), and San Marcos, Mexico, 1989 earthquakes (right). Finite fault models are shown as black rectangles.
3. SPECIAL SUBSETS OF THE ATLAS 2.0 The new version of the Atlas includes two subsets of special interest for earthquake engineering and related fields, which we describe in some detail in the following subsections. The first subset refers to those earthquakes considered in the Earthquakes Consequences Database developed for the Global Earthquake Model initiative (GEMECD). The second is a compilation of relevant earthquakes in terms of secondary hazards. In particular, this subset contains the best known case studies on landslide and liquefaction effects associated with earthquakes. 3.1. GEM Earthquakes Consequences Database (GEMECD) subset The GEMECD is one of four projects within the Exposure and Vulnerability Global Component of the GEM initiative. The aim of GEMECD is to create a structure to assemble and store earthquake consequence data, such as building and infrastructure damage, ground failure, human casualties, social disruption, or financial and economic loss, in a web-accessible way that can be set as a standard for future events and reference. In order to set up the methodology and database structure the GEMECD consortium, led by Cambridge Architectural Research Ltd., has selected nearly 80 relevant global earthquakes for which detail-enough consequence information is available (So and Pomonis, 2011). For each of these earthquakes all this information will be integrated into a web-based GIS database whose base layer will be the macroseismic intensity ShakeMap. Given the relevance of the GEMECD, we are making a special effort for these earthquakes in order to compile as many MMI and GM data as possible, to find FFMs in the literature, and to perform specific checks on the accuracy of the ShakeMaps. In addition, we provide a zoomed version of the maps that covers approximately the area with MMI VI and above with higher resolution (~0.5 km) than used for regular maps (1 km). Figure 6 shows an example for the M 6.0 Athens, Greece, 1999 earthquake.

(b) (a)
Figure 6. Example of the macroseismic intensity ShakeMaps for one GEMECD event: M 6.0 Athens, Greece, earthquake of 1999. (a) General map. (b) Zoomed map. The black rectangle delineates the surface projection of the FFM (a normal fault dipping SW). Circles: native MMI data; triangles: GM data converted to MMI values via a GMICE (here Worden et al., 2012), the choice of which automatically redefines the legend scale.
3.2. Secondary hazards subset ShakeMap ground-motion layers computed in near-real time, especially PGA and PGV maps, can potentially be used to infer the likelihood of secondary effects, such as landslides or liquefaction, if additional information (topography, soil conditions, water content, etc.) is known or can be approximated. In recent years there have been a number of efforts to incorporate previous methodologies (e.g., Jibson, 2007; Holzer et al., 2011) with ShakeMap products (Godt et al., 2008; Knudsen and Bott, 2011). With this aim in mind, we are incorporating to the Atlas a compilation of global case studies on earthquake-related landslides and liquefaction. Table 2 lists the 1973-2011 events included in this dataset. To this list we are also adding a few recent historical earthquakes with detailed secondary-effects inventories, such as the New Madrid (1811-1812), Charleston (1886), San Francisco (1906), and Table 2. Global case studies for the 1973-2011 period included in the Atlas 2.0 secondary hazards subset
Landslides Liquefaction Date Name, Country M Date Name, Country M 19760204 Guatemala 7.6 19791015 Imperial Valley, USA 6.5 19830502 Coalinga, USA 6.3 19891018 Loma Prieta, USA 6.9 19940117 Northridge, USA 6.7 19940117 Northridge, USA 6.7 19950116 Kobe, Japan 6.9 19950116 Kobe, Japan 6.9 19990920 Chi-Chi, Taiwan 7.6 19990817 Kocaeli, Turkey 7.6 20041023 Niigata-Chuetsu, Japan 6.6 20010126 Bhuj, India 7.6 20080512 Wenchuan, China 7.9 20010228 Nisqually, USA 6.8 20080613 Iwate-Miyagi Nairiku, Japan 6.9 20031222 San Simeon, USA 6.6 20100309 Darfield, New Zealand 7.0 20100404 El Mayor-Cucapah, USA 7.2 20110823 Virginia, USA 5.8 20100903 Darfield, New Zealand 7.0 20110221 Christchurch, New Zealand 6.1 20120311 Tohoku, Japan 9.0

Daly City (1957) earthquakes in the USA, and the Kanto (1923), Fukui (1948), Niigata (1964), and Tokachi-Oki (1968) earthquakes in Japan. This dataset, together with additional geological and geotechnical information that is being compiled for these events, will help the exploration of different empirical approaches to quantify as accurately as possible the likelihood of earthquake-related secondary hazards. Figure 7 shows an example of PGA and PGV maps (the most commonly used ground-motion parameters for the estimation of landslide and liquefaction occurrence) for the M 7.9 Wenchuan, China, 2008 earthquake.
(a) (b)
Figure 7. Example of the zoomed maps for the M 7.9 Wenchuan, China, 2008 earthquake for (a) PGA and (b) PGV. Black rectangles delineate the surface projection of the different fault segments involved in the rupture. Triangles: native GM data; circles: MMI data converted to GM values via an IGMCE (here Worden et al., 2012), the choice of which automatically redefines the legend scale.
4. CONCLUSIONS We have introduced the second version of the USGS ShakeMap Atlas, a greatly improved self-consistent and calibrated catalogue of macroseismic intensity and ground-motion maps for more than 8,000 significant global earthquakes since 1973. The changes introduced from the first version, as well as specific subsets for earthquake-related secondary hazards and the GEM Earthquake Consequences Database, make this new version a greatly improved resource for seismic hazard, scenario, risk, and loss-modeling analyses. AKCNOWLEDGEMENTS We thank all the institutions and individuals that have contributed with their work and generosity in sharing their data to the improvement of the ShakeMap Atlas. D. García was supported by the Postdoctoral Grants Program from the Spanish Ministry of Education (MEC). A comprehensive list of all the contributing institutions can be found in a USGS Open-File Report currently in preparation that will document the ShakeMap Atlas 2.0 in significantly more detail, as well as in the USGS ShakeMap Atlas webpage (http://earthquake.usgs.gov/earthquakes/shakemap/atlas.php).
REFERENCES Allen, T.I., Wald, D.J., Hotovec, A.J., Lin, K.W., Earle, P.S., and Marano, K.D. (2008). An Atlas of ShakeMaps
for selected global earthquakes. Open-File Report 2008-1236, US Geological Survey, Golden, Colorado. Allen, T.I., Marano, K.D., Earle, P.S., and Wald, D.J. (2009). PAGER-CAT: a composite earthquake catalogue
for calibrating global fatality models. Seism. Res. Lett. 80:1, 57-62. doi:10.1785/gssrl.80.1.57. Engdahl, E.R., and Villaseñor, A. (2002). Global seismicity: 1900-1999. In The IASPEI International Handbook
of Earthquake and Engineering Seismology, W.H.K. Lee, H. Kanamori, P.C. Jennings, and C. Kisslinger (eds.), Part A, Chapter 41, 665-690, Academic Press.
Engdahl, E.R., van der Hilst, R., and Buland, R. (1998). Global teleseismic earthquake relocation with improved travel times and procedures for depth determination. Bull. Seism. Soc. Am. 88:3, 722-743.
García, D., Wald, D.J., and Hearne, M.G. (2012). A global earthquake discrimination scheme to optimize ground-motion prediction equation selection. Bull. Seism. Soc. Am. 102:1, 185-203. doi: 10.1785/0120110124.
Godt, J., Şener, B., Verdin, K., Wald, D., Earle, P., Harp, E., and Jibson, R. (2008). Rapid assessment of earthquake-induced landsliding. Proc. of the First World Landslide Forum, Tokyo, Japan, Parallel Sessions Volume, International Program on Landslides.
Holzer, T.L., Noce, T.E., and Bennett, M.J. (2011). Liquefaction probability curves for surficial geologic deposits. Environmental and Engineering Geoscience XVII:1, 1–21.
Jibson, R. (2007). Regression models for estimating coseismic landslide displacement. Engineering Geology 91:2-4, 209-218. doi:10.1016/j.enggeo.2007.01.013.
Knudsen, K.L., and Bott, J.D.J. (2011). Geologic and geomorphic evaluation of liquefaction case histories – toward rapid hazard mapping. Seism. Res. Lett. 82:2, 334-335.
Musson, R.M.W., Grünthal, G., and Stucchi, M. (2010). The comparison of macroseismic intensity scales. J. Seismol. 14:1, 413–428. doi:10.1007/s10950-009-9172-0.
So, E., and Pomonis, A. (2011). Global Earthquake Consequences Database (GEMECD). Annual Report. GEM Foundation, Pavia, Italy.
Utsu, T. (2002). A list of deadly earthquakes in the world: 1500–2000. In International Handbook of Earthquake Engineering and Seismology, W. K. Lee, H. Kanamori, P. C. Jennings, and C. Kisslinger (eds.), 691–717. Academic Press.
Wald, D.J., Quitoriano, V., Worden, C.B., Hopper, M., and Dewey, J.W. (2011). USGS ‘Did You Feel It?’ internet-based macroseismic intensity maps. Annals of Geophysics 54:6, 688-709.
Worden, C.B., Wald, D.J., Allen, T.I., Lin, K.W., García, D., and Cua, G. (2010). A revised ground-motion and intensity interpolation scheme for ShakeMap. Bull. Seism. Soc. Am. 100:6, 3083-3096. doi: 10.1785/0120100101.
Worden, C.B., Gerstenberger, M.C., Rhoades, D.A., and Wald, D.J. (2012). Probabilistic relationships between ground-motion parameters and Modified Mercalli intensity in California. Bull. Seism. Soc. Am. 102:1, 204-221. doi: 10.1785/0120110156.
Youngs, R.R., Chiou, S.-J., Silva, W.J., and Humphrey, J.R. (1997). Strong ground motion attenuation relationships for subduction zone earthquakes. Seism. Res. Lett. 68:1, 58-73.