shaikshik parisamvad - 1-27.pdf · · 2013-03-14shaikshik parisamvad ... the ncte act only dealt...
TRANSCRIPT

ISSN 2231-2323
SHAIKSHIK PARISAMVADSHAIKSHIK PARISAMVAD(An International Journal of Education)
Banaras Hindu UniversityAlumni Association of Education, B.H.U.
Faculty of Education, Kamachha, Varanasi-10 (U.P.), Indiawww.aaebhu.com, www.spijebhu.in
Vol. 3, No. 1, January 2013

Mahamana Madan Mohan Malaviya (25 December 1861 – 12 November 1946)
Mahamana Madan Mohan Malaviya (25 December 1861 – 12 November 1946)
This issue of the journal is being published for the readers amidst the winter chills. The natural cold has not hampered our zeal rather it has given us an opportunity and strength to work in team for the academic sharing of knowledge in the form of the present issue.
This issue includes ten articles and research papers. They are
related to various interesting areas in education and allied fields. Mainly these papers are focused on the issues like Mathematics Learning, Sibling Configuration, Girl Child and Women Education, Inclusive education, Role of Judiciary in Teacher Education, Environmental Ethics Education, Concept maps in Chemistry and Use of Multi-media in Education. We hope that researchers in the field of Education and allied Disciplines will be certainly benefitted by the contents.
We are grateful to all the members of the advisory body, the members of the editorial committee, authors and the Seema Press who helped us to bring out the January 2013 issue of SPIJE in this form. Views of readers are always invited for improvement of the future issues. You can always communicate your views, critical comments and suggestions to us for further improvement. The academic fraternity is also invited to contribute articles, research papers and book reviews for wider dissemination through the print and electronic form of forthcoming issues of SPIJE.
Editor SPIJE
Editorial

Sl.No.
1.
2.
3.
4.
5.
6.
7.
8.
9.
10.
Topic and Author/s
THE ROLE OF JUDICIARY IN TEACHER EDUCATION IN INDIA
Anupama Rai, H.C.S. Rathore
CONSTRUCTION AND USE OF CONCEPT MAPS FOR THE TEACHING
LEARNING PROCESS OF ORGANIC CHEMISTRY
Kanak Sharma, Meenakshi Singh
PREPAREDNESS OF STUDENTS IN FIRST YEAR MATHEMATICS:
IMPORTANCE OF PLACING THE FOCUS AND RESPONSIBILITY OF
LEARNING ON STUDENTS
Gurudeo Anand Tularam
SIBLING CONFIGURATION AFFECTING EDUCATIONAL ATTAINMENT: AN
EXPLANATION BY CONFLUENCE MODEL AND RESOURCE DILUTION
HYPOTHESIS
Sumant Kumar Yadav
ATTITUDE TOWARDS TRIBAL GIRLS’ EDUCATION AMONG THE
TEACHERS AND PARENTS OF ARUNANCHAL PRADESH
Kesang Degi
OPINION OF TEACHER EDUCATORS REGARDING ENVIRONMENTAL
EDUCATION AND ENVIRONMENTAL ETHICS EDUCATION
Anupam Singh and Sunil Kumar Singh
APPRAISAL OF INCLUSIVE EDUCATION WITH REFERENCE TO PHYSICAL
ACCESS IN GANJAM DISTRICT OF ODISHA
Sunanda Jati
WOMEN EMPOWERMENT IN INDIA: LEGISLATIVE GOALS AND
REALITIES
Amrita Katyayni
A COMPARATIVE STUDY OF ADJUSTMENT OF VISUALLY IMPAIRED
AND SIGHTED ADOLESCENTS
S.N. Pandey, Rajesh Kumar Pandey
fo|kfFkZ;ksa dh vfHk:fp ij cgqvk;keh 'kSf{kd mikxeksa dk izHkko % ,d v/;;u
euh"kk dkS'kys'k] fu'kh HkkEcjh
Page No.
1-6
7-23
24-33
34-42
43-46
47-58
59-66
67-72
73-76
77-84
Contents

Shaikshik Parisamvad (An International Journal of Education) | 1SPIJE , ISSN 2231 – 2323 (Print), 2231 – 2404 (Online)Vol.3, No.1, January 2013, pp 1 - 6.
© 2013 AAEBHU
THE ROLE OF JUDICIARY IN TEACHER EDUCATION IN INDIA
Kamachha,Varanasi-10,U.P. ,India)
ABSTRACT
With the enactment of National Council for Teacher Education Act, 1993, the teacher education system of India was brought up under one common legislative umbrella. The reason behind this enactment was to ensure planned and coordinated development of teacher education throughout the country, but the system being regulated by four acts has witnessed a large scale judicial intervention due to various reasons. There has been continuous change in these rules and regulations. In this paper the effect of these amendments on judiciary as well as the effects of judicial interventions on the amendment has been discussed.
Key-words : Judiciary, Judicial Intervention, National Council for Teacher Education (NCTE) Act.
Introduction
Higher education of India is structured around centralized regulatory bodies with wide-ranging powers such as the University Grants Commission (UGC), All India Council for Technical Education (AICTE), Medical Council of India (MCI), Bar Council of India (BCI), and National Council for Teacher Education (NCTE).These bodies were established and empowered through legislative acts. These acts specify the role and the functions of these institutions or regulatory bodies for uniform and qualitative development of specific fields of higher education. But the lacunae and weaknesses in the regulations of these bodies have led to increased judicial interventions. The weakness and failures of the concerned legislation has been a critical factor in the judiciary's growing power in India.
In the field of teacher education the National Council for Teacher Education (NCTE) was set up in 1973 as an advisory body to the government at the center and the state on matter related to teacher education .But it was the year 1995 when the parliament of India empowered the council with statutory provisions and the entire teacher education system got a specific Act (i.e. NCTE Act-1993) for its regulation. Thus the teacher education system in India which was hitherto governed by three legislative Acts got the fourth (NCTE) act to regulate uniform qualitative development of teacher education in India. Hence today following four acts govern/monitor teacher education in India.
1. The University Grants Commission Act, 1956;
2. The State University Act, (state)
3. The Basic Education Act, (state)
4. The National Council for Teacher Education (NCTE) Act, 1993
Being governed and regulated by four Acts, teacher education has witnessed a number of judicial interventions due to inherent conflicts/contradictions in the norms/rules/policies if the above
(Anupama Rai and H.C.S. Rathore, Research Scholar and Professor, Faculty of Education, B.H.U.,

2 | SPIJE, Vol.3, No.1, January 13
acts. Often the courts have passed judgments which have compelled certain amendments in the acts/regulations of these bodies. In this article some important court cases related to teacher education which had led to amendments in the acts are reviewed. The purpose of this review is to suggest that all the four bodies (University Grant Commission, National Council for Teacher Education, State Universities and Basic Education Boards) must work in coordination in framing their regulation to avoid litigations in the field of teacher education.
The Court Cases and the Amendments related with Teacher Education Acts
Soon after its enactment, the NCTE Act was challenged in the High Court of Rajasthan by a private educational institution called Shah Goverdhan L. Kabra TeacherS College. The college challenged the order of the Northern Regional Committee of National Council for Teachers Education about rejecting the application of the institution for the recognition of its B.Ed. course. This case was further contested in the Supreme Court of India and became a leading case in establishing the validity of the Act. The Supreme Court in the Para 10 of the case observed that “on examining the statute as a whole and on scrutiny of the object and scope of the statute, we have no manner of doubt that even sub section 4 of section 17 is very much a law dealing with the coordination and determination of standards in institutions for higher education coming within entry 66 of the list III of the seventh schedule and thus the Union legislature did have the competence for enacting the said provision” (Union of India and Ors. vs. Shah Goverdhan L. Kabra Teachers College (2002).
The next noticeable judicial intervention was the direction of the Supreme Court in the case of St. Johns Teacher Training College vs. Regional Director, National Council of Teacher Education (2003). In this case the regulation 5 (e) and 5 (f) of the NCTE (Application for Recognition, the Manner for Submission, Determination of Conditions for Recognition of Institutions and Permissions to Start New Course or Training) Regulation 1995, which was related with the necessity of NOC from the State Government for getting recognition for starting a new course was challenged as ultra vireos and invalid. Mean time, during the pendency of this case, the council made fresh regulation on November 13, 2002. This was known as the NCTE (Form of application for recognition, the time of submission of application, determination of norms and standards for recognition of teacher education program me and permission to start new course or training)
thRegulation 2002. These Regulations were made through an amendment which came in effect on 6 June 2003 which was induced by the judgment of St. Johns Teacher training college case. As per this amendment, the state government has to take decision within a period of six months of the last date of receipt of application for the grant of NOC (sec 6 (ii).Prior to this judgment and amendment there was no time limit prescribed on the part of the state government for taking any decision in the matter of NOC. While the apex court observed that “the role of state government is certainly important for supplying the requisite data which is essential for formation of opinion by the regional committee while taking a decision under sub section (3) of the section 14 of the Act”(Para 11). Therefore, the Court directed the council to frame appropriate regulation in the matter with the observation “It will therefore be proper that the Council frames appropriate Regulation fixing the time limit within which a decision should be taken by the State Government on the application moved by an institution for grant of a NOC”.
The NCTE Act was amendment another time in lieu of the judgment in the case of Basic Education Board vs. Upendra Rai and others where the Supreme Court observed that the NCTE Act had nothing to do with educational institutions at primary level. The Supreme Court interpreted that the NCTE Act only dealt with the second category of institutions (i.e. teachers' training institutes) and therefore it had nothing to do with the ordinary educational institutions referred to above.
SPIJE, Vol.3, No.1, January 13 | 3
Hence, the qualification for appointment as teacher in the ordinary educational institutions like the primary school cannot be prescribed under the NCTE act and essential qualifications are prescribed by the local act and rules in each state…..” (Para 19).
After this judgment, the Ministry of Human Resource Development (MHRD) decided to amend the NCTE Act in order to clarify that the Act applies to schools and their teachers also. Through an Amendment (The National Council for Teacher Education (Amendment) Bill, 2010) NCTE was empowered to lay down the minimum qualifications for a person to be eligible as a teacher in primary and other schools. This clearly indicates that under the existing provisions of the Act, the Council did not have the power to specifically lay down minimum qualifications for school teachers. And the main purpose of bringing the proposed amendments in the Act is to remove this ambiguity only. (Para 4.5 of The National Council for Teacher Education (Amendment) Bill, 2010)
Several examples of judicial intervention on the teacher education system can be cited which were related to the issue of admission in B.Ed course. They were the cases of T.M.A. Pai vs. State of Karnataka (2002), Islamic Academy of Education and others vs. State of Karnataka (2003), P.A. Inamdar vs. State of Maharasthra (2005). The judgment passed in these cases became the basis of Government Order regarding the selection procedure, management quota and the fee structure. In the judgment of T.M.A. Pai vs. State of Karnataka the Supreme Court differentiated between the type of administration for government aided and self financed institutes. The Supreme Court Observed that:
“…. the essence of a private educational institution is the autonomy that the institution must have in its management and administration…………… Bureaucratic or governmental interference in the administration of such an institution will undermine its independence.(Para 55) ………unaided professional institution are entitled to autonomy in their administration while at the same time, they do not forego or discard the principle of merit .It would, therefore, be permissible for the university or the government, at the time of granting recognition, to require a private unaided institution to provide for merit-based selection while, at the same time giving the management sufficient discretion in admitting students. This can be done through various methods. For instance a certain percentage of the seats can be reserved for admission by the management out of those students who have passed the Common Entrance Test held by itself or by the State /University and have applied to the college concerned for admission , while the rest of the seats may be filled up on the basis of counseling by the State Agency”(Para 68).
After the pronouncement of the judgment on 31st October, 2002, the State of Uttar Pradesh issued a Government Order dated 25th July2003 and withdrew certain provisions from the Government Order 11th November 97 which related to the classifications of seats, fee structure and percentage of classification.
The case of Islamic academy of education re-interpreted the judgment of T M A Pai's case and it become a landmark in deciding not only the quota of management seats but the admission procedure also. On 22nd April 2004, following the judgment of this case, state government issued the order declaring the ratio of the government and management quota seats will be 85:15 for the session 2004-2005. This decision of the Government, which came in light of the apex court judgment, prompted many writ petitions in the Court as this decision was also made applicable on the admission procedure in the unaided colleges. The judgment states that:
“.…… the management could select students, of their quota, either on the basis of the common entrance test conducted by the State or on the basis of a common entrance test to be conducted by an association of all colleges of a particular type in the state…… if any profession

4 | SPIJE, Vol.3, No.1, January 13
colleges chooses not to admit from the Common Entrance Test conducted by the association then that college must necessarily admit from the Common Entrance Test conducted by the state”( Para 16).
Following the Judgment of this case, an amendment was made in section 7, 12, and 14 of the Uttar Pradesh State University Act (Regulation of Admission to Courses of instruction for Degree in education in Affiliated, Associated and Constituent Colleges) Order, 1987. Through this amendment, the aided colleges were directed to conduct their entrance exam in association on the date other than the date of the university entrance test (7a,). However they were directed to take admission strictly on the merit basis as per the list prepared under supervision of the concerned university (sec.12 and 14). This amendment was known as Uttar Pradesh State University Act (Regulation of Admission to Courses of instruction for Degree in education in Affiliated, Associated and Constituent Colleges) Order 2005.
The judgment in T. M.A. Pai case became the benchmark in the judgment of various other cases and associated decisions. This further regulated the teacher education in Uttar Pradesh. In the cases of Maa Sharda Maha Vidyalaya vs. State of U.P. and others, the High court of Allahabad directed that the fee which the management could charge from individual students would be uniform with a ceiling of Rs. 14,500/- (para26). These judgments lead to the formulation and enactment of new Act titled as The Uttar Pradesh Private Professionals Educational Institutions (Regulation of Admission and Fixation of fee) Act, 2006.
In 2006, the State Government declared to conduct joint entrance test for B.Ed admission in the state universities and its associated and affiliated colleges. This step was taken by the State Government in view of the law as laid down by the apex court in the cases of P.A. Inamdar vs. State of Maharasthra (2005) in which Hon,ble Supreme Court examined various aspects to impart education of professional courses like B.Ed. in various institutions and colleges. The Supreme Court held that the admissions for professional course should be made on the basis of entrance test under single window system and until the institutions themselves were not able to evolve an effective mechanism for such entrance tests ensuring transparency and merit. Responding the observation of the apex court, the state had to step in and arrange for such an entrance test.
Thus it can be seen that there has been continuous intervention of judiciary to keep transparency, responsibility and efficiency as the guiding principles in the teacher education system. Judiciary, while reinterpreting the central law had pointed towards various deficiencies in the law and made useful suggestions and gave direction to the state governments as well the council. Such suggestions from the Courts have caused positive changes in nearly all the aspects of teacher education.
The Judicial Intervention due to Amendments in Acts
Judicialisation in teacher education is viewed not only as the effect of judiciary in term of changes in acts an regulation causing change in the entire system. It is also evident, when the changes have raised bunch of writ petition. As said above various amendment in the regulation and act law been made due to the concerned authorities decision and judicial intervention. These amendments have raised dispute related with admission, recognition, affiliation, management quota seats and fee issue.
As said earlier, due to the Islamic Academy case, the state government fixed the management quota as 15% of total intake. This decision change by the government in the admission procedure was challenged in the court, when the state regulation made the provisions of common entrance test to be conducted by all the universities on date. The amendment in NCTE Norms and the

SPIJE, Vol.3, No.1, January 13 | 5
Regulation1987 under the State University Act related with eligibility criteria had led to the largest category of disputes.In1983the State Government following the provisions of 28(5) (b), framed the Rule of 1983 regarding academic qualification for admission in B.Ed. It mandates that any candidate having graduate degree in any discipline can apply. Further the changed regulation 1987 induced the criteria of cut off marks as 45%, NCTE after it inception made its provision in 2002 and followed the same criteria, but in 2005, 2007 and 2009, it kept on switching its criteria from 45% to 50% and 50% to 45%.This switch over and the differences between NCTE and the state university act led to a blunder mistake by the authorities raising judicial intervention in term of writ petition not only in U.P. but also in Maharastra and Delhi. The changes/amendment in the norms pertaining to recognition has also led to court cases. When the NCTE made a temporary arrangement of granting recognition even in absence of NOC, this amendment led to dispute related with the government policy, causing bunch of writ petition demanding affiliation from the State Governments for running BTC course (Dau Dayal Mahila PG College vs. State of UP). Similarly when in Madhya Pradesh NCTE issued an order of withdrawing recognition of various B.Ed. the colleges, a division bench of High Court held that frequent changes in the norms and standards, prescribed by the NCTE, would not apply to colleges established in keeping with previous norms and standard regulations. The Bench said that norms and standards, revised from time to time with regard to "non alterable characteristics" like physical infrastructure, land building, size of classrooms, and qualification of teaching and non-teaching staff cannot be applied to previously recognized colleges(The Times of India, 2012)
Conclusions
Based upon the above analysis of some prominent court cases and their judgments, it is clear that the intervention of judiciary has led to several amendments in the NCTE and State Government Acts relating to teacher education. Further, it is also evident that frequent changes in policy by both bodies has also led it litigation in the field of teacher education. Hence it would not be out of place to suggest that both NCTE and State Government should consult each other before taking any policy decision which is in contravention to the Act/Statutes of both bodies. As far as possible ad-hoc /contingency decisions by regulatory bodies should either be avoided or if they needed, then should be taken consultation after arriving at a consensus. This will lead to minimization of litigation in teacher education, there by saving resources, avoiding hardship of students and ensuring time bound completion of teacher education courses.
References:
1. Barar,P.K. (2011). The Uttar Pradesh State Universities Act, 1973, Allahabad: Pustak Sadan
Prakashan.
2. Basic Education Board vs. Upendra Rai (2008). Supreme Court Cases vol:3. Lucknow:
Eastern Book Company,432.
3. Dau Dayal Mahila PG College vs. State of UP (2007). Education and Service Cases vol 3,
Allahabad: Malhotra Law House, 1946.
4. Maa Sharda Maha Vidyalaya vs. State of U.P (2007). Uttar Pradesh Local Bodies and
Educational Cases.vol:1.Allahabad: Indian Law Publication 784 .
5. MHRD (2011). Revised Norms for Admission in B.Ed. Colleges, New Delhi, Press

6 | SPIJE, Vol.3, No.1, January 13
Information Bureau, Govt. of India. Retrieved from: http://pib.nic.in/newsite/erelease.
aspx?relid=35961, on 4.01.2012
6. Ministry of Law, Justice and Company Affairs (30/12/1993) National Council for
Teacher Education Act, 1993 Retrieved from: http:// www. ncte-
india.org/noti/act.htm, on 26/12/2007.
7. P.A. Inamdar vs. State of Maharasthra (2005). Supreme Court Cases vol. 6, Lucknow:
Eastern Book Company. 537.
8. St.Johns Teacher Training College vs. Regional Director, National Council of Teacher
Education (2003). Supreme Court Cases. Lucknow: Eastern Book Company. 321.
9. T.M.A. Pai Foundation vs. State of Karnataka.(2002). Supreme Court Cases,vol.8,
Lucknow: Eastern Book Company.481.
10. The Times of India (April 22,2012). HC rejects National Council for Teacher Education
order on norms for B.Ed colleges, Bhopal.
11. The National Council for Teacher Education (Amendment) Bill, 2010, Rajya Sabha Secretariat,
New Delhi, Retrieved from: http://www.prsindia.org/uploads/media/NCTE/SCR%20
National%20Council%20for%20Teacher%20Education%20Amendment%20Bill%202
010.pdf, on30/12/2010
12. Union of India and Ors. vs. Shah Goverdhan L. Kabra Teachers College, (2002). Supreme
Court Cases vol. 8, Lucknow: Eastern Book Company.228.
13. University Grants Commission Act, (1956). In The UGC Act 1956 as Modified upto
the 20th December 1985 and Rules and Regulations under the Act. New Delhi,
Secretary, University Grants Commission,1-22.

CONSTRUCTION AND USE OF CONCEPT MAPS FOR THE TEACHING LEARNING PROCESS OF ORGANIC CHEMISTRY
(Kanak Sharma, Meenakshi Singh, Research Scholar and Associate Professor, Faculty of Education,
B.H.U., Kamachha,Varanasi-10, U.P. ,India)
ABSTRACT
Chemistry universities. In India all aspirants of professional courses related to the science stream such as Medical, Engineering Agriculture, Pharmacy, Environmental Sciences, Earth Sciences have to study Organic Chemistry in order to procure admission. Being a fundamental content area in Chemistry, Organic Chemistry has important applications in mineralogy, metallurgy, material science environmental science, medicine, pharmacy and others. As a result of its inherent complex nature, Chemistry is often full of abstract concepts and may lead to extensive misconceptions among students. It is important to find various new as well as interesting ways that can lead towards meaningful Chemistry learning. One way to accomplish this is to apply Concept maps as a device of meaningful learning based on Ausubel's theory. Ausubel's assimilation theory of cognitive learning places central emphasis on the influence of students' prior knowledge on subsequent meaningful learning. The use of concept maps as teaching strategy was first developed by Joseph D. Novak of Cornell University in the early 1980's. This paper discusses the use of Concept Maps in the teaching and learning of Organic Chemistry. Concept Maps on the topic of 'Amines, have been taken as example to explain he construction and use of Concept Maps in Organic Chemistry.
Key- words: Concept maps, teaching & learning, Organic Chemistry, Ausubel's Assimilation theory, Meaningful learning
Introduction
The importance of Chemistry is, now recognized by all educationists. Chemistry has gained a
secure position in the curricula of schools, technical colleges and universities, both as an essential
part of general education for life and as a separate branch of science.
In India all aspirants of professional courses related to the science stream such as Medical,
Engineering Agriculture, Pharmacy, Environmental Sciences, Earth Sciences and even Home
Science not only have to study Organic Chemistry but have to excel in it in order to procure
admission through competitive exams.
According to Chen (2004) “Being a fundamental content area in Chemistry, Organic Chemistry
has important applications in mineralogy, metallurgy, material science environmental science,
medicine, pharmacy and others”.
Chemistry is often full of abstract concepts resulting from its inherent complex nature. It may
lead to extensive misconceptions among students (Gable, 1999). It is also a common problem in
Chemistry that even if students do well in examinations, they still may fail in solving basic textbook
problems, which is a sign of rote learning (Pendley et al., 1994).
has gained a secure position in the curricula of schools, technical colleges and
Shaikshik Parisamvad (An International Journal of Education) | 7SPIJE , ISSN 2231 – 2323 (Print), 2231 – 2404 (Online)Vol.3, No.1, January 2013, pp 7 - 23.
© 2013 AAEBHU
8 | SPIJE, Vol.3, No.1, January 13
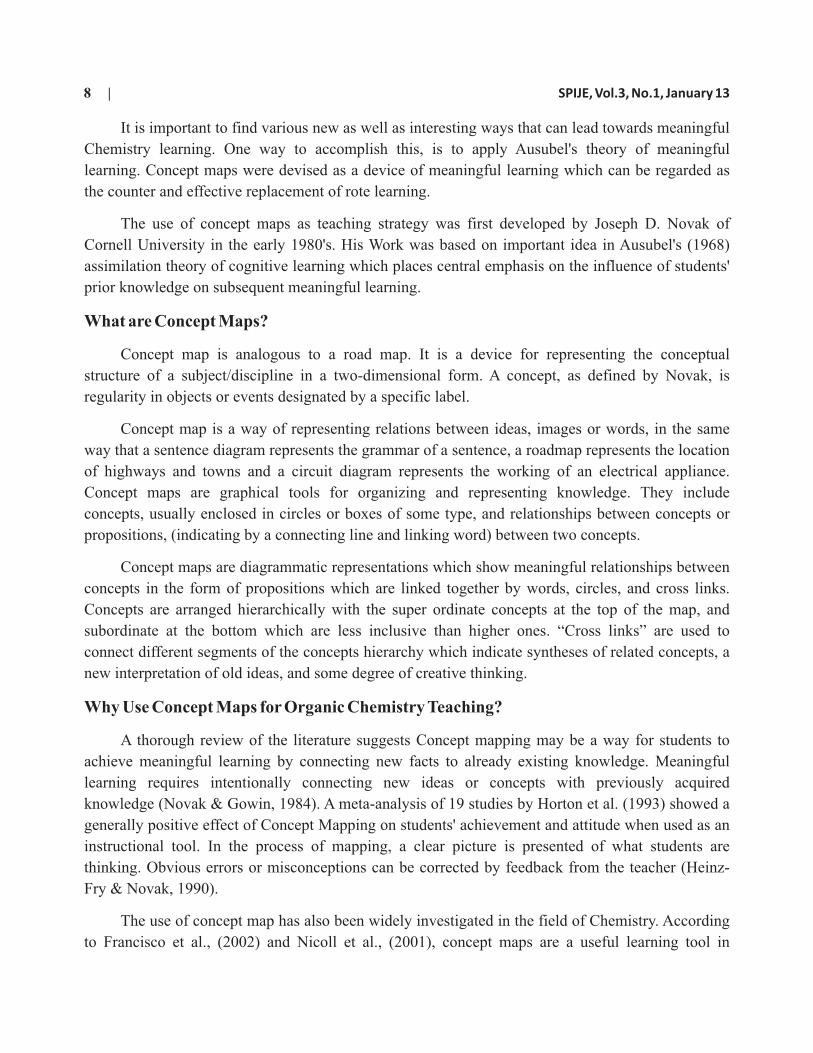
It is important to find various new as well as interesting ways that can lead towards meaningful
Chemistry learning. One way to accomplish this, is to apply Ausubel's theory of meaningful
learning. Concept maps were devised as a device of meaningful learning which can be regarded as
the counter and effective replacement of rote learning.
The use of concept maps as teaching strategy was first developed by Joseph D. Novak of
Cornell University in the early 1980's. His Work was based on important idea in Ausubel's (1968)
assimilation theory of cognitive learning which places central emphasis on the influence of students'
prior knowledge on subsequent meaningful learning.
What are Concept Maps?
Concept map is analogous to a road map. It is a device for representing the conceptual
structure of a subject/discipline in a two-dimensional form. A concept, as defined by Novak, is
regularity in objects or events designated by a specific label.
Concept map is a way of representing relations between ideas, images or words, in the same
way that a sentence diagram represents the grammar of a sentence, a roadmap represents the location
of highways and towns and a circuit diagram represents the working of an electrical appliance.
Concept maps are graphical tools for organizing and representing knowledge. They include
concepts, usually enclosed in circles or boxes of some type, and relationships between concepts or
propositions, (indicating by a connecting line and linking word) between two concepts.
Concept maps are diagrammatic representations which show meaningful relationships between
concepts in the form of propositions which are linked together by words, circles, and cross links.
Concepts are arranged hierarchically with the super ordinate concepts at the top of the map, and
subordinate at the bottom which are less inclusive than higher ones. “Cross links” are used to
connect different segments of the concepts hierarchy which indicate syntheses of related concepts, a
new interpretation of old ideas, and some degree of creative thinking.
Why Use Concept Maps for Organic Chemistry Teaching?
A thorough review of the literature suggests Concept mapping may be a way for students to
achieve meaningful learning by connecting new facts to already existing knowledge. Meaningful
learning requires intentionally connecting new ideas or concepts with previously acquired
knowledge (Novak & Gowin, 1984). A meta-analysis of 19 studies by Horton et al. (1993) showed a
generally positive effect of Concept Mapping on students' achievement and attitude when used as an
instructional tool. In the process of mapping, a clear picture is presented of what students are
thinking. Obvious errors or misconceptions can be corrected by feedback from the teacher (Heinz-
Fry & Novak, 1990).
The use of concept map has also been widely investigated in the field of Chemistry. According
to Francisco et al., (2002) and Nicoll et al., (2001), concept maps are a useful learning tool in

SPIJE, Vol.3, No.1, January 13 | 9
Chemistry. Concept maps can improve understanding of chemical concepts and help build
connections among abstract concepts. Concept maps can also be used as a misconception correction
tool. These concept maps bind concepts with linking words that help students see connections
among them and organize their knowledge hierarchically, based on scientific knowledge. (Francisco
et al., 2002; Nicoll et al., 2001).
Above all the nature of Organic Chemistry adheres very well to the basic framework of
concept maps. All reactions with laboratory conditions may be thought of as links. In Organic
Chemistry we generally learn the chemical reactions in similar manner of a concept map –
It is clear from the above examples that concept maps have an underlying similarity with Organic Chemistry reactions. We can use concept maps in Organic Chemistry:
•To clarify thinking and reinforcing understanding.
•To stimulate creative thinking.
•To integrate new knowledge.
•To identify misconceptions.
(i) R- CHO Na/C2H5OH ?
Aldehyde
Concept Cross link
Concept
(ii) R- CHO
?
R- CH2OH
Aldehyde
Alcohol
Concept
Cross link
Concept
(iii) In the given reaction find out the Compound ‘A’ –
A Conc. H2SO4
B + C Conc. HNO3
Concept Cross link Concept Cross link
Concept
NO2
O2N
OH
NO2
2, 4, 6 –
Trinitrophenol
(Picric acid)

10 | SPIJE, Vol.3, No.1, January 13
•To correct misconceptions.
•To solve complex problems.
•To solve rote learning problems
•To revise previously learned concepts.
How to Construct Concept Maps?
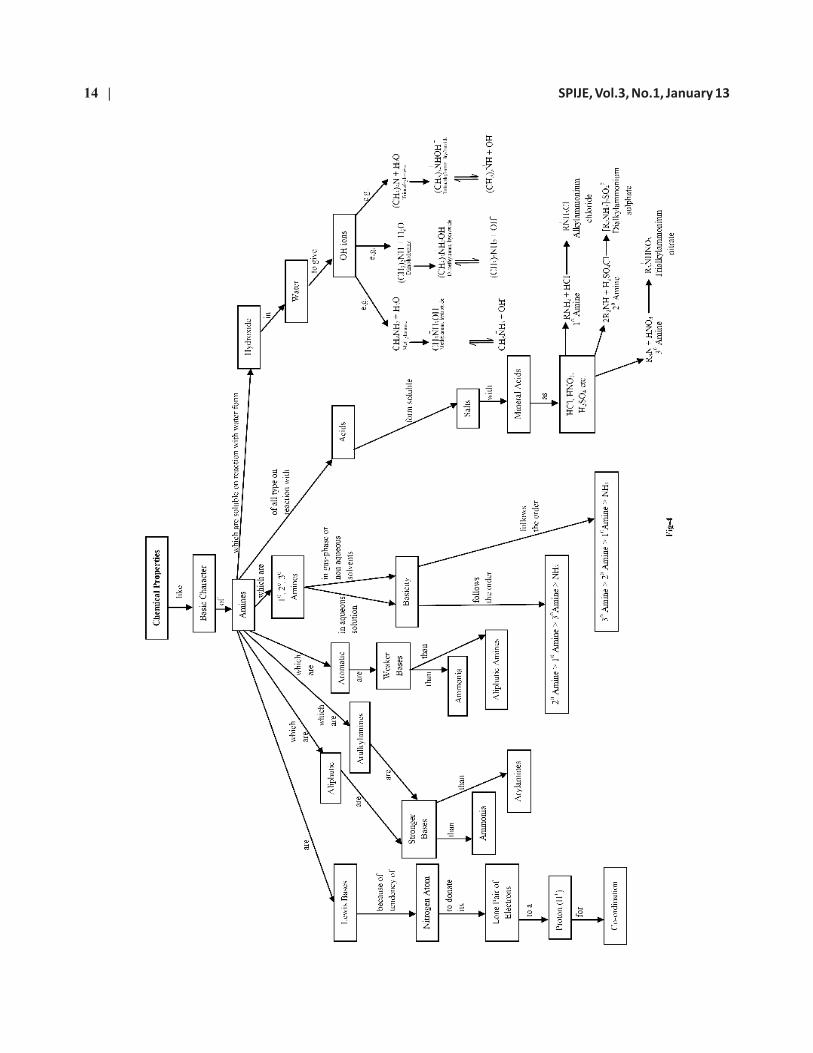
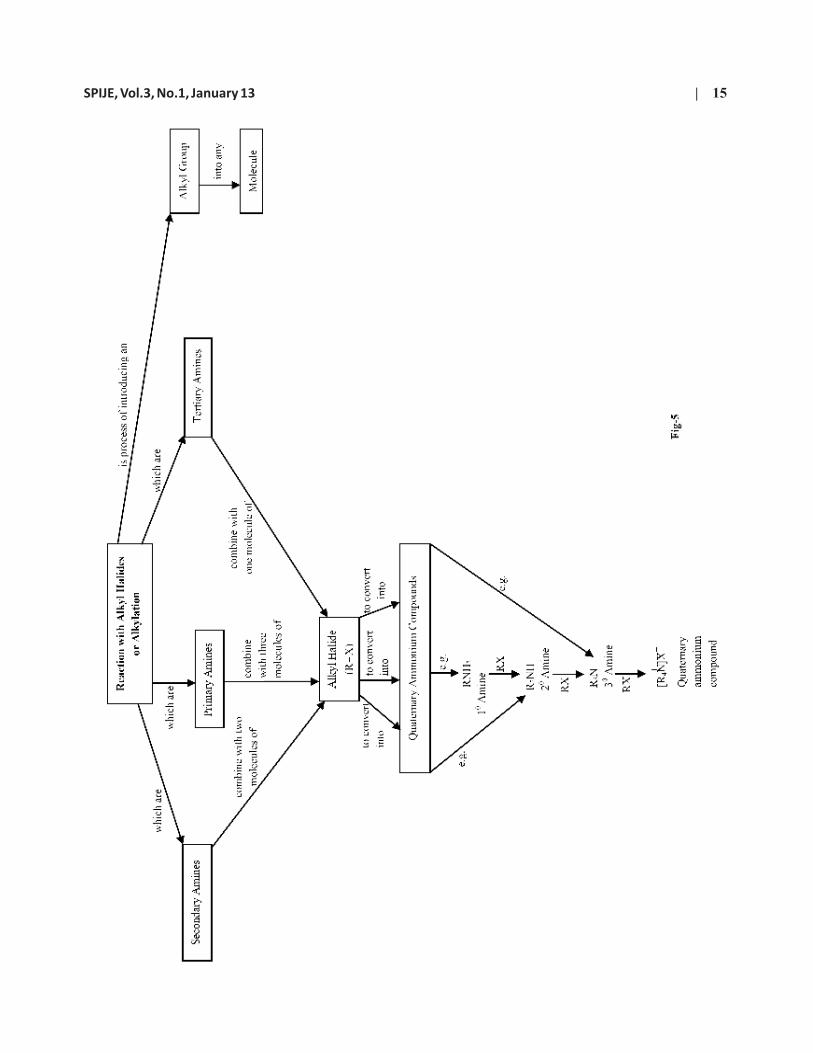
The concept maps are user friendly and easy to draw. To begin with, the mapper selects a topic of interest and reads the topic.(for example Amine (Figure 1)). While reading, around 10-15 major concepts are identified. For instance Aliphatic Amines, Aromatic Amines, Physical Properties, Chemical Properties etc.. The concepts are enclosed within an ellipse outline. These concepts are arranged from general to specific levels, by placing the most important concept (Super ordinate concept) on the top of the map and lesser important concepts (Subordinate concept) on a layer below the top concept. This is followed by labeling links by drawing lines to these concepts. These links provide meaning to the concepts, and few such linking words are: in case of, which are, can be, are derivatives of, shows etc. which are written on the lines connecting the concepts.
The process of preparing a concept map generally comprises following five major steps:
1. The students are given the material pertaining to the lesson/ unit and given instruction to read the material and select the key concepts. The concepts are listed on the blackboard as they are identified. Discussion is held with the students as to which concept is more important and most inclusive in the lesson/unit.
2. The most inclusive or super-ordinate concept is placed at the top. The most general and inclusive concepts are list next working through the first list until all concepts are rank ordered.
3. Students are asked to help in choosing good linking words to form the prepositions shown by the lines on the map.
4. Cross-links between concepts in the concept map are made with the help of students. The concepts are either circles or put in small boxes.
5. Maps are reconstructed if they are poor symmetry or as poorly clustered.
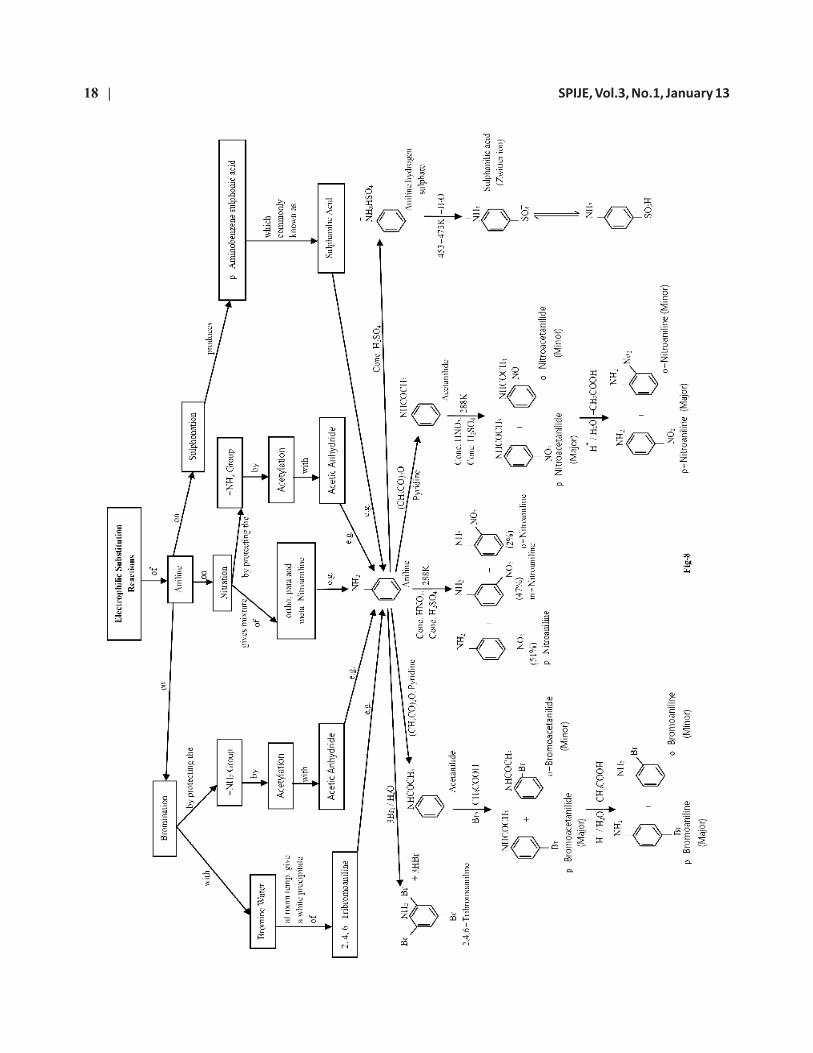
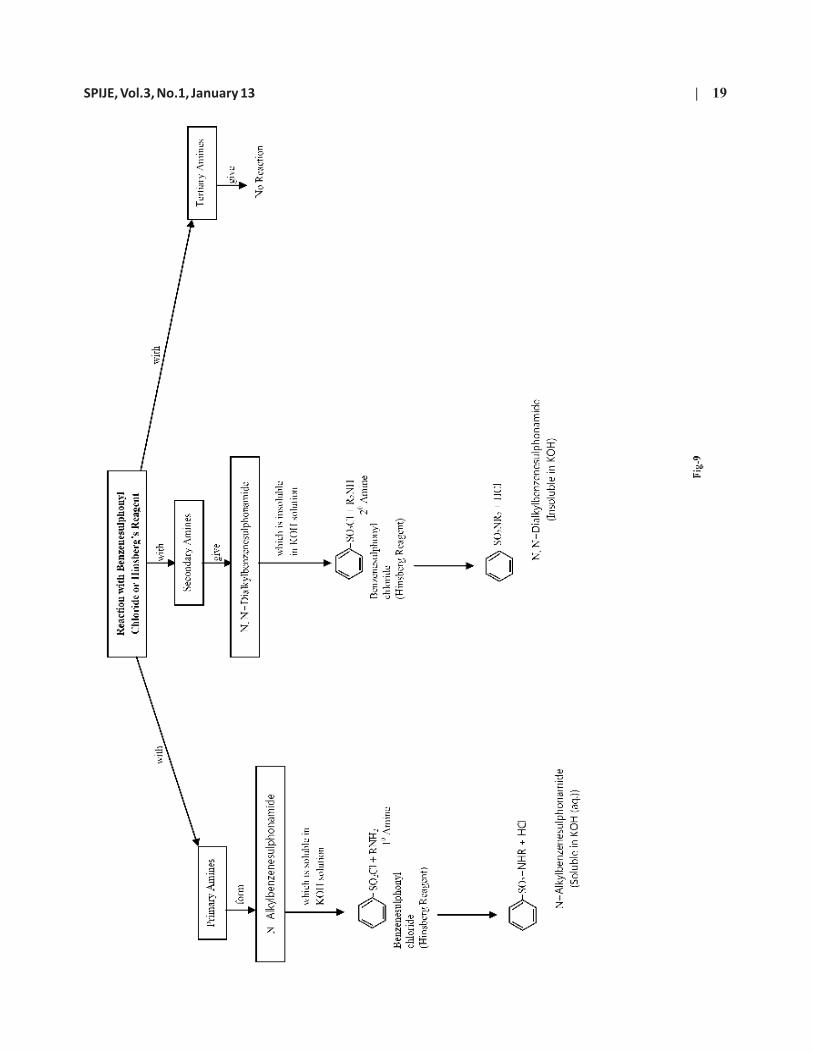
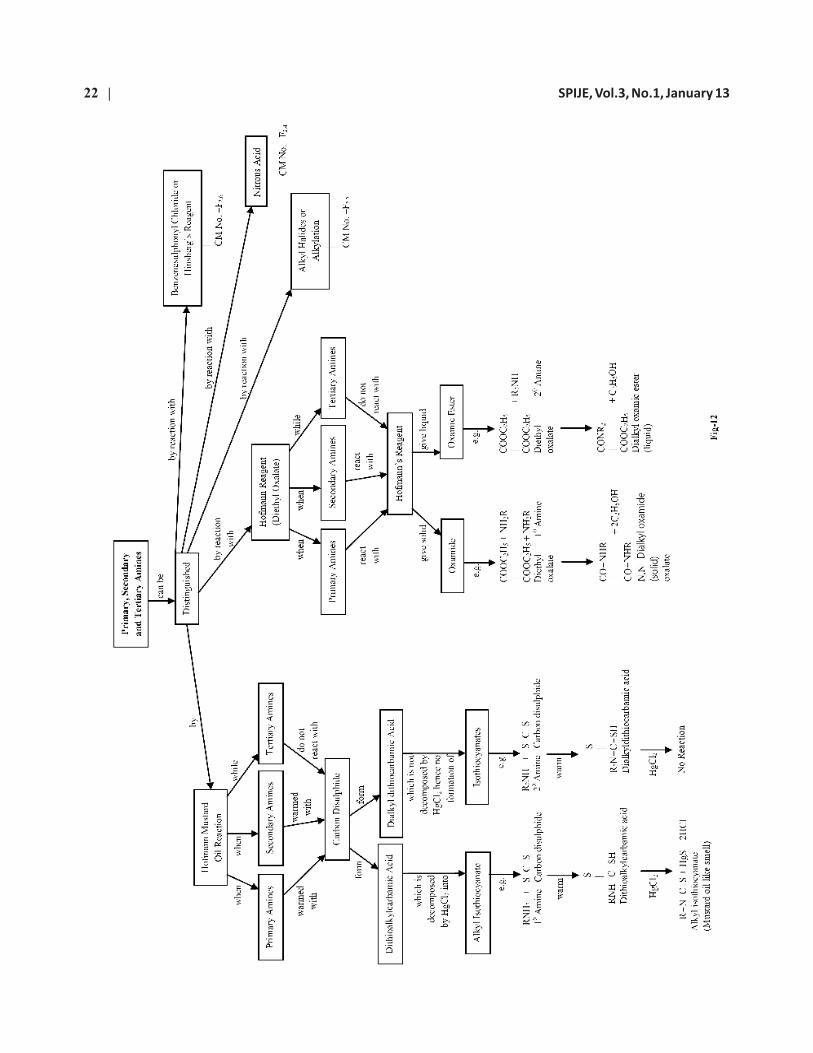
Concept Maps in the Teaching Learning Process of Organic Chemistry
In Organic Chemistry as a teaching strategy, concept maps can be used to help students to
solve rote learning problems and to clarify their misconceptions so that the students' achievement in
Organic Chemistry will be higher. Figure 1 to 12 presents concept maps on preparation, properties,
reactions, and types of Amines. These concept maps enable one to understand how Organic
Chemistry can be taught through Concept mapping in an effective manner following the five broad
steps described above.

SPIJE, Vol.3, No.1, January 13 | 11

12 | SPIJE, Vol.3, No.1, January 13

SPIJE, Vol.3, No.1, January 13 | 13
14 | SPIJE, Vol.3, No.1, January 13
SPIJE, Vol.3, No.1, January 13 | 15

16 | SPIJE, Vol.3, No.1, January 13

SPIJE, Vol.3, No.1, January 13 | 17
18 | SPIJE, Vol.3, No.1, January 13
SPIJE, Vol.3, No.1, January 13 | 19

20 | SPIJE, Vol.3, No.1, January 13

SPIJE, Vol.3, No.1, January 13 | 21
22 | SPIJE, Vol.3, No.1, January 13

SPIJE, Vol.3, No.1, January 13 | 23
Conclusion
In the teaching learning process of Organic Chemistry, the use of concept maps as teaching strategy is useful for the students as well as the teachers. The procedure adopted for teaching through concept maps ensures that the mental map of a concept is built gradually in the minds of the students by their contribution and not imposed upon them. During the construction of Concept maps, difficult concepts can be clarified and can be arranged in a systematic order. Concept maps can reinforce students' understanding and learning by the visualization of key concepts and the inter-relationships of subordinate concepts. Concept maps help in retention of concepts to a large extent.
Concept mapping in teaching helps teachers to be more aware of the key concepts and relationship among them. This helps teachers to convey a clear general picture of the topics along with the different properties, reactions and inter-related concepts with emphasis on their relationships. By doing so, it is less likely to miss and misinterpret any important concept.
It can also assist teachers in evaluating the process of teaching. They can assess the students' achievement by identifying misconceptions and missing concepts. Students' achievement can also be tested or examined by Concept mapping. An efficient use of Concept maps in teaching learning of Organic Chemistry will go a long way in overcoming the misconceptions and popularization the subject and result in more effective lessons.
References
1. Ausubel, D.P. (1963). The Psychology of Meaningful Verbal Learning. New York : Grune & Stratton, Inc.
2. Ausubel, D.P. (1968). A Subsumption Theory of Meaningful Verbal Learning and Retention. In R.G. Kuhlen (ed.), Studies in Educational Psychology. Boston : Blaisdell Publishing Company.
3. Ausubel, D.P. (1968). Educational Psychology: A Cognitive View. New York: Holt, Rinehart and Winston.
4. Chen, G.H. (2004). Reforming Organic Chemistry Teaching Using Student-Centered Methods. T h e C h i n a P a p e r s , N o v e m b e r 2 0 0 4 . R e t r i e v e d o n 1 4 - 0 6 - 0 9 f r o m , http://science.uniserve.edu.au/pubs/china/vol4/CP4_C2.pdf
5. Francisco, J.S., Nakhleh, M.B., Nurrenbern, S.C. and Miller, M.L. (2002). Assessing Student Understanding of General Chemistry with Concept Mapping. Journal of Chemical Education, 79(2), 248-257.
6. Heinze-Fry, J.A. and Novak, J.D. (1990). Concept Mapping brings Long term Movement towards Meaningful Learning. Science Education,74(4), 461-472.
7. Nicoll, G., Francisco, J. S. & Nakhleh, M. B. (2001). An Investigation of the Value of Using Concept Maps in General Chemistry. Journal of Chemical Education,78(8), 1111-1117.
8. Novak, J.D. (1988). Learning Science and the Science of Learning. Studies in Science Education, 15, 77-101.
9. Novak, J.D. (1993). How Do We Learn Our Lesson? Taking Students Through the Process. Science Teacher, 60(3), 50-55.
10. Novak, J.D. and Gowin, D.B.(1984). Learning How to Learn. New York: Cambridge University Press.
11. Pendley, B.D., Bretz, R.L. and Novak, J.D. (1994). Concept Maps as a Tool To Assess Learning in Chemistry. Journal of Chemical Education, 71 (1),9-15.

PREPAREDNESS OF STUDENTS IN FIRST YEAR MATHEMATICS: IMPORTANCE OF PLACING THE FOCUS AND RESPONSIBILITY OF
LEARNING ON STUDENTS(Gurudeo Anand Tularam, Senior Lecturer in Mathematics and Statistics,Science Environment Engineering and
Technology (ENV),Environmental Futures Centre,Griffith University, Kessels Road, Nathan, QLD, 4111,Brisbane,
Australia, Email: [email protected])
ABSTRACT
Australia is presently experiencing a decline in student numbers in higher mathematics courses. It is then critical to address some fundamental issues affecting the learners in mathematics classrooms. Observations of high schools students and new university entrants to first year mathematics show that students are not being prepared for learning itself or for learning environments generally; let alone for mathematics learning environments. The author's in class observations over years show that students fail to actively take part in learning voluntarily; or even fail to motivate themselves even when “ gently pushed” by teachers. The non-learners tend to become a burden for high school teachers to manage and when teachers themselves are not mathematically prepared the problem becomes harder. The dealing of management issues leaves less teaching time to teach mathematics or provide sufficient help to those who are prepared to extend their learning of math. There should be more research to detail the loss in “teaching time” in classrooms for this may be significant. This paper addresses “student preparedness” in the first year mathematics by examining self-directed approaches to learning and determination to succeed. The results show that student preparedness is an important factor in success. This preparedness issue in learning is a great challenge for all; in particular, for parents, carers, early, primary and high school and tertiary institutions. It is critical for researchers to address student preparedness variables in classroom contexts to investigate their effect in the learning of mathematics and indeed in student education more generally.
Key words: student preparedness, first year mathematics, strategies for mathematics learning environments, multivariate methods
Reflection on learning environments
The situation concerning mathematics learning in Australia does not appear to be satisfactory given that undergraduate students continue to choose degree options away from those with significant amount of mathematics (Chinnapan et al, 2007; Rubinstein, 2011). This situation is not only noted in the universities but also in high schools where fewer numbers of students are now undertaking math C for example (Queensland, Australia) (Wright, 2007). Chinnapan et al (2007) identified a number of difficulties concerning the learning of mathematics in Australia such as: lack of quality and qualified teachers, inadequate primary teaching of mathematics and science, lack of access to advanced high school mathematics courses, lack of appropriate university prerequisites, lack of understanding of the role of mathematics including a decline in student doing higher math. Others such as Britain, US and Ireland also appear to be battling similar issues (Hong et al, 2009). Clearly, there are problems in the teaching and learning of mathematics including inappropriate beliefs and attitudes towards the importance of mathematics itself, but the author believes that the causes are more closely related to student variables in“ learning environments” generally; and more particularly, to the level of student self “preparedness” for learning environments (Frey, 2010).
Shaikshik Parisamvad (An International Journal of Education) | 24SPIJE , ISSN 2231 – 2323 (Print), 2231 – 2404 (Online)Vol.3, No.1, January 2013, pp 24-33.
© 2013 AAEBHU
SPIJE, Vol.3, No.1, January 13 | 25
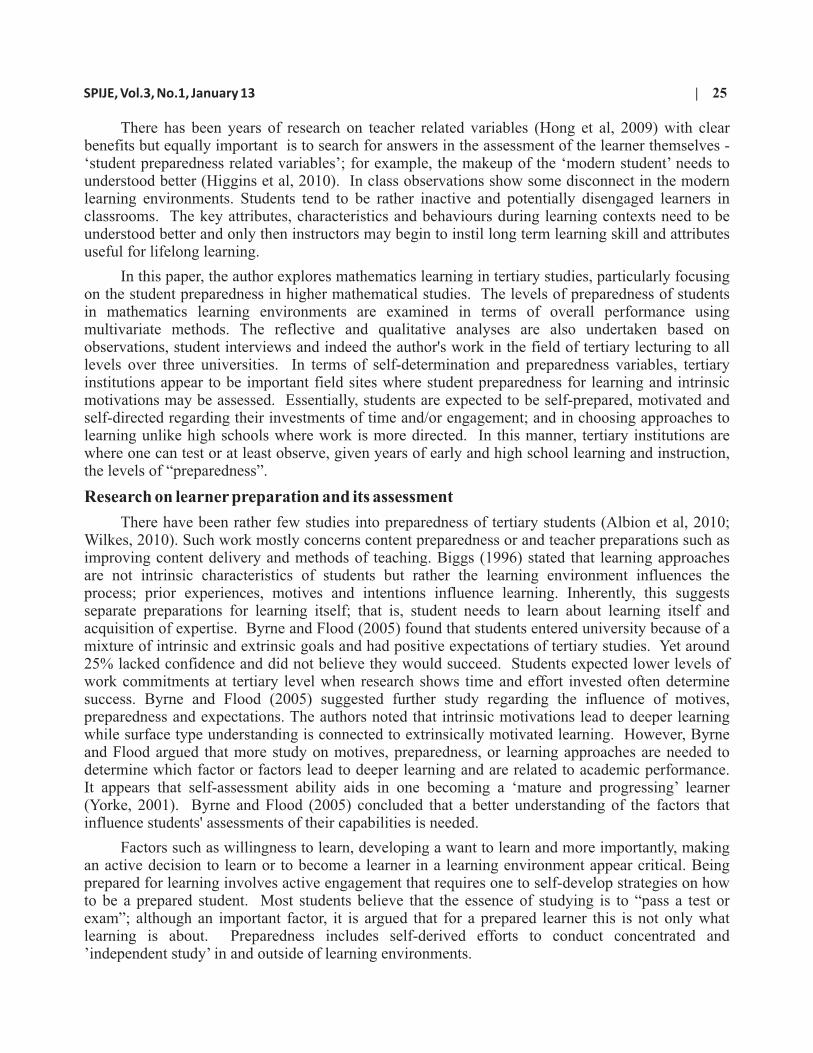
There has been years of research on teacher related variables (Hong et al, 2009) with clear benefits but equally important is to search for answers in the assessment of the learner themselves -‘student preparedness related variables’; for example, the makeup of the ‘modern student’ needs to understood better (Higgins et al, 2010). In class observations show some disconnect in the modern learning environments. Students tend to be rather inactive and potentially disengaged learners in classrooms. The key attributes, characteristics and behaviours during learning contexts need to be understood better and only then instructors may begin to instil long term learning skill and attributes useful for lifelong learning.
In this paper, the author explores mathematics learning in tertiary studies, particularly focusing on the student preparedness in higher mathematical studies. The levels of preparedness of students in mathematics learning environments are examined in terms of overall performance using multivariate methods. The reflective and qualitative analyses are also undertaken based on observations, student interviews and indeed the author's work in the field of tertiary lecturing to all levels over three universities. In terms of self-determination and preparedness variables, tertiary institutions appear to be important field sites where student preparedness for learning and intrinsic motivations may be assessed. Essentially, students are expected to be self-prepared, motivated and self-directed regarding their investments of time and/or engagement; and in choosing approaches to learning unlike high schools where work is more directed. In this manner, tertiary institutions are where one can test or at least observe, given years of early and high school learning and instruction, the levels of “preparedness”.
Research on learner preparation and its assessment
There have been rather few studies into preparedness of tertiary students (Albion et al, 2010; Wilkes, 2010). Such work mostly concerns content preparedness or and teacher preparations such as improving content delivery and methods of teaching. Biggs (1996) stated that learning approaches are not intrinsic characteristics of students but rather the learning environment influences the process; prior experiences, motives and intentions influence learning. Inherently, this suggests separate preparations for learning itself; that is, student needs to learn about learning itself and acquisition of expertise. Byrne and Flood (2005) found that students entered university because of a mixture of intrinsic and extrinsic goals and had positive expectations of tertiary studies. Yet around 25% lacked confidence and did not believe they would succeed. Students expected lower levels of work commitments at tertiary level when research shows time and effort invested often determine success. Byrne and Flood (2005) suggested further study regarding the influence of motives, preparedness and expectations. The authors noted that intrinsic motivations lead to deeper learning while surface type understanding is connected to extrinsically motivated learning. However, Byrne and Flood argued that more study on motives, preparedness, or learning approaches are needed to determine which factor or factors lead to deeper learning and are related to academic performance. It appears that self-assessment ability aids in one becoming a ‘mature and progressing’ learner (Yorke, 2001). Byrne and Flood (2005) concluded that a better understanding of the factors that influence students' assessments of their capabilities is needed.
Factors such as willingness to learn, developing a want to learn and more importantly, making an active decision to learn or to become a learner in a learning environment appear critical. Being prepared for learning involves active engagement that requires one to self-develop strategies on how to be a prepared student. Most students believe that the essence of studying is to “pass a test or exam”; although an important factor, it is argued that for a prepared learner this is not only what learning is about. Preparedness includes self-derived efforts to conduct concentrated and ’independent study’ in and outside of learning environments.

26 | SPIJE, Vol.3, No.1, January 13
The account of the preparedness of the learners may be noted in the early work of Sternberg's (1996) triarchic theory of intellectual abilities (TTIA) and the mental self-government (TMSG). In his framework, thinking styles, biographical information and past achievement help predict academic performance. Sternberg argues that student learning and thinking style together with ability levels are important. TMSG is related to the nature of thinking styles providing individuals their preference of thinking patterns, while the TTIA focuses on the ability itself. In essence, TMSG refers to different thinking styles that dictate the preference in the use of abilities. Sternberg also defined the concept of ‘successful intelligence’ as an alternative to IQ that includes a number of characteristics such as whether students: know their strengths and weaknesses, are goal setters, are highly motivated, are able to follow through with promises made, are high in self efficacy, know the problems that needs addressing and whether students can translate their thoughts to actions to achieve real world achievements. A number of these are noted in student preparedness variables. The preferences of thinking styles can be guided by preparedness for learning environments and this may be in turn based on biographical information (Sternberg, 2001).
The process of quantifying and monitoring important affective factors or indeed assessing the nature of the role they play in mathematics is not an easy task(Byrne and Flood, 2005; Kelson and Tularam, 1998; Tularam and Kelson, 1998; Tularam 1998). Mathematical self-concepts and intrinsic motivations tend to be the two main interest areas in which less work appears on understanding student preparedness for learning environments itself, their willingness to study mathematics or their approaches to learning when in classroom full of students; whether students optimize learning opportunities. The self-concept includes mathematics talent, confidence, self-efficacy, and anxiety; while student interest, enjoyment, intellectual stimulation, reward for effort, valuing mathematics, diligence relate to motivational factors. Carmichael & Taylor (2005) note the factors such as confidence, motivation, and engagements are often used with without clarifications. Bandura (2005) has argued for the stricter definitions of self-concept, confidence, and self-efficacy are needed. A learner may be confident within one part of the content while not in another within the same course content thus an overall measure is the meaningless. A student may have high level of self-efficacy (attribution of failure to changeable factors) for finding the derivative of a polynomial but a low level for a cubic. The assessment will need extra data regarding preparedness for learning, self-determination or willingness to self- study mathematics and so on.
It is true that preparedness for learning can be based on beliefs, norms and values held in cultures. Kennedy (2002) says: ‘often researchers suggest that for example the Chinese learners have to be weaned off 'inferior' or 'old-fashioned' modes of learning onto 'deeper' ways of understanding. Cort[a]zzi and [Jin]cautions against such cultural imperialism: 'there is no reason to suppose that oneculture of learning is superior to another . . . this needs to be kept in mind when teaching methodologies migrate around the world' (1996: 174). In fact, a better understanding of such 'Chinese learning styles' as 'deep memorization', collaborative group learning (Kember 2000) and the pastoral role teachers play outside the classroom (Pratt et al, 1999) could well benefit the Western learner’ (p. 442). Clearly, students from Singapore, Hong Kong, China, China Taipei and Japan do extremely well in mathematics tests; not only recalling of facts and routine problems but also in non-routine, reasoning and problem solving domains. However, this aspect willbe addressed in another paper.This study examines the relationship between preparedness and performance by examining over the semester performances of the first year environmental undergraduate mathematics in Australia.
The study - qualitative and quantitative methods
This study is of a reflective nature concerning tertiary students but also includes high school
SPIJE, Vol.3, No.1, January 13 | 27
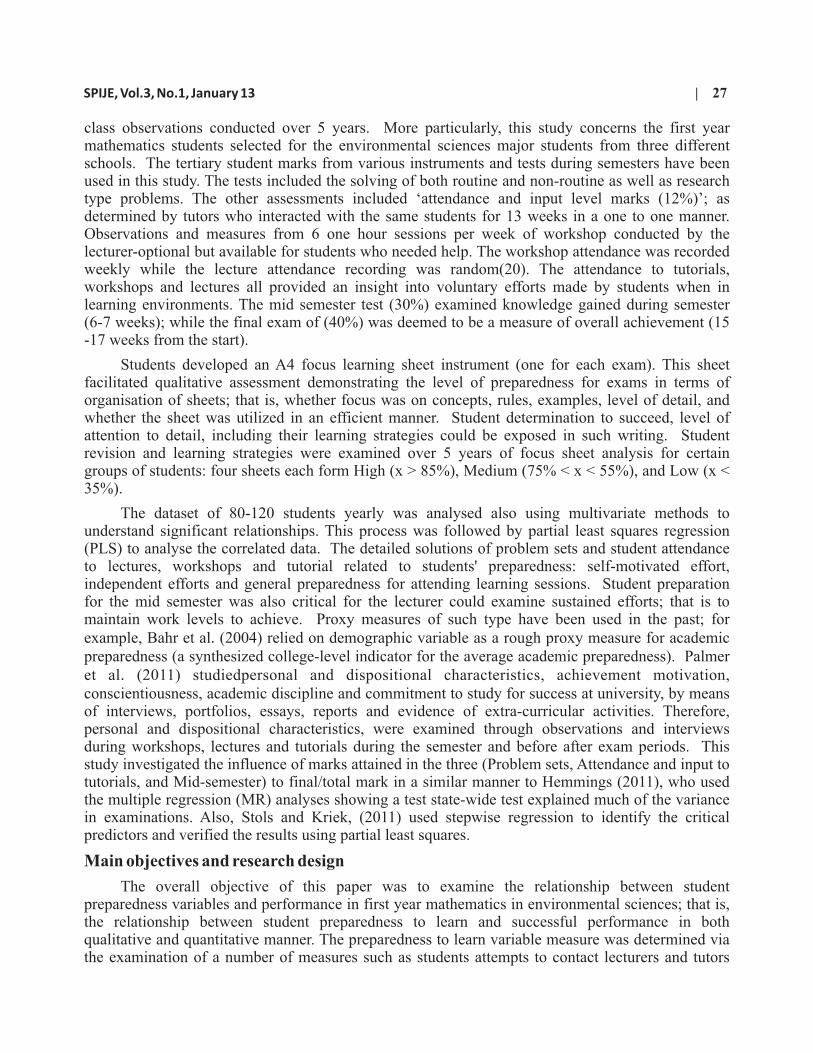
class observations conducted over 5 years. More particularly, this study concerns the first year mathematics students selected for the environmental sciences major students from three different schools. The tertiary student marks from various instruments and tests during semesters have been used in this study. The tests included the solving of both routine and non-routine as well as research type problems. The other assessments included ‘attendance and input level marks (12%)’; as determined by tutors who interacted with the same students for 13 weeks in a one to one manner. Observations and measures from 6 one hour sessions per week of workshop conducted by the lecturer-optional but available for students who needed help. The workshop attendance was recorded weekly while the lecture attendance recording was random(20). The attendance to tutorials, workshops and lectures all provided an insight into voluntary efforts made by students when in learning environments. The mid semester test (30%) examined knowledge gained during semester (6-7 weeks); while the final exam of (40%) was deemed to be a measure of overall achievement (15 -17 weeks from the start).
Students developed an A4 focus learning sheet instrument (one for each exam). This sheet facilitated qualitative assessment demonstrating the level of preparedness for exams in terms of organisation of sheets; that is, whether focus was on concepts, rules, examples, level of detail, and whether the sheet was utilized in an efficient manner. Student determination to succeed, level of attention to detail, including their learning strategies could be exposed in such writing. Student revision and learning strategies were examined over 5 years of focus sheet analysis for certain groups of students: four sheets each form High (x > 85%), Medium (75% < x < 55%), and Low (x < 35%).
The dataset of 80-120 students yearly was analysed also using multivariate methods to understand significant relationships. This process was followed by partial least squares regression (PLS) to analyse the correlated data. The detailed solutions of problem sets and student attendance to lectures, workshops and tutorial related to students' preparedness: self-motivated effort, independent efforts and general preparedness for attending learning sessions. Student preparation for the mid semester was also critical for the lecturer could examine sustained efforts; that is to maintain work levels to achieve. Proxy measures of such type have been used in the past; for example, Bahr et al. (2004) relied on demographic variable as a rough proxy measure for academic preparedness (a synthesized college-level indicator for the average academic preparedness). Palmer et al. (2011) studiedpersonal and dispositional characteristics, achievement motivation, conscientiousness, academic discipline and commitment to study for success at university, by means of interviews, portfolios, essays, reports and evidence of extra-curricular activities. Therefore, personal and dispositional characteristics, were examined through observations and interviews during workshops, lectures and tutorials during the semester and before after exam periods. This study investigated the influence of marks attained in the three (Problem sets, Attendance and input to tutorials, and Mid-semester) to final/total mark in a similar manner to Hemmings (2011), who used the multiple regression (MR) analyses showing a test state-wide test explained much of the variance in examinations. Also, Stols and Kriek, (2011) used stepwise regression to identify the critical predictors and verified the results using partial least squares.
Main objectives and research design
The overall objective of this paper was to examine the relationship between student preparedness variables and performance in first year mathematics in environmental sciences; that is, the relationship between student preparedness to learn and successful performance in both qualitative and quantitative manner. The preparedness to learn variable measure was determined via the examination of a number of measures such as students attempts to contact lecturers and tutors

28 | SPIJE, Vol.3, No.1, January 13
outside of normal time, time and effort invested in solving problems set during the semester, level of attendance at tutorials and lectures, and performance in mid-semester test. The information gathered helped determine the overall level of active persistence and effort during the semester. Student focus sheets were also examined to better understand the student focus of work and nature of investment in the course. Each of these aspects above was examined in light of final performance in the course as well as together using multiple and partial least squares regression (PLS).
A sample of 90 students was examined over 5 years from the first year mathematics course. The students work analyzed in detail in terms of the above objectives using statistical methods such as multiple and partial regression techniques. However, clinical interviews were conducted with 10 students per year with regard to the objectives mentioned. Also, 30 student focus sheets were examined yearly with the sheets labeled, high low and medium with regards to student revision and learning strategies. Finally, three different types of high school classrooms were visited over 5 years to observe year 12 students who were soon intending to attend university or tertiary level work to understand prior learning before attending university. Ad hoc notes were taken with regards to the level of student investment in productive work as well as their attitudes towards teachers and students in mathematics classrooms when required to do mathematical work.
More specifically, the first objective of the study was to study the relationships between problem set, attendance and mid semester efforts to overall performance by studying correlations and partial correlations; the second objective was to study the level of student self-direction, determination to learn, independent work attitude, attendance, and effort during the semester by examining student tutorial efforts and the work presented in focus sheets; the third objective was to conduct interviews to study in more depth and examine students' beliefs about learning mathematics as well as to gather data to further verify the level of self-determination and motivation to succeed in order to determine whether higher effort was placed throughout rather than close to assessment periods.
Results
The correlations among the assessments items are presented in Table 1. The problem set, attendance, mid semester are correlated with each other and with the final. The stepwise MR analysis selects problem set and mid semester as the main predictors while attendance factor is eliminated due to collinearity. Both variables were investigated further and the two models found were significant(Table 2 and 3); suggesting much of the variance in the final score may be explained by the student preparedness variables. ‘Probset’ in which the well-researched and detailed solutions attained higher problem scores; self-determined efforts to attend lectures, workshops and tutorials to obtain help to gain a better understanding were related to the ‘Attend’ - attendance and self-motivated input variable; and finally, maintaining sustained effort to succeed over the months in a semester in an effort score better in the mid semester concerned the ‘Mid’ variable.
Table 1: Correlations between assessment variables with p values (* 0.01)
Probset Attend Mid Final
Probset 1
Attend 0.74* 1
Mid 0.59* 0.41* 1
Final 0.67*
0.45*
0.73*
1

SPIJE, Vol.3, No.1, January 13 | 29
Table 2: Multivariate regression model 1 with problem set and mid semester
Table 3: Multivariate regression model 1 with attendance and mid semester
Table 2 shows that Model 1 involves problem set and mid semester as the main predictors while Table 3 shows Model 2 with attendance and mid semester variables being regressed with final. Both models give strong R2 values of 0.62 and 0.56 respectively; when attend alone is regressed with final an R2 of 0.45 was noted; almost half of the variance in the final mark explained by attendance variable.
Figure 1: Partial regression plots of Probset, Attend and Mid with Final
Figure 1 shows the clear trends in each variable when partially regressed. The variance inflation factor (VIF)confirmed in both cases that no serious collinearities in the two models.
Further analysis using the partial least squares (PLS) with the final mark as the dependent led to the following model equation with significant coefficients:
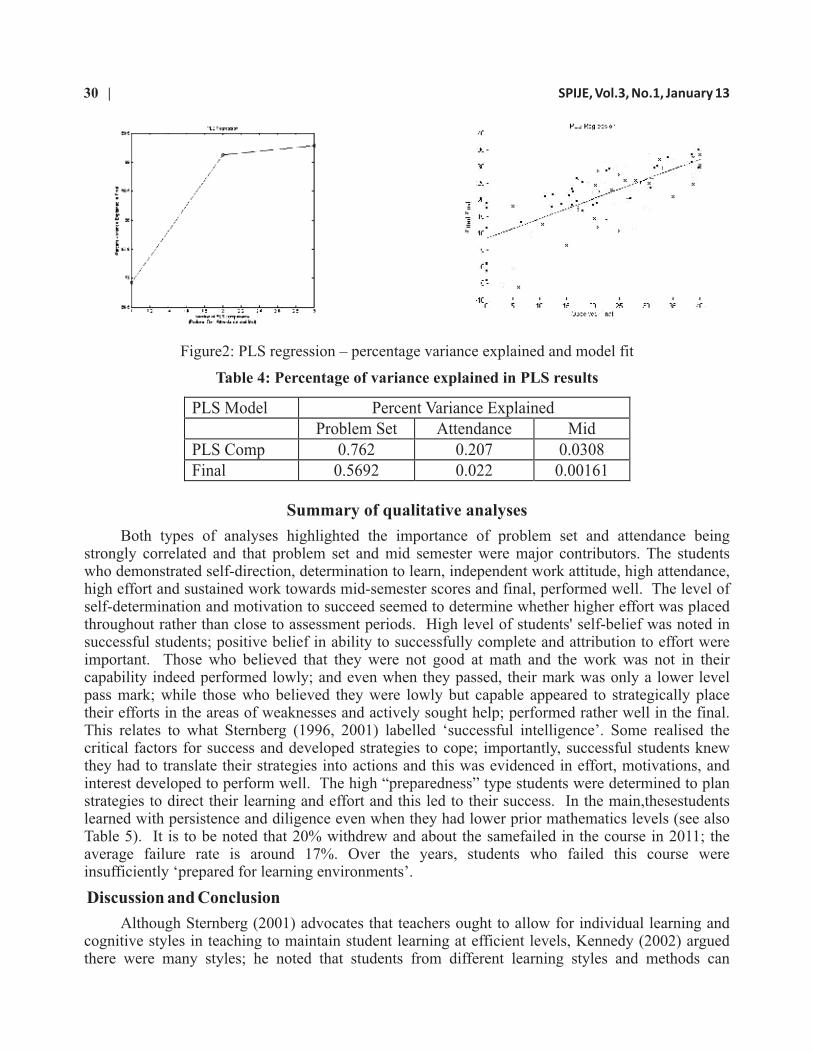
Figure 2 shows about 60% of the variation was explained using PLS with final. Figure 2 shows the percentage of variance explained by each of the scores reported and model fit. The student preparedness factors were found to be significant and the model predicted the final score with someaccuracy. Table 4 shows problem set explained most of the variance followed by attendance and mid semester scores. PLS components explained around 76%, 20% and 3% respectively with each component relating to problem set, attendance and mid semester performances in term of the final. Thus, suggesting student preparedness led to higher level of strategic inputs throughout the semester.
Model 1 Coeff Beta SigConst -8.744 .005Mid 0.877 0.508 .000
Probset 1.084 0.368 .000
Model 2 Coeff. Beta Sig.
Const -6.435 .083
Attend 0.808 0.183 .022
Mid 1.125 0.652 .000
Final = -14.32 + 1.32*ProbSet + 0.36*Attendance + 0.71*Mid (1)
30 | SPIJE, Vol.3, No.1, January 13
Figure2: PLS regression – percentage variance explained and model fit
Table 4: Percentage of variance explained in PLS results
Summary of qualitative analyses
Both types of analyses highlighted the importance of problem set and attendance being strongly correlated and that problem set and mid semester were major contributors. The students who demonstrated self-direction, determination to learn, independent work attitude, high attendance, high effort and sustained work towards mid-semester scores and final, performed well. The level of self-determination and motivation to succeed seemed to determine whether higher effort was placed throughout rather than close to assessment periods. High level of students' self-belief was noted in successful students; positive belief in ability to successfully complete and attribution to effort were important. Those who believed that they were not good at math and the work was not in their capability indeed performed lowly; and even when they passed, their mark was only a lower level pass mark; while those who believed they were lowly but capable appeared to strategically place their efforts in the areas of weaknesses and actively sought help; performed rather well in the final. This relates to what Sternberg (1996, 2001) labelled ‘successful intelligence’. Some realised the critical factors for success and developed strategies to cope; importantly, successful students knew they had to translate their strategies into actions and this was evidenced in effort, motivations, and interest developed to perform well. The high “preparedness” type students were determined to plan strategies to direct their learning and effort and this led to their success. In the main,thesestudents learned with persistence and diligence even when they had lower prior mathematics levels (see also Table 5). It is to be noted that 20% withdrew and about the samefailed in the course in 2011; the average failure rate is around 17%. Over the years, students who failed this course were insufficiently ‘prepared for learning environments’.
Discussion and Conclusion
Although Sternberg (2001) advocates that teachers ought to allow for individual learning and cognitive styles in teaching to maintain student learning at efficient levels, Kennedy (2002) argued there were many styles; he noted that students from different learning styles and methods can
PLS Model Percent Variance Explained Problem Set Attendance Mid
PLS Comp 0.762 0.207 0.0308 Final 0.5692 0.022 0.00161
SPIJE, Vol.3, No.1, January 13 | 31
perform equally well in other learning environments. The self-motivated and prepared learners appear to include the novel styles if they enhance their learning. It has been argued that Chinese learning is based on memory modes of learning rather than the so called deeper ways of understanding. However as noted earlier, Cortazziand Jin (1996) cautions against such cultural imperialism. Kennedy argued that Chinese learning is much more than simply memorization but rather, a deeper and comprehensive type of connective learning; therefore, this method of learning should not be discarded as unrelated to deep learning. Rather, the learning has been referred to as 'deep memorization' – followed by repeated reflections conducted over time. More importantly, Kennedy noted that Chinese teachers play a “wisdomic” care role outside of classroom learning (not while math content is being learned); that is they identify difficulties of students and address them outside of class in a pastoral care type session strategies (Kember 2000; Pratt et al, 1999). This may be a type of opportunity our schools could use as a way of teaching students learning and preparedness related factors for early learners that ultimately will help them become amply prepared for any learning environment; that is, passing on critical ideas or instilling “student preparedness ”virtues for learning environments. Of course, pastoral care occurs in Australia, but often there is barely enough time for the marking of attendance rather than actively engaging in perhaps in imparting any deeper learning. Tertiary institutions should also include preparedness for learning sessions during within their orientation programs. Clearly, remedial sessions are routinely held but not student preparations for study environments. The idea of lifelong learning is now accepted and given that students are entering universities from a diverse set of backgrounds, universities should prepare students for learning environments.
It is noted earlier that Hong Kong students of ten attribute their academic success to effort rather than to ability (Kennedy, 2002) and this way of thinking allows them to become prepared learners in that the students actively search for ways of improving performance. In contrast, many Australia and NZ students attribute their failure or success to their parents' lower levels, their genes, and intelligences and so on; high schools students see higher performers as highly gifted students; in essence, these are often things they cannot change. However, within this study some students who were identified as well prepared for learning students progressively increased their effort and determination applying learning strategies that led to success in the end. Hence, some minimal level of motivation and determination is needed to deal with novel or non-routine tasks or else participation in learning appears limited.
The results together show the importance of student preparedness in overall performance but there is a need for more research into the level of ‘student preparedness’ for learning environments in actual classroom contexts. It is clear that student preparedness is critical to success - the nature of approaches taken, strategies developed much earlier in the semester with a determination to perform throughout the semester, students placed more effort to complete independent tasks and attended as many tutorials and workshops as needed to gain a better understanding; in an aim to better their overall performance (10 students wanted to learn for leaning sake and were happy to continue even when they failed course). The importance of the strategies and approaches to learning including investment of time and effort in learning environments to comprehend ideas and concepts during learning was related to success. The learning aspect is aptly noted in Claxton (1998): “Learning also comes from 'emotional intelligence', imaginative insight or after a period of rumination when the 'metaphorical apple falls on the prepared mind' (Claxton, 1998: 67); and importantly, the learner preparedness aspect is concisely summarized in “Learning to be is as important as learning to do”(Kennedy, 2002, p 437). Other countries including the US realizes that “Advancements in technology usually lead to expanding applications of mathematics, and more workers with knowledge of mathematics will be required in the future.” Moreover, the US departments note that
32 | SPIJE, Vol.3, No.1, January 13
both industry and government will continue to hire mathematicians in future (US Bureau of Labor Statistics, 2011). If Australia and NZ are to be competitive, they should both realize the significance of improving mathematics education.
References1. Albion, P. R., Loch, B., Mula, J. M., & Maroulis, J. (2010). Preparedness for flexible access to
learning materials: How ready are university students and staff? Proceedings ascilite Sydney 2010 (pp.25-35), http://ascilite.org.au/conferences/sydney10/procs/Albion-full.pdf..
2. Bandura, A. (2005). Guide for constructing self-efficacy scales. In F. Pajares & T. Urdan (Eds.), Self-efficacy beliefs of adolescents (pp.1-43). Greenwich, CT: Information Age.
3. Bahr, P. R., Hom, W. and Perry, P. (2004) Student Readiness for Postsecondary Coursework: Developing a College-Level Measure of Student Average Academic Preparation. Journal of Applied Research in the Community College 11(2), 7-16).
4. Biggs, J. 1996 Western Misperceptions of the Confucian-heritage Learning culture, in Watkins, D. and Biggs, J. (eds) The Chinese Learner: Cultural, Psychological and Contextual Influences, CERC and ACER, Melbourne.
5. Carmichael, C. S., & Taylor, J. A. (2005). The analysis of student beliefs in a tertiary preparatory mathematics course. International Journal of Mathematical Education in Science and Technology, 36(7), 713-179.
6. Chinnapan, M.; Dinham, S.; Herrington, T. & Scott, D. (2007). 'Year 12 students and Higher Mathematics: Emerging issues', paper presented to Australian Association for Research in Education, Annual Conference, Fremantle, 25-29 November 2007.
7. Claxton, G. (1998) Hare Brain, Tortoise Mind: why intelligence increases when you think less London: Fourth Estate
8. Cortazzi, M. and Jin, L. (1996) Cultures of learning: language classrooms in China. In H. Coleman (Ed.). Society and the Language Classroom, Cambridge: Cambridge University Press, pp. 169–206.
9. Frey, C. (2010). Crash course in college preparedness. Start sharpening your analytical skills early and don't shy from a challenging read. http://www.usnews.com/education/
ndarticles/2010/08/16/a-crash-course-in-college-preparedness. Retreived August 22 , 2011.
10. Hemmings, B. (2011). The relationships among previous achievement, effort, and performance in high school Mathematics and English. http://www.aare.edu.au/10pap/
nd2130Hemmings.pdf: Retrieved 22 August.
11. Higgins, P.J., Mullamphy, D.F., and Belward, S.R. (2010) Bridging the gap: teaching university mathematics to high school students. ANZIAM Journal, 51 (EMAC2009). C640-C653. ISSN 1446-8735
12. Hong, Y. Y., Ker, S., and Klymchuk, S. (2009). Teachers perspectives on the transition from secondary to tertiary mathematics education. In R. Hunter, B. Bicknell, & T. Burgess (Eds.),
ndCrossing divides: Proceedings of the 32 annual conference of the Mathematics Education Research Group of Australasia (Vol. 1, pp. 241-248). Palmerston North, NZ: MERGA.http://www.irishexaminer.com/ireland/kfojgbsnsngb/rss2/
13. Kelson, N., and Tularam, A. (1998). Implementation of an integrated, technology based, discovery mode assessment item involving an incubation period to enhance learning outcomes for engineering mathematics students. In Proceedings of the Effective Assessment at University Conference held 4-5 November in UQ Brisbane. Teaching and Educational

SPIJE, Vol.3, No.1, January 13 | 33
Development Institute (TEDI), UQ. Australia.http://www.tedi.uq.edu.au/Conferences/Assess_ ndconference.html. Retrieved 22 August, 2011.
14. Kelson, N., and Tularam, A. (1998). Tutoring with higher mathematics and the use of technology. In Proceedings of the Effective Assessment at University Conference held 4-5 November in UQ Brisbane. Teaching and Educational Development Institute (TEDI), UQ.http://
ndwww.tedi.uq.edu.au/Conferences/Assess_conference.html. Retrieved 22 August, 2011.
15. Kember, D 2000, Misconceptions about the learning approaches, motivation and study practices of Asian students, Higher Education, 40, 99-121
16. Kennedy, P. (2002). Learning cultures and learning styles: myth-understandings about adult (Hong Kong) Chinese learners.Int. Journal of Lifelong Education 21(5), 430–445
17. Palmer, N., Bexley, E., and James, R. (2011). Selection and Participation in Higher Education. University selection in support of student success and diversity of participation. Prepared for the Group of Eight. Centre for the Study of Higher Education, University of Melbourne
18. Pratt, D., Kelly, M. and Wong, W. (1999). Chinese conceptions of 'effective teaching' in Hong Kong: towards culturally sensitive evaluation of teaching. International Journal of Lifelong Education, 18(4), 241–258.
19. Rubinstein. J. H. (2006). The crisis in math in Australia. Mathematics and Statistics Department, University of Melbourne.
nd20. http://www.onlineopinion.com.au/view.asp?article=4456. Retrieved 22 August 2011.
21. Sternberg, R. (1996). IQ counts, but what really counts is successful intelligence. NASSP Bulletin 1996 80: 18
22. Sternberg, R. J. (2001). How wise is it to teach for wisdom? A reply to five critiques. Educational Psychologist, 36(4), 269–272.
23. Stols, G. and Kriek, (2011). Why don't all maths teachers use dynamic geometry software in their classrooms?Australasian Journal of Educational Technology, 2011, 27(1), 137-151.
24. Tularam A., and Kelson, N. (1998). Assessment in tertiary mathematics. In Proceedings of the Effective Assessment at University Conference held 4-5 November in UQ Brisbane. Teaching and Educational Development Institute (TEDI), UQ. http://www.tedi.uq.edu.au/conferences/
ndA_conf/papers/Tularam.html. Retrieved 22 August 2011.
25. Tularam, G. A. (1998).The role of algebraic knowledge, higher-order thinking and affective factors in word-problem solving. In Proceedings of International Conference-Transformation in Higher Education (pp. 210), held7-10 July in Auckland, New Zealand. http://www.merga. net.au/documents/RP_Tularam_1994.pdf
26. US Bureau of Labor Statistics (2011). http://academics.nsuok.edu/stemscholars/ ndMathematics.aspx. Retrieved 22 August 2011.
27. Wilkes, J. (2010). Addressing the diversity of student mathematics preparedness for engineering surveying: a proposal for a technology supported learning scaffold. In R. Muldoon (Ed.), Rethinking learning in your discipline. Proceedings of the University Learning and Teaching Futures Colloquium 2010. Armidale, Australia: Teaching and Learning Centre, University of New England.
28. Wright, S. (2007). The problem with mathematics – An actuarial perspective. Parabola Volume 43(1). 1-4.
29. Yorke M. (2001). Formative assessment and its relevance to retention. Higher Education Research & Development, 20(2), 115-126
Shaikshik Parisamvad (An International Journal of Education) | 34SPIJE , ISSN 2231 – 2323 (Print), 2231 – 2404 (Online)Vol.3, No.1, January 2013, pp - 34 - 42.
© 2013 AAEBHU
SIBLING CONFIGURATION AFFECTING EDUCATIONAL ATTAINMENT: AN EXPLANATION BY CONFLUENCE MODEL AND RESOURCE
DILUTION HYPOTHESIS(Sumant Kumar Yadav, Lecturer Mathematics, Kantipur Valley College, Kumaripati, Lalitpur, Kathmandu Valley,
Nepal, Email: [email protected])
ABSTRACT
This paper discusses the effect of sibling configuration on educational attainment and their possible respective explanation by Confluence Model (CM) and Resource Dilution Hypothesis Model (RDH). Studies on family background often explain the negative effect of sibship size on educational attainment by one of the two theories: the Confluence Model or the Resource Dilution Hypothesis. However, as both theories – for substantively different reasons – predict that sibship size should have a negative effect on educational attainment. Most studies cannot distinguish empirically between the CM and the RDH. In this paper the author discusses the different theoretical predictions in the CM and RDH on the role of cognitive ability as a partial or complete mediator of the sibship size effect to identify a unique RDH effect on educational attainment.
Key words: Family background, Educational attainment, Sibship size, Confluence Model, Resource Dilution Hypothesis.
Introduction
Sibship (i.e. a group of children of the same parents) size, also referred to as the number of siblings, is often studied as a determinant of children's schooling. This study focuses on two theoretical models that explain the impact of sibling configuration (i.e. sibship size, birth order position, and spacing between children) on educational attainment of the children. The way children are raised has been of interest for social and behavioural scientists for several years. Most scientists agree that environmental factors may be important for children's cognitive development (e.g. Bussey & Bandura, 1999; Fischer & Bidell, 1998; Gibson & Pick, 2000; Siegler, 1998; Vygotsky, 1986). Several scholars (e.g. Brackbill & Nichols, 1982; Scarr, & Weinberg, 1977; Retherford & Sewell, 1991; Zajonc & Bargh, 1980) have been involved in exploring the relationship between the configuration of siblings and performance on various measures of intelligence.
Sibship Size and Educational Attainment
In many studies, it has been shown that the size of the family in which children grow having many siblings is found to be detrimental to one's educational and, consequently, occupational opportunities. One of the most robust findings in the literature on family background and educational outcomes is that sibship size is negatively associated with children's intellectual and educational outcomes. In fact, among the sibship characteristics typically studied in the literature are: sibship size, birth order, birth spacing, and sibship sex composition. Only the negative relationship between sibship size and intellectual and educational outcomes has been consistently reproduced over time (e.g. Cicirelli, 1978; Ernst and Angst, 1983; Steelman et al., 2002). However, Mare (1980) found that the negative effect of size of sibship diminished in later educational transitions and that, given graduation from college, there was no relationship between size of sibship and post college attendance.
SPIJE, Vol.3, No.1, January 13 | 35
Two theoretical models are often used to explain this phenomenon: The Confluence Model (CM) and the Resource Dilution Hypothesis (RDH). The CM, originating in psychology, argues that the primary channel through which sibship size has a negative effect on children's educational success is through the creation of an inferior intellectual environment in families with many children (Zajonc and Markus, 1975). In contrast, the RDH, originating in sociology and demographics, argues that the increasing dilution in large families of parents' resources: economic, social, emotional, interpersonal etc. is the reason why children with many siblings obtain less education than children with few siblings (e.g. Blake, 1981, 1989; Downey, 1995, 2001).
There is an ongoing debate in literature on whether the CM or the RDH offers the more correct interpretation of the empirical regularity that sibship size is negatively correlated with children's intellectual and educational outcomes (e.g. Retherford and Sewell, 1991; Downey, 2001; Steelman et al., 2002). The major problem in this debate is that at face value findings from most empirical studies are equally consistent with the predictions from both the CM and the RDH. There is a large literature documenting that sibship size is negatively correlated with children's intellectual ability (e.g. Cicirelli, 1978; Steelman, 1985; Steelman et al., 2002). Furthermore, many studies also find that sibship size is negatively correlated with final educational attainment (e.g. Conley, 2000; Steelman et al., 2002; Sandefur et al., 2006).
Is it possible to distinguish empirically between the CM and the RDH when analyzing the effect of sibship size on educational attainment? In this paper the author uses a key theoretical difference between the CM and the RDH with respect to the role of cognitive ability as a partial or complete mediator of the sibship size effect to distinguish between the two theories. According to the CM, low cognitive ability caused by being raised in an intellectually poor environment is the principal reason why children from large families end up with less education than children from small families. By contrast, the RDH offers a more comprehensive explanation in which strains on several types of parental resources, and not just strains affecting cognitive ability, is the reason why sibship size has a negative impact effect on educational attainment. This difference between the two theories has important empirical implications because, according to the CM, the negative effect on sibship size runs exclusively through cognitive ability whereas, according to the RDH, there should be an additional negative effect of sibship size on educational attainment.
Birth Order and Educational Attainment
Different theories predict a significant effect of birth order on future educational and economic achievements. An important model in the psychological literature is the confluence model, which is discussed by Zajonc (1976). The confluence model predicts the intellectual growth of a child to depend on its intellectual environment, whereby the intellectual environment is defined as a function of the average of the absolute intellectual levels of its family members. A first child enters an environment with two adult parents, so the average intellectual level is high. A second born enters a lower intellectual environment than the first-born, because his older sibling is part of the intellectual environment, and decreases the average intellectual level. A third child enters an even lower intellectual environment than the second born because of two older siblings etc. Since the intellectual environment declines with birth order, this model predicts a negative relation between birth order and educational attainment. Zajonc however stresses the effect of child- spacing, the larger the age gap between two siblings the smaller is the difference between the two children in their intellectual environment, and the smaller is the effect of birth order.
Empirical studies have found different effects of birth order. Kantarevic and Mechoulan (2006) use the Panel Study of Income Dynamics and find that first-born children have a significantly higher

36 | SPIJE, Vol.3, No.1, January 13
educational attainment. They also estimate birth order effects by family size but due to small sample sizes the estimates become imprecise for larger families. Belmont and Marolla (1973) examine, next to the effect of family size, the effect of birth order for given family sizes. They find a steady decline in the average score on a military examination with birth order. Blake (1981) also examines the effect of birth order and does not find a systematic difference in educational attainment between first and last born, and middle born children.
Birth Spacing and Educational Attainment
Much of the previous research on birth spacing comes from the medical literature, where the focus is on the effects of conceiving soon after a previous birth. However social scientists have also been interested in the effects of birth spacing. Building on a confluence model presented by Zajonc and Markus (1975), where family size and birth order influence the intellectual environment, Zajonc (1976) argues that the effects of birth order “are mediated entirely by the age spacing between siblings,” and that greater spacing between siblings can reverse the negative effects of birth order. The argument is that children born into families with older children are born into more favorable intellectual environments. In this model, larger gaps may also positively affect first-born children, who have more time to develop before the birth of an “intellectually immature” younger sibling. Additional evidence is provided by Broman, et al., (1975), who found that children born after longer intervals scored higher on the Stanford-Binet scale than those born after shorter intervals. However, Galbraith (1982) finds that sibling spacing had no effect on intellectual development in a sample of predominantly Mormon college students.
THEORETICAL PERSPECTIVES
This section presents the two major explanations of the negative relationship between sibship size and children's educational success by: The Confluence Model (CM) and the Resource Dilution Hypothesis (RDH).
The Confluence Model
The Confluence Model (CM) was formulated by Zajonc and colleagues (Zajonc and Markus, 1975). They developed a mathematical model which is based on the mutual intellectual influences among children as they develop in the family context. A family's intellectual environment is considered as a function of the average of the weighted absolute intellectual levels (mental ages) of all members of the family. The larger the sibship, the more the intellectual environment suffers from the low mental ages of young children. That is why successive children are born in an increasingly inferior environment, which is a direct handicap to their own intellectual development.
The intellectual environment varies with number of newborn children in the family. Each family member contributes to the average intelligence in the family, and therefore, the average intelligence is changing over time. Change may be due to the addition of a newborn or a family member moving out. The average intelligence depends on the number of children and the intervals between births (Zajonc & Markus, 1975).
Parents have much higher intellectual skills than children, but the arrival of a new child with low initial intellectual skills decreases the total intellectual level in the family. Consequently, families with many children provide an intellectually 'immature' environment since '… larger families will be associated with lower intellectual levels because the larger the family, the larger is the proportion of individuals with low absolute intelligence' (Zajonc and Markus, 1975: 77).
Several scientists (e.g. Breland, 1974; Mascie-Taylor, 1980; Nisbet & Entwistle, 1967) note that verbal tests, in comparison with nonverbal tests, are more sensitive to the effects of family
SPIJE, Vol.3, No.1, January 13 | 37
configuration. Reduction in parental attention due to the birth of more children may negatively influence verbal development (Mercy & Steelman, 1982).
Research has also shown that the arrivals of newborns have an effect on home environment. Firstborn children have been reported receiving more attention and verbal stimulation from their parents during infancy and throughout upbringing in comparison to later-born children. It is reasonable to believe that this interaction with adults may explain why the first-born is reported to learn to walk, talk, and read at an earlier age (Pfouts, 1980). Further research on family interaction (e.g. Irish, 1964) revealed that older siblings often informally teach their younger siblings.
The effect of time spent with friends has also been examined, and the results give further support for the confluence model. The data revealed that time spent with friends was negatively related to children's performance on intelligence tests (Mercy and Steelman, 1982).
The teaching function is another important factor that must be considered in the confluence model. In addition to sibship size, birth order has been reported to have a positive effect on the development of intelligence. Most of the time first-born children score at a higher level on intellectual tests than later-born children; for this reason, we can talk about a birth-order factor. Older siblings can assume a “tutorial function” by answering questions and helping their younger siblings to solve problems. By doing so (i.e., learning by teaching and rehearsal) this activity will provide the older sibling with an intellectual advantage in form of verbal fluency and set the stage for a birth-order effect. The birth order is a critical factor because neither the youngest sibling nor the only child will have the opportunity to teach their siblings. With this in mind, the confluence model expects a handicap for last born and only child with regards to the teaching function.
It is hypothesized that increasing family size decreases the average intellectual environment, whereas increasing age spacing between children increases the average intellectual environment. Birth order is mediated completely by the age spacing between siblings. A negative effect of birth order is expected with small spacing between children, whereas a positive effect is likely with large spacing between children (Galbraith, 1982). The confluence model assumes that longer birth intervals provide the older siblings with more time to mature, which leads to higher average intellectual performance (Markus & Zajonc, 1977).
Zajonc and Marcus (1975) point out that the confluence model illustrates the importance of the environment on intellectual development of individuals. The authors acknowledge other factors not included in the model that contribute to the intellectual development as well, such as genetic background and other environmental processes (e.g., child rearing practices and unique experience). However, the authors consider birth order as a strictly environmental factor.
In sum, the core of the confluence model is that the intellectual level within the family provided by adults and children is crucial for the intellectual development of each child.
The Resource Dilution Hypothesis
The history of the resource dilution model can be traced back to Dumont's (1890) work, which focused on the law of capillary action which states that the presence of siblings dilutes resources that are crucial for social mobility; however, Blake (1981) was the first to coin the term resource dilution model and has since been the prominent proponent.
The Resource Dilution Hypothesis (RDH) offers a simple resource explanation for declines in educational outcomes and in intellectual assessments. Most or all of the relationship found can be explained from the assumption that when the number of children in the family increases, the parents' resources decrease.

38 | SPIJE, Vol.3, No.1, January 13
In order to understand the mechanisms by which socio-economic background and family structure affect educational opportunities, one needs to consider the processes and means by which status characteristics are passed on from one generation to the next. Parents' resources play a crucial role in educational careers, and the availability of these resources is highly associated with levels of parental education and occupation.
It is important to differentiate between basic parental resources that are important for survival (e.g., food, clothes, minimal supervision, and, of course, a place to live) and resources that enhance children's opportunities (e.g., one-to-one reading, hiring a math tutor, buying computers, and saving money for education) and therefore not essential for children's survival.
However, surplus resources enhance children's opportunities (Downey, 2001). With regards to surplus resources it has been reported that children with many siblings, in contrast to children with few siblings, are not engaged in activities that enhance intelligence and they spend less time together with their parents (Steelman & Powell, 1989).
One can also view that; the relevant resources can be distinguished into material and cultural resources. Material resources refer to the financial situation of a person's parents, and thus to the money they can spend on the educational careers of their children. The availability of material resources is often indicated by parents' occupational status or income level. It is plausible that material resources play a relatively important role when the cost of education is high. The financial cost of education can be both direct (fees, books, and other learning materials) or indirect in the form of opportunity costs, that is the loss of potential income during school attendance.
Cultural resources refer to parents' educational levels, their linguistic skills, and their attitude towards dominant cultural values (De Graaf, 1986). Parents' cultural resources provide children with the appropriate abilities and attitudes for being successful in school thus giving them a 'scholastic lead' which seems to increase throughout the remainder of the educational career.
Dilution theorists also believe that some resources play a larger role than others, depending on periods in children's life. One such resource is parental attention–the most important resource when the children are young–whereas money saved for education is more important when children are older (Downey, 2001).
Blake (1981) concluded that encouragement, attention, and interaction by parents are the most important factors. It has also been pointed out that close spacing of siblings leads to more competition between the siblings for similar parental resources (Downey, 2001).
Some authors (e.g. Ernst & Angst, 1983) believe that the inverse association between sibship size and educational achievement is in fact a function of socioeconomic status. Children from large families are disproportionately from groups with lower socioeconomic status. However, although sibship size is negatively related to social class, the effect of number of siblings remains strong even when socioeconomic status is controlled for (Downey, 1995). The effect of number of siblings may vary across contexts because different societies play different roles in supporting the family. A suggested functional form between sibship size and educational outcome is
Target child (Y) = 1/number of children in the family (X)
This relationship is believed to occur only between sibship size and strictly economic parental resources. Economic resources in comparison with interpersonal resources may be less readily explained. One explanation is that the parents can decide over their spare time and choose to quit exercising or reading when the second child is born (Downey, 2001).
Clearly, the core of the resource dilution theory is that the availability of resources of parents
SPIJE, Vol.3, No.1, January 13 | 39
decreases as sibship size increases. Finally, unlike the CM, the RDH mechanism pertains to a broad spectrum of parental resources, and thus not only family characteristics or parental resources that affect children's cognitive ability.
Theoretical differences between Confluence Model and Resource Dilution Hypothesis
The CM and RDH have different theoretical implications for educational attainment. The CM explains educational attainment through the impact of sibship size, birth order, and birth spacing on children's cognitive ability. In contrast, the RDH is a more general hypothesis of the relationship between sibship size and different types of parental resources which extends beyond cognitive ability (for example, educational attainment, occupational status, income, etc.). This theoretical difference is described by Downey (2001: 497):
'… whereas the confluence model offers no explanation for an effect of sibship size on educational attainment apart from intellectual skills, the resource dilution model explains that although some parental resources influence intellectual skills, other parental resources (e.g., money saved for college) affect attainment directly'.
Consequently, in the CM the effect of sibship size on educational attainment runs exclusively through children's cognitive ability. However, it follows from the RDH that there should be an additional effect of sibship size on educational attainment originating in parental resources and inputs that are unrelated to children's cognitive ability.
Zajonc(1975) and colleagues do not consider the interactions between parents and their children, nor any deliberate or necessary resource- investment strategies. The intellectual family climate, which does not even take into account parental IQ, is considered to be so important that the model can dispose of these other factors. Until now, it has seemed impossible to replicate the initial results obtained with the confluence model (Brackbill and Nichols, 1982; Galbraith, 1982; Retherford and Sewell, 1991). Moreover, since the assumptions underlying the confluence model seem unrealistic, and since it claims to be applicable to intelligence only, which is something quite different from educational attainment? Fortunately, sibling resource-dilution theory does account for the types of resources and socio-psychological processes that are obviously associated with schooling levels.
This crucial theoretical difference between the CM and the RDH provides a source of identification because it allows for a direct test of the two channels through which sibship size affects educational attainment: An indirect effect through cognitive ability and a direct effect on educational attainment. In other words, while the negative effect of sibship size on cognitive ability may be explained theoretically by both the CM and RDH, any additional direct effect of sibship size on educational attainment can only be explained by the RDH.
In contrast to the confluence model, the resource dilution model does not include a sib-socialization component. In other words, only children and last-borns are not handicapped by lack of siblings; they do not suffer from a teaching deficit. The parental dilution model implies nothing about possible birth order effects (Blake, 1981). The dilution theory concludes that children still continue to compete for parental attention (e.g., gifts, loans and inheritances) even after they moved out of the home (Downey, 2001).
According to Steelman and Powell (1989), the resource dilution theory has been used as an ad hoc explanation for the educational outcomes due to sibship size. Therefore, the theory is seldom tested directly. However, several studies note a negative effect of sibship size on financial arrangements (e.g. Steelman & Powell, 1989), intellectual performance (e.g., Blake, 1981), parental

40 | SPIJE, Vol.3, No.1, January 13
treatments and attention (e.g. Blake, 1981; Downey, 1995), and material resources (e.g. Downey, 1995).
Implication
The ambition of this paper was to bring forth diverse interpretations of how sibling configuration affects children's educational attainment as explained by the Confluence Model (CM) and the Resource Dilution Hypothesis (RDH). There is a major controversy in the literature on whether the CM or the RDH is the correct explanation of the observed correlation between sibling configuration, cognitive ability and educational attainment.
Unfortunately, most studies cannot distinguish empirically between the CM and the RDH. The reason why is because analysts generally only observe the end result of the CM and the RDH (for e.g. a negative relationship between sibship size and children's educational attainment) and not the psychological or sociological processes that generate this end result. However, the CM and the RDH differ with respect to how they perceive these processes.
Hence this paper possesses theoretical as well as educational implication to explicate the interrelationship between sibship size, birth order and birth spacing and the educational attainment of the children.
Conclusion
A theoretical contender to the Resource Dilution Hypothesis is the Confluence Model. The Confluence Model attributes the negative relationship between sibship size and children's intellectual outcomes to a poor intellectual climates and stimuli in large families. That is, more siblings “drain” the family's intellectual milieu, which in turn implies that children tend to face poor intellectually. As family size grows larger and larger, the intellectual environment becomes more and more “babyish”. Therefore, the confluence model predicts a negative effect of sibship size upon intellectual development. But this theory restricts itself to statements referring to the impact of siblings on the intellectual family climate, and not to family interaction.
While the confluence model emphasizes more on how the intellectual milieu affects individual development, resource dilution theory provides an alternative explanation by focusing more on the resource-allocation aspect within a family. Given the fact that parental resources are finite, large sibships generate strains on many types of parental resources which in turn lead to poorer child outcomes.
References1. Belmont, L. & Marolla, F. A. (1973). Birth order, family size, and intelligence. Science, 182
(4117), 1096-1101.2. Blake, J. (1981). Family size and quality of children. Demography, 18, 421-442. 3. Blake, J. (1989). Family size and achievement. Vol. 3: Studies in demography. Berkeley, CA:
University of California Press.
4. Brackbill, Y., & Nichols, P.L. (1982). A test of the confluence model of intellectual development. Developmental Psychology, 18, 192-198.
5. Breland, H. (1974). Birth order, family configuration, and verbal achievement. Child development, 45, 1011-1019.
6. Broman, Sarah H., Paul L. Nichols, and Wallace A. Kennedy. 1975. Preschool IQ: Prenatal and early developmental correlates. Hillsdale, N.J.: L. Erlbaum Associates.
SPIJE, Vol.3, No.1, January 13 | 41
7. Bussey, K., & Bandura, A. (1999). Social cognitive theory of gender development and differentiation. Psychological Review, 106, 676-713.
8. Cicirelli, V. G. 1978. “The relationship of family structure to intellectual abilities and achievement.” Review of Educational Research 48(3):365-79.
9. Conley, D. (2000). “Sibship Sex Composition: Effects on Educational Attainment.” Social Science Research 29:441-57.
10. de Graaf, P. M. (1986). “The impact of financial and cultural resources on educational attainment in the Netherlands.” Sociology of Education 59:237-46.
11. Downey, D. B. (1995). When bigger is not better. Family size, parental resources, and children's educational performance. American Sociological Review, 60, 747-761.
12. Downey, D. B. (2001). 'Number of Siblings and Intellectual Development. The Resource Dilution Explanation', American Psychologist 56(6/7): 497-504.
13. Dumont A. (1890). Civilization et Depopulation. Paris: Le Cronsier et Babe
14. Ernst, C., & Angst, J. (1983). Birth order: Its influence on personality. Berlin: Springer-Verlag.
15. Fischer, K., & Bidell, T. R. (1998). Dynamic development of psychological structure in action and thought. In W. Damon (Series Ed.), & R.M. Lerner (Vol. Ed.), Handbook of child psychology: Vol. 1. Theoretical models of human development (5th ed., pp. 467-562). New York: Wiley.
16. Galbraith, R.C. (1982). Sibling spacing and intellectual development: A closer look at the confluence models. Developmental Psychology, 18, 151-173.
17. Gibson, E.J., & Pick, A.D. (2000). An ecological approach to perceptual learning and development. New York: Oxford University Press.
18. Irish, D.P. (1964). Sibling interaction: A neglected aspect in family life research. Social Forces, 42, 279-288.
19. Kantarevic, J. & Mechoulan, S. (2006). Birth order, educational attainment, and earnings: an investigation using the PSID. Journal of Human Resources, 41 (4), 755-777.
20. Mare, R. D. (1980). Social background and school continuation decisions. Journal of the American Statistical Association, 75, 295–305.
21. Markus, G.B., & Zajonc, R.B. (1977). Family configuration and intellectual development: A simulation. Behavioral Science, 22, 137-142.
22. Mascie-Taylor, C.G.N. (1980). Family Size, Birth Order and I.Q. Components; a survey of a Cambridge Suburb. Journal of Biosocial Science, 12, 309-312.
23. Mercy, J.A., & Steelman, L.C. (1982). Familial influence on the intellectual attainment of children. American Sociological Review, 47, 532-542.
24. Nisbet, J.D, & Entwistle, N.J. (1967). Intelligence and family size: 1949- 1965. British Journal of Educational Psychology, 37, 188-193.
25. Pfouts, J.H. (1980). Birth order, age spacing, IQ differences, and family relations. Journal of Marriage and the Family, 42,517-531.
42 | SPIJE, Vol.3, No.1, January 13
26. Retherford, R.D., & Sewell, W.H. (1991). Birth order and intelligence: Further tests of the confluence model. American Sociological Review, 56, 141-158.
27. Sandefur, G., Meier, A. and Campbell, M. E. (2006). Family resources, social capital, and college attendance. Social Science Research 35(2): 525-53.
28. Scarr, S., & Weinberg, R.A. (1977). Intellectual similarities within families of both adopted and biological children. Intelligence, 1, 170-191.
rd29. Siegler, R.S. (1998). Children´s thinking (3 ed.). Upper Saddle River, NJ: Prentice Hall.
30. Steelman, L.C., &Powell, B. (1989). The liability of having brothers: Paying for college and the sex composition of the family. Sociology of Education, 62, 134-147.
31. Steelman, L. C., Powell, B., Werum, R., and Carter, S. (2002). Reconsidering the Effects of Sibling Configuration: Recent Advances and Challenges. Annual Review of Sociology 28:243-69.
32. Vygotsky, L.S. (1986). Thought and language. Cambridge, MA: MIT Press.
33. Zajonc, R. B. and Markus, G. B. (1975) 'Birth Order and Intellectual Development', Psychological Review 82(1): 74-88.
34. Zajonc, R.B. (1976). Family configuration and intelligence. Science, 192, 227-236.
35. Zajonc, R.B., & Bargh, J. (1980b). The confluence model: Parameter estimation for six divergent data sets on family factors and intelligence. Intelligence, 4, 349-361.
Shaikshik Parisamvad (An International Journal of Education) | 43SPIJE , ISSN 2231 – 2323 (Print), 2231 – 2404 (Online)Vol.3, No.1, January 2013, pp 43 - 46.
© 2013 AAEBHU
ATTITUDE TOWARDS TRIBAL GIRLS’ EDUCATION AMONG THE TEACHERS AND PARENTS OF ARUNANCHAL PRADESH
(Kesang Degi, Assistant Professor, Department of Education, Rajiv Gandhi University,Doimukh, Itanagar,Arunanchal Pradesh,India)
ABSTRACT
This paper attempts to investigate the attitude of tribal parents and teachers towards tribal girl's education. A sample of 400 tribal parents and 400 tribal teachers were selected for this purpose. Attitude Scale for parents and teachers were used to collect the data. Comparison was made between urban & rural male and female tribal teachers and urban and rural male & female tribal parents. Findings disclosed that male and female teachers of urban area have more favourable attitude towards tribal girl's education than the rural areas. When comparison was made between the parents of urban and rural areas, no significant difference was found in their attitude towards girls' education.
Key-words: Attitude, tribal girls’ education.
Introduction
Education enables girls to make their own decisions and to influence their families positively. Education saves and improves the lives of girls and women. It allows them to have greater control of their lives and provides them with skills to contribute to their societies.
The Indian Constitution assigns special status to the Scheduled Tribes (STs). STs constitute about 8% of the Indian population. There are 573 Scheduled Tribes living in different parts of the country, having their own languages, which are different from the one mostly spoken in the state where they live. Arunachal Pradesh, the easternmost state of India is a land of tribal communities. There are 25 major tribes in Arunachal Pradesh speaking different dialects. In Arunachal Pradesh women are deprived of education because of patriarchal gender relation, which directly restricts their access to education. Besides this, women education has suffered a lot because of many reasons behind such as (i) parent's apathy (ii) lack of neighbourhood educational institutions (iii) illiteracy of guardians (iv) poverty (v) lack of awareness (vi) social barriers for women (vii) engagement of girls in agriculture or household sector for supplementing family's income.
To encourage women education government has established separate unit to impart knowledge of 3 Rs to women learners in the state, games and sports, music, tailoring, knitting and weaving facilities are also added in this unit to motivate the women learners. To uplift girls education many programmes were initiated by government like, Kasturba Gandhi Balika Vidhalaya” which is running under SSA “NPEGEL” covered 20 schools and to bring out the best in girl student “Pratibha Khoj Scheme” was also introduced to encourage talented tribal girls. But still the pace of women literacy rate in Arunachal Pradesh is very slow, a little progress have been made through a long term efforts, plans and programmes over the last few decade. As per 2001 census the literacy rate of women in Arunachal Pradesh is 44.24 which show a dismal picture of women education in the state.
Aims and Objective of the present study
The attitude of the parents and teachers is very important for girls’ education. The successful completion of girls’ education upto many extend depends on the attitude of parents and teachers. The negative attitude of the parents and teachers regarding girl's education and schooling can prevent

44 | SPIJE, Vol.3, No.1, January 13
their girl child from getting education. With less parental support in school work, there will be low level of motivation and poor self-esteem among the girls. Positive attitude of the parents and teachers can be beneficial to their girl child in many cases and can be reflected in improvement in class performance, creating interest among girls to learn, and higher achievement scores in reading and writing. In view of all these points the present study aims to investigate the following objectives:
1. To study the attitude of urban and rural male Teachers towards tribal
girls education in Arunachal Pradesh
2. To study the attitude of urban and rural female Teachers towards tribal
girls education in Arunachal Pradesh
3. To study the attitude of urban and rural male Parents towards tribal
girls education in Arunachal Pradesh
4. To study the attitude of urban and rural female Parents towards tribal
girls education in Arunachal Pradesh
Hypotheses of the Study
1. There will be a significant difference in the attitude of urban and rural male teachers towards
tribal girl's education
2. There will be a significant difference in the attitude of urban and rural female teachers
towards tribal girl's education
3. There will be a significant difference in the attitude of urban and rural male parents towards
tribal girl's education
4. There will be a significant difference in the attitude of urban and rural female parents towards
tribal girl's education
Sample and Tools
Sample for the present study consists of 400 tribal parents and 400 tribal teachers, drawn from four districts of Arunachal Pradesh namely: Tawang, East Siang, Papumpare and Tirap. Out of 400 Parents and 400 Teachers, 200 male teachers & 200 male parents and 200 female teachers and 200 female parents were selected. The samples were again distributed on the basis of settlement (urban and rural). Stratified Random Sampling technique was adopted for this purpose. The four sample districts for the present study were selected on the basis of the literacy rate. The literacy rate of Tawang district is 60.61%, East Siang and Papumpare has the highest literacy rate in the state with, 73.54% and 82.14% respectively and the district Tirap is in the lowest place with only 52.23% literate persons according to census 2011.
As data gathering tool the researcher has developed and used attitude scale for parents and teacher, to find out their attitude towards tribal girls education. The attitude scale consists of 22 statements. For constructing the attitude scale Likert's five point scale method was adopted. For computing the reliability of the attitude scale, test-retest method was used. The co-efficient of the reliability came out to be 0.95. The content validity of the scale was taken care by seeking opinion of the content expert.

SPIJE, Vol.3, No.1, January 13 | 45
Findings
The present study aims to investigate the attitude of teachers and parents towards tribal girl's education. To fulfil these objectives t-value was computed and analyzed.
Table 1: The mean score and t- value of urban and rural male teachers towards girls’ education
Table 1 shows the t – value of urban and rural male teachers towards girl's education. The computed t – value (3.90) is significant at .05 level of confidence for 188 df. The table t – value (1.97) is lesser than the computed t – value. Therefore, the hypothesis of the study that “there will be a significant difference in the attitude of urban and rural male teachers towards tribal girl's education gets accepted and looking into the mean scores, it can be interpreted that the male teachers of urban area have more favourable attitude towards girl's education than the rural area.
Table 2:The mean score and t- value of urban and rural female teachers towards girls’ education
The computed t – value (8.42) of urban and rural female teachers' attitude towards girls' education is greater than the table t-value (1.97) at .05 level of confidence for 188 df. So, the hypothesis of the study that “there will be a significant difference in the attitude of urban and rural female teachers towards girl's education” gets accepted and it is understood that, the female teachers of urban area have more favourable attitude towards girl's education than the rural area.
Table 3:The mean score and t- value of urban and rural male parents towards girls’ education
Table 3 reflects that there is no difference in the attitude of urban and rural male parents towards girl's education, as the computed t – value (0.38) is lesser than the table t-value (1.97) at .05 level of confidence for 188 df. Therefore, the hypothesis of the study gets rejected.
Table 4: The mean score and t- value of urban and rural female parents towards girls’ education
Group N Mean Df t-value
Urban 100 54.13 188 3.90
Rural 100 49.13
Group N Mean Df t-value
Urban 100 73.5 188 8.42
Rural 100 71.8
Group N Mean df t-value
Urban 100 68.2 188 0.38
Rural 100 67.6
Group N Mean df t-value
Urban 100 69 188 0.46
Rural 100 68

46 | SPIJE, Vol.3, No.1, January 13
The t – value of urban and rural female parent's attitude towards girl's education is shown in table 4. The computed t – value (0.46) is not significant at .05 level of confidence for 188 df. The table t – value (1.97) is greater than the computed t – value. Therefore, the hypothesis of the study that “there will be a significant difference in the attitude of urban and rural female parents towards girl's education” gets rejected and it can be interpreted that the attitude of urban and rural female parents towards girl's education is almost same.
Conclusion and Discussion
It was observed that the parents of urban and rural area have moderately favourable attitude towards tribal girl's education. This finding is a positive sign, since girl child were not normally encouraged for formal education as compared to boys in tribal community. The major reason is the engagement of daughters in household and agricultural activities. Daughters in tribal community are treated as helping hands for their mothers. Even if they are sent to school, they have to take along their younger's to school with them. Findings also reveal that the teachers both male and female of urban area have more favourable attitude towards tribal girl's education. This may be because of their level of education and awareness. Therefore, to achieve 100% enrolment of girls as targeted under Sarva Shiksha Abhiyan awareness programme for parents through different means is of utmost importance. Teachers and NGOs should be assigned the task to motivate the parents to enrol their daughters in schools, especially the parents who are reluctant to do so. Adult education programme should be made functional to educate the illiterate parents. To motivate girls, more incentives and special efforts should be given to refine girls' school infrastructure on priority basis. Though state government has initiated various programmes and schemes but, very few of them have actually reached the tribal girls and benefited them. Many of the programmes did not benefit the tribal community because of geographical barriers and centralized planning which does not always fit into tribal culture and area. Thus, right policy and proper implementation of centrally sponsored schemes like, KGBVs, Pratibha Koja and Residential schools must be ensured. Finally, ensuring basic facilities like- separate toilets for boys and girls, transportation facilities, safety concerns and good quality teaching will definitely have positive impact on tribal girls' education in the state.
References
2. Ali, A & Buzdar, M.A (2011). Parents Attitude towards Daughters education in Tribal Gazi Khan (Pakistan), Turkish Online Journal of Qualitative Inquiry. Retrieved from www. Google search .com on 5.6.2012
6. Koul, Lokesh (1988). Methodology of education Research, Vikas Publishing house New Delhi.
7. Namshum K (2003). Women Education in Arunachal Pradesh, Himalayan Publishers Itanagar.
1. Ambasht, N.K. (2001). Tribal education: Problems and Issues. Venkatesh Prakashan Delhi .
3. Chattopadhyay, A & Durdhawala, V (2009) Primary Schooling in Tribal District of Maharastra, Some Policy Relevence. Journal of Education Administration and Policy Studies Vol.1 (5)http:/www.academic journals.org/jeaps. Retrieved on 4.8.2012
4. Dutta, Indrance (1997). Women Education in Arunachal Pradesh. Himalayan Publishers, New Delhi
5. Educational Statistics 2011.Directorate of School Education, Govt.of Arunachal Pradesh Itanagar.
8. Samal, R (2012). Parents Attitude towards Schooling and Education of Children. Dept of Social Sciences, NIT, Rourkela. Retrieved from www. Google search .com on 5.8.2012
9. Statistical Abstract of Arunachal Pradesh (2001). Directorate of Arunachal Pradesh, Government of Arunachal Pradesh, Itanagar.
Shaikshik Parisamvad (An International Journal of Education) | 47SPIJE , ISSN 2231 – 2323 (Print), 2231 – 2404 (Online)Vol.3, No.1, January 2013, pp 47 -58.
© 2013 AAEBHU
OPINION OF TEACHER EDUCATORS REGARDING ENVIRONMENTAL EDUCATION AND ENVIRONMENTAL ETHICS EDUCATION
(Anupam Singh and Sunil Kumar Singh, Research Scholar and Associate Professor, Faculty of Education, B.H.U., Kamachha,Varanasi-10,U.P. ,India)
ABSTRACT
This paper is related to the opinion of Teacher Educators teaching Environmental Education to the students of Bachelor of Education (B.Ed.) program. Their opinion regarding existing curriculum of Environmental Education (EE) at B.Ed. level and various aspects of Environmental Ethics Education (EEE) for pupil teachers was taken for the completion of this study. The respondents opined that the present EE curriculum is not suitable to change the environment related behaviour of pupil teachers (B.Ed. students).78.12 percent respondents agreed that there was a need of replacement of present EE curriculum by curriculum of EEE. They agreed to include Meaning of Sustainable Development, Ecological Friendship, Philosophical concept of Environmental Ethics Education, Indian Environmental Ethics, Western Environmental Ethics and methods of Teaching and Evaluation of EEE in the proposed module of EEE.
Key-words: Environmental Education, Environmental Ethics Education
Introduction
The history of Environmental Education (EE) and its implementation around the world in modern era since 1970 till now reveals that Environmental Ethics Education (EEE) may shape the environmentally desired world of tomorrow. It may be considered as the most effective means that society may develop for confronting the environmental challenges of the future. According to Anand (2002), systemized, organized and awakened social mind can be developed only through right type of education and it is through right type of education that appropriate awareness can be created to make life and its environment creative, constructive and progressive. For making students aware, curriculum should be so framed that students can understand and inculcate the concept of sustainable development at all the stages of their education. Curriculum should be, on the basis of recommendations given by UNDESD (UNESCO, 2005). But in practice, no programme of educational reform can be implemented without the willing and active co-operation of teachers. They are one of the main pillars of the society, responsible for educating young people for different walks of life. There is a old proverb which states that, 'no system of education can rise above the levels of its teachers'. Thus, we have to educate our teachers about Environmental Ethics Education (EEE). Accordingly, it is very necessary for the Pupil Teachers (students undergoing Teacher Training) to get educated about Environmental Ethics Education (EEE).
Therefore, prior to suggesting anything concrete about EE and EEE it was found apt to study the opinion of Teacher Educators (Teachers in Teacher Training Institutions) teaching Environmental Education to Bachelor of Education (B.Ed.) students about present curriculum of Environmental Education (EE) and different aspects of a proposed module of Environmental Ethics Education (EEE) for pupil teachers. The paper has been developed in the same direction. Accordingly for proceeding further in this direction the studies related to EE and EEE were reviewed for convenience. Some studies, books, reports and other literature reviewed are- Annual report (2000-2001), Buch (1997),Dey(1992),Dhawan (2005),Gupta (1982),Housebeck et.al (1991),Hsu Shih-
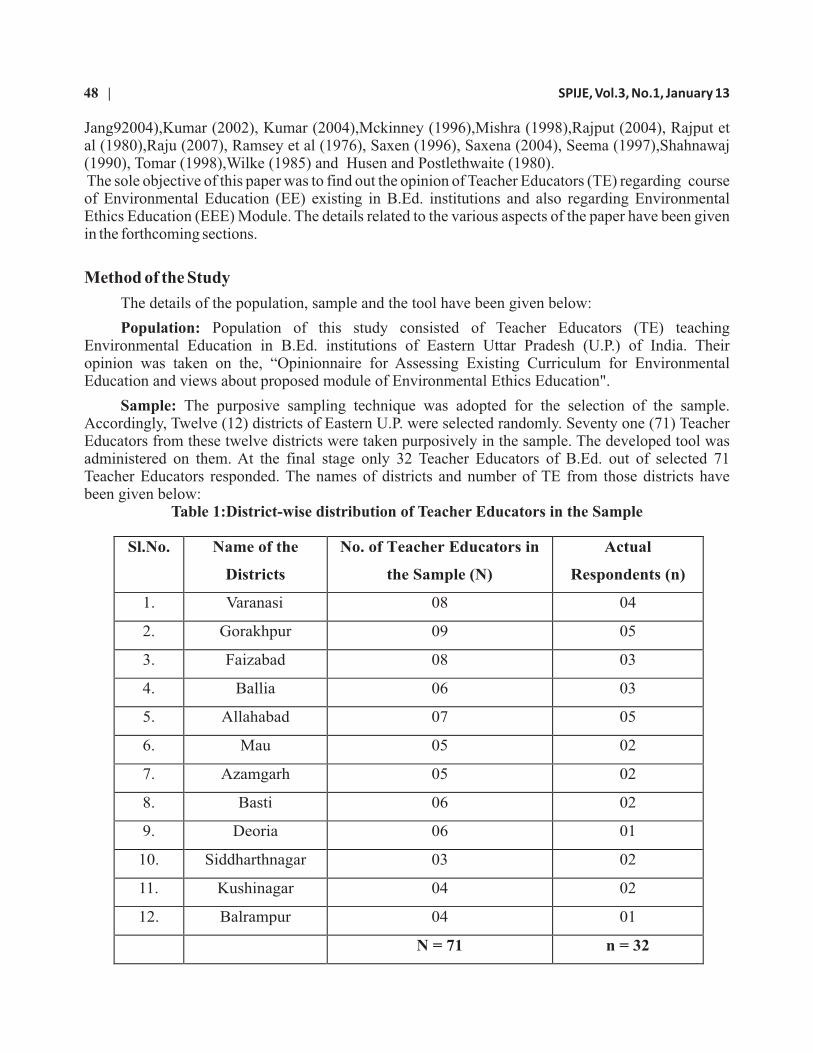
48 | SPIJE, Vol.3, No.1, January 13
Jang92004),Kumar (2002), Kumar (2004),Mckinney (1996),Mishra (1998),Rajput (2004), Rajput et al (1980),Raju (2007), Ramsey et al (1976), Saxen (1996), Saxena (2004), Seema (1997),Shahnawaj (1990), Tomar (1998),Wilke (1985) and Husen and Postlethwaite (1980). The sole objective of this paper was to find out the opinion of Teacher Educators (TE) regarding course of Environmental Education (EE) existing in B.Ed. institutions and also regarding Environmental Ethics Education (EEE) Module. The details related to the various aspects of the paper have been given in the forthcoming sections.
Method of the Study
The details of the population, sample and the tool have been given below:
Population: Population of this study consisted of Teacher Educators (TE) teaching Environmental Education in B.Ed. institutions of Eastern Uttar Pradesh (U.P.) of India. Their opinion was taken on the, “Opinionnaire for Assessing Existing Curriculum for Environmental Education and views about proposed module of Environmental Ethics Education".
Sample: The purposive sampling technique was adopted for the selection of the sample. Accordingly, Twelve (12) districts of Eastern U.P. were selected randomly. Seventy one (71) Teacher Educators from these twelve districts were taken purposively in the sample. The developed tool was administered on them. At the final stage only 32 Teacher Educators of B.Ed. out of selected 71 Teacher Educators responded. The names of districts and number of TE from those districts have been given below:
Table 1:District-wise distribution of Teacher Educators in the Sample
Sl.No. Name of the
Districts
No. of Teacher Educators in
the Sample (N)
Actual
Respondents (n)
1. Varanasi 08 04
2. Gorakhpur 09 05
3. Faizabad 08 03
4. Ballia 06 03
5. Allahabad 07 05
6. Mau 05 02
7. Azamgarh 05 02
8. Basti 06 02
9. Deoria 06 01
10. Siddharthnagar 03 02
11. Kushinagar 04 02
12. Balrampur 04 01
N = 71 n = 32

SPIJE, Vol.3, No.1, January 13 | 49
Preparation of Opinionnaire:
An opinionnaire for assessing existing curriculum for Environmental Education (EE) and views about Environmental Ethics Education (EEE) named as, 'Paryavaran Achar Shiksha Sarvekshan Matawali' was prepared for administration on the Teacher Educators teaching EE in B.Ed. institutions. It has two distinct parts namely - Personal Information and Body of the Opinionnaire. Personal information includes name, age, gender, educational qualification, teaching experience of the respondents (in years) and University/College Name of the respondent. The main body of the opinionnaire consists of 31 items. Some items consist of sub-items. These items are distributed over four broad areas as given below:
a) Opinion on existing curriculum (7 items);
b) Opinion on Environmental Ethics curriculum (5 items in which item number 4 has 15 sub-items);
c) Opinion on Teaching Strategies & Evaluation Techniques (11 items in which number 6 has 9 sub-items); and
d) Opinion on Environmentally Ethical behaviour of the students (8 items).
Table – 2: Description of Opinionnaire (Item-wise)
The structure of the opinionnaire is of mixed type, i.e. both closed and open ended questions have been included. There were 31 items in this opinionnaire titled as “Paryavaran Achar Shiksha Sarvekshan Matawali” in Hindi. The items are basically related to the four dimensions mentioned above. The opinionnaire has been expert validated for the contents included in it.
Data Analysis and Interpretation
Analysis of the data obtained on the Opinionnaire administered on the Teacher Educators teaching Environmental Education at B.Ed. level has been presented dimension-wise in the below given sections. The responses related to each dimension have been presented in a tabular form. The
Sl.
No.
Area /Dimension Total Items
Item Numbers
1. Existing curriculum 7 1.1, 1.2, 1.3, 1.4, 1.5, 1.6, 1.7
2. Environmental
Ethics curriculum
5 2.1, 2.2, 2.3, 2.4 (2.4.1, 2.4.2, 2.4.3, 2.4.4,
2.4.5, 2.4.6, 2.4.7, 2.4.8, 2.4.9, 2.4.10,
2.4.11, 2.4.12, 2.4.13, 2.4.14, 2.4.15), 2.5,
3. Teaching strategies
and Evaluation
Techniques
11 2.6, 2.6.1, 2.6.2, 2.6.3, 2.6.4, 2.6.5, 2.6.6,
2.6.7, 2.6.8, 2.6.9 and 3.1, 3.2, 3.3, 3.4, 3.5,
3.6, 3.7, 3.8, 3.9, 3.10
4. Environmental
Ethics behaviour
8 4.1, 4.2, 4.3, 4.4, 4.5, 4.6, 4.7, 4.8

50 | SPIJE, Vol.3, No.1, January 13
related items with respect to each dimension have been presented below with the respective tables and accordingly the obtained responses in form of 'agree' and 'disagree' have been presented as frequency and percentage along with each item.
Dimension 1-Opinion on existing curriculum of Environmental Education (EE):
The details related to the opinion of respondents regarding EE curriculum prevalent in B.Ed. institutions have been presented below in table 3.
Table 3: Opinion of Teacher Educators on Existing Curriculum of EE.
(*= Percentage has been given in parentheses with frequency)
Interpretation:
The above table clearly reveals that according to the 56.25 percent respondents the existing EE curriculum in B.Ed. institutions is not fit for changing student's behaviour 65.63 percent respondents admitted that the content is unnecessary whereas 68.75 percent felt it as impractical. Therefore, about 53 percent felt the need of reformation whereas about 78 percent of the TE felt the need to replace the present EE curriculum with EEE curriculum.
Dimension 2: Opinion on content of proposed Environmental Ethics Education Module (EEEM)
The details related to the opinion of Teacher Educators teaching EE in B.Ed. institutions, regarding content of EEEM have been presented below in the tables 4(a) and 4(b).
Table 4 (a): Opinion on content of proposed EEEM
Sl.No. Item details related to Curriculum of EE Frequency* of Responses Agree Disagree
1. The ability of present EE curriculum to change student’s behaviour
14(43.75) 18 (56.25)
2. The ability of present EE curriculum to change student’s reorganization
16 (50) 16(50)
3.
Unnecessary content in present EE curriculum
21(65.63)
11(34.37)
4.
Impracticability of present EE curriculum
22(68.75)
10(31.25) 5.
Ability to deeply understand facts
through EE
curriculum
15(46.87)
17(53.13)
6.
Need of reformation in present EE curriculum
17(53.13)
15(46.87) 7.
Need
to replace present EE curriculum by
Environmental Ethics Education
(EEE)
Curriculum
25(78.12)
07(21.88)
Sl.No. Item details related to proposed EEEM Frequency* of Responses
Agree
Disagree
1.
Include “Meaning of Sustainable Development” in EEEM
25(78.12)
07(21.88)
2.
Include “Ecological Friendship” in EEEM
22(68.75)
10(31.25) 3.
Include “Philosophical concept of Environmental Ethics Education” in EEEM
Indian Environmental Ethics 30(93.75) 02(6.25)Western Environmental Ethics 26(81.25) 06(18.75)
(*= Percentage has been given in parentheses with frequency)

SPIJE, Vol.3, No.1, January 13 | 51
Interpretation:
The above table 4 (a) clearly reveals that TE were of the opinion that, meaning of sustainable
development (78.12 percent), ecological friendship (68.75 percent), and philosophical concept of
EEE-Indian(93.75 percent) and western (81.25 percent) should be given place as content in the
proposed EEEM.
Table 4 (b): Inclusion of Problems of Environment and Ethics in proposed EEEM
(*= Percentage has been given in parentheses with frequency)
Interpretation:
The above table 4(b) reveals that majority of the Teacher Educators are of the opinion that the EEEM should include content related to the problem of environment and ethics related content related to Air Pollution (78.12) ,Water pollution (84.38), Noise Pollution (68.75), Radioactive Pollution (71,87) , Soil Pollution (84.38), Biodiversity Conservation (90.62), Waste Management (78.12) and Energy Conservation (68.75).
Further regarding opinion related to inclusion of the teaching strategies
Dimension 3: Opinion on useful Teaching Strategies and Evaluation Techniques for Environmental Ethics Education
On the question, How to teach Environmental Ethics? , the responses obtained from the Teacher Educators teaching EE at B.Ed. level have been presented below in table 5.
Sl.No.
Proposed Topic
Frequency*
of Responses
Agree
Disagree
1.
Green House Effect
08(25)
24(75)
2.
Ozone layer depletion
07(21.88)
25(78.12)
3.
Global warming
09(28.13)
23(71.87)
4.
Air pollution
25(78.12)
07(21.88)
5.
Water pollution
27(84.38)
05(15.62)
6.
Rising Sea level
05(15.62)
27(84.38)
7.
Noise pollution
22(68.75)
10(31.25)
8.
Radioactive Pollution
23(71.87)
09(28.13)
9.
Soil pollution
27(84.38)
05(15.62) 10.
More use of Polythene
07(21.88)
25(78.12)
11.
More use of Pesticides
09(28.13)
23(71.87) 12.
Problem of Food
06(18.75)
26(81.25)
13.
Drinking water problem
08(25)
24(75)
14.
Biodiversity conservation
29(90.62)
03(9.38)
15. Waste management 25(78.12) 07(21.88) 16. Energy conservation 22(68.75) 10(31.25)

52 | SPIJE, Vol.3, No.1, January 13
Table 5: Responses on useful Teaching Strategies for EEEM
(*= Percentage has been given in parentheses with frequency)
Interpretation:
From the above table 5, it is evident that, for teaching EEE majority of the Teacher Educators
in the sample agreed to include the Teaching Strategies and Techniques like Discussions on
Environment related Case Studies, Self evaluation of behavior with all component of environment,
Ethics development, Community activities, Story Telling, Painting/ poster/ poetry/ essay
competition, Short play/Mime, Folk game playing, Discussions on Scrapbooks and Diary writing for
teaching Environmental Ethics Education.
Regarding the question related to inclusion of “Evaluation methods for Environmental Ethics
Education” in module the responses obtained from respondents have been given below in table 6.
Sl.No. Proposed Teaching Strategies and techniques Frequency* of Responses
Agree Disagree
1. Discussions on Environment related Case
Studies 30(93.75) 02(6.25)
2. Self evaluation of behavior with all components
of environment
27(84.38) 05(15.62)
3. Ethics development 29(90.62) 03(9.38)
4. Community activities 24(75) 08(25)
5. Story Telling 24(75) 08(25)
6. Painting/ poster/ poetry/ essay competition 26(81.25) 06(18.75)
7. Short play/Mime 25(78.12) 07(21.88)
8.
Folk game playing
30(93.75)
02(6.25)
9.
Discussions on Scrapbooks
30(93.75)
02(6.25)
10.
Diary writing
27(84.38)
05(15.62)

SPIJE, Vol.3, No.1, January 13 | 53
Table 6: Inclusion of Evaluation Techniques for Environmental Ethics Education in proposed
EEEM
(*= Percentage has been given in parentheses with frequency)
Interpretation:
The above table 6 clearly reveals that majority of the TE were of the opinion that, the EEEM should include the content related to evaluation through Questionnaire, Observation, Schedule, Interview, Paper-pencil test, Rating scale, Situation-Reaction Test, Observation in Artificial Situation and Self reporting.
Dimension 4: Opinion on expected daily life behaviour of pupil Teachers taught through Environmental Ethics Education Module
On the question, what type of behaviour will be expected from a student who will be taught Environmental Education by proposed Environmental Ethics Education Module?, the respondents gave different views related to various components of environment. In the open ended section of the opinionnaire the respondents gave their views in the form of some sentences for different components of the environment. Some important opinions of respondents obtained on different components of environment have been presented below in table 7:
Table 7: Opinion regarding expected daily life behaviour of pupil Teachers taught through Environmental Ethics Education Module
Sl. No. Proposed Evaluation Methods Frequency* of Responses Agree Disagree
1. Questionnaire 26(81.25) 06(18.75) 2. Observation 25(78.12) 07(21.88) 3. Schedule 23(71.87) 09(28.13) 4. Interview 24(75) 08(25) 5. Paper-pencil test 21(65.63) 11(34.37) 6. Rating scale 27(84.38) 05(15.62) 7. Situation-reaction Test 30(93.75) 02(6.25) 8. Observation in Artificial situation 31(96.87) 01(3.13) 9. Self reporting 29(90.62) 03(9.38)
Component of Environment
Sl.No. Expected Environmentally Ethical Behaviours
Air pollution 1. Use public vehicle.
2. Use Mosquito Net. Don’t use coil or liquid.
3. Must plant tree on all special days.
4. Reduce the use of Freeze and Air Conditioners.
5. Walk to school if the distance is not too long.
6. Save Electricity and not misuse it.
Water pollution 1. Don’t dirty ponds/river banks by latrine or other things.
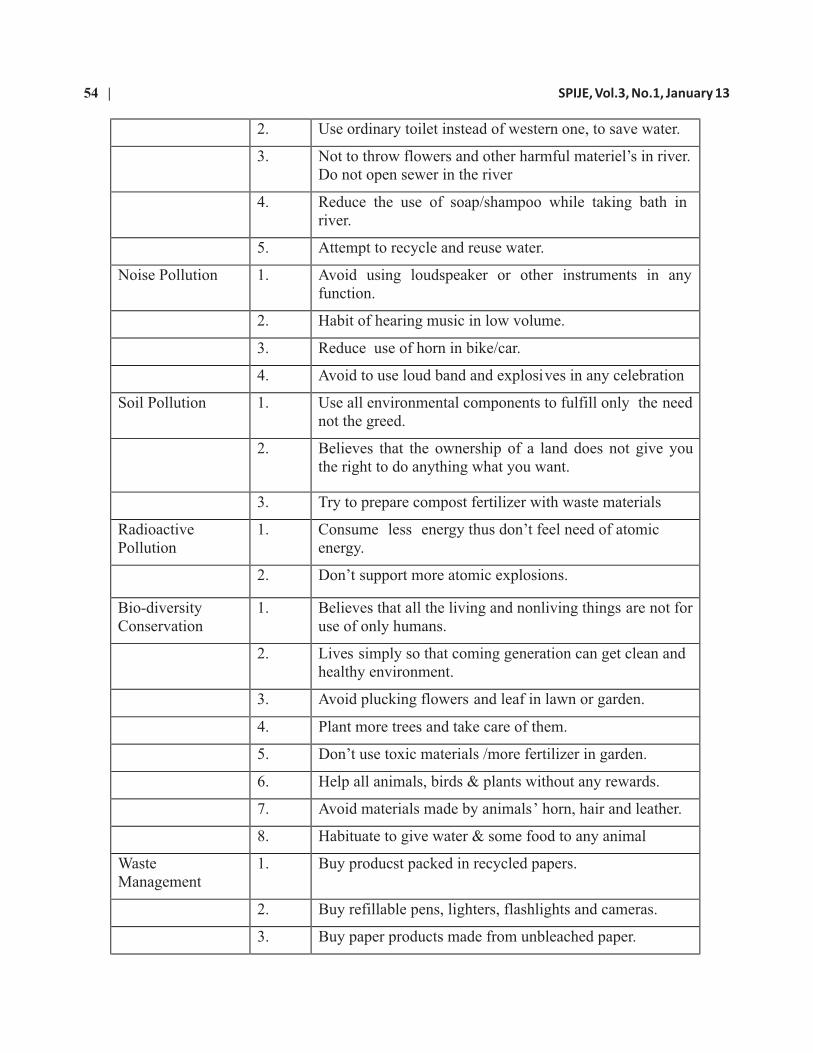
54 | SPIJE, Vol.3, No.1, January 13
2. Use ordinary toilet instead of western one, to save water.
3. Not to throw flowers and other harmful materiel’s in river. Do not open sewer in the river
4. Reduce the use of soap/shampoo while taking bath in river.
5. Attempt to recycle and reuse water.
Noise Pollution 1. Avoid using loudspeaker or other instruments in any function.
2. Habit of hearing music in low volume.
3. Reduce use of horn in bike/car.
4. Avoid to use loud band and explosives in any celebration
Soil Pollution 1. Use all environmental components to fulfill only the need not the greed.
2. Believes that the ownership of a land does not give you the right to do anything what you want.
3. Try to prepare compost fertilizer with waste materials
Radioactive Pollution
1. Consume less energy thus don’t feel need of atomic energy.
2. Don’t support more atomic explosions.
Bio-diversity Conservation
1. Believes that all the living and nonliving things are not for use of only humans.
2. Lives simply so that coming generation can get clean and healthy environment.
3. Avoid plucking flowers and leaf in lawn or garden.
4. Plant more trees and take care of them.
5. Don’t use toxic materials /more fertilizer in garden.
6. Help all animals, birds & plants without any rewards.
7. Avoid materials made by animals’ horn, hair and leather.
8. Habituate to give water & some food to any animal
Waste Management
1. Buy producst packed in recycled papers.
2. Buy refillable pens, lighters, flashlights and cameras.
3. Buy paper products made from unbleached paper.

SPIJE, Vol.3, No.1, January 13 | 55
Findings
On the basis of the analysis and interpretations given above along with tables 3,4a, 4b and 5 it is clearly reflected that Teacher Educators teaching EE in B.Ed. institutions are of the opinion that the existing curriculum of EE being taught by them is not able to change the behaviour of pupil teachers. It does not induce environmental ethics in them. They also don't find it fit for pupil teachers and are of the opinion that it should be replaced by a curriculum of EEE.A module of EEE according to them and also based on the review of literature in EE and EEE, should contain the following contents as summarized in table 8 given below:
Table 8: Summary of the contents in the proposed Environmental Ethics Education Module based on the opinion of Teacher Educators teaching EE at B.Ed. level
4. Reuse plastic containers and glass to store pencils,
crayons and other items.
5. Share magazines and books with friends.
6. Reuse envelops, files and folders.
7. Use both sides of paper to write, print and photocopy.
8. Reuse plastic bags, don’t throw them here and there.
9. Try to repair rather than replace any home appliances.
Unit Name of The Unit
Sub- themes within the Unit
1 Sustainable
Development
Sustainable Development, Environmental Friendship,
Environmental Ethics
2 Philosophical
bases of
Environmental
Ethics
(A) Environmental Ethics in Indian Tradition
(B) Environmental Ethics in Western Tradition
Anthropocentrism-Judeo-Christian, Consequentialism-
Teleological Tradition , Utilitarianism, Deontology, Non-
anthropocentric ethical Tradition - Biocentrism, Eco-
centrism, Deep Ecological Ethics, Eco-feminism
3 Areas of
Pollution
Air Pollution, Water Pollution, Soil Pollution, Noise Pollution,
Radio-active Pollution, Energy Conservation, Bio-diversity
Conservation, Solid –waste Management

56 | SPIJE, Vol.3, No.1, January 13
Further, as expressed by the Teacher Educators after being taught through the above content of EEE module the pupil teachers are expected to reflect the environmentally ethical behaviour as mentioned in summarized form in table 7 already given in the above sections under analysis and interpretation of the dimension four of the opinionnaire.
Conclusions and Educational Implications
On the basis of the above mentioned analysis and the findings of the study some important conclusions have been drawn as mentioned below.
1. Existing Environmental Education curriculum is not able to change the Students behaviour.
2. Existing Environmental Education curriculum is not able to change in student's reorganization ability of ethical/unethical environmental situations.
3. Many unnecessary and impractical contents are present in existing EE curriculum.
4. Present EE curriculum is not able to help pupil teachers to deeply understand facts of environmental ethics.
5. There is a need of reformation in present EE curriculum.
6. There is need of replacement of present EE curriculum by Environmental Ethics Education curriculum.
7. On the basis of opinions of Teacher Educators teaching Environmental Education in B.Ed. institutions and the review of the related literature in EE and EEE the contents of 'Environmental Ethics Education Module' have been identified as given above in table 8.
8. On the basis of opinions of Teacher Educators teaching Environmental Education in B.Ed. institutions the environmentally ethical behaviours related to various components of environment, expected from pupil teachers being taught on the basis of contents of 'Environmental Ethics Education Module' have been summarized in table 7 given above.
4 Teaching
Strategies and
techniques for
Environmental
Ethics
Discussions on Environment related Case Studies, Self
evaluation of behavior with all component of environment,
Ethics development, Community activities, Story Telling,
Painting/ poster/ poetry/ essay competition, Short play/Mime ,
Folk game playing, Discussions on Scrapbooks and Diary
writing.
5 Evaluation
techniques for
Environmental
Ethics
Questionnaire, Observation, Schedule, Interview, Paper-pen
Test, Rating scale test , Situation Reaction Test , Observation in
artificial situation and Self Reporting .

SPIJE, Vol.3, No.1, January 13 | 57
The major educational implication for theory and practice in the field of Education, based on the above conclusions is that, it is the responsibility of all the Teacher Training/Education Institutions globally as well as at the national level in India to develop environmental ethics in trainees. Particularly in India to achieve this purpose Environmental Ethics Education (EEE) should be made compulsory in pre-service teacher education programmes like B.Ed. NCTE discussion document (2004) also emphasized on the importance of environmental ethics education for pre-service teachers and in–service teachers and its inclusion in the teacher training program. Therefore the curriculum of EE for Pupil Teachers should be amended to develop it as EEE. It is also the responsibility of the national level institutions such as NCERT, SCERT, NUEPA, Academic Staff Colleges and Departments of Education in the Universities to promote environmental ethics through implementation of EEE in pre-service & in-service teacher and Teacher Educator programs. The findings and conclusions of this study may help a lot in the fulfillment of goals of environmental education in this direction.
References
1. Anand, A. (2002).A study of relationship between environmental awareness and Scientific attitudes among higher secondary students of Varanasi city .Unpublished Ph.D.Thesis. Faculty of education,B.H.U.,Varanasi
2. Annual report(2000-2001).Ministry of environment&forest, Govt. of India,pp.149- 150.
3. Dey, S. (1992).A comparative study of environmental awareness in higher secondary school education, Unpublished M.Ed.dissertation, B.H.U.,Varanasi.
4. Dhawam, S., Rawat, L. & Sharma,V. (2005). Environmental Education in Pre service Teacher Education. Journal of Indian Education, Vol. XXXI (2), P.29-44.
5. Gupta, R. (1982),A study of environment awareness of secondary school teachers Unpublished M.Ed. dissertation, F.O.E., B.H.U., Varanasi.
6. Housebeck, K.M., Mibrath, L.W. & Enright, S. M. (1991) Environmental knowledge, awareness and concern amongst 11th grade students: New York State, Environmental Education, Vol. 24(1).
7. Hsu, Shih-Jang (2004). The effect of an environmental education programme on responsible environmental behavior and associated environmental literacy variables in Taiwanese college students. The Journal of Environmental Education, Vol. 35(2), P.37-39.
8. Husen,T. & Postlethwaite, T.N.(1980). The international encyclopedia of education, Pregaman press, Oxford,Vol.3, pp.1778-1786.
9. Kumar, B. (2004).Environmental education .Dominant publishers and distributors, New Delhi.
10. Kumar, S.B. (2002). Environmental Problems and Gandhian solution. NewDelhi: Deep and Deep publication .
11. Mckinney, M.L. & Schoch, R.M. (1996). Environmental science:system & solutions. New York : West publishing company,Newyork.
12. Mishra, S.N. (1998). Study of environmental awareness of secondary school (U.P. & C.B.S.E.Board students).Unpublished M.Ed. dissertation, Faculty of Education. B.H.U.,Varanasi.

58 | SPIJE, Vol.3, No.1, January 13
14. NCTE (2004). Some specific Issues and concern of Teacher Education, A Document, NCTE New Delhi.
15. Rajput, J.S. (2004), The values context in environmental education, Journal of Value Education, Vol. 3(2), P. 5 -13.
16. Rajput, J.S., Saxena, A.B., & Jadhav, V.G. (1980). A research study in environmental approach of teaching at primary level,In Third Survey of Research in Education, P.813
17. Raju, G. (2007). Environmental ethics of higher secondary school students, Edutrack, Vol. 6 (11), P.32-36.
18. Ramsey, C.E. & Rickson, R.E. (1976.) Environmental knowledge and attitude. The Journal of Environmental Education, Vol.8 (1), P.10-18.
19. Saxena, A.B. (1996). Education for the environmental concerns: Implication and Practices. Radha Publication, New Delhi.
20. Saxena, A.B. (2004) Promoting Environmental Values through New Approaches in Schools, Journal of Value Education( Special issues on environmental education values), Vol.3 (2).P. 127-135.
21. Seema (1997), A survey of awarevess of college students regarding environmental Pollution. Unpublished M.Ed. dissertation,Faculty of Education, B.H.U. Varanasi.
22. Shahnawaj (1990). Environmental awareness and environmental attitude of secondary and higher secondary school teachers and students. Ph.D. Education, Rajastan University, In Fifth Survey of Education Research ,P. 175.
23. Tomar, A (1998). An introvention to improve the quality of instrucation in environmental science for Primary level school children. A doctoral thesis, M.S.U.Baroda. Retrived oct 16, 2007, from http.//w.w.w.educationinindia.nic.
24. Wilke, R.J. (1985). Environmental Education Teacher Resource Handbook for K-12. American Book Co., New York , 274-278

Shaikshik Parisamvad (An International Journal of Education) | 59SPIJE , ISSN 2231 – 2323 (Print), 2231 – 2404 (Online)Vol.3, No.1, January 2013, pp 59 - 66.
© 2013 AAEBHU
APPRAISAL OF INCLUSIVE EDUCATION WITH REFERENCE TO PHYSICAL ACCESS IN GANJAM DISTRICT OF ODISHA
(Sunanda Jati, Senior Lecturer, Department of Education, Dau Dayal Women's P.G. College, Firozabad, U.P., India, E-mail: [email protected] )
ABSTRACT
This study was undertaken with the objectives to find out (1) total number of children with special needs identified during 2010-11, (2) total number of children with special needs enrolled & covered through school readiness programme and Home Based Education, (3) total number of children with special needs assessed during 2010-11, (4) total number of children with special needs distributed aids & appliances through single window camp, (5) total number of ramps and hand rails constructed in year 2011-12 and, (6) the amount of money allotted to schools for the purpose of children with special needs. Data were also collected through interview and from the sources like records and other documents available at SSA Office of Ganjam district. In order to verify those official documents regarding physical access for CWSNs researcher randomly selected 10 primary schools of Ganjam district of Odisha and all CWSNs of those respective schools for evaluation of physical access provided to them. The study revealed that as per Child Tracking System and District Information on School Education and report of field of functionaries a total of 9894 differently able children were identified. Out of them 9182(92.8%) children were enrolled and 712 were out of schools. This paper reveals other details related to inclusion too.
Key-words: Inclusive Education, Physical Access.
Introduction
“Inclusion without resources, without support, without teacher preparation time, without commitment, without a vision statement, without restructuring, without staff development, won't work” ( Mara Sapon-Shevin,2005).This statement clearly reflects that a lot of grass root effort has to be made to ensure inclusion. Initially we know that, segregating children based on disability was discriminatory and violation of the human rights. Subsequently, the philosophy of 'integration' emerged which advocated education of children with mild and moderate disabilities in general schools along with others with adequate resource support. But children under integrated settings were still treated separately in schools and integration or mainstreaming was only partial. This led to the emergence of the new concept called Inclusive Education (IE) which argues that all children irrespective of the nature and degree of the disability should be educated in general schools with normal children. Inclusive education wishes that education system should value all children irrespective of the nature and degree of disability. Children herald a new tomorrow and education plays an influencing role in shaping the worldview of children by creating an inclusive and barrier free society. It is in this context that schools are acknowledged as a crucial sphere for developing a tolerant and plural community by means of imparting education and developing equal opportunities for all.
In spite of these efforts, UNESCO (1999) report indicated that the implementation of inclusive education in India remained at a very preliminary stage. This evidence is consistent with other
60 | SPIJE, Vol.3, No.1, January 13
experiences of developing countries where inclusive education has been legislatively adopted but educational and other benefits of inclusion have not been achieved (Eleweke & Rodda, 2002).
As “disabling educational environments affect all children, not only those who are identified as having impairments,” (Miles, 2000) it is essential that school quality issues are identified and addressed. The re-conceptualisation of inclusive education as a school quality issue could have significant impact on educational change in India for all children. Singal's (2005). Singal (2005a) argued that government policies focused on resources and physical access (distribution of aids and appliances) or infrastructure such as ramps in schools and notion of social justice through the equal distribution of benefit, seems to be more about inputs, not processes like pedagogy, curriculum or attitudes.
But we should not forget that without better input process can never be possible. Even without proper input process will become paralyzed. Thus Quality Education revolves around the availability and quality of infrastructures along with required support services.Identification is done to know the extent of the problem or the number of children with special needs in a particular district. It also gives a rough idea of the kind of disability prevalent in that area so that planning could be done accordingly. Under SSA, this exercise would be done under micro planning. Moreover, in SSA since the budget to be provided for education of children with special needs depends on the number of children identified, it is important that it is undertaken by those who are oriented to different types of disabilities like visual impairment, hearing impairment, loco-motor impairment, mental retardation, learning disabilities, cerebral palsy and multiple disabilities, so that they can also identify children with mild to moderate disabilities. The initial screening of children with special needs enrolled in schools could be done by general teachers, after being trained on how to identify such children in classrooms. Formal assessment is undertaken to determine the nature, type and extent of disability. Functional assessment means to get an idea of the child's current level of functioning. Both formal and functional assessment should be done by a competent team comprising doctors, eye specialist, ENT specialist, resource teachers and general teachers. Appropriate referrals should also be provided through this assessment. This means that if the team doing the assessment feels that a particular child cannot come to school at this point in time on account of his/her disability, then alternative educational placement should be suggested. The team should also specify that what aids and appliances the child requires. Assessment could be done with the help of PHCs, National Institutes, Composite Resource Centres and District Disability Rehabilitation Centres. (Dash, 2007)
In the assessment camp, the decision regarding appropriate educational placement for every child with a special need should be made. As far as possible, effort should be made to place children with special needs in regular schools with all the support they would require. However, if a child has a severe disability, it might not be possible for him or her to attend a regular school nor would it be feasible for a regular school to provide all those special services, such as physiotherapy, occupational therapy and speech therapy that might be required by this child. Hence, in these circumstances the team doing the assessment should suggest some other alternative educational options such as EGS&AIE centres, distance learning and home-based education.
After the assessment and educational placement, the SSA State Mission Societies should chalk out an appropriate strategy to provide assistive devices to children with special needs. The aids and appliances needed by children with special needs are those that enhance their functional capacity. A few examples might be a hearing aid for a child having hearing impairment, glasses and lenses for a
SPIJE, Vol.3, No.1, January 13 | 61
low vision child and callipers, crutches for a child having orthopaedic impairment.
Development of innovative designs for schools to provide an enabling environment for children with special needs should also be a part of the programme. This activity could be undertaken jointly with the Civil Works component under SSA. All new school buildings being constructed under SSA should have ramps, handrails and other such modifications to provide easy access. Some provisions should also be made so that the existing school buildings are also made barrier free.
Need and significance:
Segregation or isolation is good neither for learners with disabilities nor for general learners without disabilities. Societal requirement is that learners with special needs should be educated along with other learners in inclusive schools, which are cost effective and have sound pedagogical practices (NCERT, 2000). Segregating children based on disability was discriminatory and violation of the human rights. Subsequently, the philosophy of 'integration' emerged which advocated education of children with mild and moderate disabilities in general schools along with others with adequate resource support.
Identification or mapping children with special needs is an integral part of inclusive education. A concerted drive to detect children with special needs at an early age should be undertaken through PHCs (Primary health centres), ICDS (Integrated Child Development Scheme), ECCE (Early Childhood Care and Education) centres and other school readiness programme.
Assessment of identified child should be carried out to ascertain the extent and type of disability, the nature of support services required and assistive device required by the child. Architectural barriers in schools would have to be removed for easy access and to promote inclusion of children with special needs. Schools must be designed using an inclusive lens to create barrier free environments and accessible buildings must incorporate not only through ramps, but also through accessible classrooms, toilets playgrounds etc.
Every child with special needs should be placed in the neighborhood school, with needed support services. For instance, they may need mobility training, training in Braille, sign language, postural training, etc. Thus, school readiness of children with special needs must be ensured by providing 'special training' as envisaged in the Right to Education Act. This means that a) all children with special needs, who are not enrolled in schools or have dropped out, will first be enrolled in a neighborhood school, b) they will be entitled to special training through regular teachers or teachers specifically appointed for this purpose c) and then mainstreamed in general schools along with their peer in age appropriate class. Accordingly the present study was taken with the formal title, 'Appraisal of Inclusive Education with reference to Physical Access for Children with Special Needs in Ganjam district of Odisha'.
Objectives:
The objectives of the study were to find out:
1. Total number of children with special needs identified during 2010-11.
2. Total number of children with special needs enrolled & covered through school readiness programme and Home Based Education (HBE).
3. Total number of children with special needs assessed during 2010-11.
62 | SPIJE, Vol.3, No.1, January 13
4. Total number of children with special needs distributed aids & appliances through single window camp.
5. Total number of ramps and hand rails constructed in year 2010-11.
6. The amount of money allotted to schools for the purpose of toilet modification for children with special needs( CWSNs).
7. Evaluation of various aspects of physical access for CWSNs in Ganjam District of Odisha.
Method and Procedure:
Descriptive method of research has been adopted for this study. An interview schedule was prepared by the researcher for district coordinator (DC) to collect the data. The researcher interviewed the District Coordinator at the SSA Office of Ganjam at Chattarpur. Prior to this researcher met and approached the State Coordinator for permission to collect data from the SSA Office. Immediately consent letter was issued to the researcher and the copy was sent to District Coordinator by e-mail. With that permission letter the researcher proceeded for data collection. The State SSA Office provided the researcher with address and contact numbers of all District Coordinators of Orissa. Through telephonic conversation researcher get the date and time to meet Sh. Tapan Kumar Sahoo, District Coordinator of Ganjam district. Data were also collected from the secondary sources like records and other documents available at SSA Office of Ganjam district. SSA, Ganjam Report on Progress over view on Inclusive Education for Children with Special Needs 2010-11 was also a source from which data were reviewed. In order to verify those official documents regarding physical access for CWSNs, primary data also collected by the researcher. Purposive sampling was used to select 10 primary schools of Ganjam district of Odisha with at least one OI/CP studying in those schools. A self made interview schedules and school observation schedule was prepared by the researcher consultation with the guide Dr.Sudarshan Baral for Head Masters of sample schools. Simple percentile is used for calculation of the data.
Findings:
A. From Official Documents:
1. As per Child Tracking System and District Information on School Education and report of field of functionaries a total of 9894 differently able children were identified. Out of 9894 identified children with special needs, 9182(92.8%) children were enrolled and 712(7.1%) were out of schools. As out of school children were still 7.1% of total number of children with special needs identified, it was planned to mainstream all 712 out of schools children with special needs taking different strategy like motivating them to enroll in normal schools. All 712 nos. out of school 169 (1.7%) children with special needs are covered under HBE and 543(5.4%) are covered under school readiness programme during 2010-11 by Inclusive Education (I.E.) volunteers.
2. Out of 9894 identified children with special needs students it is found that more number of boys are orthopedically impaired i.e.13.9%, where as girls are more of low vision and constitutes 11.7% of total children with special needs identified.
3. All total in 14 venues named Purusottampur, Hinjli, Sheragada, Soroda, Kukudakhandi, Berhampur, Rangeilunda, Digapahandi, Buguda, J.N. Prasad, Polosara Dharakote,

SPIJE, Vol.3, No.1, January 13 | 63
Bhanjanagar, K.S.Nagar of Ganjam district Single Window camps for assessment of children with special needs organized and only 1183 Students were provided with aids and appliances out of 4397 participants of single window camp.) .Out of Total 9894 identified children with special needs only 4397(44.4%) v participated in single window camp which shows very poor participation. Only 11.9% children with special needs were provided with aids and appliances .Parents should be motivated and BRTs /I.E. volunteers/BRCC/CRCC should take initiative for total participation and assessment.
4. In Purusottampur out of 359 participants of single window camp 89 CWSN were provided with aids and appliances. Similarly, in Hinjli 63 out of 196 participants, in Sheragada 101 out of 225, in Soroda107 out of 248, in Kukudakhandi 93 out of 243 ,in Berhampur 57 out of 143, in Rangeilunda 66 out of 198 ,in Digapahandi 160 out of 508, in Buguda 97 out of 387 ,in J.N.Prasad 61 out of 499 , in Polosara 95 out of 394 , in Dharakote 49 out of 321 , in Bhanjanagar 67 out of 393 , in K.S.Nagar 78 out of 285 were assessed and provided with aids and appliances as mentioned above.(Appendix-5)
5. Two day screening camp for surgical correction of cleft lip and palate children had been conducted on 25th & 26th June 2010 at the premises of DPO (District Project Officer), SSA, Ganjam. Dr. Subrat Jena, Director Ashwini Hospital , Cuttack with his team completed screening camp in 2 days. Total 94 children were detected and surgery of 82 nos. children was completed in phase wise during the financial year 2010-11. Further surgery of 12 nos. cataract cases have been completed in ECOS Hospital of Berhampur during the month of July 2011.
6. As per progress overview of SSA, Ganjam, Odisha, 1014 ramps and handrails in different schools has been planned and constructed. Bhanja Nagar block is having 93 ramps and hand rails which is highest among all blocks, where as K.S.Nagar block is having 12 no of ramps and hand rails which is lowest among all blocks.(Appendix-4)
7. An amount of Rs. 7000/- to each school has been deposited in favour of Village Education Committee & Head Master of concerned schools in the month of July 2010. The construction work had been completed by direct supervision of Block Resource Teacher, Block Resource Centre Coordinators of concerned blocks. But still there is need of construction of modified toilet which is very negligible in nature and no data was available in documented form.
B. Analysis of Interview Schedule of Head Master/Head Mistress
1. Out of 10 schools, 40% schools were having 2 numbers of CWSNs where as other 20% schools were 3, 30% schools were having 5and rest 10% schools were having single number of CWSNs. All together there were 30 CWSNs in those sample schools and each school had at least one CWSN with orthopedic handicapped (O.H) or Cerebral Palsy (C.P).(Appendix-6)
2. When H.Ms are asked who are the different functionaries related to Identification and Assessment 40 % replied may be doctors and resource teachers .They said that this is not our job .This should be done by the government and when CWSNs will admitted to our school we will take care of them. Whereas rest 60% H.Ms had thorough knowledge of

64 | SPIJE, Vol.3, No.1, January 13
Identification and Assessment procedure and they said that they themselves visit the home to get that child admitted to in their school and resource teacher helps the parents as well as motivate them to attend single window camp for proper identification and assessment. The Head Masters were very positive in their attitude towards the education of CWSNs.
3. 100% H.Ms replied that their schools have Learning corners, for special children, TLM for disabled children, Ramps, Handrails. But 10% H.Ms replied that they have modified toilet and resource room facilities. That means in rest 90% schools had no resource room or modified toilet. Though 60% H.M. agreed that they have received grant for toilet and soon it will be started. In emergency, parents of CWSNs are called and students are sent to their home if not then out side school campus is used for that purpose. Though 10% schools had resource room but that was never used by the resource teacher as reported by the H.M.
But as far as researcher's observation is concerned 90% schools had no Learning corner for CWSNs and classes were over crowded. Even it was difficult for the class teacher to manage the class. CWSNs with speech and hearing impairment or orthopedic impairment were very well accommodated in those class rooms. The excellent part was CWSNs and peer group interaction. But CWSNs with Severe MR category or CP category were isolated and were seated towards last row and they were silent and as per teacher's view due to severe disability neither they themselves participate nor their peer group take any initiation to interact with them .There was no interaction at all with peer group. Though they were physically present in the class still they were isolated. It should be taken care for their better participation.
4. Out of 10 schools, all schools (100%) were having ramps with handrails. As far as researcher's observation is concerned except 20% of schools in rest of the schools ramps were not properly constructed for independent movement of CWSNs. It was difficult for O.H children to move without escort's support. When H.M asked about this he said these ramps were made before we get any guidelines regarding construction, so now we will modify it for better and easy access.
5. It was found that 100% schools had no access for wheel chair and tricycle into class rooms as doors of classrooms were not wide enough for entry of any tri cycle or wheel chair. It was found that in 100% schools, classes were over crowded. Due to this reason it was difficult to accommodate CWSNs with assistive devices like wheel chair or tri-cycle. In every school either tricycle/wheel chairs were found out side the class room or below the veranda where ramps were steep.
6. 30% schools having two wings had a single ramp in one wing and there was no ramp at all in other wing and which was in accessible for O.I/C.P children having class in that wing. When H.Ms asked they replied that it is due to new admission and we are supposed to change the classes to this accessible wing. It shows least concern of Head of the institute towards CWSNs and about their education.
7. When H.Ms asked about attendance and regularity of CWSNs 60% responded that O.H students are better in their class room performance and are regularly coming to the school where as 40% H.Ms replied that though O.H students are good at study but they don't

SPIJE, Vol.3, No.1, January 13 | 65
come to school regularly because parents belong to BPL group and they leave the home early in the morning to earn their bread and butter. Due to heaviness of wheel chair CWSNs are unable to come to the school independently. They need an escort. Even CWSNs with severe category were not regular to the school.
So, without escort severe category of MR, O.H and CP CWSNs were unable to come to the school.
8. 70% H.Ms responded that assessment of 100% CWSNs done by I.E professionals but 70% children have disability certificate and 30% students possess bus/rail concession. Where as 30% H.Ms replied that 30% students neither have disability certificate nor other services. Though they have already assessed but yet they have not received any disability certificate or hearing aids.
When the reason is asked it was found that either due to negligence of parents or concerned authority and aids and appliances is not provided to CWSNs in time.
District coordinator said that mainly due to short of professionals in ALIMCO they are unable to provide it in time. Sometimes late assessment of children and demand by the district is send late to ALIMCO unable to supply the required aids and appliances in time. 60 % H.Ms replied that 60% parents of severe category of CWSNs are provided with escort allowance.
So, if we want to provide better education for CWSNs first of all we have to take care of preliminary needs like physical access which include school preparedness and assistive technologies in order to provide them access to other support services.
Conclusion
A child with a special need can make use of educational support services only if schools are made barrier free i.e. physically accessible. Therefore, removal of architectural barriers in schools should be undertaken for easy access of children with special needs, especially those with loco-motor problems. Effort should be taken to provide disabled-friendly facilities in schools. Undoubtedly quality is a matter of concern. However; lack of proper input like physical access, imparting quality inclusive education to children with special needs would never be possible because, better process needs a better input.
References
1. Dash.(2007). Professional Development for Effective Inclusive Classroom in Distance Education Programme – Sarva Shiksha Abhiyan (An IGNOU – MHRD, Government of India Project), P-33-41, Retrieved in March 27, http://depssa.ignou.ac.in/wiki/images/4/44/ Effective_Classroom_Processes-CRC-June_27(2).pdf
2. Eleweke, C.J. & Rodda, M. (2002) The challenge of enhancing inclusive education in developing countries. International Journal of Inclusive Education, 6, 2, 113-126, April.
3. Mara Sapon-Shevin (2005) in 'Equity Handbook: Towards an Inclusive Culture: A guide for academic staff and senior managers at the University of Canberra', Prepared by Chambers, B. Heaney, M. S. & Brearley, T., Australian Institute for sustainable communities. Retrieved March 15, 2012 from www.canberra.edu.au/__data/assets/file/0003/.../equity-handbook. rtf, P-30

4. Miles, S. (2000). Enabling Inclusive Education: Challenges and Dilemmas, paper presented at A Symposium on Development Policy entitled “Children with Disabilities and the Convention on the Rights of the Child” Gustav Stresemann Institute, Bonn, Germany, October 27-29, 2000. http://www.eenet.org.uk/theory practice/bonn_2.shtml.
5. NCERT (2000). National curriculum framework for School Education. New Delhi: NCERT
6. Singal, N. (2005a). Responding to difference: Policies to support 'inclusive education' in India, paper presented at the Inclusive and Supportive Education Congress 2005, University of Strathclyde, Glasgow.
7. Singal, N. (2005b). Mapping the field of inclusive education: a review of the Indian literature, International Journal of Inclusive Education, 9, 4, 331-350, October-December.
8. SSA Documents on Progress Overview of Inclusive Education for CWSNs in Ganjam District.(2010-11)
9. UNESCO (1999). Welcoming schools: students with disability in regular classroom. Retrieved from http://unesdoc.unesco.org/images/0011/001184/118455eo.pdf
66 | SPIJE, Vol.3, No.1, January 13

WOMEN EMPOWERMENT IN INDIA: LEGISLATIVE GOALS AND REALITIES
(Amrita Katyayni , Assistant. Professor, Vasanta College for Women, Rajghat, Varanasi, India)
ABSTRACT
The principle of gender equality is enshrined in the Indian constitution-in its Preamble, Fundamental rights and the Directive Principles. The Constitution not only grants equality to women but also empowers states to adopt measures of positive discrimination in favour of women. Government laws, developmental policies, plans and programs have aimed at women's advancement in every sphere. The 73rd and 74th constitutional amendment, 1993 have provided for reservation of seats in the local bodies of panchayats and municipalities for women, which are considered historical in women's participation in decision making at the local level. Despite all these, various reports confirm that women conditions have not improved much in India. Crimes against women continue to increase and they are conferred inferior status in the society. The present paper explores the various legislative measures for attaining women empowerment on one hand and the current status of women as per UN reports on the other hand. The underlying causes for the dilapidated conditions of the women are analyzed. How education can only bring transformation in society perceptions and accomplish women empowerment is highlighted.
Key- words: Empowerment, Education, Legislation.
Introduction
The most common explanation of word 'empowerment' is the ability to exercise full control over one's actions. Women Empowerment refers to increasing the spiritual, political, social and economic strength of women. It involves the empowered developing confidence in their own capacities. It can be perceived as a process where women's awareness, consciousness, choices with life alternatives, resources at their disposal, voice, agency and participation increases. These ultimately enhance women's capabilities and decisions they take individually or collectively for themselves. Thus, we can say women empowerment means the process through which women who are currently discriminated in society achieve gender equity. Empowerment occurs when women achieve increased control and participation in decision making that leads to their better access to resources and improved socio-economic status. Experts opine that there are five levels of women empowerment i.e. welfare, access, conscientisation, mobilization and control. Welfare means an improvement in socio-economic status e.g. nutrition, shelter etc. It is the zero level of women empowerment where women are passive recipients of benefits. Access is considered as the first level of empowerment as women are able to have access to resources and services by their own works .Conscientisation is the second stage where women collectively urge or act to remove discriminatory practices. Women at this level adopt strategies for action to get gender equity. Mobilisation is the action stage of women empowerment and women get connected with wider women's movement and struggle for their own empowerment. Control is the last level of women empowerment where women have taken action so that there is gender equity in decision making, access to resources and women achieve direct control of their life. The concept of Women empowerment was introduced at the International women conference in 1985 at Nairobi. The 4th world conference on women, Beijing in 1995 identified certain qualitative and quantitative indicators of women empowerment (Chandra, R., 2010).which are as follows:
Shaikshik Parisamvad (An International Journal of Education) | 67SPIJE , ISSN 2231 – 2323 (Print), 2231 – 2404 (Online)Vol.3, No.1, January 2013, pp 67 - 72.
© 2013 AAEBHU
Qualitative indicators of women empowerment:
1. Increase in self-esteem, individual and collective confidence
2. Increase in articulation, knowledge and awareness on health, nutrition reproductive rights, law and literacy
3. Increase in personal leisure time and time for child care
4. Increase on decrease of workloads in new programmes
5. Change in roles and responsibility in family and community
6. Visible increase on decrease in violence on women and girls
7. Responses to changes in social customs like child marriage, dowry, discrimination against widows
8. Visible changes in women's participation level attending meeting, participating and demanding participation
9. Increase in bargaining and negotiating power at home and in community
10. Increased access to and ability to gather information
11. Formation of women collectives
12. Positive changes in social attitudes
13. Awareness and recognition of women's economic contribution within and outside the household
14. Women's decision over her work and income
Quantitative indicators of women empowerment:
1. Demographic trends such as maternal mortality rate, fertility rate, sex ratio, life expectancy at birth and average age of marriage
2. Number of women participating in different development programmers
3. Greater access and control over community resources/government schemes -crèche, credit cooperative, non formal education
4. Visible change in physical health status and nutritional level
5. Change in literacy and enrollment levels
6. Participation levels of women in political process.
Women empowerment through legislative measures
The Constitution of India is committed not only towards equality to women but also empowers states to adopt measures of positive discrimination in favour of women. Government laws, developmental policies, plans and programmes have aimed at women's advancement in every sphere. The constitution of India guarantees: to all Indian women equality (Article 14), no discrimination by the State (Article 15(1), equality of opportunity (Article 16), equal pay for equal work (Article 39(d). In addition, it allows special provisions to be made by the State in favour of women and children (Article 15(3)), renounces practices derogatory to the dignity of women (Article 51(A) (e)), and also allows for provisions to be made by the State for securing just and humane conditions of work and for maternity relief (Article 42).
68 | SPIJE, Vol.3, No.1, January 13

Apart from these, there are number of Acts related to women issues: The immoral traffic (Prevention) Act, 1956, The indecent representation of women (Prevention) Act, 1986.,The Dowry prohibition Act, 1987, The prohibition of child marriage Act, 2006, Protection of women from Domestic violence Act, 2005.and National Commission for women, Act, 1990.
India ushered into the new millennium by declaring the year 2001 as the women's empowerment year, 'Swashakti'. The national policy for empowerment of women, 2001 has outlined three policy approaches for achieving the target (Bhardwaj, S.K. , Rani, S. ,2011):
1. Judicial /Legal empowerment-by making the legal system more responsive and gender sensitive for women's needs.
2. Economic empowerment- by mainstreaming gender perspectives in the development process, enhancing women's capacities and access to economic opportunities.
3. Social empowerment by adopting programmes for education, health and nutrition of women.
In accordance with these policy approaches, a number of women empowerment programmes and schemes are run by the Government such as STEP, 1987- to support training and employment programs for women; Swayamsudha- Integrated scheme, 2001 for empowerment of women; Swadhan ,2001- to provide holistic and integrated services to women in difficult circumstances; Ujjawala 2007- for prevention of trafficking of women; .National Mission for Empowerment of women,2010- to empower women socially, economically and educationally; Dhalaxmi- 2008 for development of girl child; Nutrition Programmes for adolescent girls (NPAG-2005) for improving the health of adolescent girls.
Gender budgeting has been adopted as a powerful tool for gender mainstreaming and ensuring that benefits of development reach to women as much as men. 73rd and 74th Constitutional amendments 1993 were historical in women empowerment perspective as it provided for 33% reservation for women in the local governance. However, this has been further increased to50%.
The current status of Indian women as per various reports
The various beneficiary measures have helped women to attain their due respect and place in the society or not is the grave question that looms over us. The incessant incidences of violence and crime against women reveal a sad picture. As per reports of the United Nations Resident Co-ordinator in India(Menon-Sen and Shivakumar, 2001) titled' Women in India: How Free? How Equal?', several disturbing issues concerning the current status of women in India is raised .Data from the Human development report,2001 and the Census of India 2001 ,too reveals that Indian women continue to be excluded in the society and remain as second grade citizens in almost every sphere. It will not be exaggeration to say that there exists a wide gap between the goals and the real status. Some of the threatening disclosures regarding the status of women are as follows:
•The continuously declining female ratio (from 946 in 1951 to 933 in 2001 census) is the strongest evidence of gender discrimination. It indicates female infanticides and sex selective abortions are rampant.
•Reports reveal that in most Indian families, women do not own any property in their own names and do not get share in parental property.
•Crimes against women have increased as per police records. Police records for the country as a whole show that a woman is molested every 26 minutes. A rape occurs every 34 minutes. Every
SPIJE, Vol.3, No.1, January 13 | 69
42 minutes, an incident of sexual harassment takes place. A woman is kidnapped every 43 minutes. And every 93 minutes, a woman is killed.
•Dowry deaths continue unabated; as per reports at least 5,000 women die each year because of dowry deaths, and at least half a dozen die each day in kitchen fires- thought to be intentional.
•According to UNICEF-State of world's children -2009 reports, 47% of Indian girls are married below age of 18. The report also show 40% of world's child marriages occur in India
•Trafficking of young girls and women continue flourishing and they are forced into prostitution.
•The girls and women continue to face nutritional discrimination within the families. In 1998 – 1999, only 48 percent of married women in the reproductive age group used any form of contraception (World P o p u l a t i o n Monitoring, 2000). This figure is much lower(30%) in poorer states like Uttar Pradesh and
Bihar._ For many women, abortion is the only method of contraception available.
• More than 570 women die per 100,000births (World Population Monitoring,
2000), 70 percent of these deaths are due to totally avoidable reasons.
•Women are under-represented in governance and decision-making positions.
• Most women do not have any autonomy in decision making in their personal lives.
•Less than 50 percent of women have access to money in the household.
•Women face violence inside and outside their family, as well as at the workplace.
•The maternal mortality in India is second highest in the world and 88% of pregnant women suffer from anemia (UNDP, Human Development Report).
The underlying causes for the poor achievement of the goals
There is no doubt that despite all the good intentions, women's plight have not improved whereas it has further deteriorated in some spheres. Leaving a meager number of urban and semi-urban women, vast number of Indian women is still crying for social justice. The discrepancy in the ideology and practice of the empowerment policy of women in India is very well revealed. The 73rd and 74th Amendments of the Constitution guaranteeing women's political participation are being boasted by the government as the landmark in women's empowerment but the universal occurrence of proxy and dummy women candidates in local panchayat elections is the common phenomena today and it reflects the real scenario of women empowerment. The money and muscle associated with the electoral process inhibits women from joining politics on their own. Restriction on mobility, lack of control over resources and low literacy rates are the major obstacles. A women needs to be healthy to meet the challenges of empowerment, but Indian women lack even in basic health resources and are at the risk of unwanted, early pregnancies and severe malnutrition. The majority of women are engaged in agricultural sector, which has been worst affected in recent years thereby making them more vulnerable. There is severe lack of basic infrastructure facilities in villages and cities. Access of safe drinking water, sanitation and cooking fuel has direct impact on the lives of women which are in worst conditions in rural areas. A woman has to walk miles for getting one bucket of water. Dilapidated transport facilities further aggravate their living conditions. Economic policies lack gender perspectives and fail to enhance their social and economic position.
70 | SPIJE, Vol.3, No.1, January 13

Empowerment would become only relevant when women are self reliant, confidant, educated and can take rational decisions. Women's empowerment has to be seen in holistic perspective i.e. in all areas such as political, socio-cultural, religious, political, legal and economic spheres. The underlying causes of women discrimination are deeply rooted in the patriarchal and gender stereotyped social, economic structure of our country. Prevalence of cultural attitudes and practices that promote the low value and disrespect of girls are the major hurdles. Economic disparities are also acute because much of the unpaid work within families and communities are done by women. Women's disproportionately higher share of domestic responsibilities further restrains their opportunities for development. It is thus important to bring changes in societal attitudes and perceptions with regard to the role of women in different spheres of life. Vast adjustments have to be made in traditional gender specific work allotment in the society. The current education fabricated on western materialistic ideals has failed to address the fundamental issues of equity, justice, dignity and the practices of sustainability. It has moreover created situations of exploitations, unrest, absence of sensitivity and empathy. The modern consumerist society portrays women as commodity and has done irrepressible damage to their image.
Education as a means for women empowerment
It is rightly been pointed by social reformers that education is the strongest positive interventionist for women upliftment. It is a significant instrument for changing women's subjugated position in the society. There are numerous studies demonstrating a positive link between education and a variety of demographic indicators such as fertility, infant and child mortality and morbidity ( Veikoff, V. A. ,1998) Education has to play a decisive role in making women self reliant and increasing their autonomy so that they can take part in the decision making both at home and in public places. They have to be educated, in true sense which shall enable them to respond to the challenges of the society and they are able to confront with their traditional roles. Education benefits a woman in life-altering ways. An educated woman gains higher status and an enhanced sense of efficacy. She also has greater bargaining power in the household, tends to desire a smaller family size and seeks the necessary health care for themselves and their children. She has high educational and career expectations of her children, both boys and girls. Education profoundly changes the way they interact with society, and positively affects their economic status. Thus we can say educating women creates more equitable lives for women and their families and increases their ability to participate in community decision making. It enhances their self-respect and dignity. It even gives platform for the women to raise their voices.
Vast reforms are needed in our current education system at the primary, secondary and at the higher education levels. Education programme needs to address gender sensitization. Positive self-image of the girl child has to be build and large scale efforts to conscientise and mobilize women on gender issues is required. In other words, our education needs to incorporate gender perspectives through measures such as:
•Inclusion of topics in the curriculum related to understanding gender and the unequal
discriminative conditions and position of women.
•Sensitization and equipping teachers to address gender issues in the classroom.
Gender mainstreaming has been proposed at the Fourth World Conference on women. Capacity
building for gender mainstreaming has to be done through education. This can be
accomplished through three successive stages:
a. Capacity building for women –by developing in them confidence of their capacities in
SPIJE, Vol.3, No.1, January 13 | 71

non-traditional areas like leadership, governance and in empowerment.
b. Capacity building for men, mainly aims to change men's gender attitudes, eliminate gender-based violence, enhance men's capacities in sustainable roles and relationships with women.
c. Social capacity building is about gender stereotypes, discriminatory behaviour, attitudes and practices in the society. The third area deals with developing gender analyses in all realms of society where differences between women's and men's access to resources, benefits and control over participation and decision-making, exist.
Thus, the process of women empowerment can only be gradually accomplished through educational reconstruction of the social, economic and political fabric of the country. The current education has to integrate the issues of sustainability, morality and equality perspectives in order to change the prevalent biases and perceptions regarding women.
Conclusion
Women empowerment can not be achieved only through a few legislative measures and legal provisions. Political empowerment holds little meaning unless social and economic restructuring in favour of women is done. A long term vision is required to remove the obstacles in the path of women's empowerment. The deep rooted gender discrimination in the society can only be removed through right education, awareness, gender sensitization and gender mainstreaming. It is being rightly quoted that women's education is the key of keys to bring about revolution in women empowerment (Basu, A., 2010). Efforts should be directed towards all round development of each and every section of women through proper economic, social and educational endeavours.
References
1. Basu, A. (2010). A century and a half's journey: women's education in India, 1850s to 2000. In B. Ray, (Eds.), Women of India: Colonial and post colonial periods. Sage Publications, New Delhi. pp 183-207.
2. Bharadwaj, S. K. and Rani, S.(2011). Empowerment of women through education, University News, New Delhi.
3. Chandra, R. (2010).Women empowerment in India: milestones and challenges. Retrieved from www.empower.org/downloads/women%20 empowerment.pdf retrieved on 23-12-2011.
4. en.wikipedia.org/wiki/women _in_india retrieved on 26-12-2011.
5. Menon, Kalyani Sen, and Shiva A.K.(2001): Women India- How free? How equal. UN. Retrieved from http://www.un.org.in retrieved on 12-2-2012.
6. Srivastava, D. et.al. (Eds.) (2010). India 2011. Publications Division. New Delhi.
7. http//www.unodc.org/pdf/india/publications/women_book 6-5-03/09_status of women in India.pdf retrieved on 22-2-2012.
8. Veikoff, V. A. (1998). Women of the world: Women's education in India.US Department of commerce. http://www.census.gov/ipc/prod/wid-9801.pdf retrieved on 2011-12-23.
.
72 | SPIJE, Vol.3, No.1, January 13

A COMPARATIVE STUDY OF ADJUSTMENT OF VISUALLY IMPAIRED AND SIGHTED ADOLESCENTS
( S.N. Pandey, Associate Professor, Department, of Teacher Education K.N. Government. P.G.College Gyanpur, Sant
Ravidas Nagar, U.P., Rajesh Kumar Pandey, Teacher Educator, DIET, Gyanpur, Sant Ravidas Nagar U.P., India)
ABSTRACT
This paper is related to the comparative study of adjustment of visually impaired (VI) and sighted adolescents. The sample has been taken from schools in Varanasi. The study reveals that Sighted adolescents were found to be better adjusted than that of visually impaired adolescents. VI adolescents in integrated settings are found to be better adjusted in compare to those in special setting. Sighted adolescents were found to be more adjusted than those of the VI adolescents in special setting. Sighted and VI adolescents in integrated settings were found to be similar in respect of their adjustment. The paper includes the details related to this study.
Key-words: Adjustment, Visually Impaired Students
Introduction
Visual impairment is a medical phenomenon. It relates to impaired sense of vision loss. Usually vision is the most actively used by man and hence, his knowledge grows mainly form his visual experiences. Blindness limits perception and cognition in three ways, ie (i) in the range and variety of experiences, (ii) in the ability to get about, (iii) in the control of environment and the self relation to it. These limitation delays developmental stage characteristics compared to that of sighted counterparts.
Adolescence is the period of transition from childhood to adulthood. It extends from 12 years to the 19 or 20 years of age. The term 'adolescence' is derived from Latin word which means "to grow to maturity'. Thus, it is a process rather than a period, a process of achieving the attitude and believes needed for effective participation in society (Roger 1981). It has been regarded as a period of rapid change, both biologically and psychologically. Although adolescents may face period of uncertainty, loneliness, self-doubt, anxiety, joy and feeling of competence as they overcome the developmental challenges. A sensory deprivation limits the world of experiences. It deprives the organism of some material resources from which the mind develops. When one type of sensation is lacking, it alters the integration and functions of all others. It is therefore, essential to understand the special needs of visually handicapped adolescents. Success in working with such persons depends upon understanding their special needs.
When a man deviates from the normalcy he tries to adjust himself to the extent of deviation. If the deviation from physical and social norm is extensive and vital a total reorganization of life-pattern is indicated. Visual disability creates a situation in which both physical and social demands necessitate such total reorganization on the part of the handicapped person. Reorganization is a form of response to demand to adjust which, in turn, is response to a reality situation. Its purpose is to secure optional conditions for living. But this task is particularly hard to achieve because of severe reactions due to the loss of vision which is regarded as the most important and vital organ for living.
Blindness always produce shock it affects the parents and the family members, and the individual who is afflicted with it. The absorption of shock, both physical and emotional is prerequisite to adjustment to disability. Blindness may produce denial or depression in the individual
Shaikshik Parisamvad (An International Journal of Education) | 73SPIJE , ISSN 2231 – 2323 (Print), 2231 – 2404 (Online)Vol.3, No.1, January 2013, pp 73 - 76.
© 2013 AAEBHU

or the parents. It has been seen, those who show mainly denial tend to be "excessively disabled", in contrast to those who manifest depression and more adequate later adjustment.
There have been some studies regarding the adjustment of visually impaired and sighted adolescents Sharma (1998) reported that visually impaired students of secondary schools were found to be more frustrated than sighted ones. Sujata Bhan (2005) found significant difference in self-concept of sighted peers and visually young adult. Rai (1992) reported that generally blind adolescents are emotionally unstable, frequently unhappy react emotionally to trivial situations. They may lose their temper easily and. frequently, be moody or irritable: they often appear tense or anxious and weep under stress. In new situations, they may be either fearful and timid or overtly aggressive. The studies based on socio-economic status and adjustment reflected that there is significant positive correlation between emotional adjustment and socio economic status. Higher the socio-economic (SES) better the adjustment. Similarly, significant and positive correlation were also found between emotional adjustment and interaction of the blind subjects with the sighted and also between emotional adjustment and acceptance of blindness. It can, therefore, be concluded that emotional instability may occur as a consequence of blindness, but it may also need not necessarily occur as a result of blindness. Bhargava (1981) reported that VI individuals experience the problem in social adaption but they are not uniformly deficient.
Visually impaired having similar needs as sighted adolescents. They continuously interact to their surrounding to satisfy their needs, it may be home, school, peer group and their own emotion. Visually impaired having limited experience and opportunity posed serious problem to adjust. Thus, for proper adjustment of visually impaired adolescence, it is essential for parents, teachers, peer groups have positive attitude which in turn develop positive self concept and positive attitude .This can be achieved only though proper attitude and awareness regarding visually impaired young adult towards society and vice versa. Adjustment is essential for rehabilitation. The present study is an humble endeavor in this respect.
Objectives of the study—
The objectives of the study comprises flowingly—
1- To compare the adjustment of sighted and VI adolescents.
2- To compare the adjustment of VI adolescents in special and integrated settings.
3- To compare the adjustment of sighted and VI adolescents in special settings.
4- To compare the adjustment of sighted and VI adolescents in integrated settings.
Hypotheses—H — There is no significant difference in adjustment of sighted and VI adolescents. 01
H —There is no significant difference in adjustment of VI adolescents in special and integrated 02
settings.H —There is no significant difference in adjustment of sighted and VI adolescents in special 03
setting. H —There is no significant difference in adjustment of sighted and VI adolescents in integrated 04
setting.
Methodology—
Sample—It is survey type of research comprising 100 randomly selected adolescents in all including 30 VI adolescents in special setting, 30 VI adolescents in integrated setting, and 40 sighted adolescents form three schools of Varanasi district. A self made adolescents adjustment scale has been used in the present study. It consists of 30 items having 10 items each related to home, school
74 | SPIJE, Vol.3, No.1, January 13

and personal areas respectively. Data was analyzed by using statistical techniques as mean standard deviation (SD) and t- test.
Results and Discussion—
The results and their respective discussions are given below in a tabular for—
Table-1Mean, SD and value for the Adjustment of Sighted and VI Adolescents
* Significant at .05 level
Table 1 shows that t- value of 5.60 is Significant at .05 level. Thus, the null hypothesis that there is no significant difference in adjustment of VI and sighted adolescents is rejected. It means there is significant difference between adjustment of VI and sighted adolescents. Such result may be due to the reason that the sighted adolescents have greater exposure than that of the VI ones. This Result is in consonance with the finding of Sharma (1998) and Rai (1992)
Table-2Mean, SD and value for the adjustment of VI Adolescents in Special and Integrated Settings
* Significant at .05 level
Table 2 shows that t- value of 11.77 is Significant at .05 level. Thus, the null hypothesis that there is no significant difference in adjustment of VI adolescents in special and integrated settings is rejected. It means there exists a significant difference between adjustment of VI adolescents in special and integrated settings. Probable reason for this result may be due to the integrated set-up having varieties of exposure compared to that of special setup which, in turn, provide better social and personal interaction. These healthy inter-personal and intra-personal experiences boost up their morale fetching good result in terms of proper adjustment either at home, school or a personal area.
Table-3Mean, SD and value for the Adjustment of Sighted and VI Adolescents in Special Setting.
* Significant at .05 level
S. N. Adolescents N Mean SD t- value
1 Sighted 411 65.55 5.15 5.60*
2 VI 60 58.86 6.76
S. N. Settings N Mean SD t-value
1 Integrated 30 64.55 4.20
2 Special 30 53.10 3.25
11.77*
S. N. Adolescents N Mean SD t- value
1 Sighted 40 65.55 5.15
2 Special 30 53.10 3.25
13.45*
SPIJE, Vol.3, No.1, January 13 | 75
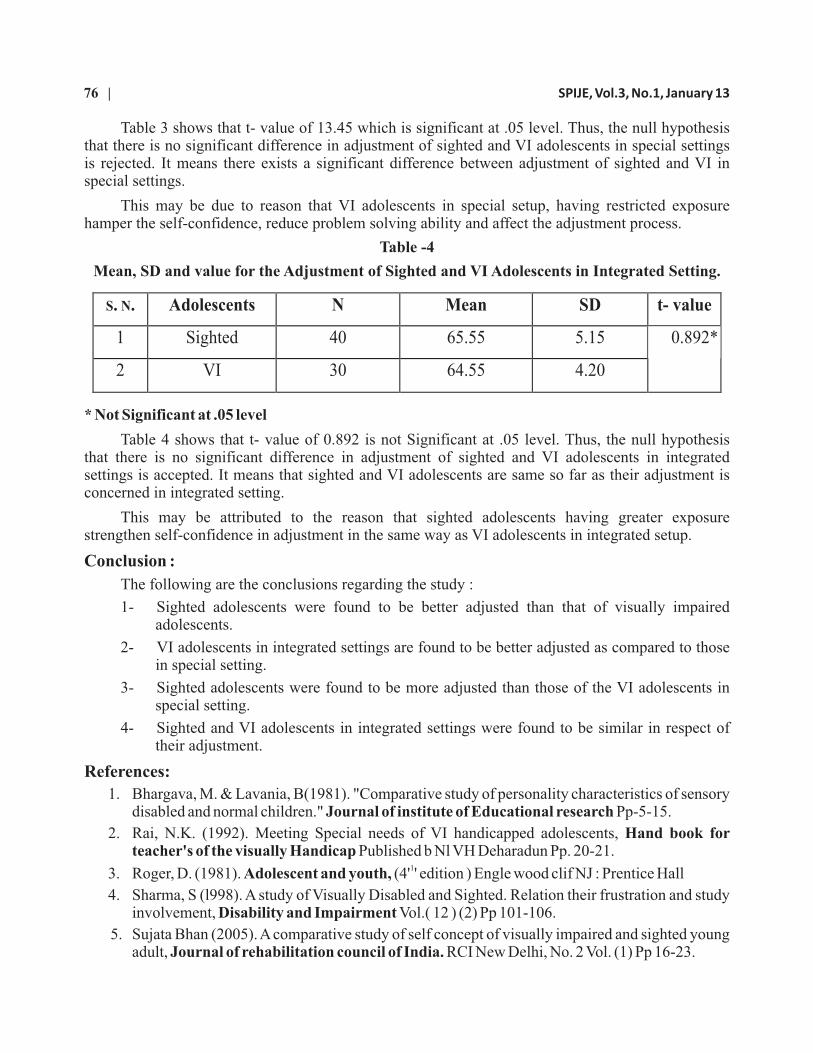
Table 3 shows that t- value of 13.45 which is significant at .05 level. Thus, the null hypothesis that there is no significant difference in adjustment of sighted and VI adolescents in special settings is rejected. It means there exists a significant difference between adjustment of sighted and VI in special settings.
This may be due to reason that VI adolescents in special setup, having restricted exposure hamper the self-confidence, reduce problem solving ability and affect the adjustment process.
Table -4
Mean, SD and value for the Adjustment of Sighted and VI Adolescents in Integrated Setting.
* Not Significant at .05 level
Table 4 shows that t- value of 0.892 is not Significant at .05 level. Thus, the null hypothesis that there is no significant difference in adjustment of sighted and VI adolescents in integrated settings is accepted. It means that sighted and VI adolescents are same so far as their adjustment is concerned in integrated setting.
This may be attributed to the reason that sighted adolescents having greater exposure strengthen self-confidence in adjustment in the same way as VI adolescents in integrated setup.
Conclusion :
The following are the conclusions regarding the study :
1- Sighted adolescents were found to be better adjusted than that of visually impaired adolescents.
2- VI adolescents in integrated settings are found to be better adjusted as compared to those in special setting.
3- Sighted adolescents were found to be more adjusted than those of the VI adolescents in special setting.
4- Sighted and VI adolescents in integrated settings were found to be similar in respect of their adjustment.
References:
1. Bhargava, M. & Lavania, B(1981). "Comparative study of personality characteristics of sensory disabled and normal children." Journal of institute of Educational research Pp-5-15.
2. Rai, N.K. (1992). Meeting Special needs of VI handicapped adolescents, Hand book for teacher's of the visually Handicap Published b Nl VH Deharadun Pp. 20-21.
13. Roger, D. (1981). Adolescent and youth, (4' ' edition ) Engle wood clif NJ : Prentice Hall
4. Sharma, S (l998). A study of Visually Disabled and Sighted. Relation their frustration and study involvement, Disability and Impairment Vol.( 12 ) (2) Pp 101-106.
5. Sujata Bhan (2005). A comparative study of self concept of visually impaired and sighted young adult, Journal of rehabilitation council of India. RCI New Delhi, No. 2 Vol. (1) Pp 16-23.
S. N. Adolescents N Mean SD t- value
1 Sighted 40 65.55 5.15
2 VI 30 64.55 4.20
0.892*
76 | SPIJE, Vol.3, No.1, January 13

fo|kfFkZ;ksa dh vfHk:fp ij cgqvk;keh 'kSf{kd mikxeksa dk izHkko % ,d v/;;u¼euh"kk dkS'kys'k] lgk;d izk/;kid] f”k{kk foHkkx] MkW- lh-oh- jkeu~ fo”ofo|ky;]
dksVk] ftyk& fcykliqj ¼N-x-½] fu'kh HkkEcjh]izk/;kid] “kkldh; f”k{kk egkfo|ky;] fcykliqj ¼N-x-½, Hkkjr ½
ABSTRACT
In this study the researcher has studied about the effect of Multimedia on the interest of Higher Secondary students. The researcher selected 100 students by random sampling method from the Schools of Urban and Rural areas of Ambikapur District. Researcher used Adolescent Interest Test and Self-made Questionnaire for this study. The findings of this study revealed that the multimedia effects the imagination as well as creativity of the students. The effect of multimedia is very positive. The study also reveals that it also increases the talent in the creativity of the students which is very important for their overall development.
Key-words:Impact, Multimedia Educational Approaches, Interest.
f”k{kk dk eq[; mn~ns'; O;ogkj esa ifjorZu ykuk gS] ftldk ifj.kke vf/kxe miyfC/k gSA f'k{kk ls vfHkizk; mu lHkh lk/kuksa rFkk izfØ;kvksa ds dqy ;ksx ls gS] tks O;fDr ;ksX;rk] {kerk] vfHko`fRr rFkk ldkjkRed ewY;ksa vkSj muds O;ogkjksa ls mls ml lekt ds vuqdwy cukrh gS] ftlesa og jgrk gSA f'k{kk dks ,slk izHkko dgk x;k gS tks O;fDr ds fopkj] O;ogkj] LoHkko vkfn esa LFkkbZ ifjorZu ykrk gSA ge tks vkt vius nSfud thou vkSj O;olk; fd nqfu;k¡ dks cM+s gh lqfo/kktud vkSj izxfriw.kZ <ax ls th jgs gSa mlds ihNs rduhdh {ks= esa gks jgs cgqvk;keh izxfr vkSj fodkl dk cgqr cM+k gkFk gSA vkt gekjs thou dk dksbZ Hkh {ks= vkSj dksuk ,slk ugha gS tgk¡ rduhdh Kku vkSj dkS'ky ds mi;ksx dk vkuan gekjs }kjk ugha mBk;k tk jgk fQj f'k{kk blls vNwrh dSls jg ldrh gSA f'k{kk izfØ;k vkSj mlds ifj.kkeksa ds lHkh rjg ds fu;kstu fØ;kUo;u vkSj izca/ku esa vkt rduhdh viuk cgqewY; ;ksxnku ns jgh gSA ,slk lc dqN djus esa gkMZos;j rFkk lkW¶Vos;j] fizaV fefM;k rFkk ukWu fizaV fefM;k ds :i esa miyC/k oSKkfud rFkk rduhdh Kku vkSj fl)karksa us gh viuk peRdkj fn[kk;k gSA blh ds lgkjs vkt ge f'k{kk vf/kxe izfØ;k dks bl rjg fu;ksftr] fØ;kfUor ,oa izfrcaf/kr djus esa l{ke fl) gks ldrs gSa fd de ls de le; esa de ls de 'kfDr vkSj lk/kuksa dk mi;ksx djrs gq;s vPNs ls vPNs vkSj csgrj ls csgrj f'k{k.k vf/kxe ifj.kkeksa dh izkfIr laHko gks ldsA
f”k{kk dks ,slk izHkko dgk x;k gS] tks O;fDr ds fopkj] O;ogkj] LoHkko vkfn esa LFkkbZ ifjorZu ykrk gSA f”k{k.k ds fy;s oSKkfud fof/k dk iz;ksx fu"d"kksZa rd igqapus ds fy;s vfr izkphudky ls fd;k tk jgk gS] ftldk ifj.kke ;g gqvk gS fd orZeku ;qx foKku dk ;qx cu x;k gSA f”k{kk izfØ;k dk mn~ns”; ckyd ds O;ogkj esa okaNuh; ifjorZu djds mldk lokZaxh.k vFkkZr~ “kkjhfjd] ekufld vkSj vk/;kfRed fodkl djuk gS rkfd og vius ifjokj vkSj lekt dk dY;k.kdkjh lnL; cu lds vkSj thou ds mRrjnkf;Roksa dks ;ksX;rk ,oa dq”kyrk ls fuHkk ldsA
gsCVsefjvu ¼2010½ ds vuqlkj vusd eYVhfefM;k izksxzke bl izdkj ds gSa fd cPps Lo;a viuh le> ls eYVhfefM;k dk mi;ksx dj izkIr lwpukvksa dh foospuk dj ldrs FksA vf/kxe izfØ;k vf/kd izHkko'kkyh gqbZA Jhfeolu ,.M eqBqeuhde ¼2010½ us fu"d"kZ izkIr fd;k fd dEI;wVj vflLVsM bUlVªD'kuy dk;ZØe (CAIP) ds }kjk i<+us ls cPpksa dh miyfC/k esa o`f) gqbZ gSA CAIP ds ek/;e ls v/;;u djus ls cPpksa esa
Shaikshik Parisamvad (An International Journal of Education) | 77SPIJE , ISSN 2231 – 2323 (Print), 2231 – 2404 (Online)Vol.3, No.1, January 2013, pp 77 - 84.
© 2013 AAEBHU

:fp ikbZ xbZA cPpksa us bl dk;ZØe dk vkuan fy;kA dikfM+;k ¼1992½ ds vuqlkj 77 izfr'kr Nk=ksa us dgk fd Vsyhfotu dk ek/;e Lo f'k{k.k dks izksRlkfgr djrk gSA gkysZ ,.M gsxuk ¼1955½ us ik;k fd :fp;ksa dk fu/kkZj.k vfHk{kerk ls gksdj O;fDrRo fodkl ls gksrk gSA LVªkax ¼1943½ ds vuqlkj :fp;ksa ds fu/kkZj.k esa vfHk{kerk] ;ksX;rk] iqjLdkj rFkk lUrqf"V vkfn dh egRoiw.kZ Hkwfedk gksrh gSA jkftd ,.M tdkfj;k ¼1995½ ds vuqlkj fd'kksjksa dh vfHk:fp mudh vk;q] fyax ,oa ,l-bZ-,l- ds vk/kkj ij cnyrh gSA vf/kd ,l-bZ-,l- okys fo|kFkhZ lkekftd xfrfof/k;ksa ,oa laxhr esa vf/kd vfHk:fp j[krs Fks] tcfd e/; ,l-bZ-,l- fo|kFkhZ fuf"Ø; jgrs FksA rksMl ¼2008½ us dyk ,oa foKku lewg ds fo|kFkhZ esa dEI;wVj ,oa bUVjusV ds Kku esa lkFkZd varj ik;kA vuqjk/kk ¼1991½ ds vuqlkj cPps Vh-oh- dk;ZØe esa [ksy dk;ZØe ns[kus esa :fp j[krs gSaA johUnzukFk ¼1992½ us fu"d"kZ izkIr fd;k cgqek/;e dk v/;;u esa iz;ksx djus ls oSKkfud vfHko`fRr] foKku fo"k; ds izfr :fp mPp gqbZA
mDr v/;;uksa ds fu"d"kksZa esa eYVhfefM;k dh izHkko'khyrk ds ifj.kkeksa esa fHkUurk ikbZ xbZA vr% dqN 'kks/k iz'uksa dks gy djus gsrq ;g v/;;u lkFkZd gksxkA
fdlh Hkh dk;Z dks lEiUu djus esa vkSj mlds izkjaHk djus esa leL;k mRiUu gksuk LokHkkfod gSA ;g ,d LoHkkfod lh izfØ;k gSA fdUrq dk;Z djus ls igys leL;k dk p;u djuk dfBu dk;Z gSA leL;k ,slh gksuh pkfg;s ftldh ckyd ds O;fDrRo ds fodkl esa dqN mi;ksfxrk ,oa vko';drk gksA
vfHk:fp dk okLrfod mn~ns'; dsoy fo"k; ds izfr vkd"kZ.k u gksdj okafNr fn'kk esa O;ogkj esa lq/kkj ykuk gSA ;gh O;ogkj vkxs pydj vfHk:fp dk :i xzg.k djrk gS vkSj cgqvk;keh 'kSf{kd mikxe ds }kjk f'k{k.k leku gksus ij Hkh ckydksa ds :fp dk ifj.kke fHkUu&fHkUu gksrk gSA ;gh dkj.k gS fd cgqvk;keh 'kSf{kd mikxeksa ds }kjk f'k{k.k izfØ;k esa fo|kfFkZ;ksa dh :fp;ksa esa fHkUurk gksxhA fo|kFkhZ ftu dk;ksZa vkSj [ksyksa esa vf/kd :fp j[krs gSa os mudks djus vkSj lh[kus ds fy;s vf/kd iz;kl djrs gSaA okLrfod :fp;k¡ ckyd ds thou esa vf/kd LFkk;h gksrh gSaA vr% cgqvk;keh 'kSf{kd mikxe ds }kjk f'k{k.k esa fo|kfFkZ;ksa dh dSlh :fp;k¡ gSa vkSj fdruh ek=k esa gSa rFkk mPprj ek/;fed Lrj ds Nk=&Nk=k;sa fdl gn rd izHkkfor gSaA blh dh tkudkjh ds fy;s bl 'kh"kZd dk v/;;u fd;kA
orZeku essa f”k{kk dsoy lS)kafrd Kku rd gh lhfer ugha gS] oju~ f”k{kk esas dbZ eYVhfefM;k mikxeksa dk iz;ksx c<+rk tk jgk gS ;k ;wa dgsa fd f”k{kk dk izR;sd {ks= fnu izfrfnu O;ogkfjd gksrk tk jgk gS rFkk f”k{kk ds {ks= esa fofHkUu cgqek/;eksa ds iz;ksxksa ij tksj fn;k tk jgk gS] ,slh fLFkfr esa vfr vko”;d gS fd orZeku esa fo|kFkhZ dsoy iqLrdh; Kku rd lhfer u jgs oju~ f”k{kk ds {ks= esa cgqek/;eksa ds iz;ksx ,oa egRo dks tkus ,oa le>s ;g vfr vko”;d gS rFkk blds izfr ,d Lo:i ,oa ldkjkRed lksp dk fodkl djsa rFkk vius vkus okyh ih<+h dks Hkh ,d ldkjkRed lksp iznku djsaA vr% ifjofrZr ifjos”k esa f”k{kk ds {ks= esa tks ifjorZu gks jgs gSa muds izfr Nk=ksa dh cgqvk;keh “kSf{kd mikxeksa dh izHkko”khyrk dk v/;;u djuk vko”;d gksxkA D;k Nk=ksa dh vfHk:fp] lek;kstu Lrj ,oa oSKkfud vfHko`fRr dks cgqvk;keh “kSf{kd mikxe izHkkfor djrk gS\ D;k mudh miyfC/k O;fDrxr gksxh\ vkfn iz”uksa dk mRrj izkIr djus esa v/;;u lkFkZd gksxkA
f”k{kk ds fxjrs Lrj ds dbZ dkj.kksa esa ls eq[; dkj.k ;g gS fd Nk=ksa dh cgqvk;keh “kSf{kd mikxe ds izfr izHkko”khyrk esa vkus okyk ifjorZu tks izR;{k] vizR;{k nksuks gh :i esa f”k{kk dks izHkkfor djrs gSaA fo"k; ds blh xaHkhj eqn~ns dks n`f"Vxr j[krs gq;s p;fur leL;k dh viuh vko”;drk o mi;ksfxrk gSA
v/;;u dk mn~ns'; :
1- fo|kfFkZ;ksa dh vfHk:fp ,oa cgqvk;keh “kSf{kd mikxeksa ds e/; lg&lEcU/k Kkr djukA
2- Nk= ,oa Nk=kvksa dh vfHk:fp ij cgqvk;keh “kSf{kd mikxeksa ds e/; lg&lEcU/k Kkr djukA
78 | SPIJE, Vol.3, No.1, January 13
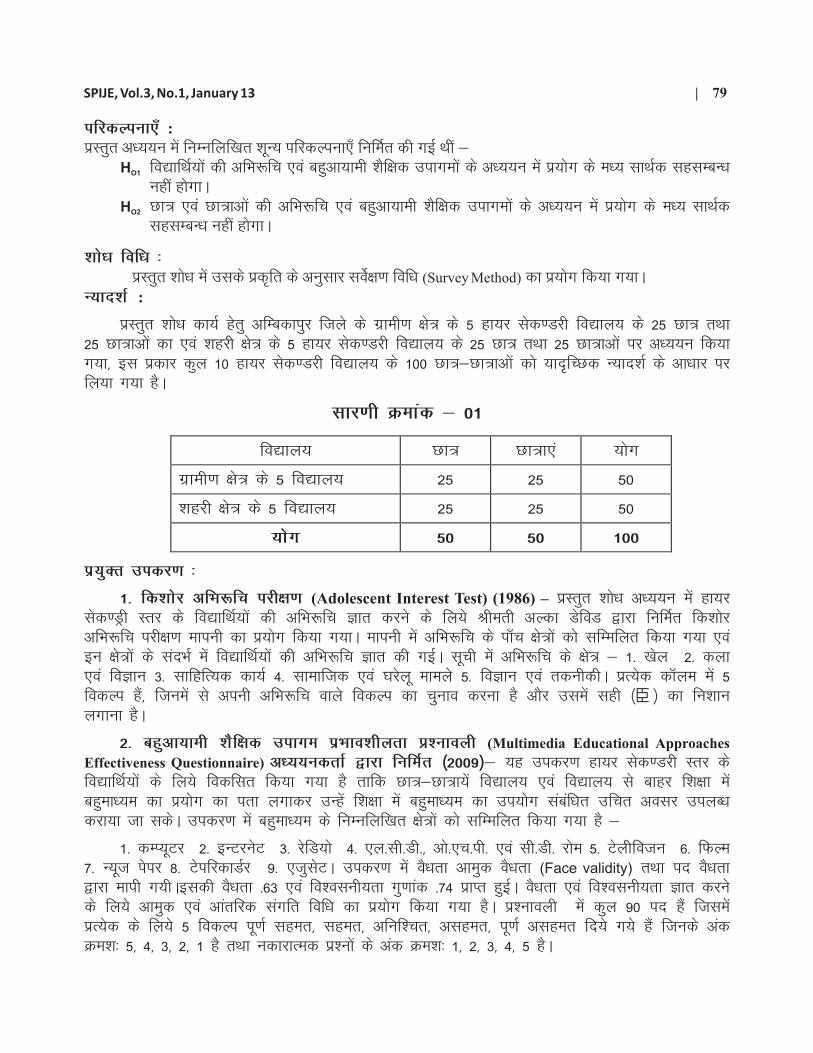
ifjdYiuk,¡ :izLrqr v/;;u esa fuEufyf[kr “kwU; ifjdYiuk,¡ fufeZr dh xbZ Fkha &
H fo|kfFkZ;ksa dh vfHk:fp ,oa cgqvk;keh “kSf{kd mikxeksa ds v/;;u esa iz;ksx ds e/; lkFkZd lglEcU/k O1
ugha gksxkAH Nk= ,oa Nk=kvksa dh vfHk:fp ,oa cgqvk;keh “kSf{kd mikxeksa ds v/;;u esa iz;ksx ds e/; lkFkZd O2
lglEcU/k ugha gksxkA
'kks/k fof/k % izLrqr 'kks/k esa mlds izd`fr ds vuqlkj losZ{k.k fof/k (Survey Method) dk iz;ksx fd;k x;kA
U;kn'kZ :
izLrqr “kks/k dk;Z gsrq vfEcdkiqj ftys ds xzkeh.k {ks= ds 5 gk;j lsd.Mjh fo|ky; ds 25 Nk= rFkk 25 Nk=kvksa dk ,oa “kgjh {ks= ds 5 gk;j lsd.Mjh fo|ky; ds 25 Nk= rFkk 25 Nk=kvksa ij v/;;u fd;k x;k] bl izdkj dqy 10 gk;j lsd.Mjh fo|ky; ds 100 Nk=&Nk=kvksa dks ;kn`fPNd U;kn”kZ ds vk/kkj ij fy;k x;k gSA
lkj.kh Øekad & 01
iz;qDr midj.k %
1- fd'kksj vfHk:fp ijh{k.k (Adolescent Interest Test) (1986) – izLrqr 'kks/k v/;;u esa gk;j lsd.Mªh Lrj ds fo|kfFkZ;ksa dh vfHk:fp Kkr djus ds fy;s Jherh vYdk MsfoM }kjk fufeZr fd'kksj vfHk:fp ijh{k.k ekiuh dk iz;ksx fd;k x;kA ekiuh esa vfHk:fp ds ik¡p {ks=ksa dks lfEefyr fd;k x;k ,oa bu {ks=ksa ds lanHkZ esa fo|kfFkZ;ksa dh vfHk:fp Kkr dh xbZA lwph esa vfHk:fp ds {ks= & 1- [ksy 2- dyk ,oa foKku 3- lkfgfR;d dk;Z 4- lkekftd ,oa ?kjsyw ekeys 5- foKku ,oa rduhdhA izR;sd dkWye esa 5 fodYi gSa] ftuesa ls viuh vfHk:fp okys fodYi dk pquko djuk gS vkSj mlesa lgh ¼√ ½ dk fu”kku yxkuk gSA
2- cgqvk;keh 'kSf{kd mikxe izHkko'khyrk Á'ukoyh (Multimedia Educational Approaches
Effectiveness Questionnaire) v/;;udrkZ }kjk fufeZr ¼2009½& ;g midj.k gk;j lsd.Mjh Lrj ds fo|kfFkZ;ksa ds fy;s fodflr fd;k x;k gS rkfd Nk=&Nk=k;sa fo|ky; ,oa fo|ky; ls ckgj f'k{kk esa cgqek/;e dk iz;ksx dk irk yxkdj mUgsa f'k{kk esa cgqek/;e dk mi;ksx lacaf/kr mfpr volj miyC/k djk;k tk ldsA midj.k esa cgqek/;e ds fuEufyf[kr {ks=ksa dks lfEefyr fd;k x;k gS &
1- dEI;wVj 2- bUVjusV 3- jsfM;ks 4- ,y-lh-Mh-] vks-,p-ih- ,oa lh-Mh- jkse 5- Vsyhfotu 6- fQYe 7- U;wt isij 8- VsifjdkMZj 9- ,tqlsVA midj.k esa oS/krk vkeqd oS/krk (Face validity) rFkk in oS/krk }kjk ekih x;hAbldh oS/krk -63 ,oa fo”oluh;rk xq.kkad -74 izkIr gqbZA oS/krk ,oa fo”oluh;rk Kkr djus ds fy;s vkeqd ,oa vkarfjd laxfr fof/k dk iz;ksx fd;k x;k gSA iz”ukoyh esa dqy 90 in gSa ftlesa izR;sd ds fy;s 5 fodYi iw.kZ lger] lger] vfuf”pr] vlger] iw.kZ vlger fn;s x;s gSa ftuds vad Øe”k% 5] 4] 3] 2] 1 gS rFkk udkjkRed iz”uksa ds vad Øe”k% 1] 2] 3] 4] 5 gSA
fo|ky; Nk= Nk=k,a ;ksx
xzkeh.k {ks= ds 5 fo|ky; 25 25 50
“kgjh {ks= ds 5 fo|ky; 25 25 50
;ksx 50 50 100
SPIJE, Vol.3, No.1, January 13 | 79
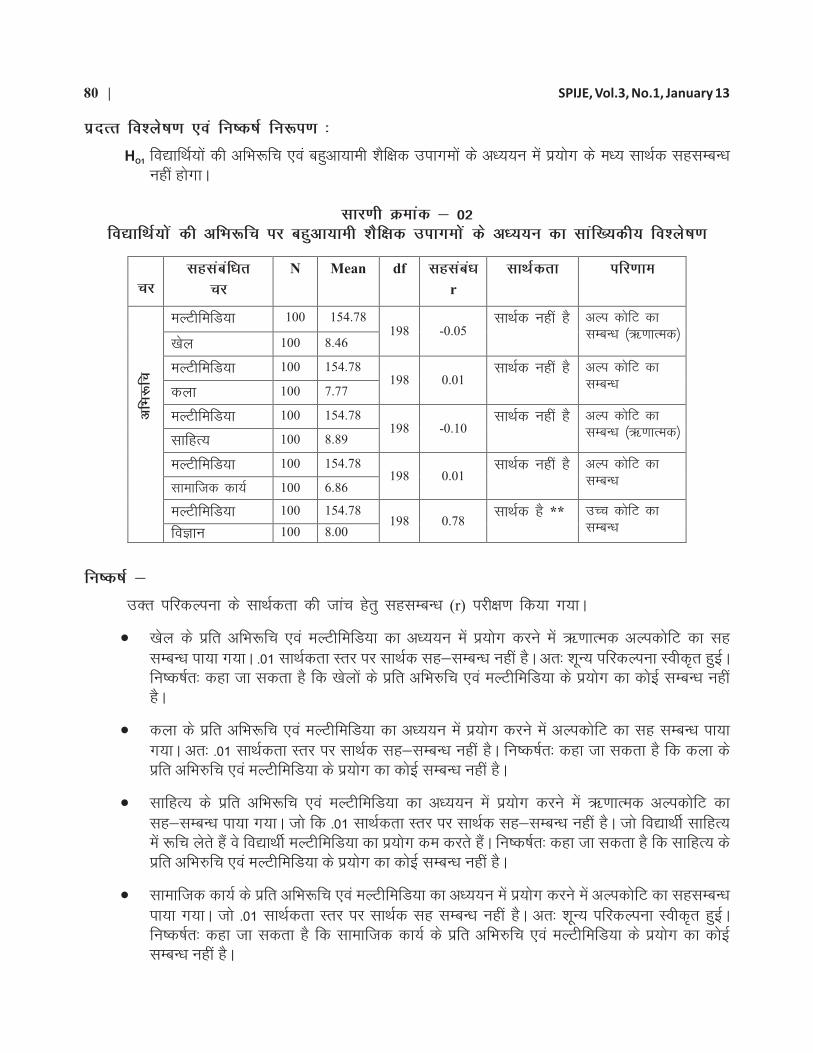
iznRr fo'ys"k.k ,oa fu"d"kZ fu:i.k %
H fo|kfFkZ;ksa dh vfHk:fp ,oa cgqvk;keh “kSf{kd mikxeksa ds v/;;u esa iz;ksx ds e/; lkFkZd lglEcU/k O1
ugha gksxkA
lkj.kh Øekad & 02fo|kfFkZ;ksa dh vfHk:fp ij cgqvk;keh 'kSf{kd mikxeksa ds v/;;u dk lkaf[;dh; fo'ys"k.k
fu"d"kZ &
mDr ifjdYiuk ds lkFkZdrk dh tkap gsrq lglEcU/k (r) ijh{k.k fd;k x;kA
•[ksy ds izfr vfHk:fp ,oa eYVhfefM;k dk v/;;u esa iz;ksx djus esa _.kkRed vYidksfV dk lg lEcU/k ik;k x;kA -01 lkFkZdrk Lrj ij lkFkZd lg&lEcU/k ugha gSA vr% “kwU; ifjdYiuk Lohd`r gqbZA fu"d"kZr% dgk tk ldrk gS fd [ksyksa ds izfr vfHk#fp ,oa eYVhfefM;k ds iz;ksx dk dksbZ lEcU/k ugha gSA
•dyk ds izfr vfHk:fp ,oa eYVhfefM;k dk v/;;u esa iz;ksx djus esa vYidksfV dk lg lEcU/k ik;k x;kA vr% -01 lkFkZdrk Lrj ij lkFkZd lg&lEcU/k ugha gSA fu"d"kZr% dgk tk ldrk gS fd dyk ds izfr vfHk#fp ,oa eYVhfefM;k ds iz;ksx dk dksbZ lEcU/k ugha gSA
•lkfgR; ds izfr vfHk:fp ,oa eYVhfefM;k dk v/;;u esa iz;ksx djus esa _.kkRed vYidksfV dk lg&lEcU/k ik;k x;kA tks fd -01 lkFkZdrk Lrj ij lkFkZd lg&lEcU/k ugha gSA tks fo|kFkhZ lkfgR; esa :fp ysrs gSa os fo|kFkhZ eYVhfefM;k dk iz;ksx de djrs gSaA fu"d"kZr% dgk tk ldrk gS fd lkfgR; ds izfr vfHk#fp ,oa eYVhfefM;k ds iz;ksx dk dksbZ lEcU/k ugha gSA
•lkekftd dk;Z ds izfr vfHk:fp ,oa eYVhfefM;k dk v/;;u esa iz;ksx djus esa vYidksfV dk lglEcU/k ik;k x;kA tks -01 lkFkZdrk Lrj ij lkFkZd lg lEcU/k ugha gSA vr% “kwU; ifjdYiuk Lohd`r gqbZA fu"d"kZr% dgk tk ldrk gS fd lkekftd dk;Z ds izfr vfHk#fp ,oa eYVhfefM;k ds iz;ksx dk dksbZ lEcU/k ugha gSA
pj
lglacaf/kr pj
N Mean df lglaca/k r
lkFkZdrk ifj.kke
eYVhfefM;k 100 154.78
[ksy 100 8.46 198 -0.05
lkFkZd ugha gS vYi dksfV dk lEcU/k ¼_.kkRed½
eYVhfefM;k 100 154.78
dyk 100 7.77 198 0.01
lkFkZd ugha gS vYi dksfV dk lEcU/k
eYVhfefM;k 100 154.78
lkfgR; 100 8.89 198 -0.10
lkFkZd ugha gS vYi dksfV dk lEcU/k ¼_.kkRed½
eYVhfefM;k 100 154.78
Lkkekftd dk;Z 100 6.86 198 0.01
lkFkZd ugha gS vYi dksfV dk lEcU/k
eYVhfefM;k 100 154.78
vfHk:
fp
foKku 100 8.00 198 0.78
lkFkZd gS ** mPp dksfV dk lEcU/k
80 | SPIJE, Vol.3, No.1, January 13
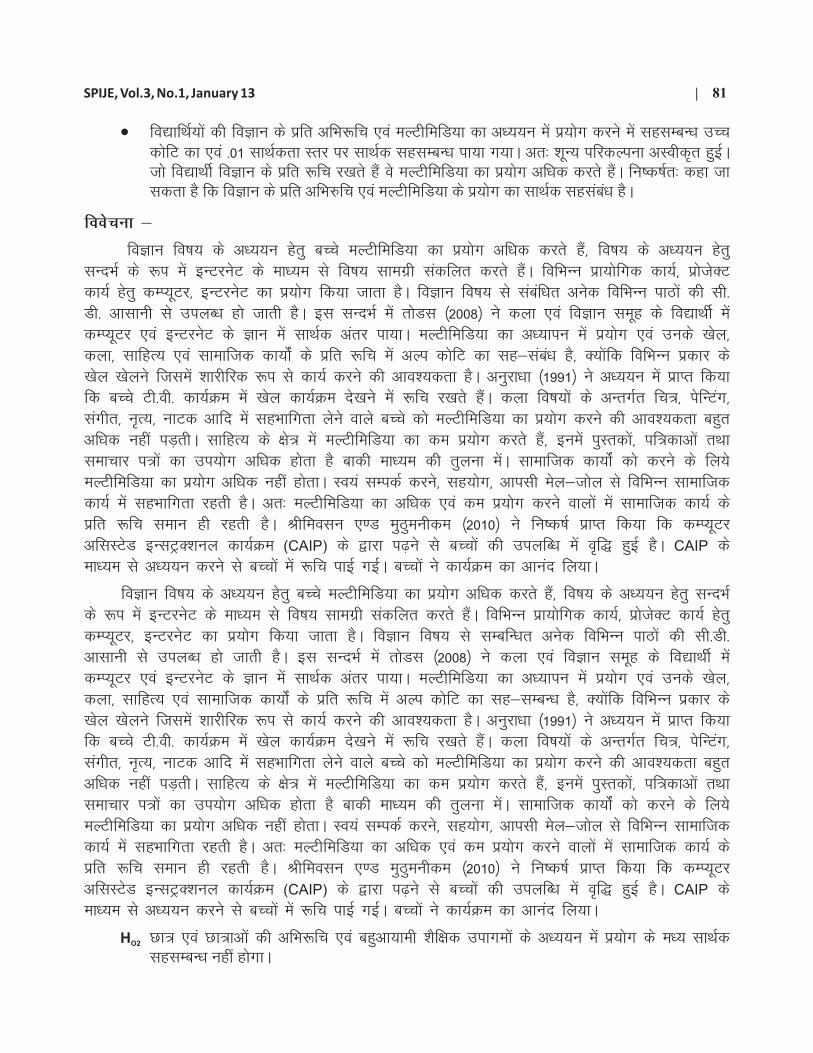
•fo|kfFkZ;ksa dh foKku ds izfr vfHk:fp ,oa eYVhfefM;k dk v/;;u esa iz;ksx djus esa lg mPp dksfV dk ,oa -01 lkFkZdrk Lrj ij lkFkZd lglEcU/k ik;k x;kA vr% “kwU; ifjdYiuk vLohd`r gqbZA tks fo|kFkhZ foKku ds izfr :fp j[krs gSa os eYVhfefM;k dk iz;ksx vf/kd djrs gSaA fu"d"kZr% dgk tk ldrk gS fd foKku ds izfr vfHk#fp ,oa eYVhfefM;k ds iz;ksx dk lkFkZd lglaca/k gSA
foospuk &
foKku fo"k; ds v/;;u gsrq cPps eYVhfefM;k dk iz;ksx vf/kd djrs gSa] fo"k; ds v/;;u gsrq lUnHkZ ds :i esa bUVjusV ds ek/;e ls fo"k; lkexzh ladfyr djrs gSaA fofHkUu izk;ksfxd dk;Z] izkstsDV dk;Z gsrq dEI;wVj] bUVjusV dk iz;ksx fd;k tkrk gSA foKku fo"k; ls lacaf/kr vusd fofHkUu ikBksa dh lh-Mh- vklkuh ls miyC/k gks tkrh gSA bl lUnHkZ esa rksMl ¼2008½ us dyk ,oa foKku lewg ds fo|kFkhZ esa dEI;wVj ,oa bUVjusV ds Kku esa lkFkZd varj ik;kA eYVhfefM;k dk v/;kiu esa iz;ksx ,oa muds [ksy] dyk] lkfgR; ,oa lkekftd dk;ksZa ds izfr :fp esa vYi dksfV dk lg&laca/k gS] D;ksafd fofHkUu izdkj ds [ksy [ksyus ftlesa “kkjhfjd :i ls dk;Z djus dh vko”;drk gSA vuqjk/kk ¼1991½ us v/;;u esa izkIr fd;k fd cPps Vh-oh- dk;ZØe esa [ksy dk;ZØe ns[kus esa :fp j[krs gSaA dyk fo"k;ksa ds vUrxZr fp=] isfUVax] laxhr] u`R;] ukVd vkfn esa lgHkkfxrk ysus okys cPps dks eYVhfefM;k dk iz;ksx djus dh vko”;drk cgqr vf/kd ugha iM+rhA lkfgR; ds {ks= esa eYVhfefM;k dk de iz;ksx djrs gSa] buesa iqLrdksa] if=dkvksa rFkk lekpkj i=ksa dk mi;ksx vf/kd gksrk gS ckdh ek/;e dh rqyuk esaA lkekftd dk;ksZa dks djus ds fy;s eYVhfefM;k dk iz;ksx vf/kd ugha gksrkA Lo;a lEidZ djus] lg;ksx] vkilh esy&tksy ls fofHkUu lkekftd dk;Z esa lgHkkfxrk jgrh gSA vr% eYVhfefM;k dk vf/kd ,oa de iz;ksx djus okyksa esa lkekftd dk;Z ds izfr :fp leku gh jgrh gSA Jhfeolu ,.M eqBqeuhde ¼2010½ us fu"d"kZ izkIr fd;k fd dEI;wVj vflLVsM bUlVªD”kuy dk;ZØe (CAIP) ds }kjk i<+us ls cPpksa dh miyfC/k esa o`f) gqbZ gSA CAIP ds ek/;e ls v/;;u djus ls cPpksa esa :fp ikbZ xbZA cPpksa us dk;ZØe dk vkuan fy;kA
foKku fo"k; ds v/;;u gsrq cPps eYVhfefM;k dk iz;ksx vf/kd djrs gSa] fo"k; ds v/;;u gsrq lUnHkZ ds :i esa bUVjusV ds ek/;e ls fo"k; lkexzh ladfyr djrs gSaA fofHkUu izk;ksfxd dk;Z] izkstsDV dk;Z gsrq dEI;wVj] bUVjusV dk iz;ksx fd;k tkrk gSA foKku fo"k; ls lEcfU/kr vusd fofHkUu ikBksa dh lh-Mh- vklkuh ls miyC/k gks tkrh gSA bl lUnHkZ esa rksMl ¼2008½ us dyk ,oa foKku lewg ds fo|kFkhZ esa dEI;wVj ,oa bUVjusV ds Kku esa lkFkZd varj ik;kA eYVhfefM;k dk v/;kiu esa iz;ksx ,oa muds [ksy] dyk] lkfgR; ,oa lkekftd dk;ksZa ds izfr :fp esa vYi dksfV dk lg&lEcU/k gS] D;ksafd fofHkUu izdkj ds [ksy [ksyus ftlesa “kkjhfjd :i ls dk;Z djus dh vko”;drk gSA vuqjk/kk ¼1991½ us v/;;u esa izkIr fd;k fd cPps Vh-oh- dk;ZØe esa [ksy dk;ZØe ns[kus esa :fp j[krs gSaA dyk fo"k;ksa ds vUrxZr fp=] isfUVax] laxhr] u`R;] ukVd vkfn esa lgHkkfxrk ysus okys cPps dks eYVhfefM;k dk iz;ksx djus dh vko”;drk cgqr vf/kd ugha iM+rhA lkfgR; ds {ks= esa eYVhfefM;k dk de iz;ksx djrs gSa] buesa iqLrdksa] if=dkvksa rFkk lekpkj i=ksa dk mi;ksx vf/kd gksrk gS ckdh ek/;e dh rqyuk esaA lkekftd dk;ksZa dks djus ds fy;s eYVhfefM;k dk iz;ksx vf/kd ugha gksrkA Lo;a lEidZ djus] lg;ksx] vkilh esy&tksy ls fofHkUu lkekftd dk;Z esa lgHkkfxrk jgrh gSA vr% eYVhfefM;k dk vf/kd ,oa de iz;ksx djus okyksa esa lkekftd dk;Z ds izfr :fp leku gh jgrh gSA Jhfeolu ,.M eqBqeuhde ¼2010½ us fu"d"kZ izkIr fd;k fd dEI;wVj vflLVsM bUlVªD”kuy dk;ZØe (CAIP) ds }kjk i<+us ls cPpksa dh miyfC/k esa o`f) gqbZ gSA CAIP ds ek/;e ls v/;;u djus ls cPpksa esa :fp ikbZ xbZA cPpksa us dk;ZØe dk vkuan fy;kA
H Nk= ,oa Nk=kvksa dh vfHk:fp ,oa cgqvk;keh “kSf{kd mikxeksa ds v/;;u esa iz;ksx ds e/; lkFkZd O2
lglEcU/k ugha gksxkA
lEcU/k
SPIJE, Vol.3, No.1, January 13 | 81

lkj.kh Øekad & 03Nk= ,oa Nk=kvksa dh vfHk:fp ij cgqvk;keh 'kSf{kd mikxeksa dk lkaf[;dh; fo'ys"k.k
fu"d"kZ &mDr ifjdYiuk ds lkFkZdrk dh tkap gsrq lg (r) ijh{k.k fd;k x;kA
Nk= ,oa Nk=kvksa ds [ksy ds izfr vfHk:fp ,oa v/;;u esa eYVhfefM;k dk iz;ksx djus esa dksbZ lkFkZd lg&lEcU/k ugha ik;k x;kA [ksy ds izfr :fp j[kus okys Nk= ,oa Nk=kvksa nksuksa gh eYVhfefM;k dk iz;ksx de djrs gSaA fu"d"kZr% dgk tk ldrk gS fd [ksy ds izfr vfHk#fp ,oa eYVhfefM;k ds iz;ksx dk dksbZ lEcU/k ugha gSA
•dyk ds izfr vfHk:fp ,oa v/;;u esa eYVhfefM;k dk iz;ksx djus esa vYidksfV dk lg lEcU/k ik;k x;kA tks -01 lkFkZdrk Lrj ij lkFkZd lglEcU/k ugha gSA fu"d"kZr% dgk tk ldrk gS fd dyk ds izfr vfHk#fp ,oa eYVhfefM;k ds iz;ksx dk dksbZ lEcU/k ugh gSA
•Nk= ,oa Nk=kvksa dk lkfgR; ds izfr vfHk:fp ,oa eYVhfefM;k dk iz;ksx djus esa _.kkRed vYidksfV dk lglEcU/k ik;k x;kA fu"d"kZr% dgk tk ldrk gS fd lkfgR; ds izfr vfHk#fp ,oa eYVhfefM;k ds iz;ksx dk dksbZ lEcU/k ugh gSA
•Lkkekftd dk;Z ds izfr vfHk:fp ,oa eYVhfefM;k dk iz;ksx djus esa vYidksfV dk lglEcU/k ik;k x;kA vr% “kwU; ifjdYiuk Lohd`r gqbZA -01 lkFkZdrk Lrj ij lkFkZd lglEcU/k ugha gSA fu"d"kZr% dgk tk ldrk gS fd Lkkekftd dk;Z ds izfr vfHk#fp ,oa eYVhfefM;k ds iz;ksx dk dksbZ lEcU/k ugha gSA
•Nk= ,oa Nk=kvksa ds foKku ds izfr vfHk:fp] v/;;u esa eYVhfefM;k -01 dk iz;ksx djus esa mPpdksfV dk lg&lEcU/k ik;k x;k gS] tks lkFkZdrk Lrj ij lkFkZd lglEcU/k gSA vr% “kwU; ifjdYiuk vLohd`r gqbZA fu"d"kZr% dgk tk ldrk gS fd foKku ds izfr vfHk#fp ,oa eYVhfefM;k ds iz;ksx dk lkFkZd lglEcU/k gSA
lEcU/k
•
pj lglacaf/kr
pj
N Nk=
M
r lkFkZdrk Nk=k
M
r lkFkZdrk
eYVhfefM;k 100 154.37 155.23
[ksy 100 9-41 -0.05
lkFkZd ugha gS
vYidksfV ¼_.kkRed½ 7.50
-0.04
lkFkZd ugha gS
vYidksfV ¼_.kkRed½
eYVhfefM;k 100 154.37 155.23
dyk 100 7.3 0.009
lkFkZd ugha gS
vYidksfV 8.24
0.007
lkFkZd ugha gS
vYidksfV
eYVhfefM;k 100 154.37 155.23
lkfgR; 100 8.74 0.082
lkFkZd ugha gS
vYidksfV ¼_.kkRed½ 9.04
-0.13
lkFkZd ugha gS
vYidksfV ¼_.kkRed½
eYVhfefM;k 100 154.37 155.23
Lkkekftd dk;Z 100 6.7 0.01
lkFkZd ugha gS
vYidksfV 7.02
0.009 lkFkZd ugha gS
vYidksfV
eYVhfefM;k 100 154.37 155.23
vfHk:
fp
foKku 100 7.85 0.76
lkFkZd gS **
mPpdksfV 8.16 0.63
lkFkZd gS **
lkekU; dksfV
82 | SPIJE, Vol.3, No.1, January 13

foospuk &
foKku fo"k; esa vfHk:fp vf/kd j[kus okys Nk=@Nk=k,¡ foKku fo"k; ls lacaf/kr uokpkj [kksts] dfBu vo/kkj.kkvksa dks le>us gsrq eYVhfefM;k dk mi;ksx djrs gSa] D;ksafd vklkuh ls ljyrkiwoZd cPps [kqn iz;ksx dj le>rs gSaA johUnzukFk ¼1992½ us fu"d"kZ izkIr fd;k cgqek/;e dk v/;;u esa iz;ksx djus ls oSKkfud vfHko`fRr] foKku fo"k; ds izfr vfHk:fp mPp ikbZ xbZA lHkh Nk=@Nk=kvksa dks fo|ky; esa cgqek/;e dk iz;ksx ds fy;s leku volj feyrs gSa vr% nksuksa esa gh cgqek/;e dk iz;ksx djus ds lUnHkZ esa vf/kd varj fn[kkbZ ugha nsrk gSA
orZeku esa fo|kFkhZ fo"k; ds Kku gsrq ikB~; iqLrd ds vfrfjDr lUnHkZ ds :i esa lkfgR;] if=dk;sa] bUVjusV] dEI;wVj] Vh-oh- dk iz;ksx i;kZIr :i ls vius izkstsDV iwjk djus gsrq djrs gSaA jktfd ,.M tdkfj;k ds vuqlkj& Nk= ,oa Nk=kvksa }kjk fofHkUu lkfgR; ds v/;;u esa fofHkUu izdkj ds [ksyksa esa lgHkkfxrk esa] lkekftd dk;ksZa dh lgHkkfxrk esa rFkk dyk ds varxZr fofHkUu xfrfof/k;ksa dks djus esa eYVhfefM;k lk/kuksa dk vf/kd mi;ksx ugha fd;k tkrk gSA ,slk mijksDr fu"d"kZ esa ifjyf{kr gksrk gSA LVªkax ¼1943½ ds vuqlkj :fp;ksa ds fu/kkZj.k esa vfHk{kerk] ;ksX;rk] iqjLdkj rFkk lUrqf"V vkfn egRoiw.kZ Hkwfedk gksrh gSA
v/;;u fu"d"k¨± dh 'kSf{kd lkFkZdrk &
fo|kfFkZ;ksa }kjk v/;;u ds nkSjku cgqek/;e dk iz;ksx djus ls foKku fo"k; ds izfr :fp esa o`f) gks ldsxhA vr% foKku fo"k; dh vo/kkj.kkvksa dks Li"V djus gsrq f'k{kd d{kk v/;kiu esa cgqek/;e dk iz;ksx djsa] ftlls cPps i<+us gsrq rRij jgsaA eYVhfefM;k dk v/;;u esa vf/kd mi;ksx djus ls cPpksa dh oSKkfud vfHko`fRr ldkjkRed ikbZ xbZ gSA pwafd cPps Lo;a bu ek/;eksa dk iz;ksx djsaxs rks Øec)] O;fDrxr ,oa rdZ laxr vk/kkj ij fo"k; dh vo/kkj.kk Li"V gksus ls lqfo/kk gksrh gS cPps Lo;a djds lh[krs gSaA cPpksa dks Vsyhfotu ds ek/;e ls fofHkUu 'kSf{kd tkudkjh izkIr gksrh gS tSls & fMLdojh pSuy] Kkun”kZu gS ftlesa oSKkfud fl)karksa dks ljyrk iwoZd izLrqr fd;k tkrk gSA oSKkfud 'kks/k] uokpkj] i;kZoj.k f'k{kk ls cPps voxr gksrs gSa ftldk mi;ksx lanHkZ ds :i esa djrs gSaA v/;;u esa cgqek/;e dk mi;ksx djus ls fo|kFkhZ izkIr Kku Lo v/;;u ls lh[k ldrs gSaA eYVhfefM;k rduhdh ds uokpkj ds :i esa lkeus vkbZ ftlds ek/;e ls de le; esa vf/kd ls vf/kd fo|kfFkZ;ksa dks izHkko iw.kZ f'k{k.k fn;k tk ldrk gSA bUVjusV vkt ds fo|kfFkZ;ksa ds fy;s egrh vko';drk cu x;k gSA 'kkldh; 'kkykvksa esa Hkh vkbZ-lh-Vh- fyVjslh izksxzke lapkfyr gksuk pkfg;sA
lq>ko &
•f”k{kd fdlh Hkh fo"k; dks izHkko”kkyh ,oa :fpdj f”k{k.k gsrq] f”k{k.k lkexzh] NksVs&NksVs izk;ksfxd midj.k] n`”;&JO;] lkekfxz;ksa dk mi;ksx djsaA
•cgqvk;keh “kSf{kd mikxeksa ds izfr cPpksa ,oa f”k{kdksa esa ldkjkRed vfHko`fRr o okrkoj.k cukuk vko”;d gS] ;g /kkj.kk gS fd cgqvk;keh “kSf{kd mikxeksa ls fd;k x;k f”k{k.k vf/kxe ijaijkxr f”k{k.k vf/kxe dh rqyuk esa izHkko”kkyh gSA
•f”k{kd ,oa fo|kfFkZ;ksa dks eYVhfefM;k lqfo/kkvksa ls iwjk iwjk ykHk mBkus gsrq vko”;d rduhdh ijke”kZ lsok;sa vkWu ykbu Hkh vklkuh ls miyC/k gks rkfd eYVhfefM;k ls gksus okys “kSf{kd ykHkksa dk Qk;nk mBkus esa mUgsa vuko”;d ijs”kkuh mBkus rFkk fujk”kko”k eYVhfefM;k ds izfr v:fp ij ldkjkRed n`f"Vdks.k fodflr gksus ls cpk;k tk ldsA
SPIJE, Vol.3, No.1, January 13 | 83

lUnHkZ xzUFk
1- jkftd] ts- ,.M tdkfj;k ts- ¼1995½- bUVjsLV~l vkWQ ,sMksyslsUl foFk fjQzsUl Vw ,t] tsUMj ,.M lksfl;ks bdkukWfeDl LVsVl] bf.M;u tuZy vkWQ vIykbM lkbdksykWth] 32] 45&51] flDLFk losZ vkWQ ,tqds”kuy fjlpZ oky;we II fnYyh] ,u-lh-bZ-vkj-Vh-] i`-la- 315-
2- gsCVsefj;u] jstkWu ¼2010½-yfuZax foFk eYVhfefM;k % , daLVªDVho dEijsfV~o ,izksp bu ,tqds'ku] ,tqVªsDl] vizSy 2010] i`-la- 18
3- dikfM+;k] ,-,e- ¼1992½-n bEisDV vkWQ Vsyhfotu vkWu LVwMsUV~l yfuZax % ,u ,DlIyksjs'ku] ,tqds'ku lkmFk xqtjkr ;wfuoflZVh] ih&,p-Mh- bu ,tqds'ku bu fQ¶Fk losZ vkWQ ,tqds'kuy fjlpZ] okY;we II] fnYyh] ,u-lh-bZ-vkj-Vh-] i`-la- 1377
4- Jhfeolu] ih-] eqFkqefude vkj- ¼2010½- ,u buksos'ku dEI;wVj vlhLVsM bUlVªD'kuy izksxzke] ,tqVªsDl] vxLr 2010] i`-la- 33
5- rksMl] lko] jksfguh oh- ¼2008½- , dEijsfV~o LVMh vkWQ dEI;wVj ,.M bUVjusV ukyst ,eax n LVwMsUV vkWQ cspyj vkWj ,tqds”ku] ekMZu ,tqds'kuy fjlpZ] vDVw- fnl- 2008] i`-l- 15
6- vuqjk/kk] ds- ¼1991½- fpYMªu Vsyhfotu ohfoax chgSfo;j ,.M bV~l bQsDV vkWu ilZuy ,.M ,tqds”kuy MsoyiesaV] Jh osadVs”oj ;wfuoflZVh] ,e-fQy- bu gkse lkbUl] bu fQ¶Fk losZ vkWQ ,tqds'kuy fjlpZ] okY;we II ] fnYyh] ,u-lh-bZ-vkj-Vh-] i`-la- 1360
7- johUnzukFk] ,e-ts- ¼1992½- MsoyiesaV vkWQ eYVhfefM;k bUlVªD”kuy LVªsVsth QkWj Vhfpax lkbal ¼ckW;ksykth½ ,V lsd.Mªh Ldwy ysoy] ih&,p-Mh- bu ,tqds”ku] ,e-,l-;w-] bu FkMZ losZ vkWQ ,tqds'kuy fjlpZ] fnYyh] ,u-lh-bZ-vkj-Vh- ] i`-la- 640
8- MsfoM] vYdk ¼1986½- fd'kksj vfHk:fp ijh{k.k] vkjksgh euksfoKku dsUnz tcyiqj ¼e-iz-½
9- eaxy] ,l-ds-] eaxy mek ¼2009½- f'k{kk rduhdh] ih-,p-vkbZ- yfuZax izkbosV fyfeVsM U;w MsYghA
10- mPp izkFkfed 'kkykvksa esa lfØ; jgdj lh[kus gsrq ,izksp isij] ,l-lh-bZ-vkj-Vh-] NRrhlx<+ ikB~;iqLrd fuxe] jk;iqj ¼N-x-½
11- MCY;wMCY;wMCY;w- ;wt vkWQ eYVhfefM;k bu ,tqds'ku-bu
84 | SPIJE, Vol.3, No.1, January 13