shadow open market committee (somc) - … open market committee somc policy statement summary...
TRANSCRIPT

SHADOW OPEN MARKET COMMITTEE (SOMC)
Policy Statement and Position Papers
March 5-6,1995
PPS 95-01
BRADLEY POLICY RESEARCH
CENTER
Public Policy Studies Working Paper Series
W I L L I
SIMON GRADUATE SCHOOL OF BUSINESS ADMINISTRATION
U^^ERSITYOFR(XHES^^ER R O C H E S T E R , N E W Y O R K 1 4 6 2 7
Digitized for FRASER http://fraser.stlouisfed.org/ Federal Reserve Bank of St. Louis

Shadow Open Market Committee
TABLE OF CONTENTS
Page
Table of Contents i
SOMC Members ii
SOMC Policy Statement Summary 1
Policy Statement 3
Prospects for Money and the Economy H. Erich Heinemann 11
Mexico: Policy Failure, Moral Hazard, and Market Solutions Lee Hoskins 25
Tax Cuts and Tax Reform Mickey D. Levy 47
Economic Outlook Mickey D. Levy 51
The Balanced-Budget Amendment: Treating the Symptom but Not the Disease
Charles I. Plosser. 69
What Does the Phillips Curve Tell Us About the Outlook for Inflation? William Poole 81
Monetary Aggregates Robert H. Rasche 87
Trial and Error in Devising the Mexican Rescue Plan Anna J. Schwartz 101
i.
Digitized for FRASER http://fraser.stlouisfed.org/ Federal Reserve Bank of St. Louis

March 5-6, 1995
SHADOW OPEN MARKET COMMITTEE
The Shadow Open Market Committee met on Sunday, March 5, 1995 from 2:00 PM to 6:30 PM in Washington, D.C.
Members of the SOMC:
Professor Allan H. Meltzer, Graduate School of Industrial Administration, Carnegie Mellon University, Pittsburgh, Pennsylvania 15213 (412-268-2282 phone, 412-268-7057 fax); and Visiting Scholar, American Enterprise Institute, Washington, DC (202-862-7150 phone)
Mr. H. Erich Heinemann, Chief Economist, Ladenburg, Thalmann & Co., Inc., 540 Madison Avenue-4th Floor, New York, New York 10022 (212-940-0250 phone, 212-751-3788 fax)
Dr. W. Lee Hoskins, Chairman and CEO, Huntington National Bank, 41S. High Street, Columbus, Ohio 43287 (614-480-4239 phone, 614-480-5485 fax)
Dr. Mickey D. Levy, Chief Financial Economist, NationsBanc Capital Markets, Inc., 7 Hanover Square, New York, New York 10004 (212-858-5545 phone, 212-858-5741 fax)
Dean Charles I. Plosser, William E. Simon Graduate School of Business Administration and Department of Economics, University of Rochester, Rochester, New York 14627 (716-275-3316 phone, 716-275-0095 fax)
Professor William Poole, Department of Economics, Brown University, Providence, Rhode Island 02912 (401-863-2697 phone, 401-863-1970 fax)
Professor Robert H. Rasche, Department of Economics, Michigan State University, East Lansing, Michigan 48823 (517-355-7755 phone, 517-432-1068 fax)
Dr. Anna J. Schwartz, National Bureau of Economic Research, 269 Mercer Street - 8th Floor, New York, New York 10003, (212-995-3451 phone, 212-995-4055 fax)
II.
Digitized for FRASER http://fraser.stlouisfed.org/ Federal Reserve Bank of St. Louis

Shadow Open Market Committee
SOMC POLICY STATEMENT SUMMARY
Washington, D.C., March 6—The Shadow Open Market Committee warned today "If the
Federal Reserve continues to tighten and reduces base money growth in 1995, the probability of a
recession in 1996 will increase." In a policy statement, the SOMC recommended that Federal
Reserve officials maintain a 7 percent growth rate of the monetary base (bank reserves and currency).
"The Federal funds rate," the SOMC stated, "should move up or down as needed to maintain this
policy."
In its statement, the SOMC said that "for the first time in 30 years, the U.S. can achieve stable
growth and low inflation in the near term. This desirable result will be realized if the Federal
Reserve does not overreact as it often has in the past This result will be sustained if the Federal
Reserve maintains a firm commitment to a non-inflationary monetary policy."
The Shadow Open Market Committee, a group of academic and business economists, meets
in March and September. It was founded in 1973 by Professor Allan H. Meltzer of Carnegie Mellon
University and the late Professor Karl Brunner of the University of Rochester.
The committee's statement urged Federal Reserve officials "to take a long-term view and pay
attention also to the lags in the effect of monetary policy. They should meet less often and improve
control of the growth of the monetary base to reduce variability and prevent inflation."
Tne SOMC maintained that the decline in the international value of the dollar "is not primarily
a monetary problem. The Federal Reserve cannot do much to stop the decline and should not try."
The policy statement took a jaundiced view of the effort to shore up the Mexican economy.
"Mexico's problem is the result of the mistaken policies followed by the Mexican government and
the Bank of Mexico during the 1994 election year...Instead of tighter money to stabilize the economy
and prevent inflation, Mexico chose monetary expansion."
The SOMC called on the U.S. Congress "to close the U.S. Treasury's Exchange Stabilization
Fund," which the Clinton Administration used to finance support for Mexico. "Not only has the
Fund been abused, it is no longer necessary." The SOMC added that "Congress should refuse to
provide additional funding for the International Monetary Fund."
1 Digitized for FRASER http://fraser.stlouisfed.org/ Federal Reserve Bank of St. Louis

March 5-6, 1995
The Shadow statement endorsed recent action by Congress rejecting the proposed Consti
tutional amendment to require a balanced budget "A balanced budget amendment directs too much
attention to balance and too little to the level of spending and taxes at which the budget is balanced
and the way in which resources are used. Further, a balanced budget amendment is likely to get
the courts involved in defining taxes, spending and the deficit"
2 Digitized for FRASER http://fraser.stlouisfed.org/ Federal Reserve Bank of St. Louis

Shadow Open Market Committee
SHADOW OPEN MARKET COMMITTEE Policy Statement March 6,1995
For the first time in 30 years, the U.S. can achieve stable growth and low inflation in the near
term. This desirable result will be realized if the Federal Reserve does not overreact as it often has
in the past. This result will be sustained if the Federal Reserve maintains a firm commitment to a
non-inflationary monetary policy.
Currently, two different monetary forces pull and push the economy. Excessively rapid money
growth from 1991 through 1993 gave momentum to the expansion in the second half of 1993 and
1994. Decisive slowing of monetary growth in 1994 improved the prospects of a "soft landing" in
1995. There is no law of economics that says that expansions get old and die. Policies that reinforce
the stabilizing properties of a free market economy sustain growth and low inflation.
The Federal Reserve has often overreacted to current events both during expansions and
recessions. Typically the money growth rate rose during recessions and remained high during the
recovery. When inflation rose, the Federal Reserve slowed money growth sharply. Money growth
continued low until after a recession had begun. This pattern produced rising inflation and con
tributed to several postwar recessions. Since 1973, we have urged the Federal Reserve to end this
stop and go policy.
The cycle is different. The Federal Reserve responded more slowly to excessive growth of
the monetary base—bank reserves and currency—than we wanted, but it responded earlier than
in most postwar recoveries, before inflation began to rise. Moreover, it responded decisively.
Growth of the monetary base calculated by the Federal Reserve Bank of St. Louis fell from
10 percent or more in 1992 and 1993 to 7.6 percent in 1994. In the last year bank reserves declined.
The current rate of base growth is consistent with a return to price stability in the years ahead.
At our September meeting, we recommended that Federal Reserve officials reduce growth
of the monetary base to 7 percent We now recommend that they maintain a 7 percent growth rate
of the base. The Federal funds rate should move up or down as needed to maintain this policy.
3 Digitized for FRASER http://fraser.stlouisfed.org/ Federal Reserve Bank of St. Louis

March 5-6, 1995
WHERE IS THE INFLATION?
Monetary effects on inflation and growth are not instantaneous. Federal Reserve policy works with a lag. If the Federal Reserve had been slower to act in 1994, inflation would be higher now. If the Federal Reserve continues to tighten and reduces base money growth in 1995, the probability of a recession in 1996 will increase.
We expect inflation to increase modestly in 1995 in response to past excessive monetary stimulus. Current policy can do little bout near-term inflation, and an attempt to roll back near-term inflation will jeopardize the attainment of stability with low inflation.
Many of those who urge tighter monetary policy now rely on a short-term Phillips curve relating unemployment and inflation. The reduction in unemployment in 1994 alerted many to the danger of inflation. Both inflation and unemployment are lagging indicators. Looking at the unemployment rate to predict inflation is like driving with your eyes on a rear view mirror; you see where the economy has been, not where it is headed.
Further, the Phillips curve has not been estimated precisely. There is considerable uncertainty about the level of the so-called natural rate of unemployment at which inflation begins to increase. Unemployment statistics have been revised and are possibly subject to larger errors than usual. For these reasons alone, it is a mistake to predict inflation from unemployment.
Inflation is a monetary problem—not a result of real growth or high employment. The job of the Federal Reserve is to prevent inflation, not to curtail growth and employment. It does its job best by controlling money, not by adjusting policy in response to growth.
IS MONEY GROWTH UNRELIABLE?
Part of the current folklore teaches that the relation of monetary aggregates to inflation and nominal output growth has broken down and that money does not matter. The record does not support that view. We accept that monetary aggregates have been misleading at times. They overestimated inflation in the mid-1980s. The SOMC's recent record, using the monetary base, runs counter to the popular belief, however.
In September 1991, we forecast that the recovery would be moderate, as it was for more than a year.
In March 1993, we noted that money growth had remained too high for too long. We suggested that economic activity would accelerate and that inflation would increase eventually to about a 4 percent annual rate.
4 Digitized for FRASER http://fraser.stlouisfed.org/ Federal Reserve Bank of St. Louis

Shadow Open Market Committee
In September 1993, we argued that the Federal Reserve had waited too long to slow money growth and suggested that long-term interest rates were likely to rise as the rate of economic expansion increased. Interest rates began rising in the fourth quarter.
In September 1994, we expected that economic activity would slow but that inflation would rise near-term. We urged the Federal Reserve to avoid excessive tightening and to follow our practice of targeting the monetary base.
We repeat these warnings and predictions to show that monetary aggregates convey useful
information about future inflation and nominal growth. We do not suggest that the Federal Reserve
rely on short-term forecasts. We urge policymakers instead to take a long-term view and pay
attention also to the lags in the effect of monetary policy. They should meet less often and improve
control of the growth of the monetary base to reduce variability and prevent inflation.
THE DOLLAR
In 1994 the dollar exchange rate fell about 10 percent against the yen and the mark despite
the strong U.S. economy. This continues a long-term decline. Since 1971, the dollar has depreciated
about 65 percent against the mark and more than 70 percent against the yen.
Dollar depreciation is not primarily a monetary problem. The Federal Reserve cannot do much to stop the decline and should not try. Those who want fixed exchange rates or coordinated policies to manage exchange rates never take account of the persistent real decline of the dollar against the yen or the Swiss franc. They do not recognize that differences in expected real returns to investment and expected productivity growth also affect exchange rates.
The new Congress can do much to strengthen the dollar. Reduced regulation lowers costs and prices. Tax policy that shifts resources from consumption to investment by reducing taxes on saving and raising the expected return to capital should be adopted on its own merits. A by-product of these changes would be a stronger economy and less dollar depreciation.
Congress is beginning to consider long and short-term changes in the tax system. We have frequently urged Congress to free saving from taxation and permit firms to expense investment in new capital. These are attractive features of the bipartisan proposal introduced by Senators Domenici and Nunn. We repeat our support for these reforms.
5 Digitized for FRASER http://fraser.stlouisfed.org/ Federal Reserve Bank of St. Louis

March 5-6,1995
BALANCED BUDGET AMENDMENT
A constitutional amendment to balance the Federal budget has two main benefits. It forces
Congress to pay for any new programs that it adopts. And it creates a public good: Each member
of Congress agrees to reduce his demands for additional public spending in exchange for promises
by other members to reduce their demands.
There are well-known disadvantages also. Congress would be encouraged to substitute regulation, state or local mandates, credit allocation, and other arrangements. These indirect methods are often more costly and less desirable than the government spending they replace. A balanced budget would at times require higher taxes or reduced spending in recessions. It would permit unsustainable growth of government spending during expansions.
A balanced budget amendment directs too much attention to balance and too little to the level
of spending and taxes at which the budget is balanced and the way in which resources are used.
Further, a balanced budget amendment is likely to get the courts involved in defining taxes, spending
and the deficit.
The recent Mexican loan and guarantee demonstrates the futility of the amendment. Congress and the administration find ways to spend or allocate resources outside the budget. A balanced budget amendment would increase these stratagems and reduce accountability.
MEXICO
Mexico's problem is the result of the mistaken policies followed by the Mexican government and the Bank of Mexico during the 1994 election year. The chart shows growth of Mexico's monetary base in 1993 and 1994. Mexico shifted to a highly expansive monetary policy in 1994 while pegging the peso to the dollar. As Mexican and foreign investors reduced their holdings of Mexico's debt, Mexico lost reserves. The Bank of Mexico substituted domestic for foreign assets. Instead of tighter money to stabilize the economy and prevent inflation, Mexico chose monetary expansion.
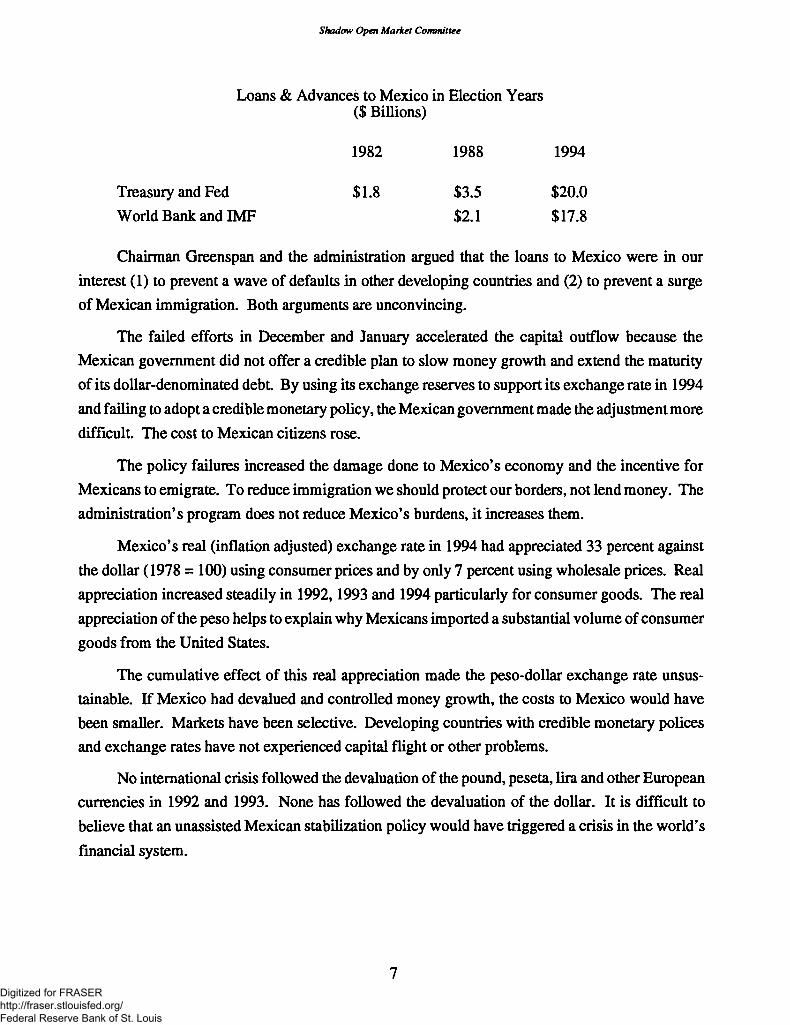
This is the third election year in a row that Mexico has had a monetary crisis. On the two
previous occasions, short-term advances (bridge loans) are made by the U.S. The IMF and World
Bank loans replaced these bridge loans with longer term financing. The table shows the loans and
advances made in response to previous crises.
6 Digitized for FRASER http://fraser.stlouisfed.org/ Federal Reserve Bank of St. Louis
Shadow Open Market Committee
Loans & Advances to Mexico iii Election Years ($ Billions)
1982 1988 1994
Treasury and Fed $1.8 $3.5 $20.0
World Bank and IMF $2.1 $17.8
Chairman Greenspan and the administration argued that the loans to Mexico were in our
interest (1) to prevent a wave of defaults in other developing countries and (2) to prevent a surge
of Mexican immigration. Both arguments are unconvincing.
The failed efforts in December and January accelerated the capital outflow because the
Mexican government did not offer a credible plan to slow money growth and extend the maturity
of its dollar-denominated debt By using its exchange reserves to support its exchange rate in 1994
and failing to adopt a credible monetary policy, the Mexican government made the adjustment more
difficult The cost to Mexican citizens rose.
The policy failures increased the damage done to Mexico's economy and the incentive for
Mexicans to emigrate. To reduce immigration we should protect our borders, not lend money. The
administration's program does not reduce Mexico's burdens, it increases them.
Mexico's real (inflation adjusted) exchange rate in 1994 had appreciated 33 percent against
the dollar (1978 = 100) using consumer prices and by only 7 percent using wholesale prices. Real
appreciation increased steadily in 1992,1993 and 1994 particularly for consumer goods. The real
appreciation of the peso helps to explain why Mexicans imported a substantial volume of consumer
goods from the United States.
The cumulative effect of this real appreciation made the peso-dollar exchange rate unsus
tainable. If Mexico had devalued and controlled money growth, the costs to Mexico would have
been smaller. Markets have been selective. Developing countries with credible monetary polices
and exchange rates have not experienced capital flight or other problems.
No international crisis followed the devaluation of the pound, peseta, lira and other European
currencies in 1992 and 1993. None has followed the devaluation of the dollar. It is difficult to
believe that an unassisted Mexican stabilization policy would have triggered a crisis in the world's
financial system.
7 Digitized for FRASER http://fraser.stlouisfed.org/ Federal Reserve Bank of St. Louis

March 5-6, 1995
The U.S. government is financing the Mexican loan off budget. One of the lessons of Iran-
Contra was supposed to be that off-budget finance without Congressional authorization is incon
sistent with the principles of democratic government.
We believe that Congress should vote to close the U.S. Treasury's Exchange Stabilization
Fund. Not only has the Fund been abused, it is no longer necessary. If currency operations are
required, they can be done by the Federal Reserve, as many of them are. In recent years the
International Monetary Fund has wasted large sums in Russia, East Europe, and most recently in
Mexico. Congress should refuse to provide additional funding for the International Monetary Fund.
8 Digitized for FRASER http://fraser.stlouisfed.org/ Federal Reserve Bank of St. Louis

MONETARY POLICY IN NEXICO
<3
1 0\
Jan Apr Jul Oct Jan Apr Jul Oct Jan Apr Jul Oct Jan 1992 1993 1994
Notes: The chart shous year-ouer-year percentage changes in the monetary base of the Bank of Mexico. Sources of the monetary base are currency and deposits by banks in the Bank of Mexico. Underyling data are millions of current pesos,
Sources: Bank of Mexico; Heinemann Economic Research
Digitized for FRASER http://fraser.stlouisfed.org/ Federal Reserve Bank of St. Louis

March 5-6,1995
10 Digitized for FRASER http://fraser.stlouisfed.org/ Federal Reserve Bank of St. Louis

Shadow Open Market Committee
PROSPECTS FOR MONEY AND THE ECONOMY
H. Erich HEINEMANN Ladenburg, Thalmann & Company, Inc.
HIGHLIGHTS
• A renewed crises in the Mexican peso would generate more selling in emerging markets. Markets in New York, Tokyo, London and Frankfurt should benefit from a flight to quality. RISKS IN MEXICO [Page 11]
• The Bank of Mexico lost its opportunity to create a basis for growth. Mexico's monetary constitution, which took effect April 1,1994, turned out to be a cruel April Fool's joke. BLAME ENOUGH FOR ALL [Page 12]
• The idea of a SOFT LANDING—a slowdown that does not slide into a recession—is gaining popularity. We are skeptical. Soft landings are a perennial Fed goals, but one it rarely, if ever, reaches. [Page 14]
• Maybe something will emerge from the budget debate. The balanced budget amendment is dead, but basic changes in taxes are alive. Watch the Domenici-Nunn consumption tax. GROPING TOWARD TAX REFORM [Page 15]
RISKS IN MEXICO
Investors should brace themselves for new, more serious problems in Mexico. The nearly $50-billion aid package that the U.S. and other lenders patched together for Mexico is not likely to restore confidence in the long-run value of the peso.
A renewed crisis seems likely in the next three to six months—in addition to the 40 percent drop in the value of the peso in December and January (see Figure 1 on page 20). Despite Mexico's pledge to control inflation and keep its capital markets open, fallout from renewed turmoil could lead to rapid inflation and exchange controls in Mexico.
Such a scenario would probably generate additional selling pressure in emerging markets —beyond the "tequila effect" already registered. At the same time, better-established markets in New York, Tokyo, London and Frankfurt should benefit from a continuing flight to quality.
Last week, there was a harbinger of difficulties that now loom over the horizon. The Bank
of Mexico once again cancelled a weekly sale of short-term, dollar-linked "Tesobonos" rather than
pay the rates of 15.5 to almost 27 percent that investors bid. This incident was troubling because
Washington included de facto backing for the tesobonos in its aid package.
11 Digitized for FRASER http://fraser.stlouisfed.org/ Federal Reserve Bank of St. Louis

March 5-6, 1995
There are two main reasons for the gloomy outlook in Mexico. Number one, the austerity
program that the U.S. Treasury demanded as the price for its support will likely push the Mexican
economy into a steep decline in a matter of months. The aid agreement requires Mexico to reduce
its real, inflation-adjusted money supply. Private borrowers in Mexico are already paying real
interest rates of 20 percent or more.
Second, Mexican President Ernesto Zedillo Ponce de Leon does not have a strategy (short-or long-range) to assure a predictable value for the peso. Expert analysts in Mexico City have long lists of policy options, but no one knows which, if any, of these Mr. Zedillo will choose. The Mexican government is on the horns of a dilemma. A deflationary monetary policy cannot be more than a temporary expedient However, Mr. Zedillo has not given potential investors in Mexico any idea of what will follow. This uncertainty will surely act as a major barrier to a reflux of foreign capital into the Mexican economy.
The great irony of the current crisis is that in the real world of employment, income, investment and output, the Mexican economy has done well in recent years. Conventional wisdom is that the structural reforms started by former President Carlos Salinas de Gortari were at best superficial and at worst seriously damaging to the economy. In fact, the Salinas program—privitization, opening Mexican industry to foreign competition and the North American Free Trade Agreement—set the stage for rapid rates of expansion for a long time to come.
Mexican exports of goods and services, measured in real pesos at 1980 prices, more than doubled from 1980 through mid-1994—a compound annual growth rate of about 5.5 percent. Many analysis in Mexico City—not the least economists at the Bank of Mexico—maintain that the rapid growth of Mexican exports is prima facie evidence that the peso was not, and is not, seriously overvalued.
According to the Organization for Economic Cooperation and Development, in this period Mexico had a real trade surplus on goods and services that averaged more than 5 percent of GDP. Meanwhile, Mexican exports are increasingly diverse. Oil was one-quarter of merchandise exports in 1987; it was 11.6 percent in 1993.
BLAME ENOUGH FOR ALL
There is blame enough for all in Mexico's difficulties, but the nation's central bank, the Bank
of Mexico, deserves special mention. During President Salinas' Administration, Mexico enacted
12 Digitized for FRASER http://fraser.stlouisfed.org/ Federal Reserve Bank of St. Louis

Shadow Open Market Committee
a model monetary constitution that is one of the best in the world. Since April 1,1994, the Bank of Mexico has been completely independent of the government. Its primary task is maintaining stable prices and a stable currency.
Sadly, the Bank of Mexico lost a crucial, perhaps unique, opportunity to create a stable foundation for sustained growth. (We based our earlier, far more favorable reading of the outlook in Mexico on incomplete and inaccurate data about the Bank of Mexico's activities [Prospects,
January 9,1995]. We regret the error.)
In practice, Mexico's new monetary constitution turned out to be little more than a cruel April Fool's joke. Miguel Mancera, Governor of the Bank of Mexico, claimed recently that allegations "that monetary policy in Mexico was expansionary during 1994" were "unjustified."
That sounds good, but few market participants—Mexican or American—now believe Mr. Mancera. The statistical record makes plain that the central bank, despite its statutory independence, printed money to assure Mr. Zedillo's election last year. Figure 2 on page 22 shows the rapid growth of the Bank of Mexico's monetary base during 1994. Annual expansion of the Mexican monetary base averaged 21.1 percent in the year ended January, compared to 6.5 percent in the year ended January 1994.
BADLY DISCREDITED
Mexican economists add that lending by government-sponsored development banks in 1994 amounted to 4.4 percent of the country's GDP, a huge increase. Some of this expansion, they assert, was supported by high-powered central bank money. Mexican authorities once counted lending by government-sponsored enterprises as part of the deficit in the public sector. However, last year such borrowing was "privatized." Exclusive of the development banks, the government deficit was 0.3 percent of GDP last year; with them, it was 4.7 percent
Mexico, along with most developing economies, must import capital in order to grow. To do this, the country has to convince overseas investors that the value of the peso will be both steady and predictable. One key Mexican analyst, a sharp critic of President Zedillo, warned that "this is unlikely without a radical modification of the exchange rate regime." Previous exchange rate policies and the Bank of Mexico itself, he charged, are "now badly discredited."
The most desirable solution would be for Mexico to follow the lead of Argentina and adopt
a type of monetary control known as a currency board. The Mexican government would peg the
value of its currency and coin to the dollar (or the yen or the D-mark).
13 Digitized for FRASER http://fraser.stlouisfed.org/ Federal Reserve Bank of St. Louis

March 5-6,1995
While Mexico, like Argentina, would likely lose control over its monetary policy, it should
gain both stable prices and a sharp drop in interest rates. However, most Mexicans apparently
regard this as a Faustian bargain that would hurt the country in the long run. Therefore, Mexico is
not likely to adopt a currency board.
The big risk for investors is that another major assault on the peso would lead Mr. Zedillo to
seek temporary relief with exchange controls that would allow the Bank of Mexico to print money
at a rapid rate. Long run, this would hurt the economy terribly and particularly the subsistence
farmers at the bottom of the Mexican economic ladder. Even so it is a seductive course—one
attempted far too often in Latin America.
SOFT LANDING
Our colleagues on the Shadow Open Market Committee seem to think that the Federal Reserve
has a realistic chance of achieving a genuine soft landing in 1995—an economic slowdown that
does not subsequently slide into a recession. We are more skeptical. A soft landing is perennially
a goal of monetary policy during economic expansions, but according to most counts, it is a goal
that the Fed rarely, if ever, reaches.
A preliminary draft of the SOMC Policy Statement due for release this morning, says that
"for the first time in 30 years, the U.S. can achieve stable growth and low inflation in the near term.
Whether that desirable result will be realized depends on Federal Reserve policy in the next few
months. Whether it will be sustained depends on the Federal Reserve's commitment to a non-
inflationary monetary policy.
"Currently, two different monetary forces pull and push the economy. Excessively rapid
monetary growth in 1992 and 1993 gave momentum to the expansion in the second half of 1993
and 1994. Decisive tightening in 1994 improved the prospects of a 'soft landing' in 1995. There
is no law of economics that says that expansions get old and die. Policies that reinforce the stabilizing
properties of a free market economy sustain growth and low inflation."
Unfortunately, as Figure 3 on page 23 makes clear, the stop-go-stop cycle in U.S. monetary
policy is alive and well and living at the Fed. The long period of easy money from 1991 through
1993 increased the total of high-powered reserves in American banks by almost 50 percent.
14 Digitized for FRASER http://fraser.stlouisfed.org/ Federal Reserve Bank of St. Louis

Shadow Open Market Committee
The economic effects of easy money last for a long time. Total business sales, which we regard as a useful proxy for aggregate nominal demand, are already rising at an annual rate of more than 10 percent Based on three-month moving averages, real orders for consumer goods and materials have gone up at a an annual rate of 12.5 percent over the six months ended in January. Real contracts and orders for plant and equipment are up at a 17.4 percent rate.
While the index of leading economic indicators has slowed to a crawl, the coincident indicators, which show what is happening in the economy currently, are up at a 5 percent rate. In our view, these indicators simply confirm our revised baseline forecast that shows solid growth in the first half of 1995 and then a slowdown in the second half (see Prospects, Vol. XI, No 4, page 5).
We believe that solid expansion—coupled with increasing evidence that latent price pressures in the economy are starting to surface—will keep tight money in place through 1995 and early 1996. In turn, that should trigger at least a mini-recession in time for the 1996 Presidential election. As the preliminary SOMC statement remarked, this stop-go-stop pattern has "produced rising inflation and contributed to many postwar recessions. Since 1973, we have urged the Federal Reserve to end this stop and go policy."
Hope springs eternal. Our colleagues think that "this cycle is different. The Federal Reserve responded more slowly to excessive growth of the monetary base—bank reserves and currency —than we wanted, but it responded earlier than in most postwar recoveries, before inflation began to rise." We hope this statement is correct, but we are doubtful.
GROPING TOWARD TAX REFORM
It is hard to tell from the raucous shouting on Capitol Hill, but perhaps something good will emerge from the debate over fiscal policy. Even though the proposed constitutional amendment to require a balanced budget went down to defeat last week, the political battle lines over tax and spending reform are now clear.
Conservatives generally say they want to roll back the size of government to promote growth. Lower taxes on capital gains and business investment are key symbols of their effort. Liberals, by contrast, seem more interested in which taxpayers pay taxes than how much they have to pay. They say conservative proposals for lower tax rates would benefit the rich at the expense of the poor and would not stimulate growth.
15 Digitized for FRASER http://fraser.stlouisfed.org/ Federal Reserve Bank of St. Louis

March 5-6, 1995
In terms of the classic trade-off in economics between efficiency and equity, conservatives appear to want growth for its own sake, while liberals are seeking more even distribution of income. The essential issue is not which proposal may be right or wrong in 1995. Rather, it is how best to serve the interests of the whole society over time. As Figure 4 on page 24 shows, the aggregate tax burden in the United States has risen steadily over the last 66 years from about 10 percent of GDP in 1929 to almost 35 percent today.
CONSUMPTION TAXES
While the bickering on Capitol Hill is noisier than even, there are hopeful signs of a bipartisan compromise. Two senior Senators, Pete Domenici (R-NM) and Sam Nunn (D-GA) have suggested an entirely new kind of consumption tax that would exempt all forms of saving from taxation.
"Consumption based taxes," says Professor Murray Weidenbaum of Washington University in St. Louis, "put the fiscal burden on what people take from society—the goods and services they consumer—rather than what they contribute by working and saving, as do income taxes."
The facts appear plain. Growth in the United States slumped over the last 20 years. Trends of real output of goods and services, productivity and real income per worker (the standard of living), have all slowed. Growth and investment are associated across time and among nations.
As Professor Weidenbaum put it, "capital plays a pivotal role in providing for the future standard of living on any society..., for increasing productivity and thus providing the basis for rising real incomes." We have argued for years that the drop in U.S. growth was the result of a parallel cut in net saving and investment
Net investment averaged about 4 percent of net national product over the last five years, the lowest for a comparable period in almost half a century. At the same time, corporate profits fell as a share of corporate income. To many analysts, the inescapable connection was that eroding profit margins undermined the incentive to invest In turn, reduced investment led to slower growth and pressure on living standards.
Profitability declined both before and after explicit federal and state taxes, so changes in tax
laws were only part of the process. Unfunded national, state and local mandates that require private
firms to implement programs for social, environmental, health and safety have grown rapidly. These
implicit taxes on income clearly were important in cutting profits, lowering investment and reducing
growth.
16 Digitized for FRASER http://fraser.stlouisfed.org/ Federal Reserve Bank of St. Louis

Shadow Open Market Committee
HIDDEN TAXES
At present, Congress is debating legislation to end unfunded mandates for state and local governments. Not only do such requirements impose intolerable budgetary burdens, but also they allow members of Congress to escape responsibility to pay for programs they initiate. The same idea should apply to private mandates. If The Americans with Disabilities Act provides worthwhile benefits, Congress should pay for them with explicit levies. Hidden taxes are not good taxes.
The theme of politically-correct America is fairness, so critics of investment incentives focus on apparent short-run changes in tax burdens. In reality, cheerleaders for schemes to solve social problems with someone else's money want government to redistribute vast amounts of income. Yet they rarely consider the full cost of such efforts in slower economic growth and lower living standards.
ONE TRILLION DOLLARS IN TRANSFERS
Explicit government transfer payment programs—which take money from people who work and give to people who do not—passed $1-trillion at an annual rate in January for the first time. Such programs now account for more than 20 percent of personal income other than transfers. Implicit programs are also very large, but they are impossible to measure.
Preston J. Miller, an adviser to the Minneapolis Fed, maintains "such interventions not only result in one-time losses in economic efficiency, as is commonly recognized, but they typically reduce growth over time." While unfettered markets provide prosperity, some people need help to achieve minimum living standards.
Society's task, Dr. Miller said, is "to develop systems that help the poor while interfering as little as possible with the private markets' ability to foster income and growth"—targeting redistributions to cut off "benefits to those who do not truly need them."
Dr. Miller added "government intervention in the name of fairness distorts the incentive structure. These distortions reduce growth and create the possibility that recipients of the government's redistribution schemes eventually would be better off without them: a small slice of a big pie could eventually exceed an equal slice of a small pie.
17 Digitized for FRASER http://fraser.stlouisfed.org/ Federal Reserve Bank of St. Louis

March 5-6,1995
THE HIGH COST OF BEING FAIR
"This is essentially what happened under Eastern European socialism, leading to the fall of Communism. Although this brand of socialism was intended to promote fairness, the economic pie in this part of the world became relatively so small that the middle class there became worse off than the poor in capitalist countries."
Under a consumption-based tax system, Professor Weidenbaum said, "saving is encouraged at the expense of current consumption. Of course, over a period of time, society is likely to achieve higher levels of both saving and consumption because the added investment, by generating a faster-growing economy, will lead to a bigger income 'pie.'" With luck, members of Congress will hear this message and act on it
18 Digitized for FRASER http://fraser.stlouisfed.org/ Federal Reserve Bank of St. Louis

Shadow Open Market Committee
MONEY SUPPLY M-1 (Cash, Demand and other
Checkable Deposits) M-2 (M-1 Plus RPs, Euros, MMMFs,
MMDAs, Consumer Time A/Cs) M-3 (M-2 Plus Large time A/Cs,
1 Term RPs and Euros) I Domestic M-1
FRB RESERVE AGGREGATES I Monetary Base I Total Reserves 1 Nonborrowed Reserves I Borrowing, ex. Extended Credit (NSA] 1 (millions of dollars)
WEEKLY MONETARY DATA (Billions of dollars,
Latest Week
$1,145.3
3620.9
4333.9
525.8
422.492 59.096 59.045 0.060
ST. LOUIS RESERVE AGGREGATES J Adjusted Monetary Base
Adjusted Fed Credit 1 Total Commercial Paper 1 C&I Loans - All Large Banks
463.1 435.8
618.087 326.8
1 Notes: Data, except as noted, are seasonally adjusted. I Domestic M-1 is an estimate of 1 Rates of change are compound
except as
Change from Previous week
NM
($1.5)
-2.7
1.2
-0.8
-0.210 -0.085 0.030 0.009
1.3 2.4
2.530 1.500
noted)
-Rates of Change Over-3 Months
0.2%
2.1
4.0
0.5
NA NA NA NM
7.7 8.7
21.1 24.0
- Not meaningful. NA loldings of American currency in the U.S.
6 Months 12 Months
-0.6%
0.5
2.5
-1.2
NA NA NA NM
5.9 7.1
15.8 16.4
- Not available
1.4%
1.0
1.9
-0.1
NA NA NA NM
6.3 7.2 8.7
14.0
plus demand deposits. annual rates based on four-week moving averages, except
Week Ended
20-Feb-95
20-Feb-95
20-Feb-95
20-Feb-95
15-Feb-95 15-Feb-95 15-Feb-95 01-Mar-95
01-Mar-95 01-Mar-95 22-Feb-95 15-Feb-95
Ml, M2 and M3's.
19 Digitized for FRASER http://fraser.stlouisfed.org/ Federal Reserve Bank of St. Louis

March 5-6, 1995
Figure 1 THE COLLAPSE OF THE PESO
U 30
Dec 4 Dec 20 Jan 5 Jan 21 Feb 6 Feb 22
Notes: The chart shows daily quotes for the Mexican peso in U.S. cents per peso. Data are noon buying rates certified by the Federal Reserve Bank of New York for customs purposes. Four-day moving averages from December 4 to March 1.
Sources: Federal Reserve board; Heinemann Economic Research
20 Digitized for FRASER http://fraser.stlouisfed.org/ Federal Reserve Bank of St. Louis

Shadow Open Market Committee
BUSINESS WEEK PRODUCTION INDEX* OUTPUT. Production:
Autos (Units) Trucks (Units) Paper (Thousands of tons) Pa per board (Thousands of tons) Raw Steel (Thsds of short tons) Bitum. Coal (Thsds of short tons)
1 Crude Oil (Thousands of bbls) 1 Electricity (Millions of kwh) 1 Rotary Rigs (US units operating)
TRANSPORTATION 1 Class I Railroad Freight Traffic 1 (Billions of ton-miles)
PRICES I Spot Index All Commodities 1967= 100 1 Raw Industrials 1 Foodstuffs
Domestic Spot Mkt Crude Oil Price 1 Trade-weigh ted Value of the US
Dollar (March 1973=100) I Common Stock Prices S&P 500
EMPLOYMENT 1 Initial Unemployment Claims (Thsds) 1 Claimant Level (Thousands)
P P P P P P P P P
P
P
WEEKLY ECONOMIC DATA Latest Chn nge from Week Previous Week 122.0
140414 112128
832.5 917.5 2015
20861 13897 64275
654 654
23.6 23.6
284.61 340.92 219.11
18.35 18.35 86.00
485.13 485.13
331 2554 2554
1.1
-8011 -11365
-15.1 15.2
-9 584
91 -353
-18 -18
0.2 0.2
-1.69 0.19
-3.37 -0.10 -0.10 -0.50 -1.78 -1.78
-13 34 34
— R a t e s of Change O v e r — 3 Months
14.7%
65.9 44.9
4.8 5.3
19.0 28.2
-12.8 17.6
-64.9 -64.9
-10.1 -10.1
14.9 11.1 20.6 10.7 10.7 -3.7
26.5 26.5
7.8 -1.7 -1.7
6 Months 12 Months 6.6%
1.4 -16.9
-0.3 5.1
19.9 7.5 0.7
11.2 -34.9 -34.9
-1.1 -1.1
16.2 22.9
7.2 6.7 6.7
-4.5 7.7 7.7
5.1 -10.1 -10.1
1 Notes: 'Copyright, McGraw-Hill, Inc. Used with permission. Data, except prices, seasonally adjusted. P 1 are compound annual rates based on four-week averages.
7.7%
-0.6 -0.7 2.0 7.5 8.5 3.1 0.9 2.9
-6.4 -6.4
12.7 12.7
13.3 23.1
0.4 26.3 26 .3 -8.9 3.8 3.8
-4.5 -9.4 -9.4
Week Ended I
18-Feb-95
25-Feb-95 25-Feb-95 18-Feb-95 18-Feb-95 25-Feb-95 I 18-Feb-95 25-Feb-95 18-Feb-95 03-Mar-95 I 03-Mar-95 I
18-Feb-95 18-Feb-95
28-Feb-95 28-Feb-95 28-Feb-95 02-Mar-95 02-Mar-95 01-Mar-95 02-Mar-95 02-Mar-95
25-Feb-95 18-Feb-95 18-Feb-95
Preliminary. Changes
21 Digitized for FRASER http://fraser.stlouisfed.org/ Federal Reserve Bank of St. Louis

March 5-6, 1995
C H A N G E
I N
p E R C E N T
37.5%
30.0%
22.5%
15.0% \
7.5% \
Figure 2 MONETARY POLICY IN MEXICO
Bank of Mexico Monetary Base
Jan Apr Jul Oct Jan Apr Jul Oct Jan Apr Jul 1992 1993 1994
Oct Jan
Notes: The chart shows year-over-year percentage changes in the monetary base of the Bank of Mexico. Sources of the monetary base are currency and deposits by banks in the Bank of Mexico. Underlying data are millions of current pesos.
Sources: Bank of Mexico; Heinemann Economic Research
22 Digitized for FRASER http://fraser.stlouisfed.org/ Federal Reserve Bank of St. Louis

Shadow Open Market Committee
Figure 3 CYCLICAL CHANGES IN MONETARY POLICY
C H A N G E
P E R C E N T
30.0%
22.5%
N 15.0%1
7.5%i
Ql 1983
Ql 1985
Ql 1987
Ql 1989
Ql 1991
Ql 1993
Ql 1995
Ql Ql 1979 1981
Notes: The chart shows annual percentage changes in total bank reserves acyusted for shifts in reserve requirements. Federal Reserve Board data in cu r ren t dollars. Firs t qua r t e r 1995 estimated. The vertical lines show recessions.
Sources: Haver Analytics} Heinemann Economic Research
23
Digitized for FRASER http://fraser.stlouisfed.org/ Federal Reserve Bank of St. Louis

March 5-6. 1995
Figure 4 TOTAL TAXES ARE A RECORD SHARE OF THE ECONOMY
P E R C E N T
0 F
G D P
— Tax Revenue 1 A ^ ^-^^^
-v
35%-
30% -
25%
20%-
15%-
10%-
1929 1935 1941 1947 1953 1959 1965 1971 1977 1983 1989 1995 Notes: The chart shows combined federal, state and local revenues as a
percent of gross domestic product. The underlying figures are billions of current dollars. The datum for 1994 is the average for the first three quarters of the year.
Sources: Haver Analytics; Heinemann Economic Research
24 Digitized for FRASER http://fraser.stlouisfed.org/ Federal Reserve Bank of St. Louis

Shadow Open Market Committee
MEXICO: POLICY FAILURE, MORAL HAZARD, AND MARKET SOLUTIONS
LeeHOSKINS The Huntington National Bank
SUMMARY
For the third time in the last dozen years, the Mexican economy is in financial distress largely because of bad monetary policies pursued by Mexican officials. The U.S. response in all three instances has been to extend loans from the Federal Reserve and the Treasury. These loans provide a short-term palliative while creating perverse incentives for Mexican officials and foreign investors that ensures the "crisis" will reappear on an even larger scale in the future. In addition, the use of the Treasury's Exchange Stabilization Fund (ESF) and Federal Reserve to fund an administration's foreign venture raises constitutional issues with regard to separation of powers and undermines the principle of central bank independence.
There is no way to avoid the significant costs imposed by bad economic policies implemented in the past. The best course for the future is to encourage market forces, stronger private property rights, price stability, and afloating exchange rate for the peso. Only by strengthening the institutions that produce such results will Mexico raise its standard of living.
Loans from the U.S. and international agencies such as the International Monetary Fund (IMF) can arrest a crisis in the short run, but are counterproductive in the long run. The new world order is one of market solutions not government intrusion. To foster such outcomes the U.S. should pass legislation that eliminates the Treasury's ability to make foreign loans (through the ESF) and that removes the ability of the Federal Reserve (through swap lines) to extend credit to foreign central banks directly or indirectly by funding the ESF. Congress should withdraw its support for the IMF.
SELF-INFLICTED WOUNDS
Financial difficulties and devaluation of the peso have occurred in each of the last three
presidential election years in Mexico: 1982,1988, and 1994. And each time, the U.S. monetary
authorities responded with a loan package of increasing size: $1.8 billion, followed by $3.5 billion,
and now $20 billion.
25 Digitized for FRASER http://fraser.stlouisfed.org/ Federal Reserve Bank of St. Louis

March 5-6, 1995
While the circumstances that led up to the financial strains and subsequent devaluation in each election year differed, the cause was the same—bad monetary policy largely driven by electoral politics. The central bank expanded the money supply in an attempt to keep interest rates from rising sharply during each election year while at the same time attempting to support a fixed or pegged exchange rate. As foreign investors, wary of inflation and devaluation, began to reduce their exposures, they exchanged pesos for dollars and rapidly depleted the central bank's foreign exchange reserves. In each case, as reserves ran low, the central bank devalued and the peso floated at least for a while. Language from the 1988 Federal Open Market Committee (FOMC) transcripts shows how similar these events are to 1994 and also provides insight into the desires of the Federal Reserve to "help out" by extending credit (See attachment.)
Attention has been incorrectly focused on the size and mobility of capital inflows as the cause of the current crisis. In fact, governments that implement sound economic policies have nothing to fear and much to gain from large inflows of capital. Countries, such as Mexico, that run inflationary monetary policies and at the same time attempt to fix exchange rates, are punished quickly and severely for such policies with capital outflows. It is the underlying instability of monetary policies, not capital outflows, that is the cause of the current crisis.
Mexico is not alone in learning this lesson. The major central banks of Europe, attempting to support fixed exchange rates inconsistent with underlying economic policies, are believed to have lost a new amount of $60 billion to capital market players in a matter of weeks in the autumn of 1992.
MISGUIDED MEASURES
The response by U.S. officials to the current turmoil in Mexico is the same as in the past: more loans and more onerous conditions on Mexico. There are at least four reasons why.this is a wrong-headed approach. First, loans or loan guarantees by the U.S. create a moral hazard that brews trouble in the future. Second, use of the Treasury by the Administration to fund foreign adventure without Congressional appropriation raises constitutional issues regarding separation of powers. Third, the Administration's use of the Federal Reserve to fund such loans, violates the principle of central bank independence. Fourth, the loans help special interests and do nothing to raise living standards for most Mexican citizens.
26 Digitized for FRASER http://fraser.stlouisfed.org/ Federal Reserve Bank of St. Louis

Shadow Open Market Committee
Moral Hazard. The regular practice by the U.S. government of extending guarantees to countries experiencing financial difficulties underwrites policies in these countries that otherwise would be untenable. It sends a message to investors, both foreign and domestic, that they can invest with little fear of a total loss. This loosens the essence of financial contracting, counter-party scrutiny, and results in excessive risk taking that occurs when a third party bears the risk.
This situation is analogous to the moral hazard created by Federal deposit insurance. Depositors do not scrutinize which banks are financially strong or weak, because they have no risk of loss. This frees bank officials to take larger risks than they could if there were no deposit insurance. The Federal guarantee encourages excessive risk taking and threatens large losses to U.S. taxpayers who already paid $ 150 billion for the thrift bailout. This example is directly relevant to the Mexican loan agreement since it de facto extends deposit insurance from the U.S. Treasury to depositors in Mexican banks.
Separation of Powers. The Administration's original proposal of $40 billion rescue package for Mexico had one redeeming feature. It sought Congressional authorization, in keeping with the separation of powers between the Executive Branch and Congress established by the Constitution. Dropping this plan in favor of the smaller program agreed to on February 20 amounted to an end run around the Congressional appropriation process. It should be noted that—pleased with the opportunity to side-step a vexing choice—Congress endorsed this abuse.
The ESF is a relic of the 1934 Gold Reserve Act that gave the Secretary of Treasury, in consultation with the President, the ability to intervene in foreign exchange markets and make loans in an attempt to "defend" the dollar and "protect" foreign trade. Since the ESF is not financed with regular appropriations from Congress, it must "borrow" from the Fed when it seeks additional funds. The FOMC regularly approves "warehouse" lines for Treasury borrowings.
The Treasury borrowed heavily against these lines in the late 1980's and as a result Congressional hearings were held in 1990 on the ESF and the Fed's warehousing activities. Loans to the Treasury by the Fed were subsequently discounted, although the warehousing lines remained in place for future use.
Central Bank Independence. The use of the Federal Reserve to fund Treasury activities not only raises questions about separation of power between the Executive Branch and Congress but also does damage to the principle of an independent central bank. Much effort has gone into keeping the Treasury and Fed at arm's length. The Secretary of Treasury was removed from a policy making position on the Fed in 1936. The Fed has not bought debt directly from the Treasury,
27 Digitized for FRASER http://fraser.stlouisfed.org/ Federal Reserve Bank of St. Louis

March 5-6, 1995
and the Accord of 1951 ended the practice of the Fed pegging interest rates while the Treasury
marketed its debt. Executive Branch influence on the Fed raises questions about the ability of
monetary policy to pursue price stability over time.
Relief for Special Interests. Lastly, the extension of loans from the U.S. government to the Mexican government favors special interests by definition and puts the U.S. in a position of monitoring loan terms and conditions of a sovereign nation where it has no jurisdiction and whose citizens it does not represent. The long governing Institutional Revolutionary Party (PRI) and its officials, as well as investors in Mexico, benefit from the U.S. support package. Support for a party in power probably slows long overdue institutional change in Mexico and preserves the status quo. Consequently, the standard of living in Mexico will be that much slower in reaching its potential and probably will suffer a year or two of future decline in the near term.
MARKET SOLUTIONS
Three times in the last dozen years or so, the U.S. and International agencies have extended loans to Mexico. Each time the loans have been larger and the terms and conditions more intrusive. The calls for bigger safety nets for emerging economies now being proposed by leaders of international agencies demonstrate that these institutions have failed in their efforts to promote development and stability. The opposite, progressively less sizable and visible interventions, would be hallmarks of lasting success. The only permanent solution lies in institutional reform that embraces market forces. Reliance on financial assistance from third parties will at best ease pressures temporarily.
The first step toward a market solution is to curb inflation by reducing money supply growth. Attempts to peg the exchange rate by any means other than sound policies are deceitful in the short run and ultimately destined for failure. In the end, the change in the price level will be identical under fixed an floating regimes, because monetary policy determines the price level.
The second step is to make monetary policy credible. The central bank should have a charter
that gives it true independence from the political process and directs it to achieve the single objective
of price stability. Mexico recently put into place a charter that was supposed to give the central
bank greater independence. Obviously it did not Sound money is a prerequisite for achieving
maximum sustainable growth. Statutory independence is a prerequisite for a credible commitment
to sound money.
28 Digitized for FRASER http://fraser.stlouisfed.org/ Federal Reserve Bank of St. Louis

Shadow Open Market Committee
Third, markets must be allowed to determine the price of the peso. Fixed exchange rates are
rarely and only accidentally consistent with prevailing economic policies and underlying funda
mentals. Most of the time, an arbitrary fixed exchange rate masks and over time amplifies imbalances
that eventually surface as major crises. Without the veil of a peso peg at 3.5 to the dollar in 1994,
the policy errors by the Mexican central bank, which included monetary base growth in the
neighborhood of 25 percent, would have been evident well before the crisis broke. Investors would
have been warned and officials forced to take actions that would have averted the crisis.
Fourth, Mexican debtors should negotiate directly with private creditors (not governments
or international agencies) to arrange conditions and terms of repayment Giant international agencies
may once have been able to orchestrate the financial and economic interactions among the nations
of a compartmentalized world economy. Today they get in the way. Government officials must
learn to ride the wave of technology and integrated global markets, because it is too large, com
plicated, and dynamic for an institution of any size and scope to control.
Bold new government financing programs have not provided solutions in the past and are not
likely to do so in the future. Rather, governments need to establish a regulatory and legal environment
that encourages and facilitates the adjustment of terms, maturities and principal of debts by creditors
and debtors, themselves.
The last step is a full embrace of free-market principles. Wealth losses that have occurred
must be recognized. If Mexican enterprises and banks are insolvent, they should be closed, and
their creditors should make appropriate compromises on the debts owed. Private property rights
should be strengthened and all government-owned commercial operations should be privatized.
Markets should be opened further to competition by eliminating all remaining protectionist barriers
and subsidies to industry, including allowing 100 percent ownership of banks and other commercial
entities by foreign investors.
CONCLUSION
These are the steps necessary to finally and completely resolve the ongoing peso crisis. If
they had been taken in 1982, Mexico would not still be in financial distress. The prescription will
be the same in 2000, 2006 and 2060. Mexican officials should take the plunge now, eschew the
old, failed government model and embrace the market. This is the best way to safeguard the rich
heritage of their great country and raise living standards to their potential.
29 Digitized for FRASER http://fraser.stlouisfed.org/ Federal Reserve Bank of St. Louis

March 5-6, 1995
U.S. officials should have resisted the temptation to tap the quick fix. Although the U.S.
forfeited considerable leverage by signing the agreement on February 20, it can still pressure Mexico
to adopt institutional reforms—particularly in the realm of monetary policy—that will all but
prevent a relapse of the peso crisis.
The threat of serious contagion from the current situation in Mexico to countries that have
followed prudent policies is small. Countries that have pursued unsound polices are at risk, and
will suffer the consequences of investor wrath. Superficial solutions involving government guar
antees fail to permanently correct misguided policies. Such guarantees create moral hazard and
increase systemic risk.
Finally, the United States should withdraw its membership in international financial orga
nizations that once may have promoted development and stability, but now encourage irresponsible
policies and imprudent risk-taking that destabilize markets.
30 Digitized for FRASER http://fraser.stlouisfed.org/ Federal Reserve Bank of St. Louis

Shadow Open Market Committee
TRANSCRIPT
FEDERAL OPEN MARKET COMMITTEE CONFERENCE CAU-
OCTOBER 17. 1988
This transcript has been produced from the original raw transcript in the FOMC Secretariat's files. The Secretariat has lightly edited the original to facilitate the reader's understanding. Where one or more words were missed or garbled in the transcription, the notation 'unintelligible' has been inserted. In some instances, words have been added in brackets to complete a speaker's thought or to correct an obvious transcription error or misstatement.
Errors undoubtedly remain. The raw transcript was not fully edited for accuracy at the time it was produced because it was intended only as an aid to the Secretariat in preparing the record of the Committee's policy actions. The edited transcript has not been reviewed by present or past members of the Committee.
Aside from the editing to facilitate the reader's understanding, the only deletions involve a small amount of confidential information regarding individual foreign central banks, private businesses, and other persons and entities. Deleted passages are indicated by gaps in the text. All information deleted in this manner is exempt from disclosure under applicable provisions of the Freedom of Information Act.
Staff Statement Appended to the Transcript:
Mr. Truman. Economist
31 Digitized for FRASER http://fraser.stlouisfed.org/ Federal Reserve Bank of St. Louis

March 5-6, 1995
Transcript of Federal Open Market Committee Conference Call of October 17, 1988
CHAIRMAN GREENSPAN. Good morning, everyone. We've been having a series of conversations with Mexican officials in recent days. And I thought it would be useful and appropriate to discuss it with the Committee. I'd like to call on Ted Truman to fill us in on the details of the conversations of recent days*
MR. TRUMAN; Well, I plan, Mr. Chairman, not to go into all the details. [See Appendix for an outline of Mr. Truman's remarks. which were not transcribed.]
CHAIRMAN GREENSPAN. I want to add that Mexico is critical to the whole debt strategy; and fundamental to that strategy is the underlying economic policies of the debtor nations. If Mexico can continue to improve and Ultimately become a success story--meaning restoration of normal access to the international financial markets--it's very likely to have an anti-contamination effect, so to speak, and have important implications for the resolution to the debt problem in the most beneficial way. As a result, we think it's important that Mexico be supported through this period to whatever extent is reasonable. And we hope that (i) if the oil price stabilizes and (2) their policies are effective, that Mexico--which led us into the debt crisis--may very well be the country which will lead us out. The timing of the oil price decline in sort of the "lame duckH status of the current [Mexican] administration is an awkward period and one which makes it rather difficult to implement significant policies. As a consequence the agreement, which I believe was struck yesterday, has within it I think a surprisingly reasonable number of provisions and fallbacks which I must say I think are better than one ordinarily would have expected during a period such as this. Are there any questions for Mr. Truman?
MR. PARRY. This is Bob Parry.
CHAIRMAN GREENSPAN. Yes. Bob.
MR. PARRY. In light of the tight policy and also the large budget cuts, what is the anticipated growth for Mexico?
MR. TRUMAN. Next yeat?
MR. PARRY. Yes.
MR. TRUMAN; The new Mexican administration is not looking for very much growth next year J maybe things will pick up in the second half of the year--something on the order of 1 to 2 percent at most.
MR. PARRY. Thank you.
MR. FORRESTAL. Mr* Chairman, this is Bob Forrestal in Atlanta.
CHAIRMAN GREENSPANi Yes. Bob.
32 Digitized for FRASER http://fraser.stlouisfed.org/ Federal Reserve Bank of St. Louis

Shadow Open Market Committee
MR. FORRESTAL. In view of the political situation in Mexico, the emergence of opposition parties and so on. with a new president coming in on December 1st, what degree of optimism do the Mexican officials have for a tighter monetary policy and the other measures that they outlined, including budget cuts? It seems to me that they might have some difficulty in following through on these.
MR. TRUMAN. Maybe the Vice Chairman of the Board would like to comment on the monetary policy, but the measures that were announced on Saturday are ones that are to be implemented by this current administration--on both the fiscal side and the privatization side and with respect to monetary policy.
MR. JOHNSON. On the monetary policy side, they*re not excited, of course, about the prospect of having to take these substantially tighter actionsk but-that was one of the conditions for this bridge loan. And so I think the feeling was that even though they had a wage-price pact that was trying to freeze prices, they weren't getting at the condition of [aggregate] demand in the country. which is still quite strong. Good evidence of that, even though they have a measured lower inflation rate, is the seepage on reserves that has picked up substantially. And I think the anticipation of a substantial devaluation, if conditions continued, is a pretty good indication of the underlying inflation problem in Mexico. So. I think it's a perfectly consistent policy to have a substantial tightening to deal with demand and at the same time restrain the outflow of reserves. I think they finally realized that they can't even hold the pact--their wage-price system that they've agreed to--together without additional restraint on domestic demand. I think the central bank has been reluctant to take this action, but I think now they realize that it is necessary and, of course, they realize too that in order to receive this bridge financing that's a necessary action. And they certainly have acknowledged that those pressures are there and something other than just a wage-price freeze needs to be done.
CHAIRMAN GREENSPAN. You know, there is a difficult problem that they've got. and which one would expect in this type of environment. They have nominal peso-denominated interest rates well in excess of 40 percent* annual rate, with a notational inflation rate of less than 1 percent a month. Now. what is very obvious from that is an implicit real rate of interest that makes no sense whatever in a free market. What we* re looking at. in effect, is not only an inflation element in the nominal interest rate but also an expectation of devaluation. And that essentially is what is driving these markets--that is, the markets presume that Mexico is on the edge of a devaluation and clearly that*s putting pressure on their reserves. You can address that issue in one of two ways: either through the fiscal side--that is, to bring down inflationary expectations which clearly are in excess of the current inflation rate which in turn would remove the expectation of a devaluation and bring nominal interest rates down--or* alternatively, you devalue to a point where expectations of further devaluation are frustrated. The Mexicans' concern about the latter Is they assert, with some limited evidence I must say. that should they do that the internal inflation that would occur would offset the devaluation effects and leave real exchange rates essentially unchanged without any alteration of expectations involved. We think they are wrong on that issue* but that's been a basic question which has created some differences of opinion about how
33 Digitized for FRASER http://fraser.stlouisfed.org/ Federal Reserve Bank of St. Louis
March 5-6, 1995
to proceed on this particular type of policy. As a consequence, one cannot argue that an increase in interest rates is the wrong policy, even though from a domestic Mexican point of view peso-denominated real interest rates are rising, and as Vice Chairman Johnson has indicated that's at the moment the only effective way in the short run to try to suppress excessive internal demands.
MR. ANGELL. Mr. Chairman. I certainly support the policy and would support the Open Market Committee agreeing to a release in this language. I am reluctant to have us make as strong a statement as we do on devaluation. It seems to me that it would be far better for them to pay the interest rates necessary in order to avoid the devaluation, which ultimately then can lead them to a position of falling interest rates because those interest rates coming down have to be in their long-run interest. And I hesitate for us to get involved in the recommendation of a devaluation which once again simply rewards those who have held their money-capital outside the country and I think will reinforce that behavior. So. it seems to me that interest rates in Mexico will have to be as high with devaluation as they will without.
MR. JOHNSON. Governor Angell. that isn't quite what the agreement is. We're not suggesting a devaluation. As a matter of fact, the whole purpose of these conditions was not to force them to a devaluation; it was to force them to take domestic fiscal and monetary actions to avoid a devaluation. Those are. in fact* the conditions.
MR. TRUMAN. I should emphasize that in the second part of this agreement
And I would hope that members of the Committee would please keep it to themselves, so to speak. But that part of it. as the Board's Vice Chairman said* is only if they fail in holding the exchange rate: only then would the second part come in.
MR. ANGELL. Well* I feel better, but I'd feel better yet if you said that the second part would be a further rise in interest rates.
MR. TRUMAN, I think you can be confident that if it fails there will have to be a rise in interest rates, too* at least in the short run.
CHAIRMAN GREENSPAN. The basic problem is that there are conditions under which interest rate increases don't create the type of environment which brings stabilization: you need more than that. And. hopefully, that won't be necessary and presumably it won't be. But there's a fallback position, that in the event that all else fails, you have really no choice. What happens is that if you get into a situation in which you get a big run on your reserves, ultimately you get to zero and you have no choice: I mean, you've got to devalue [unintelligible] && facto moratorium.
MR. TRUMAN. Well, in addition they face, potentially, a very large further shift in their terms of trade.
CHAIRMAN GREENSPAN. Yes.
34 Digitized for FRASER http://fraser.stlouisfed.org/ Federal Reserve Bank of St. Louis

Shadow Open Market Committee
MR. TRUMAN. A normal way to deal with that--
MR. ANGELL. Well, if it gets to the place where the terms of trade problem becomes acute, then I would grant that that's a step that has to be taken. I do not agree that devaluation as a technique of stopping capital outflows is a desired solution--
CHAIRMAN GREENSPAN. I don't think anybody disagrees with that statement.
MR. JOHNSON. That's what we're trying to stop.
MR. HELLER. But, Mr. Chairman, as the discussion right now shows, I think it's very difficult to make a judgment on the appropriateness of the program in the absence of a briefing on what's going on in Mexico. I for one would have very much appreciated either to have a briefing like that or to have a background paper so we can form some considered judgment as to whether these are appropriate measures in the current Mexican situation. As it is now, I'm happy to go along with it, but it's blind faith.
The second point I would like to make is in the press release. I'm [not] exactly sure what it means at the end--that the Treasury and the Federal Reserve are prepared to develop a short-term bridge loan depending on the development of loan programs by Mexico with the World Bank and IMF. I mean, they've got to do those programs first, then we do the btidge loan, or is it--?
MR. TRUMAN. The disbursement of the bridge loan would depend upon having in place the appropriate loan arrangements--the appropriate loan of the World Bank and the IMF to bridge to. There would be no disbursements on the bridge, at a minimum, until there was agreement on that. That stage of agreement is. I think, a little open at this time* and that would be subsequently negotiated. But essentially it [would be an] agreement that, yes, Mexico would qualify for compensatory financing. That might be done serially--in sequence. Or they might qualify for one of three structural loans, one a structural adjustment loan* and two large sectoral adjustment loans from the World Bank.
MR. HELLER. Wasn't there a whole series of them? One is in place already and does the second one roll in?
MR. TRUMAN. No* that's different: you may be remembering Argentina. These are three hew loans; they've had a program over the last two years of so-called structural adjustment loans. But these would be three new loans that they are in process now of negotiating. One is a structural adjustment loan addressed broadly at macroeconomlc policy and deregulation: the others are an industrial restructuring loan and a public enterprise loan, both dealing with reforms in the public enterprise sector.
MR. BRADFIELD. It should be clear that these are very secure loans from the point of view of the Treasury and the Federal Reserve. There's almost no risk. The loans would be disbursed only when there are appropriate assurances from the World Bank and the International Monetary Fund that their disbursements, to which we are bridging, would be forthcoming within the period of maturity of the bridge. As
35 Digitized for FRASER http://fraser.stlouisfed.org/ Federal Reserve Bank of St. Louis

March 5-6, 1995
to the part of the loan which is a bridge to Mexican reserves, there would be in effect a tying up of those reserves at the Federal Reserve Bank of New York as security for the bridge loan. So there would be absolutely no risk with respect to that part, which is bridging to Mexican reserves. So this is a very strong bridge and very little in the way of true financing for Mexico. The major effect of it is our expression of support that*s contained in the statement.
VICE CHAIRMAN CORRIGAN. Mr. Chairman* I'd like to pick up en that point that Mike Bradfield just made, because there are always questions in these things* and there are always uncertainties. But it seems to me that the case for the United States--the Treasury and the Federal Reserve--is that this is a powerful way to support Mexico at this point. That *s just beyond question. I certainly would enthusiastically support the thrust of your comment recommending the terms of this program. It's very, very important at this juncture. There are always questions or uncertainties on these things, but most things get worked out.,
MS. SEGER. I just have two questions. I guess they would be political but they*re probably tied into the economics also. You mentioned that the new president will take office December 1. In the context of this country, anyway, to what extent can an outgoing government commit a new government?
MR. TRUMAN. A representative of the new president--! should have mentioned this earlier--the senior economic advisor to the new president was a participant at the meeting. In that sense, you have a little more commitment to the process than you would if he wasn't participating at the meeting. And he was on the phone several times to New York.
CHAIRMAN GREENSPAN. Mr. Salinas has been briefed and is on board on this agreement.
MR. JOHNSON. The fact of the matter also is. though, if they were to fail to live up to the conditions, the bridge wouldn't be disbursed. We have complete control over the disbursement and if the conditions aren't met, then they wouldn't be able to draw the funds.
MS. SEGER. I guess I was thinking more of some of the fundamental changes that Ted.alluded to in his briefing. I think it would be hard to get those all accomplished in the next 30-some days.
CHAIRMAN GREENSPAN* Well, actually they are being announced by Mr. Salinas, allegedly in last night's speech.
MR. TRUMAN. Well, the first-phase budget cuts and the privatization program ate essentially under the control of the outgoing government* You'd probably have a document which details the privatization program--what stages some of them are in. or bids that have already been let, and some of them in process of development, and so forth and so on. And the monetary policy is under the control, so to speak, of the finance ministry and the central bank until the first of December.
MS. SEGER* Okayi that leads me to my second question. Some of these kinds of policies might not be terribly popular with the
16 Digitized for FRASER http://fraser.stlouisfed.org/ Federal Reserve Bank of St. Louis

Shadow Open Market Committee
populace. And as I understand it. the election was sort of a squeaker anyway, if that's a fair term. So. are we maybe going to have to face some real political instability if interest rates shoot up?
MR. JOHNSON. On that, let me just say that [unintelligible] I agree these policies won't be particularly popular. But at the same time, you have to consider whether the alternative would be popular. And what Governor Angell was getting at is that their alternative is a major devaluation that would substantially diminish the real incomes of those people who have submitted to a wage freeze. And so you have to take, as an alternative, a devaluation versus this. And I think that with them seeing what their alternatives are. it makes it more palatable for them to be willing to pursue a more restrained monetary policy and take stronger fiscal actions and sell off more of their nationalized firms. They*re actually undertaking some fairly impressive privatizations--the two .major airlines, two major copper companies, and I forget some of the other natural resource areas. There's a long list that they have already received bids for and they're prepared to accept bids on. So the numbers are fairly solid. If all of them go through as expected, it would be about 52 billion worth of privatizations. And a large part of that would be the two major copper mining companies, which are very large. That is already pretty much sealed up because the bids are already in and it's a matter of accepting the bids.
MS. SEGER. I'm not opposed to a loan and I certainly would believe in supporting the government. I just wonder if in 45 days we're going to be sitting around discussing this again.
MR, JOHNSON. Well, there's no guarantee.
MS. SEGER. That is what I was driving at.
CHAIRMAN GREENSPAN. That is not an inconceivable event.
MS. SEGER. Thank you.
MR. HOSKINS. This is Lee Hoskins. I'd like to hear the language in reference to the Federal Reserve that's in the press release and also ask who's putting out the press release* as well as a comment or two on the extent of our involvement in these kinds of activities in the past--bridge loan activities. And I guess, last, what has been the experience of the Treasury and other governments on some of these kinds of measures before? I'm just wondering if we have any way to gauge the success of those things. It seems to me that they have not been all that successful long term,
MR. TRUMAN. Well* I'll let the Chairman comment on the last question. The two places where the Federal Reserve appears in this press release are in the first sentence and the last sentence. The first sentence is, "The U.S. Treasury Department and the Federal Reserve welcome the economic measures recently announced by the Government of Mexico11 fc * that *s the four points that I described about the fiscal policy actioni privatization, the tighter monetary policy, and the applications to the Fund for compensatory drawings. I should emphasize on that last point that the importance of that is that it forces the Mexican authorities to enter into conversations about other policy actions extending into 1989 that the Fund feels are appropriate
37 Digitized for FRASER http://fraser.stlouisfed.org/ Federal Reserve Bank of St. Louis

March 5-6, 1995
to their circumstances. The last sentence, with explicit reference to the Federal Reserve, says "Accordingly, the U.S. Treasury and the Federal Reserve are prepared to develop a short-term bridge loan of up to $3.5 billion, depending on the development of loan programs by Mexico with the World Bank and the International Monetary Fund." And that was the question that I guess Governor Heller asked about the staging of all this and the "depending onn clause.
As far as the precedents for the Federal Reserve's being involved in these kinds of operations, there are some--in large part because we do have* and have had for 20 years, a swap line with the Bank of Mexico. On previous occasions like this, the Federal Reserve has participated alongside the Treasury Department in providing this type of short-term financial support to Mexico. We did it in 1976; we did it in 1982-83: we did it in 1986; and it's proposed that we should do it now. It is my personal view that these things have normally been relatively successful, though that clearly depends on one's standards of success,
MR. BRADFIZLD. In terms of repayment, I think the U.S. altogether has participated in approximately 15 bridge loans and every one of them has been repaid.
MR. HOSKINS. Well, my comment was not directed to non-repayments but was addressed--
MR. BRADFIELD. No* I was just addressing that specific aspect of it. I assumed that you were addressing the economic policy.
CHAIRMAN GREENSPAN. You can look at the economic policy responses in two ways. First, the fact that these Latin American countries are continuing in significant difficulty clearly suggests, of necessity, that [past] programs have not been fully successful. If they were [successful] for any of them, they wouldn't be in the particular situation they are in currently. However, it is also true that there have been very significant improvements in the structure of some of these economies, which were unbelievably arthritic previously. For example, the Mexican economy is a lot more flexible, a lot more market-oriented than it Used to be. And this is true pretty much across Latin America Where very substantial changes have occurred. That they have not been sufficient to make these wholly viable operating economies* I guess goes without saying. But all that is indicating is that they haven't come far enough yet; but the direction clearly has been positive. And I think it should be the policy of this country to be supportive of moves in that direction. But. Lee. I think what you'ret saying mainly is that they haven't come out of the extraordinarily poor state they've been in: and that's obviously the case. I don't think, however, it is generally the case that no progress has been made. On the contrary, I think significant progress has been made and in that context I would say that a number, not all. of these programs have been successful.
MR. BLACK. This is Bob Black. What is the timing on the release?
MR. TRUMAN. As soon as we finish this meeting, assuming [the Committee's view] is positive* it would be released by the Treasury Department. Are you planning on [releasing] it?
38 Digitized for FRASER http://fraser.stlouisfed.org/ Federal Reserve Bank of St. Louis

Shadow Open Market Committee
MR- COYNE. Yes.
MR. TRUMAN. And Joe Coyne will release it here as well. [See Appendix for a copy of the press release issued.]
MR. BLACK. Could you send us a facsimile copy?
MR. TRUMAN. We will do that.
MR. BLACK. Thanks.
MR. KEEHN. Mr. Chairman, this is Si Keehn. Going beyond the bridge loan, is there any additional private sector participation contemplated or required to deal with this?
MR. TRUMAN. Not at this stage. If. and this depends a lot on the future course of oil prices and whether this works and so forth, if you get involved in a full blown IMF program, then there would have to be--or one would expect there to be--a bank financing package along side that. If things do stabilize both in terms of the Mexican economy and the oil price and they merely go forward* which they will in any case with these World Bank loans, it is contemplated that there would be some parallel lending of a modest size that would go along with that over the next two or three years, but not a big jumbo loan in the next several months.
CHAIRMAN GREENSPAN. Are there any further questions?
MR. MELZER. Tom Melzer. here. I just wanted to quickly ask what their remaining reserves are and how much $3-1/2 billion would augment them. In other words, is there a prospect here of really catching the shorts and lending some support to the currency just through the announcement?
MR. TRUMAN. Their usable reserves are something between at the moment. And their total reserves
are about larger than that. I think the chances of catching the shorts off guard is primarily through the announcement effect that's been mentioned earlier and the monetary policy actions that are expected to follow up on that this week. And to the extent that their government* both the outgoing government and--based on the speech last night--the incoming government, convey a notion of following through, then there's some chance that the situation will stabilize.
MR* JOHNSON* I think what they're counting on is not the actual amount of this bridge, because as Mr. Bradfield and 'Mr. Truman, point out there's not a lot of up-front drawing associated with this. What they're counting on is the statement of support from the U.S. on top of the strong actions that they're announcing on monetary and fiscal policy. Really * in the short term between now and the time that we're really dealing with it. all the burden is going to be on monetary policy to stabilize their reserve situation through interest rates. It's not like it's just a pure currency crisis with no inflation problem; they've got enough of an underlying inflation problem to need a substantially more restrained monetary policy, as the Chairman has pointed out. Even though their measured rate is relatively low. it's purely because of the wage and price controls
39 Digitized for FRASER http://fraser.stlouisfed.org/ Federal Reserve Bank of St. Louis

March 5-6, 1995
situation. There's a lot of underlying inflationary pressure in that country.
CHAIRMAN GREENSPAN. You can't expect a short stampede, largely because I don't think the markets at this stage are aware of the size of the problem that Mexico currently is dealing with. In fact, one aspect of this issue is that we don't know to what extent the markets know what's happening. And this announcement in and of itself obviously will suggest that there's something going on. So you can actually, in the very short run before the monetary actions take place, conceivably have the market reacting in either direction.
MR. JOHNSON. We have some fairly significant assurances on the monetary side. We probably laid out as conditions of this substantially more detail [unintelligible]. As a matter of fact.
So. I think you would probably be pleased with the degree of scrutiny we gave the mechanism by which they would take tighter action.
MR. LAWARE. John LaWare. I have a question. Ted, you talked about the privatization program--is any part of that a debt-for-equity swap?
MR. TRUMAN. Some of these operations are financed through debt-for-equity swaps. Some of them are in the pipeline now. They have not approved any new ones in the last year or so, though there is talk of their reopening that program in a mild way. But I would expect that some of these do involve debt-for-equity swap operations in one form or another.
MR. LAWARE. Thank you.
CHAIRMAN GREENSPAN. Anything further on this? If not, thank you very much.
END OF CONFERENCE CALL
40 Digitized for FRASER http://fraser.stlouisfed.org/ Federal Reserve Bank of St. Louis

Shadow Open Market Committee
APPENDIX
STAFF STATEMENT AND PRESS RELEASE
41 Digitized for FRASER http://fraser.stlouisfed.org/ Federal Reserve Bank of St. Louis

March 5-6, 1995
E. M. Truman Cctcber 17, 1988
FCMC Briefing en Mexico
Ten days ago Secretary Brady and Chairman Greenspan were called by
senior Mexican officials who asked for an urgent meeting.
A. The meeting was provoked by the decline in the oil prices
and a concern that exchange market presssures would
accelerate in the period prior to the inauguration of
President-elect Salinas on December 1.
B. The Chairman and the Secretary met with the Mexicans for
most of the day last Sunday.
1. The Mexicans said
2. Their request was turned aside. It was agreed that
the Mexicans wcxild return to Mexico and sharpen their
economic policy plans while the U.S. authorities
thought about the proposed bridge loan.
On Friday, discussions resumed in Washington and continued until 9:00
p.m. last night when agreement was reached on the following approadi:
A. The Mexican authorities agreed to take immediate policy
steps in four areas. (These steps were announced by
President de la Madrid late Saturday night.)
1. The 1986 budget will be cut by $260 million (about .7
of GDP annualized) to offset about half of revenue
42 Digitized for FRASER http://fraser.stlouisfed.org/ Federal Reserve Bank of St. Louis

Shadow Open Market Committee
less from the laser oil prices and to enable the
government to meet its fiscal target for the year.
2. The privatization program will be accelerated and
about 50 enterprises are to be sold in October and
November for about $350 million excluding the proceeds
frcm the sale of the copper company.
3. Monetary policy is to be tightened.
(a) After further discussion yesterday, the
tightening was defined in terms of
progressively raising interest rates f
(b) Mexico lest abcut in reserves in
the first v^ek in October and about
last week.
4. Mexico will immediately seek about $600 million in
cenpensatory financing frcm the IMF.
TOE MATERIAL IN SECITCK B BEI£W IS HK3gff OONFIDENITAL
B. The Mexican authorities also agreed that if the less of
reserves ccntinues at the recent rate and liquid reserves
decline
C. In response# the Treasury and Federal Reserve (assuming the
FCMC has no objection) have agreed to "develop a short-term
bridge loan of up to $3.5 billion.11
43 Digitized for FRASER http://fraser.stlouisfed.org/ Federal Reserve Bank of St. Louis

March 5-6, 1995
D. Finally, last night the Mexican Ecancmic Solidarity Pact was
extended through December (the first month of the new
administration) and President-elect Salinas made a speech
cxit^ining the ecancmic policies of his new government. They
involve continuation of the process of fiscal restructuring
and the process of opening up the Mexican economy externally
and internally.
III. Ihe outline of the bridge arrangement would be as follows:
A. $1 billion could involve a potential t^ri2^dcw-dressingl,
operation divided 70/30 between the Federal Reserve and
ESF — in proportion to the existing swap arrangements.
B. $200 million could involve an advance payment on SHI oil
purchases.
C. Up to the remaining $2.3 billion cculd involve the Federal
Reserve and ESF on a 50/50 basis bridging through a special
swap arrangement to (1) $1.5 billion in World Bank loans,
(2) $0.6 in IMF compensatory financing, and
(3) drawings on any IMF standby
arrangement-
D. None of the drawings en the special swap would be made until
the arrangements of the loans to be bridged have been
cccputed*
IV. The proposed press release reads as follows; see attachment.
V. In effect, the proposed arrangements involve premising the Mexican
government seme bridge financing
44 Digitized for FRASER http://fraser.stlouisfed.org/ Federal Reserve Bank of St. Louis

Shadow Open Market Committee
VI. What we are seeking is an expression of the FCWZfs nan-cbjecticn to
the press release and in effect authorization to enter into the
negotiation of the terms of the special bridkge loan.
VII. I'd be glad to try to answer any questions.
45 Digitized for FRASER http://fraser.stlouisfed.org/ Federal Reserve Bank of St. Louis

March 5-6, 1995
For immediate release October 17, 1988
The U.S. Treasury Department and Federal Reserve
welcome the economic measures recently announced by the
Government of Mexico. The U.S. financial authorities
believe that these measures build upon the progress already
achieved in the sustained adjustment effort undergone by the
Mexican economy. Mexico's adjustment record, particularly
the process of fiscal consolidation and the structural
transformation of its external sector, has established the
basic conditions for the renewal of sustained economic
growth.
In the context of normal consultations between
countries with close economic relations, U.S. and Mexican
authorities have agreed that Mexico's strengthened economic
policies merit support* Accordingly, the U. S. Treasury and
Federal Reserve are prepared to develop a short-term bridge
loan of up to $3.5 billion, depending on the development of
loan programs by Mexico with the World Bank and the
International Monetary Fund.
46 Digitized for FRASER http://fraser.stlouisfed.org/ Federal Reserve Bank of St. Louis

Shadow Open Market Committee
TAX CUTS AND TAX REFORM
Mickey D.LEVY NationsBanc Capital Markets, Inc.
With the shift in political power in Washington, various types of tax proposals are under
consideration. They vary widely in concept and economic impact The proposals fall into three
general categories: tax cuts for the middle class, flat tax initiatives, and consumption-based taxes.
In terms of creating a fiscal environment most conducive to stronger economic performance and
higher long-run standards of living, replacing the current income tax system with a consumption-
based tax is strongly advocated. A consumption tax is preferred over a flat tax on income. Current
proposals for a tax cut for the middle class are misguided and should be avoided.
The current tax system fails when evaluated against three basic measures—simplicity, equity
or fairness, and efficiency: it is overly complex, burdensome and costly in terms of administration
and compliance; it grossly violates standard rules of equity, including notions if ability-to-pay and
imposing the same tax burden on people with the same income; and it distorts economic decisions
to work, save and invest
One of the largest inefficiencies in the tax system in terms of negative affecting economic
performance is its depressing impact on saving. If taxes saving twice, first as income and then as
income from saving. By lowering after-tax returns on saving, taxing income discourages saving
relative to consumption. The favorable tax treatment of interest expenses also contributes to low
saving. The deductibility of certain interest, particularly mortgage interest costs, encourages
debt-financed consumption. Dividends are taxed twice (first through corporate income tax and
second as personal income when distributed), while corporate interest expenses are treated pref
erentially. Capital gains are over-taxed because of the failure to fully index for inflation. The
income tax system also fails to adjust interest income and expenses for inflation.
The tax bias against saving, along with the government's deficit spending for
consumption-oriented transfer payments, has generated one of the lowest rates of personal and
national saving among all industrialized nations. Gross national saving in the U.S. has been declining
continuously as a percent of GDP in the last several decades. It is now less than half the saving
rates in high saving nations such as Japan and approximately 25 percent lower than the OECD
average. This relatively low saving rate has persisted even as government budget deficits in most
47 Digitized for FRASER http://fraser.stlouisfed.org/ Federal Reserve Bank of St. Louis

March 5-6, 1995
industrialized nations have jumped as a percent of GDP while the U.S. deficit has shrunk. The primary reason is the U.S's over-reliance on income taxes and the preferential tax treatment of interest expenses compared to the heavier reliance on consumption-based taxes and the less favorable treatment of interest expenses elsewhere.
The low national saving contributes to the current account deficit and ultimately constrains capital investment and long-run economic growth. The heavy reliance on foreign capital to finance the current account deficit is unhealthy insofar as the wide gap between national saving and investment reflects excess consumption generated primarily by government's consumption-oriented deficit spending and the tax disincentives to save. The negative economic impacts of the low national saving mount over time and deserve immediate attention.
COMPARING THE TAX PROPOSALS
Proposals to cut taxes on the middle class, like the Clinton Administration's child tax credit, are not tax reform. They would only raise the budget deficit and fuel more consumption at the expense of private saving at a time when consumption growth is above its long-run trendline and personal saving is close to an all-time low. Lower national saving would result. The cuts would add further complexity to the tax system and another layer of confusion to the issue of tax fairness. Most importantly, these proposals would not address the distorting effects of the income tax system.
The Administration's other major tax initiatives—broadening the IRA and partial deductibility of educational expenses—are on sounder footings conceptually. Broadening the IRA is designed to encourage private saving while allowing partial deductibility of educational expenses effectively would treat them as investment rather than consumption. Unfortunately, both initiatives are muddled by provisions that restrict their use and incentives. Moreover, they represent incremental changes to correct flaws in the existing income tax system.
Flat tax proposals have merit because they would greatly simplify the tax system, result in lower marginal tax rates, and eliminate many of the deductions, exemptions, and credits that create complexity, inequities, and some economic distortions. A pure flat tax would constitute a step forward in terms of a more consistent philosophy toward tax policy, compared to the hodgepodge nature of the present system. However, a flat tax on a comprehensive income tax base would continue to tax saving twice, albeit at a lower rate, and discourage saving relative to consumption. Nor would such an approach clarify the issues presented by the double taxation of dividends, or the tax treatment of capital gains or interest income and expenses.
48 Digitized for FRASER http://fraser.stlouisfed.org/ Federal Reserve Bank of St. Louis

Shadow Open Market Committee
A consumption-based tax would be economically neutral between saving and consumption.
In a cash-flow consumption tax, the tax base is derived by subtracting saving from income; certain
spending determined to be "investment-oriented" and thereby treated as deferred consumption may
also be deductible. The rate structure applied to the consumption tax base may be adjusted to
achieve goals of tax revenue and equity.
A consumption tax would greatly simplify the tax system and eliminate many of the present
inequities generated by the arbitrary pattern of deductions, credits and exemptions. Most impor
tantly, it would eliminate the tax bias against saving, the double taxation of dividends, the excess
tax on real capital gains, and the difficult issues in measurement presently generated by inflation
adjustments. Unlike the current tax system, a consumption tax would treat alike individuals with
the same beginning wealth and the same present value of lifetime earnings, regardless of the timing
of their consumption and saving.
The Dominici-Nunn tax proposal is a modified cash-flow consumption tax. In addition to
deducting saving, taxpayers would also deduct a sizable "family living allowance," mortgage
interest, charitable contributions, and a portion of educational expenses. Its tax rate structure would
be progressive, involving three rate brackets with the top marginal rate of approximately 36 percent.
Employee contributions for social security and Medicare, and eligible earned income credits would
be credited against the final tax bill.
By changing the tax base from income to consumption and imposing a progressive rate
structure based on historical propensities to consume and save, Dominici-Nunn would generate the
same approximate level of tax revenues as presently and remain consistent with acceptable notions
of ability-to-pay, not materially altering the average tax burdens of the different income quintiles.
Dominici-Nunn would also involve a cash flow business tax in which businesses would expense
business investment
Representative Armey has proposed a flat tax that has certain consumption tax characteristics.
Its base for taxation would include income from salaries and wages (plus fringe benefits) and
pensions, but not social security benefits, interest, dividends, or capital gains. There would be no
deductions for mortgage or other interest expenses, charitable contributions, or state and local taxes.
In the proposal, the flat tax rate would be 17 percent (The Administration has estimated that the
Armey proposal would involve significant decline in tax revenues from current law).
49 Digitized for FRASER http://fraser.stlouisfed.org/ Federal Reserve Bank of St. Louis

March 5-6,1995
The SOMC has long advocated a consumption tax in place of an income tax. The income
tax system is flawed structurally. Decades of efforts to offset its many shortcomings have resulted
in a series of incremental changes that combine to create a patchwork system that is lacking in any
coherent theme and is detrimental to the economy. The negative impacts on economic performance
continue to mount. The healthy economic environment now provides an opportune time to
implement positive structural change.
50 Digitized for FRASER http://fraser.stlouisfed.org/ Federal Reserve Bank of St. Louis

Shadow Open Market Committee
ECONOMIC OUTLOOK
Mickey a LEVY NationsBanc Capital Markets Inc.
The pace of economic growth is beginning to slow, following six quarters of robust economic performance. Real GDP is projected to grow approximately 2.5 percent from fourth quarter 1994 to fourth quarter 1995 and 1.75-2.0 percent in 1996, less than half its recent rate. The structure of the economy remains strong, without significant imbalances, and presently the probability of recession in 1995-1996 is very low. That probability would rise with further monetary tightening. The Federal Reserve is urged not to tighten further, based on the current restrictiveness of monetary thrust. A well-designed restructuring of the government's fiscal and regulatory policies is needed to raise the trajectory of long-run economic growth.
Inflation is projected to rise modestly as the pace of economic growth slows, but not exceed 4%, well below the previous cyclical peak of 6% in 1990. This bout of higher inflation is expected to be temporary, as the Fed's monetary policy remains consistent with lower long-run inflation.
Interest rates are beyond their cyclical peak. Real rates are expected to recede further as economic activity continues to moderate, while lingering inflation pressures will constrain the decline in bond yields. The steepening yield curve with short-rates falling faster than bond yields would reverse the curve flattening associated with the recent economic strength.
RECENT ECONOMIC PERFORMANCE
The robust 4.2 percent growth pace of real GDP from mid-1993 through 1994 was driven by the lagged impact of the Fed's stimulative monetary policy in 1992-1993 and the healthy foundation for expansion created by the positive private sector restructuring. Fiscal policy has had a negative impact on economic activity.
The Fed's accommodative stance in 1992-1993 and subsequent monetary tightening in 1994
has generated typical cyclical patterns in financial markets, real economic activity, and coming
soon, inflation. It earlier sustained monetary expansion initially benefited financial markets before
generating the recent surge in economic growth. The rapid liquidity growth pushed up prices of
financial assets, reducing interest rates while steepening the term structure of rates, and lifting P/Es
on stocks. But once created, excess liquidity does not disappear: eventually it is spent, generating
51 Digitized for FRASER http://fraser.stlouisfed.org/ Federal Reserve Bank of St. Louis

March 5-6, 1995
accelerating current dollar spending, and/or drained. In 1994, both happened: current dollar spending and real GDP growth accelerated sharply, and the Fed raised interest rates and tightened monetary policy in an effort to slow economic activity and constrain inflation. The negative financial market impact of the monetary tightening has concluded, and slower product demand and economic growth are beginning to unfold. While inflation pressures are likely to mount modestly in 1995 in response to the earlier monetary accommodation, the recent monetary tightening will constrain the rise in inflation and points to lower long-run inflation.
As the economy shifted from slow recovery to rapid expansion in 1993-1994, it took on many of the characteristics of recent cycles. Strong productivity gains and sharply slower unit labor cost increases generated accelerating corporate profits, providing the basis for rapid employment gains. Nonfarm payrolls increased 3.5 percent from December 1993 through December 1994, its fastest growth in five years. The unemployment rate decreased to 5.4 percent, its lowest rate in five years. Real consumption grew 3.5 percent, well above its long-term trendline. Business fixed investment surged, growing 13 percent annually in 1993-1994, and has risen as a share of GDP. The housing market remained strong through mid-1994, generating rapid increases in residential investment Business confidence in sustained strong product demand mounted throughout 1994. Consequently, business production outpaced final sales, and inventory building was the strongest since 1984.
Two sectors subtracted from the strong GDP growth: government purchases and net exports. Government purchases continued to decline with ongoing federal defense downsizing. While real exports rose 11.6 percent in the last year, imports surged almost 15 percent with the strong domestic demand. The real trade deficit rose from $82.2 billion in fourth quarter 1993 to above $110 billion in third and fourth quarters 1994, suppressing domestic production relative to domestic demand by 0.6 percent.
Inflation. Inflation has remained moderate, despite the strong economy. Typical of recent early expansion stages, the largest portion of the acceleration in nominal GDP (6.3 percent in the last year) was real growth (4.0 percent), while inflation remained low (the implicit GDP deflator rose 2.3 percent). Increases in productivity (1.5 percent for non-farm business and 4.6 percent in manufacturing) and small increases in employment costs have constrained unit labor costs: they increased less than 2.0 percent in nonfarm businesses and declined 2.2 percent in manufacturing. While strong product demand growth has enabled certain industries to raise product prices, attempts to raise prices in other industries have not been successful. Consequently, the CPI increased 2.6
52 Digitized for FRASER http://fraser.stlouisfed.org/ Federal Reserve Bank of St. Louis

Shadow Open Market Committee
percent in 1994 while the PPI rose 1.8 percent. Price pressures at the crude and intermediate stages have exerted only minimal upward pressures on finished goods or consumer prices; historically, they have not always been passed through.
Interest Rates. Real interest rates increased in 1994 in response to strong economic performance and rising expected rates of returns on investment, while the Fed tightened monetary policy in an attempt to constrain inflation. As a consequence, the yield curve flattened with short-term rates rising faster than bond yields. This pattern is typical of recent episodes of robust economic growth.
FED TIGHTENING AND THE MONETARY TRANSMISSION PROCESS
Since late-1993, the Fed's monetary policy has shifted from accommodative to restrictive. Bank reserves, which grew at an excessively rapid 15 percent average annual rate in 1992-1993, have declined 2.5 percent in the last year. Ml has followed a similar pattern, slowing from a 12 percent growth pace to 1.7 percent in the last year. M2 has not accelerated. This is the first time since late 1988 to early 1989 that bank reserves and real money balances have declined. The significant increase in the inflation-adjusted funds rate and flattening of the yield curve are also symptoms of monetary tightening.
The impacts of monetary tightening on financial markets are never pleasant or smooth, and the current episode has been no different In 1994, the bond market turned in its worst performance in decades. Sizable portfolio adjustments involved net outflows from stock and long-term bond funds, and a rise in short-term money market funds and bank CDs. Bank margins were squeezed as strong loan demand raised bank demand for Eurodollar deposits and lowered demand for government securities. More jarring events included the dramatic deterioration of the European debt market, the unhinging of the mortgage-backed securities market, huge investors' losses in derivative products, the Orange calamity, and collapsing currently and debt markets in Mexico and other emerging markets.
These events have not been isolated events: they are part of the transmission process through which the monetary tightening will slow economic growth.
53 Digitized for FRASER http://fraser.stlouisfed.org/ Federal Reserve Bank of St. Louis

March 5-6, 1995
SIGNS OF ECONOMIC SLOWDOWN
Signs of moderating economic growth have begun to emerge. Housing activity, which has consistently led all recent episodes of economic slowdown, has begun to moderate. New home sales peaked in October 1994, while new housing starts have also begun to decline, despite the mild weather this winter. Residential investment declined in the third quarter and was flat in the final quarter of 1994, its weakest performance since 1990. Retail sales, another reliable indicator of recent slowdowns, have slowed decidedly since October, following a sustained period of robust 8.0 percent year-over-year growth. In particular, the meager 0.2 percent rise in retail sales in January followed the disappointing holiday retail season. Mirroring this, real consumption rose only 0.1 percent in December and was unchanged in January, as durable goods consumption declined with falling auto sales.
At the same time that product demand growth has moderated, inventory building has remained robust. Although the inventory/sales ratio is very low, the amount of inflation-adjusted inventory building since second quarter 1994—$59.2 billion, $57.1 billion and $48.1 billion—was the highest since 1984. In addition, tentative signs of labor market softening have merged, in December and January employment growth slowed sharply from its earlier trends, and initial unemployment claims rose. Other sectors of the economy remain strong. Production and aggregate hours worked are rising, export growth remains robust, and business fixed investment continues to increase rapidly.
Although the lags between monetary tightening and economic slowdown are variable, the recent signs of moderating activity are well within the range of historical lags. Stated differently, following a year of funds rate hikes, declining real money balances, and sharp yield curve flattening, signs of slower economic growth should be expected.
Moreover, the recent pattern is very typical of recent monetary-induced shifts from rapid-to-slower economic growth. Monetary tightening initially generates turmoil in financial markets and with a lag slows product demand growth (initially housing and retail sales, particularly sales of durable goods), while production continues to grow rapidly and inventory building rises based on expectations of continued strong product demand. Thus, GDP growth is initially unchanged by the slowdown in final sales. In the past, businesses have taken several quarters to respond to slower product demand and pare back production schedules to achieve lowered desired inventory building.
Whether the rapid pace of inventory building in 1994 will be sustained depends on actual and
expected growth of product demand. From fourth quarter 1993 to fourth quarter 1994, real
54 Digitized for FRASER http://fraser.stlouisfed.org/ Federal Reserve Bank of St. Louis

Shadow Open Market Committee
consumption grew 3.5 percent and domestic final sales 3.8 percent, while businesses boosted
production and increased inventory building contributed another 0.6 percent to real GDP growth.
These trends will not be sustained.
In 1995, consumption is projected to decelerate to 2.5-3.0 percent and inventory building will
decline, subtracting from GDP gfowth. The slower pattern of consumption will emerge in the first
quarter: real consumption rose 5.1 percent annualized in fourth quarter 1994, but expenditures
began the quarter very strongly and ended weak. Sluggish spending continued in January, pointing
to consumption growth below 3.0 percent in the first quarter. Inventory building will likely
accelerate in the firstquarter, generating real GDP growth above 3.0percent. In response, businesses
can be expected to adjust production and begin to slow inventory building in the second quarter.
Business investment will remain strong in 1995 but decelerate from its 15.1 percent growth rate in
the second half of 1994. Government purchases, which have declined 0.9 percent in the last year,
will remain weak. Residential investment may decline modesdy. Domestic final sales consequently
will growth approximately 2.5 percent compared to 3.8 percent in the last year.
The net export sector, which subtracted significantly from GDP growth in 1993-1994, likely
will be more neutral in 1995-1996, although uncertainty about the magnitude of the negative impact
of the broadening Mexican debt crisis on U.S. exports introduces a wildcard to the outlook. Import
growth will decelerate significantly from its recent 15 percent growth rate with softening domestic
demand. Exports, which have risen 11.6 percent in the last year, should receive an added boost
from the stronger economies in Europe and Japan. However, this favorable trends will be offset
by declining exports to Mexico and weaker exports to Latin America and Canada. In the last three
years, the vast majority of real export growth has been to Latin America and Canada, while real
exports to western Europe have declined. A sharper-than-expected slowdown in exports may
constrain any reduction in the trade deficit and suppress GDP.
Economic growth is expected to decelerate below 2.0 percent in 1996. This continued slowing
trend would be similar to the majority of recent economic slowdowns: once they have begun, real
GDP growth has decelerated for at least two years. The current restrictive posture of monetary
policy points in that direction, and any further Fed tightening would only reinforce that trend. Real
money balances are declining and the decline in interest rates points to lower velocity. Nominal
GDP growth, which peaked year-over-year at 6.8 percent in third quarter 1994, has begun to
decelerate. With inflation pressures mounting, real GDP growth will decline more than current
dollar spending growth will slow. Nominal growth of approximately 5.75 percent in 1995 (it
averaged 6.0 percent in the second half of 1995) would involve 2.5 to 2.75 percent growth in real
55 Digitized for FRASER http://fraser.stlouisfed.org/ Federal Reserve Bank of St. Louis

March 5-6, 1995
GDP and a 3.0 to 3.25 percent rise in the implicit deflator. In 1996, 5.0 percent nominal growth
would suppress real growth below 2.0 percent, leaving inflation as measured by GDP deflator
unchanged from 1995.
The probability of recession in 1995-1996 is low, based on the current stance of monetary policy and the underlying economic soundness of the private sector. There are no significant imbalances in the economy whose adjustments could interrupt expansion: the burden of business and household debt service costs have receded, inventory-to-sales ratios are low, the banking system is sound, and no potential nasty surprises seem to be lurking.
The changes of an economic hard landing unfolding in 1996-1997 wold rise significantly with further monetary tightening. This would occur if the Fed ignores the lagged impact of monetary policy on the economy and inflation, and hikes rates further in response to either sustained economic strength and/or a rise in inflation.
Inflation pressures are expected to increase modestly, even as real growth moderates. Consumer price inflation is projected to peak at approximately 3.5-3.75 percent, well below the 6.0 percent peak in 1990. Thus, the downward-ratcheting inflation trend that began in 1980 is expected to remain intact. Unit labor cost increases are projected to accelerate to approximately 3.0 percent as the recent cyclical surge in productivity gains slows, while wage compensation accelerates modestly in response to selected pockets of labor market tightness. Certain crude goods and industrial commodity prices have risen sharply. Some of these production cost increases will generate higher product prices in certain industries where demand remains strong. However, the deceleration of current dollar spending generated by the Fed tightening will constrain price increases in other industries and result in squeezed profit margins.
Any rise in inflation is expected to be temporary, as the Fed's monetary policy remains consistent with lower long-run inflation. Inflation is expected to be decelerating during 1996.
FINANCIAL MARKET RESPONSES
Just as real interest rates rose in 1994 with the strong economic performance, they will recede in 1995-1996 as economic growth slows. With lingering inflation pressures, short-term rates will fall faster than bond yields. This steepening yield curve would reverse the flattening that was associated with the strong economic performance.
56 Digitized for FRASER http://fraser.stlouisfed.org/ Federal Reserve Bank of St. Louis

Shadow Open Market Committee
Similar to previous inflection points in economic performance, the first signs of moderating
economic activity have generated a significant decline in interest rates, as financial markets have
adjusted expectations of future monetary policy. The recent declines in interest rates are close in
magnitude to declines around previous episodes of economic slowdown. Interest rates are expected
to decline with further evidence of slower economic growth.
57 Digitized for FRASER http://fraser.stlouisfed.org/ Federal Reserve Bank of St. Louis

Mickey D. Levy, Ph.D. Senior Vice President Chief Financial Economist March 5-6, 1995
NationsBank
NationsBanc Capital Markets. Inc. 7 Hanover Square - 15th Floor New York. NT 10004-2H16 Tel 212 858-5545 Fax 212 858-5741
ECONOMIC AND FINANCIAL PERSPECTIVES
MICKEY D. LEVY CHIEF FINANCIAL ECONOMIST
NATIONSBANC CAPITAL MARKETS, INC.
SHADOW OPEN MARKET COMMITTEE WASHINGTON, DC
MARCH 6,1995
58 A subsidiary of NationsBank Corporation Digitized for FRASER
http://fraser.stlouisfed.org/ Federal Reserve Bank of St. Louis

Shadow Open Market Committee
j — '
QUARTERLY DATA [
1 | 1 Nominal GDP
GDP Domestic Demand Final Sales Domestic Final Sales Disposable Personal Income Consumpticn Residential Investment Business Investment Inventory Investment Government Purchases Exports Imports
| Current Account GDP Deflator Employment Costs "(Private) Unit Labor Costs (Non-Farm) Productivity (Non-Farm) Compensation (Non-Farm) Corporate Profits A/T Operating Profits A/T
1 Net Cash Flow
(c
(a (a
Jaj
MONTHLY DATA
j Purchasing Managers Index Non-Farm Payrolls Manufacturing Payrolls
1 Unemployment Rate | Average Workweek (sa) 1 Avg. Hourly Earnings (sa)
(b) <b] <cj
1 Total Vehicle Sales, incl. Lt. Trucks Domestic Unit Auto Sales Industrial Production
| Capacity Utilization
I PPI Q PPI Ex. Food & Energy J CPI J CPI Ex. Food & Energy I Retail Sales 1 Housing Starts
Permits Federal Budget Surplus/Deficit Durable Goods Orders Manufacturing Orders Personal Income ($) Consumption ($87)
I Personal Saving Rate | Leading Economic Indicators | Total Business Inventories | Inventory/Total Sales I International Trade I 3 Month Bill I 2 Year Note I 10 Year Note | 30 Year Bond { DJIA 1 S&P500 I U.S. Dollar (FRB) I Yen/S | DM/$
0 M1
8 M2 | Bank reserves j C&l Loans & Non-Financial CP I Consumer Credit
(e] (e]
<d)
(c
(c
Jfe (c (c (c (c
s j N A P Levels T
1993 1994 •1-94 Q2-94 Q3-94 Q4-94 ]
65747 5261.1 5365.1 5235.7 5339.7 3779.2 3546.3 229.9 643.6 25.4
919.9 619.6 723.6 -32.3 125.0 120.8 137.9 117.9 162.6 299.4 324.1 572.2
6689.9 5314.1 5425.8 5254.9 5366.6 3811.5 3557.8
233.8 657.9
59.2 917.1 643.9 755.6 -37.9 125.9
" 121.8 ~ 138.9 117.2 162.9 321.4 344.8 582.3
6791.7 5367.0 5484.0 5310.0 5426.9 3840.9 3584.7
230.2 680.0
57.1 932.0 666.5 783.5 -41.7 126.5 122:8 138.9 118.2 164.1 329.5 347.4 591.7
6886.1 5427.2 5536.8 5379.1 5488.7 3912.6 3629.1
230.6 705.9 48.1
923.0 697.8 807.4
NA 126.9 123.6 139.5 118.7 165.6
NA NA NA I
Levels "|
Nov-94 g j £ p jin-95 FeWS 59.9
114.882 18.183
5.6 34.6
11.23 15.4 7.4
120.4 84.8
121.5 | 137.8
149.8 158.3 192.6 1536 1355 -37.5 159.3 293.7
5842.5 3635.6
4.6 102.3 918.4
1.39 I r10.0
5.40 7.15
I 7.96 8.08
1 3792.4 461.01
87.7 98
1.54 1147.5 3608.6 59401 802.5
I 903.8 d t a S K s e s a n
57.5 115.092
18.218 5.4
34.6 11.25
15.6 7.7
121.4 85.4
121.8 138.1 150.1 158.5 192.9 1527 1421 -4.1
162.3 299.5
5885.2 3638.5
4.7 102.5 921.0
1.37 -7.3 5.80 7.59 7.81 7.87
3770.3 455.19
89.6 100
1.57 1147.8 3613.1 59342 811.1 911.2
5 7 S ^ 115.226
18.257 5.7
34.9 11.32
14.9 7.0
121.9 85.5
122.6 138.6 150.6 159.2 193.2 1377 1299 15.1
164.0 301.3
5935.3 3638.8
NA 102.5
NA NA NA
5.98 7.51 7.78 7.85
3872.5 465.25
88.3 100
1.53 1148.8 3626.4 59124
NA NA
P X j NA NA j NA NA NA NA NA NA NA NA NA NA NA NA NA NA NA NA NA NA NA NA NA NA NA NA NA NA NA NA
3953.7 481.94
NA NA NA NA NA
58909 NA NA
S H O T = O E =
Quarterly % Change (annualized) I 1993 1994
Q1-94 Q2-94 Q3-94 Q4-94 I
61 3.3 5.0 2.2 3.9 3.4 4.7
10.0 10.9 N/A
-4.9 -3.5 9.5
-1.7 2.9 3.0 3.0
- 3.1 6.1
-3.5 -5.3 1.2
- 7 2 4.1 4.6 1.5 2.0 3.5 1.3 7.0 9.2 N/A
-1.2 16.6 18.9 -5.6 2.9 3.4 2.9
-2.4 0.7 7.3 6.4 1.8
~B2 4.0 4.4 4.3 4.6 3.1 3.1
-6.0 14.1 N/A 6.7
14.8 15.6 -3.8 1.9 3.3 0.0 3.5 3.0 2.5 0.8 1.6
5.8 4.6 3.9 I 5.3 4.6 7.7 5.0 0.7
16.1 N/A
-3.8 20.1 12.8 NA 1.3 2.6 1.7 1.7 3.7 NA NA NA I
Monthly % Change
_________ 0 3 — 534 41
-0.1 -0.9 -0.2 1.0 3.3 0.8 0.5 0.6 0.1 0.1 0.2 0.4 5.9
-2.6 0.9 3.4 2.7
-0.0 0.6 0.2 0.1 0.5
-0.01 0.1
1 O l 0.42 0.22 0.14 -2.0 -0.6 1.2
-0.3 1.3
-0.1 0.0
-0.2 0.9
I 1.4
c-94 Jan-95 Fe SS5S 07
210 35
-0.2 0.0 0.2 1.0 3.2 0.8 0.7 0.4 0.3 0.2 0.1 0.2
-0.6 4.9 3.6 1.9 2.0 0.7 0.1 0.1 0.2 0.3
-0.02 2.7
0.40 0.44
-0.15 -0.21
-0.6 -1.3 2.2 2.2 2.1 0.0 0.1
-0.1 1.1 0.8
134 39 0.3 0.9 0.6
-4.6 -8.3 0.4 0.1 0.3 0.2 0.3 0.4 0.2
-9.8 -8.6 -0.1 1.1 0.6 0.9 0.0 NA 0.0 NA NA NA
0.18 -0.08 -0.03 -0.02
2.7 22
-1.5 -0.5 -2.6 0.1 0.4
-0.4 NA NA
b-95 I -S.9 NA NA NA I NA NA NA NA NA NA NA NA NA NA NA NA NA NA NA NA NA NA NA NA NA NA NA NA NA NA NA 2.1 3.6 NA NA NA NA NA
-0.4 NA NA
= = s a
YHo-Yr% Change 1993 1994
Q1-94 Q2-94 Q3-94 Q4-94 I 5T~~ 3.7 4.5 3.5 4.4 3.3 3.8 9.3
14.9 N/A
-0.7 5.2
11.9 -12.5
1.7 3.3 0.3 3.1 3.4 9.7
14.6 12.6
6T~ 4.1 4.9 3.3 4.1 3.0 3.4
13.3 13.2 N/A
-1.3 7.3
12.8 -12.3
2.0 3.3 0.6 2.4 3.0
12.9 14.4 10.8
tt~ 4.4 4.9 3.6 4.1 3.6 3.2 9.1
13.7 N/A 0.0
12.0 15.0
-13.9 2.3 3.3 0.9 2.2 3.0
14.1 7.4 9.5
12 Month % Change
~6T] 4.0 1 4.5 1 3.3 3.8 4.4 3.5 I 2.7
12.5 N/AI
•0.9 11.6 14.1 NA 2.3 I 3.1 1.9 1.5 3.4 NA NA NA I
H ~n Nov^94"~Dec-94 ~Jalv95 ~Tefr95 "^1 10.3 3.16 1.33 -0.9 0.0 2.7 5.4 4.3 5.9 3.0 2.1 1.6 2.6 2.8 7.7 9.6 -0.6
I -189.7 I 14.1
11.8 6.6 3.6 0.6 2.7 6.0
-0.04 -2.5
1 55T 2.99 2.24 1.87 3.2
-0.4 •8.1 -9.1 -9.5 2.2 0.9
-1.5 8.4
I 15.0
m 3.12 1.54 -1.0 0.3 2.6 6.9 9.0 5.8 3.0 2.7 1.6 2.6 2.7 6.9 -4J -3.6
-186.1 13.9 12.5 6.7 3.5 0.9 2.2 6.4
-0.05 -2.8 2.65 3.38 2.04 1.62 0.7
-2.3 -6.4 -8.9 -8.1 1.7 0.8
-1.9 8.7
14.7
2 T ^ 3.15 1.61 -1.0 0.3 2.7
-2.3 -4.0 6.3 3.4 2.9 1.5 2.9 2.9 8.0 8.8
-6.7 -186.2
10.4 10.5 8.2 3.3 NA 2.0 NA NA NA
2.90 3.37 2.03 1.56 0.1
-1.6 -8.5
-10.5 -12.2
1.4 1.0
-2.4 NA NA
-2.5 NA NA NA NA NA NA NA NA NA NA ! NA NA NA NA I NA NA NA NA NA NA NA NA NA NA NA NA NA NA NA NA, 1.2 2.2 NA NA NA NA NA
-3.1 NA NA»
(b) Monthly changes are In levels (c) All changes are Hi levels or basis points (d) Monthly: change from same month last year, Annual: sum of past 12 months (e) Levels and 12 month % changes are not seasonally adjusted
03/03/95
59
Mickey D. Levy, Chief Financial Economist Peter E. Kretzmer. Economist Digitized for FRASER http://fraser.stlouisfed.org/ Federal Reserve Bank of St. Louis

March 5-6,1995
MONETARY THRUST AND DOMESTIC DEMAND
Real M1 (yr/yr % change)
i i i i i i i i i i i i \ i i i » i i i i \ i r 68 70 72 74 76 78 80 82 84 86 88 90 92 94
Spread of 10-Yr T-Bond minus Federal Funds Rate
i i i i i i i i i i i i i i i i i i i i 70 72 74 76 78 80 82 84 86 88 90 92 94
Real Domestic Demand (yr/yr % change)
68 70 72 74 76 78 80 82 84 86 88 90 92 94
60 Digitized for FRASER http://fraser.stlouisfed.org/ Federal Reserve Bank of St. Louis

Shadow Open Market Committee 03/03/95
Chart 1
1800 1600 1400
g 1200 3 1000
800
600 400
Signs of Moderating Economic Growth
Housing Activity
^ ,*»»»«*»*\+»»*~*»*»++ i i i u.
93 94 95
• New 1-Family Homes Sold, U.S. (SAAR. Thous.)
— Housing Starts, Total (SAAR. Thous.)
Conference Board Consumer Confidence
100
90
S 80
70
60 93 94 95
— Conference Board Index: Expectations (SA)
Retail Sales NAPM
94 95
-Total Retail Sales. Mth/Mth % Change
62
60
58
•flj 56
_i 54
52
50
48
' ^ s^~\ • . ,4. /~^ ^ *\ I \ / * I
\ \ f u ; : ^ I i
L_i—i t i i i . i i i i i i 1 i i i, i » i i i i i i 1 i i 1
93 94 95
— Nat'l Assoc, of Purch. Mgrs. Survey-Composite Index
Non-Farm Payroll Employment
400
S 200
0
•200
' r^k
4 klJluill n 1 1 1 '! '
93 94 9
•Monthly Changes, in 1000s
—Three Month % Change
5
4.0% CO
Change in Real Inventories
3.0% ~
2.0% |
1.0% I CO
0.0% r ° l
80
60
40
20
93 94 95
— Change in Business Inventories (Bil $87)
61 NationsBanc Capital Markets, Inc.
Digitized for FRASER http://fraser.stlouisfed.org/ Federal Reserve Bank of St. Louis

March 5-6, 1995 03/01/95
Chart 2
Signs of Continuing Economic Strength
Aggregate Hours Worked Real Disposable Personal Income
93 94 95
—Average Weekly Hours, Yr/Yr % Change
Real Consumption
93 94 95
— Personal Consumption Expenditures, Yr/Yr % Change
Profits
- Corporate Profits after tax w/IVA & CCADJ. SAAR. Yr/Yr
— Corporate Net Cash Flow, SAAR. Yr/Yr % Change
93 94 95
— Disposable Personal Income, Yr/Yr % Change
Business Fixed Investment
18
16
« £ 14 a.
12
10 93 94 95
— Nonresidential Fixed Investment, Yr/Yr % Change
Exports
760 740 720
J 700 .3 680
660 640 620
! '• '
i
I I r/ .
/ / \ ! \ / \ \
f /? 1 -1 I / \ / ~T ! J
I_J 1 1 1 1 1 1 1 1 _i 1—
14% 12% 10% ~ 8% 2 6% °-4% 2%
93 94 95
— Exports: Goods & Services, BOP Basis $Bil
—Yr/Yr % Change
62 NationsBanc Capital Markets. Inc. Digitized for FRASER
http://fraser.stlouisfed.org/ Federal Reserve Bank of St. Louis

03/03/95
Chart 3
Indicators of Structural Soundness
Household Debt Burden
19
18
c 17 <D
H <D
a. 16
15
\A
—
i i i _ l _ l L_
...
1 1, > i. t 1 I t 1 i , ! • • ! i
• -
t , 1 1
^ X
i 1 1 1 1 1 1 t 1
84 85 86 87 88 89 90 91 92 93 94 95 96
—Total Debt Service Payments, % of Disposable Personal Income
Inventory-to-Sales Ratio
84 85 86 87 88 89 90 91 92 93 94 95 96
—Inventory-to-Sales Ratio: Total Business (SA)
Growth of Domestic Nonfmancial Debt
84 85 86 87 88 89 90 91 92 93 94 95 96
—Federal Debt, SA, Y rm % Change —Non-federal Debt, SA Yr/Yr % Change ^
Selected International Comparison
U.S. U.K. Japan Germany OECD G-7
Unit Labor Costs' 1985 1993
91.4 100.0
70.7 107.0
90.1 206.5
74.2 173.8
NA NA
NA NA
Unemployment Rate 5.7 8.5 2.8 8.2 11.12 6.92
Per Capita GDP3 22,381 16,784 24,818 21,161 16,687 NA
1) Manufacturing unit labor costs. Index=100 for United States in 1993. 2) OECD Standardized Unemployment Rate for 1994 3) Per capita GDP in U.S. 1990$.
NationsBanc Capital Markets, Inc. Digitized for FRASER http://fraser.stlouisfed.org/ Federal Reserve Bank of St. Louis

March 5-6, 1995 03/01/95
O) c
O
ca
> O
IB 3
Chart 4
Selected Indicators of Inflation
Consumer Price Index Producer Price Index
89 90 91 92 93 94 95 96
- C P I - U , All items (SA)
— CPI-U, All items ex. food & energy (SA)
8
(o 6
? 4
i. 2
§ & 0
I n ii ii i n i i n i m i i i m i m i l n m m u m i n it
90 91 92 93 94 95 96
- P P I - U , All items (SA)
— PPI-U, All items ex. food & energy (SA)
GDP Deflators
89 90 91 92 93 94 95 96
- GDP Fixed Weight Deflator — GDP Implicit Deflator
8% ng
e
£ o k .
§ >r i § O
ear-
>-
7%
6%
5%
4%
3%
2%
Employment Costs
^ *+** ^ v
89 90 91 92 93 94 95 96
— Compensation, Pvt Industry —Wages, Pvt Industry
* Benefits, Pvt Industry
Commodity Prices NAPM: Survey of Prices
20 a> c -c 10 O
I ? -10 5
-20
\MA : ^ i !
IM -
JFAA ' ' r / \ • '
' 1 J1/7 Y\V\ Z 2 / \ / I T»* ' i
: i ! : ! ! 1 ! ' i ! ' 1 ! !
L -.iiAii.it 11111 i 11111111 u n 1111 n 11111 n 111 n n i m n 11 u 111111111111111111 M 1111111111
89 90 91 92 93 94 95 96
• CRB Spot Market Index - CRB Futures Price Index
— JOC Industrial Price Index
100
80
60
40
20
i I I ! I A
\ J }
i i i i i i i i in i
! i i I
| A f / ! ! 1
J *
""" """" j
L_J
89 90 91 92 93 94 95 96
— NAPM Survey-Diffusion Index, Prices, SA, (%)
64 NationsBanc Capital Markets, Inc. Digitized for FRASER http://fraser.stlouisfed.org/ Federal Reserve Bank of St. Louis

Shadow Open Market Committee
Chart 5
Selected Interest Rates and Yield Spreads
03/02/95
65 66 87 88 69 90 91 92
30 Yaar Treasury Bond - • - 5 Yaar Treasury Not* — 2 Yaar Treasury h
94
68 69 90 91 92
30 Yaar Treasury Bond minus 2 Yaar Treasury Nota
65 68 89 90 91 02
2 Yaar Treasury Nota minus Fsdaral Funds Rata
93
65 NabonsBanc Capital Marfcsto. Inc.
Digitized for FRASER http://fraser.stlouisfed.org/ Federal Reserve Bank of St. Louis

Table 1
FEDERAL RESERVE OBJECTIVES AND MONETARY POLICY
I. Federal Reserve Objectives and Actual Performance Selected Economic Variables, Percent Change
Central Tendency Forecast * Actual Performance Q4:93 - Q4:94 Q4:94 - Q4:95 Year/Year Last 2 Qtrs.
Real GDP 3% to 3.25% 2.0% to 3.0% 4.0% 4.2% CPI Inflation 2.75% to 3% 3.0% to 3.5% 2.7% 2.9% Nominal GDP 5.5% to 6% 5.0% to 6.0% 6.4% 6.1% Unemployment Rate (4th Qtr) 6% to 6.25% about 5.5% 5.6%, Q4:94
||. The Fed's Money Supply Targets and Actual Trends
Money Supply Targets * Annualized % Change Q4:93 - Q4:94 Q4:94 - Q4:95 Last 3 Months Last 6 Months Yr/Yr
Bank Reserves Not Targeted M1 Not Targeted M2 1%to5% 1%to5% M3 0% to 4% 0% to 4% Debt 4% to 8% 3% to 7%
'Source: Board of Governors of Federal Reserve System, 1994 Monetarv Policy Objectives. July 1994 and February
1995.
-0.5 0.3 2.1 3.9 5.2
-2.4 -0.6 0.5 2.4 5.1
-2.5 1.5 1.0 1.9 5.2
Digitized for FRASER http://fraser.stlouisfed.org/ Federal Reserve Bank of St. Louis

Shadow Open Market Committee 03/03/95
Chart 5A
Selected U.S. Interest Rates
Federal Funds Rate Inflation-Adjusted Federal Funds Rate
o ^ 70 72 74 76 78 80 82 84 86 88 90 92 94 96
Treasury Yields
0 L-" 70 72 74 76 78 80 82 84 86 88 90 92 94 96
- 3 Month Bill - 30 Year Bond
Corporate Spread over Treasuries
i i i — — — i
70 72 74 76 78 80 82 84 86 88 90 92 94 96
— Moody's Baa Corporate - Treasury Composite Yield
70 72 74 76 78 80 82 84 86 88 90 92 94 96
Inflation-Adjusted Treasury Yields
70 72 74 76 78 80 82 84 86 88 90 92 94
- 3 Month Bill - 30 Year Bond
Treasury Yield Spread
76 78 80 82 84 86 88 90 92 94 96
- Spread: 30 Year T Bond - 3 Month T Bill
67 NsttonsBanc Capital Maricete. Inc. Digitized for FRASER
http://fraser.stlouisfed.org/ Federal Reserve Bank of St. Louis

March 5-6,1995
68 Digitized for FRASER http://fraser.stlouisfed.org/ Federal Reserve Bank of St. Louis

Shadow Open Market Committee
THE BALANCED-BUDGET AMENDMENT: TREATING THE SYMPTON BUT NOT THE DISEASE
Charles LPLOSSER William E. Simon Graduate School of Business Administration
University of Rochester
The new Republican Congress has made a balanced-budget amendment to the Constitution a cornerstone of its Contract with America. The text of the proposed amendment as passed by the House is provided as Appendix A. There are at least two levels on which one can discuss the merits of such a proposal. One is purely economic in nature while the other is based on a proposition regarding the outcome of the political process. The real disease faced by Congress is its inability to effectively subject itself to enforceable control mechanisms that limit spending. The Federal deficit is simply one possible way, among many, that this lack of control can manifest itself. Without confronting the spending decisions a cure is unlikely to be found.
HISTORICAL AND INTERNATIONAL PERSPECTIVES ON DEFICITS, SPENDING AND TAXES
Before discussing the pros and cons of balancing the Federal budget it is useful to look at a few facts regarding the nature of the Federal deficit. Chart 1 displays the overall spending by the Federal Government and its broad components as a share of GDP. Total Federal Government outlays have grown from 14.7 percent of GDP in 1950 to 23.7 percent of GDP in 1993. The peak occurred in 1983 when the Government spent 24.7 percent of GDP. This upward trend is also accompanied by a significant change in the mix of expenditures. For example, expenditures on goods and services—of which the largest portion is defense—was at a post-war low of 5.9 percent of GDP in 1947, grew to over 15 percent during the Korean conflict and declined to 6.9 percent in 1993. This is almost identical to the 7.0 percent rate existing in 1950. The component with the most significant increases during this period was transfer payments—rising from about 5.0 percent ofGDPin 1950 to 10.4 percentin 1993. Thus, of the nine percentage pointincrease in Government's share of GDP, 5.4 percentage points are accounted for by an increase in transfers.
On the revenue side of the Federal Government, Chart 2 shows that until about 1975, total
Federal receipts roughly kept pace with outlays—rising from 17.6 percent of GDP in 1950 to 20.1
percent in 1974. Since 1974 Federal Government receipts have fluctuated between a low of 18.6
69 Digitized for FRASER http://fraser.stlouisfed.org/ Federal Reserve Bank of St. Louis

March 5-6, 1995
percent in 1975 and a high of 21 percent in 1981 and in 1993 represented 20.0 percent of GDP.
Like expenditures, the overall level of receipts masks some important changes in the way in which
the Federal Government raises revenue. For example, in 1950, the corporate profits tax represented
6.0 percent of GDP or about one-third of all Federal receipts. Receipts from individuals represented
a similar amount. By 1993, the corporate profits tax measured only 2.3 percent of GDP—or just
over eleven percent of total receipts—while personal taxes have risen to just over 8.0 percent of
GDP. The decline in tax revenue from corporations largely reflects the decline in corporate profits
as a share of GDP1. Revenue from social insurance contributions has risen almost four-fold from
2.2 percent in 1950 to 8.2 percent of GDP in 1993. It is striking that this amount is now virtually
equivalent to all other tax and nontax receipts from individuals.
The net result of these revenue and spending decisions by Congress has been a budget deficit
that has worsened considerably since 1974. From 1950 to 1974 the Federal budget was on-average
very nearly balanced. The average deficit was just 0.2 percent of GDP. Since 1974 the deficit has
averaged 3.3 percent of GDP. In fact, the size of the budget deficit seems to have been on a
deteriorating trend since about 1970, thanks in part to a series of recessions and the S&L bailout.
When thinking about our budget imbalances and the accumulation of public debt it is
instructive to compare our performance with that of other countries. Charts 4 and 5 show total
government deficits (a consolidation of federal, state and local governments) as a share of GDP
and the similarly constructed deficits for the G-7 countries.2 Chart 4 shows that the government
deficit in the U.S. in 1994 is as low as any of the other countries and substantially lower than the
deficits found in France, Canada, U.K. and Italy. Consolidating governments at all levels in the
U.S. indicates that the total government deficit is much less severe. This, of course, is not a rationale
for our current deficits at the Federal level, but it does suggest that some of the hysteria over our
current budget situation is excessive.
Chart 5 shows that total government debt (federal, state and local) as a share of GDP is
significantly less than that found in Italy, Canada and Japan and only somewhat larger than that
found in Germany, France and the U.K. Interestingly, the debt-to-GDP ratio has risen by 25 per
centage points since 1978 in the U.S., which is a smaller increase than in any other G-7 country
with the exception of the U.K. and roughly equivalent to the increase found in Germany. From this
perspective our "crisis" appears to be less serious than that of other major industrialized countries.
70 Digitized for FRASER http://fraser.stlouisfed.org/ Federal Reserve Bank of St. Louis

Shadow Open Market Committee
Chart 6 shows the gross national savings rates for each of the G-7 countries. Only Canada and the U.K. have lower savings rates. Yet Germany, Italy, France and Japan, which have higher savings rates, also have as large or larger budget imbalances; and Japan and Italy also have larger debt-to-GDP ratios. This suggests that a significant portion of the differences in savings behavior across these countries is not likely to be accounted for by differences in government deficits or indebtedness.
FAILURE TO TREAT THE DISEASE: SPENDING DECISIONS VS. FINANCING DECISIONS
The primary burden government places on the private economy is measured by how much the government spends. The size of the budget deficit reflects a decision regarding how that spending is financed. Whether the government takes the resources from the private sector through taxation or through borrowing as only second-order consequences at best. By focusing attention on whether or not the budget is in balance we fail to focus on the level of spending and the opportunity costs of denying those resources to the private sector.
It is commonly argued that it is important to reduce the budget deficit in order to increase national savings and investment This argument has two basic flaws. First, it assumes that individuals in the economy have two kinds of dollars—savings dollars and consumption dollars. It further assumes that deficit spending uses up savings dollars, thus driving up interest rates and crowding-out private investment, while taxation uses up consumption dollars with little impact on savings and investment The last time I looked at my dollars, however, I couldn't tell the difference between savings dollars and consumption dollars and could easily trade savings for consumption at any time.
Second, this argument ignores the alternative financing arrangement which is to raise taxes. Whether or not deficit spending has a more detrimental effect on savings and investment than an equivalent amount of spending financed by taxation depends on the form of the taxes. For example, the current budget deficit could be eliminated through a tax on capital such as an increase in corporate tax rates or an increase in the capital gains tax or tax on dividends, but it seems highly unlikely that eliminating the deficit in this manner would have a positive impact on savings and investment It could easily make things worse. Thus, setting a goal to balance the budget without addressing the issues of the level and efficiency of spending, or the means by which the balance is achieved (spending cuts versus tax increases and their distortionary impact), may not lead to improved economic decision-making or performance.
71 Digitized for FRASER http://fraser.stlouisfed.org/ Federal Reserve Bank of St. Louis

March 5-6, 1995
It appears from the text of the proposed amendment that there will be a clear bias in favor of
higher taxes and probably higher spending. This arises because Sections 1 and 2 require a three-fifths
majority to engage in deficit spending. On the other hand, revenues and spending can rise together
by a simple majority vote. Thus, this version of the amendment makes it no more difficult than it
currently is to increase spending and taxes. There are no restraints placed on Government spending
or the resources it can extract from the private sector. It only constrains how they are financed.
Nor are there constraints that spending meet the most minimal cost-benefit analysis, so there is no
protection against wasteful or inefficient spending.
There are other reasons to be skeptical of the proposed economic benefits of the proposed
amendment. First, despite recent efforts by Congress, there will be little to prevent it from following
current practice and legislating tax increases on the private sector through unfunded mandates on
state and local governments, or through regulatory requirements on the private sector. Indeed, you
might expect such mandates to increase significantly. These hidden and indirect forms of taxation
and spending can be more costly and detrimental to the economy than the Federal spending they
might replace. In addition, it is already clear from the debates in Congress over whether Social
Security should be excluded from the budget calculations indicates that there will be significant
questions regarding accounting practices and which budget should be balanced. Congress has been
successful on many occasions at redefining the budget by moving certain items "off-budget" when
it was convenient
There is no doubt as well that there will be long and heated debates as to whether or not to
adopt a capital budget. Corporations, of course, use capital budgets to "deficit-finance" investment
projects with significant returns in the future. While adopting this view for government may have
some merit, the debate will quickly evolve into what constitute investment spending and what
doesn't President Clinton's first budget, for example, attempted to make spending programs sound
more attractive by labeling them as investments.
One reason often given to oppose a balanced-budget amendment is the idea that deficit
spending plays an important role in stabilizing the economy. The argument is usually presented
by claiming that deficit spending is an important means of increasing consumption demand in times
of recession thereby helping the economy recover. This is not a very compelling argument It rests
on the same flawed analysis that assumes that deficit spending comes from dollars committed to
savings and that monies spent by government either in the form of expenditures on goods and
72 Digitized for FRASER http://fraser.stlouisfed.org/ Federal Reserve Bank of St. Louis

Shadow Open Market Committee
services or as transfers to individuals and consumption dollars. Most modern theories of fiscal policy cast serious doubt on the stimulative effects of this view of government spending as an automatic stabilizer.
Thus the economic case for requiring the Federal Government to balance a budget through a Constitutional amendment is not a compelling one as long as it fails to address the issue of limiting spending and removing the biases in the tax code that discourage savings and investment
IS THERE A POLITICAL CASE FOR A BALANCED-BUDGET AMENDMENT?
The primary justification for a balanced-budget amendment seems to arise not on economic grounds, but on the basis of a political argument. The argument appears to go something like this: By making it much harder to deficit-finance wasteful spending, and thus forcing Congress to raise taxes explicitly to pay for their programs, the political pressure will be such that members of Congress will dramatically reduce Federal spending rather than be exposed to taxpayer scrutiny of its expenditures. This seems a roundabout and dubious way of controlling spending. In the early 1980's there were arguments made that the tax cuts proposed by President Reagan would force spending cuts because Congress would be so horrified by the prospect of large deficits that it would actually end up cutting expenditures. Obviously, those forecasts proved to be less than accurate. While members of Congress may have a greater aversion to tax increases than deficits, this seems a thin reed on which to justify an amendment to the Constitution. (This is not to say that all other amendments to the Constitution have had a firmer foundation: Prohibition is one that comes to mind.)
Cutting Government spending requires more resolve and better controls than it does Constitutional amendments. The Republicans are already aggressively pressing the case without the amendment They seem to be actively engaging the issues of spending priorities. A line-item veto is likely to have a more significant impact on controlling expenditures than a balanced-budget amendment. But, that too, may have undesirable side-effects that result in Congress and the President simply trading for their respective spending initiatives. Another initiative that has some appeal is the efforts to make Congress abide by the same set of rules and regulations they impose on the rest of the economy. While these are small steps in the right direction, the Congress has been notoriously unsuccessful at self-monitoring. There is not much hope that a balanced-budget amendment will be much more than symbolic.
73 Digitized for FRASER http://fraser.stlouisfed.org/ Federal Reserve Bank of St. Louis

March 5-6, 1995
Appendix A
104th Congress
1st Session
House Joint Resolution 1
JOINT RESOLUTION
Proposing a balanced-budget amendment to the Constitution of the United States.
Resolved by the Senate and House of Representatives of the United States of America in Congress assembled That the following article is proposed as an amendment to the Constitution of the United States, which shall be valid to all intents and purposes as part of the Constitution when ratified by the legislatures of three-fourths of the several States within seven years after the date of submission to the States for ratification.
ARTICLE
SECTION l. Total outlays for any fiscal year shall not exceed total receipts for that fiscal year, unless three-fifths of the whole number of each House of Congress shall provide by law for a specific excess of outlays over receipts by a rollcall vote.
SECTION 2. The limit on the debt of the United States held by the public shall not be increased, unless three-fifths of the whole number of each House shall provide by law for such an increase by a rollcaU vote.
SECTION 3. Prior to each fiscal year, the President shall transmit to the Congress a proposed budget for the United States Government for that fiscal year in which total outlays do not exceed total receipts.
SECTION 4. No bill to increase revenue shall become law unless approved by a majority of the whole number of each House by a rollcall vote.
SECTION 5. The Congress may waive the provisions of this article for any fiscal year in which
a declaration of war is in effect The provisions of this article may be waived for any fiscal year in
which the United States is engaged in military conflict which causes an imminent and serious
military threat to the national security and is so declared by a joint resolution, adopted by a majority
of the whole number of each House, which becomes law.
74 Digitized for FRASER http://fraser.stlouisfed.org/ Federal Reserve Bank of St. Louis

Shadow Open Market Committee
SECTION 6. The Congress shall enforce and implement this article by appropriate legislation,
which may rely on estimates of outlays and receipts.
SECTION 7. Total receipts shall include all receipts of the United States Government except
those derived from borrowing. Total outlays shall include all outlays of the United States Gov
ernment except those for repayment of debt principal.
SECTION 8. This article shall take effect beginning with fiscal year 2002 or with the second
fiscal year beginning after its ratification, whichever is later.
Passed January 26,1995.
75 Digitized for FRASER http://fraser.stlouisfed.org/ Federal Reserve Bank of St. Louis

March 5-6, 1995
NOTES
*In 1950 befone-tax corporate profits amounted to 15 percent of GDP. In 1993 this figure was 7.3 percent. The lowest figure was realized in 1985 when bef ore-tax profits amount to just 5.6 percent of GDP.
^ e OECD, in constructing these figures for the U.S., nets out the expenditures and the revenues of the Resolution Trust Corporation (RTC).
76 Digitized for FRASER http://fraser.stlouisfed.org/ Federal Reserve Bank of St. Louis

Shadow Open Market Committee
Chart 1 FEDERAL GOVERNMENT EXPENDITURE PATTERNS
AS A SHARE OF GDP
o.oo J:
Chart 2 FEDERAL GOVERNMENT REVENUE PATTERNS
AS A SHARE OF GDP
1111 M 111 11 11 i M i 11111111111 11 111 1111111
50 55 60 65 70 75 80 85 90 95 50 55 60 65 70 75 80 85 90 95
0.06
0.04
0.02
0.00
-0.02
-0.04
-0.06
Chart 3 FEDERAL DEFICIT AS A SHARE OF GDP
(I I I
V \j
r V V
\ A , V/v
s A v\ A A / J
.
\ V c J \ i \ V
Chart 4 TOTAL GOVERNMENT DEFICITS AS A SHARE OF GDP
Source: OECD
-0.04
50 55 60 65 70 75 80 85 90 95
-0.08
-0.12
Charts TOTAL GOVERNMENT DEBT AS A SHARE OF GDP
Source: OECD
Chart 6 GROSS NATIONAL SAVINGS RATES
Source: OECD
0.40
78 80 82 84 86 88 90 92 94
77 Digitized for FRASER http://fraser.stlouisfed.org/ Federal Reserve Bank of St. Louis

March 5-6, 1995
Table 1 U.S. Federal Government Expenditures
As a Share of GDP
Date Total Expenditures Goods and Services Transfers Net Interest State & Local 1946 1947 1948 1949 1950 1951 1952 1953 1954 1955 1956 1957 1958 1959 1960 1961 1962 1963 1964 1965 1966 1967 1968 1969 1970 1971 1972 1973 1974 1975 1976 1977 1978 1979 1980 1981 1982 1983 1984 1985 1986 1987 1988 1989 1990 1991 1992 1993 1994 1995
17.70% 13.21% 13.36% 16.22% 14.69% 17.71% 20.35% 20.65% 19.00% 17.06% 16.97% 17.92% 19.35% 18.87% 18.20% 19.12% 19.34% 18.96% 18.33% 17.73% 18.83% 20.29% 20.41% 19.91% 20.63% 20.44% 20.66% 20.03% 20.95% 22.97% 22.21% 21.60% 21.02% 20.91% 22.64% 23.03% 24.48% 24.67% 23.63% 24.02% 24.09% 23.47% 22.63% 22.50% 22.99% 23.26% 24.27% 23.76%
9.23% 5.87% 6.35% 8.11% 7.03% 11.75% 14.97% 15.34% 13.21% 11.43% 11.15% 11.50% 11.88% 11.56% 10.76% 11.01% 11.45% 11.01% 10.41% 9.88% 10.56% 11.40% 11.15% 10.48% 9.90% 9.11% 8.85% 8.04% 8.06% 8.16% 7.68% 7.49% 7.26% 7.21% 7.72% 7.95% 8.46% 8.57% 8.23% 8.52% 8.62% 8.48% 7.90% 7.65% 7.69% 7.79% 7.46% 6.99%
5.37% 4.61% 4.42% 5.36% 5.01% 3.52% 3.11% 3.11% 3.61% 3.58% 3.59% 3.93% 4.71% 4.44% 4.56% 5.10% 4.85% 4.82% 4.63% 4.60% 4.63% 5.20% 5.41% 5.48% 6.30% 6.87% 6.92% 7.13% 8.11% 9.47% 9.21% 8.79% 8.34% 8.43% 9.30% 9.48% 10.25% 10.21% 9.36% 9.37% 9.33% 9.08% 8.90% 8.98% 9.27% 9.12% 10.39% 10.37%
1.84% 1.74% 1.58% 1.65% 1.52% 1.33% 1.28% 1.23% 1.25% 1.14% 1.20% 1.24% 1.14% 1.24% 1.32% 1.18% 1.18% 1.21% 1.24% 1.20% 1.19% 1.21% 1.27% 1.33% 1.40% 1.26% 1.20% 1.34% 1.42% 1.45% 1.52% 1.47% 1.55% 1.69% 1.95% 2.37% 2.68% 2.72% 2.99% 3.14% 3.07% 3.01% 2.98% 3.14% 3.18% 3.28% 3.10% 2.89%
0.53% 0.75% 0.77% 0.86% 0.82% 0.75% 0.76% 0.77% 0.78% 0.78% 0.79% 0.94% 1.24% 1.39% 1.27% 1.37% 1.40% 1.52% 1.61% 1.58% 1.87% 1.96% 2.09% 2.12% 2.42% 2.64% 3.11% 3.00% 3.01% 3.44% 3.46% 3.42% 3.46% 3.23% 3.27% 2.90% 2.66% 2.56% 2.50% 2.48% 2.52% 2.26% 2.27% 2.25% 2.38% 2.68% 2.86% 2.93%
78 Digitized for FRASER http://fraser.stlouisfed.org/ Federal Reserve Bank of St. Louis

Shadow Open Market Committee
Table 2
U.S. Federal Government Receipts As a Share of GDP
Date Total Receipts Payments by Individuals Corporate Profits Tax Social Insurance Indirect Business Taxes 8.12% 4.08% 3.35% 3.74% 8.39% 4.55% 2.57% 3.39% 7.30% 4.51% 1.99% 3.11% 6.22% 3.69% 2.17% 3.14% 6.30% 5.97% 2.19% 3.11% 7.88% 6.54% 2.25% 2.84% 8.87% 5.32% 2.22% 2.97% 8.72% 5.27% 2.11% 2.96% 7.82% 4.54% 2.35% 2.64% 7.77% 5.21% 2.45% 2.65% 8.25% 4.91% 2.63% 2.65% 8.34% 4.54% 2.88% 2.64% 8.09% 3.95% 2.89% 2.55% 8.06% 4.55% 3.18% 2.55% 8.48% 4.18% 3.59% 2.64% 8.38% 4.04% 3.62% 2.58% 8.48% 3.93% 3.77% 2.58% 8.51% 4.08% 4.03% 2.55% 7.48% 4.04% 3.92% 2.52% 7.65% 4.11% 3.79% 2.36% 7.99% 4.08% 4.53% 2.05% 8.26% 3.69% 4.77% 2.02% 8.92% 4.05% 4.86% 2.05% 9.87% 3.76% 5.17% 2.00% 9.13% 3.03% 5.24% 1.92% 8.20% 3.05% 5.35% 1.87% 8.93% 3.03% 5.59% 1.67% 8.47% 3.21% 6.27% 1.59% 8.97% 3.09% 6.58% 1.51% 7.91% 2.75% 6.41% 1.53% 8.29% 3.09% 6.50% 1.34% 8.56% 3.12% 6.47% 1.30% 8.68% 3.20% 6.59% 1.29% 9.23% 2.99% 6.85% 1.21% 9.46% 2.60% 6.90% 1.46% 9.81% 2.17% 7.22% 1.89% 9.62% 1.56% 7.42% 1.58% 8.59% 1.80% 7.42% 1.57% 8.15% 1.99% 7.54% 1.53% 8.49% 1.89% 7.70% 1.45% 8.37% 1.96% 7.79% 1.25% 8.82% 2.27% 7.74% 1.29% 8.37% 2.27% 7.97% 1.24% 8.80% 2.23% 7.97% 1.18% 8.73% 2.10% 8.02% 1.19% 8.31% 1.89% 8.12% 1.40% 8.13% 1.92% 8.17% 1.35% 8.20% 2.25% 8.16% 1.33%
1946 1947 1948 1949 1950 1951 1952 1953 1954 1955 1956 1957 1958 1959 1960 1961 1962 1963 1964 1965 1966 1967 1968 1969 1970 1971 1972 1973 1974 1975 1976 1977 1978 1979 1980 1981 1982 1983 1984 1985 1986 1987 1988 1989 1990 1991 1992 1993 1994 1995
19.26% 18.91% 16.90% 15.25% 17.58% 19.51% 19.38% 19.05% 17.34% 18.10% 18.44% 18.41% 17.48% 18.33% 18.89% 18.61% 18.75% 19.15% 17.93% 17.91% 18.64% 18.74% 19.89% 20.80% 19.32% 18.46% 19.22% 19.54% 20.16% 18.59% 19.22% 19.45% 19.76% 20.28% 20.42% 21.08% 20.17% 19.38% 19.22% 19.53% 19.38% 20.13% 19.84% 20.17% 20.04% 19.72% 19.57% 19.95%
79 Digitized for FRASER http://fraser.stlouisfed.org/ Federal Reserve Bank of St. Louis

March
5-6
, 1
99
5
JQ
O
O
CD
Q
JD
O
Q
o
Q
JD
©
Q
©S
oS
oS
sS
oS
eS
.oS
oS
aS
gS
SS
^S
S^
se
.SS
s?
oo
oo
oo
oo
oo
oo
oo
oo
o
CO
O)
r;
fO
O)
0)
^N
r;
(q
MN
(D
(n
(M
r-
(0
00
^'
t'• *t
CM
CM
•ofr C
M r-"
CO
CM
CO
^
"
lO
lO
Wl
Oi
Ol
Ol
Ol
fl
iO
* -
- —
—
CO
CM
CO
^"
IO^
-t
^-
<r
-
^©
^o
^^
o^
^^
^^
SS
^g
?^
^^
^^
ooooooooooooooooo
^co^cqiqcoo^oq^-^ogjCMr^CMi^co
kf-' co"
co CM*
CM' ri n CM* oi r ^ o r-' N © s ©
•
••
••
••
••
t
**—'
••
•f
t
xP
x
P s
P x
P
XP
X
P
XP
X
P
XP
X
P
XP
X
P
XP
X
P
SP
X
P
_ ©
^ ©
^ ©
^ 0
s er»
©^
©^
©** ©"»
©^
©^
©"» 0
s ©^
©*• ©
^
OO
OO
OO
OO
OO
OO
OO
OO
O
qO
OC
00
)(
00
)N
(0
0)
C0
<D
C0
Nr
-N
S ^
Nf
si
cD
dt
dN
od
N^
Nd
oS
Nr
-'
fO
CO
gg
g©
$g
o$
oS
g©
S©
S©
$©
S©
S©
S£
^©
S
oo
oo
oo
oo
oo
oo
oo
oo
o
lO
I^
^O
OC
OC
O^
OO
CO
lo
lo
lo
CD
OO
OC
NO
ip
^^
CO
CO
CO
CM
OO
b^
CM
rM
CO
^O
CV
©S
©$
oS
©S
©S
©S
©S
©S
©$
©S
©$
©s
gg
gg
g
OO
OO
OO
OO
O
OO
Ou
wi
_>
wi
->
<_
Ji
_>
<-
>U
Ln
n^
^*
. '
^•
iq
p'
r-
^r
O^
tC
OC
MC
DO
O)
^^
-W
T
^ O
) r-' ©
CNJ N
(
D(
D
U)
(D
(D
N N
*
• ob
CM ^
K
00
GO O
O
) O)
o
CM
O
P
) T
- r-
P)
O
O <r-
T-
CM
S
oo
go
oo
oo
oo
og
oo
gE
S
^c
Mg
cq
cn
N.c
oc
Dc
^g
o>
CM
gg
g
OO
T-
T-
O^
-C
MT
-T
-O
rt
JO
O,
" o>
r: r: o) o
) o>
xP xP XP XP XP XP XP XP XP XP XP XP XP XP XP SP XP
0s
©"* ©^ 0
s ©^ ©**
o"*
©* ©
,* 0
s 0
s ©**
©*"
0s 0
s ©*•
©"*
o
oo
oo
oo
oo
oo
oo
oo
oo
T
-c
oo
qi
qc
o^
t^
iq
ui
oq
^C
M^
CM
cq
cM
CM
O
OC
>ic
Da
>T
-*
T-'c
MC
MC
O^
CO
CO
T-
:lOO
CO
©^
©5
o5
o5
©5
©?
©?
©5
©5
^©
5^
©5
^^
^^
ooooooooooooooooo
CM
CM
CM
CO
CO
CM
^^
^T
-'C
Mo
CN
CO
CM
CO
CM
* I
I I
I I
I I
I I
I
v-'
I I
I I
I
xP NP xp XP VP xP xp xP xp XP SP XP xp xp sP xP xP
J©
^ ©
^
©^
©
^
©^
©
*• ©
^
©^
©
^
©**
©^
©
^
©^
©
^
©"*
©"*
©^
I
oo
oo
oo
oo
oo
oo
oo
oo
o
IJO
^
0>
^N
WT
-(
Ot
»)
N(
0(
ON
O|
lO
CM
O
rr
OO
^W
Ng
O)
CO
CO
CO
CO
CO
CO
CO
CO
CO
O
O O
O
.
_.
^r
^
•** •*•-*• ^
*
T-
IO
CM
C
D
-~ -^
io tf>
c
I o
e-o
o
E
a
CD
a CD
a o
%
a
©S
©S
^0
$©
$©
S©
$©
$©
$©
$©
S©
$©
$o
S©
S©
S©
$
OO
OO
OO
OO
OO
OO
OO
OO
O
ko s0 xP xP xP xP xP xP xP xP xP xP XP XP XP XP XP
©^ ©"*
0
s ©"*
©^ ©**
©^ O
" ©^ ©^ ©^ ©^ ©^ ©"*
©^ O*"
©*
OO
OO
OO
OO
OO
OO
OO
OO
O
(OCO(OCMP)N5fO)00<O(M00Nr-(ON(q
(d
co
^u
Jd
u)C
ft^
do
io
So
Sc
\id
NC
Niu
)
xP xP xP XP XP XP XP XP XP XP XP XP X
P XP XP XP XP
©** ©**
©^ ©*•
©^ ©^ ©*•
0s ©^ ©**
©^ ©^ ©^ ©^ ©^ ©**
©^
OO
OO
OO
OO
OO
OO
OO
OO
O
CM
OO
OI
OO
OW
CO
^-
OO
IO
OT
-C
OT
-T
-C
M
CO
CM
C^
^I
OC
O'c
O*
CO
'lO
CO
CM
C>
i^
CD
'r^
^C
D
©5©5©5^^^^^^^^o5©5^^^©5
"ooooooooooooooooo
cN
CM
i^
oo
co
pT
^o
pr^
cM
^rc
qc
Mc
oc
q
a^
t^
i^
^T
^c
o^
od
^c
MC
Nc
oin
cb
cM
^r^
^x
^©
?0
^o
5©
5^
o5
^^
^^
^^
^^
^
ooooooooooooooooo
"^p)o^T-o)r^momiocviP)^o
o*o*VT^^^^^ri'ci'Tci'e?,,fc?ri'
5|
00
0)
Or
-(
M(
0^
IO
(D
NC
00
)O
t-
(M
(0
^ .
tS
nS
NC
O0
OC
OC
OC
O0
0C
O0
OC
O0
0O
)O
)O
)O
>m
CJ
) W
||0
) 0
>0
)0
>0
)0
)0
>0
)0
)0
)0
)0
)0
)0
)0
)0
>a
)0
)
o
(0 0
)
a:
0)
I o
CO
CO
CO
CO
•a
c
CO
a.
§
CD
£
CO
•o
3
•S x
CO
A)
|Q
M O
LU
U
J
QO
SI
pr
80
Digitized for FRASER http://fraser.stlouisfed.org/ Federal Reserve Bank of St. Louis

Shadow Open Market Committee
WHAT DOES THE PHILLIPS CURVE TELL US ABOUT THE OUTLOOK FOR INFLATION?
William POOLE* Brown University
When the economy is operating below full capacity, as it was 1991-93, expansionary monetary
policy has two effects, all other things being equal. First, monetary stimulus raises output and
employment above the levels that would have prevailed in the absence of the stimulus. Second,
monetary stimulus raises the inflation rate. The second effect typically lags the first. The Fed
provided a large dose of monetary stimulus in 1992-93; the unemployment rate declined substan
tially last year; is this the year we see rising inflation?
The Federal Reserve has for some years pursued the objective of keeping the inflation rate
from rising, and reducing it when possible, subject to the constraint that employment and output
grow at a modest rate. Because "all other things" do not remain unchanged for long, the Fed has
adjusted monetary policy—the federal funds rate as the Fed defines policy—from time to time to
offset disturbances affecting the economy and to respond to changing demand pressures as the
economy's growth rate is sometimes lower, sometimes higher.
To Fed economists, and to many others, the unemployment rate is a key indicator of demand
pressures that might lead to a change in the inflation rate. The familiar argument, accepted by most
economists, is that in the absence of disturbances the unemployment rate would tend to settle at a
particular equilibrium level, called the "natural rate of unemployment" by some and the "non-
accelerating inflation rate of unemployment (NAIRU)" by others. The natural rate itself changes
over time, for a variety of reasons. The policy issue is whether natural rate theory has enough
empirical content to serve as a reliable guide to monetary policy. That is, do we know enough about
the natural rate that the Fed can compare the current unemployment rate to the natural rate to provide
evidence on when it needs to change its monetary policy needs settings to offset disturbances of
various kinds and normal course of the business cycle? Monetary policy will be a source of instability
if the Fed assumes the natural rate is 5 percent when it is really 6 percent, or vice versa.
The figure suggests that the relationship between inflation and unemployment is anything
but simple, even in hindsight. Interpretation of the unemployment data today is further muddied
by the new survey methods introduced with the unemployment rate reported for January 1994. The
new survey raised the official unemployment rate by several tenths of a percentage point. The BLS
81 Digitized for FRASER http://fraser.stlouisfed.org/ Federal Reserve Bank of St. Louis

March 5-6,1995
ran the old and new surveys side by side for a short time, as shown by the overlapping unemployment rate estimates for 1993 in the figure. We should adjust down the current unemployment rate by something in the order of 0.2-0.4 percentage point to obtain a number comparable to the data for 1948-93.
UNEMPLOYMENT AND INFLATION
For reasons not fully understood, the natural rate was lower in the 1950s than it is today. Putting the speculative inflation of the Korean War period aside, inflation did not tend to rise until 1956-57, at an unemployment rate well below 5 percent. The peak quarterly unemployment rate in the 1953-54 recession was only 6 percent, and the price index actually fell a bit at this time.
For the period after 1960, the most commonly mentioned estimate for the natural rate is about 5 percent in 1960, drifting up to about 6 percent by the mid 1970s, and remaining at about 6 percent today. Vertical lines in the figure, drawn to make it easier to study the association between unemployment and inflation, mark times when the unemployment rate dropped below 6 percent. Inflation started to rise in 1965, but only after unemployment fell below 5 percent. Inflation did not really rise significantly until 1967, after a sustained period with unemployment below 4 percent
In 1973, an unemployment rate in the neighborhood of 5 percent was clearly associated with rising inflation, which was evident before the oil-price shock in October of that year. The unemployment rate dipped just slightly below 6 percent at the end of 1978, but inflation was clearly rising substantially before the 1979 oil price shock added to the inflationary damage. The unemployment rate reached 5.2 percent at the beginning of 1989, and inflation rose moderately until receiving a small extra boost from Iraq's invasion of Kuwait in August 1990.
The unemployment rate is clearly not a reliable indicator of inflationary danger. However, we should not ignore the unemployment rate either. Putting 1950's experience aside, an unemployment rate below 5.5 percent has been associated with rising inflation without exception—mid 1960s, early 1970s,late 1970s,andlate 1980s. Two competing explanations, not mutually exclusive, may explain the variability of the relationship between unemployment and the change in the inflation rate. One is that the natural rate changes due to changes in the demographic structure of the labor force, changes in incentives to gain employment relative to those to remain unemployed, and other similar factors. The second is that the behavior of wages and prices depends importantly on expectations about the future and not just on the current state of demand as measured by the unemployment rate, the capacity utilization rate, and the like.
82 Digitized for FRASER http://fraser.stlouisfed.org/ Federal Reserve Bank of St. Louis

Shadow Open Market Committee
One problem with structural explanations is that there are far too many hypotheses to test with the few data points available. Moreover, it seems unlikely that structural characteristics changed rapidly enough to explain the slow increase in inflation at unemployment rates well below 5 percent in the mid 1960s and the relatively rapid increase in inflation at unemployment rates just below 5 percent in early 1973. Similarly, inflation rose quickly when unemployment fell to 6 percent in 1978, but only slowly when unemployment fell below 5.5 percent in 1989.
An important role for expectations is suggested by the fact that sustained low unemployment is associated with a delayed and modest increase in inflation when the economy has been operating at a stable and relatively low rate of inflation, and when people have confidence in monetary policy. With less confidence, inflation rises sooner, by more, and at a higher rate of unemployment, as in the early and late 1970s. When the expected inflation rate is relatively low, as in the mid 1960s and the late 1980s, inflation is slow to rise at relatively low unemployment rates. When people are confident that inflation will remain reasonably low, the economy can overshoot full employment without immediate inflationary consequences because people believe that the strong demand conditions are temporary and fear that wage and price increases will price them out of markets soon to weaken.
CURRENT CONDITIONS
Over the last year, broad price indexes have not shown signs of rising at higher rate even
though the unemployment rate has declined substantially. However, we should note that on a
quarterly average basis the unemployment rate did not fall below 6.0 percent until the fourth quarter
of last year, or the third quarter if we adjust for the new employment survey.
Given today's substantial confidence in monetary policy, which the Fed has earned and for which it deserves credit, inflation will be slow to rise. However, the Fed will have to retain its restrictive policy if inflation is to remain low. When demand pressures ease, the Fed will be able to bring the federal funds rate down within the context of a monetary policy consistent with inflation at or below current levels. We should expect unemployment to rise from the levels reached early this year.
If inflation remains low over coming months, that fact would not warrant the conclusion that
the natural rate has declined and that the Fed should therefore pursue a more expansionary monetary
policy. The inflation rate has remained low because of the Fed's vigorous actions over the course
of 1994 and not because the natural rate of unemployment has declined. It is because of confidence
83 Digitized for FRASER http://fraser.stlouisfed.org/ Federal Reserve Bank of St. Louis

March 5-6, 1995
in low inflation that the unemployment rate has fallen so much without inflationary consequences.
However, if the Fed takes a more relaxed view of inflation in an effort to keep the unemployment
rate from rising much above current levels, inflation will rise, and confidence in the Fed will decline.
One caveat: Because the economy has overshot full employment, it is vulnerable to
inflationary shocks. A supply shock that would have been easily absorbed with the excess capacity
available in 1993 could not be so easily absorbed in 1995. Confidence in a low-inflation future is
not deeply embedded. A foreign political crisis, a financial crisis in the United States or a major
country abroad, or some other event could trigger an inflationary surge. If we have such bad luck,
we can blame the inflation in part on the shock; but an economy allowed to shoot beyond full
employment should also get some of the blame.
84 Digitized for FRASER http://fraser.stlouisfed.org/ Federal Reserve Bank of St. Louis

Shadow Open Market Committee
NOTES
*I thank Data Resources, Inc. for providing access to its data bank, from which I drew the data for the figures.
lrThe inflation measure in the figure is the annual rate of change of the fixed-weighted deflator for personal consumption expenditures. The unemployment rate is the official BLS series for unemployment in the civilian labor force (i.e., excluding military personnel from both employment and labor force).
85 Digitized for FRASER http://fraser.stlouisfed.org/ Federal Reserve Bank of St. Louis

March 5-6, 1995
Inflation and Unemployment Percent Quarterly, 1948-1994 Percent
86 Digitized for FRASER http://fraser.stlouisfed.org/ Federal Reserve Bank of St. Louis

Shadow Open Market Committee
MONETARY AGGREGATES
Robert H. RASCHE Michigan State University
The starting point for any discussion of the recent behavior of the monetary aggregates is to
recognize that since the late 1980s the Federal Reserve has followed a Federal funds rate targeting
procedure with only a very narrow margin of fluctuation around the established target permitted
by the Desk. This is evidence from Figure 1, which shows the monthly average funds rate and the
end-of-month value of the target established by the FOMC.1
Since the middle of 1990 there have been three distinct periods: July, 1990 until September,
1992 during which there was a succession of reductions in the funds rate target from 8.25 percent
to 3.0 percent; September, 1992 until February, 1994 during which the funds rate was held at 3
percent; and February, 1994 until the present, during which the funds rate target has been succes
sively raised.
The trend in long-term rates (as illustrated by the 10 year Treasury rate in Figure 1 followed
that of the funds rate in the first of the three periods (though with distinct oscillations), continued
during the middle period when the funds rate was stabilized, and has reversed in the last year. In
early 1990 the term structure was almost flat, it became quite steep in the next two years, moderated
somewhat while the funds rate target was maintained, and has not changed much in the past year.
It is noteworthy that long rates bottomed out and started increasing several months before the funds
rate target was raised.
The month-to-month growth rates of Ml and zero maturity money (MzM) are shown in Figure
2, beginning in June, 1991. While the funds target was being reduced the growth rates of both
aggregates were in the double digit range and very similar. After the funds rate stabilized, the
growth rate of Ml remained in excess of ten percent, while the growth rate of MzM dropped to
around five percent on average. Since February, 1994 the growth rates of both aggregates have
dropped precipitously; over the last year the growth of Ml has been slightly positive while the
growth of MzM has been slightly negative.
Associated with the distinct difference in Ml growth are differences in the behavior of Ml
velocity. In Figure 3 it can be seen that in the 1990-92 period while interest rates were falling, Ml
velocity growth went negative. Ml velocity continued to fall while the funds rate was held at three
87 Digitized for FRASER http://fraser.stlouisfed.org/ Federal Reserve Bank of St. Louis
March 5-41995
percent (and while the long-term government rate continued to fall), but immediately started
increasing when interest rates started to rise, and has grown at faster rates the higher the levels of
rates during the past year
This behavior of Ml velocity is consistent with a substantial equilibrium elasticity of the
demand for real balances with adjustment to those equilibrium balances over a period of 1 1/2 to 2
1/2 years. If we take the peak-to-trough decline in long rates as an estimate of the permanent
component of the change in interest rates we find that from 90:3 to 93:4 on a quarterly average
basis the long rate declined from 8.07 percent to 5.60 percent, or approximately 36 percent. Ml
velocity declined over the same period by approximately 17 percent. If we assume that Ml velocity
was somewhere around the equilibrium level associated with nominal interest rates in the 8 percent
range in early 1990, and if we further assume that the equilibrium interest elasticity is on the order
of .5, then the reduction of 17 percent in Ml velocity through the end of 1993 is what would be
predicted in response to a permanent shock to nominal rates of 36 percent Under these assumptions
the fact that Ml velocity started rising at the beginning of 1994 and that the growth rate accelerated
throughout 1994 is a predictable response to the increase in nominal rates over the past year.
The picture painted about is of a largely predictable and endogenous Ml velocity response
to the path of interest rates that was generated by the path chosen for the funds rate target. With
the Fed aggressively pushing short-term rates lower, and to a lesser extent real long-term rates
following, it is not surprising that the recession ended quickly and the economy started expanding.
With accelerating growth in nominal income and falling nominal rates, the demand for nominal
cash balances increased faster than the growth of nominal income through the end of 1993.
In the past year the economy has continued to expend in part in response to the earlier monetary
stimulus. The impact of this continuing growth in nominal income on the demand for Ml balances
has been offset by the sharp increase in nominal rates in response to the Fed's funds rate policy,
with a net effect that the growth in the demand for Ml balances has been reduced to approximately
zero. It is important to note that long-term nominal rates since last September have risen almost to
the levels of late 1989 and early 1990. Ml velocity still remains considerably below its peak
quarterly value in 90:2 of 6.86. If long-term nominal rates remain at current levels throughout 1995,
then it is reasonable to predict a continuing increase in Ml velocity throughout the year. Even if
1995 exhibits slowing real growth and increasing inflation relative to 1994, it remains likely that
M1 growth throughout much of the year will remain sluggish under current Fed policy.2 If long-term
nominal rates continue to fall as they have in recent weeks while the funds rate target is maintained
at the present level, then velocity growth is likely to be slower during 1995, nominal income growth
88 Digitized for FRASER http://fraser.stlouisfed.org/ Federal Reserve Bank of St. Louis

Shadow Open Market Committee
for the rest of the year is unlikely to be much different from what would occur if such rates remained
stable in the 7.8-8.0 percent range, and the growth rates of the narrow monetary aggregates will
accelerate.
From Figure 4 it can be observed that relatively little of the slowdown in Ml growth over the
past year occurred because of changes in the growth rate of the currency component During the
September, 1992-January, 1994 period the growth rates of currency and transactions deposits were
almost identical, which resulted in a very stable currency/deposit (k) ratio (Figure 5). In the past
year, currency growth has slowed, but by only a fraction of the slowdown in deposit growth, and
consequently the k ratio has steadily increased. Presumably the growth rate of currency has been
sustained by continued exports of U.S. currency to support the dollarization of some foreign
economies as well as to pay for imports of illegal drugs. The behavior of the currency/deposit ratio
has been the principal determinant of the differential growth in M1 and the various measures of the
monetary base.
Under the structure of reserve requirements which has been in place since early 1992, the
multiplier relationship between Ml and the monetary base, either as measured by the St. Louis Fed
or by the staff of the Board of Governors is particularly simple. Reserves are required only against
transactions deposits, whether owned by private agents (and included in the deposit component of
Ml) or owned by the U.S. Treasury (and excluded from Ml). Reserve requirements on all other
liabilities of depository institutions have been reduced to zero. As a result, the monetary base
multiplier can be written as:
, 1+* ml = r
r + Jk
where k is the currency/deposit ratio as above, and r is a reserve ratio equal to (1 +g)*rd + e, with
g = the ratio of government deposits to transactions deposits and e = to the ratio of reserve balances
held in excess of required reserves relative to transactions deposits. rd is the required reserve ratio
adjusted for changes in reserve requirements.
Two reserve ratios (r) are shown in Figure 6, rs is the reserve ratio implicit in the St. Louis
monetary base computations, and rb is the reserve ratio implicitin the Board of Governors monetary
base computations. Given the adjustment techniques used, the BoG reserve ratio is very close to
the eight percent marginal reserve requirement currently imposed on transactions deposits at large
banks. Clearly, neither reserve ratio has fluctuated much in the period since late 1992. Given the
stability of both the reserve ratio and the current ratio in the September, 1992-January, 1994 period,
89 Digitized for FRASER http://fraser.stlouisfed.org/ Federal Reserve Bank of St. Louis

March 5-6, 1995
the base multipliers on either concept were quite stable (Figure 7) and the growth rates of both base
concepts were very close to the growth rate of Ml in this period (Figure 8). Since last February,
the multipliers on both concepts dropped rapidly as a result of the increase in the currency/deposit
ratio. Consequently, base growth has fallen over the past year, but by a smaller absolute amount
than the decline in Ml growth.
The differential growth in Ml and MzM that is observed in Figure 2 can be traced to two
factors, the currency/deposit ratio and the ratio of nontransactions deposits included in MzM to
transactions deposits (tz). Using these definitions we have:
Mi =(1+*)*£>
and MzM = (l+Jk + fc)D
where D is total transactions deposits. The ratio of MzM to Ml is given by:
(1+k + tz) tz (1+Jfc) 1+*
Thus the relative growth rates of these two concepts depends upon the behavior of tz relative to 1
The growth of MzM relative to Ml can be attributed to two different sources in the period
when the funds rate was kept at three percent compared to the more recent period. In Figure 7 we
saw that the k ratio was quite stable from September, 1992 through the end of 1993. In contrast,
during the same period the tz ratio fell steadily (see Figure 9), presumably because market yields
on assets such as passbook savings deposits and money market mutual funds had fallen or were
falling significantly relative to the yields on other checkable deposits and relative to longer term
rates as the yield curve became steeper. Since February, 1994, the source of the slower growth of
MzM relative to Ml has been completely reversed. It can be seen in Figure 9 that in the past year
the tz ratio has stabilized and even increased slightly, presumably reflecting an increase in rates on
passbook savings and money market mutual funds relative to the yield on other checkable deposits
and relative to long-term rates as the yield curve has flattened.
The growth rates of the broader monetary aggregates, M2 and M3 are shown in Figure 10.
For both of these aggregates, the growth rates are quite sluggish relative to the growth of the narrower
aggregates during the period of falling funds rate and during the period when the funds rate was
90 Digitized for FRASER http://fraser.stlouisfed.org/ Federal Reserve Bank of St. Louis

Shadow Open Market Committee
stabilized at three percent. Since the beginning of 1994, the average growth rate of M2 has declined
slightly, while that of M3 has increased slightly. Analogous to the MzM situation we can define
the broader aggregates as follows:
M2=(l+k + tz + tl)D
M3=(l+Jk + fc + tf+*2)D
where tl = (M2 -MzM)/D and t2 = (M3 -M2)ID. Under these conditions, the growth rate of M2
relative to MzM is determined by:
(1+k + tz + tl) tl = , and
(1+Jfc + fc) (1+Jk + fc)' the growth rate of M3 relative to M2 is determined by:
(l+k + tz + tl+t2) t2 (l+Jk + fc+£/) " ( l + * + fe + *7)
The time series of the tl and t2 ratios as defined here from September, 1992 to the present
are shown in Figures 11 and 12. Recall that the "new issue" rates paid on both consumer type CDs
and large negotiable CDs follow short-term market rates quite closely.3 At the same time, maturities
on such time deposits, particularly consumer time deposits, can be quite long. When the "new
issue" rate drops sharply relative to the rate on maturing certificates, while the spread between the
rates on these deposits and zero maturity deposits decreases and the spread between the rates on
these deposits and longer term market instruments increases, we should expect that agents will
substitute against these type deposits in adjusting portfolios to the new rate structure. Such portfolio
adjustments will not occur instantaneously because of the illiquidity of the certificates prior to
maturity. Exactly the opposite should occur once the rates on these certificates start following
short-term market rates up and the rate spread relative to zero maturity deposits increases while the
rate spread relative to longer-term market instruments decreases.
This type of behavior is exactly the pattern noted in Figures 11 and 12. Both ratios continued
to fall as long as the funds target was maintained at three percent, and then started increasing almost
immediately after the funds rate target was increased and short-term market rates rose in February,
1994. The increase in the t2 ratio (Figure 12) since February is larger than that of the tl ratio, which
is consistent with a longer average maturity on consumer CDs than on large negotiable CDs.
91 Digitized for FRASER http://fraser.stlouisfed.org/ Federal Reserve Bank of St. Louis

March 5-6,1995
If the present level of short-term market rates is maintained over the next year as a result of
the funds rate policy followed by the Fed, then it is reasonable to predict that the tl and t2 ratios
will continue to increase. Under these conditions we should expect to see growth rates of the broader
aggregates much closer to and perhaps even somewhat faster than the growth rates of the narrower
aggregates. However, it is unlikely that we will observe a major decrease in the velocity of M2
over the next year, and there is a low probability that this velocity will revert in the near future to
the mean that it exhibited through the late 1980s that provided the empirical justification for the P*
model.
92 Digitized for FRASER http://fraser.stlouisfed.org/ Federal Reserve Bank of St. Louis

Shadow Open Market Committee
NOTES
*The values of the funds rate target from July, 1990 to the present are those attributed to the AP as reported on Prodigy. I have not constructed monthly average values of the funds rate target, so the series on the target and the series on the actual funds rate are not directly comparable. On a monthly average basis, the difference in the two series would be even smaller than that shown in Figure 1.
2Erich's February, 1995 forecast ("Prospects for Money and the Economy," January 21,1995 of Ml velocity and Ml growth over 1995 appear to me to be fundamentally correct. He has the 30 year government rate remaining in the 7.8 - 8.0 percent range, little changed from the 94:4 average. He forecasts that under these conditions Ml velocity will steadily increase from a value of about 6.0 in 94:4 to around 6.4 in 95:4. Associated with his predicted decline in velocity he shows sluggish Ml growth.
3For some evidence on the behavior of these rate spreads see R.H. Rasche, "Monetary Aggregates and Monetary Policy," in B. Zycher and L.C. Solmon, (eds) Economic Policy. Financial Markets and Economic Growth. Westview Press, 1993.
93 Digitized for FRASER http://fraser.stlouisfed.org/ Federal Reserve Bank of St. Louis

9.0
March 5-6,1995
Figure I: Funds Rate and 10 year Treasury Rate
January, i 990 - December, i 994
8.1 H
72 H
6.3 H
5.-1 H
«.5. H
3.G H
2.7
FYFF
FYFFT
FYGTIO 1 I > I » I I T 1 t | -1 1 1 I I 1 I I I I' » | I " 1 I I t I I 1 I » » | ' I T f I I" 1 T I \ I I I I I I > I T I " >
93 9-1 90 9f 92
25
20 H
15
10 H
-5 H
-!0
Figure 2: Month-to-Month Growth Rates of MI and MzM June, 1991 -December, 1994
' % > • ' » ' i i
Digitized for FRASER http://fraser.stlouisfed.org/ Federal Reserve Bank of St. Louis

7.5
5.0 H
2.5 H
0.0
-2.5 H
-5.0 H
-7.5 H
-10.0
Shadow Open Market Committee
Figure 3: MI Velocity Growth 90:2 - 9 4 *
16
H H
12 H
io H
8 H
6 H
« H
Figure 4: Month-to-Month Growth Rates of Currency June, 1991 -December, 1994
GCUR 1
MGCUR
MGCUR
t i t i i "
Digitized for FRASER http://fraser.stlouisfed.org/ Federal Reserve Bank of St. Louis

0.500
0.175 H
0.150 H
0.-125 H
o.-ioo H
0.375 H
0.350 H
0.325 H
0.300
March 5-6, 1995
Figure 5: Currency/Deposit Ratio September, 1992 - December, 1994
0.200
Figure 8: Reserve Ratios September, 1992 - December, 1994
0.175
0.150 H
0.125 H
o.ioo H
0.075 H
0.050 H
0.025
0.000
IRS
IRB i i i t i i t i i i i r " i i i i t t i i • "i ' ' i
9-1 93 96
Digitized for FRASER http://fraser.stlouisfed.org/ Federal Reserve Bank of St. Louis

2.95
2.90
2.85 H
2.80
2.75 H
Shadow Open Market Committee
Figure 7: MI - Monetary Base Multipliers September, 1992 - November, 1994
2.70 H
2.65
2.60 H
2.55 H
2.50 - , • » i
93 9-1
Figure 8: Month-to-Month Growth Rates of Monetary Base Measures June, 1991 -December, 1994
22.5
20.0 H
17.5 -|
15.0 H
12.5
10.0 -J
7.5 -|
5.0 -|
2.5. H
GSTBASE
MGSTBASE
MGSTBASE
,GBORBASE
ORBASE
BORBASE
\\1 i u 0.0 I " I t I » f I I I I I I I I I I I I I
91 92 I I I I I I T |
93
1'» »"" i t i i i • i i
94 97
Digitized for FRASER http://fraser.stlouisfed.org/ Federal Reserve Bank of St. Louis

-1.00
3.95 H
3.90 H
3.85 H
3.80 H
375 H
370 H
3.65
Afa/r* 5-6, 1995
Figure 9: tz = (MzM - MI )/Deposlts
September, 1992 - November, 1994
Figure 10: Month-to-Month Growth Rotes of Broad Monetary Aggregates June, 1991 -December, 1994
10.0
Digitized for FRASER http://fraser.stlouisfed.org/ Federal Reserve Bank of St. Louis

1.92
176 H
1.60 H
1.44
1.28 H
1.12
0.96 H
0.80 H
0.64
Shadow Open Market Committee
Figure 11: t l = (M2 - MzM)/Deposlts September, 1992 - November, 1994
1.50
1.25 A
t.oo H
0.75
Figure 12: t2 = (M3 - M2)/Deposlts September, 1992 - November, 1994
Digitized for FRASER http://fraser.stlouisfed.org/ Federal Reserve Bank of St. Louis

March 5-6,1995
100 Digitized for FRASER http://fraser.stlouisfed.org/ Federal Reserve Bank of St. Louis

Shadow Open Market Committee
TRIAL AND ERROR IN DEVISING THE MEXICAN RESCUE PLAN
Anna J-SCHWARTZ National Bureau of Economic Research
Despite unqualified assurances by Mexico's finance minister that the peso would not be devalued, the peso was devalued on December 20,1994. The devaluation came as a shock to U.S. investors, who had been beguiled by official opinion here and in Mexico that economic reforms under outgoing President Salinas had stabilized the economy and ensured inflation-free growth. Less sanguine views were not publicized.
BACKGROUND TO DEVALUATION
A few facts were regularly cited as evidence of the health of the Mexican economy. The annual inflation rate had been lowered from 100% in the mid-1980s to under 10% in 1994, and the federal budget had been brought into balance. The proceeds of the privatization of billions of dollars of state enterprises were used to reduce Mexico's domestic debt to 10% of GDP and to eliminate the huge budget deficit Taxes were reduced. The Mexican economy grew at 3.1% in 1994, up from 0.4% the previous year (according to the report of the central bank on February 1, 1995 —estimates before the devaluation had been higher). It was confidently predicted that the opening of the economy to international trade and investment under the North American Free Trade Agreement would lead to higher rates of growth and greater prosperity.
Some other facts were not highlighted. One was the growing current account deficit (8% of GDP in 1994, up from 6.4% the year before) that was financed by capital imports. International reserves were $30 billion early in 1994 but, as they declined from that peak, the Bank of Mexico expanded net domestic credit. Checking accounts also declined from early 1994 on, as holders shifted to currency. Many banks were troubled. These disquieting facts suggested declining domestic and foreign confidence in the Mexican economy. The government borrowed heavily in dollars on a short-term basis at home and abroad, as did also private-sector firms. Loss of confidence imperiled the rollover of debt Real interest rates were high.
Trouble had been brewing in Mexico since March 1994, when the murder of the presidential
candidate of the PRI party sparked a speculative attack on the exchange value of the peso, which
had been pegged at 3.50 to the dollar. To support the peso the Bank of Mexico depleted about
101 Digitized for FRASER http://fraser.stlouisfed.org/ Federal Reserve Bank of St. Louis

March 5-tf,1995
one-third of its stock of international reserves, which it did not subsequently recover. The economic
situation, however, was expected to improve with the election of Ernesto Zedillo in August and his
inauguration on December 1. Instead, it fell apart.
In retrospect, during the period between the election and the inauguration, Mexico could have addressed the problem of the overvaluation of the peso. For the government, however, devaluation would have been an embarrassment Salinas was reputed to be concerned that his reputation not be tarnished when he was in the running to head the new World Trade Organization. The United States, which had touted the U.S. jobs gain that NAFTA would provide, did not favor revealing any cracks in the facade of Mexican prosperity.
The cracks opened up, however. The peasant revolt in Chiapas that seemed to have been contained in the early part of 1994 flared again after Zedillo took office, to the dismay of foreign investors. The inflow of portfolio capital from abroad that had sustained the current account deficit and strengthened the peso in real terms halted. The burgeoning current account deficit focused attention on the peso's overvaluation, leading to a sell-off in mid-December. This time the central bank's intervention to support the currency was aborted when reserves fell, reportedly to $6.15 billion. Instead of the support tactic, on December 20, it widened the trading range for the peso. The market's response was a capital outflow. The next day the peso was allowed to float. The peso's value promptly sank. On January 30, it traded as low as 6.4 to the dollar. Paralleling the decline in the peso's exchange value, the Mexican stock market, which stood at 2375.66 at the end of December, tumbled.
RESCUE PLANS I, H, AND HI
I. The Clinton administration initially proposed activating the Federal Reserve and Treasury swap lines with Mexico and expanding the facility to include Canada and some BIS central banks, for a total of $18 billion on which the Bank of Mexico could draw to support the peso. President Zedillo announced the rescue package on January 2,1995. The Mexican government pledged to continue privatizing and deregulating industry. Business in turn pledged to limit price increases. On January 9, drawing on the swap line, the Federal Reserve and the Bank of Mexico intervened in currency markets. The peso gained against the dollar that day. The Bank of Mexico drew down $2.1 billion from the swap lines, but its reserves by the end of January nevertheless dwindled to $3.48 billion.
102 Digitized for FRASER http://fraser.stlouisfed.org/ Federal Reserve Bank of St. Louis

Shadow Open Market Committee
II. The Clinton administration's next move, on January 12, was to propose to Congress a $40
billion aid package for Mexico in the form of a loan guarantee that Gingrich and Dole supported.
Little enthusiasm greeted the plan in Congress and among the public. Congressional critics sug
gested conditions they would demand for their votes, ranging from a requirement that Mexico return
the peso to a pre-devaluation exchange rate of 3.5 to the dollar, an end to Mexico's ties to Cuba, a
curb on drug trafficking, collateral of export sale revenues of the Mexican state oil monopoly, labor
and environmental reforms and Mexico's adopting of a currency board. With Congressional backing
for the guarantee lukewarm, Clinton abandoned it
As supplements to Plan n, the IMF on January 26 agreed to extend a $7.8 billion loan, the
largest it had ever made. Brazil, Argentina, Columbia, and Chile discussed providing a $1 billion
credit line to Mexico.
HI. Clinton on January 31 opted for an executive order to give Mexico access to medium- and
long-term loans or loan guarantees amounting to $20 billion from the Exchange Stabilization Fund.
Conditions for the U.S. loan were not announced until February 21, and in the interim and imme
diately after the announcement Mexican financial markets remained unstable.
According to the U.S.-Mexican agreement, the United States will immediately give Mexico
$3 billion, and over the next four months another $7 billion, provided that Mexico observes the
obligations it has assumed. The remaining $10 billion will be available in July, again provided that
Mexico continues to live up to those obligations. Mexico for its part has agreed to collateral terms
requiring importers of Mexican crude oil, oil products, and petrochemical to deposit payment in a
Mexican account at the Federal Reserve Bank of New York, to protect the United States in the event
of a Mexican default
The obligations Mexico has assumed include: (1) limiting credit expansion to 10 billion pesos
in 1995, down from 60 billion pesos in 1994; (2) keeping the growth rate of money below the
inflation rate; (3) maintaining "substantially positive" real interest rates; (4) over the next three
years raising $12 to $14 billion from privatizations; (5) publishing timely statistics and reporting
financial information over the Internet Under U.S. pressure, the day before the loan agreement
was announced, the central bank raised the overnight interest rate to 50%, hoping it would help
stabilize the peso exchange rate, which was trading 5.605 to the dollar.
Supplementing the U.S. $20 billion loan, an additional $10 billion will be forthcoming on
April 1 and July 1 from the IMF, over and above the $7.8 billion it has already granted, if Mexico
fulfills the conditions of its agreement with the IMF. The conditions include: (1) reducing the
103 Digitized for FRASER http://fraser.stlouisfed.org/ Federal Reserve Bank of St. Louis
March 5-6,1995
current account deficit from 8% to 4% of GDP in 1995 and to 3.5% in 1996; (2) a 30% inflation
rate expected in 19951 is to fall to 9% in 1995IV, requiring tight wage controls; (3) 10 billion pesos
monetary growth in 1995, down from 60 billion in 1994; (4) and a cut of one-half in the 1995 rate
of credit expansion by Mexico's development banks.
BIS central banks are to provide a short-term credit of $ 10 billion, Canada, $ 1 billion Canadian, and several Latin American countries, $1 billion. The sum of the rescue package from all sources is about $50 billion.
MEXICO'S PROBLEMS
The main immediate problems are the Mexican treasury issues, tesobonos, that are indexed to the dollar. About $55 billion are outstanding (of which $30 billion are held by foreigners) and about $20 billion are very short term. Tesobonos are offered at weekly auctions in maturities of 28-, 91-, 182-and 364-days.
In the period since the December 20 devaluation, sales at the auctions have not matched the value of tesobonos that were maturing, despite interest rates as high as 40%, and in some weeks Mexico canceled the auction. U.S. investment banks in mid-February tried to repackage $2 billion of the short-term tesobonos into longer-term dollar-denominated securities, but Mexican officials decided interest rates they would have to pay were too high. Alternatively, it was proposed that Mexico's development bank repurchase the tesobonos and use them as collateral for a loan from the investment banks. Mexico under this arrangement was to pay 1.5% over Libor, and a fee of $2.50 for each $1,000 face amount of the transaction. The investment banks balked, so Mexico raised the rate over Libor to 2.25% and the fee to $3.75 for each $1,000. Talks nevertheless broke down because the investment banks did not want to act as a syndicate from which other countries with short-term financing needs would expect the same treatment as Mexico. The banks apparently will try to deal with Mexico individually, and Mexico has asked J.P. Morgan for advice on the costs and benefits of any rescue package.
The investment bank difficulties come on top of a breakdown of negotiations by commercial
banks. As of early January, J.P. Morgan and Citicorp, the lead banks, pledged $3 billion for a credit
line to Mexico, but as of mid-February, they were still trying to round up partners, seeking $200
million from each, for a syndicated loan to Mexico in the amount of $3 billion. The commercial
banks were resisting the lead banks because they were being asked to give an unsecured loan at
less-generous rates and lower fees that the investment banks were discussing.
104 Digitized for FRASER http://fraser.stlouisfed.org/ Federal Reserve Bank of St. Louis

Shadow Open Market Committee
With the U.S. loan in place, at the February 22 auction Mexico repurchased about $2 billion
tesobonos. Interest rates rose about 40% in line with the rise in the overnight rate to 50%. The
plan is to reduce the pool of dollar-denominated tesobonos to about $15 billion by the end of
February.
In additional to reducing the size of its short-term debt, Mexico will try to stretch it out. The
U.S. loan will be used as a guarantee for medium-term bonds Mexico plans to issue. One test of
the resource plan will be whether it succeeds in persuading foreign investors to purchase not only
dollar-denominated short-term issues but also medium-term bonds.
Another immediate problem that Mexico faces is the weak condition of its domestic banks.
The high interest rates on tesobonos serve as benchmarks for domestic consumer loans that range
from 50% to 60% a year. The supply of bank loans in February was reported to have dried up and
the number of nonperforming loans to have soared. U.S. funds will be available to prop up failing
Mexican banks, but details of the plan to deal with bank distress have not been revealed. It is not
clear how a plan for revival of bank lending that the central bank in late February introduced fits
in with contractionary monetary and fiscal policy and the existing problems of the banks. The plan
calls for new banking contracts that would apply to both peso loans and peso consumer deposits,
the principal of which, but not the interest rate, will be indexed to inflation. The central bank is to
announce daily inflation rates for indexing purposes.
Mexico's longer-term problem is restoration of investor confidence in its financial markets.
Devaluation has damaged its credibility. Financial instability, higher domestic interest and inflation
rates and slower growth than in 1994 are the conditions Mexico must convince investors are
transitory. It must restore its foreign-currency reserves, last reported as $3,483 billion on January
31. More timely information about internal conditions is one of the conditions of the U.S. loan.
Current account data are a year late. The Bank of Mexico's announcement on January 30 that it
would begin reporting the level of its foreign-currency reserves on a monthly basis instead of three
times a year is a move in the right direction.
More difficult will be bringing down the cost of external capital, which had fallen in 1993
after the passage of NAFTA, but has shot up since the peso crisis arose. Higher interest rates and
more collateral are part of the price Mexico faces as conditions for private financing to resume.
These are demands of the commercial banks that are resisting the efforts of Citicorp and J.P. Morgan
to arrange the $3 billion loan referred to above.
105 Digitized for FRASER http://fraser.stlouisfed.org/ Federal Reserve Bank of St. Louis

March 5-6,1995
To improve its long-term economic prospects, Mexico will need real depreciation of the peso. Last year's capital inflows financed consumer goods imports as well as investment goods. The current account deficit must be reduced to enlarge exports over imports, but in view of the policy -induced recession is not expected to change much in 1995. Inflation, which had fallen to a single digit in 1994, is now expected to reach double digits this year. The pact between employers and unions is an agreement to limit wage hikes to 7-10%; business has agreed to narrower profit margins. A 4.5 peso rate to the dollar was the assumption underlying the pact. If the market rate stabilizes at over 5 to the dollar, the wage and profit margin limits will undoubtedly be increased.
What is indisputable is that Mexico faces a recession, probably a severe one, even if the crisis atmosphere of the past two months is alleviated. Whether it can comply with the conditions it has accepted, in particular budget balance and a limited rise in inflation, is open to question.
Before the U.S.-Mexican agreement was announced, Standard and Poor downgraded Mexican long-term foreign issues denominated in dollars from double-B plus to double-B and long-term debt denominated in pesos from single-A plus to single-A. The discount on Mexico Brady bonds rose. Duff and Phelps Credit Rating Co. downgraded Mexico's debt as well as the debt of five Mexican companies after a Mexican conglomerate defaulted on a commercial paper debt payable in dollars. The firm subsequently made a payment to its creditors.
WHY THE BAILOUT AND WHY ITS MAGNITUDE?
The Clinton administration has offered many justifications for each of the rescue plans. They are said to be in the U.S. national interest to preserve jobs here that are contingent on Mexico's ability to buy our exports, and to discourage illegal immigration from Mexico that would surge in the absence of a rescue. They are said to be an appropriate action of a lender of last resort to prevent contagion and systemic risk spreading from Mexico's financial crisis to other emerging economies.
It is not credible that a decline in U.S. exports to Mexico will have much of an effect on the U.S. economy. Mexico in 1994 took 10% of U.S. merchandise exports, amounting to less than 1% of U.S. nominal GDP. The way to curb illegal immigration is by stepping up border surveillance, not by a bailout plan. The claim that the plan is needed to prevent contagion ignores the fact that stock markets of emerging economies that were shaken by Mexico's plight are countries with problems that were not imported: weak banks, large current account deficits and overvalued
106 Digitized for FRASER http://fraser.stlouisfed.org/ Federal Reserve Bank of St. Louis

Shadow Open Market Committee
currencies. Volatility in stock markets of other countries on a given day was described in the press as a ripple effect from the Mexican situation, but on other days the volatility would be ascribed to things going on elsewhere. Stock markets are volatile, and nobody can pinpoint the source.
Many precedents have been set by the rescue plan. The size of the total package is unprecedented, as is the size of the IMF loan. Germany abstained from the vote on the IMF loan because the $7.8 billion o the $17.8 billion pledge was made available in totality on February 6, without provision for drawings in tranches as conditions for the loan were lived up to.
Another precedent set by the loan plan is the use of $20 billion of the assets of the Exchange Stabilization Fund for the U.S. loans and loan guarantees. Not only the amount of the loan but the period for which it is extended—up to 10 years—is unprecedented.
Previously, both the Federal Reserve and the Treasury have had reciprocal currency arrangements with Mexico. The Federal Reserve's swap lines except for the one with Mexico have been with industrialized central banks. The Treasury's swap lines have been with emerging economies—Argentina, Brazil, Mexico, Nigeria, etc. Treasury swap lines with these economies on which they have drawn individually have typically been for less than $0.5 billion.
In 1982, the Treasury's temporary facility with the Bank of Mexico was as large as $1 billion, on which Mexico drew $0,825 in the third quarter and which it repaid in that quarter. In that year the Fed's $0.7 billion swap line was augmented by $0,325 billion, on which Mexico drew in quarters 2-3, repaying in quarter 4 and the first quarter of 1983 using an IMF loan.
In 1988, the Fed and the Treasury arranged a short-term bridge loan for Mexico of up to $3.5 billion pending three structural loans of $ 1.5 billion from The World Bank and an IMF compensatory loan of $0.6 billion, plus drawing on an IMF standby arrangement The term of the international agency loans was two to three years. The problems Mexico faced in 1988 and the conditions for the loans were forerunners of the 1994 scenario. In 1990, a combined Federal Reserve and Treasury facility for Mexico totaled $1.3 billion, drawn on in quarter 1 and repaid in quarters 2-3.
ROLE OF THE EXCHANGE STABILIZATION FUND
The Treasury has not revealed how it would obtain $20 billion from the Exchange Stabilization
Fund. Foreign assets of the ESF at current value totaled $20.4 billion on September 30, 1994
(Federal Reserve Bulletin. December 1994, p. 1076). (The Treasury Bulletin reports the balance
sheet for the ESF quarterly with a six-month lag.) Presumably the Treasury will sell the foreign
107 Digitized for FRASER http://fraser.stlouisfed.org/ Federal Reserve Bank of St. Louis

March 5-6,1995
exchange assets of the Fund to obtain dollars for Mexico. The ESF also has a dollar account at the
Federal Reserve Bank of New York. This deposit reflects the monetization of SDR allocations that
the ESF has not yet drawn down.
The Gold Reserve Act of January 30,1934, established the Fund "for the purpose of stabilizing
the exchange value of the dollar" (Section 10(a)). Later U.S.C.§ 5302 as amended in 1977 provided
that "a loan or credit (by the ESF) to a foreign entity or government...may be made for more than
6 months in any 12-month period"—provided the President informs Congress of the need for a
longer period loan—conferring legal authority for a Mexican loan of whatever term the Admin
istration has negotiated. The original propose of the ESF to defend the foreign exchange value of
the dollar has been perverted—this is not the first such case—to bailout a foreign currency.
Since 1987 both the Fund's and the Federal Reserve's foreign assets have grown from under
$5 billion (the Federal Reserve's foreign assets at current value on September 30, 1994, totaled
$23.1 billion). The increase in Federal Reserve balances was authorized by the FOMC. The Fund,
however, did not have resources of its own to finance the acquisition of foreign currencies, so the
Federal Reserve authorized warehousing for the Fund that increased from $5 billion in 1987 to $15
billion in 1990.
Since 1990 the Fund has repurchased in installments the total amount in the warehouse, ESF
resources beyond the original capital of $200 million (remaining after $1.8 billion had been with
drawn in 1947 in partial payment of the U.S. quota in the IMF) include IMF drawings the Treasury
assigns to the ESF and SDR allocations. The source of the funds that enabled the ESF to end its
dependence on the Fed warehouse apparently was dollar monetization of SDRs. A question raised
by this episode is why the Treasury before 1990 preferred to rely on the Fed warehouse for ESF
funds rather than monetize SDRs.
Now that the Mexican loan has emptied the ESF of resources for exchange market intervention
or for loans to other countries, what course will the Treasury follow? Resume calls on the warehouse?
Leave intervention to the Fed?
OUTLOOK FOR PEGGED EXCHANGE RATES
Conflicting views have been expressed on the Mexican crisis. The long-standing Wall Street
Journal view is that Mexico should not have devalued and should have stuck to the pegged 3.50
pesos to the dollar exchange rate. This view is an argument for the defense of unrealistic parities
to the bitter end. It assumes that simply reversing monetary growth would have been sufficient to
108 Digitized for FRASER http://fraser.stlouisfed.org/ Federal Reserve Bank of St. Louis

Shadow Open Market Committee
maintain the pegged rate, never mind the consequences for the real economy of recession or
depression. What is not clear is whether capital inflows would resume at the pegged rate. If not,
the adjustment in Mexico would be more severe than monetary contraction alone would enforce.
Another view is that the Mexican case demonstrates the need for a lender of last resort to
emerging economies, and that an institution for that purpose should be established. The Mexican
bailout would become a precedent Apart from the issue of moral hazard, for whose benefit would
a lender of last resort operate—the emerging economy or the industrialized world investors in that
economy?
What still requires an answer is whether Mexico will be better off with the huge repayment
obligation it has assumed. For years ahead it will need to increase its future current account surplus
sufficiently to replace the borrowings. If on its own Mexico had adopted the austerity measures it
has accepted as conditions for the loans, would not self-imposed austerity breed less populist
resentment than U.S.-imposed austerity? If Mexico had obtained only a standby IMF loan, and had
promptly negotiated with its creditors a stretchout and a writedown of its current debts, instead of
waiting for two months for the package of loans, the return to stability to the peso and its financial
markets might have been achieved sooner. The size of the package in itself suggests that the
underlying fundamentals are not sound, contrary to the presentations of officials.
109 Digitized for FRASER http://fraser.stlouisfed.org/ Federal Reserve Bank of St. Louis