sgh publishing house
TRANSCRIPT


SGH PUBLISHING HOUSESGH WARSAW SCHOOL OF ECONOMICS
WARSAW 2017

This publication is a result of research conducted by the World Economy Research Institute-a unit of the Collegium of the World Economy at the Warsaw School of Economics-and financed with funds provided by the Polish Ministry of Science and Higher Education.
ReviewersPaweł PietrasieńskiKrzysztof Wach
English editorsPatricia KozaGrzegorz Siwicki
© Copyright by the SGH Warsaw School of Economics, Warsaw 2017All rights reserved. No part of this publication may be reproduced, stored or transmitted without the permission of the Warsaw School of Economics.
First edition
ISSN 2083-229XISBN 978-83-8030-161-0
SGH Publishing House162 Niepodległości Ave., 02-554 Warsaw, Polandwww.wydawnictwo.sgh.waw.ple-mail: [email protected]
Cover designMonika Trypuz
DTPDM Quadro
Print and bindingQUICK-DRUK s.c.e-mail: [email protected]
Order 101/VI/17

Contents
Preface . . . . . . . . . . . . . . . . . . . . . . . . . . . . . . . . . . . . . . . . . . . . . . . . . . . . . . . . . . . . . . . . . . . 7Marzenna Anna Weresa
PART I . POLAND’S ECONOMIC COMPETITIVENESS FROM 2010 TO 2016
Chapter 1 . Comparative Assessment of Development Trends in 2010–2016: Poland and the European Union . . . . . . . . . . . . . . . . . . . . . . . . . . . . . . . . . . . . . . . . . . . . . . . . . . . . 13Ryszard Rapacki, Mariusz Próchniak
Chapter 2 . Income Convergence Between the CEE Region and Western Europe . . . . . . . 29Mariusz Próchniak
Chapter 3 . Income Inequality and Poverty in Poland: The Impact of Total Remittances on Income Inequality Among Polish Households from 2008 to 2015 . . . . . . . . . . . . . . . . . 41Patrycja Graca-Gelert
Chapter 4 . Poland’s Competitive Advantages in Foreign Trade and the Country’s Balance of Payments in 2010–2016 . . . . . . . . . . . . . . . . . . . . . . . . . . . . . . . . . . . . . . . . . . . . 61Mariusz-Jan Radło
Chapter 5 . The Impact of Foreign Direct Investment on Poland’s Economic Competitiveness . . . . . . . . . . . . . . . . . . . . . . . . . . . . . . . . . . . . . . . . . . . . . . . . . . . . . . . . . . . 81Tomasz M. Napiórkowski
PART II . KEY FACTORS FOR POLAND’S ECONOMIC COMPETITIVENESS IN 2010–2016
Chapter 6 . Key Economic Policy Developments in 2010–2016 and Challenges Ahead . . . 101Adam Czerniak, Ryszard Rapacki
Chapter 7 . The Internationalization of Poland’s Financial System from 2010 to 2016 . . . 117Katarzyna Sum
Chapter 8 . Investment and Domestic Savings: Poland Compared with Other EU Countries . . . . . . . . . . . . . . . . . . . . . . . . . . . . . . . . . . . . . . . . . . . . . . . . . . . . . . . . . . . . . . . . . 133Piotr Maszczyk
Chapter 9 . Changes in Human Resources in Poland and Migration Trends from 2010 to 2016 . . . . . . . . . . . . . . . . . . . . . . . . . . . . . . . . . . . . . . . . . . . . . . . . . . . . . . . . . . . . . . . . . . . 147Adam Karbowski

Contents6
Chapter 10 . Science, Technology and Innovation as Factors of Competitiveness of the Polish Economy . . . . . . . . . . . . . . . . . . . . . . . . . . . . . . . . . . . . . . . . . . . . . . . . . . . . . . . . . . . . 161Marta Mackiewicz
Chapter 11 . Changes in Total Factor Productivity . . . . . . . . . . . . . . . . . . . . . . . . . . . . . . . . 177Mariusz Próchniak
PART III . POLAND’S INTERNATIONAL COOPERATION, INNOVATION AND COMPETITIVENESS
Chapter 12 . The Internationalization of Poland’s National Innovation System . . . . . . . . . 193Marzenna Anna Weresa
Chapter 13 . The Financing of Innovative Polish Enterprises under the European Union’s Horizon 2020 Program Compared with Other Member States . . . . . . . . . . . . . . . 213Małgorzata Stefania Lewandowska
Chapter 14 . Innovation, Cooperation and Internationalization: Research Results for Polish Industrial Enterprises . . . . . . . . . . . . . . . . . . . . . . . . . . . . . . . . . . . . . . . . . . . . . . 233Tomasz Gołębiowski, Małgorzata Stefania Lewandowska
Chapter 15 . The Internationalization of Polish Business Clusters . . . . . . . . . . . . . . . . . . . 245Arkadiusz Michał Kowalski
SUMMARY AND CONCLUSIONS
The Internationalization of the Polish Economy and Changes in Its Competitive Position 2010–2016 . . . . . . . . . . . . . . . . . . . . . . . . . . . . . . . . . . . . . . . . . . . . . . . . . . . . . . . . 261Marzenna Anna Weresa

Preface
This book is the latest in a series of annual studies of economic competitiveness, a con-cept that refers to sustainable economic growth, but also implies an ability to improve quality of life, strengthen a country’s position on foreign markets and increase its at-tractiveness to foreign investment.
Competitiveness is closely linked to changes in productivity that influence the use of resources and have an impact on the production of goods and services offered on both the domestic and international markets. However, research studies today high-light some new aspects of competitiveness that go beyond economic performance. Changes in the productivity of material and non-material resources are viewed in the context of a social equilibrium and sustainable use of the environment, a perspective known as sustainable competitiveness. The definition of competitiveness is expanded to include other important elements that increase the well-being of societies.1 This book takes into account some elements of these new dimensions of sustainable com-petitiveness, especially those related to social sustainability.
The main aim of this book is to determine Poland’s competitive position and to identify factors that determined its evolution in the period of 2010–2016. One of the factors of competitiveness analyzed in detail here is the internationalization of the Polish economy and its role in shaping the country’s competitive advantages.
Competitiveness can be viewed from several perspectives: macroeconomic (i.e., of the economy as a whole), meso-economic (that of a region or industry), and microeconomic (that of an enterprise). This book focuses on the macroeconomic perspective and identifies Poland’s competitive position in comparison with other European Union member states, especially its peers in Central and Eastern Europe. All these countries became part of the EU after a period of transition from a cen-trally planned to a market economy, as a result of successive rounds of enlargement in 2004, 2007 and 2013.
The methodology of the comparative studies of competitiveness conducted in this book has been developed by a team coordinated by the World Economy Research In-stitute at the Warsaw School of Economics (SGH), in cooperation with international centers. The broad spectrum of issues that are part of the concept of competitive-
1 The definition of competitiveness and the concept of sustainable competitiveness are discussed in greater detail in previous editions of this report (see, for example, Poland: Competitiveness Report 2015, Warsaw School of Economics Press, Warsaw 2015).

Preface8
ness requires the use of a variety of research methods and techniques to determine a country’s competitive position and to identify changes in this position. Poland’s cur-rent competitive position and its evolution from 2010 to 2016 are subjected to a com-parative analysis using a broad set of economic and social indicators describing the level of society’s well-being and including elements such as:
� the current macroeconomic situation described by key indicators of economic development, such as GDP growth, inflation, unemployment, public finances, and the current-account balance, which taken together constitute the so-called “magic pentagon” of competitiveness;
� changes in the standard of living of the population, whose key measures include GDP per capita (in purchasing power parity terms), indicators of socioeconomic development (such as the social development index), and income inequality (meas-ured, for example, by the so-called Gini index);
� Poland’s position in the international division of labor, defined by its ability to ex-port goods and services and its comparative advantages in trade as well as attrac-tiveness to foreign direct investment.The book further analyzes factors of economic competitiveness that determine
Poland’s current economic performance and its position internationally. These are divided into two main categories: (1) institutions and economic policy, and (2) re-sources and their productivity. These factors of competitiveness are subjected to de-tailed statistical and descriptive analysis, while changes in the productivity of factors of production are determined using the growth accounting method.
This edition of the book focuses on the internationalization of selected areas of the Polish economy as a factor influencing competitiveness. The comparative analysis includes aspects such as the internationalization of the national innovation system, international entrepreneurship (including cooperation), and the internationaliza-tion of clusters.
The book traces changes in Poland’s competitiveness from 2010 to 2016, though sometimes it considers a broader background and refers to earlier periods. The year 2010 was chosen as a starting point for the research because it marked when EU member states began to implement the bloc’s flagship Europa 2020 strategy. With this strategy, the EU changed its priorities in the policy of strengthening competi-tiveness toward sustainable and inclusive growth based on innovation. The analysis covers a period ending in 2016, but sometimes the research period is narrowed by the unavailability of up-to-date statistics.
The structure of the book reflects the adopted methodological assumptions. The book consists of three parts that are further divided into chapters and summed up at the end.

Preface 9
Part I (Chapters 1–5) offers the results of a comparison of trends in Poland’s eco-nomic development from 2010 to 2016, based on a variety of economic and social indicators such as GDP growth, per capita income and its convergence, income in-equality and poverty. Subsequently, Poland’s competitive position in external eco-nomic relations is examined, including the country’s foreign trade and comparative advantages as well as its attractiveness to foreign direct investment and Poland’s own position as a foreign investor.
Part II of the book (Chapters 6–11) seeks to identify factors determining the com-petitiveness of the Polish economy. The concept of a country’s competitiveness is con-nected with its institutional system, which shapes the conditions for the functioning of enterprises. The institutional factors that shape this dimension of competitive-ness and are analyzed in detail in this book include economic policy and the finan-cial system. The analysis takes into account changes that took place in these areas from 2010 to 2016.
Another group of competitiveness factors examined in the book are various re-sources accumulated in the economy: financial, human and technological. Changes in these resources during the 2010–2016 period are analyzed. The assessment of com-petitiveness factors included in this part of the book closes with a look at the role that changes in total factor productivity played in Poland’s economic growth and compet-itiveness in the researched period. The country’s position in this respect is compared to those of the other 10 EU countries in Central and Eastern Europe.
Innovation plays a key role in shaping the competitiveness of economies. It is essential for an increase in total factor productivity. Yet the emergence of innova-tion depends not only on internal resources, but also on ties with the international environment. Part III (Chapters 12–15) provides insights into the internationaliza-tion of the Polish economy in the context of the development and implementation of innovations.
Conclusions from the analyses conducted in the book are presented in the final part of each chapter. A summary wraps them up and offers recommendations on ways to improve Poland’s competitiveness in the short and long term. The summary points out that, as the country develops, the importance of price competition is de-creasing in favor of other factors shaping Poland’s competitive advantages such as innovation and quality. Better use of these factors is promoted by enhanced cooper-ation with partners in other countries. Internationalization and the development of global production cooperation networks lead to an intensified exchange of informa-tion and create opportunities for research and innovation cooperation. Internation-alization processes are therefore crucial for a policy of enhancing competitiveness, with a key focus on enabling domestic businesses to join global networks of scientific

Preface10
and business ties, within both international organizations and transnational corpo-rations. These issues are more broadly examined in the final part of this book, which offers recommendations for competitiveness policy.
Marzenna Anna Weresa

Part I
Poland’s Economic Competitiveness from 2010 to 2016


Chapter 1
Comparative Assessment of Development Trends in 2010–2016:
Poland and the European Union
Ryszard Rapacki, Mariusz Próchniak
The aim of this chapter is to identify changes in Poland’s macroeconomic situation from 2010 to 2016 against the background of other EU countries. The comparative analysis covers key indicators of economic development, such as GDP growth, infla-tion, unemployment, public finances, and the current-account balance, which taken together constitute the so-called “magic pentagon of competitiveness.” The analysis is preceded by the presentation of a broader international context reflecting devel-opment trends in the global economy.
The international context: Development trends in the global economy
Before embarking on a comparative analysis of Poland’s economic performance from 2010 to 2016, we will first outline its global context, sketching a picture of the prevailing patterns of growth that occurred in the world economy during this period.
As can be seen from the preliminary data shown in Table 1.1, the global gross domestic product (GDP) grew 2.2% in 2016, a slightly slower rate than in the previ-ous two years and also slower than the medium-term trend in the 2010–2013 period.
Similar to the prevailing trends throughout the studied period, the continuing recovery of the global economy in 2016 was mostly due to relatively fast economic growth in developing economies; their GDP growth rate was 3.6%. The most remarka-ble growth indices were recorded in Southeastern Asia (5.7%), especially India (7.6%) and China (6.6%). On the other hand, the relatively slow growth in the global econ-omy was due to developed countries (with their 1.5% GDP growth) doing worse eco-nomically than in the six preceding years (2010-2015). Contributing factors included a prolonged recession and economic stagnation in some EU member states as well as

Ryszard Rapacki, Mariusz Próchniak14
in Japan, combined with negative growth rates in transition countries (except new EU member states in Central and Eastern Europe), especially Russia, as well as Latin American economies.
Table 1.1. World economic growth in 2010–2016 (rates of growth in %)
Year 2010–2013 (annual averages) 2014 2015 2016a
World 2.8 2.6 2.5 2.2
Developed countries 1.6 1.7 2.1 1.5
Eurozone 0.6 1.1 1.9 1.6
USA 2.3 2.4 2.6 1.5
Japan 1.8 –0.1 0.6 0.5
Transition countries 3.5 0.9 –2.8 –0.2
Russia 3.3 0.7 –3.7 –0.8
Developing countries, of which: least developed countries
5.74.9
4.35.7
3.83.7
3.64.5
Africab 3.6 4.3 3.2 1.8
Southeast Asia 6.7 6.1 5.7 5.7
China 8.8 7.3 6.9 6.6
India 6.6 7.3 7.3 7.6
Latin America 4.0 0.7 –0.6 –1.0
a Preliminary data. b Not including Libya.The economic growth rates of country groups are calculated as a weighted average of individual country GDP growth rates. The weights are based on 2010 prices and exchange rates.
Source: United Nations (2017), World Economic Situation and Prospects 2017, New York 2017 and earlier years.
Size of the economy
We begin our analysis of the performance of the Polish economy in 2016 and of its international competitive position with a brief assessment of Poland’s economic potential and its place in the world economy as well as in the European Union.1
The basic measure of the size of the economy is the value of the gross domestic product produced in a country in a given year. In spite of all its shortcomings, this is still the most comprehensive measure of economic activity and is widely used in mac-roeconomic analyses. For inter-country comparisons, the values of GDP expressed in local currencies are converted into a single international currency (e.g. USD or EUR),
1 This and subsequent sections of this chapter refer to an earlier edition of this report (Matkowski, Rapacki, Próchniak, 2016). For reasons of space, this edition somewhat limits the focus while furnishing data for 2016.

Chapter 1. Comparative Assessment of Development Trends in 2010–2016 15
using current exchange rates (CER) or purchasing power parities (PPP) as conversion factors. The GDP calculated at PPP is believed to better represent the value of output produced in a given country, considering different price levels in the local markets for goods and services; it is also less susceptible to fluctuations in current exchange rates. For these reasons it is more widely used in broad international comparisons. On the other hand, the PPP conversion factors are often imprecise and tend to overestimate the value of GDP for less developed countries against the value of GDP in more devel-oped countries. The same reservation applies to the comparison of per capita GDP. In our assessments of total and per capita GDP, we apply both conversion systems, CER and PPP, to provide readers with a more comprehensive comparison.
According to IMF estimates for 2016 (IMF, 2017), Poland’s GDP was equal to $ 467.4 billion if calculated at CER, but its value estimated at PPP was $ 1,052.2 billion, or more than twice as high. Among the world’s largest economies arranged according to their total GDP, Poland ranked 25th in terms of the GDP value calculated at CER (between Belgium and Nigeria), and 24th in terms of the GDP value estimated at PPP (between Nigeria and Pakistan).2 Compared with the previous year, Poland’s position in the world economy remained unchanged in terms of CER, while deteriorating by two places in terms of PPP, chiefly due to more rapid growth in some developing econo-mies and a depreciation of the Polish currency against foreign currencies such as the U. S. dollar and the Swiss franc. The share of Poland in global output inched down to 0.6% at CER, while remaining unchanged at 0.9% at PPP. This share, reflecting Poland’s position in the world economy, has remained stable for many years, although the country’s place in the worldwide GDP ranking changes from year to year because of cyclical fluctuations in output, changing inflation and exchange rates, and some revisions in GDP data and conversion factors.
Let us now look at the position of Poland’s economy in the European Union (EU28). Table 1.2 presents data on the value of total GDP in individual EU member countries in 2016, calculated in euros at current exchange rates (CER) and according to the purchasing power standard (PPS). All the GDP data for 2016 are preliminary esti-mates published by the European Commission in October 2016 (European Commis-sion, 2016), which may be subject to further revisions. The ranking given in the table is arranged according to the value of GDP calculated at CER; the alternative ranks, based on the PPS GDP values, are given in parentheses.
2 The CER ranking includes 188 countries. The top three spots are occupied by the United States, China and Japan, while the bottom three (in descending order) are held by the Marshall Islands, Kiribati and Tuvalu. The PPP ranking, meanwhile, includes 190 countries, with China, the United States and India in the top three places and Kiribati, the Marshall Islands and Tuvalu (in descending order) in the bottom three positions.

Ryszard Rapacki, Mariusz Próchniak16
Table 1.2. GDP of EU28 countries in 2016 (EUR billion)
Rank CountryGDP at CER GDP at PPS
billions of EUR % billions of EUR %
1 (1) Germany 3,139.0 21.2 2,955.0 20.0
2 (2) United Kingdom 2,317.0 15.7 2,067.0 14.0
3 (3) France 2,226.0 15.1 2,015.0 13.6
4 (4) Italy 1,670.0 11.3 1,658.0 11.2
5 (5) Spain 1,118.0 7.6 1,236.0 8.4
6 (7) Netherlands 689.6 4.7 625.1 4.2
7 (9) Sweden 467.4 3.2 355.5 2.4
8 (6) Poland 428.4 2.9 773.4 5.2
9 (8) Belgium 420.8 2.8 378.6 2.6
10 (11) Austria 351.5 2.4 316.5 2.1
11 (16) Denmark 271.1 1.8 200.8 1.4
12 (13) Ireland 265.1 1.8 236.5 1.6
13 (18) Finland 213.1 1.4 170.2 1.2
14 (14) Portugal 184.4 1.2 229.5 1.6
15 (15) Greece 174.8 1.2 216.0 1.5
16 (12) Czech Republic 172.7 1.2 265.5 1.8
17 (10) Romania 170.2 1.2 335.7 2.3
18 (17) Hungary 114.4 0.8 194.8 1.3
19 (19) Slovakia 81.2 0.5 122.7 0.8
20 (24) Luxembourg 54.1 0.4 44.4 0.3
21 (20) Bulgaria 46.7 0.3 99.9 0.7
22 (21) Croatia 45.6 0.3 71.2 0.5
23 (23) Slovenia 40.0 0.3 49.4 0.3
24 (22) Lithuania 38.6 0.3 62.1 0.4
25 (25) Latvia 25.0 0.2 36.7 0.2
26 (26) Estonia 21.2 0.1 27.7 0.2
27 (27) Cyprus 17.9 0.1 20.2 0.1
28 (28) Malta 9.3 0.1 11.3 0.1
EU28 14,774.0 100.0 14,774.0 100.0
Note: All GDP data for 2016 are preliminary European Commission estimates. The positions given in the first column refer to GDP calculated at CER and PPS (the latter in parenthesis). The percentage shares in the EU28 total were calcu-lated by the authors.
Source: European Commission (2016).

Chapter 1. Comparative Assessment of Development Trends in 2010–2016 17
The European Union now comprises 28 member states of very different sizes and different economic potential. The five biggest countries in terms of population numbers and production volume—Germany, the United Kingdom, France, Italy, and Spain—represent 63% of the EU28’s total population and 71% of its combined GDP calculated at CER or 67% if calculated at PPS. The 15 Western European countries that belonged to the EU before its major enlargement (EU15) represent 79% of the total population and produce 92% of the combined GDP calculated at CER, or 86% of the combined GDP calculated at PPS. The 13 new member states that joined the EU in 2004, 2007 or later—11 CEE countries plus Cyprus and Malta—represent 21% of the total popu-lation, but produce 8% or 14% of the total GDP respectively. This asymmetry between the “old core” and the new entrants (or, more broadly, between Western Europe and Central and Eastern Europe) should be borne in mind when evaluating the position of Poland in the European Union.
Poland is the largest country among the new EU member states in terms of area, population and GDP. Poland ranks sixth in the enlarged European Union in terms of area and population (7.1% and 7.4% respectively). In terms of GDP value calculated at PPS, it also ranks sixth (5.2%), but it is eighth (2.9%) if GDP is converted using CER. Poland’s ranks within the European Union did not change from 2015. As can be seen, Poland’s share in the EU28’s economic potential is much lower than what is indicated by the size of its territory or population, but, in light of historical expe-rience, this should come as no surprise; a similar disproportion is in evidence for all other CEE countries.
Poland has significantly improved its position in the European economy since it joined the EU. Its share in the combined output of all the current EU member countries (EU28), calculated at CER, rose from 1.9% in 2004 to 2.8% in 2010, and 2.9% in 2016. Likewise, Poland’s share in the total output of the EU28 calculated at PPS rose from 3.6% in 2004 to 4.7% in 2010, and 5.2% in 2016.
Economic growth and real convergence
The Polish economy decelerated last year. The country’s GDP growth rate was more than 1 percentage point lower than a year earlier, and it was also lower than the average for the entire transition period and below those of several other coun-tries in Central and Eastern Europe. This, however, did not fundamentally change the overall development trends in Poland in a comparative perspective. Poland’s average annual GDP growth in 1990–2016 was the fastest among the new EU members from Central and Eastern Europe (EU11), and more than twice as fast as the average for

Ryszard Rapacki, Mariusz Próchniak18
the “old core” (EU15). Poland and these two groups of countries continued their dis-similar economic growth trajectories from 2004 to 2016, after Poland’s EU entry. The situation changed slightly in the 2010–2016 period studied in this year’s report. Var-iations in economic growth significantly decreased during this period, both within the CEE group and between CEE countries and the EU15 average. Table 1.3 provides detailed data.
Table 1.3. Growth of Gross Domestic Product, 1990–2016
Country
Real GDP growth rate (constant prices) Real GDP index
in 2016Average annual % growth Annual % growth
1990–2016 2010 2015 2016a 1989 = 100 2004 = 100 2010 = 100
Poland 3.0 3.7 3.9 2.8 225 156 120
Bulgaria 0.9 1.3 3.6 3.4 126 140 118
Croatia 0.1 –1.1 1.5 2.8 104 107 100
Czech Republic 1.5 –0.5 4.2 2.6 148 131 107
Estonia 1.6 1.6 1.3 1.3 154 131 117
Lithuania 0.9 3.5 1.5 2.2 125 139 126
Latvia 0.6 3.0 2.6 1.5 117 131 120
Romania 1.0 3.0 3.8 4.8 132 142 114
Slovakia 2.4 1.4 3.3 3.3 190 155 118
Slovenia 1.5 –1.1 2.7 2.6 150 119 102
Hungary 1.3 1.9 2.9 2.0 143 114 111
EU15b 1.5 0.1 1.7 1.5 150 112 114
a The data for 2016 refer to the first three quarters and are calculated as the arithmetic averages of the quarterly GDP growth rates, compared with the corresponding quarter of the previous year.b Weighted average.Growth indexes 1989 = 100 are also based on EBRD estimates that go back to 1989.
Source: Eurostat (ec.europa.eu/eurostat); own calculations.
Poland was the only CEE country to see its GDP more than double (an index of 225) from 1990 and 2016. This represented an average annual growth rate of 3.0% (including the transformation recession period of 1990–1991). Slovakia, with an av-erage annual growth rate of 2.4%, was the only other transition country with com-parable growth dynamics.
Poland’s GDP has grown by 56% since the country joined the EU in 2004, work-ing out to an average annual growth rate of 4.2%. Much as throughout the transition period, Poland led the way among new EU member states in this respect from 2004 to 2016 (closely followed by Slovakia with 55%). At the same time, Poland significantly outpaced the EU15 in terms of economic growth.

Chapter 1. Comparative Assessment of Development Trends in 2010–2016 19
However, during the studied period of 2010–2016, Poland lost its leadership among CEE countries in terms of economic growth. Its advantage over EU15 countries also decreased significantly, with the real GDP growth indexes at 120 and 114 respectively (see Table 1.3). This was mainly due to a significant slowdown in Poland’s growth; its average annual GDP growth rate was 3.1% from 2010 to 2016, over 1 percentage point less than in the 2004–2016 period, i.e. after the country’s accession to the EU (4.2%). It cannot be ruled out that the trends discussed here are a first, early sign of changes in prevailing growth trajectories within the EU, including a deceleration or even rever-sal of the process of Poland’s real convergence with EU15 economies (Weresa, 2016).
As a result of the combined impact of these trends, Poland in the 1990–2016 pe-riod managed to significantly narrow its gap in economic development with all EU15 countries (except Ireland) as well as all CEE economies. Changes in the relative de-velopment level of the Polish economy resulted not only from its fast growth but also from diverging demographic trends and different appreciation paths for real exchange rates in individual countries.3
The process of real income convergence was the fastest with respect to Britain, Italy, and Greece. In an unprecedented development, Poland completely closed its development gap with Greece at the end of 2015, outracing an “old” EU member for the first time.
As far as the new EU member countries in the CEE region are concerned, Poland was the most successful in catching up with the region’s wealthiest countries, i.e. Slo-venia and the Czech Republic. Poland also managed to outperform Hungary in terms of GDP per capita for the first time since the pre-World War II period.
As seen in Table 1.4, in 2016 Poland’s GDP per capita in PPP terms stood at 65% of the EU15 average.4 This was equivalent to a gain of 27 percentage points from 1989 to 2016, of which 22 points were gained since Poland’s EU entry in May 2004. These trends can be attributed to a remarkable acceleration in Poland’s real convergence process after EU accession. From 1990 to 2003, the gain was 0.5 p.p. per year on aver-age; in 2004–2016 it quadrupled to nearly 2 p.p. annually.
Poland’s growth and real convergence performance looks quite good compared with other new EU members from Central and Eastern Europe, particularly in the long term encompassing the systemic transformation process so far. From 1990 to 2016,
3 While the Polish population increased only slightly between 1989 and 2015 (to 38.446 million from 38.173 million, or 0.7%), EU15 countries experienced more sizeable demographic growth. Their overall population increased by 9.2%, from 369 million to 403 million. These demographic trends are reflected in larger GDP growth rate differentials in per capita terms. While the rate for Poland was 2.9% annually, the EU15 average for GDP per capita growth was 1.3% per annum.
4 However, it is worth remembering that, considering the market (current) exchange rate, Poland’s GDP represented only 34% of the EU15 average in 2015 (own calculations based on Eurostat data).
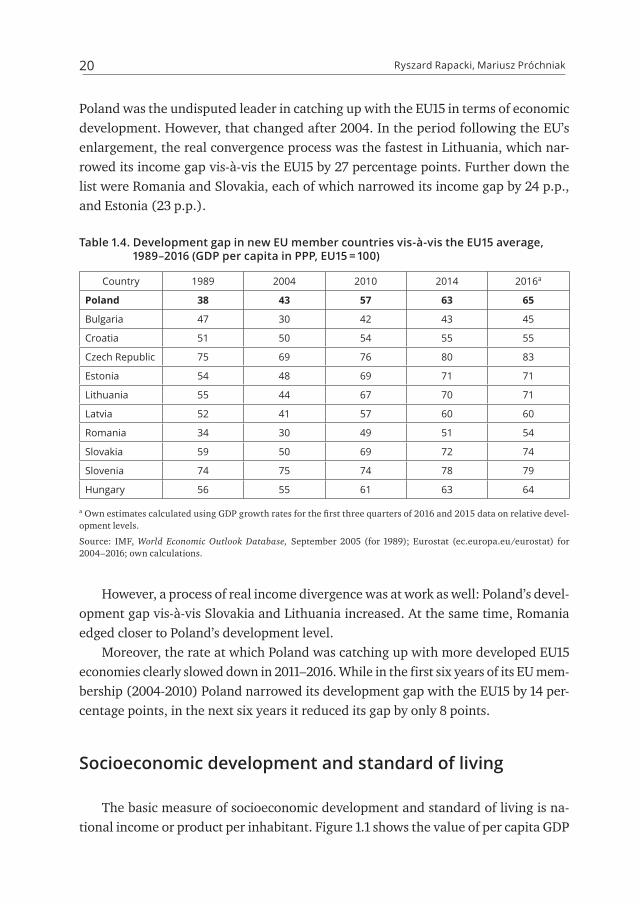
Ryszard Rapacki, Mariusz Próchniak20
Poland was the undisputed leader in catching up with the EU15 in terms of economic development. However, that changed after 2004. In the period following the EU’s enlargement, the real convergence process was the fastest in Lithuania, which nar-rowed its income gap vis-à-vis the EU15 by 27 percentage points. Further down the list were Romania and Slovakia, each of which narrowed its income gap by 24 p.p., and Estonia (23 p.p.).
Table 1.4. Development gap in new EU member countries vis-à-vis the EU15 average, 1989–2016 (GDP per capita in PPP, EU15 = 100)
Country 1989 2004 2010 2014 2016a
Poland 38 43 57 63 65
Bulgaria 47 30 42 43 45
Croatia 51 50 54 55 55
Czech Republic 75 69 76 80 83
Estonia 54 48 69 71 71
Lithuania 55 44 67 70 71
Latvia 52 41 57 60 60
Romania 34 30 49 51 54
Slovakia 59 50 69 72 74
Slovenia 74 75 74 78 79
Hungary 56 55 61 63 64
a Own estimates calculated using GDP growth rates for the first three quarters of 2016 and 2015 data on relative devel-opment levels.
Source: IMF, World Economic Outlook Database, September 2005 (for 1989); Eurostat (ec.europa.eu/eurostat) for 2004– 2016; own calculations.
However, a process of real income divergence was at work as well: Poland’s devel-opment gap vis-à-vis Slovakia and Lithuania increased. At the same time, Romania edged closer to Poland’s development level.
Moreover, the rate at which Poland was catching up with more developed EU15 economies clearly slowed down in 2011–2016. While in the first six years of its EU mem-bership (2004-2010) Poland narrowed its development gap with the EU15 by 14 per-centage points, in the next six years it reduced its gap by only 8 points.
Socioeconomic development and standard of living
The basic measure of socioeconomic development and standard of living is na-tional income or product per inhabitant. Figure 1.1 shows the value of per capita GDP

Chapter 1. Comparative Assessment of Development Trends in 2010–2016 21
measured at PPS in EU member countries in 2004 and 2016. The figure enables us to compare the value of GDP per capita and to evaluate the growth of real income in individual countries in the period after the EU’s major enlargement. The GDP per capita data for 2016 are preliminary estimates. Both the total and per capita GDP data for CEE countries calculated at PPS are much higher than the corresponding values calculated at CER.
According to our calculations based on preliminary data by the European Com-mission (European Commission, 2016), the average per capita GDP in the enlarged EU (EU28), calculated at PPS, was EUR 28,875 in 2016. In the current euro area (EA19) it was EUR 31,550, and in the “old” EU countries (EU15) it was EUR 31,236.
The income levels recorded in individual EU countries vary greatly. Luxembourg leads the EU with a GDP per capita at PPS of EUR 76,437 in 2016.5 A high per capita GDP (between EUR 30,000 and EUR 51,000) is also recorded in Ireland, the Nether-lands, Austria, Sweden, Germany, Denmark, Belgium, the United Kingdom, Finland, and France. Italy and Spain have lower per capita GDPs (at about EUR 27,000). Less advanced Western European countries such as Greece, Portugal, Cyprus, and Malta have much lower per capita incomes (between EUR 19,000 and EUR 26,000). In CEE countries, per capita GDP ranges from EUR 13,964 in Bulgaria to EUR 25,133 in the Czech Republic.
Against this background, Poland’s position in the per capita GDP rankings in the EU is not impressive. With a per capita GDP at PPS of EUR 20,119 in 2016, Poland is in the lower part of the list in the enlarged EU, ahead of Greece, Hungary, Latvia, Cro-atia, Romania, and Bulgaria.
However, GDP per capita is a crude and tentative measure of the standard of living in a country. The living standards of inhabitants are also dependent on income distri-bution and possessed wealth. Unfortunately, international statistics do not offer much data on the financial and real assets of households. Information on income inequality, particularly poverty, is also incomplete and often outdated. The latest estimates of poverty rates made by the World Bank (2017), using the international poverty lines of USD 1.90 or USD 3.10, show that the incidence of absolute poverty in all EU countries is small. However, in most CEE countries a considerable part of the population lives below the income and consumption level recognized as a poverty line using national standards. According to an OECD report on income distribution and poverty (OECD, 2013), based on 2010 data, the relative poverty rate in Poland (the percentage of the population living at less than half of the national median income) was about 11%, an
5 The unusually high value of GDP per capita in Luxembourg is largely due to high incomes generated by international corporations, banks and financial institutions based in that country. This does not adequately reflect the average living standard of inhabitants compared with other Western European countries.

Ryszard Rapacki, Mariusz Próchniak22
indicator roughly equal to the OECD average, but almost twice as high as in the Czech Republic and Denmark.
Figure 1.1. EU28 member countries by GDP per capita in PPS (EUR)
13,964
16,928
16,936
18,683
19,821
19,893
20,119
21,120
21,630
22,271
22,630
23,896
23,941
25,133
25,862
26,672
27,291
30,157
30,934
31,525
33,576
35,062
35,748
35,866
36,404
36,710
50,491
76,437
31,236
28,875
7,736
7,505
12,707
10,548
13,872
21,415
11,058
12,321
11,161
17,093
12,598
19,109
21,758
17,655
18,005
22,306
24,168
24,465
26,186
28,991
26,937
27,929
26,186
28,853
28,473
29,823
32,137
55,011
25,629
22,524
0 10,000 20,000 30,000 40,000 50,000 60,000 70,000 80,000 90,000
2004 201628. Bulgaria
27. Romania
26. Croatia
25. Latvia
24. Hungary
23. Greece
22. Poland
21. Estonia
20. Lithuania
19. Portugal
18. Slovakia
17. Slovenia
16. Cyprus
15. Czech Republic
14. Malta
13. Spain
12. Italy
11. France
10. Finland
9. United Kingdom
8. Belgium
7. Denmark
6. Germany
5. Sweden
4. Austria
3. Netherlands
2. Ireland
1. Luxembourg
EU15
EU28
Note: Ranking based on preliminary PPS GDP estimates for 2016; reference data for 2004 illustrating change after EU enlargement; GDP per capita calculated by dividing total GDP by total population.
Source: Own study based on European Commission data (European Commission, 2016).
Chapter 1. Comparative Assessment of Development Trends in 2010–2016 23
The common view in Poland is that the country’s solid track record in economic growth, measured by an increase in real GDP, has not translated well into the well-be-ing of the average citizen. If this opinion is true, one important factor contributing to this feeling is a high dispersion of income and wealth distribution.
A conventional gauge of income inequality is the Gini coefficient, which meas-ures the overall concentration of household income. Poland is among EU countries with relatively high income inequalities. In 2014, the Gini coefficient for Poland was 32.1 (World Bank, 2017).6
A concise measure of social development and the standard of living is the Human Development Index (HDI), compiled by the United Nations Development Programme (UNDP). It is the geometric mean of three component indices reflecting gross national income (GNI) per capita, life expectancy at birth, and education level, which are assumed to represent three basic dimensions of human development: a long and healthy life, thorough knowledge, and a decent standard of living. The index values range from 0 to 1; higher values imply a higher development level.
According to the latest Human Development Report (UNDP, 2016), based on 2014 data, Norway, Australia, Switzerland, Germany, Denmark, Singapore, and the Neth-erlands lead the way in the global HDI classification. Slovenia (ranked 25th) was the best performer among CEE countries, followed by the Czech Republic, Estonia, Poland, Lithuania, Slovakia, Hungary, Latvia, Croatia, Romania, and Bulgaria (56th). Poland, with an HDI of 0.855, is close to the CEE average, but behind most other EU28 coun-tries and ahead of only Lithuania, Portugal, Hungary, Latvia, Croatia, Romania, and Bulgaria. Poland is No. 36 among 188 countries in the worldwide HDI rankings and No. 20 in the EU.
Poland’s HDI has increased consistently, which testifies to the sustainability of the country’s socioeconomic development. However, Poland’s position in the world-wide HDI rankings is still remote. Nor does Poland rank high in the HDI league table in terms of the three components of the index: income, health, and education.
Comparative assessment of macroeconomic performance
Our assessment of the current condition of the Polish economy is based on an anal-ysis of five macroeconomic indicators commonly used in comparative assessments of macroeconomic performance: (a) the rate of economic growth, (b) unemployment rate, (c) inflation rate, (d) general government balance, and (e) current-account
6 More information on income inequality and poverty in Poland can be found in chapter 3 of this report.

Ryszard Rapacki, Mariusz Próchniak24
balance. The key tool used in this analysis is called the pentagon of macroeconomic performance. It illustrates the extent to which individual countries meet five macro-economic goals: (a) economic growth, (b) full employment, (c) internal equilibrium (no inflation), (d) public finance equilibrium, and (e) external equilibrium. The extent to which these goals have been achieved in a given year is expressed by the five var-iables marked on the pentagon axes.
The tips of the pentagon, representing maximum or minimum values of the indica-tors, are considered to be desirable (positive) targets, although in some cases this can be disputable. For example, a high current-account surplus or a budget surplus, accom-panied by zero inflation or zero unemployment, may not be an optimal result. Another problem is interrelations (notably conflicts) between various macroeconomic goals. For example, low unemployment (according to the Phillips curve) is often accompa-nied by high inflation, and vice versa. A separate question is the relative significance of each criterion (e.g. whether low inflation is as important as low unemployment). All these reservations should be taken into account when interpreting such charts.
When comparing the pentagons drawn for a given year among individual coun-tries, we should consider both their surface and shape. A larger surface of the pen-tagon is assumed to mean better economic performance, while a more harmonious shape indicates more balanced growth. Of course, such an assessment is confined to the five aforementioned parameters of current macroeconomic performance. It tells nothing about the size of an economy, its potential, or its development prospects. It does not even tell much about its possible performance in the next year, though an economy in good condition increases the chances of good future performance. Nevertheless, any analysis based on this method should be conducted with caution.
Let us now compare the overall performance of the Polish economy in 2016 with the situation seen in three other CEE countries: Hungary, the Czech Republic, and Slovakia, and in five Western European economies: Germany, France, Italy, Spain, and Sweden. Table 1.5 includes data on the five macroeconomic indicators reflect-ing the performance of the analyzed economies in 2016. Most of the data are prelim-inary estimates that may be subject to further corrections and revisions. Figure 1.2 presents the data in the form of pentagons, which are more convenient for a com-parative analysis.
Both the surface and the shape of the pentagon reflecting the overall condition of the Polish economy in 2016 are similar to those shown by Hungary, the Czech Repub-lic, and Slovakia. This means that among these indicators, the overall performance of these economies was more or less comparable. All four countries noted a consid-erable rise in output last year, no lower than 2%, combined with a decrease in unem-ployment, though its level remains quite high, especially in Slovakia (nearly 10%).

Chapter 1. Comparative Assessment of Development Trends in 2010–2016 25
Inflation was practically eliminated in all these countries, with Poland and Slovakia reporting a slight deflation. Poland’s budget deficit was higher than Hungary’s and Slo-vakia’s, and much higher than the Czech Republic’s, but it stayed under the 3%-of-GDP threshold. Poland and Slovakia closed their external current accounts with a slight deficit, while the Czech Republic and Hungary both managed to achieve a surplus. In the case of Hungary, the surplus was less than 5% of GDP.
Table 1.5. Key macroeconomic indicators for Poland and selected other EU countries in 2016
CountryGDP growth Inflation Unemployment General government
balanceCurrent-account
balance
% % % % of GDP % of GDP
Czech Republic 2.5 0.6 4.1 –0.6 1.5
France 1.3 0.3 9.8 –3.3 –0.5
Spain 3.1 –0.3 19.4 –4.5 1.9
Germany 1.7 0.4 4.3 0.1 8.6
Poland 3.1 –0.6 6.3 –2.8 –0.1
Slovakia 3.4 –0.2 9.9 –2.3 –1.0
Sweden 3.6 1.1 6.9 –0.4 5.0
Hungary 2.0 0.4 6.0 –2.0 4.9
Italy 0.8 –0.1 11.5 –2.5 2.2
Note: All the data are preliminary estimates. Data on inflation refer to the average annual growth in the prices of con-sumer goods and services. Moreover, the economic growth rates for Poland and other CEE countries given in the table are slightly different from those in Table 1.3; this is because these data come from different sources. According to Table 1.3, Poland’s GDP grew 2.8% in 2016.
Source: IMF (2017).
The shape of the pentagon for Poland is also similar to the shapes for Sweden and Germany, but its surface is smaller, especially compared with Germany, which had very good current-account data. This indicates that using these five criteria, the results achieved by the Polish economy in 2016 were generally poorer. GDP growth in Poland was much faster than in Germany, and the inflation rate was lower than in Germany, but in all other respects Germany had better scores. Compared with Swe-den, Poland was outdistanced by 0.5 percentage points in output growth and shared a similar unemployment rate, but Sweden had a lower budget deficit and a signifi-cant current-account surplus.
The shape of the pentagon for Poland is also similar to that for France, but its sur-face is much larger. This suggests that the overall current performance of the Polish economy in 2016 was better under these five macroeconomic terms. The main han-dicap of the French economy, compared with Poland, was very slow output growth,

Ryszard Rapacki, Mariusz Próchniak26
coupled with high unemployment. As regards the three remaining indicators of eco-nomic performance, the results noted by both economies were roughly similar in 2016.
Figure 1.2. Macroeconomic performance in Poland and selected other EU countries in 2016
20
INF–10
15105
–505
GDP
UNE
CAB GOV
51015
5–5
–15–25
5–5–15
–2520 20
INF–10
15105
–505
GDP
UNE
CAB GOV
51015
5–5
–15–25
5–5–15
–2520 20
INF–10
15105
–505
GDP
UNE
CAB GOV
51015
5–5
–15–25
5–5–15
–2520
20
INF–10
15105
–505
GDP
UNE
CAB GOV
51015
5–5
–15–25
5–5–15
–2520 20
INF–10
15105
–505
GDP
UNE
CAB GOV
51015
5–5
–15–25
5–5–15
–2520 20
INF–10
15105
–505
GDP
UNE
CAB GOV
51015
5–5
–15–25
5–5–15
–2520
20
INF–10
15105
–505
GDP
UNE
CAB GOV
51015
5–5
–15–25
5–5–15
–2520 20
INF–10
15105
–505
GDP
UNE
CAB GOV
51015
5–5
–15–25
5–5–15
–2520 20
INF–10
15105
–505
GDP
UNE
CAB GOV
51015
5–5
–15–25
5–5–15
–2520
Hungary Czech Republic Slovakia
Poland Sweden Germany
France Italy Spain
GDP – GDP growth rate (%)UNE – unemployment (%)INF – CPI inflation (%)GOV – general government balance (% of GDP)CAB – current-account balance (% of GDP)
Source: Author’s own elaboration based on the data shown in Table 1.5.
Chapter 1. Comparative Assessment of Development Trends in 2010–2016 27
Poland continued to perform much better economically than Spain, which finally overcame a prolonged recession but is still plagued by huge unemployment, a large budget deficit, and a substantial public debt. Much the same can be said about the general macroeconomic performance of Poland and Italy, whose economy was still slack, with slow output growth, high unemployment, and a giant public debt.
Compared with the previous year, the overall performance of the Polish economy did not change substantially in 2016, given the five key macroeconomic indicators considered here (IMF, 2017). GDP growth was about 1 percentage point lower than in 2015; a slight deflation continued; the budget deficit was kept below 3% of GDP; the current account was basically equal in both years; and the labor market improved, with unemployment falling from 7.5% in 2015 to 6.3% in 2016.
In conclusion, in terms of the five main macroeconomic indicators characteriz-ing the overall condition of the economy, the results obtained by Poland in 2016, as in the previous year, were relatively good in the context of the overall economic sit-uation in Europe.
However, the unquestionable achievements recorded during the whole period of systemic transformation and the poor macroeconomic results achieved in recent years should not obscure many still unresolved economic and social problems and serious threats to the future development of the Polish economy.
Overall, much as in the previous year, Poland did relatively well in 2016 in terms of the five basic macroeconomic performance indicators, especially in the context of the general economic situation in Europe.
Nevertheless, Poland’s economic achievements throughout the transformation period and its relatively good macroeconomic performance in the last few years should not obscure the existence of several unresolved economic and social problems as well as some serious threats to future development.7
References
European Commission (2016), Statistical Annex of European Economy, Autumn 2016, ec.eu-ropa.eu.
Eurostat (ec.europa.eu/eurostat).IMF (2005), World Economic Outlook Database, September.IMF (2017), World Economic Outlook Database, October 2016 (updated 16 January 2017), www.
imf.org, accessed Feb. 15, 2017.
7 See chapter 6 of this report for a broader discussion of these risks.

Ryszard Rapacki, Mariusz Próchniak28
Matkowski Z., Próchniak M., Rapacki R., (2016), Income Convergence in Poland vis-à-vis the EU: Major Trends and Prospects, in: Poland. Competitiveness Report 2016. The Role of Economic Policy and Institutions, M. A. Weresa (ed.), World Economy Research Institute, SGH War-saw School of Economics, Warsaw 2016, pp. 37–55.
Matkowski Z., Rapacki R., Próchniak M., (2016), Comparative Economic Performance: Poland and the European Union, in: Poland. Competitiveness Report 2016. The Role of Economic Policy and Institutions, M. A. Weresa (ed.), World Economy Research Institute, SGH War-saw School of Economics, Warsaw 2016, pp. 11–35.
OECD (2013), Crisis Squeezes Income and Puts Pressure on Inequality and Poverty, OECD, Paris.UNDP (2016), Human Development Report 2016. Human Development for Everyone, United
Nations Development Programme, hdr.undp.org.United Nations (2017), World Economic Situation and Prospects 2017, New York.Weresa M. A., (ed.) (2016), Poland. Competitiveness Report 2016. The Role of Economic Policy
and Institutions, World Economy Research Institute, SGH Warsaw School of Economics, Warsaw 2016.
World Bank (2017), World Development Indicators Database, databank.worldbank.org, acces-sed Feb. 15, 2017.

Chapter 2
Income Convergence Between the CEE Region and Western Europe
Mariusz Próchniak
Introduction
This chapter assesses income convergence among the 11 Central and Eastern Euro-pean (CEE) countries that joined the European Union in 2004, 2007, and 2013: Poland, Bulgaria, Croatia, the Czech Republic, Estonia, Hungary, Latvia, Lithuania, Romania, Slovakia, and Slovenia (EU11). Convergence in these countries is analyzed compared with the old EU members (EU15). This study is a follow-up to previous analyses on the subject published in earlier editions of this report (see e.g.: Matkowski, Próch-niak, Rapacki, 2016a). The 2013 edition includes an analysis of regional convergence in regions across the EU (Matkowski and Próchniak, 2013).
Theoretical basis for income convergence analysis
The theoretical background for income convergence is found in models of eco-nomic growth. Neoclassical models of economic growth (e.g. Solow, 1956; Mankiw, Romer, Weil, 1992) confirm the existence of conditional β convergence. It occurs when less developed economies (those with lower GDP per capita) grow faster than more developed ones when all the economies tend to reach the same steady state. The con-cept of β-convergence can be explained using the basic Solow model (see, for exam-ple, Rapacki, Próchniak, 2012; Próchniak, Witkowski, 2012).
In the Solow model, the equation that describes the drive of the economy toward a steady state is:
k sf k n a kδ( ) ( )= − + + , (2.1)
where: k – capital per unit of effective labor in year t, k – change of k per unit of time (from a mathematical point of view it is a derivative of k with respect to time), s – sav-

Mariusz Próchniak30
ing rate, f(k) – production function (per unit of effective labor), n – rate of population growth, a – rate of exogenous technical progress, δ – rate of capital depreciation. In the analysis of the Solow model with technological progress, the symbols k and f(k) denote capital and production per unit of effective labor respectively, where effective labor is the product of the level of technology and labor input.
If we assume that the production function is of the Cobb-Douglas type and takes the form of f(k) = kα(0 < α < 1), equation (2.1) is transformed into:
k sk n a kδ( )= − + +α . (2.2)
By dividing equation (2.2) by k, we obtain a formula for the rate of capital growth per unit of effective labor during the transition period toward the steady state:
kk
sk n a1 δ( )= − + +α− . (2.3)
Since output is proportional to capital, a similar equation characterizes the growth of GDP per unit of effective labor.
Figure 2.1. Economic growth in the Solow model
n + a + δ
(a)
n + a + δ
(b)
(skα – 1)KWRskα – 1
(skα – 1)KSR
k(0)KSRkk(0) k* kk(0)KWR k*KWRk*KSR
KSRKWRk
k
.kk
. kk
.
Source: Own work.
The graphical analysis of equation (2.3) is the best way to illustrate the conver-gence hypothesis. This is shown in Figure 2.1. The growth rate equals the vertical dis-tance between curve skα – 1 and line n + a + δ. As we can see, an economy starting from capital level k(0) and reaching steady-state capital value k* will reveal a decreasing rate of economic growth. The convergence is conditional because it is limited to a sit-uation in which both economies tend to reach the same steady state.
In order to illustrate the conditional nature of the convergence process, let us con-sider two countries: a highly developed one and a poorly developed one, with different

Chapter 2. Income Convergence Between the CEE Region and Western Europe 31
saving rates. Since the saving rate in the highly developed country (HDC) is higher, the steady-state value of capital in this country is also higher than in the poorly devel-oped country (PDC). This is shown in Figure 2.1, part (b). Although the highly devel-oped country starts from a higher capital level, it reveals more rapid growth, because it approaches a different steady state than the poorly developed country. In this case, both economies will not converge.
An important target of empirical research is to estimate the value of parameter β, which measures the speed of convergence toward the steady state, according to the equation:
yy
y yln * lnβ ( )= − , (2.4)
where: y – output per unit of effective labor in year t, y – change of y per unit of time (time derivative), y* – output per unit of effective labor in the steady state.
The parameter β tells us what part of the distance from the steady state the econ-omy covers during one period (year). For example, if β = 0.02, the economy covers 2% of the distance annually.
Another type of convergence is σ-convergence. It occurs when income differentia-tion between economies decreases over time. Income differentiation can be measured by the standard deviation, variance, or a coefficient of variation of GDP per capita levels between countries or regions.
From a theoretical point of view, σ-convergence is a necessary but insufficient con-dition for β-convergence. Thus, it is possible (though not very probable) that income differentiation between economies increases over time and the less developed econ-omy reveals a higher rate of economic growth. This occurs, for example, when the less developed economy grows so rapidly that it will outperform the more developed one in income level and the final differences in GDP per capita between both econo-mies will be greater than initially.
Methodology of convergence analysis
To verify the absolute β-convergence hypothesis, we estimate the following regres-sion equation:
T
y
yy
1ln lnT
t0
0 1 0α α ε= + + , (2.5)

Mariusz Próchniak32
where yT and y0 are the per capita GDP levels in the final and initial years respectively, and εt is a random factor. Thus the explained variable is the average annual growth rate of real GDP per capita between period T and 0, while the explanatory variable is the log of the GDP per capita level in the initial period. If parameter α1 is negative and statistically significant (in the empirical analysis we assumed a significance level of 15%), β-convergence exists. In such a case we can calculate the value of coefficient β, which measures the speed of convergence,1 from:
T
T1
ln 11
β α( )= − + . (2.6)
In order to verify the σ-convergence hypothesis, we estimate the trend line of dis-persion in income levels between countries:
y tsd lnt t0 1
α α ε( ) = + + , (2.7)
where sd is standard deviation and t is time (t = 1,…, 24 for 1993–2016). Then the explained variable is the standard deviation of log GDP per capita levels between the economies while the explanatory variable is the time variable. If parameter α1 is neg-ative and statistically significant, σ-convergence exists.
Income convergence between new and old EU members; Poland in the EU: empirical analysis results
This analysis covers the 1993–2016 period. All the calculations were also made for three subperiods, 1993–2000, 2000–2008 and 2008–2016, in order to assess the stability of the catching-up process over time. The calculations are based on the time series of real GDP per capita at purchasing power parity (PPP in $), extracted from the International Monetary Fund database (IMF, 2017). When converting nominal
1 Barro and Sala-i-Martin (2003, p. 467) analyze β-convergence based on the neoclassical model; they derive an equation that shows the relationship between the average GDP growth rate and the initial income level:
T y y a e T y w1/ ln / 1 / lniT i
Ti i T0 0 0,( )( ) ( ) ( )= − − +β− ,
where yiT and yi0 – GDP per capita of country i in the final and initial years, T – the length of period, β – the convergence parameter, a – a constant term, wi0, T – a random factor. The coefficient on initial income, i.e. –[(1 – e–βT)/T] equals parameter α1 in equation (2.5). Thus, from equation α1 = –[(1 – e–βT)/T] we obtain equation (2.6). For a small T, regression coefficient α1 is very similar to convergence parameter β because if T tends to zero the expression (1 – e–βT)/T approaches β.

Chapter 2. Income Convergence Between the CEE Region and Western Europe 33
GDP per capita at PPP (in current prices) into real GDP per capita at PPP (in constant prices), we used the GDP deflator for the United States.
The results of testing β-convergence between the EU11 countries and the EU15 are presented in Table 2.1 and Figure 2.2. The convergence is analyzed among the 26 EU countries as well as between the EU11 and EU15 areas. The aggregated data for the two regions, EU11 and EU15, are weighted averages with variable weights reflecting the population of a given country included in a specific group in a given year.
Table 2.1. Regression results for β-convergence
Period α0 α1t-stat.
(α0) t-stat.
(α1) p-value
(α0) p-value
(α1) R2 β-convergence β
26 countries of the enlarged EU
1993–2016 0.2054 –0.0185 6.53 –5.80 0.000 0.000 0.5833 yes 0.0186
1993–2000 0.0697 –0.0036 1.18 –0.61 0.250 0.549 0.0151 no –
2000–2008 0.4238 –0.0387 9.38 –8.66 0.000 0.000 0.7574 yes 0.0395
2008–2016 0.1182 –0.0110 1.56 –1.51 0.131 0.145 0.0863 yes 0.0110
2 regions (EU11 and EU15)
1993–2016 0.2493 –0.0231 . . . . 1.0000 yes 0.0234
1993–2000 0.1437 –0.0116 . . . . 1.0000 yes 0.0116
2000–2008 0.4482 –0.0417 . . . . 1.0000 yes 0.0426
2008–2016 0.3092 –0.0293 . . . . 1.0000 yes 0.0297
Source: Own calculations.
Figure 2.2. GDP per capita growth rate over the 1993–2016 period and the initial GDP per capita level
UE11
UE15
CZ
EE
HU
LV
LT
PL
SK
SI
BGHR
RO
ATBE
DK
FI
FR
DE
GR
IE
IT
LU
NL
PT
ES
SE
UK
gy = −0.0185y0 + 0.2054R2 = 0.5833
gy = −0.0231y0 + 0.2493
0.00
0.01
0.02
0.03
0.04
0.05
8.90 9.10 9.30 9.50 9.70 9.90 10.10 10.30 10.50 10.70 10.90 11.10
Annu
al g
row
th r
ate
of r
eal
GD
P pe
r ca
pita
, 199
3–20
16
Log of real 1993 GDP per capita
EU11 (average) & EU15 (average)EU11EU15Trend line: 26 countriesTrend line: EU11 (average)& EU15 (average)
Source: Own calculations.

Mariusz Próchniak34
The results confirm the existence of a clear-cut income-level convergence of the EU11 countries toward the EU15 throughout the 1993–2016 period. The catching-up process took place both among the 26 countries of the examined sample and between the two regions, EU11 and EU15. Countries with lower 1993 income levels recorded more rapid economic growth on average in 1993–2016 than countries that were ini-tially more developed. Since the Central and Eastern European economies were less developed in 1993, these results demonstrate an evident catching-up process by the EU11 countries with Western Europe.
Figure 2.2 shows that the dispersion of the points representing individual coun-tries is not far from the negatively sloped trend line. This results in a relatively high value of the R-squared coefficient, at a level close to 60%. Differences in the initial income level account for almost two-thirds of the differences in the economic growth rates for the 1993–2016 period.
The points marked in Figure 2.2 make it possible to compare the outcomes of indi-vidual countries and to assess changes in their competitive positions during the stud-ied period. The highest GDP per capita growth rates in Central and Eastern Europe were reported by the Baltic states and Poland. GDP per capita in Latvia, Lithuania, Estonia, and Poland grew at a rate exceeding 4% annually throughout the 1993–2016 period, although these countries’ initial income levels were relatively low. Slovakia also recorded a rate of economic growth at about 4%, but its initial income level was slightly higher. The results shown by these countries helped strengthen convergence inside the group.
The position of Poland is favorable compared with other countries. Poland ranked fourth in terms of the average rate of economic growth among the 11 CEE countries in 1993–2016, which was one of the factors leading to an improvement in the coun-try’s competitive position.
Aggregated data for the two regions, the EU11 and EU15, further confirm the exist-ence of convergence in the 1993–2016 period. In Figure 2.2, the points representing these two regions are marked by squares. The EU11 group as a whole recorded more rapid economic growth than the EU15 area, but the group’s initial income level was much lower.
The β-coefficients, which measure the speed of convergence, stand at 1.86% for the 26 countries and at 2.34% for the two regions. The β-coefficients allow us to esti-mate the time needed to reduce the development gap between the studied countries. If the average growth patterns observed in 1993–2016 continue, the countries of the enlarged EU will need about 30–35 years to reduce the gap to their common hypo-thetical steady state by half. The value is calculated as follows: –ln(0.5)/0.0186 = 37.3 years and –ln(0.5)/0.0234 = 29.6 years.

Chapter 2. Income Convergence Between the CEE Region and Western Europe 35
These results point to a slow catching-up process by the EU11 countries toward Western Europe. Based on these estimates, it is not expected that the income lev-els in Poland and other Central and Eastern European countries will become equal to those in Western Europe in the medium term.
A closer look at the stability of the convergence process over time reveals that the speed of the catching-up process during the subperiods was highly differentiated. The high instability of the pace of convergence in the analyzed countries was driven by several factors, including the global crisis. In 1993–2000, in the sample of the 26 EU countries, there was no statistically significant decrease of the income gap between the EU11 economies and the EU15 (on average for the whole group). For the 1993–2000 period, the slope of the trend line is negative but statistically insignificant. Such statis-tical outcomes of model estimation indicate a lack of convergence despite the negative slope of the trend line. The speed of convergence accelerated strongly from 2000 to 2008 in a trend that was undoubtedly driven by the EU’s enlargement. The clear-cut convergence trend that occurred at the beginning of the first decade of the 21st cen-tury slowed down substantially after 2008. This was largely due to the global crisis.
The results of β-convergence presented here are the average results for the whole region. As shown in Figure 2.2, individual EU11 countries displayed different rates of GDP per capita growth and different degrees of convergence toward Western Europe. It is worth examining the nature of the catching-up process in individual EU11 coun-tries toward the EU15 in the respective subperiods.
Figure 2.3. The reduction in individual EU11 countries’ income gap toward the EU15 in the three consecutive subperiodsa
2
8
2
5
1
8
48
–6
7
–3
15
21
10
2326
10
20
16 15
11
18
4 5 46
1014
9
–4
6
–3
6
−10
−5
0
5
10
15
20
25
30
CZ EE HU LV LT PL SK SI BG HR RO
1993 --> 20002000 --> 20082008 --> 2016
a The changes are expressed in percentage points; in each year the EU15 GDP per capita at PPP is taken as a base equal to 100.
Source: Own calculations based on IMF data (IMF, 2017).

Mariusz Próchniak36
σ-convergence of the Central and Eastern European countries toward Western Europe is measured by changes in the standard deviation of the GDP per capita levels among the 26 EU countries as well as between the EU11 and EU15 areas. The results of the trend line estimation for standard deviations are shown in Table 2.2. Figure 2.5 offers a graphical illustration of the outcomes.
Table 2.2. Regression results for σ-convergence
Period α0 α1t-stat.
(α0) t-stat.
(α1) p-value
(α0) p-value
(α1) R2 σ-convergence
26 countries of the enlarged EU
1993–2016 0.5677 –0.0095 66.86 –16.07 0.000 0.000 0.9215 yes
1993–2000 0.5326 –0.0010 92.87 –0.91 0.000 0.400 0.1204 no
2000–2008 0.5502 –0.0192 426.40 –83.53 0.000 0.000 0.9990 yes
2008–2016 0.3888 –0.0032 87.20 –4.01 0.000 0.005 0.6967 yes
2 regions (EU11 and EU15)
1993–2016 0.5210 –0.0123 75.73 –25.58 0.000 0.000 0.9675 yes
1993–2000 0.4878 –0.0055 72.32 –4.13 0.000 0.006 0.7398 yes
2000–2008 0.4781 –0.0192 146.60 –33.12 0.000 0.000 0.9937 yes
2008–2016 0.3134 –0.0090 138.02 –22.20 0.000 0.000 0.9860 yes
Source: Own calculations.
Figure 2.4. Standard deviation of GDP per capita, 1993–2016
sd(y) = −0.0095t + 0.5677 R2= 0.9215
sd(y) = −0.0123t + 0.5210R2 = 0.9675
0.22
0.27
0.32
0.37
0.42
0.47
0.52
1993
1994
1995
1996
1997
1998
1999
2000
2001
2002
2003
2004
2005
2006
2007
2008
2009
2010
2011
2012
2013
2014
2015
2016
Stan
dard
dev
iatio
n of
log
of r
eal
GD
P pe
r ca
pita
26 countries2 regionsTrend line: country differentiationTrend line: regional differentiation
Source: Own calculations.
The data in Table 2.2 show that there existed σ-convergence both among the 26 EU countries and between the EU11 and EU15 areas during the time period as a whole.

Chapter 2. Income Convergence Between the CEE Region and Western Europe 37
The slopes of both estimated trend lines are negative and statistically significant at high levels of significance (confirmed by p-values standing at 0.000). The high val-ues of the R-squared coefficients (exceeding 90%) reflect a very good fit of empirical points to the trend line.
Figure 2.4 shows the standard deviation of log GDP per capita levels. As we can see, income differences between the EU11 countries and the old EU members displayed a downward trend on the whole. Income differences decreased the most obviously and consistently in the second part of the analyzed period, which means after 2000. In 2009–2010, due to the global economic crisis and decelerated economic growth in many rapidly developing countries, income differences among the 26 countries of the analyzed group increased, although the average data for the two regions do not support this evidence.
Discussion of the research results
There is a vast body of empirical research on convergence, and it is impossible to list all the studies here. A detailed review of recent empirical research is available in reports including an article by Matkowski, Próchniak and Rapacki (2016b). There are also books by Malaga (2004), Michałek, Siwiński and Socha (2007), Liberda (2009), Batóg (2010), and Jóźwik (2017) that predominately focus on either convergence within the EU or convergence among OECD countries.
Comparing the results obtained here with the literature, it should be emphasized that a growing number of research reports have appeared in recent years suggesting the possible occurrence of a divergence process in Europe at both the national and regional levels. For example, Mucha (2012) suggests that, for some eurozone coun-tries, the possession of the single currency can be a source of many problems and economic divergence with respect to other members of the Economic and Monetary Union. Meanwhile, Monfort, Cuestas and Ordóñez (2013) analyze real convergence in GDP per worker in 23 EU countries from 1980 to 2009 (Western Europe) and from 1990 to 2009 (Central and Eastern Europe). Using club convergence testing techniques, they demonstrate there is strong evidence to argue that there is a divergence pro-cess under way in the EU as a whole in terms of GDP per capita, though Central and Eastern European countries (except the Czech Republic but including Greece) form a convergence group. Borsi and Metiu (2013) analyze the real convergence of 27 EU countries from 1970 to 2010. They conclude that there is no convergence in per cap-ita income levels across the group and that there is convergence within subgroups of countries that tend to different steady states. Staňisić (2012) examines β convergence

Mariusz Próchniak38
in EU25 countries and within two groups of states: the EU15 and the EU10. The study finds the existence of β convergence in the EU25 (meaning the convergence of new EU member states with Western Europe), while disproving the existence of conver-gence within the EU15 and EU10 groups. The author of the cited work also argues that the latest crisis caused income differences among EU25 countries to widen, although the scope and duration of this upward trend was limited and did not affect the long-term convergence path. This conclusion is very similar to the results of our own study.
As can be seen, convergence is not an automatic process. Despite the strong ten-dency to reduce the income gap between Central and Eastern Europe and Western Europe in recent years, there is no guarantee that this situation will continue in the future (as evidenced by the temporal instability of our results and an increasing num-ber of research reports pointing to possible divergence trends in Europe). Therefore, economic policy makers should be encouraged to make every effort to maintain exist-ing long-term economic growth trends in Europe, marked by a shrinking income gap between the eastern and western parts of the continent.
Conclusion
There is an income convergence process under way in the 26 countries of the enlarged European Union in terms of both β convergence and σ convergence. The rate of economic growth in 1993–2016 was negatively related with the countries’ initial GDP per capita levels. New EU member states from Central and Eastern Europe mus-tered faster economic growth than Western European economies even though their initial GDP per capita levels were much lower. Differences in income levels shrank, especially from 2000 to 2008, yet they remain substantial.
The global economic and financial crisis has weakened the convergence process among EU countries, causing temporary divergent trends. It cannot therefore be uncon-ditionally expected that differences in competitiveness, as measured by the standard of living in old and new EU countries, will shrink in the short term. An accelerated convergence process will depend on factors including a well-devised economic policy aimed at reducing differences in the level of development between Central and East-ern Europe and Western Europe.

Chapter 2. Income Convergence Between the CEE Region and Western Europe 39
References
Barro R., Sala-i-Martin X., (2003), Economic Growth, The MIT Press, Cambridge – London.Batóg J., (2010), Konwergencja dochodowa w krajach Unii Europejskiej, Wydawnictwo Naukowe
Uniwersytetu Szczecińskiego, Szczecin.Borsi M. T., Metiu N., (2013), The Evolution of Economic Convergence in the European Union,
Deutsche Bundesbank Discussion Paper, No. 28/2013.IMF (2017), World Economic Outlook Database, October 2016 (updated Jan. 16, 2017), www.
imf.org, accessed Feb. 10, 2017.Jóźwik B., (2017), Realna konwergencja gospodarcza państw członkowskich Unii Europejskiej
z Europy Środkowej i Wschodniej. Transformacja, integracja i polityka spójności, Wydaw-nictwo Naukowe PWN, Warszawa.
Liberda Z. B., (2009), Konwergencja gospodarcza Polski, VIII Kongres Ekonomistów Polskich, Polskie Towarzystwo Ekonomiczne, Warszawa.
Malaga K., (2004), Konwergencja gospodarcza w krajach OECD w świetle zagregowanych modeli wzrostu, Wydawnictwo Akademii Ekonomicznej, Poznań.
Mankiw N. G., Romer D., Weil D. N., (1992), A Contribution to the Empirics of Economic Growth, Quarterly Journal of Economics, vol. 107, pp. 407–437.
Matkowski Z., Próchniak M., (2013), Real Income Convergence, in: Weresa M. A. (ed.), Poland. Competitiveness Report 2013. National and Regional Dimensions, World Economy Research Institute, Warsaw School of Economics, Warsaw, pp. 44–64.
Matkowski Z., Próchniak M., Rapacki R., (2016a), Income Convergence in Poland vis-à-vis the EU: Major Trends and Prospects, in: Weresa M. A. (ed.), Poland. Competitiveness Report 2016. The Role of Economic Policy and Institutions, World Economy Research Institute, Warsaw School of Economics, Warsaw, pp. 37–55.
Matkowski Z., Próchniak M., Rapacki R., (2016b), Real Income Convergence between Central Eastern and Western Europe: Past, Present, and Prospects, Ekonomista, No. 6, pp. 853–892.
Michałek J. J., Siwiński W., Socha M., (2007), Polska w Unii Europejskiej – dynamika konwer-gencji ekonomicznej, Wydawnictwo Naukowe PWN, Warszawa.
Monfort M., Cuestas J. C., Ordóñez J. (2013), Real Convergence in Europe: A Cluster Analysis, Economic Modelling, vol. 33, pp. 689–694.
Mucha M., (2012), Mechanizm dywergencji gospodarczej w strefie euro, Ekonomista, No. 4, pp. 487–498.
Próchniak M., Witkowski B. (2012), Real Economic Convergence and the Impact of Monetary Policy on Economic Growth of the EU Countries: The Analysis of Time Stability and the Iden-tification of Major Turning Points Based on the Bayesian Methods, National Bank of Poland Working Paper, No. 137, Warsaw.

Mariusz Próchniak40
Rapacki R., Próchniak M., (2012), Wzrost gospodarczy w krajach Europy Środkowo-Wschod-niej na tle wybranych krajów wschodzących, Gospodarka Narodowa, No. 1–2, pp. 65–96.
Solow R. M., (1956), A Contribution to the Theory of Economic Growth, Quarterly Journal of Economics, vol. 70, pp. 65–94.
Staňisić N., (2012), The Effects of the Economic Crisis on Income Convergence in the European Union, Acta Oeconomica, vol. 62, pp. 161–182.

Chapter 3
Income Inequality and Poverty in Poland: The Impact of Total Remittances1 on Income
Inequality Among Polish Households from 2008 to 2015
Patrycja Graca-Gelert
Income inequality and poverty are two issues that are increasingly examined in social sciences. The rapidly growing income disparities in many regions of the world, accom-panied by social polarization, make the subject particularly relevant. Income inequality and poverty are complex issues, so it is important that research in this area promotes a better understanding of these processes. Both issues are closely related to the concept of competitiveness, which refers to an improvement in sustainable economic growth and also means an ability to improve the quality of life for society (Weresa, 2015, p. 7). Meanwhile, numerous studies have shown that low levels of income inequality as well as poverty and a low risk of poverty are conducive to economic growth and improve the standard of living, and are even a determinant of its high level.
The aim of this chapter is to show the main trends in income inequality and the risk of poverty in Poland from 2005 to 2015. We also compare Poland with other EU countries in the 2010–2015 period. Moreover, we analyze the impact of total remit-tances on household income disparities in Poland from 2008 to 2015, which is done in reference to migration, one of the forms of cooperation with foreign countries. The year 2016 could not be included in the analysis because no data was available for that year.
1 Total remittances should be understood as both monetary and non-monetary transfers from abroad to households in Poland (including salaries, gifts, and social benefits).

Patrycja Graca-Gelert42
Income inequality and poverty in Poland from 2005 to 2015
Analysis of income inequality and poverty is a complex problem.2 There are several sources of data on the basis of which these two processes can be analyzed in Poland. The most important of these are household budget surveys (HBS) and EU Statistics on Income and Living Conditions (EU-SILC). There are many differences between these data sources that may affect conclusions from the analysis. For example, data on income inequality in Poland, calculated on the basis of HBS and EU-SILC, differ in the reference unit, equivalence scale and the definition of income. Setting aside these differences, it is impossible to replicate the income inequality computations pub-lished by Eurostat on the basis of HBS and vice versa due to substantial discrepancies in methodology and data collection (see European Commission, 2015). It should be emphasized that for these reasons, it is also impossible to directly compare calcula-tions performed on the basis of HBS and EU-SILC data.
For comparison’s sake, Figure 3.1 shows several time series illustrating income ine-quality in Poland in recent years. Unlike other chapters, the analysis covers the period from 2005 due to the nature of the process: generally little variation in the short term. Regardless of the source, the data generally show that income inequality in Poland has decreased since at least 2010. The Gini coefficient was primarily used to show the disparities in income; the coefficient ranges from 0 (perfectly equal distribution of income) to 1 (extremely unequal distribution of income). The Gini coefficient shows income inequality across the income distribution, but it provides no information on the nature of the inequality: for instance, it does not say in which part of the distri-bution (bottom/top) the inequalities are the greatest. As a result, two quite different income distributions can be assessed as either equally uneven or equally even accord-ing to the Gini coefficient. Figure 3.1 also shows income disparities in Poland using the S80/S20 income quintile share ratio, which is applied by Eurostat as an alterna-tive income inequality measure and is calculated as the ratio of total income received by the 20% of the population with the highest income to that received by the 20% of the population with the lowest income.
The main indicators used by GUS to measure and analyze poverty and the risk of poverty in Poland are different from those used by Eurostat to monitor the risk of poverty in the EU. Poland’s Central Statistical Office uses three key poverty measures, calculated on the basis of three poverty lines: a relative poverty line, a statutory pov-
2 More on this can be found in previous editions of this monograph (e.g. P. Graca-Gelert, 2015).

Chapter 3. Income Inequality and Poverty in Poland 43
erty line, and a subsistence poverty line. The indicators based on the last two poverty lines are absolute poverty measures. According to the definitions used by the Central Statistical Office (GUS, 2016c, pp. 4–5), the subsistence poverty line determines an “existence minimum” that covers only those needs which cannot be postponed, and consumption below this level leads to biological deprivation; the statutory poverty line is the amount of income that entitles a household to social benefits according to the law in force; the relative poverty line is equivalent to 50% of the mean monthly house-hold expenditure (HBS data). For the sake of comparison, Figure 3.2 also includes a measure of the risk of poverty used by Eurostat, which is calculated based on a risk-of-poverty threshold at 60% of median equivalized income (EU-SILC data).
Figure 3.1. Income inequality trendsa in Poland, 2005–2015
0.0
1.0
2.0
3.0
4.0
5.0
6.0
7.0
26.0
27.0
28.0
29.0
30.0
31.0
32.0
33.0
34.0
35.0
36.0
37.0
2005 2006 2007 2008 2009 2010 2011 2012 2013 2014 2015
Eurostat GINI GUS GINI PGG GINI OECD GINI Eurostat S80/S20
Gin
i
S80/
S2
a Eurostat – equivalized disposable household income (modified OECD equivalence scale, with the person as the unit of ref-erence); GUS – available per capita household income (with the household as the unit of reference), PGG GINI – equivalized disposable household income (modified OECD equivalence scale; with the household as the unit of reference), OECD GINI – equivalized disposable household income (square root equivalence scale; with the household as the unit of reference).
Source: Eurostat; GUS, 2016a, Table 5, p. 287; OECD; own calculations based on GUS HBS.
Figure 3.2 shows selected measures of the extent of poverty/risk of poverty in Poland. Poverty and the risk of poverty show a somewhat different trend than income inequality. While the two relative measures of the risk of poverty—which are more directly related to the notion of income inequality—show a stabilization, and even a slight downward trend, in the risk of poverty, the absolute measure of poverty shows a temporary increase in the risk in recent years. In the case of the statutory poverty

Patrycja Graca-Gelert44
rate, the risk of poverty increased in 2013 mainly as a result of changes in social inter-vention thresholds.
Figure 3.2. Poverty and the risk of poverty for different poverty lines in Poland, 2005–2015
0
5
10
15
20
25
2005 2006 2007 2008 2009 2010 2011 2012 2013 2014 2015
GUS relative poverty line subsistence poverty linestatutory poverty line Eurostat relative poverty line
%
Source: Eurostat; GUS, 2016c, Figure 1, p. 1.
Income inequality and the risk of poverty in Poland compared with other EU countries from 2010 to 2015
Lithuania, Romania, and Bulgaria were the countries with the greatest income inequalities in 2015 (with a Gini coefficient of 37% and over), while the lowest income inequality occurred in Slovakia, Slovenia, and the Czech Republic (see Table 3.1). An interesting observation is that both the lowest and highest income inequalities were reported in post-socialist countries. The year 2015 was the third consecutive year in which the European Union as a whole recorded an increase in income ine-quality as measured by the Gini coefficient, although most EU countries recorded a decline or no change in income inequalities.3 The greatest increases in income
3 The Gini coefficient for the 28 EU countries is calculated as a weighted average of the population (number of people in a household) for each country.

Chapter 3. Income Inequality and Poverty in Poland 45
inequality in 2015, compared with the previous year, occurred in Lithuania, Roma-nia, and Bulgaria (2.9, 2.7 and 1.6 percentage points respectively), while the great-est decreases were recorded in Slovakia, Cyprus, and Estonia (–2.4, –1.2 and –0.8 p.p. respectively). Income inequality in France and Italy did not change in 2015 com-pared with the previous year.
Over the course of 2010–2015 there were some more substantial changes—mostly increases—in income inequalities in EU28 countries, although they were not always monotonic. Income inequality for the European Union as a whole increased by 0.5 per-centage points, with record growth in Hungary, Romania, Bulgaria, Estonia, and Cyprus (4.1, 3.9, 3.8, 3.5 and 3.5 p.p. respectively). The greatest decline in income inequality occurred in Slovakia, Austria, and Croatia (–2.2, –1.1 and –1.0 p.p. respec-tively). Poland improved its position with regard to both other member countries and in relation to the EU average from 2010 to 2015. In 2010, income inequality in Poland was higher than the EU28 average, while in 2015 it was lower than the EU28 average.
A look at income inequality before social transfers gives a picture of the redistri-bution of income in different EU countries. The two penultimate columns in Figure 3.1 list the Gini coefficient values for disposable income before social transfers exclud-ing pensions and for disposable income before social transfers including pensions for 2015. The figures show that countries such as Portugal, Sweden, Greece, Germany, and Denmark were particularly effective (in absolute terms) in considerably reducing income inequality through social transfers including pensions. In the case of Greece and Portugal, pensions played a key role in this area. In addition, Sweden and Den-mark were characterized by relatively low income disparities after considering social transfers compared with the EU28 as a whole. In Latvia, Estonia, Bulgaria, Lithuania, and Romania, social transfers including pensions made relatively little contribution to reducing income disparities, while income inequalities in these countries were the biggest in the EU28 as a whole. In Poland, social transfers, either including or exclud-ing pensions, were not an important tool in limiting income disparities compared with other EU countries.
While analyzing the data in Table 3.1, it is worth noting that the ordering of coun-tries by ascending income inequality may vary depending on what measure of disper-sion is used (see columns 7 and 10).

Patrycja Graca-Gelert46
Table 3.1. Income inequalitya in Poland compared with other EU countries, 2010–2015b c
Country/Region
2010 2011 2012 2013 2014 2015 2015
Gini coefficient (%) after social transfers
Gini coefficient (%) before
social transfers excluding pensions
Gini coefficient (%) before
social transfers including pensions
S80/S20
Slovakia 25.9 25.7 25.3 24.2 26.1 23.7 27.3 40.4 3.5
Slovenia 23.8 23.8 23.7 24.4 25.0 24.5 30.3 43.9 3.6
Czech Republic 24.9 25.2 24.9 24.6 25.1 25.0 29.4 44.9 3.5
Finland 25.4 25.8 25.9 25.4 25.6 25.2 33.9 47.4 3.6
Sweden 24.1 24.4 24.8 24.9 25.4 25.2 32.5 53.5 3.8
Belgium 26.6 26.3 26.5 25.9 25.9 26.2 34.6 48.0 3.8
Netherlands 25.5 25.8 25.4 25.1 26.2 26.4 32.4 45.9 3.8
Austria 28.3 27.4 27.6 27.0 27.6 27.2 33.6 47.6 4.0
Denmark 26.9 26.6 26.5 26.8 27.7 27.4 37.2 51.7 4.1
Malta 28.6 27.2 27.1 27.9 27.7 28.1 32.7 44.4 4.2
Hungary 24.1 26.9 27.2 28.3 28.6 28.2 34.3 51.5 4.3
Luxembourg 27.9 27.2 28.0 30.4 28.7 28.5 34.7 48.1 4.3
France 29.8 30.8 30.5 30.1 29.2 29.2 35.3 50.2 4.3
Germany 29.3 29.0 28.3 29.7 30.7 30.1 36.3 56.4 4.8
Croatia 31.6 31.2 30.9 30.9 30.2 30.6 36.9 49.4 5.2
Poland 31.1 31.1 30.9 30.7 30.8 30.6 33.8 47.9 4.9
Ireland 30.7 29.8 29.9 30.0 30.8 30.8 45.7 53.9 4.8
EU28 30.5 30.8 30.4 30.5 30.9 31.0 36.4 51.8 5.2
Italy 31.7 32.5 32.4 32.8 32.4 32.4 34.8 48.6 5.8
United Kingdom 32.9 33.0 31.3 30.2 31.6 32.4 40.9 55.5 5.2
Cyprus 30.1 29.2 31.0 32.4 34.8 33.6 37.2 49.9 5.2
Portugal 33.7 34.2 34.5 34.2 34.5 34.0 37.8 64.1 6.0
Greece 32.9 33.5 34.3 34.4 34.5 34.2 36.5 60.7 6.5
Spain 33.5 34.0 34.2 33.7 34.7 34.6 39.4 50.8 6.9
Estonia 31.3 31.9 32.5 32.9 35.6 34.8 38.1 49.1 6.2
Latvia 35.9 35.1 35.7 35.2 35.5 35.4 37.9 49.1 6.5
Bulgaria 33.2 35.0 33.6 35.4 35.4 37.0 40.1 51.6 7.1
Romania 33.5 33.5 34.0 34.6 34.7 37.4 40.4 53.2 8.3
Lithuania 37.0 33.0 32.0 34.6 35.0 37.9 42.1 53.7 7.5
a disposable income per equivalent unit; b in the case of Ireland all the dispersion measures for 2015 come from 2014; c The countries in the table are sorted by the ascending scale of income inequalities measured by the Gini coefficient after social transfers in 2015.
Source: Eurostat.

Chapter 3. Income Inequality and Poverty in Poland 47
As in the case of income inequalities, in 2015 the risk of poverty increased in the EU28 as a whole compared with 2014, yet this increase, at 0.1 p.p.—similar to the case of income inequality—was far less pronounced than in 2014 in year-on-year terms when it stood at 0.5 p.p. In most EU countries, the risk of poverty either decreased or remained unchanged, though the change in the risk of poverty in the countries that experienced an increase was stronger. The greatest increase in the risk of pov-erty in 2015 compared with the previous year occurred in Lithuania (3.1 p.p.), Cyprus (1.8 p.p.), and Latvia (1.3 p.p.), while the greatest decrease took place in Luxembourg (1.1 p.p.), Greece (0.7 p.p.), and Belgium and Sweden (each by 0.6 p.p.). Changes in poverty in 2015 compared with 2010 were more remarkable, with the biggest change in the risk of poverty in Estonia (5.8 p.p.), Romania (3.8 p.p.), and Hungary (2.6 p.p.). Only five countries recorded a decrease in the risk of poverty, which, however, was insignificant. Poland was the only country where the risk of poverty, calculated on the basis of a poverty line set at 60% of median equivalent disposable income, did not change between 2010 and 2015. However, the at-risk-of-poverty rate showed some variation during this five-year period, with the lowest level noted in 2014. Moreover, Poland’s relative position against other EU countries remained practically unchanged; the risk of poverty in Poland in both 2010 and 2015 was slightly higher than the EU average. Romania, Latvia, and Lithuania were the countries with the greatest at-risk-of-poverty rates, while the Czech Republic, the Netherlands, and Denmark showed the lowest risk of poverty.
Individual EU countries have shown varying effectiveness in reducing the risk of poverty through social transfers. Columns 8 and 9 of Table 3.2 list the values of the Gini coefficient for disposable income before social transfers either including or excluding pensions for 2015. As in the case of income inequality, Greece and Portu-gal displayed relatively high effectiveness in reducing the risk of poverty through pensions. Among the countries that were the most effective in reducing the risk of poverty through social transfers after pensions (in absolute terms) were Hungary, Ireland, Greece, Finland, France, and Austria (the risk of poverty rate falling by more than 30 p.p.). If pensions are excluded from the analysis, Ireland, Finland and Den-mark were the most effective in reducing poverty through social transfers (the risk of poverty down by 21.6 p.p., 14.4 p.p. and 13.6 p.p. respectively). The least effective in this regard were Estonia and Latvia (the risk of poverty rate was down by less than 18.5 p.p.) when it comes to social transfers including pensions, and Romania, Greece, Latvia, Poland, and Italy (reduction of the risk of poverty by less than 5.6 pp) for social transfers excluding pensions. Poland was not among countries with relatively high effectiveness in limiting the risk of poverty through social transfers in 2015, although pensions played a relatively important role.

Patrycja Graca-Gelert48
Table 3.2. The risk of povertya in Poland compared with other EU countries, 2010-2015b d
Country/Region
2010 2011 2012 2013 2014 2015 2015
Risk-of-poverty rate after social transfers
Risk
-of-
pove
rty
rate
bef
ore
soci
al tr
ansf
ers
excl
udin
g pe
nsio
ns
Risk
-of-
pove
rty
rate
bef
ore
soci
al tr
ansf
ers
incl
udin
g pe
nsio
ns
Pove
rty
thre
shol
dc P
PP
(EU
R)
Dep
th o
f po
vert
y
Czech Republic 9.0 9.8 9.6 8.6 9.7 9.7 16.8 37.0 14,682 19.2
Netherlands 10.3 11.0 10.1 10.4 11.6 12.1 22.2 39.2 24,270 17.3
Denmark 13.3 12.1 12.0 11.9 12.1 12.2 25.8 40.6 25,684 22.0
Slovakia 12.0 13.0 13.2 12.8 12.6 12.3 19.0 38.1 12,877 28.9
Finland 13.1 13.7 13.2 11.8 12.8 12.4 26.8 43.4 24,482 13.2
France 13.3 14.0 14.1 13.7 13.3 13.6 23.9 44.3 25,055 15.7
Austria 14.7 14.5 14.4 14.4 14.1 13.9 25.6 44.4 27,447 20.5
Slovenia 12.7 13.6 13.5 14.5 14.5 14.3 24.8 42.5 19,029 20.3
Sweden 12.9 14.0 14.1 14.8 15.1 14.5 26.9 42.2 26,733 20.0
Belgium 14.6 15.3 15.3 15.1 15.5 14.9 26.7 43.3 25,101 17.4
Hungary 12.3 14.1 14.3 15.0 15.0 14.9 25.7 49.1 9,978 21.8
Luxembourg 14.5 13.6 15.1 15.9 16.4 15.3 27.2 44.7 21,162 17.4
Ireland 15.2 15.2 15.7 14.1 15.6 15.6 37.2 48.8 20,156 17.2
Cyprus 15.6 14.8 14.7 15.3 14.4 16.2 25.4 38.8 19,295 19.8
Malta 15.5 15.6 15.1 15.7 15.9 16.3 23.7 37.5 21,018 17.3
Germany 15.6 15.8 16.1 16.1 16.7 16.7 25.1 43.9 25,660 22.0
United Kingdom 17.1 16.2 16.0 15.9 16.8 16.7 29.2 44.2 12,567 20.2
EU28 16.5 16.8 16.8 16.7 17.2 17.3 25.9 44.6 . 24.9
Poland 17.6 17.7 17.1 17.3 17.0 17.6 22.9 43.6 12,537 22.3
Portugal 17.9 18.0 17.9 18.7 19.5 19.5 26.4 47.8 12,999 29.0
Italy 18.7 19.8 19.5 19.3 19.4 19.9 25.4 46.0 19,397 29.3
Croatia 20.6 20.9 20.4 19.5 19.4 20.0 31.0 45.2 10,407 26.5
Greece 20.1 21.4 23.1 23.1 22.1 21.4 25.5 52.9 11,091 30.6
Estonia 15.8 17.5 17.5 18.6 21.8 21.6 27.8 39.4 13,144 21.0
Bulgaria 20.7 22.2 21.2 21.0 21.8 22.0 28.4 42.9 8,671 30.3
Spain 20.7 20.6 20.8 20.4 22.2 22.1 30.1 47.0 18,224 33.8
Lithuania 20.5 19.2 18.6 20.6 19.1 22.2 28.6 42.8 10,396 26.0
Latvia 20.9 19.0 19.2 19.4 21.2 22.5 27.3 40.9 10,196 25.5
Romania 21.6 22.3 22.9 23.0 25.4 25.4 29.3 49.6 5,486 38.2
a Relative poverty rates for a poverty line at 60% of median equivalized income; b The 2015 data for Ireland refer to 2014; c The poverty threshold has been set for a household consisting of two adults and two children under 14 years of age; d The countries in the table are sorted by the ascending value of the risk-of-poverty rate after social transfers in 2015.
Source: Eurostat.

Chapter 3. Income Inequality and Poverty in Poland 49
It should be emphasized that there is a negative correlation between the risk-of-poverty rate and the absolute poverty threshold for individual EU countries, which generally deepened between 2010 and 2015 (change from –0.448 to –0.602). This pro-cess should be assessed as negative because it involves a deepening in the “burden-someness” of poverty in the European Union. In countries where a larger proportion of the population is at risk of poverty, the absolute poverty threshold is lower.
In a sense, the severity of poverty is also reflected by the relative at-risk-of-poverty gap (depth of poverty), which—as seen in Table 3.2.—shows the difference between the at-risk-of-poverty threshold (in this case 60% of the median equivalized dispos-able income) and the median equivalized income of people below this threshold (ex-pressed as a percentage of this threshold). In other words, the depth of poverty shows the extent to which poor people are at risk of poverty. In the case of Poland, the rel-ative at-risk-of-poverty gap was 22.3% in 2015, which means that half the people at risk of poverty (with the poverty line set at 60% of median equivalent income) had incomes below 77.7% of the poverty line, i.e. less than 46.62% of median equivalent income. As seen in Table 3.2, in 2015 the list of countries with the greatest depth of poverty included Finland (13.2%) and France (15.7%), while Romania (38.2%), Spain (33.8%), and Greece (30.6%) were among the countries with the lowest relative at-risk-of-poverty gap.
The impact of total remittances on income inequality among households from 2008 to 2015
Migration from Poland, especially to other EU countries, significantly intensified after the country joined the European Union in 2004. This process has been accompa-nied by increased monetary and non-monetary transfers (see Figure 3.3) from migrants to households back in Poland, mostly to those members of their families who remained in the country. The impact of this additional source of income on income disparities among households in Poland is an interesting research problem.
An extensive body of research has been conducted on the impact of remittances from migrants on income inequality in their country of origin. Most of these analyses concern small areas (such as villages in Mexico or small island nations) or commu-nities in which migrants most often represent a significant proportion of the popula-tion—e.g. Stark, Taylor, Yitzhaki (1986); Stark, Taylor, Yitzhaki (1988); Taylor (1992); Taylor, Wyatt (1996); Mackenzie, Rapoport (2007); Barham, Boucher (1998); Brown, Jimenez (2007); Adams (1989); Oberai, Singh (1980); Rodrigues (1998); and Ahlburg (1996). There are few studies of the relationship between remittances by migrants and
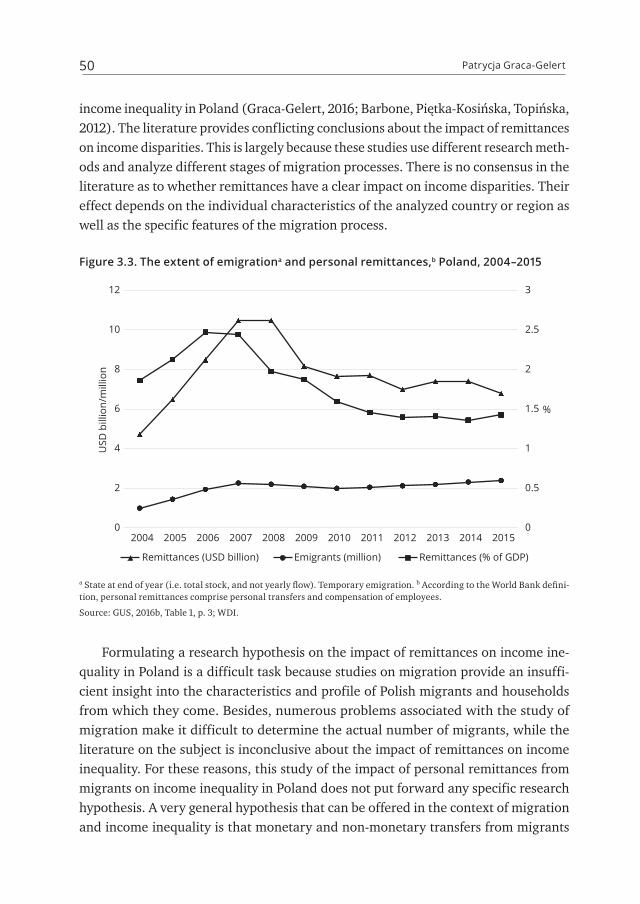
Patrycja Graca-Gelert50
income inequality in Poland (Graca-Gelert, 2016; Barbone, Piętka-Kosińska, Topińska, 2012). The literature provides conflicting conclusions about the impact of remittances on income disparities. This is largely because these studies use different research meth-ods and analyze different stages of migration processes. There is no consensus in the literature as to whether remittances have a clear impact on income disparities. Their effect depends on the individual characteristics of the analyzed country or region as well as the specific features of the migration process.
Figure 3.3. The extent of emigrationa and personal remittances,b Poland, 2004–2015
0
0.5
1
1.5
2
2.5
3
0
2
4
6
8
10
12
2004 2005 2006 2007 2008 2009 2010 2011 2012 2013 2014 2015
Remittances (USD billion) Emigrants (million) Remittances (% of GDP)
%
USD
bill
ion/
mill
ion
a State at end of year (i.e. total stock, and not yearly flow). Temporary emigration. b According to the World Bank defini-tion, personal remittances comprise personal transfers and compensation of employees.
Source: GUS, 2016b, Table 1, p. 3; WDI.
Formulating a research hypothesis on the impact of remittances on income ine-quality in Poland is a difficult task because studies on migration provide an insuffi-cient insight into the characteristics and profile of Polish migrants and households from which they come. Besides, numerous problems associated with the study of migration make it difficult to determine the actual number of migrants, while the literature on the subject is inconclusive about the impact of remittances on income inequality. For these reasons, this study of the impact of personal remittances from migrants on income inequality in Poland does not put forward any specific research hypothesis. A very general hypothesis that can be offered in the context of migration and income inequality is that monetary and non-monetary transfers from migrants

Chapter 3. Income Inequality and Poverty in Poland 51
could have helped halt the growth of income inequalities in Poland because income disparities in Poland stopped growing after 2004. In addition, migration by Poles has significantly increased since then. Validating this hypothesis goes beyond the scope of this research.
The data used in this study come from the Central Statistical Office and it is non-consolidated, non-identifiable data from household budget surveys (HBS). The following definition of income was used to study income and its sources. Income is understood as the disposable income of households (as defined by GUS) per equiva-lent unit, with a modified OECD equivalence scale used.4 The appropriate sources of income were also calculated as a source of household income per equivalent unit. In addition, the calculations take into account GUS weights.
This study covers the period from 2008 onward. This is because a detailed break-down of foreign sources of income was not used by the Central Statistical Office until 2008.5 Up until 2011 GUS identified 12 foreign sources of income in its surveys, and from 2012 onward it considered 13. Foreign sources of household income include income from permanent employment abroad, income from casual employment abroad, income from permanent self-employment abroad, income from casual self-employment abroad, income from the rental of buildings, structures and land not related to busi-ness activity abroad, old-age and disability pensions from abroad, family benefits from abroad (singled out by GUS in HBS in 2012), other social benefits from abroad, unemployment benefits from abroad, alimony payments from private individuals from abroad, other gifts from private individuals for a household from abroad, and other types of income from abroad.
For the purposes of this study, two or three kinds of household income sources were singled out: 1) transfers from abroad, and domestic sources of disposable house-hold income; 2) transfers from employment abroad, other transfers from abroad, and domestic sources of disposable household income. Foreign transfers from employment included income from permanent employment abroad, income from casual employ-ment abroad, income from permanent self-employment abroad, and income from casual self-employment abroad.
The following software was used in this empirical study: Excel 2016 and DAD 4.6. (Jean-Yves Duclos, Abdelkrim Araar and Carl Fortin, “DAD: A Software for Distribu-tive Analysis/Analyse Distributive,” MIMAP Programme, International Development Research Centre, Government of Canada, and CIRPÉE, Université Laval).
4 In the case of the modified OECD equivalence scale, weights are assigned to each person in the house-hold: a weight of 1 to the first adult, 0.5 to another person over the age of 13, and 0.3 to a child.
5 In previous rounds of the HBS, two types of income from abroad were considered: old-age pensions and disability pensions.

Patrycja Graca-Gelert52
The purpose of this section is to show what kind of impact remittances to house-holds at home have on income inequality in Poland in static terms. The study excludes issues such as a counterfactual analysis, i.e. a comparative analysis of two income distributions (in the case of a given year): the actual one and a hypothetical one that would be the case if the migrants remained in Poland.6 Briefly put, the study does not consider what household incomes would look like if households did not receive the transfers, but possibly income from other sources (such as social benefits from national sources or income from employment inside the country). The study thus comes down to: 1) a comparison between the actual income distribution and one excluding personal remittances, and 2) an analysis of the impact of personal remit-tances on the actual income distribution.
To examine the impact of personal remittances on income inequality in Poland, a method developed by Lerman and Yitzhaki (1985) was used. One form of the Gini coefficient is:
G0=
2cov y0,F y
0( )⎡⎣
⎤⎦
µ0
(3.1)
where G0 is the Gini coefficient for overall household income (for the purpose of our study), y0 is total household income, μ0 denotes mean overall household income, and F(y0) is the cumulative distribution of total household income. If we assume that house-hold income can be divided into K sources of income y
0= y
kk=1
K∑ , where y1, …, yk are sources of income, then formula (1) can be expressed as follows:
G0=
2k=1
K
∑ cov yk,F y
0( )⎡⎣
⎤⎦
µ0
=
=cov y
k,F y
0( )⎡⎣
⎤⎦
cov yk,F y
k( )⎡⎣
⎤⎦
⎛
⎝⎜⎜
⎞
⎠⎟⎟
2cov yk,F y
k( )⎡⎣
⎤⎦
µk
⎛
⎝⎜⎜
⎞
⎠⎟⎟
µk
µ0
⎛
⎝⎜
⎞
⎠⎟ =k=1
K∑
= RkG
kS
kk=1
K∑
⎫
⎬
⎪⎪⎪⎪
⎭
⎪⎪⎪⎪
, (3.2)
where Sk is the share of the k-th component of total household income, Gk is the Gini coefficient for the k-th component of household income, and Rk is the Gini correlation of the k-th component and overall income:
6 This means, for example, that the study excludes issues such as income source substitution, long-term analysis (or deferred effects), and indirect effects (e.g. how remittances influence future income acquisi-tion). All these effects may be partially overlapping.

Chapter 3. Income Inequality and Poverty in Poland 53
Rk=
cov yk,F y
0( )⎡⎣
⎤⎦
cov yk,F y
k( )⎡⎣
⎤⎦
. (3.3)
The Gini correlation takes values in the [–1, 1] range, i.e. 1) if Rk is equal to –1, then yk is a decreasing function of total household income, 2) if Rk is equal to 0, then yk and y0 are independent, and 3) when Rk is equal to 1, then yk is an increasing func-tion of total household income.
Referring to the decomposition method developed by Fei et al. (1978), it is pos-sible to specify other components of the decomposition of the Gini coefficient by income component:
k=1
K
∑SkG
k , (3.4)
where Gk is the so-called pseudo-Gini coefficient (or coefficient of concentration for the k-th component of income) and is simply the product of the Gini correlation for the k-th component of total income and the Gini coefficient for this source of income. The difference between the pseudo-Gini and the Gini coefficient for the k-th compo-nent of income is that the Gini coefficient is calculated for the k-th source of income ordered from the lowest to the highest value, while the pseudo-Gini orders the k-th component of income by ascending total income. Both measures are therefore the same only if the ranks of the k-th component of income and total income are the same.
A comparison of the pseudo-Gini for each source of income and the Gini coeffi-cient for total income makes it possible to directly evaluate the impact of individual income components on total income inequality:1) if Gk
< 0, then the k-th component of income contributes necessarily to a reduc-tion in total income inequality,
2) if Gk>G
0, then the k-th component of income leads to an increase in income ine-quality,
3) if 0 <Gk<G
0 , then the k-th component of income positively contributes to explain-ing income disparities, although to an extent it leads to a reduction in income inequality.In order to properly interpret the decomposition of the Gini coefficient by source
of income, it is also important to analyze the effects of extreme changes in individual income components on total income.7 If we consider an exogenous change in each
7 A detailed derivation of the equations can be found e.g. in Stark, Taylor, Yitzhaki (1986).

Patrycja Graca-Gelert54
household income coming from the k-th component of income equal to ekyk, where ek is close to 1, then
∂G
0
∂ek
= Sk
RkG
k−G
0( ) (3.5)
∂G
0/ ∂e
k
G0
=S
kR
kG
k
G0
− Sk. (3.6)
Tables 3.3 and 3.4 and Figure 3.4 furnish the results of the decomposition of the Gini coefficient by source of income. As seen in Table 3.3. and Figure 3.4, in each year of the analyzed period, the Gini coefficient for total income was invariably smaller than the Gini coefficient for income before remittances (GD < GD-T). This difference was the smallest in 2011, and the largest in the 2012–2015 period. The concentration coef-ficient, i.e. pseudo-Gini for any kind of transfers (overall, from employment, or the remainder) each year was higher than the Gini coefficient for total income (GT*RT = = GT
>GD). The contribution of remittances to explaining income inequality (meas-
ured by the Gini coefficient; STGTRT/GD) in Poland was positive and ranged from almost 2.5% (except in 2011) to less than 4% for total transfers, from less than 2% to more than 3% for transfers from employment abroad, and from almost 0.3% to 0.7% for the remaining transfers. It can be argued that roughly speaking (except in 2010–2011 and 2015), the contribution of remittances to explaining income inequality in Poland showed an upward trend.
Table 3.3. The impact of remittances on income inequality in Poland in 2008–2015 – decomposition of the Gini coefficienta
Category/Source of incomeb Yearc Sk Gk Rk Gk*Rk SkGkRk/G0 SkGkRk
D 2008 1 0.3164 1 0.3164 1 0.3164
T 0.0173 0.9859 0.4589 0.4524 0.0248 0.0078
TPR 0.0143 0.9891 0.4767 0.4715 0.0213 0.0067
TRE 0.0030 0.9960 0.3641 0.3626 0.0035 0.0011
D-T 0.9827 0.3236 0.9703 0.3140 0.9752 0.3085
D 2009 1 0.3139 1 0.3139 1 0.3139
T 0.0170 0.9876 0.4858 0.4798 0.0260 0.0082
TPR 0.0135 0.9906 0.4961 0.4915 0.0212 0.0066
TRE 0.0035 0.9965 0.4363 0.4348 0.0049 0.0015
D-T 0.9830 0.3199 0.9721 0.3110 0.9740 0.3057
D 2010 1 0.3207 1 0.3207 1 0.3207
T 0.0164 0.9869 0.4535 0.4476 0.0229 0.0073

Chapter 3. Income Inequality and Poverty in Poland 55
Category/Source of incomeb Yearc Sk Gk Rk Gk*Rk SkGkRk/G0 SkGkRk
TPR 0.0133 0.9897 0.4466 0.4420 0.0183 0.0059
TRE 0.0031 0.9967 0.4731 0.4715 0.0046 0.0015
D-T 0.9836 0.3274 0.9730 0.3186 0.9771 0.3133
D 2011 1 0.3170 1 0.3170 1 0.3170
T 0.0050 0.9955 0.4196 0.4177 0.0065 0.0021
TPR 0.0023 0.9983 0.4998 0.4989 0.0036 0.0011
TRE 0.0027 0.9970 0.3493 0.3482 0.0029 0.0009
D-T 0.9950 0.3191 0.9919 0.3165 0.9935 0.3150
D 2012a 1 0.3174 1 0.3174 1 0.3174
T 0.0180 0.9860 0.4469 0.4406 0.0249 0.0079
TPR 0.0150 0.9887 0.4602 0.4550 0.0215 0.0068
TRE 0.0030 0.9964 0.3699 0.3685 0.0035 0.0011
D-T 0.9820 0.3252 0.9693 0.3152 0.9751 0.3095
D 2012b 1 0.3175 1 0.3175 1 0.3175
T 0.0175 0.9862 0.4420 0.4359 0.0241 0.0076
TPR 0.0146 0.9889 0.4554 0.4503 0.0207 0.0066
TRE 0.0030 0.9964 0.3670 0.3657 0.0034 0.0011
D-T 0.9825 0.3251 0.9701 0.3153 0.9759 0.3098
D 2013 1 0.3162 1 0.3162 1 0.3162
T 0.0214 0.9840 0.4463 0.4392 0.0297 0.0094
TPR 0.0181 0.9867 0.4540 0.4480 0.0256 0.0081
TRE 0.0033 0.9965 0.3920 0.3906 0.0041 0.0013
D-T 0.9786 0.3256 0.9626 0.3135 0.9703 0.3068
D 2014 1 0.3069 1 0.3069 1 0.3069
T 0.0250 0.9818 0.4788 0.4701 0.0383 0.0118
TPR 0.0206 0.9852 0.4736 0.4666 0.0313 0.0096
TRE 0.0044 0.9954 0.4883 0.4861 0.0070 0.0022
D-T 0.9750 0.3165 0.9565 0.3027 0.9617 0.2951
D 2015 1 0.3030 1 0.3030 1 0.3030
T 0.0226 0.9819 0.4521 0.4440 0.0331 0.0100
TPR 0.0183 0.9855 0.4419 0.4355 0.0264 0.0080
TRE 0.0042 0.9954 0.4827 0.4805 0.0067 0.0020
D-T 0.9774 0.3123 0.9601 0.2998 0.9669 0.2930
a Sk – share in total income, Gk – Gini coefficient for a given category/source of income, Rk – Gini correlation for a given source of income and cumulative distribution of total income, GkRk – concentration coefficient for a given source of income, SkGkRk/G0 – relative contribution of a source of income to the Gini coefficient for total income, SkGkRk – contri-bution of a source of income to the Gini coefficient for total income in absolute terms. b D – disposable household income per equivalent unit, T – total transfers to households from abroad per equivalent unit, TPR – transfers to households from employment abroad per equivalent unit, TRE – difference between total transfers to households from abroad and trans-fers from employment abroad (TRE=T-TPR), D-T – difference between disposable household income per equivalent unit and total transfers from abroad. c In the case of 2012a GUS weights from the 2001 census were used for the calculations, and in the case of 2012b GUS weights from the 2011 census were used.
Source: Own study based on HBS data.

Patrycja Graca-Gelert56
An important element of the decomposition of the Gini coefficient by source of income is an analysis of the impact of a marginal change in the source of income on total income inequality. Table 3.4 shows that an increased role for total trans-fers in household income, ceteris paribus, would lead to deeper income disparities in Poland, as indicated by the positive values in the third, fourth and fifth columns. This effect is the greatest in the case of overall transfers, followed by transfers from employment, with the lowest effect in the case of the remaining transfers.
Table 3.4. Effect of a 1 percent increase in individual income sources on overall income inequality in Poland, 2008–2015 – decomposition of the Gini coefficient
Income source 2008 2009 2010 2011 2012
(MN) 2012
(MN2011) 2013 2014 2015
D 0.0000 0.0000 0.0000 0.0000 0.0000 0.0000 0.0000 0.0000 0.0000
T 0.0075 0.0090 0.0065 0.0016 0.0070 0.0065 0.0083 0.0133 0.0105
TPR 0.0070 0.0077 0.0050 0.0013 0.0065 0.0061 0.0075 0.0107 0.0080
TRE 0.0004 0.0014 0.0015 0.0003 0.0005 0.0005 0.0008 0.0026 0.0025
D-T –0.0075 –0.0090 –0.0065 –0.0016 –0.0070 –0.0065 –0.0083 –0.0133 –0.0105
a Symbols as in Table 3.3.
Source: Own calculations based on data from household budget surveys.
Figure 3.4. Household income inequality in Poland, 2008–2015 – income after and before remittances
0.29
0.295
0.3
0.305
0.31
0.315
0.32
0.325
0.33
2008 2009 2010 2011 2012 (MN) 2012(MN2011)
2013 2014 2015
D D-T D-TPR D-TRE
Gin
i
a Symbols as in Table 3.3.
Source: Own calculations based on HBS data.

Chapter 3. Income Inequality and Poverty in Poland 57
How, then, should the obtained results be interpreted? Let’s wrap them up. First, the Gini coefficient for total income (D) in the analyzed period was always smaller than the Gini coefficient for total income less the value of transfers (D-T), which sug-gests that an inflow of personal remittances reduced income inequality in Poland. Second, the Gk
>G0 condition is always met for remittances, which means that such
transfers contributed to deeper income inequality in Poland in absolute terms. Third, if we analyze the marginal effects of the impact of remittances on income inequal-ity, it will also turn out that an increase in remittances on each occasion led to an increase in income inequalities. How can these conflicting conclusions from analyz-ing the same data be reconciled? We are dealing with a situation in which the dis-tribution of remittances is highly uneven, and these transfers benefit higher income groups. In addition, the deterioration in the relative position of households receiv-ing remittances as a result of subtracting transfers from abroad creates a stronger effect than the improvement in the relative position of other households in the distri-bution8 (cf. Jurkatis, Strehl, 2013, pp. 6–10). Consequently, eliminating remittances from the distribution of total income leads to deeper income inequalities. At the same time, taking into account the actual distribution of total income, any small increase in remittances in the income of each household benefitting from such transfers would lead to a rise in income inequality.
Conclusion
To sum up, while the measures of income inequality in Poland point to a down-ward trend in this process in recent years, the measures of poverty as well as the risk of poverty do not indicate such a uniform trend. Compared with the EU28 as a whole, Poland shows a greater improvement in terms of income inequality than in the risk of poverty. Income inequality and the risk of poverty in the EU as a whole each increased by 0.1 p.p. in 2015.
The analysis of the impact of remittances on income inequality in Poland has found that these transfers have a highly uneven distribution and benefit higher income groups. Income inequality for disposable household income without remittances in each analyzed year of the 2008–2015 period was greater than income inequality for income including remittances. However, a potential increment in remittances would have led to deeper income inequalities in Poland in each studied year. The impact of
8 It is possible that remittances (e.g. transfers of salaries of household member) are often the only sig-nificant source of household income.

Patrycja Graca-Gelert58
remittances on income inequality in Poland is intensifying, as evidenced by factors including a growing contribution of this source of income to explain income inequal-ity, despite its slight decrease in 2015.
However, it is necessary to note that the conducted analysis had several limita-tions. As mentioned earlier, the study concerned the direct, current effect of mon-etary and non-monetary transfers on income inequality in Poland, which means it focused on the existing income distribution. The study skipped factors such as indi-rect effects spread over time; it also excluded a counterfactual analysis. The next stage of research on the impact of remittances on income inequality in Poland could take these issues into account.
Due to changes in social and economic policies that began to occur in 2016, it is necessary to expect that income inequalities and the risk of poverty will be reduced in the short term. It should be possible to examine some early effects of this process in greater detail at the end of 2017.
References
Adams R. H. Jr., (1989), Worker remittances and inequality in rural Egypt, Economic Develop-ment and Cultural Change, vol. 38, No. 1, pp. 45–71.
Ahlburg D. A., (1996), Remittances and the income distribution in Tonga, Population Research and Policy Review, vol. 15, No. 4, pp. 391–400.
Barbone L., Piętka-Kosińska K., Topińska I., (2012), Wpływ przepływów pieniężnych na polską gospodarkę w latach 1992–2012 – raport Western Union, przygotowany przez Centrum Ana-liz Społeczno-Ekonomicznych, CASE, CASE, Warszawa.
Barham B., Boucher S., (1998), Migration, remittances, and inequality: estimating the net effects of migration on income distribution, Journal of Development Economics, vol. 55, pp. 307–331.
Brown R. P. C., Jimenez E., (2007), Estimating the net effects of migration and remittances on poverty and inequality, UNU-WIDER, Research Paper, No. 2007/23.
Fei J. C. H., Ranis G., Kuo S. W. Y., (1978), Growth and the family distribution of income by factor components, The Quarterly Journal of Economics, vol. 92, No. 1, pp. 17–53.
Graca-Gelert P., (2015), Zróżnicowanie dochodów, ubóstwo oraz inne wybrane aspekty wyklucze-nia społecznego, in: M. A. Weresa, (ed.), (2015), Polska. Raport o konkurencyjności. Innowa-cje a pozycja konkurencyjna polskiej gospodarki w latach 2007–2014, Oficyna Wydawnicza SGH, Warszawa, pp. 71–91.
GUS, (2016a), Budżety gospodarstw domowych w 2015 r.; Informacje i opracowania statystyczne, GUS, Warszawa.

Chapter 3. Income Inequality and Poverty in Poland 59
GUS, (2016b), Informacja o rozmiarach i kierunkach czasowej emigracji z Polski w latach 2004– 2015; Notatka informacyjna, GUS, Warszawa.
GUS, (2016c), Zasięg ubóstwa ekonomicznego w Polsce w 2015 r. (na podstawie badania budże-tów gospodarstw domowych); Opracowanie sygnalne, GUS, Warszawa.
http://databank.worldbank.org/data/home.aspx (accessed Oct. 30, 2016).http://ec.europa.eu/eurostat/data/database (accessed Oct. 30, 2016).https://data.oecd.org/inequality/income-inequality.htm (accessed Sept. 13, 2016).Jurkatis S., Strehl W., (2013), Dos and don’ts of Gini decompositions, BDPEMS, Working Paper
Series 2013–03.Lerman R. I., Yitzhaki S., (1985), Income inequality effects by income source: A new approach and
applications to the United States, The Review of Economics and Statistics, vol. 67, No. 1, pp. 151–156.
McKenzie D., Rapoport H., (2007), Network effects and the dynamics of migration and inequal-ity: theory and evidence from Mexico, Journal of Development Economics, vol. 84, No. 1, pp. 1–24.
Oberai A. S., Singh H. K. M., (1980), Migration, remittances and rural development. Findings of a case study in the Indian Punjab, International Labour Review, 1980, vol. 119, No. 2, pp. 229–241.
Stark O., Taylor J. E., Yitzhaki S., (1986), Remittances and inequality, The Economic Journal, vol. 96, No. 383, pp. 722–740.
Stark O., Taylor J. E., Yitzhaki S., (1988), Migration, remittances and inequality. A sensitiv-ity analysis using the extended Gini index, Journal of Development Economics, vol. 28, pp. 309–322.
Taylor J. E., (1992), Remittances and inequality reconsidered: Direct, indirect, and intertemporal effects, Journal of Policy Modeling, vol. 14, No. 2, pp. 187–208.
Taylor J. E., Wyatt T. J., (1996), The shadow value of migrant remittances, income and inequal-ity in a household-farm economy, The Journal of Development Studies, vol. 32, No. 6, pp. 899–912.
Weresa M. A., (ed.), (2015), Polska. Raport o konkurencyjności 2015. Innowacje a pozycja kon-kurencyjna polskiej gospodarki w latach 2007–2014, Oficyna Wydawnicza SGH, Warszawa.


Chapter 4
Poland’s Competitive Advantages in Foreign Trade and the Country’s Balance of Payments
in 2010–2016
Mariusz-Jan Radło
Introduction
This chapter seeks to determine Poland’s position in international trade, taking into account changes in the country’s competitive advantages from 2010 to 2016. The anal-ysis also focuses on how the country’s balance of payments evolved during that period.
To start off this analysis of Poland’s competitiveness in trade, it should be noted that there are many definitions of international competitiveness. As argued by Radło (2008), these definitions can be divided into three groups: result-based definitions tied to results achieved by economies; factor-based definitions focusing on an assess-ment of the sources of economic competitiveness; and mixed definitions that combine both these approaches to assessing competitiveness. An analysis of the competitive-ness of an economy in foreign trade is mainly result-based. For this reason, and also because of the aim of this chapter, following OECD (2007), the result-based definition of competitiveness in trade is adopted here under which competitiveness means an advantage or a disadvantage in a country’s exports to international markets. A simi-lar approach to competitiveness is taken by the European Commission (2010), which notes that this term implies an ability to export goods and services.
Apart from the results of international trade, different researchers often combine the international competitiveness of an economy with its ability to maintain a long-term equilibrium in the balance of payments. Such links are highlighted, for exam-ple, by Pajarinen et al. (1998) and Fagerberg (1988), who argue that an economy’s ability to maintain a long-term equilibrium in the balance of payments is a manifes-tation of international competitiveness. A similar approach is taken by Aiginger and Landesmann (2002), who refer to the balance of payments as one of the measures of competitiveness. For this reason, apart from an analysis of trade flows and their
Mariusz-Jan Radło62
structure, this chapter discusses the components of Poland’s balance of trade and assesses its equilibrium.
It should also be noted that maintaining such equilibrium is a key objective of eco-nomic policy, and together with full employment, low inflation and economic growth, it forms the so-called magic quadrilateral of economic policy. Simultaneous imple-mentation of these goals, as pointed out by van Suntum (2005), is often impeded by contradictions that occur between them. However, every country wants to be able to pursue such an economic policy that would enable it to at least approach a situa-tion in which all these objectives can be achieved.
This chapter consists of several parts. The introduction is followed by methodo-logical remarks. The next three sections analyze trade flows, followed by an analysis of the balance of payments. The chapter ends with a summary of the research results.
Methodological remarks
The research is based on data on the trade in services and balance of payments from the National Bank of Poland (NBP) as well as on data on the trade in goods from the Customs Service. Because of methodological differences, statistics on the trade in goods offered by the NBP and the Customs Chamber are not comparable, which is a drawback of this study. Nevertheless, foreign trade data based on Customs Ser-vice databases provide a reasonable picture of how Poland’s trade in goods evolved. They are the most up-to-date source of trade data that makes it possible to analyze the trade in goods by commodity group.
This analysis of international competitiveness uses indicators of the structure of exports and imports and of the balance of trade as well as revealed comparative advan-tage (RCA) indexes, and indicators of the intensity of intra-industry trade (IIT). A log-arithmic formula that is a modified version of the original formula by Balassa (1965) was used to calculate the RCA index. The logarithmic RCA was calculated according to the following formula:
RCA = lnx
ijK
mijK
XjK
MjK
⎛
⎝⎜⎜
⎞
⎠⎟⎟
(4.1.)
where xijK is the exports of sector i from country K to country or group of countries j, m
ijK
is the exports of sector I from country K to country or group of countries j, XjK denotes
the total exports of country K to country or group of countries j, while MjK stands for
the global imports of country K from country or group of countries j.

Chapter 4. Poland’s Competitive Advantages in Foreign Trade... 63
An RCA may be either greater or less than zero. If it is greater than zero, it indi-cates a comparative advantage and describes its intensity at the same time. An RCA less than zero means a comparative disadvantage, and in this case too, the feature may be more or less intensive. The logarithmic formula makes it possible to preserve the symmetry of positive and negative indicators ranging around zero.
The intra-industry trade intensity index, also known as the Grubel-Lloyd index, was calculated according to the following formula:
IIT K = 1−X
ik − M
ik( )
i∑
Xik + M
ik( )
i∑
⎡
⎣
⎢⎢⎢
⎤
⎦
⎥⎥⎥
’ (4.2.)
where Xik stands for the exports of sector k from country i, and M
ik is the imports of
country i from sector k. The closer the index is to unity, the more intense is intra-in-dustry trade within a specific industry (Misala, 2007).
Key trends defining Poland’s trade in goods and services in 2010–2016
As shown by the data in Table 4.1, the value of Poland’s foreign trade increased steadily from 2010 to 2016. Exports grew at a faster rate than imports in both goods and services trade.
Exports of goods in the studied period increased from EUR 118.1 billion to EUR 176.5 billion. Imports of goods increased from EUR 129 billion to EUR 174.9 billion. While in 2010–2014 Poland recorded a deficit in the trade of goods, the situation reversed in 2015 and 2016 and the balance of trade on goods was positive, at EUR 2.2 billion in 2015 and EUR 1.6 billion in 2016.
In the analyzed period, the trade of services also increased steadily. The value of service exports in 2010–2016 increased from EUR 26.8 billion to EUR 43.9 billion. At the same time, the value of service imports increased from EUR 23.5 billion to EUR 30.6 billion. Throughout the period, there was a growing surplus in the trade of ser-vices; it increased from EUR 3.3 billion in 2010 to EUR 13.3 billion in 2016.
As a result of these trends, in 2013 Poland recorded a surplus in the combined trade of goods and services, following years of deficit. In 2013 and 2014 Poland still had a deficit in the trade of goods considered separately, but this deficit steadily decreased until Poland recorded surpluses for both goods and services in 2015 and 2016.

Mariusz-Jan Radło64
It should be noted that the share of goods and services in Poland’s imports was relatively stable during the studied period, except in 2010–2011. The share of services in imports in 2012–2016 ranged from 14.6% to 14.9%. The share of goods ranged from 85.1% to 85.4%. A slow but steady change was noted in the case of exports, where the share of services gradually increased at the expense of goods during the studied period. In 2011–2016, the share of services in exports increased from 18.2% to 19.9%, while the share of goods decreased from 81.8% to 80.1%.
Table 4.1. Poland’s international trade in goods and services in 2010–2016 (EUR billion)
2010 2011 2012 2013 2014 2015 2016
Balance of trade in goods –10.9 –13.3 –8.1 –0.3 –3.3 2.2 1.6
Exports of goods 118.1 132.5 141.0 149.1 158.6 172.1 176.5
Imports of goods 129.0 145.8 149.2 149.4 161.9 169.9 174.9
Balance of trade in services 3.3 5.2 6.0 7.6 9.1 10.9 13.3
Exports of services 26.8 29.4 31.9 33.6 36.7 40.7 43.9
Imports of services 23.5 24.2 25.9 25.9 27.7 29.7 30.6
Total balance of trade –7.6 –8.1 –2.1 7.3 5.8 13.1 14.9
Total exports 144.8 161.8 173.0 182.7 195.4 212.8 220.4
Total imports 152.5 170.0 175.1 175.4 189.5 199.7 205.5
Note: The 2016 data are based on preliminary monthly figures.
Source: Author’s elaboration based on NBP data.
Figure 4.1. Share of services and goods in Poland’s foreign trade in 2010–2016 (%)
15.4
14.214.8 14.8 14.6 14.9 14.9
18.5 18.2 18.5 18.418.8 19.1
19.9
14
15
16
17
18
19
20
21
2010 2011 2012 2013 2014 2015 2016
Share of services in exportsand imports
Imports Exports
84.6
85.885.2 85.2 85.4 85.1 85.1
81.5 81.8 81.5 81.681.2 80.9
80.180
81
82
83
84
85
86
87
2010 2011 2012 2013 2014 2015 2016
Share of goods in exportsand imports
Imports Exports
Note: The 2016 data are based on preliminary monthly figures.
Source: Author’s elaboration based on NBP data.

Chapter 4. Poland’s Competitive Advantages in Foreign Trade... 65
Poland’s competitive advantages in the trade of goods in 2010–2016
The trends described above show that Poland’s trade in goods in 2016 showed strengthening of a trend based on a steady improvement in the trade balance on goods. The year 2016 was the second consecutive year that Poland’s trade in goods showed a positive balance. Data on goods exports in Table 4.2 show that the highest surpluses in the trade of goods in 2016 were recorded for five commodity groups: miscellaneous manufactured articles (EUR 8.18 billion); vehicles, aircraft, and water-craft (EUR 6.47 billion); food, beverages, alcohol, and tobacco (EUR 4.72 billion); live animals and animal products (EUR 2.45 billion); and wood and articles of wood, cork, straw, and wicker (EUR 2.25 billion). In a favorable trend, the greatest sur-pluses were noted in the trade of manufactured articles. A look at commodity groups with the greatest trade deficit also reveals some positive trends. The five commodity groups with the highest deficit were: mineral products (EUR –7.03 billion); chemical products (EUR –4.84 billion); textiles and textile articles (EUR –2.4 billion); instru-ments and equipment (EUR –1.24 billion); and base metals and articles of base metal (EUR –1.23 billion).
There were also positive changes in the balance of trade in goods in 2010–2016. The greatest declines in either the trade deficit or surplus were recorded for manufactured articles and mineral products (in the latter case, this was probably due to a fall in the prices of mineral products). The five commodity groups that recorded the greatest declines in either the trade deficit or surplus in the analyzed period were: miscella-neous manufactured articles (EUR 3.83 billion); mineral products (EUR 3.31 billion); food, beverages, alcohol, and tobacco (EUR 3.04 billion); machinery and mechani-cal appliances (EUR 1.88 billion); and instruments and equipment (EUR 1.79 billion).
Table 4.2 Poland’s balance in the trade of goods in 2010–2016 (EUR billion)
2010 2011 2012 2013 2014 2015 2016
Live animals, animal products 1.51 1.88 2.19 2.32 2.43 2.61 2.45
Vegetable products –0.46 –0.91 0.00 0.58 0.58 0.69 0.08
Fats, oils, waxes –0.17 –0.40 –0.42 –0.21 –0.17 –0.39 –0.19
Food, beverages, alcohol and tobacco 1.68 2.00 2.58 3.42 3.91 3.49 4.72
Mineral products –10.34 –13.80 –14.40 –11.88 –11.89 –9.97 –7.03
Chemical products –5.39 –5.57 –4.70 –4.65 –4.91 –2.57 –4.84
Plastics and articles thereof –1.87 –2.08 –1.42 –0.91 –1.31 –1.96 –0.78
Leather and leather products –0.24 –0.31 –0.28 –0.19 –0.19 1.54 –0.28

Mariusz-Jan Radło66
2010 2011 2012 2013 2014 2015 2016
Wood and articles of wood, cork, straw, wicker 1.29 1.29 1.55 1.91 1.95 2.38 2.25
Pulp, paper or paperboard 0.01 0.11 –0.22 –0.16 –0.12 –0.56 0.28
Textiles and textile articles –1.96 –2.17 –1.83 –1.72 –2.21 –2.15 –2.40
Footwear, headgear, umbrellas, walking sticks… –0.33 –0.39 –0.31 –0.26 –0.42 –0.05 –0.37
Articles of stone, plaster, cement, glass… 0.54 0.73 0.99 1.28 1.37 0.65 1.44
Pearls, precious stones and metals, jewelry 0.48 0.99 1.37 0.75 0.67 0.94 0.72
Base metals and articles of base metal –0.40 –0.36 0.66 0.71 –0.09 –0.47 –1.23
Machinery and mechanical appliances –1.04 –1.22 –0.33 0.50 0.91 –9.82 0.84
Vehicles, aircraft and watercraft 5.31 6.77 5.08 5.78 5.18 14.36 6.47
Instruments and equipment, optical, photographic… –3.03 –3.06 –1.99 –1.48 –1.57 0.64 –1.24
Weapons and ammunition –0.06 –0.09 –0.13 –0.05 –0.04 –0.06 –0.06
Miscellaneous manufactured articles 4.35 5.03 5.92 6.58 7.17 7.15 8.18
Works of art, collectors’ items and antiques 0.01 0.01 0.01 –0.01 0.00 0.53 0.02
Source: Author’s elaboration based on Customs Service data.
The structure of Poland’s exports illustrated in Table 4.3 also deserves a positive assessment. The five commodity groups with the highest share in Poland’s goods exports were machinery and mechanical appliances (24.65%); vehicles, aircraft, and watercraft (14.98%); base metals and articles of base metal (9.25%); miscellaneous manufactured articles (7.31%); and chemical products (7.02%). It is worth noting that manufactured articles dominated among these goods.
Table 4.3. Structure of Poland’s exports of goods in 2010–2016
2010 2011 2012 2013 2014 2015 2016
Live animals, animal products 3.73 3.80 4.08 4.30 4.21 3.99 4.04
Vegetable products 1.97 1.87 2.44 2.64 2.55 2.59 2.28
Fats, oils, waxes 0.27 0.27 0.28 0.36 0.35 0.17 0.33
Food, beverages, alcohol and tobacco 5.18 5.18 5.66 5.89 6.07 5.76 6.36
Mineral products 4.34 5.08 5.15 4.89 4.33 2.41 2.75
Chemical products 6.58 6.81 6.95 6.99 7.00 8.00 7.02
Plastics and articles thereof 6.51 7.02 7.05 7.15 6.87 6.07 6.98
Leather and leather products 0.39 0.39 0.38 0.47 0.55 1.54 0.56
Wood and articles of wood, cork, straw, wicker 1.97 1.85 1.85 1.94 1.97 2.10 1.97
Pulp, paper or paperboard 3.12 3.09 2.59 2.57 2.59 2.41 2.81
Textiles and textile articles 3.20 3.16 3.02 3.05 3.24 3.50 3.76

Chapter 4. Poland’s Competitive Advantages in Foreign Trade... 67
2010 2011 2012 2013 2014 2015 2016
Footwear, headgear, umbrellas, walking sticks… 0.39 0.40 0.47 0.53 0.54 0.83 0.69
Articles of stone, plaster, cement, glass… 1.86 1.88 1.86 1.89 1.93 1.44 1.93
Pearls, precious stones and metals, jewelry 0.62 0.96 1.21 0.70 0.61 0.75 0.66
Base metals and articles of base metal 11.09 11.83 11.68 10.89 10.50 9.77 9.25
Machinery and mechanical appliances 26.30 23.70 23.84 23.75 24.85 19.73 24.65
Vehicles, aircraft and watercraft 15.98 16.05 14.35 14.67 13.89 19.31 14.98
Instruments and equipment, optical, photographic 0.95 1.03 1.07 1.17 1.26 2.71 1.57
Weapons and ammunition 0.01 0.01 0.01 0.02 0.03 0.04 0.07
Miscellaneous manufactured articles 5.53 5.58 6.04 6.12 6.63 6.59 7.31
Works of art, collectors’ items, and antiques 0.02 0.02 0.02 0.01 0.01 0.32 0.02
Source: Author’s elaboration based on Customs Service data.
It should also be noted that the main commodity groups among goods imported to Poland in 2016 in part corresponded to those dominant among exports. Those were: machinery and mechanical appliances (25.48%); vehicles, aircraft and water-craft (11.92%); base metals and articles of base metal (10.48%); chemical products (10.29%); and plastics and articles thereof (7.82%) —see Table 4.4. This observation reflects the fact that Polish trade is primarily of intra-industry type, as evidenced by the intra-industry trade intensity indexes given in Table 4.5, whose values are in most cases close to 1.
Table 4.4. Structure of Poland’s imports of goods in 2010–2016
2010 2011 2012 2013 2014 2015 2016
Live animals, animal products 2.26 2.22 2.44 2.83 2.74 2.58 2.80
Vegetable products 2.17 2.33 2.35 2.30 2.21 2.28 2.36
Fats, oils, waxes 0.38 0.52 0.56 0.50 0.45 0.41 0.46
Food, beverages, alcohol and tobacco 3.46 3.40 3.69 3.71 3.71 3.89 3.89
Mineral products 12.06 14.14 14.72 12.84 11.70 8.54 7.08
Chemical products 10.26 10.05 9.87 10.18 10.09 9.91 10.29
Plastics and articles thereof 7.45 7.88 7.75 7.86 7.74 7.52 7.82
Leather and leather products 0.55 0.57 0.56 0.61 0.67 0.68 0.75
Wood and articles of wood, cork, straw, wicker 0.81 0.83 0.72 0.70 0.78 0.75 0.74
Pulp, paper or paperboard 2.87 2.77 2.63 2.72 2.68 2.84 2.80
Textiles and textile articles 4.47 4.39 4.15 4.23 4.63 4.95 5.39
Footwear, headgear, umbrellas, walking sticks… 0.62 0.64 0.66 0.72 0.80 0.89 0.94

Mariusz-Jan Radło68
2010 2011 2012 2013 2014 2015 2016
Articles of stone, plaster, cement, glass… 1.29 1.24 1.12 1.07 1.10 1.10 1.18
Pearls, precious stones and metals, jewelry 0.20 0.21 0.24 0.22 0.20 0.21 0.27
Base metals and articles of base metal 10.53 11.13 10.78 10.58 10.64 10.47 10.48
Machinery and mechanical appliances 25.03 22.66 23.15 23.78 24.48 26.49 25.48
Vehicles, aircraft and watercraft 10.57 10.18 10.34 11.06 10.80 11.43 11.92
Instruments and equipment, optical, photographic… 3.23 3.05 2.38 2.17 2.24 2.45 2.39
Weapons and ammunition 0.06 0.07 0.10 0.05 0.06 0.08 0.12
Miscellaneous manufactured articles 1.70 1.71 1.79 1.86 2.26 2.53 2.83
Works of art, collectors’ items and antiques 0.01 0.01 0.01 0.01 0.01 0.01 0.01
Source: Author’s elaboration based on Customs Service data.
Table 4.5. Poland’s intra-industry trade intensity indexes in 2010–2016
2010 2011 2012 2013 2014 2015 2016
Live animals, animal products 0.983 0.984 0.987 0.991 0.991 0.991 0.993
Vegetable products 0.995 0.991 0.999 0.996 0.996 0.996 0.999
Fats, oils, waxes 0.890 0.861 0.869 0.940 0.951 0.776 0.942
Food, beverages, alcohol and tobacco 0.990 0.991 0.992 0.992 0.993 0.994 0.994
Mineral products 0.988 0.991 0.991 0.991 0.991 0.983 0.987
Chemical products 0.995 0.996 0.997 0.997 0.997 0.998 0.997
Plastics and articles thereof 0.998 0.999 0.999 0.999 0.999 0.998 0.999
Leather and leather products 0.930 0.932 0.936 0.962 0.976 0.948 0.969
Wood and articles of wood, cork, straw, wicker 0.934 0.947 0.939 0.940 0.951 0.949 0.952
Pulp, paper or paperboard 0.997 0.997 0.999 0.998 0.999 0.995 1.000
Textiles and textile articles 0.991 0.992 0.993 0.993 0.993 0.994 0.995
Footwear, headgear, umbrellas, walking sticks… 0.910 0.924 0.949 0.963 0.956 0.994 0.974
Articles of stone, plaster, cement, glass… 0.976 0.977 0.972 0.970 0.973 0.985 0.979
Pearls, precious stones and metals, jewelry 0.713 0.769 0.813 0.799 0.803 0.814 0.872
Base metals and articles of base metal 1.000 1.000 0.999 1.000 1.000 1.000 0.999
Machinery and mechanical appliances 1.000 1.000 1.000 1.000 1.000 0.999 1.000
Vehicles, aircraft and watercraft 0.997 0.997 0.998 0.998 0.999 0.998 0.999
Instruments and equipment, optical, photographic… 0.942 0.955 0.962 0.971 0.976 0.997 0.986
Weapons and ammunition –3.010 –2.356 –1.734 –1.065 –0.025 0.134 0.676
Miscellaneous manufactured articles 0.966 0.971 0.974 0.977 0.982 0.985 0.988
Works of art, collectors’ items and antiques –8.002 –1.586 –4.002 –2.114 –0.094 –0.439 –2.439
Source: Author’s elaboration based on Customs Service data.

Chapter 4. Poland’s Competitive Advantages in Foreign Trade... 69
Table 4.6. Poland’s revealed comparative advantages in the trade of goods by commodity group in 2010–2016
2010 2011 2012 2013 2014 2015 2016
Live animals, animal products 0.50 0.54 0.51 0.42 0.43 0.44 0.37
Vegetable products –0.10 –0.22 0.04 0.14 0.14 0.13 –0.03
Fats, oils, waxes –0.36 –0.64 –0.67 –0.33 –0.27 –0.90 –0.34
Food, beverages, alcohol and tobacco 0.40 0.42 0.43 0.46 0.49 0.39 0.49
Mineral products –1.02 –1.02 –1.05 –0.97 –0.99 –1.26 –0.95
Chemical products –0.44 –0.39 –0.35 –0.38 –0.36 –0.21 –0.38
Plastics and articles thereof –0.14 –0.12 –0.09 –0.10 –0.12 –0.21 –0.11
Leather and leather products –0.33 –0.38 –0.37 –0.26 –0.20 0.82 –0.30
Wood and articles of wood, cork, straw, wicker 0.89 0.80 0.94 1.01 0.92 1.03 0.98
Pulp, paper or paperboard 0.09 0.11 –0.02 –0.06 –0.04 –0.17 0.01
Textiles and textile articles –0.34 –0.33 –0.32 –0.33 –0.36 –0.35 –0.36
Footwear, headgear, umbrellas, walking sticks… –0.46 –0.46 –0.35 –0.30 –0.40 –0.08 –0.32
Articles of stone, plaster, cement, glass… 0.36 0.42 0.51 0.57 0.56 0.26 0.49
Pearls, precious stones and metals, jewelry 1.13 1.52 1.63 1.18 1.10 1.27 0.90
Base metals and articles of base metal 0.05 0.06 0.08 0.03 –0.01 –0.07 –0.12
Machinery and mechanical appliances 0.05 0.04 0.03 0.00 0.01 –0.29 –0.03
Vehicles, aircraft, and watercraft 0.41 0.46 0.33 0.28 0.25 0.52 0.23
Instruments and equipment, optical, photographic… –1.23 –1.08 –0.80 –0.62 –0.58 0.10 –0.42
Weapons and ammunition –1.45 –1.72 –1.96 –0.98 –0.61 –0.71 –0.46
Miscellaneous manufactured articles 1.18 1.18 1.22 1.19 1.08 0.96 0.95
Works of art, collectors’ items and antiques 1.01 0.38 0.77 –0.39 –0.16 3.40 0.79
Source: Author’s elaboration based on Customs Service data.
In evaluating Poland’s competitive advantages in goods exports, it is worth tak-ing a look at the revealed comparative advantage presented in Table 4.6. The data show that the highest RCA indexes were recorded mainly for low-value-added goods, which should be assessed negatively. The five commodity groups with the highest RCA indexes were: wood and articles of wood, cork, straw, and wicker (0.98); miscellaneous manufactured articles (0.95); pearls, precious stones and metals, and jewelry (0.9); works of art, collectors’ items and antiques (0.79); and food, beverages, alcohol and tobacco (0.49). Meanwhile, the five commodity groups with the lowest RCA indexes were: mineral products (–0.95); weapons and ammunition (–0.46); instruments and equipment (–0.42); chemical products (–0.38); and textiles and textile articles (–0.36).
When analyzing the RCA indexes for various commodity groups in Poland’s foreign trade, it is necessary to take a look at its structure. As seen from the data in Figure 4.2,

Mariusz-Jan Radło70
the largest share in Polish exports was claimed by commodity groups whose indexes were close to 0, while commodity groups with RCA indexes ranging from –0.12 to 0.23 were responsible for 65% of Poland’s exports. These were: base metals and articles of base metal (11.1%, RCA: –0.12); “plastics and articles thereof” (6.5%, RCA: –0.11); machinery and mechanical appliances (26.3%, RCA: –0.03); vegetable products (2%, RCA: –0.03); pulp, paper or paperboard (3.1%, RCA: 0.01); and vehicles, aircraft, and watercraft (16%, RCA: 0.23%).
Figure 4.2. Structure of Poland’s exports and revealed comparative advantages in 2016
0 20 40 60
−2 −1 0 1 2
Mineral productsWeapons and ammunition
Instruments and equipment, optical,…Chemical products
Textiles and textile articlesFats, oils, waxes
Footwear, headgear, umbrellas, walking sticks…Leather and leather products
Base metals and articles of base metalPlastics and articles thereof
Machinery and mechanical appliancesVegetable products
Pulp, paper or paperboardVehicles, aircraft and watercraft
Live animals, animal productsFood, beverages, alcohol and tobacco
Articles of stone, plaster, cement, glass...Works of art, collectors’ items and antiquesPearls, precious stones and metals, jewelry
Miscellaneous manufactured articlesWood and articles of wood, cork, straw, wicker
Share in exports (%)
RCA
RCA
Share inexports
Note: Commodity groups ranked according to RCA index in descending order from top to bottom.
Source: Author’s elaboration based on Customs Service data.
Poland’s competitive advantages in the trade of services in 2010–2016
Poland’s surplus in the trade of goods is only two years old, while the surplus in the trade of services was present throughout the study period. According to the NBP data shown earlier, the trade of services is responsible for most of Poland’s surplus in for-eign trade. NBP statistics for 2016 were not available at this writing.

Chapter 4. Poland’s Competitive Advantages in Foreign Trade... 71
Table 4.7. Balance on services, EUR billion, 2010–2016
Type of service 2010 2011 2012 2013 2014 2015
Total 13.2 21.1 25.1 32.1 37.9 45.6
Processing 4.9 6.0 7.4 9.7 11.3 11.5
Repair 1.5 1.9 1.1 0.8 0.3 1.4
Transport services 7.9 12.2 13.1 16.0 17.1 18.7
Sea transport –2.2 –2.0 –2.4 –2.3 –2.5 –2.7
Air transport 0.1 0.9 1.1 1.7 0.5 0.2
Other transport services 10.1 13.4 14.5 16.8 19.1 21.3
Postal and courier services –0.1 –0.1 –0.1 –0.2 –0.1 –0.1
Foreign travel 3.0 6.6 7.2 8.0 9.4 9.5
Construction services 1.8 2.7 2.5 2.7 2.9 1.8
Insurance services –1.0 –0.9 –1.4 –1.2 –1.9 –1.2
Financial services –2.9 –3.2 –2.9 –1.4 –1.3 –1.2
Fees for the use of intellectual property –6.1 –6.3 –6.8 –7.5 –8.2 –7.6
Telecommunications, IT and information services –0.6 0.6 1.3 1.8 3.9 6.2
Telecommunications services –0.2 0.0 –0.2 –0.3 –0.3 –0.5
IT services –0.2 0.4 1.4 2.0 3.8 6.2
Information services –0.1 0.2 0.1 0.1 0.4 0.5
Other business services 6.9 5.0 6.5 4.8 6.1 7.8
Research and development services 1.2 1.6 1.7 1.7 2.4 2.9
Professional services 3.1 2.6 3.1 1.4 1.6 2.7
Legal, accounting, management and public relations services –0.7 –1.1 –0.6 –2.3 –2.0 –1.1
Legal services 0.3 0.3 0.3 0.4 0.3 0.3
Accounting, auditing and tax services 1.6 1.7 2.1 2.6 3.0 3.8
Business consulting and public relations services –2.6 –3.0 –3.1 –5.3 –5.3 –5.2
Marketing services 3.8 3.6 3.7 3.8 3.6 3.8
Technical services, trade services and other business services 2.5 0.9 1.6 1.8 2.1 2.2
Cultural and recreational services –1.9 –3.1 –2.4 –1.2 –1.2 –1.0
Source: Author’s elaboration based on NBP data.
The data in Table 4.7 show that in 2015 the largest surpluses in the trade of services were in evidence for transport services (EUR 18.7 billion); processing (EUR 11.5 bil-lion); foreign travel (EUR 9.5 billion); “other business services” (EUR 7.8 billion); and telecommunications, IT and information services (EUR 6.2 billion). The greatest deficit was recorded in the trade of services such as fees for the use of intellectual property (EUR 7.6 billion); business consulting and public relations services (EUR –5.2 billion); sea transport EUR (–2.7 billion); financial services (EUR –1.2 billion); and insurance services (EUR –1.2 billion). It should also be noted that the greatest improvement

Mariusz-Jan Radło72
in the trade balance on services in 2010–2015 was recorded for services with a high trade surplus. In descending order, these were: transport services (an improvement by EUR 10.8 billion); telecommunications, IT and information services (up by EUR 6.8 billion); processing (up by EUR 6.6 billion); foreign travel (up by EUR 6.5 billion); and IT services (up by EUR 6.4 billion).
Table 4.8. Structure of Poland’s service exports in 2010–2015 (EUR billion)
Type of service 2010 2011 2012 2013 2014 2015
Processing 5.0 5.4 5.8 7.5 8.0 7.7
Repair 2.0 2.2 1.4 2.3 2.4 2.6
Transport services 25.1 27.1 27.2 27.3 27.3 26.6
Sea transport 1.0 1.1 1.1 1.1 1.1 1.0
Air transport 2.6 3.2 3.2 3.3 3.0 2.8
Other transport services 21.2 22.6 22.7 22.7 22.9 22.6
Postal and courier services 0.2 0.2 0.2 0.2 0.2 0.3
Foreign travel 27.1 26.1 26.8 25.5 24.3 23.2
Construction services 3.7 4.0 3.9 3.8 3.6 3.4
Insurance services 0.6 1.0 0.7 0.7 0.5 0.9
Financial services 1.9 1.7 1.7 1.6 1.6 1.5
Fees for the use of intellectual property 0.7 0.7 0.6 0.7 0.7 0.9
Telecommunications, IT and information services 5.7 6.3 7.0 7.7 8.7 9.7
Telecommunications services 1.3 1.2 1.1 1.0 0.9 0.7
IT services 3.9 4.7 5.4 6.1 7.2 8.3
Information services 0.4 0.5 0.4 0.5 0.6 0.7
Other business services 27.2 24.2 23.9 22.0 22.1 22.4
Research and development services 1.6 1.8 1.7 1.8 2.2 2.3
Professional services 9.7 10.0 10.3 11.3 11.4 11.8
Legal, accounting, management and public relations services 4.8 5.3 5.8 6.8 7.1 7.5
Legal services 0.7 0.7 0.6 0.6 0.5 0.5
Accounting, auditing and tax services 1.8 1.7 2.0 2.3 2.5 2.8
Business consulting and public relations services 2.3 2.9 3.2 3.9 4.1 4.3
Marketing services 4.9 4.6 4.5 4.5 4.3 4.2
Technical services, trade services and other business services 15.9 12.5 11.8 8.8 8.4 8.3
Cultural and recreational services 0.9 1.3 0.9 0.9 0.9 1.0
Source: Author’s elaboration based on NBP data.
One positive feature of the structure of Poland’s service exports is its diversity. The data in Table 4.8 show that in 2015 the main types of services exported by Poland

Chapter 4. Poland’s Competitive Advantages in Foreign Trade... 73
were transport services (26.6%); foreign travel (23.2%); “other business services” (22.4%); telecommunications, IT and information services (9.7%); and processing (7.7%). In all, these categories accounted for 89.6% of the total value of Polish ser-vice exports in 2015. It should also be noted that the greatest increases in exports in 2010–2015 were recorded for telecommunications, IT and information services (up by 4 p.p.); processing (up by 2.7 p.p.); professional services (up by 2.1 p.p.); and transport services (up by 1.5 p.p.). Of special note among the discussed catego-ries are growing exports of IT services and professional services, both of which are knowledge-intensive services.
The structure of Poland’s service imports given in Table 4.9 shows that the fol-lowing services dominated in 2015: “other business services” (24.3%); foreign travel (24%); transport services (21.4%); and professional services (13.9%). It should also be noted that in 2010–2015 the greatest increases in the share of imports were recorded for professional services (up by 13.9 p.p.); legal, accounting, management and pub-lic relations services (up by 11.1 p.p.); IT services (up by 6.4 p.p.); and repair services (up by 2.4 p.p.).
Table 4.9. Structure of Poland’s service imports in 2010–2015 (EUR billion)
Type of service 2010 2011 2012 2013 2014 2015
Processing 0.4 0.6 0.4 0.7 0.9 1.2
Repair 0.7 0.7 0.7 2.3 2.9 2.4
Transport services 20.2 20.7 21.5 20.7 21.5 21.4
Sea transport 3.5 3.3 3.5 3.5 3.6 3.6
Air transport 2.9 3.0 2.9 2.8 3.6 3.6
Other transport services 13.4 14.0 14.7 14.0 13.9 13.7
Postal and courier services 0.4 0.4 0.3 0.4 0.3 0.5
Foreign travel 27.8 24.9 26.4 25.7 24.1 24.0
Construction services 2.3 2.1 2.4 2.4 2.2 3.2
Insurance services 1.8 2.1 2.2 2.1 2.3 2.2
Financial services 5.3 5.2 4.7 3.4 3.3 3.0
Fees for the use of intellectual property 7.2 7.1 7.0 7.8 8.1 7.4
Telecommunications, IT and information services 7.1 7.1 7.5 8.2 8.2 8.4
Telecommunications services 1.7 1.4 1.6 1.6 1.4 1.5
IT services 4.7 5.3 5.4 6.1 6.3 6.4
Information services 0.6 0.4 0.5 0.6 0.5 0.5
Other business services 23.8 24.3 23.5 24.0 24.1 24.3
Research and development services 0.5 0.6 0.6 0.8 0.9 0.8
Professional services 7.8 9.5 9.8 13.4 13.8 13.9

Mariusz-Jan Radło74
Type of service 2010 2011 2012 2013 2014 2015
Legal, accounting, management and public relations services 6.2 7.5 7.8 11.0 11.2 11.1
Legal services 0.5 0.5 0.4 0.4 0.4 0.4
Accounting, auditing and tax services 0.3 0.4 0.5 0.7 0.7 0.7
Business consulting and public relations services 5.4 6.5 6.8 9.9 10.0 10.0
Marketing services 1.6 2.0 2.1 2.4 2.6 2.8
Technical services, trade services and other business services 15.5 14.3 13.0 9.8 9.4 9.6
Cultural and recreational services 3.0 4.7 3.4 2.2 2.2 2.2
Source: Author’s elaboration based on NBP data.
A look at Poland’s RCA indexes in the trade of services given in Table 4.10 reveals that in 2015 the country had the greatest comparative advantages in the following types of services: processing (1.9); accounting, auditing and tax services (1.3); research and development services (1); “other transport services” (0.5); and marketing ser-vices (0.4). By contrast, Poland had the greatest comparative disadvantages for the following types of services: fees for the use of intellectual property (–2.1); sea trans-port (–1.3); insurance services (–0.9); business consulting and public relations ser-vices (–0.9); and cultural and recreational services (–0.8).
Table 4.10. Poland’s RCA indexes in the trade of services in 2010–2015
Type of service 2010 2011 2012 2013 2014 2015
Processing 2.5 2.2 2.7 2.3 2.2 1.9
Repair 1.1 1.2 0.7 0.0 –0.2 0.1
Transport services 0.2 0.3 0.2 0.3 0.2 0.2
Sea transport –1.3 –1.1 –1.2 –1.2 –1.2 –1.3
Air transport –0.1 0.1 0.1 0.2 –0.2 –0.3
Other transport services 0.5 0.5 0.4 0.5 0.5 0.5
Postal and courier services –0.4 –0.4 –0.5 –0.7 –0.5 –0.5
Foreign travel 0.0 0.0 0.0 0.0 0.0 0.0
Construction services 0.5 0.6 0.5 0.5 0.5 0.1
Insurance services –1.0 –0.8 –1.2 –1 –1.5 –0.9
Financial services –1.0 –1.1 –1 –0.7 –0.7 –0.7
Fees for the use of intellectual property –2.4 –2.4 –2.5 –2.4 –2.4 –2.1
Telecommunications, IT and information services –0.2 –0.1 –0.1 –0.1 0.1 0.2
Telecommunications services –0.3 –0.2 –0.3 –0.4 –0.5 –0.7
IT services. –0.2 –0.1 0.0 0 0.1 0.3
Information services –0.4 0.1 –0.1 –0.1 0.3 0.3
Other business services 0.1 0.0 0.0 –0.1 –0.1 –0.1

Chapter 4. Poland’s Competitive Advantages in Foreign Trade... 75
Type of service 2010 2011 2012 2013 2014 2015
Research and development services 1.2 1.1 1.1 0.8 1.0 1.0
Professional services 0.2 0.0 0.0 –0.2 –0.2 –0.2
Legal, accounting, management and public relations services –0.3 –0.3 –0.3 –0.5 –0.5 –0.4
Legal services 0.4 0.2 0.3 0.4 0.2 0.2
Accounting, auditing and tax services 1.7 1.5 1.4 1.2 1.2 1.3
Business consulting and public relations services –0.9 –0.8 –0.7 –0.9 –0.9 –0.9
Marketing services 1.2 0.8 0.8 0.6 0.5 0.4
Technical services, trade services and other business services 0.0 –0.1 –0.1 –0.1 –0.1 –0.1
Cultural and recreational services –1.3 –1.3 –1.3 –0.9 –0.9 –0.8
Source: Author’s elaboration based on NBP data.
Balance of payments and its components
The data in Figure 4.3 show that Poland’s current account significantly improved in 2010–2016, but remained negative throughout the period. As mentioned earlier, the improvement in the current account was mainly driven by a surplus in the trade of services throughout the period, combined with a shrinking deficit in the trade of goods since 2014 and a surplus in the trade of goods in 2015 and 2016.
The balance of primary income negatively affected the balance of payments throughout the analyzed period. The balance of secondary income, on the other hand, had an only slightly negative impact. Primary income includes short-term employee salaries, investment income, taxes and subsidies to products and production, Common Agricultural Policy funds, a portion of Poland’s contribution to the European Com-mission related to the so-called Traditional Own Resources (TOR), and household lease payments for property abroad. Secondary income comprises current transfers between residents and non-residents, including the remaining portion of transfers between Poland and the EU earmarked for the financing of current expenditure by the government; this includes humanitarian assistance, the purchase of medicines, training programs, remittances, transfers in kind, including free-of-charge exports and imports of goods as part of international assistance, as well as tax flows related to the social security system and insurance services. The high negative balance of pri-mary incomes resulted mainly from transfers of income earned by foreign investors from their capital involvement in the Polish economy. On the other hand, transfers from the EU budget and income from earnings had a positive effect on the balance of income, although they were unable to outweigh those items that had a negative impact on the balance of income (NBP, 2015).

Mariusz-Jan Radło76
Figure 4.3. Current account and its components, EUR billion, 2010–2016
−30.00
−25.00
−20.00
−15.00
−10.00
–5.00
0.00
5.00
10.00
15.00
20.00
2010 2011 2012 2013 2014 2015 2016
Balance of secondary income
Balance of primary income
Balance on services
Balance on goods
Current account
Note: Preliminary 2016 data based on monthly estimates.
Source: Author’s elaboration based on NBP data.
Another component of the balance of payments is the capital account. This includes non-refundable capital transfers for the financing of fixed assets, debt amortization, and the acquisition and sale of non-financial and non-productive assets as well as settlements resulting from the acquisition and sale of intangible non-financial assets, including patents, licenses, copyrights, and trademarks. The capital account also includes funds provided by European Union institutions or international organiza-tions as well as those channeled free of charge by the Polish government to other insti-tutions and earmarked for the financing of fixed asset investment (NBP, 2015). The evolution of individual components of the capital account is presented in Figure 4.4. It shows that the capital account was in surplus in 2010–2016; this surplus grew sig-nificantly until 2015, after which it fell by about half in 2016. The trend was mainly due to changes in transfers of funds between the EU and Poland. It should be noted that, while in the first half of the studied period the capital-account balance neutral-ized the negative current-account balance, in the second half of the period Poland had a surplus in both its balance of trade and capital account. On the one hand, this situation reflects Poland’s role as the largest recipient of EU funds under the bloc’s current budget. On the other, it may signify a slow change in the structural charac-teristics of the economy and a growing competitiveness of its exports, which would be reflected by a longer-term trade surplus.

Chapter 4. Poland’s Competitive Advantages in Foreign Trade... 77
Figure 4.4. Capital account and its components, EUR billion, 2010–2016
−2.00
0.00
2.00
4.00
6.00
8.00
10.00
12.00
2010 2011 2012 2013 2014 2015 2016
Debit
Credit
Capital account
Note: Preliminary 2016 data based on monthly estimates.
Source: Author’s elaboration based on NBP data.
Figure 4.5. Financial account, 2004–2014, PLN million, according to BMP6
2010 2011 2012 2013 2014 2015 2016−40
−30
−20
−10
10
20
30
40
0
Official reserve assets
Financial derivatives
Other investmentliabilities
Other investment assets
Portfolio investmentliabilities
Portfolio investment
Direct investmentliabilities
Direct investment assets
Financial account
Note: Preliminary 2016 data based on monthly estimates.
Source: Author’s elaboration based on NBP data.
The last component of the balance of payments is the financial account. Its evolu-tion in Poland is illustrated in Figure 4.5. The first major component of the financial account is direct investment, which reflects the role of foreign companies in financing

Mariusz-Jan Radło78
investment in the Polish economy and the involvement of domestic businesses on for-eign markets. The data in the figure show that, except in 2013, Poland had relatively high FDI inflows in the 2010–2016 period. It should also be noted that the value of Pol-ish direct investment abroad increased in the analyzed period, and its positive impact on the financial account was particularly strong in 2014–2016. Portfolio investment was highly volatile; this applied to both foreign portfolio investment in Poland and Polish portfolio investment abroad. These investments can be a source of additional risk to the economy because of possible speculative attacks or the so-called domino effect (Radomski, 2014). On the other hand, the steady increase in the value of offi-cial reserve assets was a positive development. At the end of 2016, Poland’s official reserve assets stood at just over EUR 108 billion. To sum up, it should be noted that while in 2010–2014 the financial account was in deficit, in 2015 and 2016 it had devel-oped a slight surplus.
Summary and conclusions
Summing up, it should be pointed out that Poland’s exports of goods and services grew continually during the studied period, and at a rate faster than a parallel rise in imports. As a result, the trade deficit that Poland recorded until 2014 was replaced by a small surplus that continued into 2015 and 2016. It is difficult to predict whether this situation will be lasting in nature, but its potential continuation in the future could be indicative of an increased competitiveness of Polish goods and services in foreign trade. One manifestation of improving competitiveness was the relatively good struc-tural features of Poland’s trade in goods and services. It should be emphasized here that Polish exports are dominated by value-added and intra-industry goods, which brings Poland structurally closer to developed economies. Another positive develop-ment is that service exports are shifting toward knowledge-intensive services. One setback is the continually high share of low-value-added goods in exports and the fact that Poland’s revealed comparative advantages in foreign trade predominately apply to such categories of goods.
While assessing the balance of payments, it should be noted that for the first time in years, Poland recorded a very low current-account deficit combined with capi-tal- and financial-account surpluses in 2015 and 2016. This was due to an improved balance of trade accompanied by an inflow of EU structural funds and a balanced financial account.
Chapter 4. Poland’s Competitive Advantages in Foreign Trade... 79
References
Aiginger K., Landesmann M., (2002), Competitive Economic Performance: USA versus EU, wiiw Research Report No. 291, wiiw, Vienna.
Fagerberg J., (1998), A technology gap approach to why growth rates differ, Research Policy, vol. 16, issues 2–4, August 1987, pp. 87–99.
OECD, (2007) OECD Glossary of Statistical Terms, OECD, Paris.European Commission, (2010) European Competitiveness Report 2010, Commission staff work-
ing document SEC (2010) 1276, Publications Office of the European Union, Luxembourg.NBP (2015), Statystyka bilansu płatniczego. Uwagi metodyczne, Narodowy Bank Polski,
Warszawa.Radło M-J., (2008), Międzynarodowa konkurencyjność gospodarki. Uwagi na temat definicji,
czynników i miar, in: Bieńkowski W. et al. (2008), Czynniki i miary międzynarodowej kon-kurencyjności gospodarek w kontekście globalizacji – wstępne wyniki badań, Prace i Mate-riały Nr 284, Instytut Gospodarki Światowej, Warszawa.
Radomski B., (2014), Bilans płatniczy, oficjalne aktywa rezerwowe i zadłużenie zagraniczne Pol-ski – zmiany w okresie członkostwa w UE, in: Weresa M. A., (ed.), (2014), Polska. Raport o konkurencyjności 2014, Oficyna Wydawnicza SGH, Warszawa.
van Suntum U., (2005) The Invisible Hand. Economic Thought Yesterday and Today, Springer-Verlag, Berlin -Heidelberg.


Chapter 5
The Impact of Foreign Direct Investment on Poland’s Economic Competitiveness
Tomasz M. Napiórkowski
Introduction
Foreign direct investment (FDI) plays a significant role in shaping host economies. For example, in Poland, FDI from the United States played a key role in the country’s economic transformation (Kornecki, 2008; Kuskowski et al., 2010; Popescu, 2014). By deriving both direct and indirect benefits from hosting FDI, Poland was able to build a strong economy that is capable of competing internationally. This chapter poses the following research question: To what extent does Poland’s activity as an investor and FDI host influence the country’s international economic competitiveness? The research hypothesis is that the bilateral FDI activity of an economy has a statistically significant and positive impact on its international competitiveness.
The first stage of the study is an analysis of how FDI developed in Poland in the last five years, from 2011 to 2015. Data for Poland will be benchmarked against those for the other members of the four-nation Visegrad Group (V4): the Czech Republic, Hungary, and Slovakia. In the second stage of this study, a relationship will be estab-lished between FDI and the competitiveness of these countries, with the V4 used as the control group. The data will be analyzed using the Pearson linear correlation coef-ficient and the Granger causality test (a similar procedure was used by Nair-Reichert and Weinhold, 2001; and Napiórkowski, 2013).
For this study, the definition of FDI (hypothetical independent variable) was taken from the main data source used in the analysis: the United Nations Conference on Trade and Development (UNCTAD). FDI refers to an investment made to acquire last-ing interest, or at least 10% of equity ownership in enterprises operating outside of the investor’s economy (UNCTAD, 2015a). As the dynamics of both FDI flows1 and the
1 “For associates and subsidiaries, FDI flows consist of the net sales of shares and loans (including non-cash acquisitions made against equipment, manufacturing rights, etc.) to the parent company plus the parent firm s share of the affiliate s reinvested earnings plus total net intra-company loans (short- and
Tomasz M. Napiórkowski82
FDI stock2 will be examined below, the definitions of these two terms are also taken from UNCTAD.
Measures of international competitiveness
The international competitiveness of an economy is examined from a number of different angles in theoretical studies; it is consequently measured in a variety of ways in empirical research. The aim of this part of the study is to outline these measures and choose the appropriate measure for the tested relationship.
Another important aim is to define the measure of the international competi-tiveness of an economy (hypothetical dependent variable). In his study focusing on the manufacturing sector in New Zealand, Ratnayake (1998) initially proposes the use of the Relative Comparative Advantage index: RCAij = (Xij/Xi)/(Xjw/Xw), defined as the ratio of a country’s (i) exports in a particular commodity category (j) to its share of the world total. Subsequently, however, the author states this indicator can-not be used in an econometric study because it is difficult to match foreign trade data with data concerning a specific sector of the economy. As a solution, Ratnay-ake suggests using the ratio of net exports (of product j) to the total value of exports: NXi = (Xj – Mj)/ (Xj+Mj). Gordon et al. (2001) propose a measure of competitiveness called Domestic Resource Costs (DRC). More precisely, the DRC indicator compares the country’s alternative production costs (value in the numerator) to added value generated as a result of this production (value in the denominator). Interestingly, Misala (2011), in his chapter devoted to various measures of international competi-tiveness, defines DRC as a ratio of value added to the cost of using various factors of production. Zhang (2015), meanwhile, focuses exclusively on export competitiveness defined as “a country’s ability to compete globally through expanding export capacity and upgrading export sophistication.”3
Since this study focuses on the macroeconomic level, the main indicator of the international competitiveness of the examined economies (based on the RCA concept and Zhang’s definition, 2015) will be the share of exports of economy i (i = Czech
long-term) provided by the parent company. For branches, FDI flows consist of the increase in reinvested earnings plus the net increase in funds received from the foreign direct investor” (UNCTAD, 2015b).
2 “For associate and subsidiary enterprises, it is the value of the share of their capital and reserves (including retained profits) attributable to the parent enterprise (this is equal to total assets minus total liabilities), plus the net indebtedness of the associate or subsidiary to the parent firm. For branches, it is the value of fixed assets and the value of current assets and investments, excluding amounts due from the parent, less liabilities to third parties” (UNCTAD, 2015c).
3 While analyzing competitiveness, attention should also be paid to studies that review competitive-ness in the broad sense, such as Hartwell (2016) and Misala (2011).

Chapter 5. The Impact of Foreign Direct Investment on Poland’s Economic Competitiveness 83
Republic, Hungary, Poland, Slovakia) in the exports of the control group (i.e. V4); V4_X_C_USDi = Xi/XV4. The following hypothesis is attributed to this measure: the greater the relative international competitiveness of economy i in relation to the con-trol group, the greater its share in the exports of a specific commodity category.
Dynamics of foreign direct investment among Visegrad Group countries
This part of the study seeks to present the current state of play when it comes to FDI in Poland. As stated in the introduction, Poland will be shown against the back-ground of the three other V4 members.4
Poland (referred to as PL) was responsible for the largest share of FDI inflows to the European Union (EU28) among V4 countries for most of the studied period (2011– 2015, Table 5.1), except in 2012 and 2013 when it was outperformed by Hungary (H) and the Czech Republic (CZ). The latest data show that while Poland’s role as a host country for FDI inflows has fallen within the EU28 (in 2014, Poland accounted for USD 4.29 of every USD 100 in FDI coming to the EU28; in 2015 its share was USD 1.70), in relation to other V4 countries, Poland is still the decisive leader and its attractiveness to for-eign investors has grown compared with the Czech Republic (USD 0.28), Hungary (USD 0.29), and Slovakia (SK; USD 0.18). However, Poland does not lead the way if the V4 group is analyzed as a source of FDI flows (Table 5.2). It was only in the last studied year that Poland was responsible for the largest share of FDI outflows (USD 0.60 of every 100 USD coming from the EU28). In the remaining years, it was either Hungary (with USD 0.96 in 2011, USD 3.33 in 2012, and USD 1.19 in 2014) or the Czech Republic (USD 1.47 in 2013) that led the charge. An unsettling development in the case of both inward and outward FDI flows is an overall decline in the V4 countries’ share in the EU28’s total FDI flows.
4 In order to avoid false assumptions about the dynamics and relative attractiveness of the surveyed host economies, the FDI values are expressed as a percentage of the total for a given category for the EU28, and not, for example, in per capita terms (because in such an approach the real rate of growth could be affected by changes in the population resulting, for example, from emigration).

Tomasz M. Napiórkowski84
Table 5.1. Inward FDI flows for V4 members as a percentage share of the EU28 total, 2011–2015
2011 2012 2013 2014 2015CZ/UE28 0.54% 1.79% 1.14% 1.88% 0.28%H/UE28 1.48% 3.23% 1.07% 2.56% 0.29%PL/UE28 3.74% 2.78% 1.13% 4.29% 1.70%SK/UE28 0.82% 0.67% –0.19% –0.11% 0.18%
−0.50%
0.00%
0.50%
1.00%
1.50%
2.00%
2.50%
3.00%
3.50%
4.00%
4.50%
Inw
ard
FDI fl
ows
for
V4 m
embe
rs a
sa
perc
enta
ge s
hare
of t
he E
U28
tota
l
Source: Own graph based on UNCTAD (2016d) data.
Table 5.2. Outward FDI flows for V4 members as a percentage share of the EU28 total, 2011–2015
2011 2012 2013 2014 2015CZ/UE28 –0.07% 0.51% 1.47% 0.55% 0.47%H/UE28 0.96% 3.33% 0.68% 1.19% 0.31%PL/UE28 0.21% 0.82% –0.17% 0.67% 0.60%SK/UE28 0.15% 0.00% –0.11% –0.04% –0.04%
–0.50%
0.00%
0.50%
1.00%
1.50%
2.00%
2.50%
3.00%
3.50%
Out
war
d FD
I flow
s fo
r V4
mem
bers
as
a pe
rcen
tage
sha
re o
f the
EU
28 to
tal
Source: Own graph based on UNCTAD (2016d) data.

Chapter 5. The Impact of Foreign Direct Investment on Poland’s Economic Competitiveness 85
A look at the FDI stock (Table 5.3) in the EU28 reveals that Poland is the undis-puted leader among V4 countries. In 2015, Poland accounted for USD 2.74 of every USD 100 in the EU28, a level very close to a long-term (1993-2015) high of USD 2.79 in 2013. The next places on the podium show an interesting pattern, with the Czech Republic (USD 1.45 in 2015) invariably in second place among the most popular des-tinations for FDI, followed by Hungary (USD 1.19) and Slovakia (USD 0.62). At this point, it should be noted that Poland was the only V4 country whose role as an FDI host economy increased last year, maintaining its significant predominance in this area. However, much as in the case of outward FDI flows, Poland does not the lead V4 countries in terms of outward FDI stock (Table 5.4). The leading role falls to Hun-gary: investors from that country were responsible for USD 0.41 (2015) of every USD 100 from the EU28. Poland currently accounts for USD 0.30 (long-term high) for every USD 100 in the EU28 stock, followed by the Czech Republic (USD 0.20) and Slovakia (USD 0.03). As the data show, all V4 economies are net FDI recipients, which has an effect on the structure of benefits resulting from their involvement in FDI.
Table 5.3. Inward FDI stock for V4 members as a percentage share of the EU28 total, 2011–2015
2011 2012 2013 2014 2015CZ/UE28 1.57% 1.74% 1.63% 1.50% 1.45%H/UE28 1.11% 1.33% 1.32% 1.22% 1.19%PL/UE28 2.14% 2.53% 2.79% 2.54% 2.74%SK/UE28 0.68% 0.70% 0.71% 0.65% 0.62%
0.00%
0.50%
1.00%
1.50%
2.00%
2.50%
3.00%
Inw
ard
FDI s
tock
for
V4 m
embe
rs a
sa
perc
enta
ge s
hare
of t
he E
U28
tota
l
Source: Own graph based on UNCTAD (2016d) data.
This analysis of the FDI flows and stock for Poland compared with other V4 mem-bers shows that Poland leads the way in terms of FDI hosting but is a less significant source of FDI in the EU28 than Hungary.

Tomasz M. Napiórkowski86
Table 5.4. Outward FDI stock for V4 members as a percentage share of the EU28 total, 2011–2015
2011 2012 2013 2014 2015CZ/UE28 0.14% 0.19% 0.22% 0.20% 0.20%H/UE28 0.28% 0.41% 0.41% 0.43% 0.41%PL/UE28 0.20% 0.29% 0.30% 0.27% 0.30%SK/UE28 0.04% 0.05% 0.05% 0.03% 0.03%
0.00%0.05%0.10%0.15%0.20%0.25%0.30%0.35%0.40%0.45%
Out
war
d FD
I sto
ck fo
r V4
mem
bers
as
a pe
rcen
tage
sha
re o
f the
EU
28 to
tal
Source: Own graph based on UNCTAD (2016d) data.
Link between foreign direct investment and competitiveness among V4 countries
The purpose of this part of the study is to empirically test the research hypothesis about a positive and statistically significant relationship between FDI activity and the international competitiveness of an economy.
With the set definitions of the studied concepts, data was collected for a group of variables (Table 5.5) for 1993–2015 (the longest possible time series).5
Since the trends in the variables describing FDI were already discussed earlier, this section will describe changes in the shares of exports of a given economy in V4 exports as a measure of international competitiveness.
Poland has the largest share of V4 exports (39.20% in 2015; Figure 5.1), followed by the Czech Republic (25.69%), Hungary (21.53%) and Slovakia (13.58%). The most interesting observations, however, concern changes in the dynamics of the studied variable. Since Poland’s accession to the European Union, the share of the country’s
5 Due to the lack of data for Hungary’s exports in 2015, an extrapolation was made based on the assump-tion that the difference between the values for 2015 and 2014 is identical to that seen for 2014 and 2013. Considering that the extrapolation was performed for only about 1.1% of observations (i.e. 1 in 92) in one variable; the choice of the extrapolation method should not have a statistically significant effect on the results obtained.

Chapter 5. The Impact of Foreign Direct Investment on Poland’s Economic Competitiveness 87
exports has been growing practically nonstop. This is very good news, especially com-pared with: (1) the Czech Republic, which saw a short-lived increase in its share around the time of its EU entry, followed by stagnation and even a loss of competitiveness in recent years; (2) Hungary, which saw its maximum before EU accession and which is currently working to make up for its losses from the past decade, and (3) Slovakia, whose track record in relation to 2004 is negative, much as in the case of Hungary.
Table 5.5. List of variables used in the study
Variable Measurement unit Symbol Data source
FDI inflows USD at current exchange rate IFDI_F_C_USD UNCTAD (2016d)
FDI outflows USD at current exchange rate OFDI_F_C_USD UNCTAD (2016d)
V4 inward FDI stock USD at current exchange rate IFDI_S_C_USD UNCTAD (2016d)
V4 outward FDI stock USD at current exchange rate OFDI_S_C_USD UNCTAD (2016d)
V4 exports USD at current exchange rate X_C_USD WB (2016)
V4 GDP USD at current exchange rate PKB_C_USD WB (2016)
Source: Own work.
Figure 5.1. Share of an economy’s exports in total V4 exports (%)
0.1
0.15
0.2
0.25
0.3
0.35
0.4
0.45
1993
1994
1995
1996
1997
1998
1999
2000
2001
2002
2003
2004
2005
2006
2007
2008
2009
2010
2011
2012
2013
2014
2015
Shar
e of
an
econ
omy’
s ex
port
sin
tota
l V4
expo
rts
(%)
CZ V4_X_C_USD H V4_X_C_USD PL V4_X_C_USD SK V4_X_C_USD
Source: Own work based on WB (2016) data.
Moving to research hypothesis testing, the first test for the existence of a cor-relation between the studied variables is the Pearson linear correlation coefficient (r, where H0: r ≤ 0, HA: r > 0, α = 5% = 0.05).
The Pearson correlation coefficients between different variants of FDI and compet-itiveness measured by the share of an economy’s exports in total V4 exports (Table 5.6)

Tomasz M. Napiórkowski88
show the absence of a statistically significant correlation (p = 0.194) for FDI outflows. In the case of the V4 FDI stock, the correlation is statistically significant at α ≈ 10%. Given these results, it is possible to say that FDI has a statistically significant and pos-itive correlation with international economic competitiveness, but the strength of this correlation is low to average.
Table 5.6. Pearson linear correlation coefficients for V4 countries (n = 92)
V4_X_C_USD p-value
IFDI_F_C_USDr 0.527**
p-value 0.000
OFDI_F_C_USDr 0.091
p-value 0.194
IFDI_S_C_USDr 0.448**
p-value 0.000
OFDI_S_C_USDr 0.134
p-value 0.102
**. The correlation coefficient is statistically significant at the 0.01 level (1-tailed).
Source: Own study based on UNCTAD (2016d) data.
The next step in the correlation analysis is to check whether the hypothesis about a positive link between FDI and the international competitiveness of economies can be confirmed for each V4 country separately (Table 5.7). The Pearson correlation coef-ficients between FDI and the share of an economy’s exports in total V4 exports show that in only two cases (for Poland with both variables concerning the FDI stock) is the correlation statistically significant and positive (for α = 10% = 0.1 for Poland’s inward FDI stock and α = 5% = 0.05 for Poland’s outward FDI stock). The correla-tion is statistically significant and negative in only one case (with the FDI stock from Hungary). In all other cases, the correlation is statistically insignificant. Based on these findings, it can be concluded that there is a statistically significant and positive link between FDI activity and international competitiveness (i.e. the research hypoth-esis is validated), but only for Poland. In the case of the Czech Republic, Hungary, and Slovakia, the results clearly disprove the research hypothesis. It is also necessary to remember that corr(A, B) = corr(B, A), so it is impossible to determine the sequence of events, i.e. causality, using the correlation coefficient. Consequently, the Granger causality test (with α = 5% = 0.05 and H0: variable A does not Granger-cause varia-ble B) will be performed.

Chapter 5. The Impact of Foreign Direct Investment on Poland’s Economic Competitiveness 89
Table 5.7. Pearson linear correlation coefficients for individual V4 countries (n = 23 for each studied country)
Country V4_X_C_USD
CZ
IFDI_F_C_USDr –0.098
p-value 0.329
OFDI_F_C_USDr 0.112
p-value 0.306
IFDI_S_C_USDr 0.223
p-value 0.153
OFDI_S_C_USDr 0.234
p-value 0.141
H
IFDI_F_C_USDr –0.152
p-value 0.245
OFDI_F_C_USDr –0.204
p-value 0.176
IFDI_S_C_USDr –0.100
p-value 0.324
OFDI_S_C_USDr –0.349
p-value 0.052
PL
IFDI_F_C_USDr –0.183
p-value 0.202
OFDI_F_C_USDr 0.045
p-value 0.419
IFDI_S_C_USDr 0.315
p-value 0.072
OFDI_S_C_USDr 0.585**
p-value 0.002
SK
IFDI_F_C_USDr –0.111
p-value 0.306
OFDI_F_C_USDr –0.146
p-value 0.253
IFDI_S_C_USDr –0.162
p-value 0.230
OFDI_S_C_USDr –0.184
p-value 0.201
**. The correlation coefficient is statistically significant at the 0.01 level (1-tailed).
Source: Own study based on UNCTAD (2016d) data.
As in the case of correlation coefficient analysis, the Granger test will first be per-formed for the whole panel and then for each V4 country separately. Before perform-ing a series of Granger tests, it is necessary to test the stationarity of the variables. And so, using the Levin, Lin & Chu t tests (H0: there is a common unit root) and the Im,

Tomasz M. Napiórkowski90
Pesaran & Shin W-stat, ADF – Fisher Chi-square and PP – Fisher Chi-square tests (H0: there are individual unit roots), the obtained results suggest that (with α = 5% = 0.05) all the variables should be subjected to a differentiation (Xt – Xt–1) of the first order, and to a differentiation of the second order in the case of variable V4_X_C_USD.
Unexpectedly, the results of the Granger causality test for the panel (Table 5.8) show that a null hypothesis cannot be rejected for any of the test pairs. In other words, there is a lack of statistically significant Granger causality between FDI and the meas-ure of competitiveness used, which contradicts the research hypothesis. These obser-vations are also true when individual V4 countries are analyzed separately (Table 5.10 for the Czech Republic, Table 5.11 for Hungary, Table 5.12 for Poland, and Table 5.13 for Slovakia).6
Table 5.8. Granger causality test results for V4
Null hypothesis F stat. p-value
for V4_X_C_USD (n = 76)
D(V4_X_C_USD,2) does not Granger-cause D (IFDI_F_C_USD) 0.1704 0.8437
D(IFDI_F_C_USD) does not Granger-cause D (V4_X_C_USD,2) 0.4257 0.6550
D(V4_X_C_USD,2) does not Granger-cause D (OFDI_F_C_USD) 0.2537 0.7767
D(OFDI_F_C_USD) does not Granger-cause D (V4_X_C_USD,2) 0.1455 0.8649
D(V4_X_C_USD,2) does not Granger-cause D (IFDI_S_C_USD) 0.0992 0.9057
D(IFDI_S_C_USD) does not Granger-cause D (V4_X_C_USD,2) 0.1886 0.8286
D(V4_X_C_USD,2) does not Granger-cause D (OFDI_S_C_USD) 0.1151 0.8914
D(OFDI_S_C_USD) does not Granger-cause D (V4_X_C_USD,2) 0.6753 0.5123
Source: Own study based on UNCTAD (2016d) data.
To explain these results, it is necessary to look more closely at the Granger cau-sality test. Pindyck and Rubinfeld (1998) point out that the results of the test used are susceptible to sources of bias. The subjective choice of the number of lags used (m) is significant for this test (i.e. when the null hypothesis is not rejected).7 In our study, m = 2. Pindyck and Rubinfeld (1998) suggest that the test should be repeated for different values of m, which, however, requires a large number of observations (a requirement already violated during the analysis of individual economies). It should be noted, however, that since the results for the panel overlap with those for each
6 Considering that in this case the data used is time-series data, an adjusted Dickey-Fuller test (Table 5.9) was performed to determine the stationarity of the variables.
7 Another source of bias for the performed test may be the existence of a third variable C that may be a factor determining variable A (the tested dependent variable) and which may at the same time be corre-lated with variable B (the tested independent variable). This would result in rejecting the null hypothesis when it is true.

Chapter 5. The Impact of Foreign Direct Investment on Poland’s Economic Competitiveness 91
studied country separately, there are no indications that the test results could be sensitive to the number of lags. To confirm this observation, Granger causality tests were performed for the panel for m = 3, 4, 5 and 6. It is only at the m = 4 level that the null hypothesis (p-value = 0.0073) can be rejected holding that FDI outflows are not a Granger cause of the share of an economy’s exports in total V4 exports (this result is confirmed for m = 5 and 6).
Table 5.9. Orders of differentiation applied to individual variables for the given countries (based on the results of an adjusted Dickey-Fuller test with α = 5% = 0.05 and H0: there is a unit root)
Differentiation order (d)
Variable/Country CZ H PL SK
IFDI_F_C_USD 0 0 1 1
OFDI_F_C_USD 2 1 0 1
IFDI_S_C_USD 1 1 2 2
OFDI_S_C_USD 1 d > 2 d > 2 1
V4_X_C_USD 1 2 1 0
Source: Own study based on UNCTAD (2016d) data.
Table 5.10. Granger causality test results for the Czech Republic
Null hypothesis F stat. p-value
for V4_X_C_USD (n = 20, except OFDI_F_C_USD where n = 19)
D(V4_X_C_USD) does not Granger-cause IFDI_F_C_USD 1.6845 0.2188
IFDI_F_C_USD does not Granger-cause D (V4_X_C_USD) 1.5481 0.2448
D(V4_X_C_USD) does not Granger-cause D (OFDI_F_C_USD,2) 0.2379 0.7914
D(OFDI_F_C_USD,2) does not Granger-cause D (V4_X_C_USD) 0.1676 0.8474
D(V4_X_C_USD) does not Granger-cause D (IFDI_S_C_USD) 1.1211 0.3517
D(IFDI_S_C_USD) does not Granger-cause D (V4_X_C_USD) 1.9932 0.1707
D(V4_X_C_USD) does not Granger-cause D (OFDI_S_C_USD) 0.3645 0.7006
D(OFDI_S_C_USD) does not Granger-cause D (V4_X_C_USD) 0.3889 0.6845
Source: Own study based on UNCTAD (2016d) data.
Table 5.11. Granger causality test results for Hungary
Null hypothesis F stat. p-value
for V4_X_C_USD (n = 19)
D(V4_X_C_USD,2) does not Granger-cause IFDI_F_C_USD 0.3526 0.7089
IFDI_F_C_USD does not Granger-cause D (V4_X_C_USD,2) 2.8719 0.0901

Tomasz M. Napiórkowski92
Null hypothesis F stat. p-value
for V4_X_C_USD (n = 19)
D(V4_X_C_USD,2) does not Granger-cause D (OFDI_F_C_USD) 0.0987 0.9066
D(OFDI_F_C_USD) does not Granger-cause D (V4_X_C_USD,2) 0.5397 0.5946
D(V4_X_C_USD,2) does not Granger-cause D (IFDI_S_C_USD) 1.2279 0.3226
D(IFDI_S_C_USD) does not Granger-cause D (V4_X_C_USD,2) 0.1778 0.8390
The test did not consider variable OFDI_S_C_USD because an order of differentiation greater than 2 would have been required for it to be stationary.
Source: Own study based on UNCTAD (2016d) data.
Table 5.12. Granger causality test results for Poland
Null hypothesis F stat. p-value
for V4_X_C_USD (n = 20, except IFDI_S_C_USD where n = 19)
D(V4_X_C_USD) does not Granger-cause D (IFDI_F_C_USD) 0.2027 0.8188
D(IFDI_F_C_USD) does not Granger-cause D (V4_X_C_USD) 0.7868 0.4732
D(V4_X_C_USD) does not Granger-cause OFDI_F_C_USD 0.0188 0.9814
OFDI_F_C_USD does not Granger-cause D (V4_X_C_USD) 1.0578 0.3717
D(V4_X_C_USD) does not Granger-cause D (IFDI_S_C_USD,2) 0.9726 0.4022
D(IFDI_S_C_USD,2) does not Granger-cause D (V4_X_C_USD) 0.0449 0.9562
The test did not consider variable OFDI_S_C_USD because an order of differentiation greater than 2 would have been required for it to be stationary.
Source: Own study based on UNCTAD (2016d) data.
Table 5.13. Granger causality test results for Slovakia
Null hypothesis F stat. p-value
for V4_X_C_USD (n = 20, except IFDI_S_C_USD where n = 19)
V4_X_C_USD does not Granger-cause D (IFDI_F_C_USD) 1.3523 0.2884
D(IFDI_F_C_USD) does not Granger-cause V4_X_C_USD 2.1786 0.1477
V4_X_C_USD does not Granger-cause D (OFDI_F_C_USD) 5.353 0.0176
D(OFDI_F_C_USD) does not Granger-cause V4_X_C_USD 0.1001 0.9053
V4_X_C_USD does not Granger-cause D (IFDI_S_C_USD,2) 1.1746 0.3376
D(IFDI_S_C_USD,2) does not Granger-cause V4_X_C_USD 1.0269 0.3836
V4_X_C_USD does not Granger-cause D (OFDI_S_C_USD) 0.0617 0.9404
D(OFDI_S_C_USD) does not Granger-cause V4_X_C_USD 0.5599 0.5828
Source: Own study based on UNCTAD (2016d) data.
The results obtained by analyzing the Pearson linear correlation coefficient and the series of Granger causality tests can be summarized as follows. There is a positive

Chapter 5. The Impact of Foreign Direct Investment on Poland’s Economic Competitiveness 93
and statistically significant correlation between FDI activity and international com-petitiveness (Pearson correlation results) at the V4 level (panel), but this relationship is not a causal relationship (Granger test results). At the level of individual V4 econo-mies (time series), there is a positive and statistically significant relationship between FDI activity (FDI stock only) and international competitiveness only for Poland, but this relationship is not a causal relationship (Granger test results).
The differences in the results between individual economies can be justified by their varying level of involvement in FDI activity, especially when it comes to the accu-mulation of the FDI stock, where the unquestioned leader is Poland, for which the research hypothesis put forward has been confirmed.
The lack of statistically significant causal relationships where FDI would have an impact on international competitiveness may be justified if an assumption is made that FDI activity influences international competitiveness indirectly (Figure 5.2) rather than directly (Figure 5.1). For example, in a host country (and the studied economies are net host countries), FDI increases the level of investment,8 raises average wage levels (see, for example, Lipsey, 2002; Tomohara and Takii, 2011; Javorcik, 2015), promotes tech-nology transfer (see, for example, Liu et al., 2016; Svedin and Stage, 2016), and leads to a transfer of human capital (see, for example, Tülüce and Doğan, 2014; Temiz and Gökmen; 2014); thereby increasing the international competitiveness of an economy.
Figure 5.2. Direct relationship between FDI and international competitiveness
FDI activity International competitiveness
Source: Own work.
Figure 5.3. Indirect relationship between FDI and international competitiveness
FDI activityInvestment, wages,
technology,human capital etc.
Internationalcompetitiveness
Source: Own work.
8 Of course, some research reports suggest that FDI crowds out domestic investment, but according to Pilbeam and Oboleviciute (2012), even if we accept this thesis, it does not hold true for the economies discussed here, though Szkorupová (2015), for example, argues the opposite. Overall, conclusions about FDI having a crowding-out effect on domestic investment depend on the research method and measures used—see, for example, differences between research results obtained by Farla et al. (2016) and Morris-sey & Udomkerdmonkol (2012).

Tomasz M. Napiórkowski94
Implications
This research has two key implications for FDI policy.First, the relatively low involvement of the studied economies in FDI allocation
leads to a limited range of benefits from it, especially as investors. Therefore, FDI pol-icy should be based on tools of supporting FDI allocation. First, however, it is neces-sary to ask the question if excessive activity by domestic investors in FDI abroad will not negatively affect the level of investment at home.
Second, if FDI generates only direct benefits for a host economy, it can support its development only up to a certain point because it then has an identical effect on economic growth as, for example, increased marginal propensity to save. This means that an economy continues to move along a pre-designated path of development. It is only when an economy absorbs the indirect benefits of FDI (technology and human capital spillovers in the case of hosting FDI) that it can enter a higher path of develop-ment (see, for example, Romer, 2001). It is therefore necessary to invest continuously in the development of domestic enterprises in order to ensure an adequate level of absorption of indirect FDI benefits (see, for example, Nunnenkamp, 2002; Borensz-tein et al., 1998; Velde, 2006; Azam and Ahmed, 2015).
Conclusions
The purpose of this study was to find an answer to the question about the exist-ence of a link between FDI activity and the international competitiveness of an econ-omy, using the example of Poland.
In order to measure international competitiveness, the share of Poland's exports in total V4 exports was used, with the Visegrad Group constituting the control group in the study and its remaining members representing reference points for Poland.
The analysis used the Pearson linear correlation coefficient to determine the exist-ence of the studied link, followed by a series of Granger causality tests to determine the causality of the mutual impact of the studied variables.
A positive and statistically significant relationship was found between FDI activity and international competitiveness for the Visegrad Group as a whole. At the level of individual V4 economies, a positive and statistically significant relationship between the FDI stock and international competitiveness was only observed for Poland. None of the studied relationships is a statistically significant causal relationship. This means

Chapter 5. The Impact of Foreign Direct Investment on Poland’s Economic Competitiveness 95
the research hypothesis (about the existence of a statistically significant and positive relationship) was only confirmed for Poland.
The main limitations of this study are the selection of the measure of international competitiveness (as mentioned in the text, the number of indicators is considerable and multiplied by their permutations) and the selection of the control group, which if changed should be a source of further research.
References
Azam M., Ahmed A. M., (2015), Role of Human Capital and Foreign Direct Investment in Promot-ing Economic Growth, International Journal of Social Economics, vol. 42, No. 2, pp. 98–111.
Borensztein E., De Gregorio, J., Lee, J-W., (1998), How Does Foreign Direct Investment Affect Economic Growth, Journal of International Economics, vol. 45, pp. 115–135.
Farla K., De Crombrugghe D., Varspagen B., (2016), Institutions, Foreign Direct Investment, and Domestic Investment: Crowding Out or Crowding In?, World Development, vol. 88, pp. 1–9.
Gorto M., Daniłowska A., Jarka S., Straszewski S., Zwojska A., Majewski E., (2001), The Inter-national Competitiveness of Polish Agriculture, Post-Communist Economies, vol. 13, No. 4, pp. 445–457.
Hartwell, C. A., (2016), Improving Competitiveness in the Member States of the Eurasian Eco-nomic Union: A Blueprint for the Next Decade, Post-Communist Economies, vol. 28, No. 1, pp. 49–71.
Javorcik B. S., (2015), Does FDI Bring Good Jobs to Host Countries?, World Bank Research Observer, vol. 30, No. 1, pp. 74–94.
Kornecki, L., (2008), Foreign Direct Investment and Macroeconomic Changers in CEE Integrat-ing into the Global Market, Investment and Management and Financial Innovations, vol. 5, No. 4.
Kuskowski P., Sadowski J., Strojny M., (2010), 20 Years of American Investment in Poland, study conducted by KMPG and the American Chamber of Commerce in Poland.
Lipsey R. E., (2002), Home and Host Country Effects of FDI, NBER Working Paper 9293.Liu W. S., Agbola, F. W., Dzator J. A., (2016), The Impact of FDI Spillover Effects on Total Factor
Productivity in the Chinese Electronic Industry: A Panel Data Analysis, Journal of the Asia Pacific Economy, vol. 21, No. 2, pp. 217–234.
Misala J., (2011), Międzynarodowa konkurencyjność gospodarki narodowej, Polskie Wydawnic-two Ekonomiczne, Warszawa.
Morrissey O., Udomkerdmongkol M., (2012), Governance, Private Investment and Foreign Direct Investment in Developing Countries, World Development, vol. 40, No. 3, pp. 437–445.

Tomasz M. Napiórkowski96
Nair-Reichert U., Weinhold D., (Revised 2000, Published 2001), Causality Test for Cross-Coun-try Panels: New Look at FDI and Economic Growth in Developing Countries, Oxford Bulletin of Economics and Statistics, vol. 63, No. 2, pp. 153–171.
Napiórkowski T. M., (2013), Atrakcyjność inwestycyjna Polski, in: Marzenna A. Weresa (ed.), Polska. Raport o konkurencyjności 2013. Wymiar krajowy i regionalny, Szkoła Główna Han-dlowa w Warszawie – Oficyna Wydawnicza, Warszawa, pp. 119–131.
Nunnenkamp P., (2002), To What Extent Can Foreign Direct Investment Help Achieve Interna-tional Development Goals?, Kiel Institute of World Economics, Kiel Working Paper 1128.
Pilbeam K., Oboleviciute N., (2012), Does Foreign Direct Investment Crowd In or Crowd Out Domestic Investment? Evidence from the European Union, The Journal of Economic Asym-metries, vol. 9., No. 1, pp. 89–104.
Popescu G. H., (2014), FDI and Economic Growth in Central and Eastern Europe, Sustainability, vol. 6, pp. 8149–8163
Ratnayake R., (1998), Do Stringent Environmental Regulations Reduce International Competi-tiveness? Evidence from an Inter-industry Analysis, International Journal of the Economics of Business, vol. 5, No. 1, pp. 77–96.
Romer D. (2001), Advanced Macroeconomics, McGraw-Hill/Irwin, New York.Svedin D., Stage, J., (2016), Impact of Foreign Direct Investment on Efficiency in Swedish Man-
ufacturing, Springerplus, vol. 5.Szkorupová Z., (2015), Relationship between Foreign Direct Investment and Domestic Invest-
ment in Selected Countries of Central and Eastern Europe, Procedia Economics and Finance, vol. 23, pp. 1017–1022.
Temiz D., Gökmen, A., (2014), FDI Inflow as an International Business Operation by MNCs and Economic Growth: An Empirical Study on Turkey, International Business Review, vol. 23, pp. 145–154.
Tomohara A., Takii, S., (2011), Does Globalization Benefit Developing Countries? Effects of FDI on Local Wages, Journal of Policy Modeling, vol. 33, pp. 511–521.
Tülüce N. S., Doğan, İ., (2014), The Impact of Foreign Direct Investments on SMEs’ Development, Procedia – Social and Behavioral Sciences, vol. 150, pp. 107–115.
UNCTAD (2016a), Foreign Direct Investment (FDI), accessed Oct. 31, 2016, available at http://unctad.org/en/Pages/DIAE/Foreign-Direct-Investment- (FDI). aspx.
UNCTAD (2016b), FDI Flows, accessed Oct. 31, 2016, available at http://unctad.org/en/Pages/DIAE/FDI%20Statistics/FDIFlows.aspx
UNCTAD (2016c), FDI Stock, accessed Oct. 31, 2016, available at http://unctad.org/en/Pages/DIAE/FDI%20Statistics/FDIStock.aspx
UNCTAD (2016d), UNCTADSTAT, accessed Oct. 31, 2016, available at http://unctadstat.unc-tad.org/wds/ReportFolders/reportFolders.aspx?sCS_ChosenLang=en

Chapter 5. The Impact of Foreign Direct Investment on Poland’s Economic Competitiveness 97
Velde D. W. te, (2006), Foreign Direct Investment and Development: An Historical Perspective, background paper for World Economic and Social Survey for 2006, Commissioned by UNCTAD.
WB (2016), World DataBank, World Development Indicators, accessed Oct. 31, 2016, availa-ble at http://databank.worldbank.org/data/reports.aspx?source=world-development- indicators
Zhang K. H., (2015), What Drives Export Competitiveness? The Role of FDI in Chinese Manufac-turing, Contemporary Economic Policy, vol. 33, No. 3, pp. 499–512.


Part II
Key Factors for Poland’s Economic Competitiveness in 2010–2016


Chapter 6
Key Economic Policy Developments in 2010–2016 and Challenges Ahead
Adam Czerniak, Ryszard Rapacki
This chapter seeks to assess the main thrusts of Polish economic policy from 2010 to 2016, with a focus on how its paradigm changed after the country’s presidential and parliamentary elections in 2015. Due to exceptionally intense changes in 2016, in our evaluation we exclusively focus on the most important areas of macroeconom-ic policy, i.e. on fiscal and labor market policies, while also considering their wider, non-fiscal consequences.1 In this chapter we also outline the key challenges for eco-nomic policy makers after a year of the conservative government of the Law and Justice (PiS) party. In this context, we signal the potential impact of measures taken in other non-economic policy areas, especially those affecting the country’s legal sys-tem, which in our opinion have strongly influenced the conditions of doing business and investing in Poland.
Key macroeconomic policy developments
For the purposes of this report, Poland’s economic policy has been divided into two phases:1) the post-crisis period of 2010–2015, marked by strong business cycle fluctuations,
significant uncertainty and numerous changes in economic policy, especially those related to public finance consolidation;
2) a period of expansionary fiscal policy swiftly introduced by the new government that was formed at the end of 2015.
1 We offered a more comprehensive assessment of supply-side economic policy (structural policy) in a previous edition of this report (Weresa 2015). The conclusions contained there continue to hold true today.
Adam Czerniak, Ryszard Rapacki102
From 2010 to 2015 the authorities pursued a restrictive fiscal policy on both the revenue and expenditure side of the Polish budget. The most important measures aimed at boosting public revenues were:
� an increase in the VAT rates from January 2010, with the main rate rising from 22% to 23%;
� an increase in disability pension contributions by 2 p.p. to 8% as of February 2012; � several increases in excise taxes on tobacco products and alcoholic beverages; � freezing income tax brackets at their 2008 levels; � implementing several anti-tax evasion laws, including one to prevent fraud in VAT
payments by companies trading in goods such as steel rods, fuel, and precious metals, and one imposing taxes on Polish-owned special-purpose companies reg-istered in tax havens such as Cyprus, Malta, and Luxembourg and thus evading corporate income taxes; adopting a law increasing the tax on undisclosed income; and adopting regulations launching a national “receipt lottery” in a bid to boost the country’s VAT revenues.The bulk of the fiscal tightening program pursued by the government in the post-
crisis period focused on the expenditure side of fiscal policy and was implemented between 2010 and 2014 (resulting in savings for the government of 4.1 p.p. of GDP, compared with 0.1 p.p. of GDP on the revenue side in 2010–2014 [Rada Ministrów, 2015]). A further decline in the public deficit to 2.6% in 2015 was due to the mainte-nance of a restrictive fiscal policy. This included unchanged tax brackets and an un-changed limit of tax-free income, accompanied by a further freeze of public-sector wages comparable to that in 2014 amid accelerated economic growth.
The most important measures concerned the pension system. These included a re-duction in the size of the fully funded pillar and an increase in the retirement age. The first modifications focused on the mechanism for transferring pension contributions. In 2011, the government temporarily reduced the amount of pension premiums trans-ferred from the Social Insurance Institution (ZUS) to Private Pension Funds (OFE) from 7.3% to 2.3%, with a subsequent increase to 2.8% in 2013. The key change in the system, however, took effect in early February 2014, when 51.5% of OFE assets were transferred to ZUS. The transferred T-bonds were redeemed and public debt fell by 9 p.p. to 48.5% of GDP at the end of the first quarter of 2014, according to ESA’2010 methodology (Eurostat, 2016).
The key change in the fully funded pillar was in the amount of funds that will be transferred from ZUS to OFE in subsequent years. Prior to 2011, the entire pen-sion contribution of 7.3% was transferred to OFE. Under the new rules, it will now stay in ZUS and be recorded on a special sub-account indexed against nominal GDP growth. Those who wished to continue saving in the fully funded pillar were given an

Chapter 6. Key Economic Policy Developments in 2010–2016 and Challenges Ahead 103
alternative option. They could declare that they wanted the state to transfer 2.98% of their contributions to private pension funds. Such a decision was made by 2.5 million Poles, or 15.1% of those who were eligible. This is probably not enough to keep pri-vate pension fund net inflows (paid-in contributions minus the transfer of assets to pensioners) in positive territory. In January 2015, a year after the reform, ZUS trans-ferred PLN 184.5 million to private pension funds from premiums, and OFEs trans-ferred to ZUS PLN 346 million worth of assets for the payment of benefits to people approaching retirement. After the introduction of the new law, government expendi-ture in 2015 was PLN 18.6 billion lower (1 percent of GDP) than in the no-change-in-eco-nomic-policy scenario. This was due to a lower Social Security Fund deficit combined with lower debt-servicing costs (Ministry of Labor, 2014).
Another important change in the pension system was a decision in 2012 to increase the retirement age to 67 for both men and women. Previously, men retired at 65 and women at 62. The retirement age was set to increase gradually. Beginning in January 2013, the retirement age increased at a rate of three months per month. The target level was to be reached in 2020 for men and in 2040 for women. In all, the govern-ment saved around PLN 6 billion as a result of this from 2012 to 2015 (MPiPS, 2012).
In order to reduce the nominal and structural deficit, the then-governing coalition of the Civic Platform (PO) and the Polish People’s Party (PSL) decided to go ahead with institutional changes. Beginning in 2010, the parliament passed a number of new expenditure measures aimed at limiting the growth of public spending at both the central and local government levels. The most important of these was the so-called stabilizing expenditure rule, which was introduced in 2014 to replace the ineffective disciplinary rule. This new rule was based on a complex mathematical formula for the upper ceiling on planned public spending enshrined in subsequent budgets. The limit depends on historical and projected real GDP growth, the CPI inflation forecast, and the public deficit and debt levels. The rule takes into account discretionary policy changes to the income side of the budget. It covers nearly 90% of general government expenditures and was first applied to the 2015 draft budget.
The introduction of the stabilizing fiscal rule changed the process of drafting the budget. Previously, the budgets of the central and local governments and other public institutions were drafted independently. Under the new rule, the Ministry of Finance had to be informed by all institutions covered by the new regulations about expenditures planned for the subsequent year. Taking this into account, the ministry adjusted central budget spending in order to keep public spending below the limit. This increased cen-tral administration control over fiscal policies pursued by the public sector as a whole.
To reduce the budget deficit, the Ministry of Finance introduced another impor-tant institutional change: central liquidity management in the public sector. Some

Adam Czerniak, Ryszard Rapacki104
public institutions, including the national healthcare fund (NFZ), special-purpose funds, and the State Forest Authority, were all forced to keep their surplus funds on a Ministry of Finance account in the publicly owned BGK bank. In this way, other in-stitutions could use surplus liquidity in the sector to finance their short-term defi-cits instead of issuing bonds or borrowing money from private banks. Thanks to this management system, general government debt-service costs were reduced by sever-al hundred million zlotys a year and the borrowing needs were lowered by a total of PLN 33 billion (2% of GDP) in 2010–2014. Another important measure aimed at re-ducing the budget deficit was a decision to freeze compensation expenditures in the public sector at their 2009 nominal level. This move yielded PLN 2.2 billion in savings in 2014 alone (Ministry of Finance, 2014).
As a result of these measures, the government managed to permanently reduce the general government deficit from 7.6% of GDP in 2010 to 2.6% in 2015. Thanks to this, the European Commission dropped the excessive deficit procedure against Poland in June 2015 (Council of the European Union, 2015). The introduction of long-term austerity measures (including the pension system reform, the establishment of the stabilizing expenditure rule, and the centralization of liquidity management) brought down the structural deficit to 2.3% of GDP in 2015, from 8.0% in 2010 (Eurostat, 2016).
After the Law and Justice (PiS) party won the parliamentary elections in October 2015, the country’s new lawmakers found themselves in a very comfortable position of fiscal freedom. For the first time in six years, the 2016 budget did not have to be consulted with Brussels, and the government was free to increase spending, offer tax cuts and make other moves to make fiscal policy more expansionary without risk-ing punishment by EU institutions under the excessive deficit procedure. Moreover, thanks to auctioning off the 800 MHz mobile spectrum, called the Long-Term Evolu-tion (LTE), to telecommunications operators, the government generated PLN 9.2 bil-lion in one-off revenue, and thanks to changes in asset prices, the central bank (NBP) contributed PLN 7.9 billion in profit to public coffers (Rada Ministrów, 2016a; 2016b). This, combined with historically low debt-servicing costs, temporarily created a lot of room for loosening fiscal policy in Poland.
As a result, in December 2015, the new parliament amended the budget and an-nounced the introduction of its flagship Family 500+ child benefit program, one of the most expensive social welfare programs in Polish history. Under the program, which took effect on April 1, 2016, families with two or more children are eligible for a benefit of PLN 500 per child per month. Families with one child are also eligible for the benefit if their average monthly income per household member does not exceed PLN 800. If any of the children in a family is disabled, the monthly income limit rises to PLN 1,200. The program covered more than 3.5 million children nationwide, work-

Chapter 6. Key Economic Policy Developments in 2010–2016 and Challenges Ahead 105
ing out to a monthly cost of PLN 1.9 billion. In addition, the government set aside more than PLN 400 million a year for handling the payouts under the program. In total, the program cost the government PLN 17 billion in 2016, and in 2017 it was expected to cost almost PLN 23 billion, or 1.2% of GDP (6.2% of total budgetary spending and 3.1% of general government expenditure). Childcare benefits are the sixth-largest item in the budget, and the cost of the program exceeds spending on areas such as higher education, research and development, unemployment benefits, road projects, or the justice administration system.
The government says it expects the program to boost the birth rate, help expand the labor force in the future, and add to the country’s potential for economic growth. The Ministry of Family, Labor and Social Policy (MRPiPS) assumes that the 500+ pro-gram will make it possible to meet the most optimistic forecast of the country’s Cen-tral Statistical Office (GUS) of 2014 under which the fertility rate in Poland would increase to 1.60 by 2025 (with the worst-case scenario suggesting 1.30 and the most probable average-case scenario speaking of 1.38). GUS’s best-case scenario for the number of births means that 14% more children would be born in Poland annually on average by 2050 than in the average-case scenario. It is worth noting, however, that the GUS forecasts considered by the ministry did not take into account changes in family policy introduced from 2014 to 2016, including year-long parental leave and parental benefits for unemployed persons.
In the medium term, the impact of the Family 500+ program on the supply of labor will likely be negative, as it will discourage low-wage earners from seeking employ-ment. This especially applies to so-called second earners, mostly low-skilled or part-time women workers who earn less than their partners. As a result, anywhere from 200,000 to 300,000 people will disappear from the labor market, and female economic activity rate will decrease by about 3 percentage points. If the government scenario materializes, the impact of the 500+ program on demography and the labor market will even out after about 35 years. Only then will a sufficient number of young people who were born thanks to the program begin to work to offset the decline in the eco-nomic activity of their mothers. If the program runs until 2050, an additional 2.5 mil-lion Poles will be born (Myck 2016; Arak 2016).
Another key change in economic policy made by the PiS government was its re-versal of the 2012 pension reform by restoring the previous retirement age of 60 for women and 65 for men as of October 2017. The decision will lead to increased spend-ing on pensions, reduced contributions and lower government tax revenue. Using government calculations, it can be estimated that in 2018, the first full year under the law, Poland’s general government deficit will increase by PLN 11.4 billion (Rada Mi-nistrów, 2016c). This will be due to a PLN 10.3 billion increase in the Social Insurance

Adam Czerniak, Ryszard Rapacki106
Fund (FUS) deficit, accompanied by a PLN 200 million rise in the Agricultural Social Insurance Fund (KRUS) and a PLN 900 million decrease in tax revenue. In 2017, due to a transfer from OFEs to ZUS of assets held by citizens nearing retirement, the costs and revenues of the reform will be balanced. It is worth pointing out, however, that under Eurostat regulations (ESA 2010), transfers from OFEs to ZUS cannot be classi-fied as Social Insurance Fund income and can only serve to finance the Fund’s defi-cit. As a result, after lowering the retirement age, the general government deficit will increase by 0.3% of GDP in 2017 and by 0.8–0.9 percent annually from 2018 to 2020, producing a total cost of 2.8 percent of GDP by 2020. In the next decade, the cost of lowering the retirement age may exceed 1 percent of GDP a year.
Another important implication of reversing the 2012 reform will be a fall in re-tirement benefits. In the current system their level depends on the number of years worked and on the amount of remuneration. That’s why the shorter the people work, the lower pensions they will get. Women will be able to retire seven years earlier than previously planned, but will receive significantly lower pensions than men. Some-one earning the national average will most likely receive the minimum pension after retirement (GRAPE, 2016). In March 2017, the minimum pension rose to PLN 1,000 a month following a decision by the PiS government.
Together with the Family 500+ program, the lower retirement age will affect the economic activity of the Polish people, causing the labor force to shrink and nega-tively affecting Poland’s potential for economic growth. After taking into account the changes, there will be almost 900,000 fewer workers in Poland in 2025 than in 2016, and the labor force will decrease by 1.6 million, or 11 percent, by 2050.
Apart from the aforementioned moves, PiS made a number of other smaller chang-es in fiscal policy, whose expansionary effect on the economy either began to materi-alize in 2016 or will be felt in the following years. The most important moves included the introduction of a progressive tax-free allowance. As of 2017, taxpayers with annu-al incomes not exceeding PLN 6,600 are exempt from personal income tax (PIT). Be-yond this level the tax-free amount decreases with rises in income. Annual incomes above PLN 11,000 are subject to the previous limit of PLN 3,091. The tax-free allow-ance for taxpayers earning more than the second tax threshold of PLN 85,500 is lower than previously, with the allowance falling steadily all the way to PLN 127,000. Those earning more than PLN 127,000 have no allowance, but they are exempt from further pension contributions beyond this level. Around 3.5 million taxpayers are expected to benefit from the new rules. About 20 million of Poland’s 24.6 million personal in-come taxpayers are expected to be unaffected by the move, while just over 710,000 will have a lower tax-free amount. The changes are expected to add PLN 1 billion to the general government deficit in 2018, according to preliminary estimates.
Chapter 6. Key Economic Policy Developments in 2010–2016 and Challenges Ahead 107
In addition to modifying the tax-free allowance rules, PiS decided to partially unfreeze wages in the public sector. It also raised salaries for uniformed employees, cut the corporate income tax (CIT) for small businesses and microenterprises from 19% to 15%, and mitigated the spending rule by replacing projected inflation with the NBP inflation target. The government also introduced a minimum hourly wage for people employed on a freelance basis and increased the minimum monthly wage to PLN 2,000 as of 2017, which marks the highest hike in a decade.
The total annual cost for the public finance sector of all reforms introduced by PiS will exceed PLN 35 billion in 2018. Only to a small extent will they be covered by tax increases and the Finance Ministry’s planned efforts to tighten up the tax system. By the end of 2016, a tax on selected financial institutions that entered into force on Feb. 1, which is widely referred to as the banking tax, had had the greatest contribu-tion to increasing tax revenue. The tax covers banks, insurance companies, credit un-ions, and lenders operating in Poland if their assets exceed PLN 2 billion and they do not pursue a recovery program. Every year each of these institutions must pay 0.44 percent of the value of its assets, less the value of Treasury bonds purchased and equi-ty. In the first eight months of the banking tax, the government earned a total of PLN 2.79 billion, barely half the 2016 budget target of PLN 5.5 billion. This is the result of massive purchases of government bonds by banks as well as the launch of recovery processes in some lending institutions combined with more stringent equity require-ments by the Polish Financial Supervision Authority (KNF).
In addition to the tax on selected financial institutions, PiS slapped a sales tax on retailers, but due to opposition from the European Commission, the Finance Min-istry had to suspend it before all the payments for the first month were transferred to the budget. Increased tax collections are expected to be the main source of reve-nue growth for the government. To this end, the government imposed an obligation on companies to enforce a Standard Audit File and introduced a number of changes in the functioning of the tax administration, aimed at streamlining its operations. It will take some time before the results of these efforts can be evaluated.
Key challenges
In this section, we outline the biggest challenges facing Polish economic policy makers in the years ahead. We focus on two categories of development barriers and threats to the Polish economy. The first category comprises threats that have been growing for many years, including those resulting from the negligence and failures of

Adam Czerniak, Ryszard Rapacki108
a number of previous governments. The second category encompasses new challeng-es that are a direct consequence of the first year of the PiS government.
Major economic policy challenges in Poland can be classified into two intercon-nected groups. The first group deals with conceptual, political and institutional de-velopment barriers that make up a broad framework of economic activity in Poland and determine the structure and strength of incentives influencing the behavior and decisions of economic agents. The second group covers challenges that stem from the mode of operation of the Polish economy, its growth factors and macroeconom-ic performance.
Conceptual, political and institutional challenges
The first fundamental weakness of Polish economic policy is the failure of suc-cessive governments and policy makers to define the target model of capitalism that should be built in the country. The goal of systemic transformation in Poland—both at the very beginning of this process and on the country’s road from “plan to mar-ket”—was usually defined vaguely as the creation of a liberal market economy (or capitalism), without a clear vision of what shape it should take.
Due to the lack of a clear vision about the model of capitalism that would best fit the country’s development determinants and aspirations, Poland’s emerging market economy is largely a hybrid. Various parts of the country’s institutional matrix come from different institutional orders and are not complementary. As a consequence, in-stead of triggering positive synergies and increased efficiency, this institutional am-biguity has generated rising frictions and increased idle capacity in the system.
Second, the government has apparently failed in its attempts to precisely define Poland’s present and future role in the EU, other than just being a recipient of EU funds. While the need for efficient absorption of EU funds (and institutions) goes without saying, an optimal allocation and choice of alternative uses for these funds should originate from a national development strategy (an outline of which, known as the Morawiecki Plan, is still at the formative stage even though the PiS govern-ment is well into its second year). While Poland has done relatively well in terms of gaining access to EU funds, it has performed much worse in defining its development priorities in the allocation and use of these funds. At the same time, it has underper-formed in its endeavors to fully recognize the costs and benefits of various EU pro-grams in terms of Poland’s national interest.
Third, Poland risks becoming a peripheral EU member country in this context. Under this scenario, Poland would increasingly specialize in the production of simple

Chapter 6. Key Economic Policy Developments in 2010–2016 and Challenges Ahead 109
manufacturing goods with a low level of processing and relatively low value-added, being at best a subcontractor for more technologically advanced products.
Fourth, the list of major challenges includes a failure by the government to cre-ate favorable conditions for sustainable, long-term economic growth, in particular failure to generate positive externalities for the private business sector. Specifically, key government failures in this area include underfunding of R&D activities, inade-quate support for the development and upgrading of human capital, neglecting the significance of social capital—whose insufficient stock ranks among the most acute development barriers in the Polish economy—and ineffective efforts to foster the de-velopment of information and communication technology (ICT).
Fifth, this government weakness stems mainly from a strong redistributive bias in Poland’s public expenditure policy (a distorted pattern of government functions) at the expense of development spending. Other causes include a failure to meet the “golden rule” of public finance, the continually growing scale of rent-seeking, and the persistence of an unproductive model of entrepreneurship, as described by American economist William Baumol (Baumol 1990).
Sixth, Poland continues to exhibit many symptoms of the Myrdalian “soft state” pattern where the incidence of corruption still tends to be excessive, the judiciary branch of power is increasingly inefficient (in particular business courts), and law enforcement continues to be weak, which means a strong asymmetry between for-mal and informal institutions in favor of the latter (Rapacki 2012). At the same time, there have been mounting symptoms of a declining quality of public and merit goods such as healthcare and education.
Finally, in contrast to some other transition countries in the CEE region (Slova-kia and the Baltic states), Poland has not managed to substantially downsize its gov-ernment sector and reduce the scope of its functions during the past six years (and more generally throughout the transition period). If the proportion of public expend-iture to GDP is adopted as the basic gauge of the size of government, this index has remained stable in Poland since the early 1990 s, at above 40%. In the global perspec-tive, the index for Poland has been about twice as high as those in peer countries with a similar level of economic development (23%–24%). At the same time, the figure has remained close to the average level in the European Union and the OECD. This pattern implies that Poland displays indicators comparable to those in the most de-veloped EU countries. In other words, the size of government in Poland is excessive for the country’s economic development level. What’s more, in the last several years the size of government in Poland has begun to grow again. Employment in public ad-ministration has increased by over 10% to more than 600,000.

Adam Czerniak, Ryszard Rapacki110
Macroeconomic challenges
Polish economic policy faces a number of major macroeconomic development challenges. These include the following:
The first challenge that is likely to adversely affect Poland’s development pros-pects in the next 30 to 45 years is its unfavorable demographic trends. These include a shrinking population, unfavorable changes in the age composition of Polish society, emigration and brain drain, and a permanent decline in the dependency ratio—the number of those working per one retired person.
The second challenge is that the Polish labor market displays a number of imper-fections. These include a low level of economic activity in the country, combined with high unemployment among young people and a large share of flexible forms of em-ployment. In addition, important inter-temporal trade-offs have been strengthened in the market in recent years. On the one hand, the labor market is becoming more flexible in the short term, which facilitates the absorption of asymmetric shocks. On the other hand, in the long term, this trend undermines the foundations of the inter-national competitiveness of the Polish economy (which include low costs, a low and medium level of export processing, and low value added), because it erodes incen-tives to upgrade qualifications and innovate (Rapacki 2016).
Third, the Polish economy displays the lowest propensity to save and the low-est investment-to-GDP ratio in Central and Eastern Europe. Under the endogenous growth model, a sufficiently high investment rate and adequate domestic savings—which provide funding for investment in the long term—are the necessary conditions for fast and sustainable economic growth.
A fourth key barrier is a persistently low innovative capability of the Polish econ-omy. Of special note among its numerous symptoms is a low proportion of high-tech products in manufacturing exports (8%) and a huge license trade deficit (the ratio of export receipts to import spending is 1:10).
A fifth major challenge for Polish economic policy is a low (and shrinking, accord-ing to some empirical studies) stock of social capital. Using the terminology devised by Francis Fukuyama, Poland should be described as a low-trust society (Fukuyama 1997). Moreover, while Poles’ distrust of government has strong historical roots, a new trend has emerged suggesting a similar distrust on the part of the state toward citi-zens and private businesses. As a result, the government and public administration in Poland tend to devise bureaucratic hurdles, which, combined with increased gov-ernment intervention, limit economic freedom.

Chapter 6. Key Economic Policy Developments in 2010–2016 and Challenges Ahead 111
A sixth serious development challenge stems from rapidly growing tensions in Poland’s energy mix, which are mostly due to delayed investment projects aimed at developing and modernizing the country’s power-generation base. The effect of this factor is compounded by the prospect of a substantial rise in the costs of generating and supplying electricity in Poland, in the wake of an intergovernmental agreement (known as the climate package) adopted by the EU in the autumn of 2014. The package calls for considerable reductions in toxic emissions and the resulting need to switch to more environment-friendly energy generation technologies.
New challenges
In this section, we attempt to outline key economic policy challenges resulting from moves by the Law and Justice (PiS) government during its first year in power. We assume that PiS will continue in its efforts to deliver on most of its election prom-ises, which would lead to the high probability of an expansionary fiscal policy, and—to a lesser extent—expansionary monetary policy. We also believe it is likely that the government will press ahead with the kind of institutional changes it launched in November 2015 in a bid to change the foundations of Poland’s political system and liberal democracy. This could negatively affect Poland’s image abroad and further weaken its position in the European Union, leading to the country’s growing margin-alization within the bloc. This scenario, if it materializes, will mean the emergence of new economic policy challenges in the form of a variety of threats to short-, medi-um-, and long-term development.
Short-term effects
� Strong fiscal expansion, resulting mainly from increased government expendi-ture on allowances for large families (the so-called Family 500+ program with a total price tag of PLN 17 billion in 2016 and PLN 23 billion in 2017). As we esti-mated in the first part of this chapter, the total annual cost of all PiS reforms for the public finance sector will exceed PLN 35 billion in 2018. Meeting all election promises in the area of social transfers would pose an additional burden on the budget to the tune of PLN 50 billion a year.
� A likely increase in the 2017 budget deficit to above 3% of GDP, thus exceeding the Maastricht nominal convergence criterion.

Adam Czerniak, Ryszard Rapacki112
� As a result, the European Commission may reopen its excessive deficit procedure with regard to Poland.
� Increased government spending (mostly on consumption) financed from a grow-ing deficit and public debt would lead to a crowding-out effect in the economy with regard to private investment, which would consequently change the way in which national income is distributed (on the demand side); the role of the pri-vate sector would fall in favor of the public sector.
� At the same time, due to increased “rigid” government expenditure, not accom-panied by a parallel increase in permanent sources of funding, the structural deficit might increase. According to the latest forecast by the European Commis-sion (European Commission, 2016), Poland’s general government deficit in 2018 could reach 3.3% (up from 2.3% in 2015), which would be one of the worst re-sults in the EU.
� A growing general government deficit, accompanied by increased negative gov-ernment savings, would reduce the possibility of financing investment projects from domestic private-sector savings.
� An increased perceived risk of investing in Poland would translate into a higher cost of borrowing on international financial markets. Such a scenario is increas-ingly probable after a January 2016 decision by rating agency Standard and Poor’s to downgrade Poland’s investment rating, followed by warnings in November 2016 from the Moody’s and Fitch agencies that Poland's credit rating could be given a negative outlook in connection with the impending cut in the retirement age.
� High probability of a complete dismantling of the three-pillar pension system through the takeover by the government of the remaining part of pension assets accumulated in OFE pension funds (nationalization of retirement savings).
� The reversal of the previous government’s pension system reform (based on rais-ing the retirement age from 60 to 65 years for women and from 65 to 67 years for men) may create additional constraints for the current and future liquidity of the Social Insurance Fund and the national budget.
Medium- and long-term effects
Macroeconomic
� Increased inflationary pressure and expectations resulting from two interrelat-ed factors:(1) a significant loosening of fiscal and monetary policies, and

Chapter 6. Key Economic Policy Developments in 2010–2016 and Challenges Ahead 113
(2) almost full use of the production capacity in the Polish economy (with the out-put gap estimated at only –0.6% of potential GDP) and a significant decelera-tion in the rate of potential economic growth (to no more than 3.0% a year).
� This may mean that additional incentives for growth from fiscal and/or monetary expansion (in the form of measures such as increased lending to SMEs) may lead to an overheating of the Polish economy and accelerated inflation rather than ac-celerated GDP growth.
� In the slightly longer term, insufficient propensity to save (currently standing at 18%–19% of GDP) and a low investment rate (20% instead of at least 24–25% of GDP) may contribute to a slowdown in the Polish economy.
� The crowding-out effect (see above) may have a similar effect. It will lead to a less efficient use of resources in Poland on average (a decrease in the growth rate of total factor productivity, or TFP) and thus a deceleration of the potential econom-ic growth rate.
� In this context, it is also worth highlighting a continued contradiction between the actual moves of the governing party and the main objectives announced by Deputy Prime Minister Mateusz Morawiecki in mid-February 2016. Morawiecki’s Plan for Responsible Development calls for a significant increase in domestic sav-ings and investment, coupled with increased national innovative capability and support for domestic capital. However, according to standard economic theory, it is impossible to increase the consumption and investment rates while simulta-neously limiting the role of foreign savings in an economy.
� Morawiecki’s plan also contains an internal contradiction of a deeper, institu-tional nature. While the objectives set out in the plan (such as increasing the in-novation capacity of the Polish economy) have been taken over mainly from the variety of capitalism called the liberal market economy (or the Anglo-Saxon model of capitalism), the means and methods of achieving them (strong statism and an increased importance of non-market forms of coordination, combined with rena-tionalization) come from a completely different institutional order, dubbed a co-ordinated market economy (or in other words, continental European or Nordic model of capitalism).2
� A takeover by the government of the remaining OFE assets would result in a con-version (postponement) of the official, “visible” part of the public debt into hidden, “invisible” debt (promises of future pension payments) and a significant increase in the latter form of debt.
2 This contradiction has been pointed out by A. Wojtyna (Wojtyna, 2016).

Adam Czerniak, Ryszard Rapacki114
� A decision made by Polish parliament in November 2016 to backtrack on the pen-sion reform based on extending the retirement age is likely to decrease the supply of labor and lead to a drastic reduction in the replacement rate for future retirees. At the same time, it could threaten the long-term solvency of the Social Insurance Institution and the public finance sector.
� This decision could also deal a further body blow to the Warsaw Stock Exchange, which has already underperformed significantly in the wake of the 2014 nation-alization of half of the OFE pension funds assets by the PO-PSL government.
Institutional
The first year of the PiS government also marked the emergence of new devel-opment challenges of an institutional nature. The following processes were the most important:
� Erosion of the foundations of Poland’s liberal democracy system based on checks and balances and a separation of powers.
� Progressive dismantling of the civil service. � Limiting the scope of media freedom, thus targeting the fourth estate. � Deepening divisions in society: the disappearance of a sense of community. � A further decline in the level of trust and willingness to cooperate among the
public. � Weakening incentives for productive entrepreneurship and investment.
Summary: key long-term consequences
The cumulative effect of these development challenges, combined with a missing or insufficient response of economic policy, may eventually lead to a steady decelera-tion of growth dynamics and a subsequent deterioration in the international compet-itiveness of the Polish economy. In particular, it is worth highlighting the following possible long-term consequences of this scenario.1. Perpetuation of a (semi) peripheral model of development based on imitation
rather than innovation in the Polish economy.2. A progressive process of anomie, or breakdown of social structure.3. A growing role of informal institutions at the expense of formal ones.4. Stronger incentives for unproductive and destructive entrepreneurship.5. A further increase in the idle capacity of the institutional system and a progres-
sive erosion of Poland’s comparative institutional advantage.

Chapter 6. Key Economic Policy Developments in 2010–2016 and Challenges Ahead 115
All these factors may lead to a lasting decline in the potential rate of economic growth. Some symptoms of this new unfavorable trend have already appeared in Po-land. In the past several years the Polish economy has decelerated in terms of potential GDP growth, from more than 5% to around 3% per annum, or by about 2.5 percent-age points. What’s more, based on long-term forecasts by the European Commission, the OECD and our own projections (Matkowski, Próchniak, Rapacki 2016), after 2020 Poland’s economic growth is likely to decelerate further, to a level below 2% annually.
References
Arak P., (2016), Jak program 500+ wpłynie na rynek pracy, Polityka Insight, Feb. 22, 2016.Baumol W., (1990), Entrepreneurship: Productive, Unproductive and Destructive, Journal of
Political Economy, vol. 98, No. 5.Council of the European Union (2009), Council Decision of 7 July 2009 on the existence of
an excessive deficit in Poland (2009/589/EC), Official Journal of the European Union.Council of the European Union (2015), Council Decision (EU) 2015/1026 of 19 June 2015
abrogating Decision 2009/589/EC on the existence of an excessive deficit in Poland, Offi-cial Journal of the European Union, European Commission (2016), Autumn Economic Forecasts, Brussels.
GRAPE (2016), Obniżenie wieku emerytalnego. Jakie będą skutki? http://grape.org.pl/blog/co-dokladnie-oznacza-obnizanie-wieku-emerytalnego-w-polsce/ [accessed Oct. 25, 2016].
Matkowski Z., Próchniak M., Rapacki R., (2016), Real Income Convergence between Central East-ern and Western Europe: Past, Present, and Prospects, Ekonomista, No. 6.
Ministerstwo Finansów (2013), Uzasadnienie do projektu ustawy o zmianie ustawy o finansach publicznych oraz niektórych innych ustaw, Aug. 14, 2013, Ministerstwo Finansów.
Ministerstwo Finansów (2014), Informacja o działaniach podjętych przez Polskę w celu realiza-cji rekomendacji Rady w ramach procedury nadmiernego deficytu, Ministerstwo Finansów.
MPiPS (2012), Uzasadnienie do projektu ustawy o zmianie ustawy o emeryturach i rentach z Fun-duszu Ubezpieczeń Społecznych oraz niektórych innych ustaw, March 12, 2012, Ministerstwo Pracy i Polityki Społecznej.
MPiPS (2013), Uzasadnienie do projektu ustawy o zmianie niektórych ustaw w związku z okre-śleniem zasad wypłaty emerytur ze środków zgromadzonych w otwartych funduszach eme-rytalnych, Oct. 10, 2013, Ministerstwo Pracy i Polityki Społecznej.
MPiPS (2014), K 1/14 – pismo Ministra Pracy i Polityki Społecznej z 4 kwietnia 2014 r. – skutki finansowe dot. wniosku Prezydenta RP – uzupełnienie/załącznik, April 4, 2014, Minister-stwo Pracy i Polityki Społecznej.
Myck M., (2016), Estimating Labour Supply Response to the Introduction of the Family 500+ Programme, CenEA Working Paper Series 01/16.

Adam Czerniak, Ryszard Rapacki116
Rada Ministrów (2015), Wieloletni plan finansowy państwa na lata 2015–2018, April, Warszawa.Rada Ministrów (2016a), Wieloletni plan finansowy państwa na lata 2016–2019, April,
Warszawa.Rada Ministrów (2016b), Ustawa budżetowa na rok 2017. Uzasadnienie, September, Warszawa.Rada Ministrów (2016c), Stanowisko Rady Ministrów wobec prezydenckiego projektu ustawy
o zmianie ustawy o emeryturach i rentach z Funduszu Ubezpieczeń Społecznych oraz niektó-rych innych ustaw, July, Warszawa.
Rapacki R., (2016), The Institutional Underpinnings of the Prospective Euro Adoption in Poland, chapter 5, in: Y. Koyama (ed.): The Eurozone Enlargement: Prospect of New EU Member States for Euro Adoption, New York: Nova Science Publishers, pp. 65–86.
Rapacki R., (2012), O szansach i zagrożeniach rozwoju polskiej gospodarki, in: Wykłady inau-gurujące rok akademicki 2011/2012, Instytut Problemów Współczesnej Cywilizacji, War-szawa, pp. 65–73.
Wojtyna A., Szanse i zagrożenia rozwoju polskiej gospodarki, seminar presentation (PTE and INE PAN), Warsaw, Nov. 23, 2016.
Chapter 7
The Internationalization of Poland’s Financial System from 2010 to 2016
Katarzyna Sum
Introduction
Internationalization is an important factor in the development of financial systems. It can be defined as a process whereby a country’s institutions become active abroad while foreign investors enter the country’s domestic market. The main signs of the internationalization of the financial system are an increased number and volume of transactions on foreign markets, an increased role for non-residents in financial trans-actions, greater foreign investment in the domestic financial system, and a country’s increased investment abroad coupled with the development of international finan-cial institutions. The internationalization of the financial sector may produce a num-ber of benefits for the competitiveness of the economy. Above all, foreign investment makes it possible to access capital at a time when it is in short supply on the domes-tic market, accompanied by a lower cost of acquiring this capital and an increased li-quidity of individual segments of financial markets resulting from a larger number of participants and a greater supply of instruments. The liberalization of financial mar-kets can therefore contribute to economic growth and boost the competitiveness of an economy, thus enabling investment that would otherwise not be possible. The in-ternationalization of the financial system also means removing barriers to an inflow of portfolio investment. This makes it possible to diversify risk for domestic investors. Surplus funds can be invested more effectively due to lower transaction costs.
Internationalization can help improve the quality of services through increased competition between institutions; it enables innovation and a wider range of servic-es offered through a flow of know-how. It contributes to integration with the global financial system, thus facilitating services for international companies. A number of empirical studies have shown that the internationalization of the financial system has a positive impact on its development; these include Chinn & Ito (2005); Leahy et al. (2001); Klein & Olivei (2001); Kose, Prasad & Terrones (2009); and Osada & Saito (2010).

Katarzyna Sum118
However, the internationalization of the financial system carries certain risks. A dominant role of foreign businesses in various segments of the financial system may cause domestic supervisory institutions to lose control of the financial system. A pre-dominant role of foreign financial institutions may limit the development of domestic financial companies, and in extreme cases lead to their reluctance to finance invest-ment projects needed for a country. Such trends can especially be observed at a time of financial crises when there is a process of so-called “sovereign suasion” based on the domination of financial institutions by the governments of the countries of origin. This process leads to attempts to save parent companies, accompanied by a transfer of funds abroad as part of a multinational corporation. In addition, in periods of finan-cial turmoil strong ties with foreign institutions can lead to the so-called contagion effect, or the spreading of the crisis.1
The Polish financial system has undergone significant internationalization dur-ing the past two decades, with a progressive liberalization of its various segments and markets and a growing activity of foreign investors in the country. After the 2007–2009 financial crisis, this trend weakened, yet the Polish financial system remained highly internationalized. Today internationalization is to a large extent promoted by common regulatory standards at the EU level that were introduced gradually after the crisis.
The aim of this chapter is to outline the evolution of Poland’s financial system from 2010 to 20162 in the context of its internationalization. We present indicators of the internationalization of the various components of the financial system and analyze their role in the system’s development during this period. We also identify the factors behind the internationalization of the system and outline prospects for its further development in the context of the changes it is undergoing.
Banking system
The internationalization of Poland’s banking system significantly determines the internationalization of the country’s entire financial sector. This is because banks have a predominant share in the total assets of financial institutions and play a key role in financial intermediation. From the mid-1990 s onward Poland’s banking system un-derwent extensive internationalization, which contributed to its development. At the
1 Bonfiglioli A. (2008), Financial integration, productivity and capital accumulation, Journal of Inter-national Economics, 76 (2), 337–355.
2 One limitation of this study is the availability of data; there is a lack of uniform statistics for the entire analyzed period. In the case of data taken from NBP reports, the studied period is 2010–2014. This time frame is sufficient to reliably show the trends in the internationalization of the Polish financial system dur-ing this period.

Chapter 7. The Internationalization of Poland’s Financial System from 2010 to 2016 119
same time the process led to a far greater share of foreign banks in the sector’s total assets compared with other EU countries (Figure 7.1). In 2014, this share was 59.4%, while in EU15 countries it ranged from 3% in Greece to 34% in Belgium. The 30% mark was exceeded only in Ireland (48%) and Finland (72%). A high ratio of foreign-con-trolled bank assets to total assets is a characteristic feature of all Central and Eastern European countries. In most of these countries (notably Bulgaria, the Czech Repub-lic, Estonia, Lithuania, Romania, and Slovakia), it exceeded 75%. Only Hungary and Latvia reported relatively lower figures, 46% and 52% respectively.
Figure 7.1. The share of foreign bank assets in Poland compared with selected other EU countries in 2014
0%
20%
40%
60%
80%
100%
120%
Bulg
aria
Czec
h Re
publ
ik
Esto
nia
Lith
uani
a
Latv
ia
Pola
nd
Rom
ania
Slov
ak R
epub
lik
Hun
gary
Aust
ria
Belg
ium
Den
mar
k
Finl
and
Fran
ce
Gre
ece
Spai
n
Net
herla
nds
Irla
nd
Ger
man
y
Potu
gal
Italy
Source: NBP.
After the 2007–2009 financial crisis, there was a move away from the strong level of banking sector internationalization in Poland. This was chiefly due to the materi-alization of risk related to the intense internationalization of financial institutions, reflected in a deteriorated condition of the parent companies of foreign banks ac-tive in Poland and the aforementioned “sovereign suasion” process. The share of for-eign bank assets in total banking-sector assets steadily decreased from 63% in 2011 to 59% in 2015, reflecting an ongoing process of so-called domestication of banks (Figure 7.2). Despite the withdrawal of foreign investors, total banking sector assets increased steadily in the analyzed period in both absolute terms and in relation to GDP (Figure 7.3) from PLN 1,158.5 billion in 2010 to PLN 1,529.3 billion in 2014. This means that the decreased involvement of foreign investors did not stop the sector from developing.

Katarzyna Sum120
Figure 7.2. The share of foreign bank assets in total banking-sector assets in Poland, 2010–2015
57%
58%
59%
60%
61%
62%
63%
64%
2010 2011 2012 2013 2014 2015
Source: NBP and KNF.
Figure 7.3. Banking sector assets in Poland, 2010–2014 (PLN billion)
0
200
400
600
800
1000
1200
1400
1600
1800
2010 2011 2012 2013 2014
Source: NBP.
The decreased role of foreign investors in the Polish banking sector was accompa-nied by decreased short-term financing of Polish banks with the use of deposits and loans obtained from foreign entities, mainly parent companies. This fell from 14.8% in 2010 to 10.9% in 2014 (Figure 7.4) as a result of a deteriorated financial condition of parent organizations and ownership changes in banks, combined with reduced demand for foreign-currency financing and a decreased share of foreign currency-denominat-ed mortgages.3 Another factor was reduced investment by foreign banks in Treasury
3 NBP (2014), Rozwój systemu finansowego w Polsce, NBP, Warszawa.

Chapter 7. The Internationalization of Poland’s Financial System from 2010 to 2016 121
securities.4 On the one hand, the decreased foreign financing of Polish banks reduces the risk of concentration, but on the other, it forces lending institutions to raise funds from domestic sources. While this could potentially lead to a reduced supply of credit, such a situation will be countered by a growing share of domestic investors as part of the bank “domestication” process.
Figure 7.4. The share of foreign deposits and loans in the financing of banks in Poland
0%
2%
4%
6%
8%
10%
12%
14%
16%
2010 2011 2012 2013 2014
Source: NBP.
Overall, it is possible to conclude that the internationalization of the Polish banking sector has significantly contributed to its development. Reversing the internationaliza-tion process is a challenge for Polish banks; however, it seems that the benefits of in-ternationalization have largely become exhausted, especially since the financial crisis.
Insurance sector
Foreign investors also played a dominant role in Poland’s insurance system. The internationalization of this sector was stable in the analyzed period. At the beginning of the period the share of foreign investors in the sector’s total assets stood at 53%; by 2012 it had increased to more than 58%, and in 2014 it was 55.4% (Figure 7.5). The sector underwent stable development during this time, its assets growing steadily from PLN 138 billion in 2010 to PLN 180 billion in 2016 (Figure 7.6). Income from premi-ums in the sector remained stable at around PLN 14 billion annually.5 New insurance
4 NBP (2012), Rozwój systemu finansowego w Polsce, NBP, Warszawa.5 KNF data.

Katarzyna Sum122
companies emerged in the analyzed period, but some others were folded and still others merged.6 The concentration of the sector, as measured by the share of the top five players in total premiums, was high, at around 60% for life insurance companies (Section I) and 70% for property insurers (Section II).7 About 35% of the market was in the hands of Poland’s PZU, and the assets of foreign insurers were spread among several companies.
Figure 7.5. The share of foreign companies in Polish insurance-sector assets, 2010–2014
50%
51%
52%
53%
54%
55%
56%
57%
58%
59%
2010 2011 2012 2013 2014
Source: NBP.
Figure 7.6. Insurance company assets, 2010–2016 (PLN billion)
0
20
40
60
80
100
120
140
160
180
200
2010 2011 2012 2013 2014 2015 2016
Source: KNF.
6 NBP (2014), Rozwój…, op. cit.7 KNF data.

Chapter 7. The Internationalization of Poland’s Financial System from 2010 to 2016 123
New implementing regulations accompanying the EU’s Solvency II Directive are a key factor of internationalization and a challenge for the further development of Poland’s insurance sector.8 These new rules entered into force on Jan. 1, 2016. They establish capital requirements and insurance supervision for insurance companies and could possibly increase their operating costs.9
Investment fund sector
Foreign investment funds can operate in Poland on the basis of the UCITS Direc-tive.10 The proportion of institutions active on the basis of this directive, however, is small. Foreign funds accounted for around 2% of the total net value of fund assets on the Polish market in the studied period.11 Domestic entities operating under the law on investment funds dominate on the Polish market.12 However, investment in foreign securities contributes to the internationalization of Poland’s investment fund sector.
Figure 7.7. Share of foreign securities in the assets of Polish investment funds
0%
1%
2%
3%
4%
5%
6%
7%
8%
9%
10%
2010 2011 2012 2013 2014
Foreign stock
Foreign debt securities
Source: NBP.
8 Directive 2009/138/EC of the European Parliament and of the Council of 25 November 2009 on the taking-up and pursuit of the business of Insurance and Reinsurance (Solvency II).
9 Cf. Sum K., The Polish Financial System in the Context of Regulatory Changes in the European Union, in: Poland. Competitiveness Report 2016, M. Weresa (ed.).
10 Undertakings for Collective Investments in Transferable Securities, Directive 2009/65/EC of the Euro-pean Parliament and of the Council of 13 July 2009 on the coordination of laws, regulations and adminis-trative provisions relating to undertakings for collective investment in transferable securities (UCITS).
11 KNF (2016), Materiał informacyjny na temat zbywania na terytorium Rzeczypospolitej Polskiej tytu-łów uczestnictwa emitowanych przez fundusze zagraniczne w okresie od 1 stycznia do 31 grudnia 2015 r.
12 Ustawa z dnia 27 maja 2004 r. o funduszach inwestycyjnych (Dz.U. z 2004 r., nr 146, poz. 1546, z poźn. zm.

Katarzyna Sum124
The analyzed period marked a gradual increase in the share of foreign debt secu-rities in the total assets of Polish funds from 4% to 6.8%. The share of foreign stocks initially fell from 7.2% to 4.4% in 2012 only to grow to 5.1% in 2013 and 9.4% in 2014 (Figure 7.7). This trend was favorable for the development of the sector because it contributed to a geographic diversification of risk. At the end of the period there was also an increased investment in the shares of foreign investment funds, which allowed domestic funds to enter markets that were less well known to them.13
Financial markets
Poland’s financial market displays a significant level of internationalization. Its various segments grew in the analyzed period, which was especially true of the spot and futures markets and as well as the equities market. The market for debt instru-ments also has a relatively high level of internationalization, particularly compared with its counterparts in other countries in Central and Eastern Europe.
Poland’s foreign exchange market is highly internationalized. This is shown by factors including a dominant share of non-residents in spot market trading. This share steadily increased from 81% in 2010 to 86% in 2014 (7.8), with a one-off decrease to 80% in 2012. Most zloty transactions on the offshore market were in London, and they were mainly concluded for speculative and investment reasons. Only 3% of the transactions were with non-financial companies. Transactions on the onshore mar-ket were to a much greater extent connected with the real economy; 33% of the total value of the transactions was with non-financial entities.14
Non-residents also had a dominant share in the futures market (Figure 7.9). In forward transactions, their share of average monthly net turnover fell from 99% in 2010 to 70% in 2013, but then increased again to 90% in 2014. Seventy percent of the total value of operations on the onshore market was from services for non-financial companies that purchased derivative instruments as a hedge against currency risk. On the offshore as well as the spot market, speculative operations with non-banking financial entities dominated. In the case of swap operations, non-residents were re-sponsible for 95% of the total turnover in 2010. This share decreased in the follow-ing years to 92%, but in 2014 it increased again to 99%. Transactions between banks dominated in this market segment, treated as a hedge against currency risk from for-
13 NBP (2016), Raport o stabilności system finansowego, NBP, Warszawa.14 NBP (2014), Rozwój systemu finansowego w Polsce, NBP, Warszawa.

Chapter 7. The Internationalization of Poland’s Financial System from 2010 to 2016 125
eign-currency housing loans.15 The share of non-residents in the trade of zloty options was relatively stable at around 97% (Figure 7.9). Foreign banks also accounted for a dominant portion of these transactions.
Figure 7.8. Share of non-residents in average daily spot market turnover
77%
78%
79%
80%
81%
82%
83%
84%
85%
86%
87%
2010 2011 2012 2013 2014
Source: NBP.
Figure 7.9. Share of non-residents in average net monthly turnover on the market for OTC foreign-currency derivatives at the end of a year
0%
20%
40%
60%
80%
100%
120%
2010 2011 2012 2013 2014
Forward
Swap
Options
Source: NBP.
Internationalization significantly contributed to the development of Poland’s for-eign exchange market. This was because domestic banks offered a limited range of instruments. They were far less active on the market for foreign-currency derivatives
15 NBP (2014), Rozwój systemu finansowego w Polsce, NBP, Warszawa.

Katarzyna Sum126
and did not play the role of market makers. Besides their credit limits were much lower than those of foreign institutions.16 Moreover, non-bank domestic financial institutions only to a limited extent invested in foreign-currency derivatives.
Overall, internationalization made it possible to broaden the range of instruments and significantly increase the liquidity of the foreign exchange market.
The Polish capital market underwent progressive internationalization in the ana-lyzed period. On the equities market, the capitalization of foreign companies listed on the Warsaw Stock Exchange soared from PLN 253.9 billion in 2010 to PLN 661.8 billion in 2014 (Figure 7.10). Thus, at the end of the studied period the capitalization of foreign companies exceeded that of domestic companies, which stood at PLN 591.2 billion.17 Another sign of the growing internationalization of the stock market was a steadily growing share of foreign investors in the capitalization of domestic companies on the WSE. It grew from 41% to 46.5% in the analyzed period (Figure 7.11). Non-residents purchased mainly shares of large companies making up the WIG20 index. The inter-nationalization of the futures equities market was relatively low but stable during the studied period. Foreign investors were responsible for around 15% of the total trading of derivatives on the WSE’s equities market (Figure 7.12).
Figure 7.10. Capitalization of foreign companies listed on the Warsaw Stock Exchange (PLN billion)
0
100
200
300
400
500
600
700
2010 2011 2012 2013 2014
Source: NBP data.
The unregulated segment of the equities market, NewConnect, enjoyed far less interest among foreign investors. The share of foreign investors in this sector ranged
16 Ibidem.17 Ibidem.

Chapter 7. The Internationalization of Poland’s Financial System from 2010 to 2016 127
from 3% to 10%.18 The low level of market internationalization could be because for-eign investors are unfamiliar with the specific features of NewConnect’s small and still developing companies, and because they also found it difficult to accept the low li-quidity of this market segment as well as the risk associated with its weaker regulation.
Figure 7.11. Share of foreign investors in the capitalization of Polish companies on the Warsaw Stock Exchange
38%
39%
40%
41%
42%
43%
44%
45%
46%
47%
2010 2011 2012 2013 2014
Source: NBP data.
Figure 7.12. Share of foreign investors in the trading of derivatives on the WSE’s equities market
0%
5%
10%
15%
20%
25%
2010 2011 2012 2013 2014
Source: NBP.
18 NBP data.

Katarzyna Sum128
Therefore it is possible to conclude that foreign investors generated a significant portion of the turnover, especially in the case of large companies listed on the Warsaw Stock Exchange’s main market, while their role in financing small domestic compa-nies was small. The development of the stock market was favored by the high capi-talization of foreign companies.
The debt instrument market shows a relatively high level of internationalization. In 2015, Poland was Central and Eastern Europe’s largest issuer of international bonds. It issued USD 63 billion worth of bonds, including USD 58 billion worth of government bonds, USD 4 billion worth of non-banking financial institution bonds, USD 1 billion worth of bank debt securities, and USD 1 billion worth of non-financial corporate bonds (Table 7.1). The total value of international bonds issued by Central and Eastern European countries ranged from USD 2 billion in Estonia to USD 34 billion in Hunga-ry. In the EU15, the figure was much higher, ranging from USD 66 billion in Portugal to USD 1.81 billion in the Netherlands. In this group of countries, international bonds were primarily issued by non-bank financial institutions.
Table 7.1. Value of international bonds issued (USD billion)
Central and Eastern European countries Total value Non-bank financial
institutions Banks Non-financial enterprises Government
Bulgaria 7 0 0 1 6
Estonia 2 0 0 2 0
Lithuania 12 0 0 0 12
Latvia 7 1 0 - 7
Poland 63 4 1 1 58
Romania 20 0 0 0 20
Slovakia 15 0 0 3 12
Hungary 34 9 8 1 23
EU15 countries
Austria 260 126 101 41 93
Belgium 146 85 20 40 21
Finland 164 119 65 22 24
France 1,387 990 586 389 8
Greece 105 71 65 3 31
Spain 565 504 132 24 38
Netherlands 1,814 1658 618 143 14
Ireland 790 754 114 17 20
Germany 1,125 891 467 159 75
Portugal 66 35 14 8 23
Italy 764 541 266 127 96
Source: Bank for International Settlements.

Chapter 7. The Internationalization of Poland’s Financial System from 2010 to 2016 129
Treasury bonds form the largest segment of Poland’s debt instrument market. Non-residents played an important role in financing Poland’s debt in the researched period as they were the dominant investors on the government bond market. At the end of the analyzed period, their share in the total value of issued bonds stood at around 40%.19 Foreign investors were also the main buyer of fixed-rate bonds, which are the main instrument for financing the country’s budget.
The high level of foreign investor involvement was due to decreased risk aver-sion on the Polish market from the beginning of the studied period, accompanied by continued significant differences in interest rates between catching-up economies and developed countries, which contributed to an inflow of funds to the domestic bond market.20 Other contributing factors included high market liquidity, in addition to Poland’s stable economic situation and a significant decrease in credit risk leading to lower credit default swap (CDS) spreads.
Foreign investors generated a large part of the turnover on the Treasury bond mar-ket. They were responsible for around 30% to 40% of the total turnover in this market segment. Foreign banks played the biggest role; their share was 30% in 2010, followed by 32.2% in 2012 and 23.6% in 2014 (Figure 7.13). The share of foreign non-banking financial institutions increased from 6.2% in 2010 to 13.7% in 2013, followed by a de-cline to 7.5% at the end of the analyzed period. The share of other non-residents in total turnover was much lower, ranging from 1.1% to 3.9%.
Figure 7.13. Share of foreign investors in total turnover on the Polish market for Treasury bonds
0%
5%
10%
15%
20%
25%
30%
35%
2010 2011 2012 2013 2014
Foreign banks
Non-bank foreignfinancial institutions
Other non-residents
19 NBP data.20 NBP (2012), Rozwój systemu finansowego w Polsce, NBP, Warszawa.

Katarzyna Sum130
Foreign investor involvement fluctuated during the studied period due not as much to internal factors as to changes in the attractiveness of bonds issued by the govern-ments of other countries. Foreign investors’ reluctance to invest in the debt securities of eurozone countries—amid a debt crisis and European Central Bank (ECB) interest rate cuts—contributed to increased interest in zloty-denominated bonds. One factor leading to a temporary decline in interest in Polish bonds was the Federal Reserve’s withdrawal from the Troubled Asset Relief Program (TARP), a U. S. government pro-gram for buying toxic assets and equity from financial institutions. This was combined with increased yields of U. S. Treasury debt securities.
Overall, internationalization was an important factor in the development of the Polish market for debt instruments during the studied period. A continually strong level of internationalization will depend on the perceived risk premium in the future, reflecting in particular the country’s fiscal situation and credit risk.
Conclusion
The analysis in this chapter shows that internationalization has been an important factor behind the development of Poland’s financial system. The internationalization of Poland’s financial system is primarily reflected in the dominant role of foreign in-vestors in the banking system and the insurance sector, combined with a predomi-nant share of non-residents in spot and futures market turnover, a high capitalization of foreign companies listed on the Warsaw Stock Exchange, a large share of foreign investors on the WSE’s regulated market, and a predominant share of non-residents on the debt securities market.
A substantial narrowing in the range of financial instruments offered by domes-tic institutions was an important factor behind the internationalization of Poland’s financial system during the studied period. Internationalization was also promoted by Poland’s economic stability, low perceived risk and attractive investment opportu-nities. The analysis of indicators of internationalization reveals that the internation-alization of individual segments of the financial system was stable throughout the analyzed period, with signs of possible changes in the coming years.
The ongoing domestication of financial institutions will contribute to a reduced role for foreign capital in the Polish financial system. It will also pose a challenge for the sector’s further development. Another challenge will be new regulatory standards that could potentially increase the operating costs of financial institutions, especially if accompanied by a reduction in foreign funding. The limited supply of instruments by domestic authorities will continue to work as a factor contributing to a continually

Chapter 7. The Internationalization of Poland’s Financial System from 2010 to 2016 131
high internationalization of financial markets. Changes in the involvement of foreign institutions and investors on Poland’s financial market will depend on the evolution of the future perceived risk premium reflecting in particular the country’s fiscal situ-ation and credit risk. Today internationalization is largely favored by common regu-latory standards at the EU level; these were introduced gradually after the financial crisis of 2007–2009.
These conclusions have important implications for economic policy and the in-ternational competitiveness of the Polish economy. As the internationalization of the financial system produces many benefits in the form of access to capital, greater li-quidity of individual segments of the financial market and improved service quality, it is desirable to create conditions for maintaining a continually high level of inter-nationalization, especially a large share of foreign investors in the capital market, which is particularly important from the point of view of the development of the real economy. Because financial system internationalization also entails certain risks, es-pecially excessive concentration of sources of funds, it is important to strike a balance between the participation of domestic and foreign institutions in the financial system.
One limitation of the study was insufficient availability of data, with a lack of uni-form statistics for the entire analyzed period. However, available data made it possi-ble to give a clear-cut picture of the internationalization of the Polish financial system in the studied period and formulate proposals on how the Polish economy should de-velop its competitiveness in the future.
From the point of view of the analyzed topic, an important next step would be to examine the conditions for financing Polish enterprises. This topic will be the subject of future research.
References
Bonfiglioli A., (2008), Financial integration, productivity and capital accumulation, Journal of International Economics, 76 (2), 337–355.
Chinn M., Ito H. (2005), What matters for financial development? Capital controls, institutions, and interactions, NBER Working Paper 11370.
Klein M., Olivei G., (2001), Capital Account Liberalization, Financial Depth and Economic Growth, mimeo.
KNF, 2010–2016, Raport o stanie sektora ubezpieczeń KNF, 2015, Raport o sytuacji banków.KNF, (2016), Materiał informacyjny na temat zbywania na terytorium Rzeczypospolitej Polskiej
tytułów uczestnictwa emitowanych przez fundusze zagraniczne w okresie od 1 stycznia do 31 grudnia 2015 r.
Katarzyna Sum132
Kose M., Prasad E., Eswar S., Terrones M., (2009), Does openness to international financial flows raise productivity growth?, Journal of International Money & Finance, 28 (4), 554–580.
Leahy, Michael, S. Schich, G. Wehinger, F. Pelgrin, and T. Thorgeirsson (2001), Contributions of financial systems to growth in OECD countries, OECD Economic Department Working Papers No. 280.
NBP, 2010–2016 (a), Raport o stabilności systemu finansowego, NBP, Warszawa.NBP, 2010–2015 (b), Rozwój systemu finansowego w Polsce, NBP, Warszawa.Osada M., Saito S., (2010), Financial integration and economic growth: an empirical analysis
using international panel data from 1974−2007, paper for the third annual workshop of the BIS Asian Research Networks held on March 26, 2010, http://www.bis.org/repoffi-cepublarpresearch 201003.13.pdf.
https://www.bis.org/statistics/secstats.htmhttps://www.bis.org/statistics/bansktats.htmDirective 2009/65/EC of the European Parliament and of the Council of 13 July 2009 on the
coordination of laws, regulations and administrative provisions relating to undertakings for collective investment in transferable securities (UCITS).
Directive 2009/138/EC of the European Parliament and of the Council of 25 November 2009 on the taking-up and pursuit of the business of Insurance and Reinsurance (Solvency II).
Sum K., (2016), The Polish Financial System in the Context of Regulatory Changes in the Euro-pean Union, in: Poland. Competitiveness Report 2016, M. Weresa (ed.).
Ustawa z dnia 27 maja 2004 r. o funduszach inwestycyjnych (Dz.U. z 2004 r., nr 146, poz. 1546, z poźn. zm. [The Law of May 27, 2004 on Investment Funds (Journal of Laws of 2004, No. 146, item 1546 with subsequent amendments)].

Chapter 8
Investment and Domestic Savings: Poland Compared with Other EU Countries
Piotr Maszczyk
Domestic savings and investment are key factors that determine the competitiveness of economies and the rate of economic growth. In Poland, domestic funds are the main source of financing investment, while the inflow of foreign capital, though still significant, is steadily decreasing.1 This chapter analyzes the role of investment and domestic savings in shaping the competitiveness of the Polish economy, with a focus on changes from 2010 to 2016, against the background of trends in other EU countries.
Investment
When analyzing the dynamics of changes in investment outlays in Poland in 2010– 2016, two key factors should be considered that influenced the evolution of this component of global demand. First, this seven-year period was a time when the negative implications of the global crisis of 2008 decreased steadily in the global econ-omy. This means that exogenous factors had a favorable effect on the level and pace of changes in investment outlays in Poland. Second, the year 2016 marked a funda-mental change in economic policy in Poland, following a change of government as a result of the 2015 elections. A deep correction of fiscal policy, coupled with the spe-cific rhetoric of prominent government officials, meant that in the context of invest-ment, endogenous factors were most likely of key importance. Of course, this strong impact of expectations-related internal factors is likely to be short-term in nature, and favorable trends in the global economy will gradually reduce its importance. How-ever, when assessing the evolution of investment outlays in 2016, their level was ap-parently primarily influenced by variables strongly determined by the relationship
1 It dropped by 1 percentage point, from 4% to 3%, in relation to GDP from 2010 to 2015 compared with the 2005–2010 period.

Piotr Maszczyk134
between the government and the corporate sector. On the other hand, it should be emphasized that the value of investment decreased in all the countries considered as a reference point for Poland (the Czech Republic, Hungary and Slovakia), although Hungary was the only country where this decrease was greater than in Poland. This appears to disprove a view fairly common among analysts that the decline in invest-ment was due solely to endogenous factors.
The first three years of the analyzed period (2010-2012) marked a drop in the value of investment in Poland, except for 2011 when the value of investment increased by almost 9%, driven by a significant acceleration in GDP growth. The negative trends in investment during this three-year period were obviously related to the fallout from the global crisis. Even though Poland’s economic growth in 2011 was more than 1.5 percentage points faster than in 2014, at 5% vs. 3.3%, investment outlays grew at a much slower rate: 8.8% vs. 10%. It was only when the Polish economy finally man-aged to overcome the negative consequences of the global crisis in 2014 that the rate at which investment grew in Poland became positive (though no longer rising). The trend continued in the next two years. Nevertheless, as in the case of GDP growth, the adverse influence of the global turbulence on Poland was moderate compared with the rest of the EU. The value of investment outlays decreased by only 1.8% from 2010 to 2012 in year-on-year terms, compared with a 17.6% increase in 2007.
On the one hand, growing investment improved the competitiveness of the Pol-ish economy. On the other, Polish enterprises performed better on EU markets and increased their investment outlays and thus their capacity to meet growing demand. The global crisis empirically confirmed the demand model. Because of a specific feed-back mechanism described in the Keynesian model, investment outlays influence the economy far more dramatically than private consumption or government spending and are responsible for the part of aggregate demand most strongly dependent on the business climate. Thus investment stimulated both the demand and supply sides of the Polish economy. As data analyzed later in this chapter show, the relationship between investment and economic growth described by the demand model was veri-fied positively in the Polish economy in the last three years. The slowdown in the rate at which gross fixed capital formation grew in 2015 despite a slight acceleration of economic growth should be treated as a one-off event. It resulted from a “correction” in the double-digit growth rate from the previous year, on the one hand, and a posi-tive impact of the foreign trade balance on economic growth on the other. The rate at which domestic demand grew in 2015 was almost 1.5 percentage points slower than in the previous year (3.4% vs. 4.7% in 2014), which, in line with the Keynesian model, was bound to produce a decrease in the rate of investment growth.

Chapter 8. Investment and Domestic Savings: Poland Compared with Other EU Countries 135
In 2010, the Polish economy grew 3.9%. This was not enough to increase the value of investment outlays, but the rate at which this part of aggregate demand decreased was slower than in the previous year (0.4%). In 2011, Poland’s economic growth picked up again (to 5%) and investment increased by more than 8% because of the feedback mechanism described above. The year 2012 (which marked “the sec-ond wave of the crisis”) produced another deceleration in GDP growth (to 1.9%) and investment outlays dropped by 1.8%, as expected. When the growth rate decreased in 2013 (by 0.2 percentage points), expectations that investment outlays would drop seemed to be justified. The anticipated effect materialized, and investment outlays fell by 1.1%. In 2014, economic growth accelerated by nearly 2 percentage points, which, in line with expectations formulated on the basis of the demand model, allowed gross fixed capital formation to increase by 10%. In 2015, GDP growth was even faster (at 3.9%), and investment spending increased again, albeit at a slower rate than the pre-vious year (6.1%, or nearly 4 percentage points slower). However, as suggested earlier, the slowdown in the growth of investment outlays was in this case caused by slower growth of domestic demand.
Preliminary data for 2016 showed that the relationship between investment and GDP growth remained stable. The slowdown in economic growth by more than 1 per-centage point (with a projected rate of 2.8% for 2016, down from 3.9% in 2015) was correlated with a projected 5.5% decline in gross fixed capital formation. An attempt to estimate investment expenditure in 2016 is made later in this chapter. However, it can be expected that investment increased in 2016 based on an acceleration in eco-nomic growth expected by most economists. This would mean the overall mechanism and interdependencies observed in previous years continued in 2016.
Figure 8.1. Investment growth in Poland, 2010–2016
−10.0%
−5.0%
0.0%
5.0%
10.0%
15.0%
2010 2011 2012 2013 2014 2015 2016-estimate
Source: Author’s calculations based on Central Statistical Office (GUS) data.

Piotr Maszczyk136
Despite optimistic expectations voiced last year in publications including this report, the value of investment in Poland decreased in 2016. While the estimates of possible growth in gross fixed capital formation were quite cautious, the gener-al expectation was that the positive upward trend initiated in 2014 would continue. Meanwhile, preliminary GUS data released in February 2017 showed that investment outlays at the end of the third quarter of 2016 totaled PLN 79.9 billion and were al-most 7% lower than for the corresponding period of the previous year. Preliminary GUS data for all of 2016 show that investment outlays came to PLN 257 billion and were 5.5% lower than in 2015, when investment rose by 6.1%. Thus the 2016 invest-ment ratio in the economy—the relation of investment outlays to the GDP in current prices—stood at 18.5%, according to preliminary GUS data, compared with 20.1% in 2015 and 19.6% in 2014.
As suggested earlier, the reversal in the positive trends in investment in Poland in 2016 should be viewed in the context of endogenous factors, primarily those relat-ed to the change of government in the second half of 2015, combined with a slower rate at which Poland absorbed structural funds coming to the country from the EU budget. The deceleration resulted from the expiration of the EU’s previous financial framework (2007-2013) combined with a lack of access to funds set aside for disburse-ment in 2014–2020.
The spending of funds from the EU budget is governed by the so-called “n+2” rule, under which funds must be spent within two years from the year when the money is allocated. This period ended in December 2015, which means that projects funded with transfers under the previous financial framework had to be completed by then. At the same time, many projects financed with funds under the current financial frame-work were still not launched, resulting in an overall decrease in the value of invest-ment projects under way in both the public and private sectors. These projects were financed mainly from the European Regional Development Fund and to a lesser ex-tent with funds earmarked for rural development.
A particularly worrying fact is that the delays in the spending of funds under most Operational Programmes are as much as a year, and two years in the case of railway projects. The slowdown in investment has strongly affected enterprises run by local government authorities, with the construction sector hardest hit by the decline. The number of public tenders, primarily those concerning infrastructure projects, has shrunk sharply. The government’s expansionary fiscal policy based on increased trans-fers has added to the general government deficit. It has been accompanied by strong pressure—including political pressure—on local governments to avoid further increas-ing the public finance deficit. As a result, local government authorities have remained reluctant to invest amid fear of inspections and being accused of mismanagement.
Chapter 8. Investment and Domestic Savings: Poland Compared with Other EU Countries 137
Meanwhile, after the end of the previous financial framework, Poland’s Devel-opment Ministry stopped regularly publishing data on expenditure by beneficiaries of EU co-financing, based on submitted applications for payment. This makes it im-possible to estimate either the amount of this expenditure in 2016 or its growth rate. Only a progress report is available on the implementation of programs under the EU’s 2014–2020 budget showing the state of play as of Feb. 19, 2017. It suggests that as of that day, 12,347 co-financing agreements had been signed with beneficiaries for PLN 77.5 billion worth of EU co-financing. No information is available on the amount of refunds (applications for payment) that would show the actual expenditure incurred as part of projects co-financed by the EU for the full year. Data unveiled by the Devel-opment Ministry in late July 2016—and based on submitted payment applications—suggested that the value of expenditure by beneficiaries cleared for co-financing had come to almost PLN 7.4 billion since the beginning of the year, with EU co-financing at PLN 6 billion, less than 2 percent of the total pool for 2014–2020. To compare, the total value of eligible expenditure by beneficiaries resulting from submitted payment applications was PLN 52.5 billion in 2015 (down from PLN 64.2 billion in 2014), with EU co-financing at PLN 37.8 billion (down from PLN 45.4 billion in 2014). Thus the value of spending by beneficiaries stood at PLN 371.9 billion at the end of 2015, with EU co-financing at PLN 264 billion.
The investment climate also deteriorated as businesspeople expressed uncertain-ty about the prospects of their companies amid discouraging signals coming from the government. One example of such unfavorable signals was a plan for a uniform sin-gle tax discussed for many months that would have meant increased tax burdens for the highest earners. The plan was eventually abandoned, but before that happened it adversely affected potential investment decisions. A new tax that the government imposed on the banking sector and retailers further affected the investment climate. Theoretically, companies should have increased their investment because their de-posits were close to record levels (nearly PLN 250 billion in bank accounts), accom-panied by high utilization of production capacity (around 80%), steadily decreasing unemployment, and record-cheap bank credit that could be used to leverage invest-ment spending. This was not the case, evidently because of the negative (though per-haps not fully rational) expectations. Meanwhile, investment in Germany, Poland’s top economic partner, increased by about 2% in 2016.
A steady stream of foreign direct investment is an additional argument that the decline in investment outlays in Poland in 2016 was chiefly driven by endogenous and expectation-related factors. While full data on FDI in Poland in 2016 were not avail-able at this writing (they were not expected to be released until the third quarter of 2017), preliminary information—posted by the Polish Investment and Trade Agency

Piotr Maszczyk138
(PAIH)2 on its website—suggested that the full year 2016 saw foreign businesses as keen on investing in Poland as they were in the previous year.
The year 2015 was extremely successful for Poland with regard to FDI: a total of 211 new projects were carried out, and a combined 19,651 jobs were created. Po-land not only continued to lead the pack in Central and Eastern Europe, but was also among leaders in all of Europe in terms of investment attractiveness. It was ranked fifth among the most attractive investment destinations in Europe and topped the list in its region. Poland was a top performer not only in terms of new projects but above all in their rapid growth in year-on-year terms. In 2015, 211 projects were carried out, up from 132 the previous year, meaning a rise by 60%, greater in any other European country except Russia. This included 142 new investment projects by companies with-out a previous presence in Poland and 69 reinvestment projects by companies with a record of investment in Poland.
According to the National Bank of Poland (NBP), Poland attracted EUR 12.2 bil-lion worth of FDI in 2015. This included EUR 3.6 billion in equity investment, EUR 7.1 billion in reinvested profits, and EUR 1.4 billion in debt securities.
Assuming that 2016 saw a similar level of FDI, it can be stated that the slump in the flow of FDI in Poland in 2012 and 2013 had been overcome in a sustainable manner. In 2004–2011, foreign direct investment in Poland ranged from USD 10 billion to USD 24 billion annually. In 2012, it was only USD 4.76 billion and in 2013 the FDI inflow was negative for the first time since 2000, when the National Bank of Poland began publishing its own statistics according to the current methodology. Of course, both the negative value of FDI in 2013 and its rapid increase in 2014 (around USD 14 billion) were largely due to one-off factors. In 2013, the negative value of FDI was mainly due to a single decision to close down a special-purpose entity established previously in Po-land and a transfer of nearly EUR 3.5 billion to the British tax haven of Jersey. The total value of FDI in Poland in 2013 came to EUR 9 billion. The fast growth of FDI in 2014 was largely because of a new investment project by Volkswagen A. G. in Biełężyce near Poznań. Taking this into account, the total value of FDI in 2015 of around EUR 12 billion (apparently followed by a comparable figure in 2016) meant stable growth compared with 2012 and 2013 but a decrease compared with the 2004–2011 period.
According to the PAIH, foreign businesses were especially interested in investing in modern services in Poland. Up to 70 share service, information and communica-tions technology (ICT) and business process outsourcing (BPO) centers were expect-ed to be established in the country in 2016 and 2017 to handle services outsourced by foreign corporations, such as accounting, IT support, and call centers. They were ex-
2 It replaced the former Polish Information and Foreign Investment Agency (PAIiIZ) on Feb. 3, 2017.

Chapter 8. Investment and Domestic Savings: Poland Compared with Other EU Countries 139
pected to create some 20,000 new jobs. The automotive sector was the second-most attractive sector to investors in terms of the number of projects, with more than EUR 1.3 billion in total investment planned by foreign companies with the support of the PAIH. There was also a revival in the food sector, with plans for 13 projects submitted by mid-2016. They were worth a total EUR 568 million and were expected to create 3,400 new jobs. The list also includes the R&D sector (with 11 projects), construction materials (seven projects), household appliances (six projects), the medical sector (five projects), and aerospace and electronics (four projects). The agency also reported that foreign direct investment in Poland had come to EUR 171.7 billion by the end of 2014.
According to PAIH experts, the four main factors determining Poland’s investment appeal are invariably low labor costs, the availability of qualified staff, the availabil-ity of production workers, and foreign language skills. Contrary to popular belief, foreign investors emphasize the high level of Poland’s higher education system and are also happy with its technical and vocational training system, which, combined with the growing popularity of engineering and technical education in the country, is producing a growing supply of skilled professionals. It seems that the availability of unique employee skills and foreign language competence, combined with meas-ures to support innovation, will contribute to the further development of Poland’s manufacturing sector.
A comparison of the rate at which investment changed in Poland in 2010–2016 with those for the Czech Republic, Slovakia, and Hungary—Poland’s main competi-tors in the region for FDI—clearly shows that there are important differences between these countries,3 although the level and rate of accumulation in these Central and East-ern European countries, all of which joined the EU in 2004, have mainly been influ-enced by exogenous factors (the global crisis, EU membership, and economic trends in Germany). Specifically, a slight convergence trend was in evidence between Poland and the Czech Republic (and to an extent Slovakia) in terms of the rate at which the value of investment changed; this pattern increasingly differed from the mechanisms at work in Hungary.
During the studied period, investment in the Czech Republic increased in 2010– –2011 and 2014–2015. As a result, the direction of changes in this component of global demand was six times in line with the trend observed in Poland. The only difference was in 2010, when the value of investment outlays in the Czech Republic increased slightly (by 1.3%), while in Poland it decreased slightly (by 0.4%). In other studied years, the direction of changes in the value of investment in Poland and the Czech
3 The data on investment outlays in the Czech Republic, Hungary, and Slovakia in 2010–2015 come from the Eurostat website: http://epp.eurostat.ec.eu.int.

Piotr Maszczyk140
Republic was convergent. It should be noted, however, that the variations in the value of investment in the Czech Republic were much lower than in Poland, in terms of both positive and negative growth rates. Generally, the variations in the value of invest-ment in the Czech Republic were the lowest in the group. Regardless of whether the rate rose or fell, the Czech figure was always the lowest. Nevertheless, much as in the case of Poland, the Czech economy failed to muster a stable growth rate in this part of aggregate demand; nor was it able to return to its 2008 investment level.
In the analyzed group of countries, the Slovak pattern of investment outlays and their growth was until recently the closest to Poland’s. Much as in the case of the Czech Republic, the direction of changes in this component of global demand in Slovakia was frequently in line with the trend observed in Poland: such a pattern was seen for six years during the analyzed period. As with the Czech Republic, the only difference was in 2010, when the value of investment outlays in Slovakia increased significantly (by more than 7%), while in Poland it decreased. It should be noted, however, that the variations in the value of investment in Slovakia were much higher than in both Poland and the Czech Republic, in terms of both positive and negative growth rates.
Hungary, much as Poland, Slovakia, and the Czech Republic, did not manage to muster a positive growth rate for investment in 2016. In fact, it recorded the deep-est decline among the analyzed countries (16%, while the decreases for Poland, the Czech Republic and Slovakia were 5.5%, 3.3% and 0.2% respectively). Moreover, Hungary experienced a decline in the value of investment not only in 2010 (as was the case in Poland), but also in 2012 and 2013. On the other hand, unlike in the other studied countries, the value of investment in Hungary increased not only in 2014 and 2015, but also in 2013. However, the symbolic increase in this component of global demand in 2015 (by 1.9%), combined with the deep decline in 2016, do not make it possible to definitively determine whether Hungary has indeed overcome its recent public finance crisis and its negative impact on investment.
Figure 8.2 compares Poland with other new EU member states in terms of the rate at which total investment outlays grew from 2010 to 2016.
Domestic savings in Poland in 2010–2016 are difficult to analyze because the most recent GUS data are for 2013. The level of domestic savings in 2014 and 2015 can be estimated on the basis of data published by the NBP.
Most economists agree that the insufficient level of domestic savings is slowing down investment processes and forcing Poland to use foreign savings in the form of FDI and other sources of foreign capital. Domestic savings are consequently seen as a stabilizing factor for economic growth in the long term.
In 2004–2007, a steady rise was recorded in the ratio of gross domestic savings to GDP. In 2007, this ratio increased by 3.9 percentage points over 2004. In 2008, after the

Chapter 8. Investment and Domestic Savings: Poland Compared with Other EU Countries 141
crisis began in the United States, the gross domestic savings-to-GDP ratio decreased, and this trend continued until 2010, when negative factors connected with the glob-al financial crisis evidently began to peter out. In subsequent years, the ratio began to increase again. In 2013, the gross domestic savings-to-GDP ratio was 18.1%, of this: 15.8% for non-financial corporations, 2.3% for households, minus 0.7% for the govern-ment and local-government sector, 1.2% for financial institutions, and minus 0.5% for non-commercial institutions. In all institutional sectors, savings are in part earmarked for accumulation and liabilities. The fact that non-financial corporations accounted for the largest figure shows that by the end of 2013, Poland had failed to overcome the negative trends triggered by the economic slowdown; the domestic savings rate had not returned to its pre-crisis level. In the following years, a strong upward trend could be observed, and Poland in 2014 succeeded in overcoming negative trends re-lated to the economic downturn, and domestic savings not only returned to their pre-crisis level, but were now more than 3 percentage points higher.
Figure 8.2. A comparison of investment growth in Poland, the Czech Republic, Slovakia, and Hungary, 2010–2016
−10.0%
−5.0%
0.0%
5.0%
10.0%
15.0%
20.0%
Poland Czech Republic Slovakia Hungary2010 2011 2012 2013 2014 2015 2016-estimate
Source: Author’s calculations based on Eurostat data.
The most up-to-date data on household savings was presented in January 2017 by the National Bank of Poland. In its “Financial Situation of Households in Q3 2016” study, the bank said that the rate of household savings at the end of the third quarter of 2016 had declined to 2% (according to seasonally adjusted data), due to a decrease in both voluntary savings and those collected in the fully-funded pillar of the pen-sion system. It is worth noting that the average saving rate in 2006–2016 was 2.4%. At the end of the analyzed period, household financial assets stood at just over PLN

Piotr Maszczyk142
1.8 billion, which marked a quarterly increase of 2% and an annual rise of 5.5%. As reported by the NBP, this growth was mainly a result of positive changes in valuation, with a lower share of transaction changes. The value of household incomes increased by nearly 6% year-on-year in the same period, with benefits transferred under the gov-ernment’s Family 500-Plus program responsible for more than 3 percentage points of the growth. It is difficult to judge at this point just what impact funds set aside for child benefits under this program will have on medium- and long-term saving deci-sions. The increase in the disposable incomes of families with two and more children should lead to higher savings, but a key determinant of household consumption de-cisions will be the perception of funds available under the Family 500-Plus program. If they are viewed as a permanent item, most of them will probably be earmarked for consumption. On the other hand, the temporary nature of this benefit (until a child reaches the age of 18) may limit this effect.
However, when analyzing this data, it is important to take into account the fact that corporate-sector savings are a key component of overall domestic savings. This is related to the key role of companies’ own funds in financing investment projects, which stems not only from barriers to access to funds from the banking sector and the capital market, but also from the preferences of businesspeople.
Figure 8.3. Gross domestic savings-to-GDP ratio, 2004–2015
14.00%
15.00%
16.00%
17.00%
18.00%
19.00%
20.00%
21.00%
22.00%
2004 2005 2006 2007 2008 2009 2010 2011 2012 2013 2014 2015
Source: Wskaźniki Zrównoważonego Rozwoju Polski 2015, GUS, Katowice 2015.
Chapter 8. Investment and Domestic Savings: Poland Compared with Other EU Countries 143
The future path of investment growth: a tentative forecast
Considering the combination of factors that contributed to slower investment growth in 2016, forecasting the value of this component of aggregate demand in 2017 is a difficult and risky task. Most analysts, however, expect Poland’s economic growth to accelerate in 2017, which in itself should lead to an increased value of investment outlays. The trends on the supply side, in particular the productivity of capital in the Polish economy, were extensively examined in previous editions of this report. That analysis showed that rapid investment growth was correlated with rapid GDP growth in Poland for many years. When the growth of fixed capital investment in Poland started to decelerate at the end of 1997, GDP growth slowed as well. When fixed capital out-lays began to grow again in 2004, the same trend was noted for GDP until 2008. This could suggest a specific “business cycle” in which periods of rapidly growing capital expenditure and declining productivity are interspersed with periods of decreasing capital and labor inputs, accompanied by Total Factor Productivity increases result-ing in accelerated GDP growth.
In this context, data released by GUS in the first quarter of 2017, coupled with business climate surveys, suggested that Poland’s economic growth in the full year would pick up by about 1 percentage point. Importantly, the country’s growth was expected to be primarily driven by a recovery in consumer demand and rising invest-ment spending. In addition, the total estimated value of investment projects already under way—an indicator showing possible directions of change in investment about two quarters ahead—been growing at the end of the first quarter of 2016. This meant that the value of investment outlays could also be expected to begin growing from the first quarter of 2017 in a trend that was likely to continue throughout the calendar year.
All these signals suggested that investment in Poland would increase by no less than 5% in 2017, under the assumption of at least 3.5% GDP growth. Significantly, the investment increase could be expected to be driven by not only the public but also the corporate sector (it was possible to cautiously forecast that gross fixed capital forma-tion would increase by about 3%).
Admittedly, similar forecasts formulated in early 2016 turned out to be completely missed. A pessimistic scenario of moderate 2%–3% growth in reality turned out to be quite a deep drop. It cannot be ruled out that the same may happen in 2017, especial-ly as endogenous factors limiting investment growth are still at work. The question of a profound reform of income taxes remains unresolved; this situation, together with announcements of a radical tightening up of the tax system, causes understandable fears among businesspeople. Nor is it impossible to rule out that Poland’s Monetary

Piotr Maszczyk144
Policy Council (RPP) will change tack and adopt a restrictive approach if inflation rises faster than expected. Tensions will probably continue to pervade the ruling ma-jority’s relations with the parliamentary and non-parliamentary opposition as well as EU and international institutions.
Moreover, the “conservative” structure of investment in Poland could limit GDP growth to 4% in the next five to 10 years. Because of the feedback mechanism de-scribed above, investment is strongly dependent on the business climate. With such moderate GDP growth, investment outlays would increase relatively slowly, thus hav-ing a negative impact on the economy. Even though this risk is most likely in the me-dium and long term—not during the next year—it poses a serious threat to Poland’s real convergence path, especially if household savings do not grow rapidly and if funds accumulated in the corporate sector are not turned into investment. Even though the government’s plans call for a fundamental change in this area (using measures includ-ing public funds), it is unclear how these plans will be implemented and whether will they will strike a chord with businesses. So far the Polish economy, with its emerg-ing “model of capitalism” and institutions supporting market development, has man-aged to grow without any significant investment in innovative projects. Now a radical change is being urged in this area, based on radical innovation—such as electric cars and drones—which is expected to become a key driver of the Polish economy. Howev-er, considering that the implementation of all these plans will be overseen by govern-ment bureaucrats, such an effect is unlikely to occur. The government plans to bring to Poland institutions associated with the “continental model of capitalism,” chief-ly that in evidence in Germany. As shown by numerous studies, such institutions are obviously conducive to an increased innovativeness of economies, but this is chiefly incremental innovation aimed at continually improving products that already exist on the market rather than at creating breakthrough inventions. It is consequently dif-ficult to judge how this institutional ambiguity will play out in Poland.
On the other hand, factors such as a growing inflow of structural funds to Poland from Brussels under the EU’s 2014–2020 budget could easily contribute to an optimis-tic scenario. Spending of EU funds is unlikely to be any lower than in 2016. As data for the previous year show, EU funds remain an important factor supporting both lo-cal-government and private-sector projects in Poland.
All these forecasts have been made with the assumption that Poland’s econom-ic and political environment will develop according to a baseline scenario in which no unexpected positive or negative trends will emerge either in Europe or worldwide during 2017. This view further assumes that internal political risk in Poland will con-tinue to run at a moderate level. Poland’s central bank will be able to pursue its neutral monetary policy—which encourages a moderate increase in credit offered by commer-

Chapter 8. Investment and Domestic Savings: Poland Compared with Other EU Countries 145
cial banks to the corporate sector—unless the latest downward trend in energy prices quickly reverses due to developments in the Ukrainian-Russian conflict, the civil war in Syria, or political turmoil in Turkey and the continuing wave of refugees, which is having a destabilizing effect on the situation in the EU.
Political turmoil ahead of elections in France and Germany as well as unpredict-able policies by U. S. President Donald Trump were likely to have a similarly negative impact on investment in Poland.
On the other hand, improved trends in the U. S. economy and another term for Angela Merkel as German chancellor following elections in that country, after the victory of centrist Emmanuel Macron in France’s presidential election, would see ex-ogenous factors having a positive effect on GDP and investment growth in Poland. If, additionally, the economic and political situation in Ukraine, Syria and above all in Russia, does not deteriorate dramatically, corporate-sector and household senti-ment might improve quickly. This would provide a major impetus for faster econom-ic growth in Poland above the baseline-scenario target. However, some unexpected negative events affecting the condition of the Polish economy, as well as the EU and the global economy as a whole, seem to be far more probable today than positive de-velopments.
References
Eurostat, (2017), www.ec.europa.eu/eurostat/.GUS, (2015), Wskaźniki Zrównoważonego Rozwoju Polski 2015, Katowice.GUS, (2017), Biuletyn Statystyczny Nr 1, February, Warszawa.MR, (2017), Ministerstwo Rozwoju, www.mr.gov.pl.NBP, (2017), Sytuacja finansowa sektora gospodarstw domowych w III kw. 2016 r., No. 1/2017,
January, Warszawa.NBP, (2017), Narodowy Bank Polski, www.nbp.pl PAIH, (2017), Polska Agencja Inwestycji
i Handlu, www.paih.gov.pl.


Chapter 9
Changes in Human Resources in Poland and Migration Trends from 2010 to 2016
Adam Karbowski
The aim of this chapter is to assess changes in human resources in Poland as a factor of economic competitiveness from 2010 to 2016.
Human resources constitute an important factor of the international competitive-ness of economies (see e.g. Stroh and Caligiuri, 1998; Williamsz, 2006; and Carayan-nis and Grigoroudis, 2014). The productivity of human resources and an economy’s endowment with human resources translate directly into its ability to innovate and attract foreign direct investment. The analysis below focuses on the relationship be-tween the state of human resources in Poland from 2010 to 2016 and the international competitiveness of the Polish economy in that period. Compared with previous studies in the Poland: Competitiveness Report series produced every year by the World Econ-omy Research Institute of the Warsaw School of Economics (SGH), this year’s report pays more attention to migration trends that affected human resources in Poland from 2010 to 2016. The analysis conducted in this chapter covers the most important aspects of changes in human resources in the Polish economy, such as demographic trends, changes in employment and the level of unemployment, growth in wages and salaries, and labor productivity. The main focus is on describing the latest migration trends with an impact on human resources in Poland.
Demographics
An important feature of Poland’s present demographic situation is a decline in real terms in the country’s population that began in 2012. At the end of 2015, Poland’s population was 38.44 million, down by 47,000 from a year earlier and by 59,000 from two years earlier. This decline follows an increase in the population in the 2008–2011 period. The rate of real decline in the population was –0.04% in 2014 and –0.05% in mid-2015, which means four and five fewer people per 10,000 residents respectively.

Adam Karbowski148
It was the sixth year in a row with a negative balance of net migration abroad for per-manent residence. In addition, temporary emigration from Poland increased. It is es-timated that at the end of 2015 the number of Polish nationals residing temporarily abroad was approximately 2,397,000, i.e. 77,000 (3.3%) more than the year before. In 2015, around 2,098,000 Polish people resided in Europe, the vast majority of whom—about 1,983,000—were residing in EU member states. This number increased by 82,000 over the previous year. As regards EU countries, the most Polish people were still re-siding in Britain (720,000), Germany (655,000), the Netherlands (112,000), Ireland (111,000), and Italy (94,000), according to data by Poland’s Central Statistical Office (GUS). In 2015, a considerable increase in the number of Poles residing in Germa-ny was recorded (an increase by 41,000, or roughly 7%, compared with the previous year) as well as in Britain (up by 35,000, or 5%, over the previous year). As regards EU countries, an increased number of Poles was also recorded in Belgium, the Neth-erlands, Sweden, Austria, Denmark, and France last year. In total, at the end of 2015, around 2.4 million Poles were temporarily residing abroad, up from 2.32 million the previous year, 2.2 million two years before, and 2.27 million in 2007. In 2015, Britain hosted the largest number of emigrants from Poland (720,000), followed by Germa-ny (655,000), the Netherlands (112,000), and Ireland (111,000).
A decreased number of emigrants from Poland compared with the previous year was recorded in Spain (a decrease by 6.3% compared with 2014) and Greece (down by 11%). The drop was probably due to relatively high unemployment rates in these countries. In December 2015, the unemployment rate in Spain was 20.8% and in Greece it was 24.2%. The number of emigrants from Poland to Ireland continued to decrease in 2015 (falling by around 1.8%). Of note was a continuing increase in the number of emigrants from Poland who reside temporarily in Norway. That number has been in-creasing every year since 2006.
The data in Table 9.1 should be treated as approximate values (based on an In-formation Note issued by GUS; 2016). This estimate is complicated due to different migration flow recording systems used in individual countries and also because of dif-ferent availability of data on migration. Data from accepting countries, data present-ing the number of Poles or people born in Poland also include those who emigrated from Poland permanently and are not included in the estimate presented in Table 9.1. Moreover, it should be remembered that when preparing migration statistics individ-ual countries often take into consideration different periods of stay as a criterion for defining a person as an immigrant (a criterion of one year is often adopted, which automatically leaves out short-term migrants).
The fact that a large group of Poles reside abroad is a considerable demographic challenge for the Polish economy. It leads to a significant decrease in the supply of

Chapter 9. Changes in Human Resources in Poland and Migration Trends from 2010 to 2016 149
labor in the economy, among other negative implications. This process does not seem transitory because emigrants from Poland usually find employment abroad (although often far below their qualifications), and then they acquire the desired financial status through professional development. For the Polish economy, this in fact means losing a part of the professional potential forged through education at schools and public universities. As noted by Mokrogulski (2015, 160), the outflow of working-age citizens to other countries will have negative economic consequences for Poland in the long term. Emigrants contribute to the GDP growth of other countries although many of them obtained an education in Poland, often at the cost of Polish taxpayers.
Table 9.1. Estimated emigration from Poland for temporary residence in the 2004–2015 period (the number of people residing abroad at the end of the year)
Country of residence
Number of emigrants in thousands
2004 2005 2006 2007 2008 2009 2010 2011 2012 2013 2014 2015
Total
EU (27 countries in total)AustriaBelgiumCyprusCzech Rep.DenmarkFinlandFranceGreeceNetherlandsSpainIrelandGermanyPortugalSwedenGreat BritainItalyNorway
1,000
750
1513
n.a.n.a.n.a.0.43013232615
3850.511
15059
n.a.
1,450
1,170
2521
n.a.n.a.n.a.0.74417433776
4300.617
34070
n.a.
1,950
1,550
3428
n.a.n.a.n.a.
349205544
120450
125
58085
n.a.
2,270
1,860
3931
48
174
55209880
200490
127
6908736
2,210
1,820
4033
41019
45620
10883
180490
129
6508838
2,100
1,690
3634
39
203
60169884
140465
131
5958845
2,000
1,607
2945
37
193
60169248
133440
133
5809250
2,060
1,670
2547
37
212
62159540
120470
136
6259456
2,130
1,720
2848
28
232
63149737
118500
138
6379765
2,196
1,789
3149
18
253
6312
10334
115560
140
6429671
2,320
1,901
3449
19
283
639
10932
113614
143
6859679
2,397
1,983
3652
19
303
648
11230
111655
146
7209484
Source: Informacja o rozmiarach i kierunkach czasowej emigracji z Polski w latach 2004–2015, GUS, 2016.
Legend: n.a. – data not available.
Immigration is another factor that substantially influences the Polish economy. Data by Poland’s Office for Foreigners show that 211,869 foreign nationals had the right of residence in Poland as of Jan. 1, 2016. The three most numerous groups with such a right were citizens of Ukraine (nearly 66,000), citizens of Germany (more than 22,000), and citizens of Belarus (more than 11,000). Nearly 48,000 of the total number of 211,869 foreign nationals were staying in Poland under a permanent resi-dence permit. In this category most people came from Ukraine (20,300). Ukrainians

Adam Karbowski150
Tabl
e 9.
2. T
he n
umbe
r of
peo
ple
resi
ding
in P
olan
d w
ith
rega
rd to
thei
r re
side
nce
enti
tlem
ent (
as o
f Jan
. 1, 2
016)
Permanent residence
Long-term residence of the
EU resident
Temporary residence
Right of residence of the
EU citizen
Right of permanent
residence of the EU citizen
Right of residence of
the EU citizen’s family member
Right of permanent residence of
the EU citizen’s family member
Asylum
Refugee status
Subsidiary protection
Humanitarian stay
Tolerated stay
In total
47,9
899,
469
77,6
2363
,460
7,09
859
684
11,
359
2,05
81,
599
533
211,
869
Sour
ce: O
ffice
for F
orei
gner
s.
Tabl
e 9.
3. T
he n
umbe
r of
peo
ple
resi
ding
in P
olan
d w
ith
rega
rd to
thei
r ho
me
coun
try
and
resi
denc
e en
titl
emen
t (as
of J
an. 1
, 201
6)
Home country
Permanent residence
Long-term residence of the
EU resident
Temporary residence
Right of residence of the
EU citizen
Right of permanent
residence of the EU citizen
Right of residence of
the EU citizen’s family member
Right of permanent residence of
the EU citizen’s family member
Asylum
Refugee status
Subsidiary protection
Humanitarian stay
Tolerated stay
In total
Ukr
aine
20,2
522,
796
42,4
51-
-10
223
-2
353
202
65,8
66
Ger
man
y55
1-
-19
,670
1,78
9-
--
--
--
22,0
10
Bela
rus
7,99
152
32,
439
--
2517
113
5-
392
11,1
72
Russ
ia3,
539
476
2,85
0-
-60
15-
509
1,78
573
53
9,97
2
Viet
nam
2,36
81,
894
4,51
7-
-6
--
42
9724
29,
130
Italy
204
--
5,48
473
8-
--
--
--
6,42
6
Chin
a53
363
74,
447
--
41-
-9
13
45,
675
Fran
ce19
0-
-4,
656
451
--
--
--
-5,
297
Gre
at B
rita
in19
3-
-4,
174
562
--
--
--
-4,
929
Bulg
aria
589
5-
3,87
341
5-
--
-2
--
4,88
4
Sour
ce: O
ffice
for F
orei
gner
s.
Not
e: D
ata
for t
he 1
0 la
rges
t gro
ups
of fo
reig
ners
, as
of J
an. 1
, 201
6.
(42,500) also held the largest number of temporary residence permits in Poland (around 77,600 people held such permits in total). On the other hand, Germans held the largest number of residence registration certificates, at nearly 19,700. Also, many nationals of Italy, France, Spain and Britain stay in Poland under a residence registration certificate. In total, 63,500 EU citizens hold a certificate of residence registration in Poland. More than 7,000 EU citizens have been granted the right of permanent residence in Poland.
Regarding migration, let us clarify the differences between the terms “migrant” and “refugee.” The term “migrant” refers to a person who came to another country of their own will for different reasons, the most important of which include education (willingness to study), a desire to improve their economic status, and marriage. A spe-cial group of migrants are economic migrants, who leave their home country in order to improve their living conditions as well as their social and economic status. Under Article 1 of the Geneva Convention and the New York Protocol, a “refugee” is a person who has been forced to leave their country by external conditions such as war, perse-cution on account of nationality, affiliation with a given social group, race, religious beliefs or political views. Only civilians can be classified as refugees.
Most refugees in Poland (1,359 in total) come from Russia, Syria and Belarus or have no citizenship. At around 1,800, Russians are also the largest group among 2,058 foreigners with so-called subsidiary protection. There is also a relatively large group from Iraq, Syria, Ukraine, and Somalia. Nearly 1,600 people reside in Poland under permits for humanitarian stay and 533 under “tolerated stay” permits.
A total of 43,663 work permits were issued for foreigners in Poland in 2014 (11.7% more than the previous year). More than half the permits were issued in the central Ma-zowieckie province. Most work permits for foreigners were issued in the construction sector (7,041), followed by wholesale and retail trade (6,610); housework and seasonal work (5,780); and transport and warehousing (4,291). More than 60% of permits (up from 52% the previous year) were issued to Ukrainian nationals. A significant num-ber of work permits issued in Poland belong to citizens of Vietnam (5.43%), China (4.98%) and Belarus (4.20%). In 2014, foreigners with work permits in Poland usual-ly worked as home help, sales representatives, drivers, cooks, plasterers, construction workers, home assistants, butchers/sausage makers, and welders (Wermińska, 2016).
An interesting trend in the development of human capital in the Polish economy is educational migration. The number of foreign students in Poland has grown stead-ily since 2000. The increase was particularly dynamic in 2012–2014. In the 2014–2015 academic year there were more than 46,000 students from abroad (foreign citizens) studying at Polish universities, more than double the numbers in the 2010–2011 ac-ademic year.

Chapter 9. Changes in Human Resources in Poland and Migration Trends from 2010 to 2016 151Ta
ble
9.2.
The
num
ber
of p
eopl
e re
sidi
ng in
Pol
and
wit
h re
gard
to th
eir
resi
denc
e en
titl
emen
t (as
of J
an. 1
, 201
6)
Permanent residence
Long-term residence of the
EU resident
Temporary residence
Right of residence of the
EU citizen
Right of permanent
residence of the EU citizen
Right of residence of
the EU citizen’s family member
Right of permanent residence of
the EU citizen’s family member
Asylum
Refugee status
Subsidiary protection
Humanitarian stay
Tolerated stay
In total
47,9
899,
469
77,6
2363
,460
7,09
859
684
11,
359
2,05
81,
599
533
211,
869
Sour
ce: O
ffice
for F
orei
gner
s.
Tabl
e 9.
3. T
he n
umbe
r of
peo
ple
resi
ding
in P
olan
d w
ith
rega
rd to
thei
r ho
me
coun
try
and
resi
denc
e en
titl
emen
t (as
of J
an. 1
, 201
6)
Home country
Permanent residence
Long-term residence of the
EU resident
Temporary residence
Right of residence of the
EU citizen
Right of permanent
residence of the EU citizen
Right of residence of
the EU citizen’s family member
Right of permanent residence of
the EU citizen’s family member
Asylum
Refugee status
Subsidiary protection
Humanitarian stay
Tolerated stay
In total
Ukr
aine
20,2
522,
796
42,4
51-
-10
223
-2
353
202
65,8
66
Ger
man
y55
1-
-19
,670
1,78
9-
--
--
--
22,0
10
Bela
rus
7,99
152
32,
439
--
2517
113
5-
392
11,1
72
Russ
ia3,
539
476
2,85
0-
-60
15-
509
1,78
573
53
9,97
2
Viet
nam
2,36
81,
894
4,51
7-
-6
--
42
9724
29,
130
Italy
204
--
5,48
473
8-
--
--
--
6,42
6
Chin
a53
363
74,
447
--
41-
-9
13
45,
675
Fran
ce19
0-
-4,
656
451
--
--
--
-5,
297
Gre
at B
rita
in19
3-
-4,
174
562
--
--
--
-4,
929
Bulg
aria
589
5-
3,87
341
5-
--
-2
--
4,88
4
Sour
ce: O
ffice
for F
orei
gner
s.
Not
e: D
ata
for t
he 1
0 la
rges
t gro
ups
of fo
reig
ners
, as
of J
an. 1
, 201
6.

Adam Karbowski152
Figure 9.1. The number of foreigners studying at Polish universities, 2000–2014
6,563 7,380 7,680 8,106 8,829 10,09211,752
13,69515,862
17,000
21,47424,253
29,172
36,983
46,101
0
5,000
10,000
15,000
20,000
25,000
30,000
35,000
40,000
45,000
50,000
2000 2001 2002 2003 2004 2005 2006 2007 2008 2009 2010 2011 2012 2013 2014
Source: Sytuacja demograficzna Polski (2015).
Ukrainians form the largest group among foreign students in Poland. The sec-ond-largest group are Belarusians, followed by Norwegians and Swedes. Norwe-gians mainly study medicine at Polish medical universities. In 2014, Poland became a country of educational immigration: the number of foreigners studying in Poland exceeded the number of Poles studying abroad. This was probably due to changes introduced in 2014 to allow foreign graduates of Polish universities to remain in Po-land and seek employment. The most popular higher education fields among for-eigners studying in Poland are social sciences, economics and law (43%) as well as health and social care (19%).
Table 9.4. Home countries of educational immigrants studying in Poland; ranking per number of citizens of a given country studying in Poland (in descending order)
Place in ranking Home country of educational immigrants in Poland
1 Ukraine
2 Belarus
3 Norway
4 Sweden
5 Spain
6 Lithuania
7 USA
Source: Sytuacja demograficzna Polski (2015).

Chapter 9. Changes in Human Resources in Poland and Migration Trends from 2010 to 2016 153
Poland is still a country of net emigration, although it is steadily transforming into one of emigration and immigration (Wermińska, 2016). Even though emigration from Poland is still at a high level, migrants are beginning to come to Poland as well. Lesińska (2015) points out that foreigners constitute less than 2 percent of all those living in Poland. Moreover, migrations into Poland are usually temporary, unlike so-called settlement migration in Western Europe and the United States.
An assessment of demographic trends also requires an analysis of the popula-tion’s vital events. The 2012–2013 period witnessed the greatest natural population drop in Poland’s postwar history, primarily due to a downturn in the childbearing rate along with a steady increase in the number of deaths (Sytuacja demograficzna Polski, 2015). In 2013, the number of live births, at 369,600, was among the lowest in the postwar period, while the number of deaths, at 387,300, was among the highest. In 2014, the number of births was lower than the number of deaths by 1,300, where-as the rate of natural increase was 0.0‰, according to Poland’s Central Statistical Office (GUS). In 2015, the negative rate of natural increase was disturbingly high, at –13,000 (–0.7‰), GUS says.
The rate of natural increase has shown a distinct downward trend since 2010; in 2010 it approached +35,000, followed by +12,900 in 2011, and +1,500 in 2012. In 2013, natural increase turned negative, with a natural decrease of –17,700. The de-cline continued in the following years; in 2014 the natural decrease was –1,300, and in 2015 it was –13,000, or –0.7‰. To compare, in the early 1990 s the rate of natural increase in Poland exceeded 4‰.
This data may suggest that Poland has entered a demographic crisis similar to that in 1997–2007, although demographers say this new crisis may be much deeper and more permanent (see Sytuacja demograficzna Polski, 2015). It may be compounded by unfavorable changes in the age structure of Polish society (with a significantly lower number of children) and in the number of marriages concluded in the country (a clear downward trend).
As regards the regional distribution of the demographic crisis in Poland, the great-est rate of natural decrease is in evidence in the following provinces: Podlaskie, Lu-belskie, Łódzkie, Świętokrzyskie, Opolskie and Śląskie as well as in some areas of Dolnośląskie. A natural decrease is under way in many urban counties.
Poland has entered a phase of what is known as birth depression, in which the number of births does not guarantee a simple replacement of generations. In 2014, the fertility rate was 1.29 (up from 1.26 in 2013). In 2011–2012 the rate was 1.30, and in 2009-a record year in this respect during the last 15 years—it was 1.40. The de-clining trend in the number of births is connected with unfavorable changes, which have deepened since 2009, in women’s fertility patterns and in the age structure of

Adam Karbowski154
women of childbearing age. A lowering of the fertility of women is gradually appear-ing in more advanced age groups. Decisions to have a child are being increasingly postponed, and the average age of childbearing mothers is growing higher. The av-erage age of women having their first child had increased to 27.4 years by 2014. In 2000, it was 3.7 years lower.
The gradual decrease in fertility rates contributes to Poland’s worsening demo-graphic structure. The age structure of the Polish population changed further in the 2014–2015 period. With the working-age population at 18–59 years for women and 18–64 years for men, labor resources have been shrinking since 2010. In 2014, the working-age population shrank by approximately 192,000 from the previous year to 24,230,200. The greatest share in potential labor resources (working-age popula-tion—18–59/60 years) is observed in the western part of the country and major cit-ies and urban areas (the average for Poland was 63.4% in 2013 and 63.0% in 2014).
Poland’s population is rapidly aging, as reflected by changes in the proportion of the post-working-age population (60 years and over for women, and 65 years and over for men). The proportion of the post-working-age population increased from 14.8% in 2000 to 19.0% in 2014. There has also been a significant increase in the number of senior citizens (80 years and older) from around 860,000 in 2002 to more than 1.5 mil-lion in 2014. This is mainly due to lower mortality among the elderly. The percentage of minors (those below 18) is also decreasing. In 2014, it was 18.1%, down from 24.4% in 2000. These changes are reflected in the generation replacement process (teenag-ers coming of working age to replace those exiting the working-age population and entering post-working age).
In 2014 and 2015, Poland’s population continued to shrink in the cities and the process of de-urbanization deepened, chiefly due to processes of “urban sprawl” and suburbanization. Due to imperfect spatial planning regulations, the processes of “urban sprawl” and suburbanization led to increased social and economic problems in the 2014–2015 period, especially in terms of infrastructure. Villages near cities were in fact becoming urban areas, even though they remained villages in the administrative sense.
Labor market
The financial and economic crisis of 2008 resulted in a sudden deterioration on Poland’s labor market, a process that continued until mid-2010. From 2010 until the end of 2013, stabilization was observed in Poland in terms of employment and un-employment. From 2010 to 2013, corporate-sector employment increased by 0.7% a year on average. Slow growth was also observed in real salaries in the economy

Chapter 9. Changes in Human Resources in Poland and Migration Trends from 2010 to 2016 155
and their increases ranged from 0.1% to 2.5% a year. The year 2014 brought a rever-sal in trends from the preceding four years. Unemployment dropped significantly (by around 330,000 in 2014 alone); employment in the corporate sector started to grow (by 1.1% at the end of 2014), as did the average gross monthly wage in the corporate sector (by 3.7% a year).
In 2015, labor productivity in industry (production sold per employee) increased by 3.3%. The number of those employed in the economy increased by 2.0% in 2015 to 14,850,000. An increased number of employees was seen for a third year in a row, but in 2015 this increase was lower than in 2014, when it stood at 2.2%. Average em-ployment in the corporate sector in 2015 was 5,601,600, rising by 1.3% from the previ-ous year. In 2015, the most significant increase in employment was in the “information and communication” sector (by 7.6%) and in administration and support activities (by 4.2%). In 2015, the downward trend in employment continued in mining and quarrying (a decrease of 7.1%), construction (5.8%), hotels and restaurants (5.0%), production and supply of electricity, gas and hot water (4.4%), and facility management (1.9%).
The average gross monthly wage in the corporate sector increased by 3.5% in 2015 to PLN 4,121.41. The increase was particularly visible in professional, scientific and technical activities (by 5.6%), administration and support activities (5.3%), and construction (4.9%). The buying power of the average gross monthly wage in the corporate sector in 2015 was 4.5% higher than in the previous year. The minimum wage in 2015 was PLN 1,750, up from PLN 1,680 in 2014. In 2015, the average number of retirees and pensioners was 8,879,400, growing by 9,100, or 0.1%, from the previ-ous year. In 2015, the average gross monthly retirement and disability pension in the non-agricultural social insurance system was PLN 2,049.25, growing by 2.9% from the previous year. In 2015, the average gross monthly retirement and disability pension for farmers was PLN 1,179.52, a rise by 3.0% from the previous year.
At the end of 2015, the registered unemployment rate was 9.8%, 1.6 percentage points less than in the previous year. It was the first time the registered unemployment rate fell below 10% in years. There were 1,563,300 registered unemployed at the end of 2015, the second yearly decrease. The number of people registered in labor offices decreased by 261,800, or 14.3%, from the end of 2014. At the end of 2015, the num-ber of unemployed who had been employed previously decreased by 13.0% compared with the end of 2014, whereas the number of people unemployed to date dropped by 20.7%. This seemed to be a consequence of a much better situation for young people on the labor market, although this was accompanied by a simultaneous increase in the proportion of older people among registered unemployed. This last trend contributed to an increased proportion of those entitled to unemployment benefits (from 13.3% at the end of 2014 to 13.9% at the end of 2015).

Adam Karbowski156
Despite many beneficial developments in the Polish labor market in the last two years, regional differences in unemployment remain considerable. This is due to both uneven economic development and geography. At the end of 2015, the difference between the lowest and highest unemployment rates in Poland’s provinces was 10.1 percentage points (with Wielkopolskie province reporting 6.2% and Warmińsko-Ma-zurskie 16.3%). Regional differences at the provincial level decreased by 1 percentage point in 2015 from 2014, when they equaled 11.1 percentage points.
Invariably, one characteristic feature of Polish labor is its seasonal nature, where-by unemployment increases in the first and last few months of each year. In the spring months the number of registered unemployed decreases, mainly due to seasonal work in construction and agriculture, and also due to the start of the tourism season. The end of the year is a time when employment contracts expire and when people with subsidized employment become unemployed again. Therefore registered unemploy-ment usually increases in January and often also in February as well as in November and December.
In 2016, the labor market kept improving. The number of those employed grew dynamically, according to the Labor Force Survey (BAEL). In the first quarter of 2016, the number of employed increased by 1.1% from the previous year, according to the survey. The number of persons employed in industry grew at the fastest rate, but the increase in employment was mainly due to services. Employment increased despite a further drop in the number of people working in agriculture. The increase in the number of employed persons was chiefly attributable to hired labor and, to a lesser extent, to self-employment outside agriculture.
The labor supply in 2016 dropped despite a slight increase in labor market par-ticipation. This happened because growing labor market participation failed to bal-ance the negative demographic trends outlined in the previous part of the study. The increased labor market participation of people of pre-retirement age keeps losing its positive influence on labor market participation. In the coming quarters a steady de-crease can be expected in labor market participation.
The growth in wages in the economy in the first quarter of 2016 remained stable at around 3% year on year. The increase in wages in the corporate sector remained not much higher than in the economy as a whole, and monthly data indicates that the growth in wages in the service sector is accelerating.
The growth in unit labor costs (ULC) in the economy remains relatively slow, al-though it accelerated due to labor productivity growing slower in the first quarter of 2016. Lowered productivity was especially evident in construction, due to weaker data on investment in the economy in the first quarter of 2016.

Chapter 9. Changes in Human Resources in Poland and Migration Trends from 2010 to 2016 157
The data show slightly faster growth in wages and salaries in the first quarter of 2016 in the corporate sector, with a significant deceleration in this growth in financial services, a process accompanied by a stabilized rate of growth for salaries in the “sci-ence and technology” sector (see Table 9.5). High demand for labor has yet to translate into stronger growth in unit labor costs. It seems that enterprises manage to control the relationship between an increase in labor productivity and a real increase in wages and salaries, whereas somewhat stable growth in real wages and salaries is accom-panied by a consistent increase in labor productivity. Moreover, the deflation that began in the economy in 2014 had a negative impact on nominal growth in unit labor costs. Another indication of an ongoing stable relationship between productivity and real wages and salaries is the accumulated changes those values manifest. Since 2013 wages and salaries have been growing faster than labor productivity, although the gap between the increase in labor productivity and its coverage with increased real wages and salaries was eliminated in early 2016. If the current trends continue, they could produce an accelerated increase in unit labor costs in the near future.
Table 9.5. Growth in wages and salaries in the economy as a whole and in individual sectors (year on year)
Participation in the wage
bill2014 2015 2016
Economy 100.3% 1st q. 2nd q. 3 rd q. 4th q. 1st q. 2nd q. 3 rd q. 4th q. 1st q.
Market sector (industry, construction, market services) – enterprises with more than nine employees
Corporate sector 55.1% 4.2 4.1 3.3 3.3 4.0 3.0 3.6 3.4 3.7
Financial services 4.3% 6.4 0.5 4.8 –5.6 7.3 2.5 3.5 9.5 2.6
Science and technology 3.9% 2.8 3.5 3.6 4.7 5.9 3.7 5.2 5.4 5.2
Non-market services (including legal entities)
Education 12.2% 3.8 3.1 1.3 3.8 2.6 2.9 3.3 3.0 2.0
Administration 8.2% 2.5 3.7 3.0 3.2 3.0 1.8 2.7 2.7 2.3
Healthcare 6.0% 2.1 2.4 3.4 1.4 3.1 2.2 1.3 6.1 5.2
Other entities
Agriculture 0.8% 4.6 2.3 2.5 5.3 7.7 0.1 10.2 1.1 –0.9
Micro-entities 9.8% 10.7 6.6 13.0 13.6 12.9 8.1 0.3 –0.6 –0.6
Source: National Bank of Poland (NBP), June 2016.

Adam Karbowski158
Conclusions
Considering the results presented above, it can be assumed that Poland is current-ly undergoing a demographic crisis. Its symptoms include:
– rate of natural increase dropping since 2010 – continuing “birth depression” – fewer new marriages – challenges connected with longer lifespans among Poles – image of Poland as an emigration country – shrinking labor resources in the economy – decreasing number of children and youth – accelerated aging of the population.
The labor market has improved gradually since 2014. Registered unemployment is dropping, labor productivity in industry is increasing, and average gross monthly wages are growing in the economy. Nevertheless, despite these favorable develop-ments on the Polish labor market in the past two years, regional differences in un-employment are still substantial, and one of the labor market’s main features is that it is subject to seasonal fluctuations, reflected by a significant increase in unemploy-ment in the first and last few months of the year. The latest trends indicate that an accelerated increase in unit labor costs (ULC) should be expected in Poland in the near future. This prompts questions about the model of economic competitiveness that Poland should follow. It seems that the current model in which Poland’s com-petitive advantages are based on low labor costs as well as a qualified and available workforce has reached its limits. These limitations have been exacerbated by unfa-vorable demographic trends (shrinking labor resources attributable to natural causes and the emigration of qualified professionals). Although Poland still holds a consid-erable competitive advantage over Western European countries in labor costs, it is far behind Western Europe in terms of labor productivity. A vital task of economic poli-cy is to try to overcome the demographic crisis and create a system of incentives for relatively young and well-educated Poles to encourage them to stay in the country, start families and pursue professional development. Such a policy will not bring the desired results in the short term. Therefore—amid the negative demographic trends and qualitative changes on the Polish labor market—it should be introduced on a sus-tainable basis as soon as possible. This would help mitigate any disturbances in the economy as a whole.

Chapter 9. Changes in Human Resources in Poland and Migration Trends from 2010 to 2016 159
References
Carrayannis, E., Grigoroudis, E., (2014), Linking innovation, productivity, and competitive-ness: implications for policy and practice, The Journal of Technology Transfer, vol. 39, pp. 199–218.
GUS – Notatka informacyjna (2016), Informacja o rozmiarach i kierunkach czasowej emigracji Polaków w latach 2004–2015, GUS, Warszawa, GUS: www.stat.gov.pl.
Konwencja Genewska dotycząca statusu uchodźców (1951), Dz. U., 1991 r., No. 119, items 515 and 516.
Kwartalny raport o rynku pracy w I kw. 2016 r. (2016), Narodowy Bank Polski, Warszawa.Lesińska, M., (2015), Immigration of Ukrainians and Russians into Poland: Inflow, Integration
Trends and Policy Impacts, INTERACT Research Report 2015/06, Warszawa.Mokrogulski, M., (2015), Zmiany zasobów ludzkich w Polsce w latach 2007–2014, in: M. Weresa
(ed.) (2015), Polska. Raport o konkurencyjności 2015, Szkoła Główna Handlowa w War-szawie, Warszawa, pp. 159–176.
Rodzina.gov.pl.Rynek pracy w Polsce w 2015 roku (2016), Ministerstwo Rodziny, Pracy i Polityki Społecznej,
Warszawa.Stroh, L., (1998), Increasing global competitiveness through effective people management, Jour-
nal of World Business, vol. 33, pp. 1–16.Sytuacja demograficzna Polski. Raport 2014–2015 (2015). Rządowa Rada Ludnościowa,
Warszawa.Urząd do Spraw Cudzoziemców: http://udsc.gov.pl/statystyki.Wermińska, I., (2016), Migranci na rynku pracy w Rzeczypospolitej Polskiej, Praca dyplomowa,
Szkoła Główna Handlowa w Warszawie, Warszawa.Williamsz, T., (2006), New technology, human resources and competitiveness in developing coun-
tries: the role of technology transfer, The International Journal of Human Resource Mana-gement, vol. 7, pp. 832–845.


Chapter 10
Science, Technology and Innovation as Factors of Competitiveness of the Polish Economy
Marta Mackiewicz
Introduction
Science, technology, and innovation are key factors in the competitiveness of the economy because they contribute to productivity growth and help improve the quality of manufactured products and services.1 They make it possible to increase the scale of production, win new markets, and increase profitability. However, a competitive advantage based on low costs alone is short-lived and cannot be maintained in the long term. Nor does it make it possible to achieve a high level of wages and other incomes. A key condition for maintaining a competitive advantage is to create in-novations and bring them to market. Today highly developed countries increasingly compete on innovation in the global economy because they are “too expensive” to compete on price.
This section compares the state of science, technology, and innovation in select-ed countries and outlines the importance of research and development as well as the innovativeness of enterprises for an increased competitiveness of the Polish econo-my. We use key indicators measuring the level of innovation in order to identify the most important trends.
In discussing factors affecting the competitiveness of the economy it is neces-sary to adopt a definition of competitiveness. The term “competitiveness” is usually understood as a set of characteristics by which it is possible to maintain stable soci-oeconomic development. Competitiveness may be reflected by integrated and multi-dimensional development. It can also be manifested in various fields of rivalry where
1 The role of science, technology, and innovation in shaping the competitiveness of the Polish economy was also examined in previous editions of this report (see, for example, Polska. Raport o konkurencyjności 2006. Rola innowacji w kształtowaniu przewag konkurencyjnych; Polska. Raport o konkurencyjności 2008. Konkurencyjność sektora usług; Polska. Raport o konkurencyjności 20013. Ocena zmian konkurencyjności polskiej gospodarki w 2012 roku w wymiarze makroekonomicznym oraz regionalnym).

Marta Mackiewicz162
competitiveness is measured by an economy’s position in international league tables. This chapter refers to both of these dimensions of competitiveness, focusing on the latter, chiefly on indicators showing the state of science and innovation and the relat-ed ability of the economy to achieve a relatively high level of income.
Insufficient statistical data limits the possibility of conducting an in-depth analysis of the impact of science, technology, and innovation on international competitiveness (as measured by indicators including the size of exports). Each year data is supplied in a different arrangement, and its high level of aggregation and selectivity makes it difficult to carry out a detailed comparative analysis of R&D expenditure and export revenue. Data on R&D expenditure is available at the level of Polish Classification of Activities (PKD) sections and divisions, while data on export revenue is only available for a few selected PKD sections. In addition, data on innovation and R&D is deficient due to factors including statistical confidentiality.
The influence of science and innovation on the competitiveness of the economy in light of theory
The argument that inventions are a source of progress, and that the moderniza-tion of products is determined by their supply, was first formulated by Schumpeter (1911). In the Schumpeterian model of endogenous innovation, a rational search for profit and efforts to upgrade technology are the driving forces of economic growth. The primary reason companies undertake research and development is that new prod-ucts can lead to temporary monopoly profits. Market competition imperfections allow companies to generate profits to cover the costs of research and development (R&D). This enables them to produce better quality products that crowd out previous-gen-eration products on the market. As a result, companies are able to achieve so-called first-mover profits (Schumpeter, 1911).
Growth models explain various aspects of the impact of science, technology, and innovation on economic growth. Models related to technological change can be clas-sified into two basic categories: models based on innovation (Romer, 1990; Grossman and Helpman, 1991) and models based on continuous learning by doing, developed by Arrow (1962) and Lucas (1988). In the case of the latter, technological change is a byproduct of experience achieved in the production of goods. Innovation is then an indirect contribution to the products of other companies and thereby determines fur-ther growth. One current example is goods and—increasingly—services offered by the information and communications technology (ICT) sector. IT goods and services help in the production of goods and services in other sectors.

Chapter 10. Science, Technology and Innovation as Factors of Competitiveness 163
In the traditional Solow model, technological progress, which explains long- -term growth, is an exogenous value. This limitation has been removed in endogenous growth models focusing on the causes of progress. In growth models that assume an endogenous nature of technological progress, the process of growth and its sustain-ability is the result of the interaction of two factors: technological progress and in-vestment in physical and human capital. The development of technology is a growth factor and its product at the same time (Romer, 2000).
Using a slightly modified Solow production function, Romer explained that tech-nological change is the result of a deliberate research process aimed at developing new technology. He also demonstrated that, assuming a long-term equilibrium, prod-uct per worker increases in proportion to the growth of capital per worker and the growth of technological progress.
Knowledge depends on total cumulative investment throughout the economy. Company investment in physical capital is determined by the accumulation of knowl-edge as a by-product that spreads to all firms in the economy (knowledge spillover).
Similarly, in models developed by Barro, Sala-i-Martin, and Mankiw and based on human capital, technological progress is the result of rational investment in re-search and education. A combination of parts of the Schumpeterian model and a cap-ital accumulation model shows that competitive advantages for developed economies depend on the application of the knowledge base. Knowledge is the basis for the cre-ation of product innovation, process innovation, and services. Innovative products and services create new sales markets for themselves. In addition, thanks to this pro-cess, production becomes cheaper, which in turn leads to an increase in productivity. Knowledge, which is the basis of innovation, is created through investment in research and development, in well-qualified labor and in effective technology transfer as well as through the commercial use of new technology.
Similar views were presented by M. Porter. According to his theories, scientific and technical knowledge is the main factor of economic growth. He believes that the return on development work is generally high. Scientific inventions are a prerequisite for the acceleration of technological progress, but they are not enough; they must be properly applied in the production process. Another factor contributing to growth is strong ties between academia on the one hand, and industry and agriculture on the other (Porter, 1990).
All these theories posit that technological progress is a prerequisite for economic growth. Inventions are essential to create and maintain competitiveness, and efforts to gain an advantage based on innovation have become a necessary condition for in-ternational competitiveness. This is because, first, modern production technology can
Marta Mackiewicz164
help achieve better productivity, and, second, more modern products increase the range of consumer choices, which potentially increases their usefulness.
The new models of growth show that technological progress is an important fac-tor of economic growth and a result of rational investment in research and education. Based on these findings, we hypothesize the existence of a relationship between ex-penditure on research and innovation and the competitiveness of the economy.
The role of research and development in Poland compared with other EU countries
Empirical studies show a significant and positive impact that economic growth has both on the overall size of domestic expenditure on research and development and on business R&D expenditure (Bassanini et al., 2001; OECD, 2003; Ulku, 2004; Bouis et al., 2011).
Comparing the scale of innovative activities by Polish enterprises with the EU av-erage, it can be seen that innovation in Poland is lower than average. This is reflect-ed in the percentage of companies that incur expenditure on innovation, the average size of this expenditure per company, and the share of R&D expenditure in GDP. This last indicator is the most important measure used in the study of technological ad-vancement because it shows the intensity of R&D (in simple terms, the higher the expenditure, the greater the likelihood of producing innovation and, consequently, more modern production). It can be assumed that relatively low R&D expenditure in relation to GDP combined with a low percentage of innovative companies creates a negative synergy. Companies not only spend less on innovation, but also achieve a lower effect per unit because their relative rarity in the population limits positive knowledge spillover effects. Innovations developed on separate islands have limited potential to reinforce each other, while the larger the group of those potentially bene-fiting from new knowledge or innovation, the stronger the effect of production of new ideas they generate. This is confirmed by a number of theories, including new growth theories (Barro, Sala-i-Martin, 1995), technology factor theories (Rosenstein-Rodan, 1943) and innovation diffusion models (Mansfield, 1961).
In 2014, R&D expenditure in the EU28 countries was 2.03% of GDP on average, while in Poland it was only 0.94% of GDP. In a ranking of EU countries by the inten-sity of R&D expenditure in 2014, Poland was in 20th place, ahead of Slovakia, Greece, Malta, Bulgaria, Croatia, Latvia, Cyprus, and Romania. However, Poland’s index in-creased by 12.1% compared with the previous year and by 55.2% compared with 2010. The gap with the EU average decreased, even though the EU average also grew.

Chapter 10. Science, Technology and Innovation as Factors of Competitiveness 165
Figure 10.1. R&D expenditure in Poland and the European Union as a whole, 2005–2014
0.00
0.50
1.00
1.50
2.00
2.50
2005 2006 2007 2008 2009 2010 2011 2012 2013 2014
EU28
Poland
Source: Eurostat.
The share of private expenditure in total R&D spending is particularly important for the development of the economy because it usually guarantees faster commercial use of research results. Empirical studies show this is one of the most important in-dicators of the innovativeness of an economy (Cooke, 2005). Its significance is also reflected by the fact that the target value of this indicator is listed in strategic EU doc-uments.2 In Poland, the structure of R&D expenditure by sector is significantly dif-ferent from that in more developed countries. Also, compared with the EU average, Poland has a much higher share of government-sector expenditure and a relatively high share of universities (which generally have a small share in the structure of ex-penditure in other EU countries). This implies a relatively low share of the business sector. In 2014, the intensity of R&D measured by the ratio of business R&D expend-iture to GDP was 0.44%, up from 0.38% in 2013. Compared with other EU countries, this ratio is low, with the EU average at 1.30% in 2014. As a result, Poland was in 21st position in terms of business R&D spending. Figure 10.2 shows how this indicator im-proved significantly compared with the EU average in the last three analyzed years. This may testify to growing innovation needs and a growing awareness of the role of innovation in the competitiveness of enterprises, which bodes well for a further in-crease in expenditure.
In 2014, 37.0% of Poland’s high-tech enterprises were innovative, while 22.6% conducted their own research and development. For medium high-tech enterprises, the figures were 33.3% and 14.4% respectively (GUS, 2015b).
2 For example, the first version of the Lisbon Strategy from 2000 assumed that R&D spending would rise to 3% of GDP by 2010, and that two-thirds of these funds would come from the private sector. The EU’s current Europe 2020 growth strategy also lists the 3% of GDP target for R&D spending.

Marta Mackiewicz166
Figure 10.2. The share of business expenditure in total R&D spending in Poland and the EU as a whole, 2005–2014
0
0.2
0.4
0.6
0.8
1
1.2
1.4
2005 2006 2007 2008 2009 2010 2011 2012 2013 2014
Poland
EU28
difference
Source: Eurostat.
Table 10.1. Intensity of innovation and science in industrial enterprises by level of technology in Poland in 2014
Type of enterpriseInnovative enterprises Enterprises incurring R&D
expenditureIntensity of direct and
indirect R&D
%
High 37.0 22.6 1.38
Medium-high 33.3 14.4 0.51
Medium-low 18.3 4.1 0.14
Low 12.1 1.5 0.13
Source: Główny Urząd Statystyczny (2015), Nauka i Technika w 2014 r.
An important indicator of the effects of research and development is the number of patents per million inhabitants. Inventions and patents testify to research activi-ty and reflect the productivity of research work conducted. At the same time, they can be seen as a source of some Schumpeterian temporary monopoly profits, which provides motivation for further research. Empirical studies have shown that patent applications filed by exporters on their export markets were the most important fac-tor leading to the growth of exports in OECD countries in the 1990 s (Madsen, 2008).
Although patenting activity in Poland is unimpressive compared with the EU av-erage, it visibly improved from 2004, as illustrated in the chart below.
It should also be noted that, while in terms of the total number of patents per mil-lion inhabitants, Poland is in a distant 19th place among the 28 EU countries, it fares much better in terms of the number of patents submitted in high- and medium-tech

Chapter 10. Science, Technology and Innovation as Factors of Competitiveness 167
sectors. This testifies to the technological sophistication of the products and reflects the structure of expenditure shown in Table 10.1, confirming the effectiveness of re-search work carried out in high-tech and medium-high enterprises.
Figure 10.3. The number of patents submitted to the European Patent Office per million inhabitants in 2004 and 2014
0 20 40 60 80 100 120
2004
2014
EU28
Poland
Source: Eurostat.
Figure 10.4. Number of patents submitted to the European Patent Office in high-tech sectors in 2012
0
500
1,000
1,500
2,000
2,500
3,000
3,500
Ger
man
yFr
ance
Uni
ted
King
dom
Swed
enN
ethe
rlan
dsFi
nlan
dIta
lyBe
lgiu
mSp
ain
Den
mar
kAu
stri
aIr
elan
dPo
land
Hun
gary
Czec
h Re
publ
icG
reec
eLi
thua
nia
Port
ugal
Rom
ania
Slov
enia
Slov
akia
Latv
iaLu
xem
bour
gEs
toni
aBu
lgar
iaCy
prus
Croa
tia
Source: Eurostat.
In 2015, Poland was ranked 18th among EU countries in terms of the proportion of those employed in science and technology in total employment. This indicator (understood in the broad sense and covering not only those employed in science and technology, but also people with a higher education) was 41.6% in 2015, with the EU average at 45.2%. Poland fares slightly worse in terms of the number of researchers per 1,000 employees, although this indicator has increased during the last decade. Ac-cording to the Central Statistical Office (GUS), in 2014, there were 6.6 R&D workers

Marta Mackiewicz168
(in terms of full-time jobs) per 1,000 people employed. In 2013, this indicator was less than half the EU average of 12.6 (GUS, 2015b).
The importance of research and development in Poland compared with other Eu-ropean Union countries as well as OECD countries is illustrated in Figure 10.5.
Figure 10.5. Comparison of Poland’s relative strengths and weaknesses in science and innovation
020406080
100120140160
Public R&D expenditures(per GDP)
Publications in the top-quartile journals (per GDP)
Business R&D expenditure(per GDP)
Triadic patent families(per GDP)
Trademarks (per GDP)
International co-patenting(PCT patent applications)(%)
Doctoral graduation ratein science and engineering
S&T occupations in totalemployment (%)
Poland EU27
OECD sample median Top five OECD value
Source: OECD, data collected on Sept. 29, 2016 from OECD statistics.
Business innovation and competitiveness
Competitiveness can be understood as the ability of economies to achieve a rela-tively high level of income and employment under international competition. In this context, it is an ability to produce and offer goods and services with such technical and operational parameters, prices, quality and terms of sale that they will find buy-ers on both the domestic and foreign markets.
This ability is reflected by revenue from the sale of new or significantly improved goods and services. The graphs below show the relationship between the share of R&D expenditure in total expenditure on innovation and the share of revenue from the sale of new products (Figure 10.6) or new services (Figure 10.7) in sales revenue by PKD section.

Chapter 10. Science, Technology and Innovation as Factors of Competitiveness 169
Figure 10.6. The share of R&D expenditure in total expenditure on innovation and its relation to revenue from the sale of new or significantly improved products in 2012–2014
y = 0,2315x + 4,8226R2 = 0,3097
0
5
10
15
20
25
30
0 10 20 30 40 50 60
Shar
e of
rev
enue
from
sal
e of
new
or
sign
ifica
ntly
impr
oved
pro
duct
s in
tota
l sal
es r
even
ue, %
Share of R&D in total expenditure on innovation, %
Source: Own study based on GUS data.
According to GUS data, in 2014 Poland’s industrial enterprises spent a total of PLN 24.6 billion on innovative activities. The purchase of fixed assets, mostly machinery and equipment, accounted for 75.3% of their total innovation expenditure. Innova-tion stemming from research and development claimed 18.5% of the funds (GUS, 2015b). Production of basic pharmaceutical substances and medicines was the PKD section with the highest share of R&D expenditure in total spending on innovation, while the manufacture of “other transport equipment” was the PKD section with the highest share of revenue from the sale of new or significantly improved products.
As seen in Figures 10.6 and 10.7, there is a statistical correlation between the share of R&D expenditure in total expenditure on innovation and sales revenues, which confirms the positive impact of science and technology on competitiveness. The ex-istence of a positive statistically significant relationship suggests that from the point of view of innovation, the scale of internal spending on innovation is important in do-mestic companies. In the case of sectors where innovation largely boils down to the acquisition of innovation from external sources, for example in the form of capital

Marta Mackiewicz170
expenditure, it is less likely to produce revenue from the sale of innovative products.3 This applies to both industrial companies and those active in the service sector, al-though to a slightly lesser extent in the case of the latter.
Figure 10.7. The share of R&D expenditure in total expenditure on innovation and its relation to revenue from the sale of new or significantly improved services in 2012–2014
y = 0,1122x + 1,4914R2 = 0,5913
0
2
4
6
8
10
12
14
16
18
0 10 20 30 40 50 60 70 80 90 100
Shar
e of
rev
enue
from
sal
e of
new
or
sign
ifica
ntly
impr
oved
ser
vice
s in
tota
l sal
es r
even
ue, %
Share of R&D in total expenditure on innovation, %
Source: Own study based on GUS data.
According to GUS data, Polish service-sector enterprises spent a total of PLN 13.0 billion on innovative activities in 2014. The greatest expenditure was incurred on fixed assets, at 43.2%, followed by research and development, at 22.7% (GUS, 2015b). In what seems to be quite obvious, research and development was the PKD section with the highest share of R&D expenditure in total expenditure on innovation in the service sector, and it also reported the highest share of revenue from the sale of new or significantly improved services.
Although expenditure on the purchase of machinery and equipment helps imple-ment new solutions in production, it is not sufficient in the long term. If the Polish
3 Capital expenditure may as a rule be incurred internally, but it usually takes the form of the purchase of fixed assets.

Chapter 10. Science, Technology and Innovation as Factors of Competitiveness 171
economy is to gradually become more innovative, it is necessary to increase business R&D spending (Gradzewicz et al., 2015). While expenditure on the purchase of ma-chinery and equipment can also support processes for the production of goods other than new or significantly improved ones, expenditure on research and development is usually focused on new solutions. Therefore, its effectiveness, defined as the ratio of expenditure to the results achieved, may be higher.
Moreover, in the case of expenditure on the purchase of machinery and equipment, it is more difficult to achieve monopoly profits guaranteeing above-average returns, even on a temporary basis. In a situation where this expenditure leads to innovation only at the company or—at best—market level, such innovations can be easily imitat-ed by the competition. The results of the companies’ own R&D (which may in particu-lar result in a new machine or new equipment), meanwhile, are the property of the company and are protected as a business secret or are subject to patent protection. In both these cases, it is possible to take advantage of monopoly profits.
Figure 10.8. Changes in the share of high-tech products in total exports, 2007–2015
0.0
2.0
4.0
6.0
8.0
10.0
12.0
14.0
16.0
18.0
2007 2008 2009 2010 2011 2012 2013 2014 2015
Poland
EU28
Source: Eurostat.
A particularly important dimension of the competitiveness of enterprises is their international competitiveness. Research conducted on the basis of data from the Com-munity Innovation Survey (CIS), an international research program in EU countries, shows that there is a positive correlation between innovation and exports (Damijan et al., 2014). In turn, a model tested for 38 sectors in six countries and examining links between R&D expenditure and exports revealed positive relationships in a group of northern countries made up of Germany, the Netherlands, and the UK, and the absence of such relationships in a group of southern countries comprising France, Italy, and Spain (Guarascio et al., 2016).

Marta Mackiewicz172
A measure of innovation in foreign trade is the ratio of high-tech goods exports to the total trade of manufactured goods. The share of high-tech products in exports may be a measure of competitiveness resulting from an innovation advantage. The share of high-tech products in Polish exports is still relatively low, but shows an up-ward trend. In 2015, it stood at 8.8%, compared with the EU average of 17%.
Figure 10.9. Changes in the share of Polish high-tech products in global exports, 2008–2014
0
0.5
1
1.5
2
2.5
2008 2011 2014
%
Aviation industry
Computer, electronicand optical industryPharmaceutical industry
Source: OECD, (2016), Main Science and Technology Indicators.
The following groups of products dominated among the exports of Polish high-tech goods: electronics and telecommunications (46.4%), computers and office equipment (23.6%), and aeronautical equipment (10.9%), while exports of high-tech services were dominated by software, IT consultancy and related services. Among high-tech enter-prises, those active in the production of aircraft, spacecraft, and related machinery generated net revenues from exports that accounted for 14.9% of total revenues. For businesses active in the manufacture of computers and electronic and optical prod-ucts, exports accounted for 67.5% of total revenue, while in businesses active in the production of basic pharmaceutical substances and medicines as well as other phar-maceutical products the figure was 17.6% (GUS, 2015b). This corresponds with R&D expenditure statistics showing an increase in the intensity of these sectors’ R&D ex-penditure in recent years. It also reflects the structure of expenditure on innovation in industrial enterprises, which is dominated by the production of pharmaceuticals.4
4 Due to deficient statistical data and incomparable business sectors across which the statistics are pre-sented, it is impossible to show the correlations involved.

Chapter 10. Science, Technology and Innovation as Factors of Competitiveness 173
The high-tech industries in question saw their share of global exports increase mark-edly, as shown in the chart below.
The pharmaceutical industry is characterized by a very high ratio of R&D expend-iture to capital expenditure. The manufacture of “other transport equipment,”5 mean-while, has the highest share of revenue from the sale of new or significantly improved products in total sales revenue.
Conclusions
An increased competitiveness of companies on both the domestic and interna-tional markets requires continual improvement in products and services. This occurs through the introduction of technological innovations, which are created through research and development work undertaken by companies and through investment in human resources. R&D is often measured with expenditure incurred for this pur-pose. The analysis shows that there is a positive correlation between R&D expend-iture as a percentage of total innovation-related expenditure and revenue from the sale of new or significantly improved products. The study also shows that innovation in the form of research and development has an impact on the share of revenue from the sale of new or significantly improved products. The analysis findings thus confirm the positive impact of science and technology on competitiveness. Increased revenues from the sale of innovative products allow businesses to achieve above-average profits that can be invested in further development, both technological and that of human resources. The use of new technology forces companies to hire increasingly better qualified workers, which in turn leads to higher wages in the economy.
Although Poland still needs to bridge its significant development gap with a vast number of EU countries, it seems that these processes have been initiated in its econ-omy as indicators of R&D intensity, including the intensity of business R&D, as well as the number of patents and indicators related to human resources in research and development, have all visibly improved in recent years. The proportion of high-tech products in Poland’s exports has also grown, though it remains at a low level. The unavailability of comparable data made it impossible to check some statistically sig-nificant correlations, yet it is possible to assume that relatively high R&D expendi-ture in selected sectors (such as the aviation industry, the computer, electronic, and optical industry, and the pharmaceutical industry) contributes to the international
5 The sector includes the production of ships, boats, aircraft, and rail vehicles as well as defense-ori-ented production.

Marta Mackiewicz174
competitiveness of these sectors. This issue should be the subject of further in-depth analysis, which will require developing methods to evaluate the impact of R&D ex-penditure on the volume of exports.6 Further research could also focus on analyzing the value of high-tech goods imports and exports in relation to the total trade in man-ufactured goods.
In summary, if, as suggested by the discussed economic theories, knowledge, in-cluding scientific and technical knowledge, is the main factor of economic growth, then Poland still lacks many elements necessary to enter a path of sustainable growth. The proportion of innovative enterprises is low in comparison with other EU coun-tries, and relatively small and infrequent investment efforts by individual business-es may fail to help enterprises move to more modern sectors. Undoubtedly, however, the main indicators of the state of science, technology and innovation show that the ongoing changes are headed in the right direction and that the country’s innovation potential is constantly being raised, which promotes an increased competitiveness of the Polish economy. EU structural funds intended for supporting business innovation are clearly are a key contributing factor.
References
Barro R., Sala-i-Martin X., (1995), Technological diffusion, convergence, and growth, Working Paper No. 5151 NBER, Cambridge.
Bassanini A., Scarpetta S., Hemmings P., (2001), Economic Growth: The Role of Policies and Institutions. Panel Data. Evidence from OECD Countries, OECD Economics Department Working Papers, 283.
Cooke P., Morgan K., (1998), The Associational Economy: Firms, Regions and Innovation, Oxford: Oxford University Press.
Damijan J., Kostevc Č., Rojec M., (2014), Exporting Status and Success in Innovation: Evidence from Community Innovation Survey Micro Data for EU Countries, GRINCOH Working Paper, Paper No. 2.06, Institute for Economic Research, Ljubljana.
Guarascio, D., Pianta, M., Bogliacino, F., (2016), Export, R&D and new products. A model and a test on European industries, Journal of Evolutionary Economics, vol. 26, Issue 4, Oct. 1, 2016, pp. 869–905.
Główny Urząd Statystyczny, (2015a), Działalność innowacyjna przedsiębiorstw w latach 2012–2014, Warszawa.
6 This requires the use of data on exports based on a classification of products and services rather than a classification of economic activities, which is precisely how data on R&D expenditure is usually presented. To enable analysis, it is therefore necessary to develop a method to ensure the comparability of data based on both such classifications with a relatively high level of aggregation.

Chapter 10. Science, Technology and Innovation as Factors of Competitiveness 175
Główny Urząd Statystyczny, (2015b), Nauka i Technika w 2014 r., Warszawa.Gradzewicz M., Stążka-Gawrysiak A., Rubaszek M., Growiec, J., (2016), Potencjał innowacyjny
gospodarki: uwarunkowania, determinanty, perspektywy, Narodowy Bank Polski.Grossman G., Helpman E., (1991), Quality Ladders in the Theory of Growth, The Review of Eco-
nomic Studies, vol. 58, No. 1.European Commission, (2011), Innovation Union Competitiveness Report 2011.Madsen J. B, (2008), Innovations and manufacturing export performance in the OECD countries,
Oxford Economic Papers 60, pp. 143–167.Mansfield E., (1961), Technical Change and the Rate of Imitation, Econometrica, vol. 29, No. 4.
(Oct., 1961), pp. 741–766.OECD, (2003), The Sources of Economic Growth in OECD Countries, OECD Publishing, Paris.OECD, (2016a), Main Science and Technology Indicators, vol. 2016/1.OECD, (2016b), SDBS Structural Business Statistics, ISIC Rev. 4, database, accessed in Octo-
ber 2016.OECD, (2016c), OECD Economic Surveys: Poland 2016, OECD Publishing, Paris.Porter M. E., (1990), The Competitive Advantage of Nations, Macmillan, New York.Romer D., (1990), Endogenous Technological Change, Journal of Political Economy, 98 (5),
part 2, S71-S101.Romer D., (2000), Makroekonomia dla zaawansowanych, PWN, Warszawa.Schumpeter J., (1960), Teoria rozwoju gospodarczego, PWN, Warszawa.Ulku H., (2004), R&D, Innovation, and Economic Growth: An Empirical Analysis, IMF Working
Paper WP/04/185.


Chapter 11
Changes in Total Factor Productivity
Mariusz Próchniak
This chapter looks at total factor productivity (TFP) in Poland and 10 other EU coun-tries in Central and Eastern Europe from 2007 to 2016. The aim is to determine the role that TFP growth played in Poland’s economic growth and competitiveness in the analyzed period. This analysis of TFP will be conducted using the growth account-ing framework. Growth accounting is an empirical exercise aimed at calculating how much economic growth is caused by changes in measurable factor inputs and in the level of technology measured with the TFP growth rate.
In the 2013 edition of this report, we estimated total factor productivity in vari-ous sectors of the economy for Poland and selected other countries in Central-Eastern and Western Europe. Ten sectors were examined according to the NACE-2 classifica-tion (Próchniak, 2013). In the 2012 and 2014 editions, in addition to the basic model of growth accounting, we also estimated a model expanded to include human capital (Próchniak, 2012, 2014).
This analysis covers 11 CEE countries, referred to as the EU11 (Poland, Bulgaria, Croatia, the Czech Republic, Estonia, Hungary, Latvia, Lithuania, Romania, Slovakia, and Slovenia) during the 2007–2016 period. To assess changes in total factor produc-tivity during that period, we also present the average TFP growth rates for the follow-ing subperiods: 2007–2009, 2010–2012, 2013–2015, and 2016.
Changes in total factor productivity: theoretical outline
The beginnings of growth accounting date back to the first half of the 20th centu-ry. The idea of total factor productivity and the view that labor is not the only factor of production, and that national income and productivity measurements should also consider other factors such as capital and land, were discussed in economic literature in the 1930s (Griliches, 1996). The input-output type of indicator was first mentioned in a work by Copeland of 1937 (Griliches, 1996). In the 1940 s and 1950s, many other studies were published—to a large extent independently—that contained the results

Mariusz Próchniak178
of empirical analyses concerning TFP measurement. The first such analysis, conduct-ed by Dutch economist Jan Tinbergen, was published in 1942. In the following years, more works were published by authors who examined the relationship between output and input (see, for example, Tintner, 1944; Barton and Cooper, 1948; Johnson, 1950; Schmookler, 1952; Abramovitz, 1956; Kendrick, 1956; and Ruttan, 1956).
The first economist to formalize growth accounting was Robert Solow (Solow, 1957). Using an aggregate production function and differential calculus, he showed in what way it was possible to divide the economic growth rate into a component re-sulting from increased factor inputs and the remaining part, known as the Solow resid-ual. The Solow residual shows what part of growth cannot be attributed to individual factors. It is consequently a measure of technical change, or TFP growth.
In the following years, further works on growth accounting introduced new terms and expanded previous studies to include new aspects of empirical analysis (e.g., see Solow, 1962; Griliches, 1964; and Jorgenson and Griliches, 1967).
The decomposition of economic growth initiated by Solow is the basis of contem-porary growth accounting. The starting point for such an analysis is the aggregate production function. Its general form is as follows:
Y t( )= F A t( ),Z1
t( ),...,Zn
t( )( ) , (11.1)
where Y – production (GDP), A – technology, Z1, …, Zn – measurable factors of pro-duction. Empirical studies usually take into account two or three measurable factors of production: labor, physical capital and sometimes human capital.
In this edition of the report, we will conduct our analysis for two measurable fac-tors: labor and physical capital. Consequently, our production function (11.1) takes the following form:
Y t( )= F A t( ),L t( ),K t( )( ) . (11.2)
To decompose the economic growth rate, it is necessary to transform equation (11.2) to show the growth rate of Y. To this end, we differentiate (11.2) with regard to time, and then divide it by Y. As a result, we have:
!YY=
∂F A,L,K( )∂A
!A
Y+
∂F A,L,K( )∂L
!L
Y+
∂F A,L,K( )∂K
!K
Y. (11.3)
After multiplying the individual components on the right side of equation (11.3) by A/A, L/L and K/K respectively, we end up with:

Chapter 11. Changes in Total Factor Productivity 179
!YY=
∂F A,L,K( )∂A
A
Y
!AA+
∂F A,L,K( )∂L
L
Y
!LL+
∂F A,L,K( )∂K
K
Y
!KK
. (11.4)
Equation (11.4) shows that the GDP growth rate is a weighted average of the growth rates of three factors: technology, labor, and physical capital. The weights are the shares of individual factors in GDP, measured as a marginal factor product (at the whole economy level) multiplied by the quantity of a given factor and divid-ed by output.
The method
The research method used in this chapter is growth accounting. To calculate the rate of TFP growth in empirical research, it is necessary to introduce additional assump-tions to equation (11.4), which shows the essence of the growth accounting procedure.
First, we assume that the production function is characterized by Hicks-neutral technical change. Consequently, this function can be expressed in the following way:
F A,L,K( )= A ⋅ f L,K( ) . (11.5)
As can be seen, Hicks-neutral technical change means that variable A, which shows the level of technology, accompanies the production function, f, which makes output dependent on measurable factor inputs. Technical change equally propels both factors of production, without changing the marginal rate of technical substitution. For pro-duction function (11.5), the share of technology income in GDP, which corresponds to component (∂F/∂A)A/Y in equation (11.4), is 1. Therefore equation (11.4) can be expressed in the following form:
!YY=!AA+
∂F A,L,K( )∂L
L
Y
!LL+
∂F A,L,K( )∂K
K
Y
!KK
. (11.6)
The above equation shows that the economic growth rate is the sum of techni-cal change (TFP growth) and the average growth rate of labor and physical capital, weighted with the shares of both factors’ incomes in GDP.
It is necessary to make an additional assumption concerning the marginal prod-ucts of both factors. The marginal product of labor and capital at the whole econo-my level cannot be measured in reality. We consequently assume that all the markets

Mariusz Próchniak180
are perfectly competitive and that no externalities occur. In such a case, the marginal social product of capital ∂F/∂K is equal to the price of capital, r, while the marginal social product of labor ∂F/∂L is equal to the wage rate, w. Marking the share of cap-ital income in GDP (rK/Y) as sK, with sL denoting the share of labor income in GDP (wL/Y), equation (11.6) can be expressed in the following way:
!YY=!AA+ s
K
!KK+ s
L
!LL
. (11.7)
Let us make an additional assumption that the entire income can be attributed to one of the two factors of production: labor or physical capital, therefore: Y = wL + rK. Consequently, the shares of labor and physical capital incomes in GDP add up to 1: sK + sL = 1. Thus, equation (11.7) assumes the following form:
!YY=!AA+ s
K
!KK+ 1− s
K( ) !LL
. (11.8)
Equation (11.8)1 is the basis for a standard growth accounting procedure. From this equation, it is possible to calculate the TFP growth rate as the difference between the rate of GDP growth and the weighted average growth rate for both factors of pro-duction:
TFP growth rate ≡!AA=!YY− s
K
!KK+ 1− s
K( ) !LL
⎡
⎣⎢
⎤
⎦⎥ . (11.9)
The results of empirical research
The following time series were collected for the purposes of our analysis: (a) the growth rate of GDP, (b) the growth rate of labor, and (c) the growth rate of physical capital. The data are derived from the following sources: the International Monetary Fund (IMF, 2017), the International Labor Organization (ILO, 2017), and the World Bank (World Bank, 2017). The economic growth rate is the real annual GDP growth rate, taken from the IMF database. The growth rate for labor is the change in total em-ployment according to the ILO data (ILO, 2017). The 2016 data are for the first three quarters of the year (to avoid seasonality, the growth rate for labor in 2016 is calcu-lated by comparing the level of employment in the first three quarters of 2016 with the level of employment in the first three quarters of 2015). The amount of physical
1 This equation is in essence a form of the Cobb-Douglas production function.

Chapter 11. Changes in Total Factor Productivity 181
capital is calculated using the perpetual inventory method based on World Bank data (World Bank, 2017). This method requires a number of assumptions. We assumed a 5% depreciation rate and an initial capital/output ratio of 3. In the perpetual inventory method, the initial year should be earlier than the first year for which TFP is calculat-ed. In our analysis the perpetual inventory method starts in 2000; this is the year for which we assume a capital/output ratio of 3. Investments are measured by gross fixed capital formation. The labor and physical capital shares in income are one-half each.
In this round of research, we updated all the time series of the analyzed variables. All the steps of the analysis were recalculated. Moreover, some time series have new coverage. Thus, all the results are fully documented in the study and the analysis does not use information from previous editions of the report.
Interpretation of results: changes in total factor productivity vs. competitiveness
Table 11.1 shows the detailed breakdown of economic growth. Tables 11.2 and 11.3 sum up the data given in Table 11.1.
Over the entire period, the highest TFP growth rate was recorded in Poland, Slo-vakia, and Lithuania. In 2007–2016, total factor productivity grew at an average rate of 1.4% per annum in Poland, 1.0% in Slovakia, and 0.6% in Lithuania. In the remain-ing EU11 countries, the growth of productivity was much slower, not exceeding 0.5%, and in many countries it was negative. Romania and Bulgaria recorded TFP growth rates of 0.4% and 0.1% per annum respectively in 2007–2016, while Slovenia showed no changes in TFP during the entire 10-year period. The remaining countries noted a fall in TFP per annum on average: –0.4% in the Czech Republic and Latvia, –0.9% in Hungary, –1.0% in Estonia, and –1.5% in Croatia.
In interpreting the results for TFP changes, it is necessary to point out that the part of TFP which is due to increased labor productivity should be partly considered as a human capital contribution to economic growth. Because of the difficulties in cal-culating the stock of human capital for the group of countries studied, TFP in our ap-proach also includes the impact of human capital on economic growth.
Poland’s superior performance in terms of changes in total factor productivity compared with the other EU11 economies can undoubtedly be treated as a success. In studies conducted several years ago, the Baltic states had the best TFP growth rates. Prior to the global crisis, they showed very rapid economic growth, which was hard to explain by changes in labor and physical capital, and consequently were attributed to TFP. The position of Poland in these analyses was moderate—not as good as that of
Mariusz Próchniak182
Tabl
e 11
.1. L
abor
, phy
sica
l cap
ital
and
TFP
con
trib
utio
n to
eco
nom
ic g
row
th, 2
007–
2016
2007
2008
2009
2010
2011
2012
2013
2014
2015
2016
growth (%)
contr. (% points)
contr. (%)
growth (%)
contr. (% points)
contr. (%)
growth (%)
contr. (% points)
contr. (%)
growth (%)
contr. (% points)
contr. (%)
growth (%)
contr. (% points)
contr. (%)
growth (%)
contr. (% points)
contr. (%)
growth (%)
contr. (% points)
contr. (%)
growth (%)
contr. (% points)
contr. (%)
growth (%)
contr. (% points)
contr. (%)
growth (%)
contr. (% points)
contr. (%)
Bulgaria
L4.
62.
330
3.3
1.7
29–3
.2–1
.638
–5.5
–2.8
–500
1–3
.6–1
.8–1
13–1
.0–0
.5–2
210.
00.
01
1.6
0.8
511.
70.
929
–0.1
0.0
–1
K5.
72.
937
6.5
3.2
578.
14.
1–9
75.
02.
545
552.
81.
490
2.3
1.1
484
2.3
1.1
882.
11.
168
2.2
1.1
372.
21.
137
TFP
2.5
2.5
330.
70.
713
–6.7
–6.7
159
0.3
0.3
546
1.9
1.9
123
–0.4
–0.4
–163
0.1
0.1
11–0
.3–0
.3–1
91.
01.
034
1.9
1.9
64
GD
P7.
77.
710
05.
65.
610
0–4
.2–4
.210
00.
10.
110
01.
61.
610
00.
20.
210
01.
31.
310
01.
51.
510
03.
03.
010
03.
03.
010
0
Croatia
L9.
34.
791
2.1
1.1
52–0
.8–0
.45
–3.8
–1.9
112
–3.8
–1.9
684
–3.6
–1.8
83–2
.7–1
.312
62.
81.
4–3
831.
50.
745
0.9
0.5
24
K4.
22.
141
4.5
2.2
109
4.9
2.4
–33
3.1
1.5
–90
1.6
0.8
–292
1.4
0.7
–31
1.1
0.5
–50
1.1
0.5
–151
0.8
0.4
240.
80.
422
TFP
–1.6
–1.6
–31
–1.2
–1.2
–60
–9.4
–9.4
128
–1.3
–1.3
780.
80.
8–2
93–1
.1–1
.148
–0.3
–0.3
24–2
.3–2
.363
40.
50.
531
1.0
1.0
54
GD
P5.
25.
210
02.
12.
110
0–7
.4–7
.410
0–1
.7–1
.710
0–0
.3–0
.310
0–2
.2–2
.210
0–1
.1–1
.110
0–0
.4–0
.410
01.
61.
610
01.
91.
910
0
Czech Rep.
L1.
91.
018
1.6
0.8
30–1
.4–0
.714
–1.0
–0.5
–22
–0.2
–0.1
–60.
30.
2–2
21.
00.
5–9
90.
70.
414
1.4
0.7
151.
80.
937
K4.
22.
138
5.0
2.5
924.
82.
4–4
93.
41.
774
3.2
1.6
803.
01.
5–1
892.
61.
3–2
642.
21.
140
2.3
1.2
252.
81.
457
TFP
2.5
2.5
45–0
.6–0
.6–2
3–6
.5–6
.513
51.
11.
148
0.5
0.5
26–2
.5–2
.531
1–2
.2–2
.246
31.
21.
246
2.7
2.7
600.
10.
16
GD
P5.
55.
510
02.
72.
710
0–4
.8–4
.810
02.
32.
310
02.
02.
010
0–0
.8–0
.810
0–0
.5–0
.510
02.
72.
710
04.
54.
510
02.
52.
510
0
Estonia
L0.
90.
56
–0.3
–0.2
3–9
.5–4
.732
–4.4
–2.2
–89
6.2
3.1
412.
01.
019
1.0
0.5
310.
60.
311
2.6
1.3
120
0.8
0.4
27
K8.
04.
051
8.3
4.1
–76
5.6
2.8
–19
1.4
0.7
281.
10.
67
3.1
1.6
303.
91.
912
43.
31.
757
2.4
1.2
112
2.0
1.0
65
TFP
3.3
3.3
43–9
.4–9
.417
3–1
2.8
–12.
887
4.0
4.0
161
3.9
3.9
522.
62.
651
–0.9
–0.9
–55
0.9
0.9
32–1
.4–1
.4–1
320.
10.
18
GD
P7.
77.
710
0–5
.4–5
.410
0–1
4.7
–14.
710
02.
52.
510
07.
67.
610
05.
25.
210
01.
61.
610
02.
92.
910
01.
11.
110
01.
51.
510
0
Hungary
L–0
.7–0
.3–7
8–1
.4–0
.7–8
2–2
.6–1
.320
–0.4
–0.2
–29
0.7
0.4
211.
80.
9–5
41.
70.
946
5.3
2.7
732.
71.
345
3.3
1.6
82
K3.
01.
535
23.
11.
518
52.
91.
5–2
22.
11.
013
91.
30.
636
1.1
0.6
–33
0.9
0.4
231.
40.
719
1.9
1.0
331.
91.
048
TFP
–0.7
–0.7
–175
0.0
0.0
–2–6
.7–6
.710
3–0
.1–0
.1–1
10.
80.
843
–3.1
–3.1
186
0.6
0.6
320.
30.
38
0.7
0.7
22–0
.6–0
.6–3
0
GD
P0.
40.
410
00.
80.
810
0–6
.6–6
.610
00.
70.
710
01.
81.
810
0–1
.7–1
.710
01.
91.
910
03.
73.
710
02.
92.
910
02.
02.
010
0
Latvia
L2.
51.
313
–0.2
–0.1
3–1
3.8
–6.9
48–6
.4–3
.284
1.3
0.6
101.
60.
820
2.1
1.0
36–1
.0–0
.5–2
51.
20.
623
0.0
0.0
–1
K7.
63.
838
9.3
4.7
–130
6.9
3.5
–24
2.4
1.2
–32
0.8
0.4
72.
21.
127
3.0
1.5
522.
31.
257
2.2
1.1
392.
21.
143
TFP
4.9
4.9
49–8
.2–8
.222
7–1
0.9
–10.
976
–1.8
–1.8
485.
25.
283
2.1
2.1
530.
40.
412
1.4
1.4
681.
01.
038
1.5
1.5
58
GD
P10
.010
.010
0–3
.6–3
.610
0–1
4.3
–14.
310
0–3
.8–3
.810
06.
26.
210
04.
04.
010
02.
92.
910
02.
02.
010
02.
72.
710
02.
52.
510
0the Baltic states, but neither was it trailing the group. The extension of the time ho-rizon significantly changed the outcomes for individual countries in favor of Poland, while worsening the position of the Baltic states.
As previously mentioned, the part of TFP that results from increased labor pro-ductivity may be regarded as a human capital contribution to economic growth. Po-land’s superior performance in terms of TFP growth among EU11 countries shows that the country enjoys a good position in the analyzed group of countries in terms of human capital development.
In previous rounds of this research, published in earlier editions of this report and covering a longer time horizon before the crisis (e.g. Próchniak, 2012), the rates of TFP growth were higher on average. The global crisis had a negative impact on the TFP growth rates calculated using the residual method and as a result, many coun-tries recorded negative TFP growth rates during the entire period from 2007 to 2016. There is a visible lowering of the TFP growth rates in the wake of the global crisis when the results for the individual subperiods are discussed.
The highest variance of TFP growth rates in the analyzed period was noted in the Baltic states and Romania. The strong differences in how productivity grew in these countries resulted to a large extent from high fluctuations in GDP growth rates. The Baltic states recorded rapid economic growth in the first few years of their EU mem-bership, at times exceeding 10% per annum. These countries were also hardest hit by the implications of the global crisis because, in 2009, they noted a double-digit fall in GDP. As a result, TFP changes in the Baltics were the most differentiated among EU11 countries. The difference between the highest and the lowest TFP growth rates was 21.5 percentage points in Lithuania (ranging from –13.9% to 7.6%) and 16–17 p.p. in the two other Baltic states and Romania. In the remaining CEE countries except Poland, the spread between the TFP growth rates ranged from 13–14 p.p. in Slovenia and Slovakia to 7.5 p.p. in Hungary. Poland, which exhibited fairly regular growth in output throughout the 2007–2016 period and was the only EU country to avoid recession, recorded the smallest variations in TFP, at 4.1 percentage points. This last result is another reason to positively assess Poland’s achievements in terms of total factor productivity. Apart from the fact that Poland recorded the fastest growth of productivity in the last 10 years, it was the most stable of the whole group of Cen-tral and Eastern European countries. In Poland, the slowest growth of TFP in the examined period was recorded in 2012 (–0.3%), while the fastest growth appeared in 2007 (3.8%).

Chapter 11. Changes in Total Factor Productivity 183Ta
ble
11.1
. Lab
or, p
hysi
cal c
apit
al a
nd T
FP c
ontr
ibut
ion
to e
cono
mic
gro
wth
, 200
7–20
16
2007
2008
2009
2010
2011
2012
2013
2014
2015
2016
growth (%)
contr. (% points)
contr. (%)
growth (%)
contr. (% points)
contr. (%)
growth (%)
contr. (% points)
contr. (%)
growth (%)
contr. (% points)
contr. (%)
growth (%)
contr. (% points)
contr. (%)
growth (%)
contr. (% points)
contr. (%)
growth (%)
contr. (% points)
contr. (%)
growth (%)
contr. (% points)
contr. (%)
growth (%)
contr. (% points)
contr. (%)
growth (%)
contr. (% points)
contr. (%)
Bulgaria
L4.
62.
330
3.3
1.7
29–3
.2–1
.638
–5.5
–2.8
–500
1–3
.6–1
.8–1
13–1
.0–0
.5–2
210.
00.
01
1.6
0.8
511.
70.
929
–0.1
0.0
–1
K5.
72.
937
6.5
3.2
578.
14.
1–9
75.
02.
545
552.
81.
490
2.3
1.1
484
2.3
1.1
882.
11.
168
2.2
1.1
372.
21.
137
TFP
2.5
2.5
330.
70.
713
–6.7
–6.7
159
0.3
0.3
546
1.9
1.9
123
–0.4
–0.4
–163
0.1
0.1
11–0
.3–0
.3–1
91.
01.
034
1.9
1.9
64
GD
P7.
77.
710
05.
65.
610
0–4
.2–4
.210
00.
10.
110
01.
61.
610
00.
20.
210
01.
31.
310
01.
51.
510
03.
03.
010
03.
03.
010
0
Croatia
L9.
34.
791
2.1
1.1
52–0
.8–0
.45
–3.8
–1.9
112
–3.8
–1.9
684
–3.6
–1.8
83–2
.7–1
.312
62.
81.
4–3
831.
50.
745
0.9
0.5
24
K4.
22.
141
4.5
2.2
109
4.9
2.4
–33
3.1
1.5
–90
1.6
0.8
–292
1.4
0.7
–31
1.1
0.5
–50
1.1
0.5
–151
0.8
0.4
240.
80.
422
TFP
–1.6
–1.6
–31
–1.2
–1.2
–60
–9.4
–9.4
128
–1.3
–1.3
780.
80.
8–2
93–1
.1–1
.148
–0.3
–0.3
24–2
.3–2
.363
40.
50.
531
1.0
1.0
54
GD
P5.
25.
210
02.
12.
110
0–7
.4–7
.410
0–1
.7–1
.710
0–0
.3–0
.310
0–2
.2–2
.210
0–1
.1–1
.110
0–0
.4–0
.410
01.
61.
610
01.
91.
910
0
Czech Rep.
L1.
91.
018
1.6
0.8
30–1
.4–0
.714
–1.0
–0.5
–22
–0.2
–0.1
–60.
30.
2–2
21.
00.
5–9
90.
70.
414
1.4
0.7
151.
80.
937
K4.
22.
138
5.0
2.5
924.
82.
4–4
93.
41.
774
3.2
1.6
803.
01.
5–1
892.
61.
3–2
642.
21.
140
2.3
1.2
252.
81.
457
TFP
2.5
2.5
45–0
.6–0
.6–2
3–6
.5–6
.513
51.
11.
148
0.5
0.5
26–2
.5–2
.531
1–2
.2–2
.246
31.
21.
246
2.7
2.7
600.
10.
16
GD
P5.
55.
510
02.
72.
710
0–4
.8–4
.810
02.
32.
310
02.
02.
010
0–0
.8–0
.810
0–0
.5–0
.510
02.
72.
710
04.
54.
510
02.
52.
510
0
Estonia
L0.
90.
56
–0.3
–0.2
3–9
.5–4
.732
–4.4
–2.2
–89
6.2
3.1
412.
01.
019
1.0
0.5
310.
60.
311
2.6
1.3
120
0.8
0.4
27
K8.
04.
051
8.3
4.1
–76
5.6
2.8
–19
1.4
0.7
281.
10.
67
3.1
1.6
303.
91.
912
43.
31.
757
2.4
1.2
112
2.0
1.0
65
TFP
3.3
3.3
43–9
.4–9
.417
3–1
2.8
–12.
887
4.0
4.0
161
3.9
3.9
522.
62.
651
–0.9
–0.9
–55
0.9
0.9
32–1
.4–1
.4–1
320.
10.
18
GD
P7.
77.
710
0–5
.4–5
.410
0–1
4.7
–14.
710
02.
52.
510
07.
67.
610
05.
25.
210
01.
61.
610
02.
92.
910
01.
11.
110
01.
51.
510
0
Hungary
L–0
.7–0
.3–7
8–1
.4–0
.7–8
2–2
.6–1
.320
–0.4
–0.2
–29
0.7
0.4
211.
80.
9–5
41.
70.
946
5.3
2.7
732.
71.
345
3.3
1.6
82
K3.
01.
535
23.
11.
518
52.
91.
5–2
22.
11.
013
91.
30.
636
1.1
0.6
–33
0.9
0.4
231.
40.
719
1.9
1.0
331.
91.
048
TFP
–0.7
–0.7
–175
0.0
0.0
–2–6
.7–6
.710
3–0
.1–0
.1–1
10.
80.
843
–3.1
–3.1
186
0.6
0.6
320.
30.
38
0.7
0.7
22–0
.6–0
.6–3
0
GD
P0.
40.
410
00.
80.
810
0–6
.6–6
.610
00.
70.
710
01.
81.
810
0–1
.7–1
.710
01.
91.
910
03.
73.
710
02.
92.
910
02.
02.
010
0
Latvia
L2.
51.
313
–0.2
–0.1
3–1
3.8
–6.9
48–6
.4–3
.284
1.3
0.6
101.
60.
820
2.1
1.0
36–1
.0–0
.5–2
51.
20.
623
0.0
0.0
–1
K7.
63.
838
9.3
4.7
–130
6.9
3.5
–24
2.4
1.2
–32
0.8
0.4
72.
21.
127
3.0
1.5
522.
31.
257
2.2
1.1
392.
21.
143
TFP
4.9
4.9
49–8
.2–8
.222
7–1
0.9
–10.
976
–1.8
–1.8
485.
25.
283
2.1
2.1
530.
40.
412
1.4
1.4
681.
01.
038
1.5
1.5
58
GD
P10
.010
.010
0–3
.6–3
.610
0–1
4.3
–14.
310
0–3
.8–3
.810
06.
26.
210
04.
04.
010
02.
92.
910
02.
02.
010
02.
72.
710
02.
52.
510
0

Mariusz Próchniak18420
0720
0820
0920
1020
1120
1220
1320
1420
1520
16
growth (%)
contr. (% points)
contr. (%)
growth (%)
contr. (% points)
contr. (%)
growth (%)
contr. (% points)
contr. (%)
growth (%)
contr. (% points)
contr. (%)
growth (%)
contr. (% points)
contr. (%)
growth (%)
contr. (% points)
contr. (%)
growth (%)
contr. (% points)
contr. (%)
growth (%)
contr. (% points)
contr. (%)
growth (%)
contr. (% points)
contr. (%)
growth (%)
contr. (% points)
contr. (%)
Lithuania
L1.
60.
87
–1.7
–0.9
–33
–7.7
–3.9
26–5
.2–2
.6–1
600.
50.
24
1.8
0.9
231.
30.
719
2.0
1.0
331.
20.
638
2.2
1.1
42
K5.
42.
724
7.1
3.5
135
5.8
2.9
–20
1.3
0.6
381.
30.
610
2.4
1.2
322.
11.
130
2.6
1.3
422.
81.
486
3.3
1.7
65
TFP
7.6
7.6
680.
00.
0–2
–13.
9–1
3.9
943.
63.
622
25.
25.
286
1.7
1.7
451.
81.
851
0.7
0.7
25–0
.4–0
.4–2
3–0
.2–0
.2–7
GD
P11
.111
.110
02.
62.
610
0–1
4.8
–14.
810
01.
61.
610
06.
06.
010
03.
83.
810
03.
53.
510
03.
03.
010
01.
61.
610
02.
62.
610
0
Poland
L4.
42.
231
3.7
1.8
470.
40.
28
–2.5
–1.2
–34
0.6
0.3
60.
20.
16
–0.1
–0.1
–61.
90.
929
1.4
0.7
190.
80.
413
K2.
41.
216
3.6
1.8
454.
02.
076
3.4
1.7
463.
11.
631
3.6
1.8
115
3.1
1.6
124
2.8
1.4
433.
41.
746
3.6
1.8
57
TFP
3.8
3.8
530.
30.
38
0.4
0.4
163.
23.
287
3.2
3.2
63–0
.3–0
.3–2
1–0
.2–0
.2–1
80.
90.
929
1.3
1.3
350.
90.
929
GD
P7.
27.
210
03.
93.
910
02.
62.
610
03.
73.
710
05.
05.
010
01.
61.
610
01.
31.
310
03.
33.
310
03.
73.
710
03.
13.
110
0
Romania
L0.
70.
35
0.2
0.1
1–1
.3–0
.710
–5.7
–2.9
359
–2.1
–1.1
–101
0.9
0.5
70–0
.7–0
.3–9
0.8
0.4
13–0
.9–0
.5–1
2–1
.0–0
.5–1
0
K5.
52.
740
10.0
5.0
5911
.05.
5–7
84.
12.
1–2
593.
61.
816
93.
51.
827
33.
21.
646
2.5
1.3
432.
61.
334
3.0
1.5
30
TFP
3.8
3.8
553.
43.
440
–11.
9–1
1.9
168
0.0
0.0
00.
30.
332
–1.6
–1.6
–244
2.2
2.2
641.
31.
344
2.9
2.9
784.
04.
080
GD
P6.
96.
910
08.
58.
510
0–7
.1–7
.110
0–0
.8–0
.810
01.
11.
110
00.
60.
610
03.
53.
510
03.
03.
010
03.
83.
810
05.
05.
010
0
Slovakia
L2.
41.
211
3.2
1.6
29–2
.8–1
.425
–2.1
–1.0
–20
–0.1
0.0
–20.
60.
320
0.0
0.0
01.
50.
729
2.6
1.3
362.
91.
543
K4.
92.
422
5.2
2.6
464.
92.
4–4
42.
71.
326
3.0
1.5
533.
71.
912
32.
71.
394
2.4
1.2
482.
31.
232
3.4
1.7
49
TFP
7.2
7.2
661.
41.
425
–6.5
–6.5
119
4.8
4.8
941.
41.
449
–0.7
–0.7
–43
0.1
0.1
60.
60.
623
1.1
1.1
320.
30.
39
GD
P10
.810
.810
05.
75.
710
0–5
.5–5
.510
05.
15.
110
02.
82.
810
01.
51.
510
01.
41.
410
02.
52.
510
03.
63.
610
03.
43.
410
0
Slovenia
L2.
51.
218
1.1
0.6
17–1
.5–0
.810
–1.5
–0.8
–62
–3.1
–1.6
–239
–1.3
–0.6
24–1
.9–1
.090
1.2
0.6
200.
00.
00
–0.7
–0.3
–15
K4.
22.
130
4.9
2.5
745.
12.
6–3
32.
51.
210
11.
30.
710
30.
90.
5–1
80.
40.
2–1
70.
50.
38
0.6
0.3
120.
60.
313
TFP
3.6
3.6
520.
30.
39
–9.6
–9.6
123
0.8
0.8
611.
51.
523
6–2
.5–2
.594
–0.3
–0.3
282.
22.
272
2.0
2.0
882.
42.
410
2
GD
P6.
96.
910
03.
33.
310
0–7
.8–7
.810
01.
21.
210
00.
60.
610
0–2
.7–2
.710
0–1
.1–1
.110
03.
13.
110
02.
32.
310
02.
32.
310
0
Sour
ce: O
wn
calc
ulat
ions
.

Chapter 11. Changes in Total Factor Productivity 185
Table 11.2. TFP growth rates (%)
CountryThe whole 2007–2016 period 2007–2009 2010–2012 2013–2015
2016Mean Minimum Maximum Mean Mean Mean
Bulgaria 0.1 –6.7 2.5 –1.1 0.6 0.3 1.9
Croatia –1.5 –9.4 1.0 –4.1 –0.5 –0.7 1.0
Czech Republic –0.4 –6.5 2.7 –1.6 –0.3 0.6 0.1
Estonia –1.0 –12.8 4.0 –6.3 3.5 –0.4 0.1
Hungary –0.9 –6.7 0.8 –2.5 –0.8 0.5 –0.6
Latvia –0.4 –10.9 5.2 –4.7 1.8 0.9 1.5
Lithuania 0.6 –13.9 7.6 –2.1 3.5 0.7 –0.2
Poland 1.4 –0.3 3.8 1.5 2.0 0.7 0.9
Romania 0.4 –11.9 4.0 –1.6 –0.4 2.2 4.0
Slovakia 1.0 –6.5 7.2 0.7 1.8 0.6 0.3
Slovenia 0.0 –9.6 3.6 –1.9 –0.1 1.3 2.4
Source: Author’s calculations.
Table 11.3. TFP contribution to economic growth (%)
CountryThe whole 2007–2016 period
Mean Minimum Maximum
Bulgaria 80 –163 546
Croatia 61 –293 634
Czech Republic 112 –23 463
Estonia 42 –132 173
Hungary 18 –175 186
Latvia 71 12 227
Lithuania 56 –23 222
Poland 28 –21 87
Romania 32 –244 168
Slovakia 38 –43 119
Slovenia 86 9 236
Source: Author’s calculations.
It is worth analyzing the dynamics of total factor productivity in the individual subperiods. Before the global crisis, in 2007, nine CEE countries (excluding Croatia and Hungary) recorded a positive growth rate of TFP. It was the highest in Lithuania (7.6%), Slovakia (7.2%), Latvia (4.9%), and Poland and Romania (each 3.8%), which was due to very rapid GDP growth in these countries before the crisis.
2007
2008
2009
2010
2011
2012
2013
2014
2015
2016
growth (%)
contr. (% points)
contr. (%)
growth (%)
contr. (% points)
contr. (%)
growth (%)
contr. (% points)
contr. (%)
growth (%)
contr. (% points)
contr. (%)
growth (%)
contr. (% points)
contr. (%)
growth (%)
contr. (% points)
contr. (%)
growth (%)
contr. (% points)
contr. (%)
growth (%)
contr. (% points)
contr. (%)
growth (%)
contr. (% points)
contr. (%)
growth (%)
contr. (% points)
contr. (%)
Lithuania
L1.
60.
87
–1.7
–0.9
–33
–7.7
–3.9
26–5
.2–2
.6–1
600.
50.
24
1.8
0.9
231.
30.
719
2.0
1.0
331.
20.
638
2.2
1.1
42
K5.
42.
724
7.1
3.5
135
5.8
2.9
–20
1.3
0.6
381.
30.
610
2.4
1.2
322.
11.
130
2.6
1.3
422.
81.
486
3.3
1.7
65
TFP
7.6
7.6
680.
00.
0–2
–13.
9–1
3.9
943.
63.
622
25.
25.
286
1.7
1.7
451.
81.
851
0.7
0.7
25–0
.4–0
.4–2
3–0
.2–0
.2–7
GD
P11
.111
.110
02.
62.
610
0–1
4.8
–14.
810
01.
61.
610
06.
06.
010
03.
83.
810
03.
53.
510
03.
03.
010
01.
61.
610
02.
62.
610
0
Poland
L4.
42.
231
3.7
1.8
470.
40.
28
–2.5
–1.2
–34
0.6
0.3
60.
20.
16
–0.1
–0.1
–61.
90.
929
1.4
0.7
190.
80.
413
K2.
41.
216
3.6
1.8
454.
02.
076
3.4
1.7
463.
11.
631
3.6
1.8
115
3.1
1.6
124
2.8
1.4
433.
41.
746
3.6
1.8
57
TFP
3.8
3.8
530.
30.
38
0.4
0.4
163.
23.
287
3.2
3.2
63–0
.3–0
.3–2
1–0
.2–0
.2–1
80.
90.
929
1.3
1.3
350.
90.
929
GD
P7.
27.
210
03.
93.
910
02.
62.
610
03.
73.
710
05.
05.
010
01.
61.
610
01.
31.
310
03.
33.
310
03.
73.
710
03.
13.
110
0
Romania
L0.
70.
35
0.2
0.1
1–1
.3–0
.710
–5.7
–2.9
359
–2.1
–1.1
–101
0.9
0.5
70–0
.7–0
.3–9
0.8
0.4
13–0
.9–0
.5–1
2–1
.0–0
.5–1
0
K5.
52.
740
10.0
5.0
5911
.05.
5–7
84.
12.
1–2
593.
61.
816
93.
51.
827
33.
21.
646
2.5
1.3
432.
61.
334
3.0
1.5
30
TFP
3.8
3.8
553.
43.
440
–11.
9–1
1.9
168
0.0
0.0
00.
30.
332
–1.6
–1.6
–244
2.2
2.2
641.
31.
344
2.9
2.9
784.
04.
080
GD
P6.
96.
910
08.
58.
510
0–7
.1–7
.110
0–0
.8–0
.810
01.
11.
110
00.
60.
610
03.
53.
510
03.
03.
010
03.
83.
810
05.
05.
010
0
Slovakia
L2.
41.
211
3.2
1.6
29–2
.8–1
.425
–2.1
–1.0
–20
–0.1
0.0
–20.
60.
320
0.0
0.0
01.
50.
729
2.6
1.3
362.
91.
543
K4.
92.
422
5.2
2.6
464.
92.
4–4
42.
71.
326
3.0
1.5
533.
71.
912
32.
71.
394
2.4
1.2
482.
31.
232
3.4
1.7
49
TFP
7.2
7.2
661.
41.
425
–6.5
–6.5
119
4.8
4.8
941.
41.
449
–0.7
–0.7
–43
0.1
0.1
60.
60.
623
1.1
1.1
320.
30.
39
GD
P10
.810
.810
05.
75.
710
0–5
.5–5
.510
05.
15.
110
02.
82.
810
01.
51.
510
01.
41.
410
02.
52.
510
03.
63.
610
03.
43.
410
0
Slovenia
L2.
51.
218
1.1
0.6
17–1
.5–0
.810
–1.5
–0.8
–62
–3.1
–1.6
–239
–1.3
–0.6
24–1
.9–1
.090
1.2
0.6
200.
00.
00
–0.7
–0.3
–15
K4.
22.
130
4.9
2.5
745.
12.
6–3
32.
51.
210
11.
30.
710
30.
90.
5–1
80.
40.
2–1
70.
50.
38
0.6
0.3
120.
60.
313
TFP
3.6
3.6
520.
30.
39
–9.6
–9.6
123
0.8
0.8
611.
51.
523
6–2
.5–2
.594
–0.3
–0.3
282.
22.
272
2.0
2.0
882.
42.
410
2
GD
P6.
96.
910
03.
33.
310
0–7
.8–7
.810
01.
21.
210
00.
60.
610
0–2
.7–2
.710
0–1
.1–1
.110
03.
13.
110
02.
32.
310
02.
32.
310
0
Sour
ce: O
wn
calc
ulat
ions
.

Mariusz Próchniak186
The crisis brought significant changes in the dynamics of total factor productiv-ity, as shown by aggregate data for the 2007–2009 period. During this period all the CEE countries except Poland and Slovakia recorded negative TFP growth. The Bal-tics, which recorded the highest pre-crisis TFP growth rates, performed very poorly in terms of productivity growth during the crisis, with negative growth rates at –6.3% in Estonia, –4.7% in Latvia, and –2.1% in Lithuania. Poor results in 2007–2009 were also recorded in Croatia (–4.1%), Hungary (–2.5%), Slovenia (–1.9%), and the Czech Republic and Romania (each –1.6%). Poland and Slovakia were the only countries with positive TFP growth in 2007–2009, at 1.5% and 0.7% respectively.
In 2010–2012, all EU11 countries improved their position compared with the 2007–2009 period in terms of TFP dynamics. The Baltic states again recorded positive TFP growth rates. They stood at 3.5% in Lithuania and Estonia, and 1.8% in Latvia. Poland maintained positive TFP growth at 2.0% per annum, better than in previous years. Slovakia and Bulgaria also noted positive TFP growth rates, 1.8% and 0.6% respective-ly. Slovenia, the Czech Republic, Romania, Croatia, and Hungary displayed negative TFP growth rates in this period, ranging from –0.1% to –0.8% a year.
In 2013–2015, EU11 countries posted varied outcomes in terms of TFP dynam-ics. Some of them improved their performance in relation to 2010–2012, while oth-ers worsened their positions. The TFP growth rate in Poland in 2013–2015 was 0.7%, identical to that in Lithuania. The top three EU11 countries with the highest rates of TFP growth in the 2013–2015 period were Romania (2.2%), Slovenia (1.3%), and Lat-via (0.9%). Slovakia, the Czech Republic, and Hungary posted TFP growth rates very close to those for Poland and Lithuania (0.5%–0.6%), while Bulgaria, Estonia, and Croatia recorded –0.3%, –0.4% and –0.7% respectively.
For 2016, it is also difficult to discern any systematic trends in GDP growth compared with the 2013–2015 period. Some countries improved their performance in terms of TFP growth, while others achieved worse results. Poland recorded a TFP growth rate of 0.9% in 2016, ranking sixth in the group. The following countries achieved TFP growth rates higher than Poland’s: Romania (4.0%), Slovenia (2.4%), Bulgaria (1.9%), Latvia (1.5%), and Croatia (1.0%). Lower TFP growth rates were reported by Slovakia (0.3%), the Czech Republic and Estonia (each 0.1%), Lithuania (–0.2%), and Hungary (–0.6%).
As regards TFP contributions to economic growth, the figures for the studied pe-riod are strongly distorted by the fact that positive TFP growth during a recession means a negative contribution to economic growth. On the other hand, in the case of a strong economic slowdown with GDP growth close to 0%, a change of a few percent in total factor productivity translates into a several thousand percent TFP contribution to economic growth. Nevertheless, it is possible to determine some trends and regu-larities on the basis of the aggregated results for the whole period.
Chapter 11. Changes in Total Factor Productivity 187
As indicated by the data presented in Table 11.3, TFP contributions to economic growth in most countries (except the Czech Republic, Poland, and Hungary) ranged between 32% and 86% in 2007–2016. This confirms the important role of TFP in the economic growth of the studied countries after their EU entry. In Poland, the TFP contribution to economic growth was 28% on average in 2007–2016.
To wrap up, it is worth adding that several other Polish researchers (apart from our own research quoted earlier) have also studied the decomposition of economic growth and offered TFP estimates for Poland.2 For example, Florczak and Welfe (2000) and Welfe (2001) calculated TFP for Poland in the 1982–2000 period on the basis of a standard growth accounting approach, taking into account two factors of produc-tion: labor and physical capital (plant and equipment or total fixed assets). In their study, the elasticity of production with respect to fixed assets, or the share of physi-cal capital income in GDP, is calibrated at 0.5 or estimated based on the production function. In another study, by Welfe (2003), the researcher estimates TFP for Poland from 1986 to 2000, using different alternative values of the share of physical capi-tal income in GDP (from 0.25 to 0.7). Meanwhile, Florczak (2011) uses the Wharton method to estimate TFP values cleared of short-term demand fluctuations for Poland from 1970 to 2008, and then examines the determinants of total factor productivity. Zienkowski (2001), Rapacki (2002), Piątkowski (2004), and Ptaszyńska (2006) have also performed TFP estimations for Poland. Roszkowska (2005) and Tokarski, Rosz-kowska and Gajewski (2005) performed growth accounting for Poland’s provinces. Zielińska-Głębocka (2004) estimated TFP for 100 industries in Poland; Ciołek and Umiński (2007) calculated the TFP growth rate for domestic and foreign enterpris-es in Poland; and Doebeli and Kolasa (2005) used the index number decomposition method for growth accounting for Poland, the Czech Republic, and Hungary.
Conclusions
The results indicate that changes in TFP played a significant role in the economic growth of Poland and other EU11 countries. In Poland, the average TFP growth rate was 1.4% per annum from 2007 to 2016, the highest in the EU11 group. The global cri-sis had a negative impact on TFP growth, causing many Central and Eastern Europe-an countries to record negative TFP growth rates in the 2007–2016 period. The rate at which these countries will be returning to the path of pre-crisis economic growth will determine further changes in the dynamics of total factor productivity.
2 For reasons of space we do not report on the detailed findings of these studies.
Mariusz Próchniak188
The TFP growth in Poland should be viewed as an improvement in the competi-tiveness of the Polish economy. Greater productivity of factors of production means increased economic efficiency and a better competitive position in the international environment. The fact that Poland posted the highest TFP growth rate among EU11 countries in the 2007–2016 period shows that its competitive position—measured by the dynamics of total factor productivity—has improved the most remarkably among the new EU member states during the past 10 years.
References
Abramovitz M. (1956), Resource and Output Trends in the United States since 1870, American Economic Review, vol. 46, pp. 5–23.
Barton G. T., Cooper M. R. (1948), Relation of Agricultural Production to Inputs, Review of Eco-nomics and Statistics, vol. 30, pp. 117–126.
Ciołek D., Umiński S. (2007), Transfer technologii przez zagranicznych inwestorów, Ekonomista, No. 2, pp. 221–234.
Doebeli B., Kolasa M. (2005), Rola zmian cen dóbr handlowych we wzroście dochodu krajowego Polski, Czech i Węgier, Gospodarka Narodowa, No. 9, pp. 25–45.
Florczak W. (2011), Ekonometryczna analiza makro-uwarunkowań wzrostu gospodarczego Pol-ski, Prace i Materiały Wydziału Zarządzania Uniwersytetu Gdańskiego, No. 4/8, pp. 75–92.
Florczak W., Welfe W. (2000), Wyznaczanie potencjalnego PKB i łącznej produktywności czyn-ników produkcji, Gospodarka Narodowa, No. 11–12, pp. 40–55.
Griliches Z. (1964), Research Expenditures, Education, and the Aggregate Agricultural Produc-tion Function, American Economic Review, vol. 54, pp. 961–974.
Griliches Z. (1996), The Discovery of the Residual: A Historical Note, Journal of Economic Lit-erature, vol. 34, pp. 1324–1330.
ILO (2017), Ilostat Database, www.ilo.org/ilostat, accessed Feb. 10, 2017.IMF (2017), World Economic Outlook Database, October 2016 (updated Jan. 16, 2017), www.
imf.org, accessed Feb. 10, 2017.Johnson D. G. (1950), The Nature of the Supply Function for Agricultural Products, American
Economic Review, vol. 40, pp. 539–564.Jorgenson D. W., Griliches Z. (1967), The Explanation of Productivity Change, Review of Eco-
nomic Studies, vol. 34, pp. 249–283.Kendrick J. W. (1956), Productivity Trends: Capital and Labor, Review of Economics and Sta-
tistics, vol. 38, pp. 248–257.Piątkowski M. (2004), Wpływ technologii informacyjnych na wzrost gospodarczy i wydajność
pracy w Polsce w latach 1995–2000, Gospodarka Narodowa, No. 1–2, pp. 37–52.
Chapter 11. Changes in Total Factor Productivity 189
Próchniak M. (2012), Total Factor Productivity, in: Weresa M. A. (ed.), Poland. Competitiveness Report 2012. Focus on Education, World Economy Research Institute, Warsaw School of Economics, Warsaw, pp. 189–203.
Próchniak M. (2013), Changes in Total Factor Productivity, in: Weresa M. A. (ed.), Poland. Com-petitiveness Report 2013. National and Regional Dimensions, World Economy Research Insti-tute, Warsaw School of Economics, Warsaw, pp. 175–201.
Próchniak M. (2014), Changes in Total Factor Productivity in 2004–2013 and the Competitive-ness of the Polish Economy, in: Weresa M. A. (ed.), Poland. Competitiveness Report 2014. A Decade in the European Union, World Economy Research Institute, Warsaw School of Economics, Warsaw, pp. 192–204.
Ptaszyńska B. (2006), Wzrost gospodarczy w Polsce w latach transformacji systemowej, Wiado-mości Statystyczne, No. 2, pp. 44–53.
Rapacki R. (2002), Możliwości przyspieszenia wzrostu gospodarczego w Polsce, Ekonomista, No. 4, pp. 469–493.
Roszkowska S. (2005), Kapitał ludzki a wzrost gospodarczy w ujęciu wojewódzkim, Wiadomo-ści Statystyczne, No. 4, pp. 46–67.
Ruttan V. W. (1956), The Contribution of Technological Progress to Farm Output: 1950–75, Review of Economics and Statistics, vol. 38, pp. 61–69.
Schmookler J. (1952), The Changing Efficiency of the American Economy, 1869–1938, Review of Economics and Statistics, vol. 34, pp. 214–231.
Solow R. M. (1957), Technical Change and the Aggregate Production Function, Review of Eco-nomics and Statistics, vol. 39, pp. 312–320.
Solow R. M. (1962), Technical Progress, Capital Formation, and Economic Growth, American Economic Review, vol. 52, pp. 76–86.
Tintner G. (1944), A Note on the Derivation of Production Functions from Farm Records, Econo-metrica, vol. 12, pp. 26–34.
Tokarski T., Roszkowska S., Gajewski P. (2005), Regionalne zróżnicowanie łącznej produktyw-ności czynników produkcji w Polsce, Ekonomista, No. 2, pp. 215–244.
Welfe W. (2001), Czynniki wzrostu potencjału gospodarczego Polski, Ekonomista, No. 2, pp. 177–200.
Welfe W. (2003), Łączna produktywność czynników produkcji a postęp techniczny, Studia Eko-nomiczne, No. 1–2, pp. 99–115.
World Bank (2017), World Development Indicators Database, databank.worldbank.org, accessed Feb. 10, 2017.
Zielińska-Głębocka A. (2004), Analiza produkcyjności polskiego przemysłu. Aspekty metodyczne i empiryczne, Ekonomista, No. 3, pp. 335–358.
Zienkowski L. (2001), Wydajność pracy i kapitału w Polsce, Wiadomości Statystyczne, No. 2, pp. 36–49.


Part III
Poland’s International Cooperation, Innovation and Competitiveness


Chapter 12
The Internationalization of Poland’s National Innovation System
Marzenna Anna Weresa
Introduction
The ongoing processes of internationalization and globalization in the world econ-omy affect various aspects of how enterprises and economies operate. These process-es also apply to innovation. This chapter seeks to examine the internationalization of innovative activities from a macroeconomic perspective, i.e. from the point of view of the National Innovation System (NIS), understood as a system of linkages and mu-tual interactions among entities using knowledge accumulated in an economy and operating within a specific institutional order and participating in the creation and commercial use of new knowledge (Weresa, 2012, p. 23).
The internationalization of innovation systems refers to the development and ap-plication of new knowledge as well as the diffusion and transfer of new solutions. The main drivers of the trend are multinational companies and their integrated strategies (Cantwell, Janne 2000; Carlsson, 2006) as well as economic integration processes and the resulting development of cooperation in research and development (R&D). Such cooperation can be conducted through international research programs, including programs for the international mobility of researchers; coordination of learning sys-tems; exchange of knowledge in research and innovation; and the promotion of open access to research results.
The aim of this chapter is to compare the internationalization of Poland’s national innovation system with the internationalization of its counterparts in other EU coun-tries and to track the advancement of the internationalization of Poland’s innovation system in the 2010–2015 period. Poland’s experience will be compared with those of other EU member states, in particular its peers in Central and Eastern Europe: the Czech Republic, Hungary, and Slovakia. The analysis aims to answer the following research questions:

Marzenna Anna Weresa194
1. What is the role of external sources of funding research in Poland?2. To what extent are the achievements of Polish science used internationally and to
what extent does Poland take advantage of foreign solutions?3. How does Poland compared with other EU countries in terms of international
protection of intellectual property rights?4. What is Poland’s involvement in international cooperation in research and inno-
vation?These research questions refer to the empirical part of the study, which is preced-
ed by a brief review of research reports on the subject aimed at identifying the most important manifestations of the internationalization of national innovation systems and at determining the ways in which they are measured.
Facets of the internationalization of the National Innovation System (NIS): review of literature on the subject
Two major aspects can be distinguished in the literature on the internationaliza-tion of innovation systems. The first one emphasizes deepening globalization in in-novation (see, for example, Archibugi, J. Michie, 1997; Kaiser, Prange, 2004; Edquist, L. Hommen, 2009; Iammarino, McCann, 2013; and Alkemade et. al., 2015). The sec-ond aspect refers to interaction between individual national innovation systems (see, for example, Niosi, B. Bellon, 1996; Bartholomew, 1997; Steg 2005; Frietsch, Schuller, 2010; and Potts, 2016). This study focuses on the second aspect of research: it analyz-es interdependencies between the Polish innovation system and the NISes of other countries. The processes of internationalization above all cover entities constituting the national innovation system, i.e. domestic companies, universities and research centers as well as science and technology regulations (including innovation policy). The openness of national innovation systems depends on the intensity of ties that their individual components have with entities abroad (Niosi, Bellon, 1996). Referring to the literature on the subject, interactions between national innovation systems from different countries chiefly include various forms of international transfer and diffu-sion of innovation (Archibugi, Iammarino, 2000, Autretsch et al., 2011; Weresa, 2012; 2014). However, it is additionally worth examining one of the forms of this transfer and diffusion, namely international cooperation in research and innovation. This kind of cooperation is a more advanced process than simple transactions of the purchase and sale of licenses and patents or the international flow of financial and human re-sources. Cooperation by its very nature guarantees stronger interactions and linkag-es as part of the NIS than just the flow of goods, services, or factors of production,

Chapter 12. The Internationalization of Poland’s National Innovation System 195
and it is therefore possible to expect that it is of greater importance to the develop-ment of the NIS. Moreover, it provides for different mechanisms for shaping interna-tional cooperation in intellectual property protection, and consequently for different interdependencies in patenting activity, than in the case of international links in the development of publications or the exchange of research staff. The extent of interde-pendence between the national innovation system and its international environment also depends on factors including the country’s development, its innovative potential, and technological specialization. Small countries are usually more dependent on in-ternational flows of technological knowledge (Carlsson, 2006).
Comparative studies of national innovation systems in different countries and their dependence on the international environment show that NIS internationaliza-tion varies considerably in individual areas. While most national innovation systems are relatively open to international cooperation in research, they are usually more cautious in foreign cooperation in innovative activities and in the practical applica-tion of new technologies. This is because there is direct competition among enter-prises in the global marketplace in these areas. In addition, empirical research on relationships between national innovation systems shows that public-sector research centers and non-profit organizations are more likely to engage in research and de-velopment cooperation with foreign entities than private-sector units (Niosi, Bellon, 1996, pp. 154–155; Carlsson, 2006, p. 59).
Wrapping up this review of literature on the internationalization of national in-novation systems, it can be noted that the increasingly closer ties between them are due to the globalization of research and innovation. Globalization processes concern not only companies active on international markets, but also universities, research centers and inventors and innovators. Competition on foreign markets applies to both products and resources (including knowledge). Besides, the development of informa-tion and communication technologies (ICTs) accelerates the international movement of knowledge and facilitates access to its resources accumulated in other countries. Similar processes can be observed in universities where international research coop-eration is developing dynamically.
Methods for measuring the internationalization of national innovation systems
How should the internationalization of national innovation systems be measured? Attempts to quantify the process can be found in the work of J. Niosi and B. Bellon (1996). The traditionally used measures are the international exchange of licenses and

Marzenna Anna Weresa196
patents, the balance of foreign trade in technology, exports of high-tech goods, and the international mobility of scientists and doctoral students (Niosi, Bellon, 1996). Other measures of NIS internationalization include international cooperation in sci-entific publications, joint patents by domestic and foreign inventors, and internation-al cooperation in innovative activities (Frietsch, Schuller, 2010; Greenhalgh, Rogers, 2010; Autretsch, Heblich, Lederer, 2011; Weresa, 2012). Table 12.1 offers a summary of the various measures used to determine the level of internationalization of a na-tional innovation system.
Table 12.1. Selected measures of internationalization of national innovation systems
Key dimensions of NIS internationalization Examples of measures
International transfer and diffusion of innovation
– R&D expenditure from foreign sources relative to total R&D expenditure – R&D expenditure from foreign sources relative to domestic expenditure – R&D expenditure of transnational corporations relative to domestic business expenditure
– Foreign employees in the R&D sector relative to total R&D employment – Number of foreign doctoral students in a country as a percentage of the total number of doctoral students overall and/or by sector/technology
– Number of foreign researchers and doctoral students in a country relative to the number of domestic researchers and doctoral students working abroad (overall and by sector/technology)
– Exports of high-tech products as a percentage of total exports of a country/region/sector
– A country’s patents as a percentage of the total number of patents worldwide
– Number of domestic resident patent applications relative to the number of non-resident applications
– A country’s payments for international purchases of intellectual property rights (patents, licenses, etc.) related to receipts from this source
International cooperation in research and innovation
– Expenditure on international research cooperation relative to expenditure on domestic cooperation
– Number (percentage) of domestic entities that have received funds under foreign programs for cooperation in research/innovation activities
– Number of innovative companies that have undertaken international cooperation in innovation as a percentage of the total number of innovative companies in a country/region/sector
– Number of research projects undertaken by domestic entities in cooperation with partners abroad
– Number of cooperation agreements on the exchange of technical information, know-how and equipment (overall and by sector/technology)
– Patent applications under the Patent Cooperation Treaty (PCT) as a percentage of the total number of applications
– Number of research publications developed in cooperation with foreign partners per capita
Source: Own elaboration based on author’s previous work (cf. Weresa, 2012, pp. 254–255).
The measures of internationalization of national innovation systems that are shown in Table 12.1 do not exhaust all the possible ways of measuring this process.

Chapter 12. The Internationalization of Poland’s National Innovation System 197
On the basis of these basic gauges, it is possible to create indexes, and it is also possi-ble to observe how they change over time. The design of indicators in empirical anal-yses depends on the selection of the studied sample of countries, and their practical application is conditioned by the availability of statistical data.
The scope of this paper does not allow for an analysis of all the measures of in-ternationalization of the Polish NIS. Four key measures from each group listed in Table 12.1 are chosen to analyze the main dimensions of internationalization. The measures selected for analysis are given in the table in bold. The measures were cho-sen to represent both sides of the innovation process, i.e. R&D and innovation inputs (expenditure, human resources) and the outcomes of research work (patents, publi-cations).1 This will make it possible to compare the key elements of NIS internation-alization in Poland and other EU countries, in particular its regional peers. In the empirical part of the study, a statistical and descriptive analysis was conducted, with conclusions based on data from the following databases: Eurostat, the European In-novation Scoreboard (EIS), the World Intellectual Property Organization (WIPO), and Poland’s own Central Statistical Office (GUS). The analysis covers the 2010–2015 period, though in some cases only the year 2013 (or sometimes 2014) was analyzed due to the unavailability of statistical data for 2015.
Innovation system internationalization: Poland compared with selected other European Union countries
The internationalization of national innovation systems is reflected in the process of international transfer and diffusion of innovation. It leads to the international use of technology developed within individual NISes and to the application in a country of new solutions developed abroad. Among the catalog of gauges that make it possible to determine the advancement of these processes within the Polish NIS, the following four indicators were subjected to comparative analysis in this study:
– R&D expenditure from foreign sources relative to domestic expenditure; – Number of foreign doctoral students in a country as a percentage of the total num-
ber of doctoral students; – A country’s payments for international purchases of intellectual property rights
(patents, licenses, etc.) relative to receipts from this source; – Number of patent applications filed by domestic residents relative to the number
of non-resident applications (see Table 12.1).
1 See Weresa, 2012, for more on how innovation systems and their internationalization are measured.

Marzenna Anna Weresa198
The first measure selected for analysis shows to what extent innovations devel-oped in a country are supported from foreign sources. On average, foreign funds account for around 10% of total R&D spending in EU countries. In Poland, this per-centage is much higher; moreover, it rose during the 2010–2015 period. In 2015, for-eign sources accounted for 16.7% of R&D expenditure in Poland, 5 percentage points more than in 2010. This growing share of foreign sources in R&D funding can be re-garded as a favorable trend because foreign funds supplement insufficient domestic spending, thus enabling Polish entities to supplement their own investment in devel-oping new solutions. EU funds are the main source of foreign support for Poland’s R&D sector; in 2015 they accounted for 87% of total foreign funds, 10 p.p. more than in 2010. At the same time, the number of active research entities benefiting from EU funds doubled though their share in the total number of active research entities did not change significantly, hovering around 15% during the 2010–2015 period (GUS, 2016, pp. 68– 69). This means that the growing importance of foreign funds (mainly those coming from the EU budget) is accompanied by an increased number of R&D entities while the number of active research entities and those benefitting from EU funds in their research activities is growing at a similar rate. Therefore NIS interna-tionalization seen from this perspective involves a growing pool of funds from abroad rather than an increased percentage of active research entities benefiting from them.
Comparing Poland’s position in terms of foreign participation in R&D funding with that of other EU countries, especially its peers in Central and Eastern Europe, it should be noted that the share of foreign sources of financing in Poland is similar to those ob-served in Estonia, Hungary, and Croatia, but half of those in the Czech Republic and Slovakia (Table 12.2). Considering that R&D expenditures as a percentage of GDP in these two countries are much higher than in Poland and that both the Czech Repub-lic and Slovakia are ranked higher in innovation league tables (EIS, 2016), it can be said that they make better use than Poland of EU funds to develop their R&D sectors.
Another measure of NIS internationalization on the input side is the inflow of re-search staff from abroad. In terms of the percentage of doctoral students from non-EU countries, Poland is in last place in the EU. What’s more, the figure dropped in the 2010–2015 period from 2% to 1.3% (with the EU average at 16.6% in 2010 and 17.8% in 2015) (Table 12.3). Despite growing opportunities for cooperation and research staff mobility within the European Union, Poland’s involvement in intra-EU coopera-tion is still relatively low.2 There is a very low level of interest among non-EU countries in conducting research and development in Poland. Undoubtedly, one barrier for for-eign doctoral students to access the Polish R&D sector is language, but countries such
2 See chapter 13 on Poland’s participation in EU programs.

Chapter 12. The Internationalization of Poland’s National Innovation System 199
as Slovenia, Hungary, and Estonia encounter similar problems yet still have indicators that are three to four times as high as Poland’s (Table 12.3). Other factors include a lim-ited range of doctoral programs in English, low wages in Poland’s R&D sector, and bur-densome procedures for employing non-EU foreigners. A comparison of Poland and other EU countries in terms of how attractive their R&D sectors are to young research staff reveals another weakness of the Polish NIS: low ability to attract foreign talent.
Table 12.2. R&D expenditure from foreign sources relative to domestic expenditure in 2010–2015: Poland and other EU countries compared (%)
Country 2010 2015
Germany 3.9 n.a.
Portugal 3.2 n.a.
Denmark 7.2 6.7
Sweden n.a. n.a.
Spain 5.7 n.a.
France 7.5 n.a.
Slovenia 6.0 10.6
Italy 9.8 n.a.
EU 8.9 n.a.
Estonia 11.4 12.2
Greece 11.9 12.8
Belgium 13.3 n.a.
Croatia 9.9 14.5
Finland 6.9 14.5
Hungary 12.4 15.0
Netherlands n.a. 15.1
Austria 16.1 15.9
Poland 11.8 16.7
United Kingdom 17.6 17.6
Ireland 17.0 n.a.
Romania 11.1 19.2
Malta 12.2 21.3
Cyprus 15.0 n.a.
Luxembourg 20.6 n.a.
Czech Republic 13.9 32.5
Lithuania 19.9 34.6
Slovakia 14.7 39.4
Latvia 33.4 45.0
Bulgaria 39.6 n.a.
Source: Eurostat data, accessed March 18, 2017.

Marzenna Anna Weresa200
Table 12.3. Number of doctoral students from non-EU countries as a percentage of the total number of doctoral students: Poland compared with other EU countries
Country 2010 2015
France 34.3 33.6
United Kingdom 31.5 30.0
Belgium 19.3 25.0
Sweden 18.2 24.5
Luxembourg 20.4 23.5
Netherlands 20.9 19.3
EU 16.6 17.8
Denmark 10.4 15.2
Ireland 14.3 14.3
Portugal 10.0 13.9
Finland 5.1 12.8
Spain 17.1 12.0
Italy 6.1 10.1
Austria 10.5 9.3
Germany 11.2 7.4
Slovenia 4.7 5.7
Czech Republic 3.7 5.2
Estonia 3.0 4.4
Hungary 2.6 3.8
Croatia 2.2 3.0
Bulgaria 3.9 3.0
Latvia 0.5 2.9
Cyprus 1.8 2.2
Romania 2.1 2.1
Malta 1.4 2.1
Slovakia 1.4 1.8
Lithuania 0.6 1.4
Poland 2.0 1.3
Greece n.a. n.a.
Source: Own study based on the EIS database, 2016, accessed Nov. 28, 2016.
In addition to foreign sources of R&D funding and international mobility of scien-tific staff, NIS internationalization is reflected in the use of foreign technical know-how and payments abroad related to this. International interdependencies in this area are measured by the extent to which a country’s foreign payments for licensing and intellectual property rights are covered by revenue generated by the country from
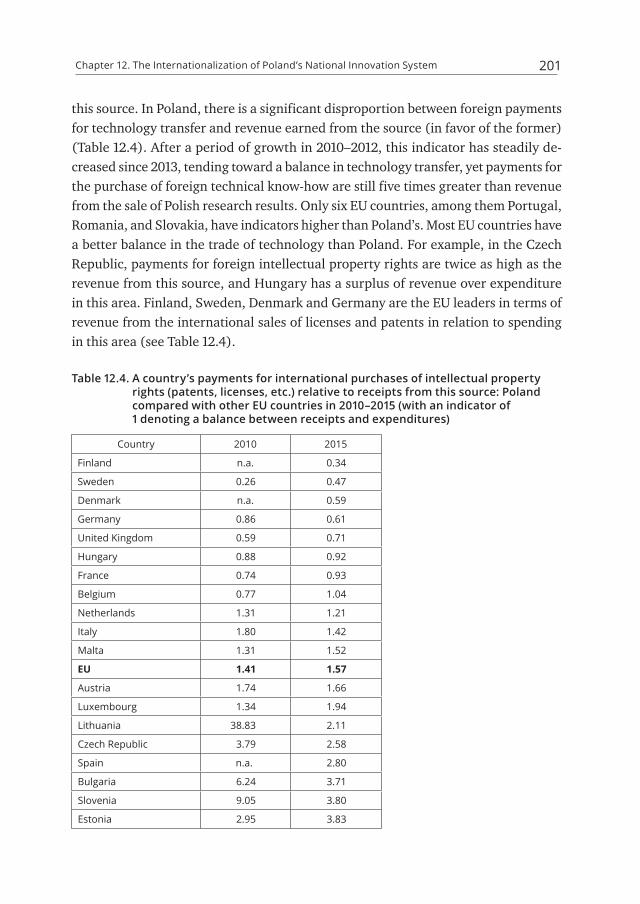
Chapter 12. The Internationalization of Poland’s National Innovation System 201
this source. In Poland, there is a significant disproportion between foreign payments for technology transfer and revenue earned from the source (in favor of the former) (Table 12.4). After a period of growth in 2010–2012, this indicator has steadily de-creased since 2013, tending toward a balance in technology transfer, yet payments for the purchase of foreign technical know-how are still five times greater than revenue from the sale of Polish research results. Only six EU countries, among them Portugal, Romania, and Slovakia, have indicators higher than Poland’s. Most EU countries have a better balance in the trade of technology than Poland. For example, in the Czech Republic, payments for foreign intellectual property rights are twice as high as the revenue from this source, and Hungary has a surplus of revenue over expenditure in this area. Finland, Sweden, Denmark and Germany are the EU leaders in terms of revenue from the international sales of licenses and patents in relation to spending in this area (see Table 12.4).
Table 12.4. A country’s payments for international purchases of intellectual property rights (patents, licenses, etc.) relative to receipts from this source: Poland compared with other EU countries in 2010–2015 (with an indicator of 1 denoting a balance between receipts and expenditures)
Country 2010 2015
Finland n.a. 0.34
Sweden 0.26 0.47
Denmark n.a. 0.59
Germany 0.86 0.61
United Kingdom 0.59 0.71
Hungary 0.88 0.92
France 0.74 0.93
Belgium 0.77 1.04
Netherlands 1.31 1.21
Italy 1.80 1.42
Malta 1.31 1.52
EU 1.41 1.57
Austria 1.74 1.66
Luxembourg 1.34 1.94
Lithuania 38.83 2.11
Czech Republic 3.79 2.58
Spain n.a. 2.80
Bulgaria 6.24 3.71
Slovenia 9.05 3.80
Estonia 2.95 3.83

Marzenna Anna Weresa202
Country 2010 2015
Latvia 2.76 5.17
Greece 9.13 5.37
Poland 9.49 5.86
Croatia 7.14 5.87
Portugal 12.85 7.86
Romania 0.96 9.08
Ireland 12.83 10.07
Slovakia 3.57 19.89
Cyprus n.a. n.a.
Source: Own calculations based on World Intellectual Property Organization (WIPO) data (www.wipo.org, accessed March 18, 2017).
A further indicator of NIS internationalization is the patenting activity of domes-tic residents in relation to patents filed by non-residents under the Patent Coopera-tion Treaty (PCT) procedure (Table 12.5). Poland ranks near the bottom of the list of EU countries in terms of this indicator, ahead of only three nations, Latvia, Greece and Portugal. There is a high disproportion between patent applications filed by res-idents and non-residents in Poland under the PCT (in 2014, there were 25 times more resident applications than non-resident ones, while on average in the EU the indica-tor was only 3.5 times higher) and it has been growing since 2010 despite a decrease in the EU on average. This means that there is not much interest among foreign in-ventors in securing patent protection in Poland. This conclusion is confirmed by the low share of patent applications by non-residents under the PCT in Poland in the total pool of non-resident applications in the EU, which ranged from a mere 0.5% to 1% in the 2010–2015 period. This indicator is similar to that achieved by Hungary, even though Hungary is a much smaller market than Poland in terms of the number of po-tential recipients of patented innovations.
Nor are Polish inventors particularly active in submitting their innovations for in-ternational patenting under the PCT procedure. A wide range of patents abroad in-directly confirms the importance of an invention to the world. In Poland, the share of applications under the international PCT procedure in the total number of such ap-plications from EU countries was fairly stable in the analyzed period at around 3%. This figure is similar to that in Spain, a country comparable to Poland in size, but sig-nificantly below those reported by innovation leaders such as Germany, France and Britain. With this figure, Poland also trails some countries with a comparable level of innovation (for example, Italy, which is classified among so-called moderate inno-vators—cf. EIS, 2016). Poland’s relatively weak position in patenting under the PCT

Chapter 12. The Internationalization of Poland’s National Innovation System 203
throughout the 2010–2015 period is one of the signs of the continually low level of internationalization of its national innovation system when it comes to the diffusion of innovation.
Table 12.5. Ratio of patent applications by residents to those by non-residents: Poland compared with other EU countries, 2010–2015
Country 2010 2015
Cyprus 1.0 n.a.
Slovenia 40.2 n.a.
Malta 1.7 n.a.
Luxembourg 3.8 n.a.
United Kingdom 2.4 n.a.
Germany 3.9 n.a.
Lithuania 18.0 n.a.
EU 4.7 n.a.
Ireland 12.4 n.a.
Sweden 6.2 n.a.
Croatia 12.2 n.a.
Belgium 4.4 n.a.
Denmark 11.5 n.a.
France 8.1 n.a.
Estonia 6.5 n.a.
Hungary 13.8 n.a.
Austria 9.7 n.a.
Netherlands 10.5 n.a.
Slovakia 4.9 n.a.
Italy 10.5 n.a.
Finland 17.0 n.a.
Romania 38.4 n.a.
Spain 16.7 n.a.
Bulgaria 14.3 n.a.
Czech Republic 7.6 n.a.
Poland 14.1 n.a.
Latvia 25.4 n.a.
Greece 45.5 n.a.
Portugal 10.8 n.a.
Source: Own calculations based on World Intellectual Property Organization (WIPO) data (www.wipo.org, accessed March 18, 2017).

Marzenna Anna Weresa204
The internationalization of a NIS can also be analyzed by looking at the country’s involvement in international cooperation in research and innovation. In line with the adopted methodology, four selected measures of NIS internationalization will be ana-lyzed, two input and two output indicators (see Table 12.2). These are:
– The percentage of domestic innovative firms that have received funds for financ-ing international cooperation under the EU’s 7th Framework Programme;
– The number of innovative enterprises that have undertaken foreign cooperation in innovation as a percentage of the total number of innovative enterprises;
– The proportion of patent applications resulting from international cooperation in the total number of domestic resident applications (%);
– The per capita number of research publications produced in cooperation with foreign partners.Financing obtained by domestic enterprises under the European Union’s 7th
Framework Programme for the implementation of international projects is one of the indicators describing the input side of the innovation process related to interna-tional cooperation. According to Eurostat data collected in the periodical Community Innovation Survey, Poland is among EU countries near the bottom of the list in terms of using the EU’s 7th Framework Programme to fund innovative activities carried out jointly with foreign partners. Only 0.8% of innovative companies use this source of funds for innovation cooperation (according to the latest CIS9 study for 2014); this percentage decreased fourfold compared with 2010 (Table 12.6). However, Poland can only be compared with some countries because the CIS data are not available for all EU economies. Nevertheless, it is worth noting that Slovenia, Estonia, and the Czech Republic achieved the best results among EU countries in Central and Eastern Europe, several times better than Poland’s. Moreover, Poland is one of a few EU coun-tries where this indicator was worse in 2014 than in 2010 (Table 12.6).
Yet another measure of foreign cooperation considered from the input side is the involvement of enterprises in innovative activities together with foreign part-ners. The percentage of innovative Polish companies undertaking this type of co-operation decreased from 23.3% in 2010 to 18.7% in 2014, ranking Poland in 20th place in the EU. Estonia and Slovakia are the EU leaders in this respect, with more than half innovative companies cooperating with partners abroad to work on new solutions (Table 12.7). Such cooperation, with both domestic and foreign entities, undoubtedly contributes to knowledge-sharing, but it also requires confidence and a great deal of caution as well as reciprocity in protecting the intellectual property of the cooperating partners. The result may be innovations, some of which are pro-tected by the partners’ joint patents.

Chapter 12. The Internationalization of Poland’s National Innovation System 205
Table 12.6. Innovative companies that received funds to finance international cooperation under the EU’s 7th Framework Programme (as a percentage of the total number of innovative companies): Poland compared with selected other EU countries
Country 2010 (CIS7) 2014 (CIS9)
Slovenia 4.2 5.3
Estonia 2.1 5.0
Belgium 2.3 4.3
Portugal 1.7 4.1
Czech Republic 5.9 4.0
Spain 1.3 4.0
Germany 3.2 3.2
Romania 1.4 3.2
Cyprus 2.3 2.7
Luxembourg 2.0 2.6
Slovakia 1.9 2.6
Hungary 2.1 2.4
Netherlands 1.0 2.4
Greece n.a. 2.4
Latvia 4.8 2.3
Sweden n.a. 2.2
Finland 1.7 2.1
France 2.1 2.0
Lithuania 3.7 1.5
Malta 0.5 1.5
Bulgaria 0.9 1.2
Italy 0.5 0.9
Poland 3.1 0.8
Croatia 0.1 0.6
Source: Own study based on Eurostat data from the Community Innovation Survey (CIS) 7 and CIS 9 questionnaires, accessed April 7, 2017.
Although Poland compares poorly with other EU countries in terms of how en-terprises cooperate with foreign partners in innovation, the results of international cooperation on inventions are relatively good when measured by the percentage of patents filed with the European Patent Office by Polish inventors jointly with foreign inventors. Poland is well above the EU average in this respect. About 15% of Polish in-novators file patent applications together with foreign partners (almost 6% of them with EU partners). The EU average is lower, at around 10%, with just over half the inventions filed with EU partners (Table 12.8). Patent cooperation with EU partners

Marzenna Anna Weresa206
is quite intense in most EU member states in Central and Eastern Europe, with Po-land ranking behind Hungary, the Czech Republic, Slovakia, Romania, and Bulgaria. Cooperation with non-EU partners provides a different picture. Among EU countries in Central and Eastern Europe, only Hungary and Bulgaria are ahead of Poland in this respect. This shows that the Polish NIS is open toward extra-EU cooperation in inno-vation activity to a greater extent than it is to intra-EU cooperation.
Table 12.7. Enterprises undertaking all kinds of innovation cooperation with foreign partners (as a percentage of the total number of innovative enterprises) in 2010 and 2014: Poland compared with other EU countries
Country 2010 2014
Estonia 38.3 57.9
Slovakia 43.2 53.0
Finland 56.2 44.7
Belgium 37.6 44.6
Slovenia 56.9 44.1
Denmark n.a. 44.1
Austria 42.4 42.5
Sweden 46.2 42.0
Cyprus 63.9 39.2
Ireland 31.2 32.2
Latvia 38.2 31.9
Luxembourg 46.0 30.4
Netherlands 21.6 30.1
Lithuania 44.8 27.6
Hungary 23.2 26.5
Czech Republic 31.4 25.7
France 31.3 25.4
Croatia 32.3 23.9
Greece n.a. 22.2
Poland 23.3 18.7
Malta 23.0 18.0
Bulgaria 20.8 15.8
Romania n.a. 15.4
Spain 7.9 15.0
Portugal 13.6 11.7
Germany 13.4 11.0
Italy 6.8 6.4
United Kingdom n.a. n.a.
Source: Own study based on Eurostat data from the Community Innovation Survey (CIS) 7 and CIS 9 questionnaires, accessed April 7, 2017.

Chapter 12. The Internationalization of Poland’s National Innovation System 207
Table 12.8. Share of patent applications filed in international cooperation in the total number of applications (%): Poland compared with other EU countries
CountryWith EU innovators With non-EU innovators Total
2010 2013 2010 2013 2010 2013
Luxembourg 44.6 30.6 11.8 14.3 56.4 44.9
Slovakia 24.6 24.0 6.6 4.6 31.2 28.6
Cyprus 8.7 21.3 n.a. 6.3 n.a. 27.6
Hungary 18.1 17.6 7.1 7.0 25.3 24.5
Romania 17.9 18.5 16.7 3.9 34.6 22.4
Bulgaria 36.7 11.6 6.4 9.2 43.0 20.8
Ireland 10.1 9.8 13.2 10.8 23.2 20.5
Czech Republic 8.4 14.6 4.2 5.7 12.6 20.2
Malta 14.3 11.0 n.a. 6.9 n.a. 17.8
Belgium 16.3 12.0 7.3 5.2 23.6 17.2
Croatia 7.6 16.4 10.0 0.5 17.6 16.9
Poland 11.7 9.3 4.8 5.9 16.5 15.2
Austria 11.1 10.0 4.6 5.0 15.7 15.0
Greece 10.6 9.4 6.2 5.2 16.8 14.5
Sweden 6.4 6.2 5.4 6.6 11.8 12.8
United Kingdom 5.7 5.4 8.6 7.2 14.3 12.7
Estonia 25.7 9.0 14.6 3.0 40.3 11.9
Denmark 8.1 6.5 3.9 4.6 12.0 11.1
Slovenia 8.9 8.4 5.3 1.8 14.2 10.2
Netherlands 6.7 5.6 3.4 4.2 10.1 9.8
EU 5.6 5.2 4.7 4.6 10.4 9.7
Portugal 17.8 6.9 6.5 2.8 24.3 9.7
France 4.9 4.4 4.9 4.6 9.8 9.0
Spain 6.2 5.6 3.8 3.3 10.0 8.9
Finland 6.2 5.6 4.2 3.1 10.4 8.7
Germany 4.1 3.9 4.1 4.0 8.2 7.9
Italy 3.6 3.5 2.3 2.7 5.9 6.2
Lithuania 2.5 1.8 3.1 1.8 5.7 3.7
Source: Own study based on Eurostat data, accessed March 18, 2017.
The Polish NIS shows a different level of openness when measured by coopera-tion in the development of scientific publications. Poland has no significant achieve-ments in this field; it is near the end of the ranking list of EU countries, and the per capita number of publications developed in cooperation with foreign authors was 252 in 2015, just over half the EU average of 459 (Table 12.9).

Marzenna Anna Weresa208
Table 12.9. Number of research publications developed in cooperation with foreign partners per capita
Country 2010 2015
Denmark 1,290.8 2,066.7
Sweden 1,258.3 1,774.1
Luxembourg 862.4 1,598.7
Finland 1,027.2 1,485.6
Netherlands 1,044.4 1,449.6
Belgium 988.8 1,351.5
Austria 890.2 1,225.5
Ireland 807.1 1,080.2
Slovenia 714.2 1,068.9
United Kingdom 756.3 1,059.4
Cyprus 636.0 998.8
Estonia 552.8 907.7
Portugal 468.9 794.8
Germany 553.2 729.1
Czech Republic 427.6 660.9
France 517.6 651.2
Spain 434.6 645.2
Italy 391.5 551.6
Greece 396.2 549.1
Malta 205.3 517.1
EU 335.4 459.2
Hungary 299.6 413.8
Croatia 292.8 409.7
Slovakia 293.5 383.1
Lithuania 185.9 355.3
Poland 173.6 251.2
Latvia 106.6 221.0
Bulgaria 157.6 173.4
Romania 111.8 172.8
Source: Own study based on EIS data, 2016, accessed Nov. 28, 2016.
Poland is ahead of only three EU member states in this category: Latvia, Bulgar-ia, and Romania. Although the indicator for Poland has improved by more than 40% since 2010, the rate at which it increased has been only slightly faster than the EU av-erage. The data indicate that the internationalization of research resulting in scien-tific publications is still one of the weaknesses of the Polish NSI.

Chapter 12. The Internationalization of Poland’s National Innovation System 209
Conclusion
This analysis of the internationalization of Poland’s national innovation system has demonstrated that Poland lags behind most other EU member states, including those in Central and Eastern Europe, in terms of NIS internationalization indicators. The Polish innovation system can hardly be described as open to cooperation with foreign partners. What’s more, no major changes have been observed in this area for the 2010–2015 period.
While referring to the research questions posed in the introduction, it should be noted that while the importance of foreign sources of funding research in Poland is steadily growing, these are mainly the EU’s structural funds, while the use of funds available under EU framework programs has been relatively small. Other EU members in Central and Eastern Europe such as the Czech Republic, Hungary and Slovakia fare definitely better in this regard. Another weakness of the Polish NIS is the relatively low attractiveness of Poland’s R&D sector to foreign talent.
The results of Polish research have been little used internationally so far. Poland makes a far greater use of foreign technology, which is reflected by the fact that spend-ing on the purchase of foreign licenses, patents and other results of R&D work is five times greater than revenue from abroad from this source. Moreover, Poland’s posi-tion in patenting under the international procedure was rather low throughout the 2010–2015 period compared with other EU countries, which confirms that Poland’s national innovation system shows a low level of internationalization in the diffusion of domestically developed innovations.
Another disturbing trend during the last five years has been a decrease by 5 p.p. in the share of innovative Polish companies that undertake innovation-oriented co-operation with foreign partners. This hinders the transfer of knowledge and weakens the outcomes of learning, which, as shown by the literature, are crucial in the process of catching up with innovation leaders.
The openness of the Polish NSI as measured by cooperation in the joint develop-ment of research publications, is also limited. The per capita number of publications produced by Polish scientists in cooperation with foreign authors is nearly half the EU average, which ranks Poland near the bottom of the list among EU countries.
The patenting activity of Polish inventors undertaken jointly with foreign inventors is the only indicator of Poland’s involvement in international cooperation in research and innovation that points to some progress in the internationalization of Poland’s NIS. In this respect Poland is well above the EU average though below levels achieved by some other CEE countries such as Slovakia, the Czech Republic, Hungary, Romania,
Marzenna Anna Weresa210
and Bulgaria when it comes to intra-EU cooperation. In the case of patenting cooper-ation with non-EU partners, only Hungary and Bulgaria are ahead of Poland among EU countries in the CEE region. This points to a greater opening of Poland’s NIS in extra-EU rather than intra-EU terms when it comes to innovation.
Nevertheless, compared with the rest of the EU, Poland does not have much suc-cess in using international collaboration to stimulate innovation, as evidenced by the low levels of most indicators describing the internationalization of Poland’s NIS and their slow growth (with a decline in some cases). Thus, one of the main challenges that Polish innovation policy faces in the context of globalization of innovation is the need to improve the national R&D base and strengthen the links between the Polish national innovation system and its counterparts in other countries, in order to better exploit domestic R&D results and increase the absorption of foreign achievements.
References
Alkemade F., Heimeriks G., Schoen A., Villard L., Laurens P. (2015), Tracking the internation-alization of multinational corporate inventive activity: national and sectoral characteristics, Research Policy vol. 44, pp. 1763–1772.
Archibugi D., Iammarino S., (2000), Innovation and globalization. Evidence and implications, in: F. Chesnais, G. Ietto-Gilles, R. Simonetti (ed.), European Integration and Global Corpo-rate Strategies, Routledge, London- New York.
Autretsch D. B., Heblich S., Lederer A., (2011), The Handbook of Research on Innovation and Entrepreneurship, E. Elgar, Cheltenham
Bartholomew S., (1997), National systems of biotechnology innovation: complex interdepend-ence in the global system, Journal of International Business Studies, vol. 2, No. 2, 1997, pp. 241–266.
Cantwell J., Janne O., (2000), Globalization of innovatory capacity, in: F. Chesnais, G. Iet-to-Gilles, R. Simonetti (ed.), European Integration and Global Corporate Strategies, Rou-tledge, London & New York.
Carlsson B., (2006), Internationalization of innovation systems: A survey of the literature, Research Policy, No. 35, pp. 56–67.
Edquist Ch., L. Hommen L., (ed.) (2009), Small Country Innovation Systems. Globalization, Change and Policy in Asia and Europe, Edward Elgar, Cheltenham.
EIS (2016), European Innovation Scoreboard 2016, European Union, Belgium 2016, http://ec.europa.eu/growth/industry/innovation/facts-figures/scoreboards/index_en.htm, accessed Oct. 7, 2016

Chapter 12. The Internationalization of Poland’s National Innovation System 211
Frietsch R., Schuller M., (2010) (ed.), Competing for global innovation leadership: innovation systems and policies in the USA, Europe and Asia, Fraunhofer Institute for Systems and Inno-vation Research ISI, Fraunhofer Verlag, Stuttgart.
Greenhalgh Ch., Rogers M., (2010), Innovation, Intellectual Property and Economic Growth, Princeton University Press, Princeton, Oxford.
GUS, (2016), Nauka i technika w 2015 roku, 2015, Główny Urzad Statystyczny, Urzad Staty-styczny w Szczecinie, Warszawa.
Iammarino S., P. McCann P., (2013), Multinationals and Economic Geography: Location, Tech-nology and Innovation, E. Elgar Cheltenham.
Kaiser R., Prange H., (2004), The reconfiguration of National Innovation Systems: The example of German biotechnology, Research Policy, No. 33, 2004, pp. 395–408.
Niosi J., Bellon B., (1996), The globalization of national innovation systems, in: De la Mothe, J., Paquet, G. (ed.), (1996), Evolutionary Economics and the New International Political Econ-omy, Pinter, New York.
Potts J., (2016), Innovation policy in a global economy, Journal of Entrepreneurship and Public Policy, vol. 5, issue 3, pp. 308–324.
Weresa M. A., (2012), Systemy innowacyjne we współczesnej gospodarce światowej, Wydawnic-two Naukowe PWN Warszawa
Weresa, M. A., (2014), Polityka innowacyjna, Wydawnictwo Naukowe

Chapter 13
The Financing of Innovative Polish Enterprises under the European Union’s Horizon 2020
Program Compared with Other Member States
Małgorzata Stefania Lewandowska
Introduction
The Europe 2020 strategy, which defines the directions of development of Europe-an Union countries, specifies three mutually reinforcing priorities: smart, sustainable, and inclusive growth. Part of the strategy is Horizon 2020 (H2020), a major program for financing research and innovation in the European Union from 2014 to 2020. It combines research and innovation with a focus on three key areas: “excellent science,” industrial leadership, and societal challenges. These key pillars are supplemented by additional specific objectives: spreading excellence and widening participation, “sci-ence with and for society,” and the work of the Joint Research Centre and the Euro-pean Institute of Innovation and Technology.
In this context, the aim of this chapter is to furnish basic data on the funding of innovative projects in EU countries from the H2020 budget.
An important item in the H2020 budget is funds to stimulate the innovativeness of industrial enterprises. That’s why a second aim of this chapter is to describe the logic of financing industrial enterprises from the H2020 budget with the use of tools, including those aimed at small and medium-sized enterprises (SMEs). A third objec-tive is to show the hitherto level of funding for Polish enterprises, in particular from the H2020 budget, compared with the level of financing for enterprises from other European Union countries. An important final part of the chapter is an attempt to de-termine why Polish industrial enterprises have made only moderate use of funds avail-able from the H2020 budget.
An analysis of research reports on the importance of funding for innovative pro-jects will be of help in achieving the objectives of the chapter. The empirical part has been developed based on data obtained from the National Contact Point for Research Programmes of the European Union concerning the level of funding for enterprises,

Małgorzata Stefania Lewandowska214
mainly industrial ones, under the FP7 and H2020 programs. This data comes in the form of tables and a graph showing the proportions of the H2020 budget divided be-tween individual EU countries. The analysis also uses a linear regression to illustrate the relationship between the success rate and a financed project’s budget. The chapter also uses information obtained through in-depth interviews conducted with employ-ees at the National Contact Point for Research Programmes of the European Union.
Currently it is difficult to measure the real effects of support from the H2020 budget because they tend to occur with a considerable delay, so instead this chapter focuses on assessing the hitherto distribution of available funds and on diagnosing the causes for the low funding of Polish enterprises.
Public financial support for innovators – theoretical outline
The most important argument for government policy to promote innovation in the broad sense is the role that innovation plays in boosting the effectiveness of enterprises and the economic growth of countries (Crépon, Duguet, Mairesse, 1998; Van Leeuw-en, Klomp, 2006). Innovation is also a key factor in building international competi-tiveness, at both the micro- and macroeconomic levels (Brusoni et al., 2006, Halpern, 2007), while technological gap theory suggests that innovation is an important factor in international competitiveness at the sector level (Posner, 1961; Soete, 1981).
Government action to support innovative enterprises is the answer to theses adopt-ed in economic theory (Nelson 1959, Arrow, 1962) under which a firm is not interest-ed in investing in innovation unless it is able to capture and take advantage of all the benefits of such an investment (Luukkonen, 2000).
There are many studies that investigate the role of innovation policy. Some re-search reports focus on Polish enterprises in this context. Grabowski et al. (2013) assess the effectiveness of state aid in Turkey and Poland based on data from the Community Innovation Survey (CIS) for the 2008–2010 period. They find that government sup-port leads to increased innovation expenditure by enterprises, thus increasing their chances of introducing product innovations; local government support was found to be less effective than support from the central government and that received from the EU budget. Weresa and Lewandowska (2014), basing their findings on CIS 2010 data for Poland, proved the existence of an “input additionality” from EU funds with regard to expenditure incurred on the purchase of machines and equipment. They also showed that there is a “cooperation additionality” effect that stimulates cooper-ation with institutional partners. Also, Lewandowska, Kowalski (2015), in their study of large Polish enterprises operating within clusters, proved that public intervention

Chapter 13. The Financing of Innovative Polish Enterprises... 215
at the EU level has an impact on the propensity of companies to cooperate as part of clusters (“cluster cooperation additionality”). Using a structural equation model, the researchers found that public intervention has no such effect on innovation cooper-ation with partners outside the cluster. Last year’s edition of this report contained a study that, based on data from a structural equation modeling (SEM) approach, demonstrated that EU funds stimulate expenditure on machines and boost coopera-tion among Polish and Czech firms, but have no effect on stimulating the level of in-novativeness (Lewandowska, Weresa, 2016).
Horizon 2020 program as a tool to stimulate innovation in the European Union
The Horizon 2020 Framework Programme for Research and Innovation (2014– –2020), established Dec. 11, 2013 under Regulation No. 1291/2013 of the European Parliament and of the Council, is by far the largest EU program in this area. It includes three previously separate programs for supporting research:
� 7th Framework Programme for Research, Technological Development and Demon-stration Activities;
� part of the Framework Programme for Competitiveness and Innovation (CIP) for 2007–2013 dedicated to innovation;1
� work of the European Institute of Innovation and Technology.The aim of H2020 is to develop European innovations of global significance and
to develop a competitive advantage for the European economy based on innovation, in line with the Europe 2020 Strategy as well as the Innovation Union initiative (EC, 2014, p. 7).
The establishment of the Specific Programme Implementing Horizon 2020 (in-cluding its priorities and goals) is regulated by Council Decision of Dec. 3, 2013. The “rules for participation and dissemination” in the Horizon 2020 program are laid down in Regulation (EU) No. 1290/2013 of the European Parliament and of the Council of Dec. 11, 2013.
1 In December 2013, the European Parliament and the Council of the European Union adopted a Framework Programme for the Competitiveness of Enterprises and Small and Medium-Sized Enterprises (COSME) 2014–2020, a successor to the Framework Programme for Competitiveness and Innovation (CIP) for 2007– 2013 in its part concerning competitiveness. The main objective of the program is to strengthen the competitiveness of EU enterprises, especially SMEs, and promote an entrepreneurial culture and sup-port job creation and the growth of SMEs. The program’s budget is EUR 2.3 billion.

Małgorzata Stefania Lewandowska216
It is possible to apply for funds for each stage of innovation development from the Horizon 2020 budget. The program supports fundamental research, industrial research, development, demonstration, and the commercial use of research results.
Under the program it is possible to apply for coverage of 70% (in the case of in-novative projects) to 100% (in the case of research and innovation projects) of the eligible costs of a project. The entire H2020 budget is more than EUR 80 billion (at current prices). The distribution of the H2020 budget as of May 31, 2016 is reported in Table 13.1.
Table 13.1. The allocation of the Horizon 2020 budget as of May 31, 2016
Area Number of participations2
European Commission co-financing (EUR) Project budget (EUR)
Societal challenges 16,351 6,032 992,475 120,146,919,884
Excellent science 11,795 5,961 537,853 56,296,280,368
Industrial leadership 10,229 3,641 297,018 84,223,235,694
Euratom 408 514,982,619 27,847,935,245
Cross-theme 246 212,926,459 2,398,652,206
Dissemination of excellence and widening of participation 451 119,378,889 432,131,217
Science with and for society 513 108,945,175 1,291,121,011
Total 39,993 16,592,060,489 292,636,275,624
Source: Own study based on data obtained by the author from the National Contact Point for EU Research Programmes.
By May 31, 2016, a total of 39,993 participations had been approved for financ-ing as part of the H2020 program, including 38,186 from EU countries, Norway and Switzerland, which accounted for a combined 95% of the total number of financed participations. These countries received more EUR 16 billion between them. The big-gest beneficiary of the funds was Germany. Applicants from that country accounted for 18% of the total budget set aside for the EU, Norway, and Switzerland. Next were applicants from the UK, France, and Spain, and Italy and the Netherlands. The top 10 ranked countries accounted for more than 80% of the total H2020 budget. Poland, with 658 participations financed and a total funding of EUR 152,694,738, represented less than 1 percent of the total funding granted, holding the 17th position.
2 A proposal to finance a project is sent to the European Commission by one or more applying institu-tions. If the proposal is approved, it becomes a project, which is implemented by one or more participants. A participant may be involved in more than one project, hence the concept of the number of “participa-tions” (European Commission, 2014). Thus, “the number of participations,” that is the number of grants awarded, does not directly translate into the number of organizations receiving co-financing because an organization can apply for co-financing more than once (author’s note).

Chapter 13. The Financing of Innovative Polish Enterprises... 217
Table 13.2. Funding from the H2020 budget for EU countries, Norway and Switzerland, as of May 31, 2016
Country
Num
ber
of
part
icip
atio
ns
Aver
age
finan
cing
(EU
R) H2020
financing(EUR)
Total financing for projects
(EUR)
A co
untr
y’s
shar
e of
fin
anci
ng
H20
20
finan
cing
per
ca
pita
(EU
R)
Germany 5,204 556,334 2,895,161,394 45,629,688,220 18.02% 36
United Kingdom 5,305 469,280 2,489,528,365 28,028,392,781 15.50% 38
France 3,525 479,052 1,688,659,027 27,546,264,754 10.51% 25
Spain 4,091 359,557 1,470,948,879 26,130,133,924 9.16% 32
Italy 3,780 358,583 1,355,442,542 23,513,606,132 8.44% 22
Netherlands 2,668 483,150 1,289,045,198 19,991,530,783 8.02% 76
Belgium 1,756 445,542 782,372,446 13,500,386,062 4.87% 69
Sweden 1,188 464,363 551,663,251 9,202,089,861 3.43% 57
Austria 1,143 402,522 460,082,173 11,382,728,646 2.86% 54
Denmark 951 453,868 431,628,247 7,117,808,718 2.69% 76
Greece 1,139 303,555 345,749,627 6,941,540,164 2.15% 32
Finland 790 420,569 332,249,426 6,567,420,680 2.07% 61
Norway 588 517,187 304,106,024 4,802,624,020 1.89% 59
Ireland 683 434,268 296,604,790 4,472,717,861 1.85% 64
Portugal 898 316,065 283,826,544 6,408,776,498 1.77% 27
Switzerland 919 306,206 281,403,590 7,582,791,377 1.75% 34
Poland 658 232,059 152,694,738 4,220,255,576 0.95% 4
Czech Republic 398 262,276 104,385,807 3,665,959,660 0.65% 10
Hungary 368 251,430 92,526,229 3,095,386,169 0.58% 9
Slovenia 352 258,444 90,972,260 2,790,673,667 0.57% 44
Romania 370 180,047 66,617,294 3,261,645,801 0.41% 3
Estonia 207 289,603 59,947,845 2,188,182,629 0.37% 46
Cyprus 194 266,459 51,693,054 1,774,327,411 0.32% 61
Slovakia 182 241,569 43,965,508 2,266,219,239 0.27% 8
Luxembourg 137 297,423 40,746,943 739,097,205 0.25% 72
Croatia 169 169,454 28,637,652 1,504,847,841 0.18% 7
Bulgaria 202 115,391 23,309,027 1,836,217,135 0.15% 3
Lithuania 119 164,447 19,569,221 1,667,760,925 0.12% 10
Latvia 134 140,249 18,793,389 1,674,876,312 0.12% 6
Malta 68 193,270 13,142,355 329,684,201 0.08% 31
Total for EU countries, Norway and Switzerland 38,186 420,716 16,065,472,844 279,833,634,252 100.00% Average:
36
H2020 total 39,993 414,874 16,592,060,490 292,636,275,624
Source: Own study based on data obtained by the author from the National Contact Point for EU Research Programmes.

Małgorzata Stefania Lewandowska218
Relating these data to the size of the countries applying for funding, average fi-nancing from the H2020 budget per capita in the EU, Norway, and Switzerland is EUR 36. Clearly above this average are small countries such as the Netherlands, Bel-gium, Denmark, Ireland, Cyprus, and Luxembourg, where funding per capita is up to twice as high as the average per inhabitant in the EU, Norway, and Switzerland. Against this background, Poland, with financing at EUR 4 per capita, is only ahead of Bulgaria and Romania (see Table 13.2 for detailed data).
Analyzing the data in terms of the financed entities,3 the biggest beneficiaries in this period were higher or secondary education institutions (34% of funded pro-jects), followed by private-for-profit organizations (32% of funded projects), and research organizations (22% of funded projects). Much less funding was granted to public bodies (6% of funded projects) and “others,” or entities classified as not be-longing to any of the above groups (5%). The data for Poland show that the propor-tions of the financed projects are very similar, with slightly lower activity of higher or secondary education institutions (32% of all projects submitted by applicants from Poland) and slightly lower activity of private-for-profit organizations (30%). Polish public bodies (10% of projects) and research organizations (24% of projects) proved to be more active in submitting applications than other applicants on average. The number of projects from Poland that were granted funding accounted for 1.65% of the total number of projects. The average financing for a project from Poland is 56% of the average for all projects. Financing for Polish applicants was less than 1% of the total funding awarded, and the sum of projects represented 1.44% of the total num-ber of projects carried out as part of H2020 (see Table 13.4 for details).
Rules for financing enterprises from the Horizon 2020 budget, with a focus on tools for small and medium-sized enterprises
The rules for applying for funding from the H2020 budget (definition of benefi-ciaries, determining the advancement of a project) are strictly defined4. Enterprises can apply in all areas of H2020, but some of the instruments are intended specifical-ly for them, in particular for small and medium-sized enterprises. When applying for
3 The H2020 program identifies five types of applicants for funding: higher or secondary education (HEC); private for profit (PRC); public body (PUB); research organizations (REC); and others (OTH) (based on materials from the National Contact Point for EU Research Programmes).
4 For reasons of space, the study will not discuss in detail H2020 financial instruments, but only general rules for applying for funds. For detailed information about financing tools, see: National Contact Point for Financial Instruments of EU Programmes; http://instrumentyfinansoweue.gov.pl/program-horyzont-2020/

Chapter 13. The Financing of Innovative Polish Enterprises... 219
funds for SMEs, it is required that a project is at least at Technology Readiness Level 6 (EC, 2014).
Table 13.3. Technology Readiness Levels (TRL)
Product No. Technology Readiness Level Stage of research
9 Technology successfully tested in real-life conditions Commercial demonstration
8 Technology after close of project and final qualification
Product demonstration7 Presentation of prototype technology in real-life conditions
6 Presentation of prototype technology in near-real-life conditions
5 Concept tested in near-real-life conditions
4 Concept tested in laboratory conditions
Technological research3 Experimental proof-of-concept
2 Technology concept formulated
1 Basic operating principles defined Basic research
Idea
Source: Based on NCBR (2016); materials from the National Centre for Research and Development (NCBR).
The methodology to assess the technology readiness level was first used in R&D projects in the U. S. defense industry and in NASA projects (Mankis, 1995).
According to this method, the maturity of technology is described by nine stages. The first phase is the conceptualization of a new solution (TRL1), while the last phase (TRL9) means maturity, when the concept reaches the stage of a solution that can be applied in practice, launched into production and brought to market5 (Table 13.3). The sixth phase (TRL6) means that “a demonstration has been made of a prototype or a model of the technology system or subsystem under near-real-life conditions. A rep-resentative model or a prototype system that is far more advanced than that tested at level 5 has been examined in conditions similar to the actual ones. Tests at this level include the testing of a prototype in laboratory conditions faithfully reflecting the ac-tual conditions or in simulated operating conditions” (NCBR, 2016).
The purpose of instruments intended for SMEs is to fill a gap in the financing of innovative projects between the phases of research and commercialization. This is
5 A more detailed description of technology readiness levels can be found in Regulation of Jan. 4, 2011 on the management by the NCBR of research and development for national defense and security.

Małgorzata Stefania Lewandowska220
when enterprises’ own funds and public funds begin to run out, and the advancement of a project is insufficient to guarantee private funding (Figure 13.1).
Figure 13.1. The logic of financing small and medium-sized enterprises from the H2020 budget
Research Development Commercialization
Fund
s in
vest
ed
Public funds
SME financing under H2020
Private funds
Business angels
Venture capital
Industry
Source: Study based on National Contact Point (KPK) materials (2016) and European Commission materials (Horizon 2020).
Instruments for small and medium-sized enterprises have been divided into three phases to support the successive stages of carrying out innovation projects. Phase 1 is support for the evaluation of a concept and creation of a feasibility study. Phase 2 provides funding for work to develop a product for successful use on a commercial basis, and Phase 3 is based on carrying out the process of going commercial with the product. In this phase, the enterprise no longer receives funding, but is provided with professional support. Projects in Phase 1 are eligible for a lump sum of EUR 50,000, while the value of co-financing in the second phase may range from EUR 500,000 to EUR 2.5 million. Enterprises in Phase 1 or 2 may take part in Phase 3, in which en-tities are covered by indirect support based on access to financial instruments, build-ing relationships, securing intellectual property rights, assistance in reaching new markets, and support in the form of free coaching as part of the Enterprise Europe Network. Opportunities offered by the third phase are considerable, since companies taking part in it will gain access to top international coaching experts on doing busi-ness and management. This creates opportunities to gain an insight into the market, find out about the directions of development for the sector, and subsequently gain recognition in Europe and internationally (KPK, 2016), which means build an inter-national competitive advantage.
Chapter 13. The Financing of Innovative Polish Enterprises... 221
Financing of Polish enterprises from the Horizon 2020 budget compared with companies in other EU countries
Detailed data for Polish companies6 indicate that participations that had received funding from H2020 by May 31, 2016 (195) accounted for 1.50% of the total number of participations for industry financed under H2020 (12,984), while the average amount of financing for Polish enterprises (EUR 199,467) represented 55% of the average amount of financing for participations from industry under H2020 (EUR 359,877). The funding for enterprises from Poland is 0.83%, while the size of projects is 0.77% of the size of H2020 projects for the sector. Looking for a point of reference for this data, it is worth referring to the FP7 project, the predecessor of H2020. In total, in-dustrial enterprises received funds for 41,230 participations under the FP7 project. Industrial enterprises from Poland saw 531 participations financed, which accounted for 1.29% of the total number. The average financing per participation accounted for 64% of the average for the entire population, while the share of financing was 0.83%.
While comparing the results for enterprises benefitting from FP7 and H2020, it should be noted that after 2 1/2 years of financing there is a slight improvement in the share of applications from Poland (from 1.29% to 1.50%), but this difference is insig-nificant. Although the average amount of financing the participation of enterprises in H2020 increased in relation to FP7 (from EUR 173,081 to EUR 199,467, or by 15%) it is still much lower than in other countries on average. This is because average fi-nancing from H2020 increased by 33% (from EUR 269,760 to EUR 359,877), far more significantly than the average from FP7 (see Table 13.4 for details).
By May 31, 2016, a total of 12,984 participations by industrial enterprises—includ-ing 12,518 from EU countries, Norway, and Switzerland, or 96% of the total number—had been approved for funding under the H2020 program. EU countries, Norway, and Switzerland received over EUR 4.5 billion in all. Germany is the biggest beneficiary of funds for this type of enterprise, much as in the case of the overall H2020 budget. En-terprises from that country accounted for 18% of the total budget for the EU, Norway, and Switzerland. Next in line for funding were entities from the UK, France and Spain, Italy, and the Netherlands. As in the case of the overall budget, the top 10 countries account for almost 80% of the budget allocated to industrial enterprises.
It is worth noting a growing position of enterprises from Spain as beneficiaries of H2020. Under the previous financial framework, enterprises from Spain received less
6 Data from this part of the study apply to all enterprises (both SMEs and large enterprises) apply-ing for and receiving funding as part of all available projects under the H2020 budget as of May 31, 2016 (author's note).

Małgorzata Stefania Lewandowska222
than 9% of the total amount of funds; in the case of H2020, the figure is 11%, a notice-able change notwithstanding an increase in the budget. Undoubtedly, a network of support for potential beneficiaries in that country and intensive development of con-sulting firms have contributed to a more intense process of submitting applications by Spanish industrial enterprises.
Table 13.4. Allocation of the H2020 budget overall and for Poland, division by type of entity, data as of May 31, 2016
H2020 Number of participations
Average financing (EUR)
H2020 financing(EUR)
Total financing for projects (EUR)
Higher or secondary education institutions 13,637 465,018 6,341,449,320 79,055,166,698
Private-for-profit organizations 12,984 359,877 4,672,640,113 103,093,709,077
Research organizations 8,816 499,768 4,405,954,816 76,088,935,432
Public bodies 2,453 268,944 659,719,713 23,807,652,732
Other 2,103 243,603 512,296,528 10,590,811,685
Total 39,993 414,874 16,592,060,490 292,636,275,624
Poland Number of participations
Average financing (EUR)
H2020 financing(EUR)
Total financing for projects (EUR)
Higher or secondary education institutions 209 239,212 49,995,313 875,572,235
Private-for-profit organizations 195 199,467 38,896,000 793,903,195
Research organizations 158 278,588 44,016,918 1,673,702,179
Public bodies 64 260,394 16,665,240 797,397,344
Other 32 97,540 3,121,268 79,680,622
Total 658 232,059 152,694,738 4,220,255,576
Higher or secondary education institutions % 1.53% 51% 0.79% 1.11%
Private-for-profit organizations % 1.50% 55% 0.83% 0.77%
Research organizations % 1.79% 56% 1.00% 2.20%
Public bodies % 2.61% 97% 2.53% 3.35%
Other 1.52% 40% 0.61% 0.75%
Poland in H2020% 1.65% 56% 0.92% 1.44%
Industry in FP7 41,230 269,760 11,122,201,155 377,694,973,605
Polish industry in FP7 531 173,081 91,905,898 3,333,026,574
Percentage share 1.29% 64% 0.83% 0.88%
Source: Own study based on data obtained by the author from the National Contact Point for EU Research Programmes.
Poland, with its 195 financed participations and EUR 38,896,000 in total financing, represented less than 1 percent of financing granted to industrial enterprises, rank-ing 17th, the same position as in the case of total financing (see Table 13.5 for details).

Chapter 13. The Financing of Innovative Polish Enterprises... 223
Table 13.5. Funding from the H2020 budget for industrial enterprises in EU countries, Norway and Switzerland, as of May 31, 2016
Country Number of participations
Average financing
(EUR)
H2020financing
(EUR)
Total financing for projects
(EUR)
A country’s share of financing
Germany 1,854 436,876 809,967,683 20,094,093,981 18.00%
United Kingdom 1,403 386,186 541,819,033 9,742,634,295 12.00%
France 1,245 420,770 523,858,098 13,067,718,480 11.57%
Spain 1,559 314,381 490,120,160 9,234,893,038 10.83%
Italy 1,483 328,101 486,574,336 8,567,461,937 10.75%
Netherlands 857 434,536 372,397,380 8,504,961,745 8.23%
Belgium 467 367,023 171,399,814 4,055,719,502 3.79%
Austria 400 400,305 160,121,849 4,679,598,362 3.54%
Sweden 373 374,529 139,699,407 2,758,413,777 3.09%
Finland 264 401,665 106,039,607 2,170,412,263 2.34%
Denmark 274 363,720 99,659,210 2,061,526,103 2.20%
Greece 357 263,623 94,113,461 1,830,502,485 2.08%
Ireland 236 376,699 88,900,964 1,278,093,296 1.96%
Norway 162 525,586 85,144,869 1,488,429,813 1.88%
Portugal 267 263,307 70,302,914 1,567,998,618 1.55%
Slovenia 133 336,278 44,724,996 612,441,542 0.99%
Poland 195 199,467 38,896,000 793,903,195 0.86%
Hungary 129 252,469 32,568,439 797,744,972 0.72%
Slovakia 67 401,073 26,871,861 479,665,001 0.59%
Czech Republic 108 232,242 25,082,119 957,387,773 0.55%
Cyprus 69 284,337 19,619,276 337,436,164 0.43%
Romania 94 207,835 19,536,456 575,368,864 0.43%
Estonia 52 375,313 19,516,283 363,097,000 0.43%
Luxembourg 61 274,368 16,736,469 305,330,080 0.37%
Switzerland 250 50,933 12,733,351 1,763,353,828 0.28%
Bulgaria 50 138,252 6,912,614 291,307,372 0.15%
Lithuania 33 202,468 6,681,439 171,370,705 0.15%
Croatia 30 180,371 5,411,141 116,391,767 0.12%
Latvia 26 208,061 5,409,585 77,187,510 0.12%
Malta 20 251,921 5,038,414 63,605,299 0.11%
Total for EU countries, Norway and Switzerland 12,518 361,548 4,525,857,228 98,808,048,767 3.00%
H2020 total 12,984 359,877 4,672,640,113 103,093,709,077
Source: Own study based on data obtained by the author from the National Contact Point for EU Research Programmes.

Małgorzata Stefania Lewandowska224
Figu
re 1
3.2.
H20
20 b
udge
t allo
cati
on to
indu
stri
al e
nter
pris
es, a
s of
May
31,
201
6
Ger
man
y80
9,96
7,68
3 €
UK
541,
819,
033
€
Fran
ce52
3,85
8,09
8 €
Spai
n49
0,12
0,16
0 €
Italy
486,
574,
336
€
Net
herl
ands
372,
397,
380
€Be
lgiu
m
Aust
ria
Swed
en
Finl
and
Den
mar
kG
reec
e
Irel
and
Port
ugal
Slov
enia Po
land
38,8
96,0
00 €
Hun
gary
Slov
akia
CzR
Cypr
us
Rom
ania
Esto
nia
Luxe
mbo
urg
Switz
erla
nd
Bulg
aria
Latv
ia
Croa
tia
Lith
uani
a
Mal
ta
0 €
50,0
00 €
100,
000
€
150,
000
€
200,
000
€
250,
000
€
300,
000
€
350,
000
€
400,
000
€
450,
000
€
500,
000
€
020
040
060
080
01,
000
1,20
01,
400
1,60
01,
800
2,00
0
Average budget per participation
Num
ber
of p
artic
ipat
ions
Sour
ce: O
wn
stud
y ba
sed
on d
ata
obta
ined
by
the
auth
or fr
om th
e N
atio
nal C
onta
ct P
oint
for E
U R
esea
rch
Prog
ram
mes

Chapter 13. The Financing of Innovative Polish Enterprises... 225
A more in-depth analysis of data for Polish industrial entities prompts further conclusions. First and foremost, there is a striking difference between the average number of participations allotted to industrial enterprises from Poland. The average funding for participations by enterprises from Poland accounts for only 46% of the average funding for participations by enterprises from Germany and for less than 55% of the average for the 10 top-ranked countries. This difference is particularly evident for new EU countries, although enterprises from some of these countries, such as Estonia and Slovakia, managed to obtain financing whose average value did not significantly differ from the average for the leading countries and exceeded the average for the EU, Norway, and Switzerland. The distribution of funds among indus-trial entities in individual countries is graphically represented in Figure 13.2, taking into account the total number of participations from each country and the average funding for participations.
Data on the H2020 budget’s SME Instrument shows that by May 30, 2016, a total of 400 participations had been financed under this instrument, or 3% of the total number of participations by enterprises. The average financing was EUR 191,502, and the total amount exceeded EUR 76 million. Polish enterprises had had 26 participa-tions financed by May 30, 2016 (out of the total number of 195 for Polish applicants) under the SME Instrument. This accounted for 6.5% of the overall number under the H2020 budget’s SME Instrument. From this perspective, the result seems to be satis-factory, but taking into account the average amount of funding for participations, it turns out that it represents less than 9% of the average for enterprises financed under the H2020 SME Instrument, while the total amount for all applicants from Poland is only 0.6% of the total amount for H2020 SME Instrument. For details see Table 13.6.
Table 13.6. Financing for industrial enterprises from the H2020 budget’s SME Instrument, as of May 30, 2016
H2020 budget, SME Instrument
Number of participations
Average financing
H2020 financing SME Instrument
Total financing for projects
H2020 SME Instrument 400 191,502 76,600,614 25,726,9550
Polish SMEs in H2020 SME 26 16,494 428,850 2,027,007
Polish SMEs in H2020 SME, % 6.5% 8.6% 0.6% 0.8%
Source: Own study based on data obtained by the author from the National Contact Point for EU Research Programmes.
As in any case when financing is granted through a competitive procedure, it is possible to calculate the success rate, i.e. the ratio of the number of participation ap-plications submitted to the number of participations approved for funding. The data for industrial enterprises as of May 31, 2016 show the ratio varied considerably.
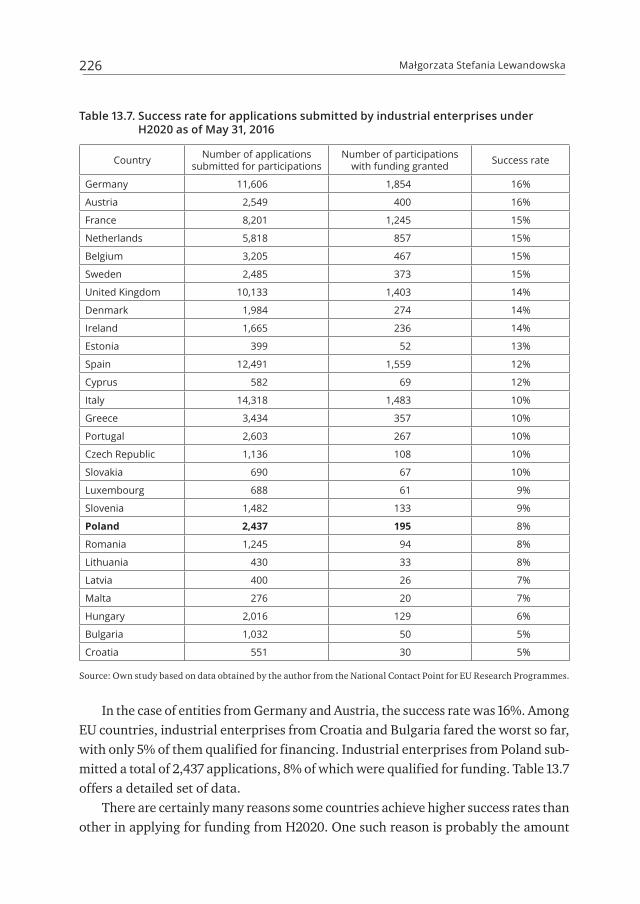
Małgorzata Stefania Lewandowska226
Table 13.7. Success rate for applications submitted by industrial enterprises under H2020 as of May 31, 2016
Country Number of applications submitted for participations
Number of participations with funding granted Success rate
Germany 11,606 1,854 16%
Austria 2,549 400 16%
France 8,201 1,245 15%
Netherlands 5,818 857 15%
Belgium 3,205 467 15%
Sweden 2,485 373 15%
United Kingdom 10,133 1,403 14%
Denmark 1,984 274 14%
Ireland 1,665 236 14%
Estonia 399 52 13%
Spain 12,491 1,559 12%
Cyprus 582 69 12%
Italy 14,318 1,483 10%
Greece 3,434 357 10%
Portugal 2,603 267 10%
Czech Republic 1,136 108 10%
Slovakia 690 67 10%
Luxembourg 688 61 9%
Slovenia 1,482 133 9%
Poland 2,437 195 8%
Romania 1,245 94 8%
Lithuania 430 33 8%
Latvia 400 26 7%
Malta 276 20 7%
Hungary 2,016 129 6%
Bulgaria 1,032 50 5%
Croatia 551 30 5%
Source: Own study based on data obtained by the author from the National Contact Point for EU Research Programmes.
In the case of entities from Germany and Austria, the success rate was 16%. Among EU countries, industrial enterprises from Croatia and Bulgaria fared the worst so far, with only 5% of them qualified for financing. Industrial enterprises from Poland sub-mitted a total of 2,437 applications, 8% of which were qualified for funding. Table 13.7 offers a detailed set of data.
There are certainly many reasons some countries achieve higher success rates than other in applying for funding from H2020. One such reason is probably the amount

Chapter 13. The Financing of Innovative Polish Enterprises... 227
of financing sought by applicants. There is a strong relationship between the suc-cess rate and average financing for participation under H2020 for the 28 EU member states (R² = 0.7881).
Figure 13.3. The relationship between the success rate and the average financing of participation in H2020 for EU countries, figures for industrial enterprises
100,000 € 150,000 € 200,000 € 250,000 € 300,000 € 350,000 € 400,000 € 450,000 € 500,000 €
GermanyAustria
FranceNetherlandsBelgium
Sweden
United KingdomIrelandDenmark
EstoniaSpainCyprus
ItalyPortugal
Czech Republic
Slovakia
LuxembourgSlovenia
Poland
RomaniaLithuania
LatviaMalta
HungaryBulgariaCroatia
y = 4E -07x - 0.0007R² = 0.7881
4%
6%
8%
10%
12%
14%
16%
Source: Own study based on data obtained by the author from the National Contact Point for EU Research Programmes.
In old EU countries, where the average financing of a participant is high, the success rate is also high. In most countries in Poland’s region (except Estonia) low financing for a participant is associated with a low success rate. One of the reasons is that enterprises from new EU countries, including Poland, rarely play the role of project leaders if they apply for funds as part of consortiums, and project leaders are usually granted much greater funding than other participants. Details are reported in Figure 13.3.
Conclusion
Polish industrial enterprises had a relatively low share of financing from the H2020 budget as of May 31, 2016, almost 2 1/2 years after the program was launched. Their success rate was one of the lowest among EU countries, and the average level of fund-

Małgorzata Stefania Lewandowska228
ing for Polish enterprises was significantly below the EU average. Funds intended for SMEs were used to finance 26 participations from Poland to the tune of EUR 428,850 in total, or EUR 16,494 per participation on average.
In a survey conducted on a sample of more than 500 Polish companies in 2014, more than half of the respondents said that a lack of experience in this area is the main reason they do not take advantage of EU funds. Other obstacles that discour-aged companies from applying for funds were complicated procedures for obtaining financing, a high cost of advisory services, a lack of appropriate EU funds, and insuf-ficient information on the subject (Comarch, 2014). Similar arguments were listed by respondents surveyed by PARP (2014). These seem to be largely subjective rather than objective reasons, especially as Poland has been a member of the EU for more than a decade, which seems to be long enough to acquire the skills needed to obtain information on the availability of funds.
An existing network of EU contact points undoubtedly helps spread this knowl-edge. For many years, a Contact Point for Financial Instruments of EU Programmes has operated out of the Polish Bank Association. It helps identify available funding opportunities, while the National Contact Point for Research EU Programmes coordi-nates a network of contact points across the country (comprising 11 Regional Contact Points and a dozen or so Sector Contact Points at Polish Technology Platforms and key business clusters), and provides the infrastructure to support the participation of Polish enterprises in the Horizon 2020 program. The Polish Agency for Enterprise Development (PARP) also plays a significant role in this area.
Meanwhile, the Department for Coordination of Implementation of EU Funds at the Ministry of Economic Development is tasked with monitoring the situation re-garding the use of funds.
Objective reasons for the low participation of Polish enterprises in H2020 can be described more precisely by analyzing the results of an evaluation of H2020 applica-tions in the 2014–2015 period. The evaluation shows that the most common reasons applications were rejected include:
� Low level of product innovation. Many enterprises plan to introduce solutions that already exist on the market;
� Lack of information in the application on how the solution will be put to use commercially, or presentation of an idea without a business concept. Only 12% of 6,972 applications by enterprises from the EU submitted for Phase 1 provided information on the commercial use of the products in question.
� Insufficient information on rival solutions. Descriptions focus on the project it-self and contain too little information about business opportunities, a financing model, or the commercialization method.

Chapter 13. The Financing of Innovative Polish Enterprises... 229
� Unconvincing description of what an enterprise’s business is about and an impre-cise explanation of what competitive advantages a potential beneficiary of the program holds (EASME, 2015).These reasons apply to all businesses, and they are probably true of Polish enter-
prises as well. In the case of Polish enterprises, a significant obstacle is the require-ment that the submitted project must be at Technology Readiness Level 6 (TRL6), which requires considerable spending already in the initial phase of the project. In addition, most products in the Polish SME sector have a moderate degree of com-plexity and in many cases they are innovative only locally, which is a further factor behind the low success rate (Kaczmarska et al., 2015). Aside from the poor financial condition of companies, which makes them unable to finance their own contribu-tions, some studies point to the continued existence of bureaucratic and institution-al barriers that effectively reduce the activity of Polish enterprises (Kotowicz-Jawor, Pęczkowska, 2012, pp. 142–143).
Perhaps the situation would improve if enterprises submitted their proposals as part of consortiums, including international ones. One barrier to this, however, is a continually low level of cooperation and trust. There is also the low activity of Pol-ish enterprises during special events organized for them that are designed to help them find cooperation partners.
Government agencies are aware of these limitations and are developing tools to support enterprises in submitting applications for funds for innovative projects. Support under the program is intended to cover (reimburse) the costs of drawing up and submitting a project application. A single businessperson can be reimbursed for the costs of several project applications as long as these were submitted in response to different calls for proposals (PARP, 2015). However, funding is granted only if an application meets the criteria set out in the H2020 requirements, and these are diffi-cult to meet, as evidenced by the efforts of Polish enterprises so far.
The lack of funding from the H2020 budget for projects in Phases 1 and 2 elimi-nates Polish SMEs from the opportunity of participation in the third phase of the pro-ject, where they could gain practical knowledge on how to go commercial with their products and build networks of ties at home and, primarily, abroad.
Because a sudden increase in participation by Polish enterprises is unlikely, this may widen the gap between Poland and other EU countries in the long term, thus increasing the already large gap in terms of innovation and international competi-tiveness. Poland will thus find it difficult to improve its position among EU countries in terms of the Global Innovation Index, which is published annually by the World Economic Forum in its Global Competitiveness Report. This is despite targets defined

Małgorzata Stefania Lewandowska230
by Poland’s previous government in its Dynamic Poland 2020 Strategy for Innovation and Economic Effectiveness (Ministry of Economy, 2013, p. 147).
References
Arrow K. J., (1962), Economic welfare and the allocation of resources for invention, in: Nelson, R. R. (Ed.), The Rate and Direction of Inventive Activity: Economic and Social Factors, National Bureau of Economic Research, Conference Series, pp. 609–625, Princeton Uni-versity Press, Princeton.
Brusoni S., Cefis E., Orsenigo L., (2006), Innovate or die? A critical review of the literature on innovation and performance, Working Paper No. 179, CESPRI, Universita Commerciale Luigi Bocconi, Milan, 2006;
Comarch (2014), Finansowanie MSP z dotacji UE. Raport z badań Comarch i dotacjomat.pl http://dotacjomat.pl/wp-content/uploads/2015/02/raport-dotacjomat.pl_.pdf
Crépon B., Duguet, E., Mairesse, J., (1998), Research, Innovation and Productivity: An Econo-metric Analysis at the Firm Level, Economics of Innovation and New Technology, vol. 7, pp. 115–158.
Council Decision of 3 December 2013 establishing the Specific Programme Implementing Horizon 2020 – the Framework Programme for Research and Innovation (2014-20) and repealing Decisions 2006/971/EC, 2006/972/EC, 2006/973/EC, 2006/974/EC and 2006/975/EC.
EASME (Executive Agency for Small and Medium-sized Enterprises), (2015), http://ec.europa.eu/easme/en/fast-track-innovation-fti-pilot-0
European Commission (2015), Horizon 2020. First results, https://ec.europa.eu/programmes/horizon2020/en/news/horizon-2020-first-results
European Commission (2013), Factsheet: Horizon 2020 budget,http://ec.europa.eu/research/horizon2020/pdf/press/fact_sheet_on_horizon2020_budget.
pdfEuropean Commission (2014), Technology readiness levels (TRL), HORIZON 2020 – WORK
PROGRAMME 2014–2015 General Annexes, Extract from Part 19 – Commission Decision C (2014) 4995.
Grabowski W., Pamukcu, T., Szczygielski, K., Tandogan, S., (2013), Does government support for private innovation matter? Firm-level evidence from Turkey and Poland, CASE Network Studies & Analysis, 458/2013.
Halpern L., (2007), Literature survey on the links between innovation, competition, competitive-ness, entry & exit, firm survival and growth, Working Paper No. 02/07, MICRO-DYN, EU 6th Framework Programme.
Horizon 2020; http://ec.europa.eu/programmes/horizon2020/en/area/smes

Chapter 13. The Financing of Innovative Polish Enterprises... 231
Kaczmarska B., Bochnia J., Gierulski W., (2015), Ocena gotowości technologii jako element pro-cesu komercjalizacji, conference materials, Politechnika Świętokrzyska, Kielce 2015 (http://www.ptzp.org.pl!files/konferencje/kzz/artyk ~dC 2015/Tl/U_ 0104. pdf).
European Commission (2014), Horizon 2020 in Brief: The EU Framework Programme for Research and Innovation, https://ec.europa.eu/programmes/horizon2020/sites/hori-zon2020/files/H2020_PL_KI0213413 PLN.pdf
Kotowicz-Jawor J., Pęczkowska J., (2012), Bariery transferu nowej wiedzy, in: J. Kotowicz-Jawor (ed.), Wpływ funduszy strukturalnych na transfer wiedzy do przedsiębiorstw, Instytut Nauk Ekonomicznych PAN, Warszawa.
Krajowy Punkt Kontaktowy Programów Badawczych UE, www.kpk.gov.pl KPK (2016), Mini--przewodnik dla MŚP zainteresowanych pozyskaniem dofinansowania w ramach Instrumentu MŚP w Fazie 1 i 2, http://www.kpk.gov.pl/wp-content/uploads/2016/06/instrument--msp-internet.pdf
Lewandowska M. S., Kowalski A. M., (2015), Współpraca polskich przedsiębiorstw w sferze inno-wacji a wsparcie z funduszy unijnych, Gospodarka Narodowa, No. 4 (278), pp. 69–89.
Lewandowska M. S., Weresa M. A., (2016), Skuteczność publicznego wsparcia działalności inno-wacyjnej przedsiębiorstw, in: Polska. Raport o konkurencyjności 2016. Znaczenie polityki gospodarczej i czynników instytucjonalnych, M. A. Weresa (ed.), Warszawa, Oficyna Wydaw-nicza SGH, pp. 213–230.
Luukkonen T., (2000), Additionality in EU Framework Programmes, Research Policy, vol. 29 (6), pp. 711–724.
Mankins J. C., (6 April 1995), Technology Readiness Levels: A White Paper, NASA, Office ofSpace Access and Technology, Advanced Concepts Office. http://www.hq.nasa.gov/office/
codeq/trl/trl.pdfMinistry of Economy (2013), Strategia Innowacyjności i efektywności gospodarki“Dynamiczna Polska 2020,” http://www.kigeit.org.pl/FTP/PRCIP/Literatura/006_1_Strategia_
Innowacyjnosci_i_Efektywnosci_Gospodarki_2020.pdfNelson R. R., (1959), The simple economics of basic scientific research, Journal of Political Econ-
omy, vol. 49, pp. 297–306.NCBR, (2016), http://www.ncbir.pl/gfx/ncbir/userfiles/_public/fundusze_europejskie/inteli-
gentny_rozwoj/innomoto/11_poziomy_gotowosci_technologicznej-zmiana-13.04.2016.pdfPARP (2015), https://www.parp.gov.pl/index/more/47274.PARP (2014), Internacjonalizacja przedsiębiorstw w Polsce, Raport z badania desk research,
Warszawa.Posner M. V., (1961), International trade and technical change, Oxford Economic Papers,
vol. 13 (3), pp. 323–341.Punkt Kontaktowy ds. Instrumentów Finansowych Programów Unii Europejskiej, http://instru-
mentyfinansoweue.gov.pl/o-kpk/

Małgorzata Stefania Lewandowska232
Regulation (EU) No 1291/2013 of the European Parliament and of the Council of 11 Decem-ber 2013 establishing Horizon 2020 – the Framework Programme for Research and Inno-vation (2014-2020) and repealing Decision No 1982/2006/EC.
Regulation (EU) No 1290/2013 of the European Parliament and of the Council of 11 Decem-ber 2013 laying down the rules for participation and dissemination in “Horizon 2020 – the Framework Programme for Research and Innovation (2014-2020)” and repealing Regu-lation (EC) No 1906/2006.
Regulation (EU) No 1287/2013 of the European Parliament and of the Council of 11 Decem-ber 2013 establishing a Programme for the Competitiveness of Enterprises and small and medium-sized enterprises (COSME).
Rozporządzenie z 04.01.2011 r. w sprawie sposobu zarządzania przez NCBR realizacją badań naukowych lub prac rozwojowych na rzecz obronności i bezpieczeństwa państwa.
Soete L., (1981), A general test of technology gap trade theory, Weltwirtschaftliches Archiv, vol. 117 (4), pp. 638–660.
Van Leeuwen G., Klomp L., (2006), On the contribution of innovation to multi-factor productiv-ity, Economics of Innovation and New Technologies, vol. 15 (4/5), pp. 367–390.
Interview conducted during a meeting with Marta Krutel, coordinator for SME innovation and an expert on access to risk financing at the National Contact Point for EU Research Pro-grammes, Polish Academy of Sciences’ Institute of Fundamental Technological Research (date of meeting: Oct. 11, 2016).
Interview conducted during a meeting with Katarzyna Walczyk-Matuszyk, deputy director for innovation at the National Contact Point for the Horizon 2020 Programme, and a team of experts at the Polish Academy of Sciences’ Institute of Fundamental Technological Research (date of meeting: Oct. 14, 2016).
Weresa M. A., Lewandowska M. S., (2014), Innovation system restructuring in Poland in the con-text of EU membership, in: Weresa, M. A. (Ed.), Poland Competitiveness Report 2014: A Dec-ade in the European Union, pp. 171–191, Warsaw School of Economics, Warsaw.

Chapter 14
Innovation, Cooperation and Internationalization: Research Results
for Polish Industrial Enterprises
Tomasz Gołębiowski, Małgorzata Stefania Lewandowska
Innovation is a key determinant of the competitiveness of both individual businesses and the economy as a whole. High innovation efficiency requires effective creation and acquisition of new knowledge through collaboration in innovative activities. This chapter focuses on the relationship between different types of innovations (as well as combinations of these) and innovation cooperation between domestic and internation-al partners, on the one hand, and the intensity of new-product exports on the other. The intensity of new-product exports is a measure of the internationalization and in-ternational competitiveness of enterprises. The analysis was conducted on a sample of 6,855 Polish companies covered by a GUS/CIS survey for 2008–2010. The Commu-nity Innovation Surveys (CIS) are executed by national statistical offices throughout the European Union and in Norway and Iceland to provide harmonized information on the innovativeness of enterprises in different sectors and regions.
The relationship between innovation, innovation cooperation and the internationalization of firms: a review of studies on the subject; research hypotheses
Enterprise innovativeness and exports
Many theoretical as well as empirical studies show that innovation has a positive impact on the competitive advantages of enterprises on both the home and foreign markets. Such competitive advantages encourage enterprises to export their goods and services and boost the intensity of these exports (measured by the share of sales abroad in total sales). Most of the research conducted in mature economies focuses on technological innovation (applying to both products and processes). Researchers

Tomasz Gołębiowski, Małgorzata Stefania Lewandowska234
note that business R&D expenditure and the enterprises’ involvement and ability to introduce new products have an important effect on their propensity to export products and on the intensity of these exports (see, for example, Verspagen, Wake-lin, 1997; Roper, Love, 2002; Cassiman et al., 2010; Ganotakis, Love, 2011; and Filip-petti et al., 2011).
Process innovation (in production technology, logistic processes, and other organ-izational processes—see Table 14.1) is mainly designed to reduce costs while boost-ing productivity. Process innovation can promote the penetration of foreign markets thanks to a cost advantage. It is worth noting that this advantage can also be obtained as a result of product innovations (cost-cutting design, using cheaper components or reducing product features). These two types of innovation have been found to be complementary (e.g. Kraft, 1990; Martinez-Ros, Labeaga, 2009).
It is believed that using innovations to differentiate the product is more impor-tant for a long-term international competitive advantage than cost factors (Verspagen, Wakelin, 1997; Halpern, 2007). Research conducted in mature economies suggests that product innovations play a more important role in export expansion than pro-cess innovations (e.g. Clausen, Pohjola, 2009; Becker, Egger, 2013). However, some other researchers suggest that the intensity of exports depends to a greater extent on process innovations than on product innovations, while product innovations (includ-ing those designed to adapt a firm’s product to the requirements of an export market) play a significant role in encouraging businesses to look for export markets for their products (e.g. Di Maria, Ganau, 2013).
Marketing instruments have a significant impact on altering the product to provide a competitive advantage. Many studies show that marketing competence and innova-tion have a positive impact on the international competitiveness and performance of enterprises (see, for example, Narver, Slater, 1990; Best, 2009; Hollensen, 2011). Mar-keting activities on foreign markets enable businesses to broaden their knowledge of these markets and help them adapt their products to better compete on target markets. Marketing innovations (see Table 14.1) may be complementary with regard to product innovation, thus facilitating access to a market and stimulating exports (e.g. Song et al., 2005; Mothe, Nguyen, 2010).
Researchers also point to the positive impact of various types of coordinated in-novations (technological and non-technological) on business performance. This is largely thanks to the complementarity and sometimes substitutability of such inno-vations. The effect also applies to exports (e.g. Mothe, Nguen, 2010; Doran 2012, Di Maria, Ganau, 2013).
The above review of the literature warrants the following research hypothesis about Polish industrial enterprises:

Chapter 14. Innovation, Cooperation and Internationalization: Research Results... 235
Product innovation (H1a), a combination of product and process innovations (H1b), a combination of product and marketing innovations (H1c), and a combination of prod-uct, process and marketing innovations (H14) all have a positive impact on the intensity of new-product exports.
Innovation cooperation and exports
According to the network approach to resource theory of the firm, an enterprise’s access to the resources of cooperating entities can be a source of a competitive ad-vantage (e.g. Lechner, Dowling, 2003; Lavie, 2006). Studies show a positive impact of innovation cooperation on the innovativeness of cooperating partners. The most important benefits of network ties resulting in innovation cooperation include access to external expertise and other complementary assets and access to new technology and markets, in addition to faster commercialization of new products, risk sharing, and protection of intellectual property rights (Pittaway et al., 2004). Efforts to effec-tively combine the partners’ knowledge and use it to create innovative solutions are particularly important (Chesbrough, 2003; Bell, 2005).
All types of innovations can be the subject of inter-organizational collaboration, but the most attention is typically paid to technological innovation, which is potential-ly the most complex. Depending on the subject of cooperation, cooperation partners can include both domestic and foreign suppliers, buyers, distributors, competitors, universities, R&D centers, marketing agencies, and government institutions aiming to support innovation.
The literature on the subject points to the importance of cooperation (including innovation cooperation) in the internationalization of firms, through both exports and more advanced forms of international involvement in both mature and emerging economies; this applies to firms of various sizes (e.g. Ellis, 2000; Haati et al., 2005; Coviello, 2006; Chetty, Stangl, 2010; Johansson et al., 2015).
One of the reasons for cooperation, especially in the case of businesses that are only starting their international expansion, is insufficient knowledge that exporters and other market players have about the foreign markets where they are launching their business projects. Other reasons include the lack of contacts and own infrastruc-ture on a target market as well as risk aversion. Appropriate management strategies and adequate marketing or product innovations make it easier for businesses to es-tablish complementary relationships with entities that have the necessary knowledge and other resources. In this context, cooperation with foreign partners can be par-ticularly useful (e.g. Ellis, 2000; Ghauri et al., 2003; Kontinen, Ojala, 2011; Yu et al., 2011; Ciravegna et al., 2014).

Tomasz Gołębiowski, Małgorzata Stefania Lewandowska236
Researchers less often single out the usefulness of relations with partners in the home country in order to gain access to foreign markets (e.g. Boehe, 2013). In the domestic market, cooperation partners can be either domestic businesses or subsid-iaries of multinational companies. A competitive environment in the home country (including the presence of innovative suppliers, customers and strong competitors) promotes innovation cooperation with local partners. In less competitive and less in-novative economies where there is a lack of an attractive business environment, there may be less interest in cooperation with domestic partners, and in the case of small and medium-sized enterprises as well as start-ups, strong ties with domestic partners may hinder foreign expansion (Prashantham, Birkinshaw, 2015).
The attractiveness of both domestic and foreign partners is determined by resourc-es (especially know-how and market expertise), experience in international business, innovation, and openness to cooperation. The effectiveness of cooperation depends not only on the knowledge and competence of the partners, but also on the intensity and stability of relationships, commitment, mutual trust, and the benefits derived by the partners (Forsgren et al., 2005; Ricci, Trionfetti, 2012).
This leads to the formulation of further research hypotheses concerning Polish industrial enterprises:
Innovation cooperation with either domestic partners (H2a) or foreign partners (H2b) or with domestic and foreign partners at the same time (H2c) has a positive im-pact on the intensity of new-product exports.
Innovation and innovation cooperation and their impact on exports—research results for Polish industrial enterprises
The analytical part of this report is based on data from a representative sample of 7,783 large and medium-sized enterprises, representing NACE sections B-E, which were surveyed in the GUS study using the PNT-02 questionnaire (Polish version of the Community Innovation Survey) for 2008–2010. The CIS methodology is based on the guidelines of the third edition of the Oslo Manual 2005 (Oslo Manual, 2005), which makes it possible to obtain comparable statistics. The Statistical Classification of Eco-nomic Activities in the European Community, commonly referred to as NACE (for the French term nomenclature statistique des activités économiques dans la Communauté européenne), is the industry standard classification system used in the European Union.
Due to incomplete data, the analysis covered 6,855 enterprises, of which 4,866 did not introduce any innovations in the studied period, 399 introduced only product

Chapter 14. Innovation, Cooperation and Internationalization: Research Results... 237
innovations, 669 introduced both product and process innovations, 209 introduced product and marketing innovations, and 712 introduced product, process, and mar-keting innovations at the same time.
The operationalization of the variables used in the study was based on the de-scription of the variables in the Polish version of the CIS. With this questionnaire, it is possible to operationalize the innovative activities of a company by calculating the share of new-product sales in total sales (and more precisely: innovative products in-troduced in 2008–2010 and sold in 2010). The Polish version of the CIS/PNT-02 ques-tionnaire thus makes it possible to build an indicator—a dependent variable—in the form of the percentage of new-product exports in total sales. The description of the variables is given in Table 14.1.
Table 14.1. Description and operationalization of the variables
Intensity of exports
Intensity of new-product exports
Exports of innovative (new or significantly improved) products brought to market from 2008 to 2010 as a percentage of total sales revenue in 2010 (innovative products are understood here as either products that are new, or significantly improved, to the market or products that are new, or significantly improved, to the enterprise)
Types of innovation
Lack of innovation applicable if an enterprise did not introduce any type of innovation in 2008–2010
Product innovation applicable if an enterprise introduced product innovation in 2008–2010, i.e., products new or significantly improved for the market and/or for the enterprise
Process innovation applicable if an enterprise in 2008–2010 introduced new or significantly improved production methods and/or logistics methods and/or delivery and distribution methods, and/or new or significantly improved methods (systems) for supporting enterprise processes
Marketing innovation applicable if an enterprise in 2008–2010 introduced marketing innovation involving a change in the design, concept or packaging of goods or services (not including changes in product functionality); a change in product distribution or sales channels; a new concept for the display of products and/or innovations based on the introduction of new media or techniques for product promotion and/or innovative pricing methods
Partners in innovation cooperation
Lack of cooperation partners
applicable if an enterprise did not declare being part of innovation cooperation in 2008–2010
Domestic partners applicable if an enterprise was in 2008–2010 involved in innovation cooperation with suppliers, customers, competitors, consultants, universities, and research institutes from its province or other provinces
Foreign partners applicable if an enterprise in 2008–2010 was involved in innovation cooperation with partners from EU, EFTA, or EU candidate countries, or the US, China, India, or other countries
Source: Own study based on the PNT-02 (Polish CIS) questionnaire for 2008–2010.

Tomasz Gołębiowski, Małgorzata Stefania Lewandowska238
Among the analyzed predictors of exports, the following have been selected: the nature and structure of business innovation (lack of innovation, product innovation, process innovation, marketing innovation). In addition to the lack of innovation, the following types of innovation have been selected: product innovation; product and process innovation; product and marketing innovation; and the co-existence of all types of innovations. We also considered innovation cooperation (wherever appli-cable) by the location of the partners (domestic, foreign, or domestic and foreign).
To assess the relationships in question, the Kruskal-Wallis test was used, and the Mann-Whitney test was also used to compare the groups in pairs. Unlike the ANOVA analysis of variance, the Kruskal-Wallis test does not require a number of assumptions to be met. The distributions of the variables do not need to be close to the normal dis-tribution, as is the case with the studied set. There is no requirement for the equinu-merosity of the groups or the equality of variance across the groups.
The results of the analysis confirmed a significant correlation between the share of new-product exports in total sales and the type of innovation (as well as combi-nations of innovations) (p<0.001). They also confirmed a significant correlation be-tween the share of new-product exports in total sales and the location of cooperation partners (p<0.001). However, not all of the groups singled out for the main effects significantly differed from one another.
Figure 14.1. The relationship between the bundle of innovations introduced by Polish industrial enterprises and the intensity of their exports of innovative products, N=6855, of this: innovative enterprises n=1989
5,5%
8,3%
3,0%
7,2%
2%
3%
4%
5%
6%
7%
8%
9%
Product innovations,n=399
Product and processinnovations, n=669
Product and marketinginnovations, n=208
Product, process andmarkeing innovations,
n=712
Source: Own study.

Chapter 14. Innovation, Cooperation and Internationalization: Research Results... 239
The Kruskal-Wallis test showed the existence of statistically significant differences in the intensity of innovative-product exports (i.e. the share of exports of such products in total sales) among the singled-out groups of enterprises, taking into account the types and combinations of innovations they introduced (χ2 (2) = 3313.611, p = 0.000).
Figure 14.1 shows that a combination of product and process innovations is the most conducive to innovative-product exports. Among enterprises that pursued this combination of innovations, innovative-product exports were responsible for 8.3% of total sales on average. Another combination of innovations favorable to the intensity of exports is a combination of product, process, and marketing innovations (with an average share in exports at 7.2%). Enterprises that only introduced product innova-tions in the analyzed period obtained significantly less positive exports results (with innovative-product exports accounting for 5.5% of total sales on average). The worst export performance was recorded by enterprises that introduced product and mar-keting innovations in the analyzed period (new-product exports representing only 3% of total sales).
The analysis of the relationship between innovation cooperation and the inten-sity of innovative-product exports clearly demonstrates the positive impact of such cooperation. In addition, the results of the Kruskal-Wallis test reveal significant dif-ferences in the intensity of innovative-product exports depending on the location of the innovation cooperation partner (χ2 (2) = 1560.169, p = 0.000). The averages for the singled-out subgroups of enterprises are higher than the average for the entire sample (1.98).
Cooperation with foreign partners has the greatest effect on the intensity of ex-ports. Enterprises cooperating with foreign partners achieved the best results in ex-port sales. Cooperation with both foreign and domestic partners combined appears to be less beneficial, though enterprises in this group still have a higher share of in-novative-product exports than those that cooperated only with domestic partners in a specific period. The lowest intensity of innovative-product exports was in enter-prises that did not pursue innovation cooperation—see Figure 14.2.
The number of foreign partners for innovation cooperation has a significant im-pact on an increased share of innovative-product exports in total sales, but only if the number of partners ranges from one to five: <1; 5>. With a larger number of part-ners, the share of innovative-product exports in total sales begins to decrease (see Figure 14.3 for details).

Tomasz Gołębiowski, Małgorzata Stefania Lewandowska240
Figure 14.2. The relationship between innovation cooperation and the intensity of innovative-product exports in Polish industrial enterprises, N=6855
2,4%
11%
8,2%
1,0%0%
2%
4%
6%
8%
10%
12%
Cooperation withpartners from Poland,
n=398
Cooperation withpartners from abroad,
n=136
Cooperation withpartners from Poland
and abroad, n=610
Lack of cooperation,n=5711
Source: Own study.
Figure 14.3. The relationship between the number of foreign partners in innovation cooperation and the intensity of innovative-product exports in Polish industrial enterprises, n=136
6%
8%
13%14%
18%
12%
2%
4%
6%
8%
10%
12%
14%
16%
18%
20%
Cooperationwith one partner
from abroad
Cooperationwith twopartners
from abroad
Cooperationwith threepartners
from abroad
Cooperationwith fourpartners
from abroad
Cooperationwith fivepartners
from abroad
Cooperationwith six
partners fromabroad
Source: Own study.
Conclusions
The findings of the study justify the desirability of a holistic look at factors deter-mining enterprise innovativeness and exports. Such an approach needs to take into account interactions between different types of innovations, and it should also consid-

Chapter 14. Innovation, Cooperation and Internationalization: Research Results... 241
er innovation cooperation leading to an increased intensity of new-product exports. It has been demonstrated that a combination of product and process innovations as well as of product, process, and marketing innovations (most frequent variants among in-novative enterprises) has a stronger impact on new-product exports than either sole product innovations or product-and-marketing innovations.
The research results seem to confirm the continued importance of a cost advan-tage in the strategies of enterprises from CEE countries (including Poland) that seek to compete thanks to process innovations. This is despite ongoing efforts by enter-prises to increase the role of their differentiation-based advantage resulting from product and marketing innovations (e.g. Stojcic et al., 2011; Lewandowska, Gołębi-owski, 2014). However, few businesses embrace such a combination of innovations, and its impact on the intensity of exports is weak (see Figure 14.1). It is worth not-ing that about 30% of innovative enterprises surveyed represent low-tech industries in which interaction between product innovations and other types of innovations are not statistically significant (Gołębiowski, Lewandowska 2014). This fact influenced the results obtained.
The low impact of product and marketing innovations on the intensity of exports may be due to exporter strategies and the structure of Polish exports. Many products offered by Polish exporters are marketed under the labels of foreign intermediaries that undertake marketing activities on international markets. The manufacturing sub-sidiaries of international corporations active in Poland are responsible for a signifi-cant chunk of new-product exports as a result of which the parent company takes over marketing activities in exports. Finally, the structure of exports, specifically a signif-icant portion of products offered in B2B relations reduces the intensity of marketing activities (and marketing innovations).
The study confirmed the importance of innovation cooperation between enter-prises, in line with the contemporary network approach to innovation processes.
The study has highlighted ties between innovation cooperation and the intensity of exports, a problem rarely analyzed in transition economies, including Poland (Szy-mura-Tyc, 2015; Lewandowska et al., 2016). It has been shown that there is a positive relationship between innovation cooperation, especially with foreign partners as well as with foreign and domestic partners combined, and the intensity of new-product exports. The fact that cooperation with domestic partners has less of an impact on the intensity of new-product exports seems to point to the low attractiveness of the domestic environment, including a relatively low level of knowledge and expertise (especially technological and market skills) among domestic partners compared with foreign partners (which is confirmed by other studies). The study has also pointed to the desirability of optimizing the number of cooperation partners.

Tomasz Gołębiowski, Małgorzata Stefania Lewandowska242
The most important conclusion from the study is that enterprises (exporters) should take advantage of the complementarity of various types of innovation and become much more involved in innovation cooperation (especially with competent foreign partners) as a necessary condition for their increased international competi-tiveness and greater export intensity.
An important limitation of the study was the lack of access to newer GUS/CIS panel data on enterprise innovation. Obtaining data for subsequent years would make it pos-sible to verify the results of this survey in the long term and capture trends in changes. It would also be worthwhile to deepen research, for example by taking into account the size of enterprises, the structure of their capital (domestic/foreign ownership), the technological advancement of industries or export market characteristics, and how these impact the relationships between innovation, innovation cooperation, and the intensity of new-product exports.
References
Becker S. O., Egger P. H., (2013), Endogenous product versus process innovation and a firm’s pro-pensity to export, Empirical Economics, No. 1, pp. 329–354.
Bell G. G., (2005), Clusters, networks, and firm innovativeness, Strategic Management Journal, No. 3, pp. 287–295.
Best R. J., (2009), Market-Based Management. Strategies for Growing Customer Value andProfitability, ed. 5, Pearson Education, London.Boehe D., (2013), Collaborate at home to win abroad: How does access to local network resources
influence export behavior?, Journal of Small Business Management, No. 2, pp. 167–182.Cassiman B., Golovko, E., Martínez-Ros E., (2010), Innovation, exports and productivity, Inter-
national Journal of Industrial Organization, No. 4, pp. 372–376.Chesbrough H. W., (2003), Open innovation: The New Imperative for Creating and Profiting from
Technology, Harvard Business School Press, Boston, Mass.Chetty S., Stangl, L. M., (2010), Internationalization and innovation in a network context, Euro-
pean Journal of Marketing, No. 11/12, pp. 1725–1743.Ciravegna L., Majano, S. B., Zhan, G., (2014), The inception of internationalization of small
and medium enterprises: The role of activeness and networks, Journal of Business Research, No. 7, pp. 1081–1089.
Clausen T. H., Pohjola, M., (2009), International competitiveness: internal capabilities and open innovation as sources of export performance, MICRO-DYN, EU Sixth Framework Programme, Working Paper No. 05/09.

Chapter 14. Innovation, Cooperation and Internationalization: Research Results... 243
Coviello N. E., (2006), The network dynamics of international new ventures, Journal of Interna-tional Business Studies, No. 5, pp. 713–731.
Di Maria E., Ganau R., (2013), Driving firm’s export propensity and export intensity: the role of experience, innovation and international marketing strategy, paper presented on European International Business Academy (EIBA) 39th Annual Conference, Bremen.
Doran J., (2012), Are differing forms of innovation complements or substitutes?, European Jour-nal of Innovation Management, No. 3, pp. 351–371.
Filippetti A., Frenz M., Ietto-Gillies G., (2011), Are innovation and internationalization related? An Analysis of European countries, Industry and Innovation, No. 5, pp. 437–459.
Forsgren M., Holm U., Johanson J., (2005), Managing the Embedded Multinational: A Business Network View, Edward Elgar, Cheltenham.
Ganotakis P., Love J. H., (2011), R&D, product innovation, and exporting: evidence from UK new technology firms, Oxford Economic Papers, No. 2, pp. 279–306.
Ghauri P., Lutz C., Tesfom G., (2003), Using networks to solve export-marketing problems of small and medium-sized firms from developing countries, European Journal of Marketing, No. 5–6, pp. 728–752.
Gołębiowski T., Lewandowska M. S. (2014), Complementarities between technological and non-technological innovation. Their influence on new product export intensity of Polish firms, paper for 40th European International Business Academy (EIBA) Annual Confer-ence, Uppsala.
Haahti A., Madupu V., Yavas U., Babakus E., (2005), Cooperative strategy, knowledge intensity and export performance of small and medium sized enterprises, Journal of World Business, No. 1, pp. 124–138.
Halpern L., (2007), Literature survey on the links between innovation, competition, competitive-ness, entry & exit, firm survival and growth, MICRO-DYN, EU Sixth Framework Programme Working Paper No. 02/07.
Hollensen S., (2011), Global Marketing. A Decision-oriented Approach, ed. 5, FT Prentice Hall/Pearson Education Ltd, Harlow.
Johansson B., Johansson S., Wallin T., (2015), Internal and external knowledge and introduc-tion of export varieties, The World Economy, No. 4, pp. 629–654.
Kontinen K., Ojala A., (2011), Network ties in the international opportunity recognition of fam-ily SMEs, International Business Review, No. 4, pp. 440–453.
Kraft K., (1990), Are product- and process-innovations independent of each other?, Applied Eco-nomics, No. 8, pp. 1029–1038.
Lavie D., [2006], The competitive advantage of interconnected firms: An extension of the resource-based view of the firm, Academy of Management Review, No. 3, pp. 638–658.
Lechner C., Dowling M., (2003), Firm networks: external relationships as sources for the growth and competitiveness of entrepreneurial firms, Entrepreneurship and Regional Development, No. 1, pp. 1–26.
Tomasz Gołębiowski, Małgorzata Stefania Lewandowska244
Lewandowska M. S., Gołębiowski T., 2014, Innovation and international competitiveness of man-ufacturing firms: Evidence from Bulgaria, Czech Republic, Hungary, Poland, and Romania, in: A. Zhuplev, K. Liuhto (ed.), Geo-Regional Competitiveness in Central and Eastern Europe, the Baltic Countries, and Russia, IGI Global, Hershey, PA, pp. 57–82.
Lewandowska M. S., Szymura-Tyc M., Gołębiowski T., (2016), Innovation complementarity, cooperation partners, and new product export: Evidence from Poland, Journal of Business Research, No. 9, pp. 3673–3681.
Martinez-Ros E., Labeaga J., (2009), Product and process innovation: persistence and comple-mentarities, European Management Review, No. 1, pp. 64–75.
Mothe C., Nguyen T. T. U., (2010), The link between non-technological innovation and technolog-ical innovation, European Journal of Innovation Management, No. 3, pp. 313–332.
Narver J. C., Slater S. F., (1990), The effect of a market orientation on business profitability, Jour-nal of Marketing, October, pp. 20–35.
Oslo Manual. Guidelines for Collecting and Interpreting Innovation Data, (2005), Joint publica-tion by OECD and Eurostat, ed. 3, OECD Publishing, Paris.
Pittaway L., Robertson, M., Munir, K., Denyer, D., Neely, A., (2004), Networking and innovation: a systemic review of the evidence, International Journal of Management Reviews, No. 5/6 (3-4), pp. 137–168.
Prashantham S., Birkinshaw J., (2015), Choose your friends carefully: Home-country ties and new venture internationalization, Management International Review, No. 1, pp. 207–234.
Ricci L. A., Trionfetti A., (2012), Productivity, networks, and export performance: Evidence from a cross-country firm dataset, Review of International Economics, No. 3, pp. 552–562.
Roper S., Love J. H., (2002), Innovation and export performance: evidence from the UK and Ger-man manufacturing plants, Research Policy, No. 7, pp. 1087–1102.
Song M., Droge C., Hanvanich S., Calantone R., (2005), Marketing and technological resource complementarity: an analysis of their interaction effect in two environmental contexts, Stra-tegic Management Journal, No. 3, pp. 259–276.
Stojcic N., Hashi I., Telhaj S., (2011), Innovation activities and competitiveness: empirical evi-dence on behavior of firms in new member states and candidate countries, CASE Network Studies and Analyses, No. 424.
Szymura-Tyc M., (2015), Internacjonalizacja, innowacyjność i usieciowienie przedsiębiorstw. Podejście holistyczne, Difin, Warszawa.
Verspagen B., Wakelin, K., (1997), International competitiveness and its determinants, Interna-tional Review of Applied Economics, No. 2, pp. 177–190.
Yu J. Gilbert B. A., Oviat B. M., (2011), Effects of alliances, time, and network cohesion on the ini-tiation of foreign sales by new ventures, Strategic Management Journal, No. 4, pp. 424–446.
The authors wish to thank Prof. Małgorzata Rószkiewicz for her help in the sta-tistical analysis of empirical data.

Chapter 15
The Internationalization of Polish Business Clusters
Arkadiusz Michał Kowalski
Introduction
This chapter focuses on the internationalization of Polish business clusters and on the involvement of local cluster initiatives in the process, while taking into account the potential benefits for enterprises. The rationale for the choice of the topic is the evolution of clusters in the modern economy whereby they are growing from limit-ed local production systems into important components of international cooperation networks, many of these global in nature. The first part of the chapter gives the the-oretical basis for the concept of clusters and looks at their focus on internationaliza-tion as a way to meet contemporary challenges in the development of international competitiveness. The next section outlines the basic dimensions of the process of in-ternationalization of clusters, which may occur as a result of activities undertaken by cluster initiatives (top-down approach) or member companies (bottom-up approach), and cover a variety of activities, such as production, trade, research, education, and training. The chapter then examines the process whereby clusters join global value chains in response to the growing international fragmentation of production. At the same time, in an era of globalization of the economy and economic cooperation across national borders, clusters can increase the attractiveness of countries or regions as investment destinations and help them attract foreign direct investment. The next section furnishes the results of empirical research on the international cooperation of Polish cluster initiatives, taking into account foreign partners from both the Euro-pean Union and non-European countries. The final part of the chapter describes ac-tivities undertaken for the internationalization of clusters as part of cluster policy at both the EU and national levels.
Arkadiusz Michał Kowalski246
Cluster internationalization as a response to new challenges for the development of international competitiveness
Clusters have dynamically increased their importance and popularity during the last three decades, becoming a new way of thinking about the international compet-itiveness of economies. The very concept of competitiveness is multidimensional, as evidenced by a large number of attempts in the literature to define the concept. How-ever, while traditional definitions of competitiveness relate primarily to changes in the efficiency with which a country uses its resources, the new approach goes beyond the economic dimension. It addresses the need to expand the concept of competitiveness to include social aspects and certain elements of sustainable development, for exam-ple a desire to ensure a social equilibrium and sustainable use of the environment (Aiginger, Vogel, 2015; Weresa, 2015, Weresa, 2016a, b).
In the traditional approach, research into clusters focused on their impact on com-petitiveness at the mesoeconomic level, which means it primarily concerned benefits gained for the development of a sector or a regional economy. Both these dimensions are reflected in the classic definition formulated by M. E. Porter (Porter, 1990), accord-ing to which clusters are “geographic concentrations of interconnected companies, specialized suppliers, service providers, firms in related industries, and associated in-stitutions (e.g. universities, standards agencies, and trade associations) in particular fields that compete but also cooperate.” This definition means that one of the most important characteristics of clusters is a spatial concentration of enterprises operat-ing in a given sector and related industries (Kowalski, 2016, p. 50). In the initial phase of research into clusters, they were therefore regarded as closed production systems, restricted to a particular location and capable of entering into external interactions only at the beginning and at the end of a production chain. Meanwhile, the growing internationalization of the economy—which leads to the removal of trade barriers, strengthens transport and communication systems, and promotes the introduction of uniform market regulations—contributes to more intense cooperation and a stepped-up international flow of resources, a process reflected in cluster operations.
Cluster initiatives increasingly extend beyond the scope of a given location, en-tering into interactions with actors based in other regions or even countries. Accord-ing to J. H. Dunning (2002), the fact that cluster operations extend beyond their local areas calls for a revision of conventional models explaining the spatial concentration of economic activity and the role of business clusters in the development of compet-itiveness. The evolution of clusters shows that they are becoming a factor contribut-ing to the globalization of the economy. According to one definition, globalization

Chapter 15. The Internationalization of Polish Business Clusters 247
means an “increased network of interactions among a growing number of players, as a result of which the situation of individual entities is increasingly dependent on mega- rather than meso-trends” (Hausner, Kudłacz, Szlachta, 1998, p. 14). Globali-zation therefore means that in order to maintain their competitive capacity, clusters and the businesses they bring together are increasingly working out strategies for the internationalization of their operations, including by outsourcing or foreign di-rect investment (Rabellotti, Carabelli, Hirsch, 2009). To sum up, it is possible to state that clusters have entered a new stage of evolution in which, after the development of cooperation chiefly at the local level, the time has come to build trans-regional and cross-border cooperation networks (Kowalski, 2014). On the one hand, clusters have become a new way of thinking about competitiveness; on the other, they have become an important element of international economic cooperation, thus fitting into the re-search undertaken in this year’s report.
Dimensions of cluster internationalization
Increased global economic interdependencies mean that businesses operating within clusters should reach beyond cooperation at the local level and open them-selves to foreign partners. In the traditional approach, possibilities for business expan-sion on foreign markets primarily depended on internal factors. Today the network approach to the internationalization of the firm is increasingly important. According to this approach, the firm is part of a wider system of entities that share a variety of ties (Johanson, Mattsson, 2015). Clusters can represent such a system; they ensure the complementarity of actions by many actors, thereby facilitating international ex-pansion from the point of view of both a group of participants and a single company. B. Jankowska and C. Główka (2016, p. 401), in their concept of the internationaliza-tion of the cluster, report that this process can be analyzed at two levels:1) the top-down approach, whereby cooperation is established at the international
level as a result of actions undertaken by cluster initiative coordinators, meaning this kind of cooperation always applies to formalized clusters,
2) the bottom-up approach, when the internationalization of the cluster occurs through the activity of businesses that are cluster members, and may therefore concern both formal cluster initiatives and informal clusters. In this case the fol-lowing two types of internationalization can be distinguished:
– active internationalization, which requires businesses to venture outside their home market, for example through exports, cooperative relationships, or for-eign investment,

Arkadiusz Michał Kowalski248
– passive internationalization, which means building relationships with foreign entities without venturing beyond the domestic market.
While analyzing actions undertaken by formal cluster organizations in France (re-flecting the top-down approach to the internationalization of the cluster), A. Colovic and O. Lamotte (2014) identified two basic types of activities: helping entrepreneurs find foreign customers for manufactured goods and aiding the establishment of part-nerships for research, development, and innovation (RDI). It is worth noting that the internationalization of clusters in the top-down approach often launches internation-alization processes in the bottom-up approach. A number of empirical studies (e.g. Al-Laham, Souitaris, 2008; Fernhaber, Gilbert, McDougall, 2008; Libaers, Meyer, 2011, Andersson, Evers, Griot, 2013; Musso, Francioni, 2015; Nielsen, Jørgensen, Nielsen, 2016) confirm that enterprises are more likely to secure opportunities for interna-tional expansion if they operate as a part of clusters that establish cooperation with foreign partners.
In practice, internationalization is not yet regarded as a priority by most cluster initiatives, but it is increasingly possible to see examples of active cooperation on the international arena. The internationalization of the cluster and its component com-panies and other types of entities may apply to the following types of activities:1) production, when the profile of enterprises operating in a cluster needs to be ex-
panded to include the range of complementary resources offered by their foreign partners,
2) trade, in particular in the case of small and medium-sized enterprises belonging to a cluster that have not developed ties abroad which would enable them to ex-port manufactured goods on their own,
3) research (e.g. undertaking joint R&D or cooperation for the sake of technology transfer), which plays a particularly important role in the context of internation-alization processes involving innovation (techno-globalism),
4) education and training when training programs, conferences, and study visits are organized to upgrade the qualifications of market players and to exchange knowl-edge and experience at the international level.The possibilities of internationalization of a cluster’s operations are to a large ex-
tent determined by its characteristics and internal structure. Research by A. Al-Laham and V. Souitaris (2008) on biotechnology clusters in Germany shows that previous experience by cluster initiatives in developing local and national cooperation has a positive impact on the establishment of international contacts. This experience provides skills to carry out joint projects and initiatives, and it is also a signal for po-tential foreign partners that a cluster has contacts with various actors on the home market. For this reason, the internationalization of clusters is also in a positive way

Chapter 15. The Internationalization of Polish Business Clusters 249
influenced by their organizational diversity, i.e. the fact that they bring together dif-ferent types of organizations, such as business service providers, financial institu-tions, suppliers, and associations of professionals from various fields. Of particular importance is the presence, in a cluster initiative, of renowned research and scien-tific entities because this increases the reliability of this initiative, and it also signals to potential international partners that the initiative has high potential in terms of knowledge and skills.
Clusters in global value chains
The modern global economy is characterized by a growing international fragmen-tation of production, as a result of which clusters are included in global value chains (GVC). In this context, M. Porter (2008, pp. 252–253) observed the so-called location paradox whereby, despite the progressive globalization, a sustainable competitive ad-vantage of companies on international markets is often rooted in the local environ-ment and various aspects of proximity. This research topic is part of the concept of glocalization, based on the mutual penetration of global economy components and local economic and social structures that enter into networks of international links. This process also concerns clusters which in many cases produce intermediates that are the basis for the functioning of global value chains.
The increasingly dense network of raw materials and intermediates flowing be-tween various locations leads to fragmented production processes. According to re-search by B. Los, M. P. Timmer and G. J. Vries (2015), these processes are gradually losing their regional character and are becoming increasingly global in nature. At the same time, the creation of value chains across national boundaries contributes to a situation, in which clusters can promote greater internationalization of the local economy and represent an effective means of attracting foreign direct investment and of their integration with domestic entities, while taking into account the spe-cific conditions prevailing in a given country (Kowalski, 2014, pp. 107–108). Cluster structures, by increasing the attractiveness of a region as an investment destination, not only contribute to a greater inflow of capital, but also help permanently bind in-vestors to the local economy. A standout example of such a process is Ireland, where the inflow of foreign direct investment, in particular from the United States, has con-tributed to the creation of clusters in sectors such as ICT, (bio) pharmaceuticals and international services. Likewise, Poland’s best developed cluster, the Aviation Valley in the southeastern Podkarpackie province, has emerged with the significant involve-ment of foreign investors.

Arkadiusz Michał Kowalski250
Transnational corporations are developing their chains by acquiring resources specific to a given region, including local knowledge (Bellandi, 2001). Such a strat-egy leads to a process known as multiple-embeddedness, whereby companies build permanent and in-depth relationships with many industry clusters (Zucchella, 2006). This is accompanied by a dispersion of cluster value chains into cooperative and com-petitive relationships between different industrial agglomerations that occupy either different or identical positions in a value chain (Nadvi, Halder, 2005). Such de-local-ization processes pose a threat to clusters because they may cause value to migrate to other regions. On the other hand, they can facilitate the inclusion of regional busi-nesses into international networks, thus opening possibilities of expansion into in-ternational markets. According to J. Humphrey and H. Schmitz (2002, p. 1020), the following methods can be used to improve competitiveness and upgrade a cluster as part of a global value chain:
– process upgrading, based on increasing the efficiency of processes through the re-organization of a production system or the introduction of advanced technology,
– product upgrading, based on diversifying the product range and manufacturing high-value-added products,
– functional upgrading, based on adopting new functions or replacing the combi-nation of already performed tasks with those that increase the level of speciali-zation in activities,
– inter-sectoral upgrading, based on cluster companies undertaking new types of business activities and entering new value chains while using competences ac-quired through prior participation in other value chains.G. Gereffi and J. Lee (2016, p. 30) and P. Knorringa and K. Nadvi (2016, p. 58) ana-
lyzed clusters and global value chains in terms of governance. Clusters have a hori-zontal management system that primarily concerns coordination of local cooperation between businesses and other organizations inside and outside the cluster structure. The management of global value chains is, in turn, based on a vertical system that combines customers and suppliers in different countries. While the co-existence of both systems in a given area may create conflict situations resulting from factors such as asymmetry, their proper coordination contributes to a beneficial synergy effect and industrial advancement. It also helps upgrade the regional economy, enabling it to im-prove its competitive position internationally. The entry of clusters into global value chains thus ensures a holistic view of business processes, in both top-down and bot-tom-up terms. At the same time, the overlapping of these two approaches is part of an analysis of multi-polar governance of global value chains (Ponte, Sturgeon, 2014).

Chapter 15. The Internationalization of Polish Business Clusters 251
International cooperation of Polish clusters
Research conducted by the Polish Agency for Enterprise Development (PARP) (Buczyńska, Frączek, Kryjom, 2016) provides data on the top-down internationaliza-tion of clusters (through activities undertaken by cluster initiative coordinators). The research, which used the typology presented in the theoretical part of this chapter, covered 134 cluster initiatives, 63 of which (47%) cooperated with at least one foreign partner and 23 declared a lack of international cooperation, with 48 clusters provid-ing no information in this area. The most common type of foreign partner was other cluster initiatives, but also single entities. Table 15.1 has detailed data on the number of partner organizations for Polish clusters in different countries.
Table 15.1. The number of Polish cluster initiatives cooperating with foreign partners
Country Number of cooperating cluster initiatives
Germany 50
Spain 18
Sweden 17
Austria 16
France, Italy 15
United Kingdom 12
Belgium, Slovakia, Finland, Norway* 11
Denmark, Ukraine* 10
Lithuania, Hungary, United States* 9
Russia* 8
Estonia, Netherlands, Portugal, Turkey* 5
Greece, Latvia, Romania, Slovenia, Switzerland* 4
China*, Japan*, Canada*, Mexico* 3
Ireland, Belarus*, Israel*, Serbia* 2
Croatia, Australia*, South Korea*, United Arab Emirates* 1
* Non-EU country
Source: Own study based on PARP research published in a report by: Buczyńska, Frączek, Kryjom (2016), pp. 45–47.
The data in Table 15.1 show that entities from Germany are the most common for-eign partners for Polish cluster initiatives, while entities from Norway are the most common among non-EU partners. Polish cluster initiatives also establish cooperation with partners outside Europe, in countries such as the United States, China, Japan, Canada, Mexico, Australia, South Korea, and the United Arab Emirates. At the same

Arkadiusz Michał Kowalski252
time, 39 cluster initiatives (29% of the total number) declared participation in inter-national cluster networks, chiefly the European Cluster Collaboration Platform (men-tioned by 11 initiatives).
These results can be compared with a study by A. M Kowalski (2013, p. 227) that covered 50 cluster initiative coordinators. In that study, 58% of respondents said that a cluster initiative they managed worked with a cluster abroad, including with part-ners from: Germany (mentioned by 15 Polish cluster initiatives); Spain (8); Italy (6); Austria and the United Kingdom (5 each); Finland, France, Latvia, Sweden, and Hun-gary (4 each); Belgium, Denmark, the Netherlands, Portugal, and Ukraine (3 each); the Czech Republic, Greece, and the United States (2 each); and Albania, Australia, Brazil, Bulgaria, India, Israel, South Korea, Mexico, Norway, New Zealand, Romania, Slovakia, Slovenia, Switzerland, and Turkey (1 each).
Policy measures for the internationalization of cluster initiatives
The growing popularity of clusters as a business model and their impact on inter-national competitiveness have encouraged public authorities to develop various eco-nomic policy instruments aimed at supporting the development of cluster initiatives. The internationalization of clusters as described in this chapter and the benefits of this process lead to a situation in which one of the most important types of interven-tion is programs to stimulate international cluster cooperation. Under the multi-level governance (MLG) principle followed in cluster policy in the European Union, actions of this kind were traditionally the responsibility of Community authorities. National governments, meanwhile, worked for the development of mature cluster structures with an established position on the market of a given country, while local authorities were responsible for supporting fledgling clusters that were only gaining a foothold on the local market. In practice, competences at various levels of government over-lap and activities for the internationalization of clusters are also implemented at the national and regional levels; it is important that they are complementary to EU ini-tiatives. According to the EU Committee of the Regions (Committee of the Regions, 2011), it is possible to combine efforts to develop business cluster operations in a given area with cooperation with cluster initiatives in other EU member states as well as non-European nations. In essence, a cluster deeply rooted in a region has sufficient potential to achieve a competitive advantage on a global scale. While cooperation be-tween cluster initiatives as part of the European Union is indispensable, it should also open vistas for cooperation with clusters from other continents.

Chapter 15. The Internationalization of Polish Business Clusters 253
European Strategic Cluster Partnerships Going International (ESCP-4i) is a major European initiative for the internationalization of clusters. The initiative is the re-sult of the Cluster Go International measure being implemented as part of the EU’s Framework Programme for the Competitiveness of Small and Medium-Sized Enter-prises (COSME 2014–2020). The aim of these partnerships is to develop cross-border and cross-sector cooperation of clusters and networks that could lead to the creation of new value chains and to the development of solutions responding to major societal challenges. It is important that they focus on the development and implementation of a common strategy for the internationalization of clusters extending beyond Europe and covering markets around the world. The European Commission has supported 24 European Strategic Cluster Partnerships, which were presented at a meeting of clus-ters in Brussels on March 8, 2016. Polish clusters are part of only five of these part-nerships, as shown in Table 15.2.
Policy measures promoting the internationalization of clusters are also impor-tant in Polish cluster policy at the national level. In the 2014–2020 financial frame-work, a key element of this policy is identifying and focusing public support on Key National Clusters (KKK), which are cluster initiatives of key importance to the econ-omy and with high international competitiveness that have been selected on a com-petitive basis. Requirements with regard to KKKs include the presence of a cluster and cluster companies on foreign markets as well as recognition at home and abroad. Also, a special economic policy instrument known as Measure 2.3.3 “International-ization of Key National Clusters,” which is being implemented as part of Operation-al Programme Smart Growth 2014–2010 (OP SG), is dedicated to KKKs. This tool is designed to support comprehensive services to make it easier for companies belong-ing to a cluster initiative to bring their products to foreign markets, thus encouraging cluster members to establish cooperation with foreign partners. The fact that direct support for initiatives designated as KKKs focuses on supporting their international-ization shows the high importance that national cluster policy makers attach to this particular form of business cluster.
Conclusion
The analysis in this section shows that internationalization is becoming a key di-rection in the development of clusters, which are beginning to go beyond their local frameworks for cooperation and are entering into international cooperation networks, in many cases becoming an important part of global value chains. The research shows that one of the benefits that cluster members derive from participation in a cluster

Arkadiusz Michał Kowalski254
Tabl
e 15
.2 E
urop
ean
Stra
tegi
c Cl
uste
r Pa
rtne
rshi
ps –
Goi
ng In
tern
atio
nal (
ESCP
-4i),
incl
udin
g cl
uste
rs fr
om P
olan
d
Acro
nym
Nam
e of
ESC
P-4i
Sect
or/s
cope
Part
icip
atin
g co
untr
ies
Polis
h pa
rtic
ipan
tTa
rget
mar
kets
Num
ber
of S
MEs
ECCA
Euro
pean
Cir
cula
r Co
nstr
uctio
n Al
lianc
e
Cons
truc
tion,
su
stai
nabl
e co
nstr
uctio
n,
rene
wab
le e
nerg
y
Slov
enia
, Pol
and,
Sp
ain
Balti
c Cl
uste
r Se
Ener
gia,
Ko
łobr
zeg
Chin
a, In
dia,
Mex
ico
400
SPAC
E2ID
Spac
e Cl
uste
rs
Inte
rnat
iona
l In
dust
rial
D
iver
sific
atio
n
Aero
spac
e, s
atel
lite
tech
nolo
gy,
tran
spor
t, lo
gist
ics
Fran
ce, B
elgi
um (2
), Sp
ain
(2),
Italy
(2),
Gre
ece,
Pol
and
Inte
llige
nt
Tran
spor
tatio
n Sy
stem
s Cl
uste
r
to b
e de
fined
243
NAT
URE
EFN
atur
al R
esou
rce
Effic
ient
Eur
ope
– N
atur
eef E
SCP
Envi
ronm
enta
l en
gine
erin
g,
envi
ronm
enta
l se
rvic
es, r
esou
rce
effic
ienc
y,
chem
istr
y
Spai
n, C
zech
Re
publ
ic, B
ulga
ria,
Po
land
, Hun
gary
, D
enm
ark,
Ger
man
y,
Fran
ce, P
ortu
gal
Wes
t Pom
eran
ian
Chem
ical
Clu
ster
“G
reen
Che
mis
try,
” Sz
czec
in
Chile
, Chi
na,
Colo
mbi
a, M
exic
o,
Peru
, Phi
lippi
nes
546
PERE
SRa
ilway
Pro
mot
ing
Euro
pean
Rai
lway
Ex
celle
nce
Out
side
EU
Rail
sect
or,
tran
spor
t & lo
gist
ics
Italy
, Fra
nce,
Uni
ted
King
dom
, Ger
man
y (3
), Po
land
, Spa
in
Sout
hern
Rai
lway
Cl
uste
r, Ka
tow
ice
Braz
il, C
anad
a,
Chin
a, C
olom
bia,
In
dia,
Iran
, Mex
ico,
O
man
, Qat
ar, S
audi
Ar
abia
Uni
ted
Arab
Em
irat
es, U
nite
d St
ates
1,00
0
SeaM
ICI
Seab
ed M
inin
g cl
uste
rs fo
r SM
Es
Inte
rnat
iona
lizat
ion
Extr
actio
n of
raw
m
ater
ials
from
the
seab
ed, p
rodu
ctio
n an
d tr
ansm
issi
on o
f oi
l and
gas
Fran
ce (2
), U
nite
d Ki
ngdo
m, P
olan
dW
est P
omer
ania
n M
ariti
me
Clus
ter,
Szcz
ecin
to b
e de
fined
790
Sour
ce: E
urop
ean
Clu
ster
Col
labo
rati
on P
latf
orm
, htt
p://
ww
w.c
lust
erco
llabo
rati
on.e
u [a
cces
sed
Aug
. 23,
201
6].

Chapter 15. The Internationalization of Polish Business Clusters 255
initiative is greater opportunities to find partners abroad and participate in interna-tional projects. This process results in better access to markets in different countries and a higher level of exports as well as access to innovative technology and global sources of knowledge and information. Another benefit of cluster development in the context of international cooperation is that it increases the locational advantages of regions and helps them attract foreign direct investment, which plays a significant role as economies strongly compete for external capital. This is important in the quest for new sources of a competitive advantage for Poland as many traditional factors con-ducive to investment in the country, such as cheap labor, are declining. On the other hand, the concentration of foreign direct investment in specific regions may imply the development of cluster structures such as the Aviation Valley in Poland’s Podkar-packie province.
The role of instruments aimed at supporting cluster initiatives in Polish economic policy has grown over the past decade or so. In the 2014–2020 programming period, the internationalization of clusters is a key area of support. It is at the center of Meas-ure 2.3.3 of OP SG, “Internationalization of Key National Clusters.” EU cluster policy is evolving in a similar way, based on a transfer of emphasis from supporting the local development of cluster initiatives to stimulating cross-border cooperation of clusters. At the moment, the most important policy measure in this area is European Strategic Cluster Partnerships Going International. Polish cluster initiatives were part of only five such partnerships among the 24 that were in operation in 2016. This shows that Polish clusters have limited involvement in EU international cooperation programs, and that the potential offered by the internationalization of cluster initiatives has yet to be fully exploited in the country.
Overall, the research conducted makes it possible to formulate recommendations for cluster policy in order to provide increasingly stronger support for Polish clusters as they undertake international cooperation, in particular by strengthening their position in global value chains. Experience in this area so far confirms the potential of Polish entities in establishing business relations with foreign partners, and it also shows that they can derive a range of economic benefits as a result. These include a stepped-up transfer of knowledge and modern technology. In the context of the main subject matter of this report, it should be pointed out that support for interna-tional cooperation between clusters, for example as part of EU programs, can be an effective means of internationalizing the economy and can contribute to enhancing its global competitiveness.
In conclusion, it is necessary to note that there are limitations to the research be-cause the issue of clusters, in particular their internationalization, is a relatively new research area. One of the most important barriers in the study of clusters is a lack of

Arkadiusz Michał Kowalski256
sufficiently long time series of statistical data that would enable dynamic analysis of cluster development processes. Cluster development is a process that did not begin in Poland until the country joined the European Union in 2004. At the same time, this subject has broad prospects for continued research, which should to a large extent focus on the international dimension of cluster structures. In particular, it is neces-sary to analyze the position of clusters in global value chains and to identify ways of strengthening this position with cluster policy instruments.
References
Aiginger K., Vogel, J. (2015), Competitiveness: from a misleading concept to a strategy support-ing Beyond GDP goals, Competitiveness Review, No. 25 (5), pp. 497–523.
Al-Laham A., Souitaris V., (2008), Network embeddedness and new-venture internationaliza-tion: analyzing international linkages in the German biotech industry, Journal of Business Venturing, 23 (5), pp. 567–586.
Andersson S., Evers N., Griot C., (2013), Local and international networks in small firm inter-nationalization: cases from the Rhône-Alpes medical technology regional cluster, Entrepre-neurship and Regional Development, 25 (9/10), pp. 867–888.
Bellandi M. (2001), Local development and embedded large firms, Entrepreneurship & Regional Development, 13 (3), pp. 189–210.
Buczyńska G., Frączek D., Kryjom P., (2016), Raport z inwentaryzacji klastrów w Polsce 2015, Polska Agencja Rozwoju Przedsiębiorczości, Warszawa.
Colovic A., Lamotte O., (2014), The role of formal industry clusters in the internationalization of new ventures, European Business Review, 26 (5), pp. 449–470.
Committee of the Regions (2011), Opinion on Common Strategic Framework for EU Research and Innovation Funding, Official Journal of the European Union, 2011/C 259/01, Brus-sels, 30 June 2011.
Dunning J. H. (2002), Regions, globalization and the knowledge-based economy: the issues stated, in: J. H. Dunning (ed.), Regions, Globalization and the Knowledge-Based Economy, Oxford University Press, Oxford.
Fernhaber S. S., Gilbert B. A., McDougall P. P., (2008), International entrepreneurship and geo-graphical location: an empirical examination of new venture internationalization, Journal of International Business Studies, 39 (2), pp. 267–290.
Gereffi G., Lee J. (2016), Economic and Social Upgrading in Global Value Chains and Industrial Clusters: Why Governance Matters, Journal of Business Ethics, 133 (1), pp. 25–38.
Hausner J., Kudłacz T., Szlachta J. (1998), Identyfikacja nowych problemów rozwoju regional-nego Polski, Polska Akademia Nauk, Wydawnictwo Naukowe PWN, Warszawa.

Chapter 15. The Internationalization of Polish Business Clusters 257
Humphrey J., Schmitz H., (2002), How Does Insertion in Global Value Chains Affect Upgrading in Industrial Clusters?, Regional Studies, 36, pp. 1017–1027.
Jankowska B., Główka C., (2016), Clusters on the road to internationalization – evidence from a CEE economy, Competitiveness Review, 26 (4), pp. 395–414.
Johanson J., Mattsson L. G. (2015), Internationalisation in industrial systems—a network approach, in: U. Holm, M. Forsgren, J. Johanson (eds.), Knowledge, Networks and Power. The Uppsala School of International Business, Palgrave Macmillan UK, pp. 111–132.
Knorringa P., Nadvi K. (2016), Rising power clusters and the challenges of local and global stand-ards, Journal of Business Ethics, 133 (1), pp. 55–72.
Kowalski A. M., (2013), Znaczenie klastrów dla innowacyjności gospodarki w Polsce, Szkoła Główna Handlowa w Warszawie – Oficyna Wydawnicza, Warszawa.
Kowalski, A. M., (2014), The role of innovative clusters in the process of internationalization of firms, Journal of Economics, Business and Management, 2 (3), pp. 181–185.
Kowalski, A. M., (2015), Internationalization of firms. A Manual for Students, Warsaw School of Economics.
Kowalski, A. M., (2016), Territorial location of ICT cluster initiatives and ICT-related sectors in Poland, in: H. Drewello, M. Bouzar, M. Helfer (eds.): Clusters as a Driving Power of the European Economy, Nomos, Baden-Baden, pp. 49–66.
Libaers D., Meyer M., (2011), Highly innovative small technology firms, industrial clusters and firm internationalization, Research Policy, 40 (10), pp. 1426–1437.
Los, B., Timmer, M. P., Vries, G. J. (2015), How global are global value chains? A new approach to measure international fragmentation, Journal of Regional Science, 55 (1), 66–92.
Musso F., Francioni B., (2015), Agri-Food Clusters, Wine Tourism and Foreign Markets. The Role of Local Networks for SME’s Internationalization, Procedia Economics and Finance, 27, pp. 334–343.
Nadvi K., Halder G., (2005), Local clusters in global value chains: exploring dynamic link-ages between Germany and Pakistan, Entrepreneurship & Regional Development, 17 (5), pp. 339–364.
Nielsen K., Jørgensen S. B., Nielsen M. D., (2016), Towards New Cluster Internationalisation Mod-els–lessons learned from the Danish clusters, in: H. Drewello, M. Bouzar, M. Helfer (eds.), Clusters as a Driving Power of the European Economy, Baden-Baden: Nomos, pp. 176–197.
Ponte S., Sturgeon, T. (2014), Explaining governance in global value chains: A modular theo-ry-building effort, Review of International Political Economy, 21 (1), pp. 195–223.
Porter M. E. (1990), The competitive advantage of nations, Free Press, New York.Porter M. E. (2008), On Competition. Updated and Expanded Version, A Harvard Business Review
Book, Boston.Rabellotti R., Carabelli A., Hirsch, G. (2009), Industrial districts on the move: where are they
going?, European Planning Studies, 17 (1), pp. 1–41.
Arkadiusz Michał Kowalski258
Weresa M. A., (2015), Innovation and sustainable competitiveness: evidence from Poland, Inter-national Journal of Transitions and Innovation Systems, No. 4 (3-4), pp. 150–163.
Weresa M. A., (2016a), The Competitiveness of EU Member States from Central and Eastern Europe in 2007–2014, Competitiveness of CEE Economies and Businesses, Springer International Publishing, pp. 3–23.
Weresa M. A., (2016b), Innowacje a koncepcja zrównoważonej konkurencyjności – przypadek Polski, Studia Prawno-ekonomiczne, vol. XCVIII, pp. 293–311.
Zucchella A., (2006), Local cluster dynamics: trajectories of mature industrial districts between decline and multiple embeddedness, Journal of Institutional Economics, 2 (1), pp. 21–44.

Summary and Conclusions


The Internationalization of the Polish Economy and Changes
in Its Competitive Position 2010–2016
Marzenna Anna Weresa
This book explores the competitiveness of the Polish economy and how and why it changed from 2010 to 2016. In analyzing Poland’s competitiveness, we primarily focus on the macroeconomic level, which means the level of the economy and its links with the global marketplace.
There are many definitions of competitiveness used in research studies, and var-ious methods are applied to measure it. The approach proposed in this book seeks to determine Poland’s competitive position based on many years of comparative re-search conducted at the World Economy Research Institute of the Warsaw School of Economics (SGH). In this approach, competitiveness refers to a country’s macroeco-nomic situation, changes in the productivity of resources, the efficiency of institu-tions, and the development of the country’s links with the global market. Seen from this perspective, competitiveness is the result of interaction of government and cor-porate-sector activities in a country. The goal is for the economy to actively adapt it-self to changing economic and technological conditions in order to ensure sustained economic growth and derive the greatest possible benefits from participation in the international division of labor, while maintaining social and environmental sustain-ability. The notion of competitiveness defined in this way, sometimes referred to as “sustainable competitiveness,” goes beyond the realm of economic performance and takes into account social and environmental aspects that enhance the well-being of so-cieties. The benchmark for determining a country’s competitiveness is other countries with similar characteristics. The analysis takes into account their economic growth and level of development as well as their position on international markets in trade (advantages in foreign trade) and the exchange of factors of production (capital, labor, and technology).
By adopting such a conceptual framework, the book identifies Poland’s compet-itive position in comparison with other EU member states, especially those in Cen-tral and Eastern Europe. The analysis seeks answers to the following questions: How did the competitive position of the Polish economy change from 2010 to 2016? What

Marzenna Anna Weresa262
factors determined these changes? And to what extent, if at all, does Poland make use of international cooperation—especially from the point of view of the internation-alization of its national innovation system—to build its competitive position? What are the recommendations for economic policy makers that result from the analysis of changes in Poland’s competitiveness in the studied six-year period?
The analyses conducted in the book show that Poland’s position in the EU, as meas-ured by its share in the total EU GDP by purchasing power parity standards (PPS), in-creased by only 0.5 percentage point in the 2010–2016 period, rising from 4.7% to 5.2%. This slight improvement was a result of slower economic growth in 2010–2016, with the average annual GDP growth rate for Poland at 3.1%, 1 percentage point less than in the post-accession period (2004-2016) as a whole. Poland lost its position as the fastest-growing economy among EU member states in Central and Eastern Europe. Its 2016 growth rate was 2.8%, less than in Romania, Bulgaria, or Slovakia. As a re-sult, the rate at which Poland is catching up with more developed EU economies has decelerated.
In 2016, Poland’s GDP per capita in PPS terms stood at 65% of the EU15 average, up from 57% in 2010. This means that during the six-year period of 2010–2016 Po-land’s development gap with the EU15, measured by GDP per capita, narrowed by 8 percentage points, whereas in the previous six-year period directly following Poland’s EU entry (2004-2010), the gap had decreased by 14 percentage points. The process of real convergence in Poland was the fastest with regard to Britain, Italy, and Greece. In 2015, Poland outperformed this last country in terms of GDP per capita.
Taking into account the social dimension of competitiveness, it is necessary to refer to the general level of household income distribution as measured by the so-called Gini coefficient. Poland is among countries with considerable income inequality. Its Gini coefficient was 30.6 in 2015, but income inequality in the country has decreased steadily since 2010. Moreover, Poland has improved its position relative to the EU average. In 2010, income inequalities in Poland were greater than on average in the EU28, while in 2015 they were lower than the EU28 average. The changes in income inequality were influenced by factors including remittances from Polish people living and working in other EU countries. As shown by an analysis in Chapter 3, the distri-bution of these remittances is highly uneven; however, they predominately benefit higher income groups. Foreign transfers have contributed to a reduction in income inequality, and their role is growing in Poland.
Social development can also be measured by the more general Social Progress Index (SPI), which encompasses both social and environmental aspects. The index combines three dimensions: basic human needs, foundations of well-being, and oppor-tunity to progress (Porter et al., 2016, p. 32). Economic results are not part of the SPI,

TheInternationalizationofthePolishEconomyandChangesin ItsCompetitivePosition2010–2016 263
so the indicator makes it possible to assess social progress and environmental issues directly while excluding economic aspects (Porter et al., 2016, p. 35). Nevertheless, it should be noted that economic growth and social progress are interrelated, though this relationship is not linear. Empirical studies confirm the positive and strong cor-relation between social progress and GDP per capita. The correlation coefficient be-tween GDP per capita and the SPI, calculated for 133 countries, was 0.78 in 2014 (Porter et al., 2015, p. 18) and 0.89 in 2015 (Porter et al., 2016, p. 72). This correlation is also in evidence in EU member states, including those in Central and Eastern Europe (the Pearson correlation coefficient between GDP per capita in purchasing power stand-ard (PPS) terms and the SPI index was 0.84 in 2016; see also: Weresa, 2016, p. 248). The SPI was calculated for the first time in 2015, so no long time series are available that would allow cross-country comparisons over a longer term. Available data in-dicate that Slovenia led the CEE region in terms of the social and environmental di-mensions of competitiveness covered by the SPI index, ahead of the Czech Republic, Estonia, and Poland. Poland was in 18th place among all EU member states in 2016 in terms of the SPI, two positions lower than in a competitiveness league table compiled by the World Economic Forum. The importance of social and environmental factors for the competitiveness of economies is also reflected by the correlation between the SPI index and the World Economic Forum’s Global Economic Competitiveness Index (GCI); the index was 0.82 for EU countries in 2016 (Figure 16.1).
Figure 16.1. The correlation between social and environmental factors and competitiveness in the EU in 2016
Germany
NetherlandsSweden UK
FinlandDenmark
BelgiumAustria
FranceLuxembourg
IrelandEstonia
Czech RepublicSpain
Lithuania PolandMalta
Italy
PortugalLatvia
Bulgaria
SloveniaRomania SlovakiaHungary
Croatia
CyprusGreece
0
1
2
3
4
5
6
7
8
70 75 80 85 90 95
Glo
bal C
ompe
titiv
enes
s In
dex
(GCI
) 201
6
Social Progress Index (SPI), 2016
Source: Own study based on data by Porter et al., 2016, pp. 50–51 and WEF, 2016, p. 7.

Marzenna Anna Weresa264
When evaluating the competitiveness of the Polish economy—and seeking an answer to the research question about changes in the country’s competitive position from 2010 to 2016-it is worth tracking the evolution of the Global Competitiveness Index (GCI) computed by the World Economic Forum (Figure 16.2). It turns out that Poland’s competitiveness index increased only slightly in the 2010–2016 period (from 4.51 to 4.56). Some other EU countries improved their competitiveness faster than Poland. Spain and Lithuania were ranked higher Poland in terms of competitiveness during the 2010–2016 period. Poland slipped from 14th to 16th place in the EU, while advancing from 39th to 36th position1 among all 138 analyzed economies worldwide in 2010–2016 (WEF, 2010 p. 15; WEF, 2016, p. 7). Among EU countries in Central and Eastern Europe, Slovakia improved its competitiveness at a slower rate in the analyz-ed period, while Slovenia and Hungary saw their GCIs worsen. Latvia, Bulgaria, and Lithuania led the way in the CEE region in terms of the rate at which they improved their competitiveness, while Estonia and the Czech Republic remained the most com-petitive economies in the region, ranking 12th and 13th in the EU28 respectively.
Overall, Poland’s competitive position weakened slightly from 2010 to 2016 com-pared with other EU countries despite some positive trends such as growing GDP per capita, a continued process of income convergence with developed Western European economies, and slight progress in social and environmental aspects.
Why did Poland see its competitive position deteriorate among EU member states in the studied period? Two groups of determining factors are analyzed in this book: material and intangible resources, on the one hand, and institutional conditions and economic policy, on the other.
As shown in Chapter 6, the Polish economy recorded diverse trends in terms of how institutional factors shaped its competitive advantages from 2010 to 2016. On the whole, these changes failed to strengthen the country’s competitiveness. Poland’s market economy is characterized by institutional inconsistency; in the period ana-lyzed in the book, the country did not manage to reduce the role of government and limit the size of the public sector (the share of public expenditure in GDP continued to run at more than 40% and was almost twice as high as in peer economies with similar levels of development—see Chapter 6). The weakening role of institutional factors in building the competitiveness of the Polish economy in the 2010–2016 peri-od is reflected in the World Economic Forum rankings. In terms of the institutional pillar of competitiveness, Poland slid from 54th place in 2010 to 65th position in 2016. Estonia (ranked 23 rd globally in 2016) leads the charge among EU members in Cen-tral and Eastern Europe according to the development of institutions, and Lithuania,
1 Poland trails countries such as China, Chile, and Thailand, and Azerbaijan is just behind Poland.

TheInternationalizationofthePolishEconomyandChangesin ItsCompetitivePosition2010–2016 265
the Czech Republic, Slovenia, and Latvia were also ahead of Poland in 2016. Moreo-ver, the Czech Republic, Lithuania, and Latvia made significant progress in terms of institutional performance from 2010 to 2016; in 2010, these countries were still be-hind Poland in this area (WEF, 2010, pp. 18–19; WEF, 2016, pp. 46–47). Poland saw the opposite trends at work.
Figure 16.2. Poland’s position compared with other EU countries in the World Economic Forum’s competitiveness ranking: 2010 vs. 2016
−1 0 1 2 3 4 5 6
GreeceCyprusCroatia
HungarySlovakia
RomaniaSloveniaBulgaria
LatviaPortugal
ItalyMalta
PolandLithuania
SpainCzech Republic
EstoniaIreland
LuxembourgFranceAustria
BelgiumDenmark
FinlandUK
SwedenGermany
Netherlands
change of GCI 2010-2016 GCI 2016 GCI 2010
Source: Own study based on WEF data, 2010, p. 15, and WEF, 2016, p. 7.
As far as capital resources are concerned, there were diverse changes in how cap-ital was used in Poland from 2010 to 2016. The beginning of the analyzed period (2010-2013) saw a downward trend in the value of investment in Poland, mainly due to persistent negative implications of the global crisis in the world economy. Invest-ment outlays began to increase in 2014, but in 2015 this growth decelerated, and pre-liminary figures for 2016 indicated a fall in the value of investment outlays. These
Marzenna Anna Weresa266
fluctuations were due to factors such as reduced absorption of structural funds com-ing to Poland from the EU budget and uncertainty among businesspeople over de-velopment prospects. This hindered their investment expansion. Another factor was a decline in FDI inflows needed to supplement domestic savings. In 2012–2013, Po-land reported a record low FDI inflow; after a one-off increase in 2014, FDI dynamics declined again in 2015. Preliminary estimates show that in 2016 FDI ran at a similar level as in 2015, which means that Poland has managed to overcome a slump in the FDI inflow recorded in 2012–2013 (see Chapter 8). However, fluctuating domestic and foreign investment added to the weakening in Poland’s competitive position compared with other EU economies.
Unfavorable developments in human resources are another reason Poland’s com-petitiveness improved less markedly than expected, and even decreased compared with some countries. The rate of natural increase in Poland is gradually declining, and unfavorable changes are taking place in the age structure of society, with population aging and decreasing fertility rates leading to a deterioration in the country’s demo-graphic situation. The migration balance is negative, with the balance of migrations for permanent residence abroad negative since 2010, accompanied by an intensifying process of temporary emigration from Poland. All this leads to a situation in which labor resources are diminishing. On the other hand, steadily shrinking unemployment and growing labor productivity have had a positive impact on the economy’s com-petitiveness. However, wages have risen more rapidly than labor productivity since 2013, which implies an increase in unit labor costs, a process that harms opportunities to build competitive advantages based on low labor costs (see Chapter 9).
All this seems to indicate that Poland is having difficulty moving to an innova-tion-based model of competitiveness. Data on innovative activities undertaken by Polish enterprises show that Poland is well below the EU average in terms of inno-vation. This is due to factors including low R&D spending—roughly half that in the EU on average—and insignificant progress in this area from 2010 to 2016 (with R&D outlays as a percentage of GDP rising by only 0.27 p.p.). A positive trend, meanwhile, is a gradually changing structure of R&D expenditure: in 2010 business expenditure accounted for 28% of the country’s total R&D outlays, while by 2015 the figure had come to 46%. Nevertheless, the value of this expenditure is still too low to create the critical mass needed to significantly improve competitiveness. This is evidenced by a decreased proportion of small and medium-sized enterprises (SMEs) that introduce innovations. According to Eurostat data, only 17.2% of small and medium-sized en-terprises (SMEs) in Poland introduced innovations in 2010, down from 10.1% in 2015 (with the EU average at around 30%). On the other hand, there have been some pos-itive developments in patenting: the number of patent applications per 1 billion GDP

TheInternationalizationofthePolishEconomyandChangesin ItsCompetitivePosition2010–2016 267
in Poland increased from 0.36 in 2010 to 0.51 in 2015, yet it was still one-seventh of the EU average. These data, which offer a reasonable picture of changes in Poland’s innovativeness (see Chapter 10), show that innovations were not a factor of compet-itiveness for the Polish economy from 2010 to 2016.
To sum up this analysis of Poland’s competitiveness from 2010 to 2016, it is neces-sary to mention changes in total factor productivity (TFP). TFP growth decelerated in the country in the researched period. The average rate for 2010–2012 was 2%, fol-lowed by 0.7% in 2013–2015 and 0.9% in 2016 (see Chapter 11). This TFP dynamics is attributable to a combination of technological, organizational and other changes re-sulting from the development of human capital. However, it must be noted that the role of this factor decreased during the 2010–2016 period, with the contribution of TFP to growth still fairly high (at 29% on average from 2010 to 2016) though lower than in most other EU member states in the CEE region.
The internationalization of the Polish economy was another factor that influenced the country’s competitive position in the EU from 2010 to 2016. This prompts anoth-er research question: to what extent, if at all, does Poland make use of international cooperation—especially when it comes to the internationalization of its national in-novation system—to build its competitive position?
Some of the effects of internationalization on competitiveness have already been mentioned, but this impact tends to be multi-faceted. For example, international labor flows have a negative impact on the availability of human resources in Poland (negative migration balance), but they have a positive impact when it comes to the educational aspect of migration. They also have a beneficial effect on the whole on reducing in-come inequality thanks to foreign transfers, although further growth in these transfers could work in the opposite direction. Another sign of the internationalization of the Polish economy is its share in the international flows of productive capital. As noted earlier, the reduction in FDI inflows to Poland should be viewed as an unfavorable development because the country needs foreign capital to replenish insufficient do-mestic investment. However, despite its reduced inflow, FDI continues to play a sig-nificant in the economy. Foreign-owned enterprises are responsible for roughly half of Poland’s foreign trade. Moreover, as shown in this book, the inflow of FDI into Po-land has had a statistically significant and positive impact on the competitiveness of Polish exports (see Chapter 5).
The internationalization of the Polish economy, as measured by the size of its trade, steadily increased in the analyzed period of 2010–2015, and exports of goods and services grew at a faster rate than imports. As a result, Poland’s balance of trade has shown a surplus since 2015. The structure of Polish exports is gradually chang-ing, with the dominant role of processed goods and a growing role of intra-industry

Marzenna Anna Weresa268
trade. However, Poland has revealed comparative advantages primarily in the trade of medium-low and low-tech goods (such as “wood and articles of wood,” “live animals and animal products,” “food, beverages, alcohol and tobacco,” and “articles of stone, plaster, cement and glass”), with some medium-high-tech commodities (such as “ve-hicles, aircraft and watercraft”) also becoming a source of comparative advantages.
In 2010–2016, Poland’s revealed comparative advantage indicators improved in the trade of some groups of high-tech goods (such as “instruments and equip-ment”), although the country did not yet record an overall advantage in the trade of such goods. In the trade of services, meanwhile, Poland has the greatest revealed comparative advantages in services based on processing as well as in accounting, auditing and tax services; research and development services; and marketing ser-vices (see Chapter 4). Findings obtained at the macroeconomic level are confirmed by enterprise-level studies (see Chapter 14). They show that the cost advantage con-tinues to play a key role in the competitive strategies of enterprises in both Poland and other CEE countries, and that this advantage is mainly built through process in-novations. Competitive advantages on foreign markets resulting from product and marketing innovations promoting differentiation are rare. A link has also been found between the innovative activities of enterprises and their success in exports. Coop-eration in innovation, especially with foreign partners, leads to an increased inten-sity of new-product exports. This shows that the internationalization of innovative activities promotes the competitiveness of enterprises. However, the percentage of innovative Polish enterprises that undertake innovation cooperation with foreign partners has fallen by 5 p.p. since 2010. This inhibits the transfer of knowledge and erodes possibilities for using foreign achievements to build the competitiveness of the Polish economy. An in-depth analysis of this issue offered in Chapter 12 shows that the internationalization of Poland’s innovation system was insufficient and that no fundamental changes took place in this area from 2010 to 2016. Poland was lag-ging behind most other EU member states, including those from Central and East-ern Europe, in internationalization indicators. Although the importance of foreign sources of financing R&D activities in Poland increased in 2010–2016, this chiefly applied to EU structural funds.
Poland has been making limited use of funds available under EU programs to fur-ther international cooperation. Funding for research under the Horizon 2020 program, for example, was EUR 4 per resident on average in Poland, with the EU average nine times that, at around EUR 36 (see Chapter 14). Also small is the involvement of Pol-ish enterprises in foreign cooperation as part of clusters; only five Polish clusters are members of European Strategic Partnerships (see Chapter 15). The openness of the Polish innovation system as measured by cooperation in preparing scientific publi-

TheInternationalizationofthePolishEconomyandChangesin ItsCompetitivePosition2010–2016 269
cations with foreign researchers is also limited; their number per capita in Poland is just over half the EU average.
In conclusion, the analyses of the internationalization of the Polish economy con-ducted in this book show that—while Polish enterprises are increasingly involved in traditional forms of internationalization, such as foreign trade and the flow of fac-tors of production (FDI and worker migration)—more advanced forms such as inter-national cooperation in innovative and research activities are developing very slowly, and sometimes even regressing. In addition, Poland is making insufficient use of in-ternational business ties to stimulate innovation, as evidenced by most indicators de-scribing the internationalization of the national innovation system. These indicators have been growing slowly and sometimes they have even been declining. The impor-tance of internationalization in shaping the competitiveness of the Polish economy remains limited and did not change significantly in the 2010–2016 period.
The research results presented in the book make it possible to formulate recom-mendations for a policy of promoting competitiveness, in particular regarding the use of cooperation with foreign partners to create competitive advantages. In a situation in which resources, especially human resources, are diminishing—due to a combina-tion of demographic factors and the emigration of Polish workers to other EU coun-tries, accompanied by shrinking possibilities for competing on cost—it is necessary to make better use of new sources of competitiveness such as innovation and human capital. Therefore, investment in creating new knowledge and developing human capital should be the cornerstone of the policy of strengthening competitiveness. The main objectives of competitiveness policy should be to improve the quality of educa-tion at all levels, increase the intensity of R&D, strengthen the transfer of knowledge from science to business and use it for commercial purposes, and to ensure horizontal and vertical diffusion of innovation. However, these goals will not be achieved with-out improving the quality of institutions, reducing bureaucracy, liberalizing the labor market, and supporting the development of entrepreneurship. In addition, more sup-port is needed for cooperation with foreign partners with appropriate economic pol-icy tools—not only exports and FDI, but also more advanced forms of cooperation.
A key priority is to facilitate international research cooperation and encourage Polish enterprises to undertake innovation cooperation with foreign partners. There are currently strong wage imbalances in the research sector to the detriment of Polish research teams, and there is asymmetry in access to information. Another impediment is the lack of sufficient skills among Polish researchers to develop such cooperation on a larger scale and lead international consortiums. Changing this situation requires action to remove barriers limiting the interest and potential of Polish researchers and innovators to engage in international cooperation. Greater support is needed from

Marzenna Anna Weresa270
public funds for research and innovation cooperation with partners abroad, includ-ing better pay for R&D staff. Efforts in this area are necessary because an improved competitiveness of the Polish economy requires a transition to an innovation-driven model of development.
References
Porter M., Stern S., Green M. (2015), Social Progress Index 2015. Social Progress Impera-tive, Washington, http://www.socialprogressimperative.org/publication/2015-report/, accessed Nov. 10, 2016.
Porter M., Stern S., Green M. (2016), Social Progress Index 2016. Social Progress Imperative, Washington, http://www.socialprogressimperative.org/wp-content/uploads/2016/06/SPI-2016-Main-Report.pdf, accessed Feb. 20, 2017.
WEF, (2010), Global Competitiveness Report 2010–2011, World Economic Forum, Geneva.WEF, (2016), Global Competitiveness Report 2016–2017, World Economic Forum, Geneva.Weresa M. A. (2016), ÓAn Overall Assessment of Poland’s Competitiveness in 2015, in:
M. A. Weresa (ed.), Poland: Competitiveness Report 2016. The Role of Economic Policy and Institutions, Warsaw School of Economics Press, Warsaw, pp. 243–252.