sg weekly comm 2010 # aug 09sgcr.us/archive_reprts_2010/aug_2010/sg_weekly... · astro cycles work...
TRANSCRIPT

SG Capital , 9 Bartlet Street # 254 , Andover, MA 01810-2845.
Phone: 978.6623329
Research Note – Weekly Commentary MASG WKLY 2010 # Aug 09 By: Suneil R Pavse Contact: [email protected] __________________________________________________________________________________
We have picked up charts that has some distinct characteristics and values
from last weeks observation at Inflection points:
SPX, NYSE, AD-Oscillator, NDX, SML, CHINA.
GOLD, USD, EURO,CDN, AUD.
SPX – Closed @ 1128
Alert – 1st July “Buy Signal” via POM 12 @ SPX 1015 has ended on 9th
August via POM 14 @ SPX 1125
SPX – “Our Current Signals & Projections”
. • On 9
th Aug – POM 14 – Re run was triggered at 1125 –(Sell Signal).. We should see
another test of 1131 again soon and fail or decisive close below 1090 on weekly would be another way to look at it.
• On 1st July – POM 12 was triggered at 1015 ( Buy Signal )
• We have the weekly close below 1130, and Intermediate term market should remain below this on any rally bounces. Any move higher should be computed for detailed Bearish analysis..
• On completion of this bounce, we should get a next leg down. We do expect to see a return to that secular bearish trend at some point.
• Seasonality comparison
Last year the market’s normal seasonal pattern was over-whelmed last year by the massive stimulus and extra liquidity poured into the system to rescue it from collapse. Rather than a correction in the un-favorable season last year there was an continuing rally. This year , the normal seasonal pattern has returned this year. The market experienced a correction in February, which is historically the weakest month within the favorable season. It then rallied back in March and April for the resumption of the favorable season, reaching a new high for the year on April 23. And at that point it topped out, just 5 trading days before the historical “Sell in May and Go Away , then SPX experienced a correction of 16% to its low of July 2. The next normal seasonal effect was a rally in July, which is historically the strongest month within the un-favorable season.

SG Capital , 9 Bartlet Street # 254 , Andover, MA 01810-2845.
Phone: 978.6623329
If seasonality is to continue, the next pattern is that we are entering the three-month period of August, September, and October, which over the long-term tends to be the weakest period of the year. Of the individual months, August tends to be positive early on, but a month when the trend reverses. September tends to have the most consistent declines. October tends to be the most volatile (has seen the most crashes and mini-crashes). But on the positive side, October most often also sees the upside reversal from a low into the next favor-able season, and a big rally, particularly in the 2nd year of the Four-Year Presidential Cycle, which this is. Possibly the l seasonality be overwhelmed by government stimulus in the last half of the year as suggested some talk recently that the Fed will have to launch another round of stimulus, politically driven.
Market Insights
Tomorrow’s FOMC one-day meeting and the post-meeting communiqué . Our read on this is that they will do very little to the communiqué from the previous as the current economic conditions are roughly the same. This event has History of causing triple digit moves.
Geomagnetic storm - An explosion on the side of the sun facing Earth last Sunday sent a massive cloud of charged particles toward Earth, causing a geomagnetic storm. Once the storm subsided, the market sold off. This week, no significant storms are forecast. However, the effect of last week’s storm in triggering selling activity should extend through the week if it follows the historical pattern.
Astro cycles work most of the time but it is still a probability at all times. The short term cycles move quickly and must be used with pattern recognition and other tools to supplement. August 12th, followed by the 26th of August. This week is an important date because we have 3 major aspects to Venus forming. Venus opposition Uranus (the .618 Cycle 225/365), Venus opposition Jupiter and Venus square Pluto, Historically these aspects have been associated with negative moves in the market. August 12th is the first big date with probabilities suggest we will come down hard into Thursday. Should we go above 1,135 SPX it would suggest it could be a high. I am still sticking to my belief that one of these two aspects August 12th or August 26th will be of historic meaning. There is a new moon Tuesday so many things are happening in the sky for whatever its worth. ( NASA has been warning this for while ) . Apparently ( see below ) this coincides with our T – Termination on AD oscillator and Major Indices On past Friday, the SPX printed 1107 and right into wedge trendline support, and then promptly rallied back . The SPX Price levels remains at the end of Confluence Zone of Price Projections that have been projecting, another test of 1131 need to be completed, then a close below 1110 is the first conformation
• Market is banging between 2 different Setup 2 ‘s on 2 different time frame. The bigger
time frame is 11W & 34 W is under 1130 and 21 D & 50 D @ SPX 1085. This will continue
as the diffusion will be completed.
• Our expectation is the market wants to test 1130 and We would like to see the test of 1131
fail for good conformation . Also a decisive close below 1090 on weekly that will have
bearish conformation

SG Capital , 9 Bartlet Street # 254 , Andover, MA 01810-2845.
Phone: 978.6623329
Breadth Deteriorating, The advance-decline line Oscillator gives a more accurate picture that the standard advance-decline chart you might see. While the "standard" chart shows the advance-decline line moving to a new record high, the stocks-only line remains well off its highs.
Friday's despite the late comeback, it's likely just a warning shot that the uptrend from early July is in its last phase. We should get a down week this week, although the 1090 price level on SPX is likely to hold the lows first time. If the market is intent on fulfilling its time projection of a late August peak, this consolidation period could setup a last run to the upside, but risks are rising.
SPX – Hourly – Diagonal Triangle Pattern Last week we saw the market hit the ceiling on Thursday. This week, we should get a consolidation as the market pulls back to digest the gains of July. The end of the uptrend is likely to come no later than the end of August as the intermediate term Advance-Decline T expires. marking an boundary for this impulse to the upside. The immediate downside is 1090

SG Capital , 9 Bartlet Street # 254 , Andover, MA 01810-2845.
Phone: 978.6623329
SPX – Daily - Poly Trend Analysis We had a recovery high in SPX last week, but money flow failed to confirm it. And, that high represented not only a 61% retracement, but also a retest of the broken 2009 rally support line, now a resistance line. This could be a RIGHT SHOLDER below 1144. The possibility of a decline is growing stronger every day this market continues to walk on air. Although Late buying support the market from the hole, but last week’s midweek,top-down money flow indicated by moving lower on higher prices in the average that it’s very, very late in the game and the smart money is anxious to finish liquidating stocks.

SG Capital , 9 Bartlet Street # 254 , Andover, MA 01810-2845.
Phone: 978.6623329
SPX – Weekly – Intermediate term
The July rally has the major indexes back up to their 34-week MA, which is potential overhead resis-tance,

SG Capital , 9 Bartlet Street # 254 , Andover, MA 01810-2845.
Phone: 978.6623329
AD – Line
We are showing the Advance-Decline Line along with its Advance-Decline Oscillator. The two Ts project a double top. The second top is due on August 24th. The left side top occured a couple of weeks before its ideal date. If the right side top were two weeks early, it would occur on the 10th (Tuesday), so you can see that we are entering a very risky topping timeframe right now between 10
th to 24
th Aug.

SG Capital , 9 Bartlet Street # 254 , Andover, MA 01810-2845.
Phone: 978.6623329
SECTOR Analysis
Since the bottom on 1st
July to current, here is the relative strength of the sectors v/s SPX.
MATERIALS, ENERGY AND INDUSTRIALS LEAD MARKET and outperforming. Consumer staples, healthcare and finance are underperforming because they have the largest negative performance. This is not the ideal leadership picture for a broad market rally. Ideally, consumer discretionary, technology and finance would show upside leadership. Relative weakness in these three key groups is a concern.
This should be Ideal to measure against the Setup 2 Index , sector wise during the weak sectors on market fall in next decline

SG Capital , 9 Bartlet Street # 254 , Andover, MA 01810-2845.
Phone: 978.6623329
SECTORS
The Relative Strength. There we are comparing current indices starting from the beginning of the rally phase in early July, now five weeks old. As you can see, SOX is showing substantial weakness versus SPX, Since this index is almost always the first to show weakness in a topping market, we have our first big red flag that we are coming into a significant top. ( We demonstrated this in our last weeks report)
Second place on the weak list is a tie between the SML ( Small cap ) and XLF. Small caps represent the broad market and this is a sign of the traditional symptoms of a developing top---the blue chips advance while the troops (broad market) start retreating. The blue chips will hold the market up pricewise while the smart money sells into rallies to buy the large blue chips
This should be Ideal to measure against the Setup 2 Index , during the weak sectors on market fall in next decline
SOX / SPY
One of the first signs of a top has traditionally been a weakening in SOX and NDX indices. SOX is a great leading indicator, so we compute a relative strength ratio of it versus the SPX. When that line is falling, it means that SOX is weak compared to SPX. And, right now, that's definitely the case and a sign the market could be heading for a big fall:

SG Capital , 9 Bartlet Street # 254 , Andover, MA 01810-2845.
Phone: 978.6623329
RUT / SPX
Similarly, weakness in the RUT will generally precede a major market top. That may have already begun if our relative strength gauge for RUT versus SPX indicator

SG Capital , 9 Bartlet Street # 254 , Andover, MA 01810-2845.
Phone: 978.6623329
NYSE
This very similar to SPX therefore when 2 or 3 major Indices gives same signal, signal just becomes stronger. Short term bearish divergence in money flow warned. This coming week should see additional downside.

SG Capital , 9 Bartlet Street # 254 , Andover, MA 01810-2845.
Phone: 978.6623329
NDX
Our second best lead dog is NDX and the picture there is only marginally better than SOX. Last week, the index moved to a recovery high, but money flow failed to confirm the move, which is very bearish.

SG Capital , 9 Bartlet Street # 254 , Andover, MA 01810-2845.
Phone: 978.6623329
NASD – Short term Short-term the Nasdaq, like the Dow and other indexes, is overbought above its 21-day m.a. to a degree that most often brings a de-cline back down to at least retest the potential support at the m.a.at 2225, and in bull or bear markets often breaking below the m.a. short-term. That short-term situation.
NASD – Intermediate term The major indexes are in the vicinity of the potential overhead resistance at their intermediate-term 34 W MA. We still expect that moving average to be approxi-mate overhead resistance for the current short-term rally.

SG Capital , 9 Bartlet Street # 254 , Andover, MA 01810-2845.
Phone: 978.6623329
SML - Small cap This weaker then other indices banging against the trend lines resistance ( Last week we demonstated the IWM / SPY weakening ratio.

SG Capital , 9 Bartlet Street # 254 , Andover, MA 01810-2845.
Phone: 978.6623329
CHINA
China has been another lead indicator First in April to and then July bottom, but its usually 3 week ahead ( We have covered this in our earlier reports Now Major resistance lies overhead at the falling polytrendline. The 2700 price level appears to be unlikely to be exceeded if the market is able to make it that far. A substantial decline may be directly ahead.

SG Capital , 9 Bartlet Street # 254 , Andover, MA 01810-2845.
Phone: 978.6623329
GOLD
We had a initial support at 1170 for POM 13 as indicated in our earlier reports. And then a bounce we are evaluating how far this bounce could be for Re run of POM 14 . It should start to vibrate right side of the Poly trend. We will see how the USD bottoms out.

SG Capital , 9 Bartlet Street # 254 , Andover, MA 01810-2845.
Phone: 978.6623329
USD – DXY – Trend line & Pattern
This Global market is all about the Dollar move. Long term trend remains up into next few years as the value of the dollar rises against most other assets.
The dollar reached the downside tar-get of its 34-week m.a. We were watching for a potential POM 12, Area Around 80 should be good place to hold support for next leg up. We could see slightly below 80 to 79 to shake everyone out and then consolidation . But the next potential area of support looks to be at the trendline drawn through its 2008 and 2009 lows 76 , we would be very surprised if it gets there. .

SG Capital , 9 Bartlet Street # 254 , Andover, MA 01810-2845.
Phone: 978.6623329
USD – DXY – Waves
During the preceding leg up, DXY exhibited an extended first wave (which happens to be very bullish for the longer term). However, one of the characteristics of an extended first wave is that the retracement of that move tends to retrace all the way back to near the second wave’s bottom. That would take DXY back to the wave end labeled (2) in the chart (we’re in that general price area right now). That also corresponds to a 62% retracement of the entire move. We’re getting close, but the index is likely to require some time to base before turning up again. We also need to see the oscillator forming a higher low even as DXY forms a lower low. The most likely time would be the 3
rd week of August, which would correspond to the turn scheduled for the euro and
T in the stock market.
SG Capital , 9 Bartlet Street # 254 , Andover, MA 01810-2845.
Phone: 978.6623329
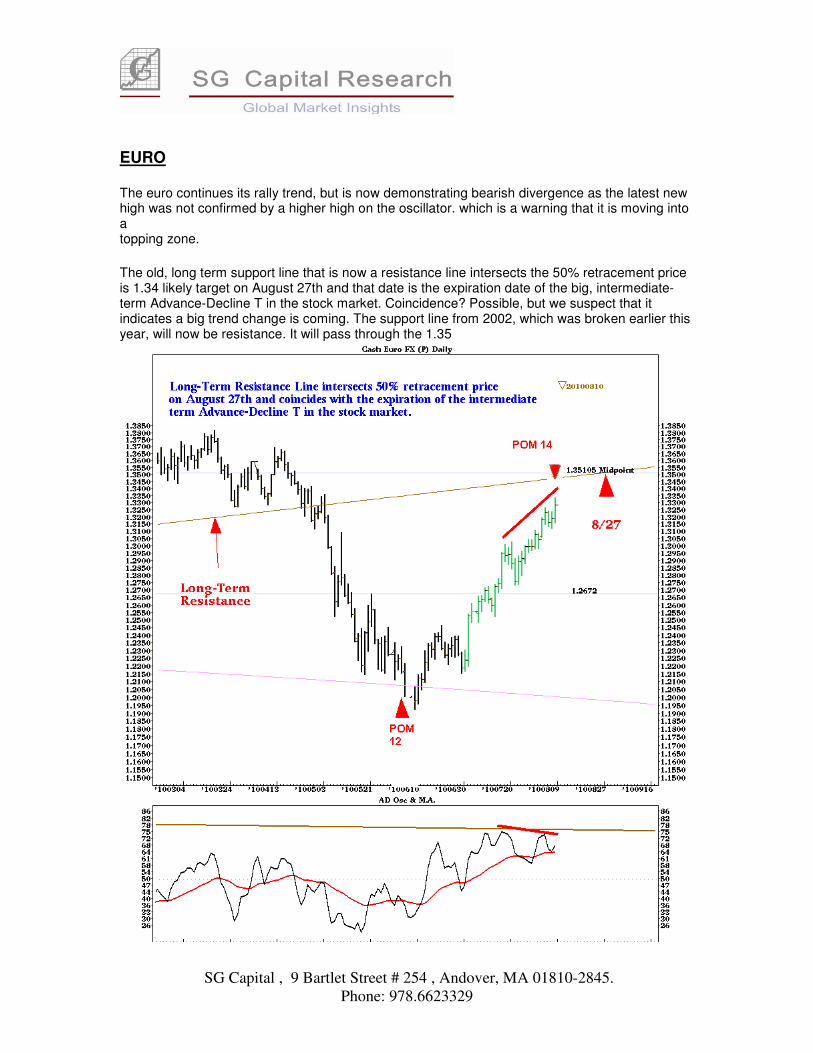
EURO
The euro continues its rally trend, but is now demonstrating bearish divergence as the latest new high was not confirmed by a higher high on the oscillator. which is a warning that it is moving into a topping zone.
The old, long term support line that is now a resistance line intersects the 50% retracement price is 1.34 likely target on August 27th and that date is the expiration date of the big, intermediate-term Advance-Decline T in the stock market. Coincidence? Possible, but we suspect that it indicates a big trend change is coming. The support line from 2002, which was broken earlier this year, will now be resistance. It will pass through the 1.35

SG Capital , 9 Bartlet Street # 254 , Andover, MA 01810-2845.
Phone: 978.6623329
EURO : CCI is also overbought at prices near confluence level 1.33/ 1.35.
EURO : Reverse poly trend line resistance.

SG Capital , 9 Bartlet Street # 254 , Andover, MA 01810-2845.
Phone: 978.6623329
CDN – Short term
Risk is to the low 90.

SG Capital , 9 Bartlet Street # 254 , Andover, MA 01810-2845.
Phone: 978.6623329
CDN – Intermediate Term
The path of least resistance is down in the intermediate term. The Top came in at Parity with US at Time termination at the TOP of the poly trend. Once on the Right side of the hump is more subject to decline.

SG Capital , 9 Bartlet Street # 254 , Andover, MA 01810-2845.
Phone: 978.6623329
AUD A huge risk in in the aussie. Around 93

SG Capital , 9 Bartlet Street # 254 , Andover, MA 01810-2845.
Phone: 978.6623329
This setting up little dangerously. .

SG Capital , 9 Bartlet Street # 254 , Andover, MA 01810-2845.
Phone: 978.6623329
Disclaimer : The information in this report has been taken from sources believed to be reliable but SG Capital Research does not warrant its accuracy or completeness. Any opinions expressed herein reflect our judgment at this date and are subject to change. This document is for private circulation and for general information only. It is not intended as an offer or solicitation with respect to the purchase or sale of any security or as personalized investment advice. SG Capital Research or its Author does not assume any liability for any loss which may result from the reliance by any person or persons upon any such information or opinions. These views are given without responsibility on the part of SG Capital Research or its officials. No part of this report may be reproduced in any manner as Author reserves the distribution rights. Under Copyright 2002 Act: It is a violation of federal copyright and imposes liability for such infringement.