sfecc purpose and need - transportation
TRANSCRIPT

June 2010
SOUTH FLORIDA EAST COAST (FEC)
ALTERNATIVES ANALYSIS
F.M. NO. 417031-1-22-01
CONTRACT: C-8F66
F FLO O E RT IDA ATS
D NE OP I
A T
R ATT
RM
OE PN ST NO AF R T
Prepared by:
SFECC Purpose and Need

SFECC Purpose and Need
1
11.. PPUURRPPOOSSEE && NNEEEEDD
CHAPTER HIGHLIGHTS
• The SFECCTA rail corridor is 85 miles long and operates in the historic economic core of South
Florida, connecting downtowns of large and small cities.
• Despite existing transit services in the tri-county area, traffic congestion is a major problem,
particularly on large north-south roads like I-95 and US-1 that parallel the FEC corridor.
• Regional land use and economic development efforts have been focused on the eastern
portions of South Florida, through which the FEC rail corridor travels.
• A new transit service would increase mobility, supplement transportation capacity, and increase
regionally supported development opportunities.
• Goals and objectives were created to guide the transit planning process.
11..11.. CCoorrrriiddoorr DDeessccrriippttiioonn
The South Florida East Coast Corridor Transit Analysis (SFECCTA) study area extends approximately 85
miles through the tri-county area of South Florida along the FEC Railway corridor (Figure 1-1). This
corridor represents the historic economic core of Southeast Florida that developed along the railroad,
and links highly urbanized CBDs of Miami, Ft Lauderdale, and West Palm Beach in addition to their
respective seaports and airports. The corridor includes residential, employment, recreational, cultural,
educational, medical, retail, and tourist uses. Due to its location and the demand for travel, the FEC
Railway corridor is included as part of Florida’s Strategic Intermodal System (SIS). Florida’s SIS is
comprised of statewide and regionally significant facilities and services for moving both people and
goods, and includes linkages that provide for smooth and efficient transfers between modes and major
facilities.
The Corridor’s Historical Background: The FEC Railway was initially built in the late 1880's to early
1900's by Henry Flagler to provide passenger and freight service along the east coast of Florida.
Passenger service along the FEC Railway into southern Florida continued until 1968 when it was
discontinued. Today, the FEC Railway continues to dispatch freight trains from its headquarters in St.
Augustine, sending trains along virtually the same route developed by Henry Flagler over 100 years ago.
Study Background: The Florida Department of Transportation (FDOT) initiated the SFECCTA study in
December 2005 as a multi-phased Alternatives Analysis (AA) employing a Tiered Programmatic
Environmental Impact Statement (PEIS) approach to transportation and environmental matters. At the
conclusion of the first tier, a Locally Preferred Alternative (LPA) had not been identified and a broad
SFECC Purpose and Need
2
range of modal alternatives remained under consideration. However, the FEC Corridor was identified as
the preferred corridor for a new transit service and the number of alternative modes had been refined.
As a result, FDOT and Federal Transit Administration (FTA) agreed the proposed study remain in early
scoping, consistent with the National Environmental Policy Act (NEPA) and discontinued the pursuit of a
tiered PEIS process. From that point on, the work, now in Phase 2, has advanced following the FTA Early
Scoping/Alternatives Analysis and FDOT Efficient Transportation Decision Making (ETDM) processes. A
NEPA Draft Environmental Impact Statement (DEIS) will not be prepared in Phase 2. The DEIS will follow
the selection of an LPA at the conclusion of Phase 2. This change in approach to project development
resulted in the Tier 1 Final PEIS document becoming an interim planning report, renamed the Final
Conceptual Alternatives Analysis/Environmental Screening Report (AA/ESR). An early scoping notice
announcing the availability of the Final Conceptual AA/ESR and the initiation of Phase 2 (AA/Early
Scoping) was published in the Federal Register on January 13, 2009 and in the Florida Administrative
Weekly on January 16, 2009.
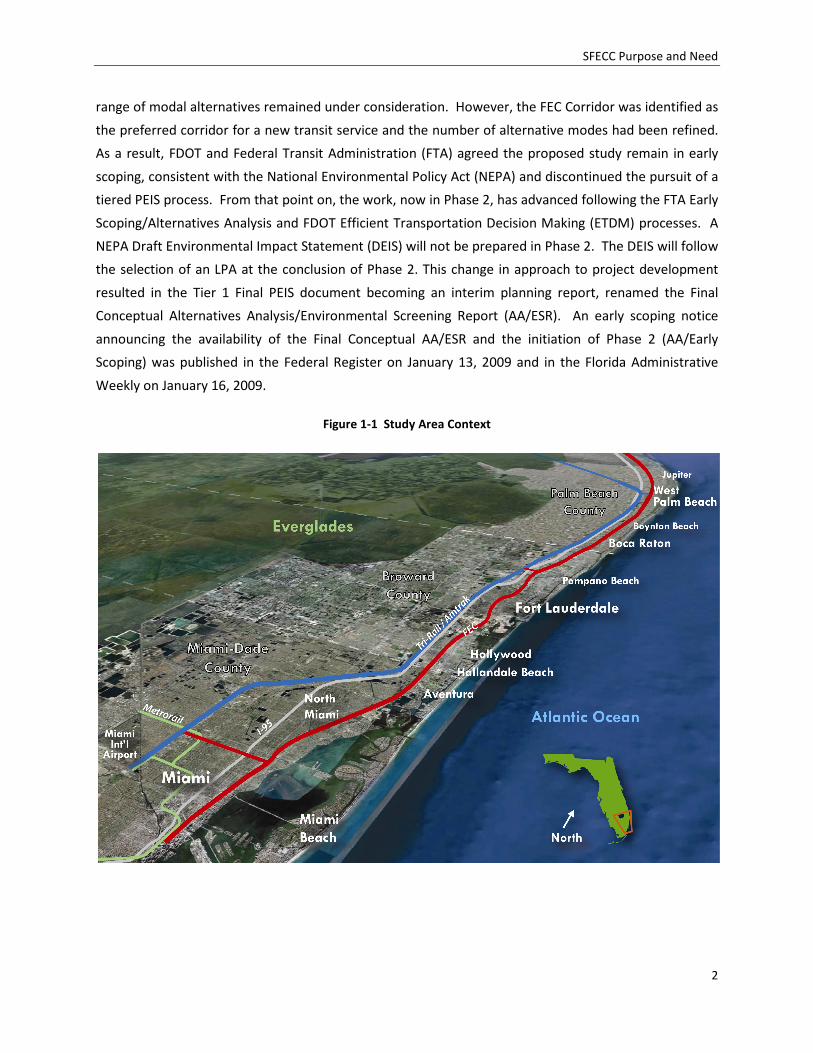
Figure 1-1 Study Area Context
SFECC Purpose and Need
3
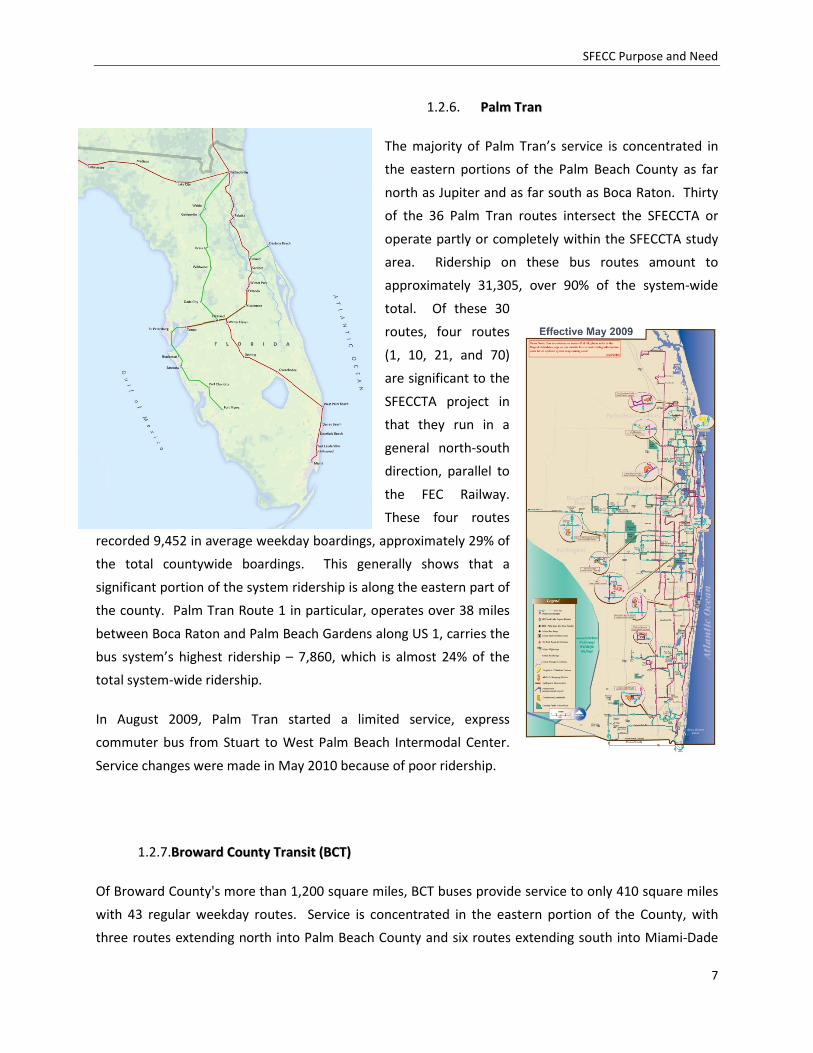
As seen in Figure 1-1, the South Florida region is
strongly oriented north-south, squeezed
between the Everglades on the west and the
Atlantic Ocean on the east. The FEC corridor
extends down the heart of the coastal ridge
and historically anchored the development of
the region’s oldest and densest towns and
cities. I-95 was built on the western edge of
these centers, and newer suburban
development has spread further west into the
Everglades.
11..22.. TTrraannssppoorrttaattiioonn FFaacciilliittiieess aanndd SSeerrvviicceess
iinn tthhee CCoorrrriiddoorr
1.2.1. EExxiissttiinngg HHiigghhwwaayy SSyysstteemm
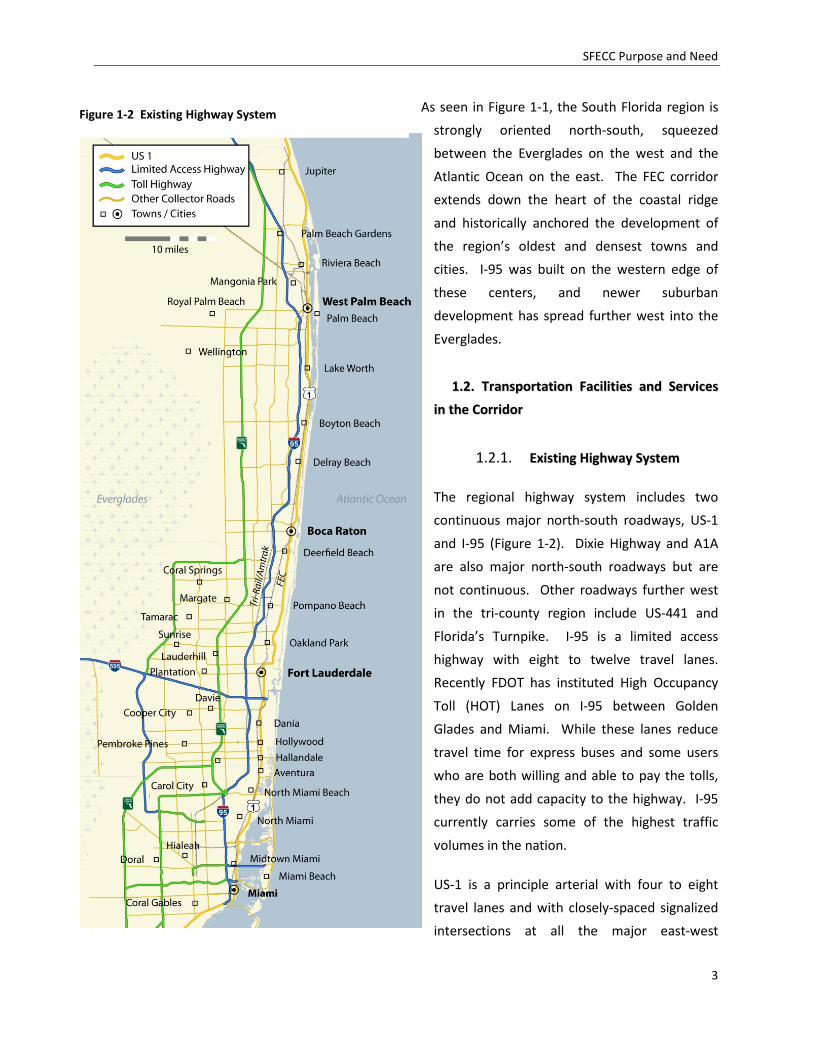
The regional highway system includes two
continuous major north-south roadways, US-1
and I-95 (Figure 1-2). Dixie Highway and A1A
are also major north-south roadways but are
not continuous. Other roadways further west
in the tri-county region include US-441 and
Florida’s Turnpike. I-95 is a limited access
highway with eight to twelve travel lanes.
Recently FDOT has instituted High Occupancy
Toll (HOT) Lanes on I-95 between Golden
Glades and Miami. While these lanes reduce
travel time for express buses and some users
who are both willing and able to pay the tolls,
they do not add capacity to the highway. I-95
currently carries some of the highest traffic
volumes in the nation.
US-1 is a principle arterial with four to eight
travel lanes and with closely-spaced signalized
intersections at all the major east-west
Figure 1-2 Existing Highway System
SFECC Purpose and Need
4
arterials. Additional turn lanes for both left and right hand turns are provided at these intersections.
Though there are typically sidewalks along US 1, they are narrow and immediately adjacent to speeding
travel lanes. Intersections are significant barriers to walking because there are so many lanes to
negotiate.
1.2.2.EExxiissttiinngg TTrraannssiitt SSeerrvviicceess
There are several public transportation providers currently in operation in South Florida. Palm Beach
County operates Palm Tran bus services, Broward County operates Broward County Transit (BCT) bus
services, and Miami-Dade County operates Miami-Dade Transit (MDT) bus, Metrorail and Metromover
services. South Florida Regional Transportation Authority (SFRTA) operates Tri-Rail commuter rail
services Amtrak also provides intercity passenger rail service connecting to Central Florida and beyond.
Figures X.3 and X.4 show existing bus routes and fixed-guideway transit, respectively.
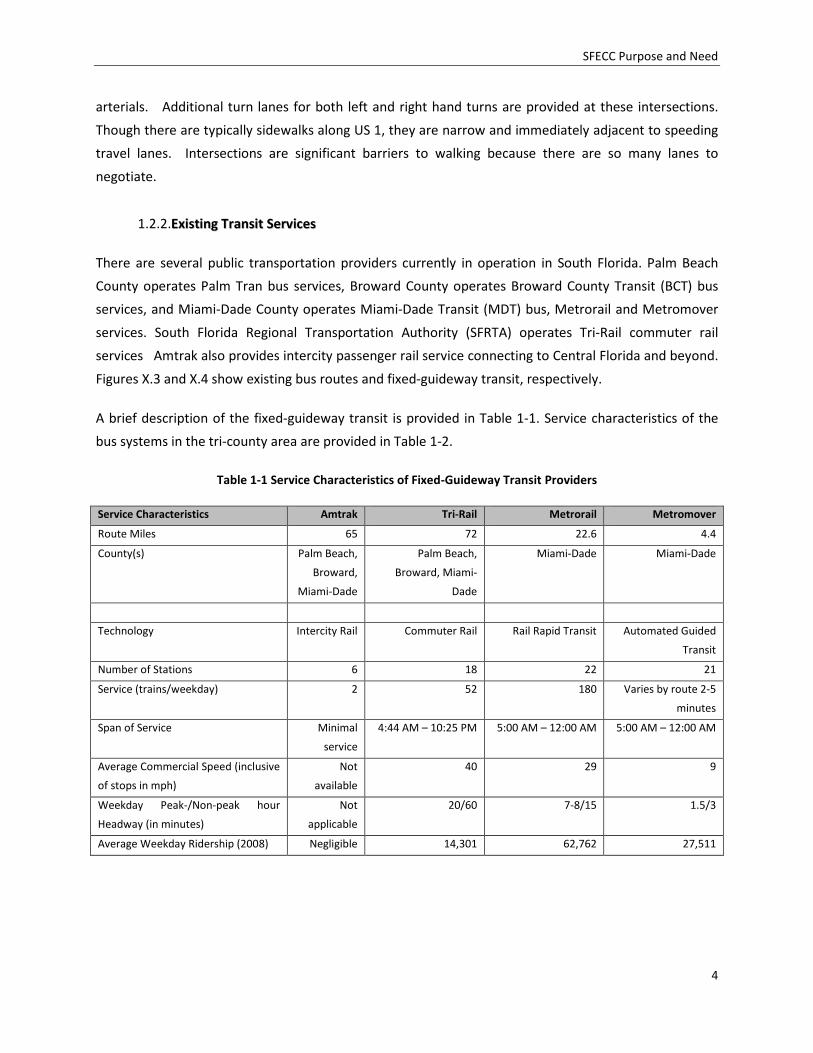
A brief description of the fixed-guideway transit is provided in Table 1-1. Service characteristics of the
bus systems in the tri-county area are provided in Table 1-2.
Table 1-1 Service Characteristics of Fixed-Guideway Transit Providers
Service Characteristics Amtrak Tri-Rail Metrorail Metromover
Route Miles 65 72 22.6 4.4
County(s) Palm Beach,
Broward,
Miami-Dade
Palm Beach,
Broward, Miami-
Dade
Miami-Dade Miami-Dade
Technology Intercity Rail Commuter Rail Rail Rapid Transit Automated Guided
Transit
Number of Stations 6 18 22 21
Service (trains/weekday) 2 52 180 Varies by route 2-5
minutes
Span of Service Minimal
service
4:44 AM – 10:25 PM 5:00 AM – 12:00 AM 5:00 AM – 12:00 AM
Average Commercial Speed (inclusive
of stops in mph)
Not
available
40 29 9
Weekday Peak-/Non-peak hour
Headway (in minutes)
Not
applicable
20/60 7-8/15 1.5/3
Average Weekday Ridership (2008) Negligible 14,301 62,762 27,511
SFECC Purpose and Need
5
Table 1-2: Service Characteristics of Bus Transit Providers in the Southeast Florida
Service Characteristics Palm Tran Broward Transit Miami-Dade Transit
Number of Routes 36 43 90+
County(s) Palm Beach Broward Miami-Dade
Span of Service 5:00 AM – 11 PM 4:40 AM – 12:40 AM 5:00 AM – 1 AM
Range of Service Frequency (in minutes) 15 to 60 15 to 45 15 to 60
Average Weekday Ridership (2008) 33,057 95,782 132,784
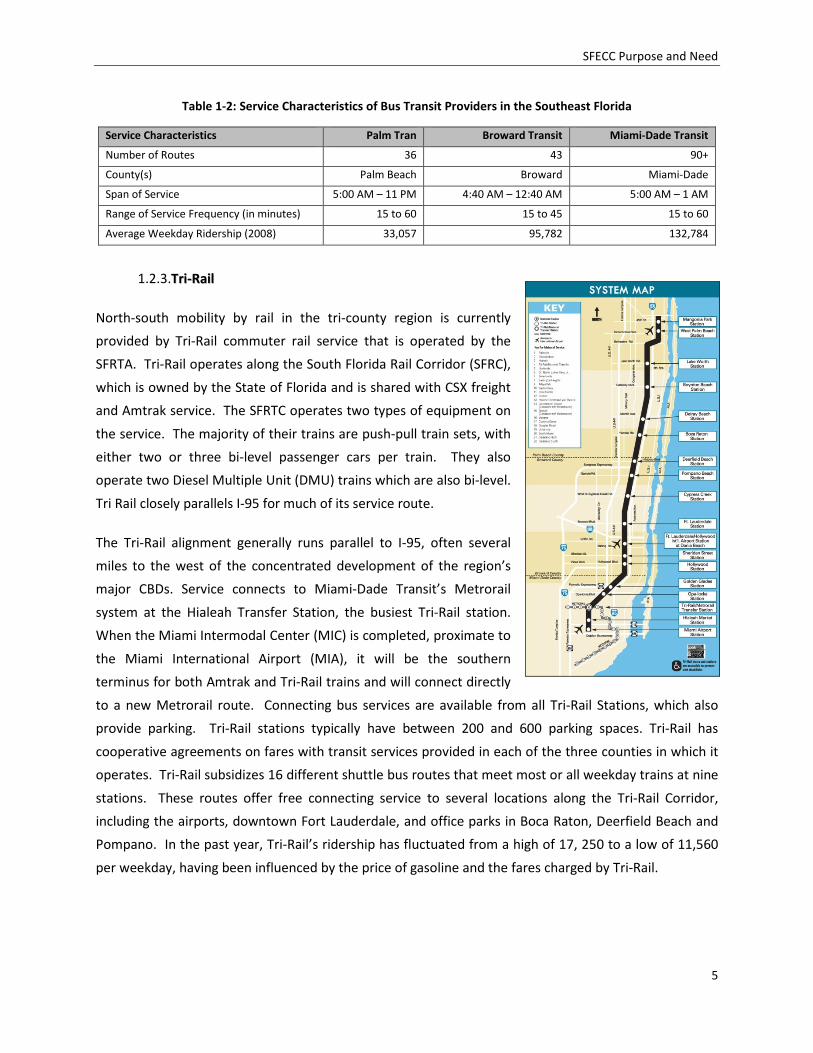
1.2.3.TTrrii--RRaaiill
North-south mobility by rail in the tri-county region is currently
provided by Tri-Rail commuter rail service that is operated by the
SFRTA. Tri-Rail operates along the South Florida Rail Corridor (SFRC),
which is owned by the State of Florida and is shared with CSX freight
and Amtrak service. The SFRTC operates two types of equipment on
the service. The majority of their trains are push-pull train sets, with
either two or three bi-level passenger cars per train. They also
operate two Diesel Multiple Unit (DMU) trains which are also bi-level.
Tri Rail closely parallels I-95 for much of its service route.
The Tri-Rail alignment generally runs parallel to I-95, often several
miles to the west of the concentrated development of the region’s
major CBDs. Service connects to Miami-Dade Transit’s Metrorail
system at the Hialeah Transfer Station, the busiest Tri-Rail station.
When the Miami Intermodal Center (MIC) is completed, proximate to
the Miami International Airport (MIA), it will be the southern
terminus for both Amtrak and Tri-Rail trains and will connect directly
to a new Metrorail route. Connecting bus services are available from all Tri-Rail Stations, which also
provide parking. Tri-Rail stations typically have between 200 and 600 parking spaces. Tri-Rail has
cooperative agreements on fares with transit services provided in each of the three counties in which it
operates. Tri-Rail subsidizes 16 different shuttle bus routes that meet most or all weekday trains at nine
stations. These routes offer free connecting service to several locations along the Tri-Rail Corridor,
including the airports, downtown Fort Lauderdale, and office parks in Boca Raton, Deerfield Beach and
Pompano. In the past year, Tri-Rail’s ridership has fluctuated from a high of 17, 250 to a low of 11,560
per weekday, having been influenced by the price of gasoline and the fares charged by Tri-Rail.

SFECC Purpose and Need
6
Metrorail
Metrorail is a 22-mile long, electrically powered, elevated rail rapid-
transit system extending from Kendall in South Miami-Dade County to
Medley in West Miami-Dade County. A 2.4-mile extension to the
airport is currently under construction.
The southern leg of Metrorail, between Miami-Dade County
Government Center and Kendall, attracts the highest ridership. In
2008, the average weekday ridership for the Metrorail Station at
Government Center was 10,000, which is 16% of the system’s total
ridership. Government Center serves as the southern terminus of the
SFECCTA study area.
1.2.4. MMeettrroommoovveerr
The Metromover is an electrically powered, fully-automated guided transit
(people mover) system that operates along a 4.4-mile route. Metromover is
a free service, and connects with Metrorail at the Government Center and
Brickell stations and with Metrobus at various locations throughout
Downtown Miami. The Miami-Dade County Government Center serves as a
location for one of the 21 Metromover stations. In 2008, the average
weekday ridership at Metromover’s busiest station, Government Center, was
6,500, which is 23% of Metromover’s total ridership.
1.2.5. AAmmttrraakk
Amtrak operates two daily trains in each direction between New York Penn
Station and Miami Station in Hialeah. Within the southeast Florida region,
these trains use same tracks as Tri-Rail and CSX freight trains. Ridership between local AMTRAK stops in
the region is negligible, meaning that while this service is important to the region’s connectedness with
the rest of the state and country, it presently has only a nominal role for regional travel.
SFECC Purpose and Need
7
1.2.6. PPaallmm TTrraann
The majority of Palm Tran’s service is concentrated in
the eastern portions of the Palm Beach County as far
north as Jupiter and as far south as Boca Raton. Thirty
of the 36 Palm Tran routes intersect the SFECCTA or
operate partly or completely within the SFECCTA study
area. Ridership on these bus routes amount to
approximately 31,305, over 90% of the system-wide
total. Of these 30
routes, four routes
(1, 10, 21, and 70)
are significant to the
SFECCTA project in
that they run in a
general north-south
direction, parallel to
the FEC Railway.
These four routes
recorded 9,452 in average weekday boardings, approximately 29% of
the total countywide boardings. This generally shows that a
significant portion of the system ridership is along the eastern part of
the county. Palm Tran Route 1 in particular, operates over 38 miles
between Boca Raton and Palm Beach Gardens along US 1, carries the
bus system’s highest ridership – 7,860, which is almost 24% of the
total system-wide ridership.
In August 2009, Palm Tran started a limited service, express
commuter bus from Stuart to West Palm Beach Intermodal Center.
Service changes were made in May 2010 because of poor ridership.
1.2.7.BBrroowwaarrdd CCoouunnttyy TTrraannssiitt ((BBCCTT))
Of Broward County's more than 1,200 square miles, BCT buses provide service to only 410 square miles
with 43 regular weekday routes. Service is concentrated in the eastern portion of the County, with
three routes extending north into Palm Beach County and six routes extending south into Miami-Dade
SFECC Purpose and Need
8
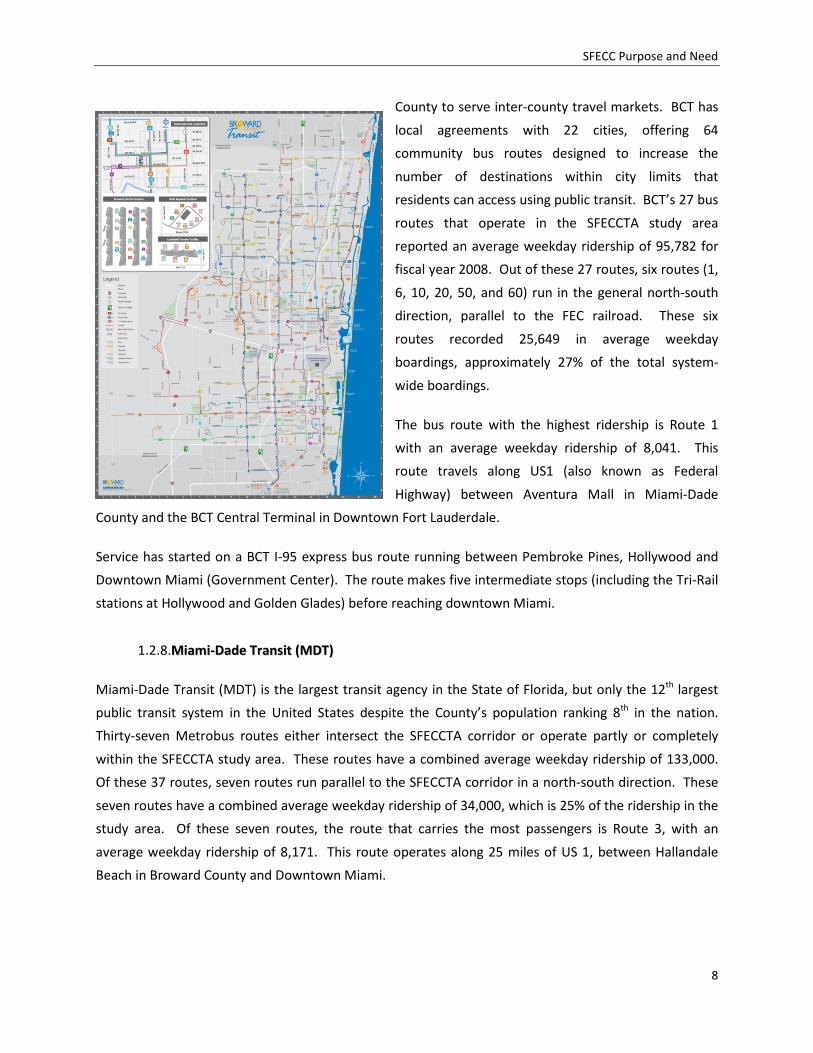
County to serve inter-county travel markets. BCT has
local agreements with 22 cities, offering 64
community bus routes designed to increase the
number of destinations within city limits that
residents can access using public transit. BCT’s 27 bus
routes that operate in the SFECCTA study area
reported an average weekday ridership of 95,782 for
fiscal year 2008. Out of these 27 routes, six routes (1,
6, 10, 20, 50, and 60) run in the general north-south
direction, parallel to the FEC railroad. These six
routes recorded 25,649 in average weekday
boardings, approximately 27% of the total system-
wide boardings.
The bus route with the highest ridership is Route 1
with an average weekday ridership of 8,041. This
route travels along US1 (also known as Federal
Highway) between Aventura Mall in Miami-Dade
County and the BCT Central Terminal in Downtown Fort Lauderdale.
Service has started on a BCT I-95 express bus route running between Pembroke Pines, Hollywood and
Downtown Miami (Government Center). The route makes five intermediate stops (including the Tri-Rail
stations at Hollywood and Golden Glades) before reaching downtown Miami.
1.2.8.MMiiaammii--DDaaddee TTrraannssiitt ((MMDDTT))
Miami-Dade Transit (MDT) is the largest transit agency in the State of Florida, but only the 12th largest
public transit system in the United States despite the County’s population ranking 8th in the nation.
Thirty-seven Metrobus routes either intersect the SFECCTA corridor or operate partly or completely
within the SFECCTA study area. These routes have a combined average weekday ridership of 133,000.
Of these 37 routes, seven routes run parallel to the SFECCTA corridor in a north-south direction. These
seven routes have a combined average weekday ridership of 34,000, which is 25% of the ridership in the
study area. Of these seven routes, the route that carries the most passengers is Route 3, with an
average weekday ridership of 8,171. This route operates along 25 miles of US 1, between Hallandale
Beach in Broward County and Downtown Miami.

SFECC Purpose and Need
9
MDT has initiated service on a series of I-95
express buses running between downtown
Fort Lauderdale and downtown Miami
(Government Center) and between Hollywood
and downtown Miami. The Fort Lauderdale
route makes an intermediate stop at the Tri-
Rail Fort Lauderdale Station before reaching
downtown Miami. The Hollywood route
travels directly between Sheridan Street Tri-
Rail Station and downtown Miami.
SFECC Purpose and Need
10
11..33.. PPeerrffoorrmmaannccee ooff tthhee TTrraannssppoorrttaattiioonn SSyysstteemm
1.3.1.HHiigghhwwaayyss
Traffic Congestion
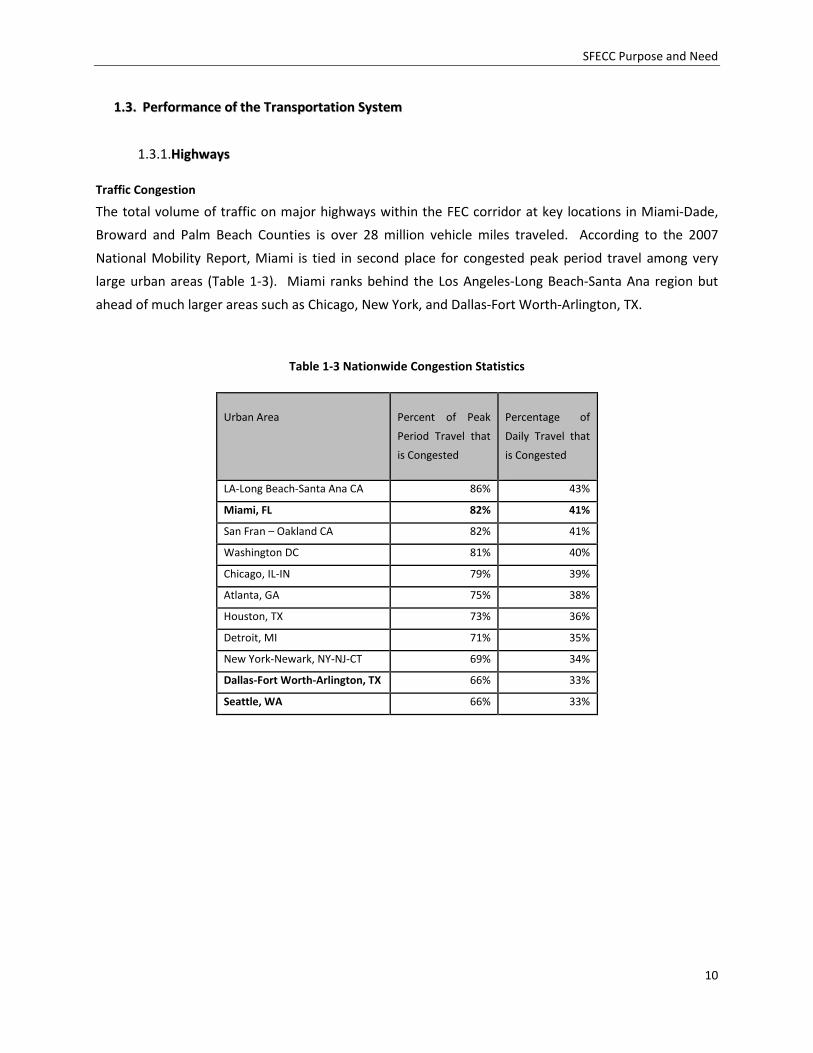
The total volume of traffic on major highways within the FEC corridor at key locations in Miami-Dade,
Broward and Palm Beach Counties is over 28 million vehicle miles traveled. According to the 2007
National Mobility Report, Miami is tied in second place for congested peak period travel among very
large urban areas (Table 1-3). Miami ranks behind the Los Angeles-Long Beach-Santa Ana region but
ahead of much larger areas such as Chicago, New York, and Dallas-Fort Worth-Arlington, TX.
Table 1-3 Nationwide Congestion Statistics
Urban Area Percent of Peak
Period Travel that
is Congested
Percentage of
Daily Travel that
is Congested
LA-Long Beach-Santa Ana CA 86% 43%
Miami, FL 82% 41%
San Fran – Oakland CA 82% 41%
Washington DC 81% 40%
Chicago, IL-IN 79% 39%
Atlanta, GA 75% 38%
Houston, TX 73% 36%
Detroit, MI 71% 35%
New York-Newark, NY-NJ-CT 69% 34%
Dallas-Fort Worth-Arlington, TX 66% 33%
Seattle, WA 66% 33%
SFECC Purpose and Need
11
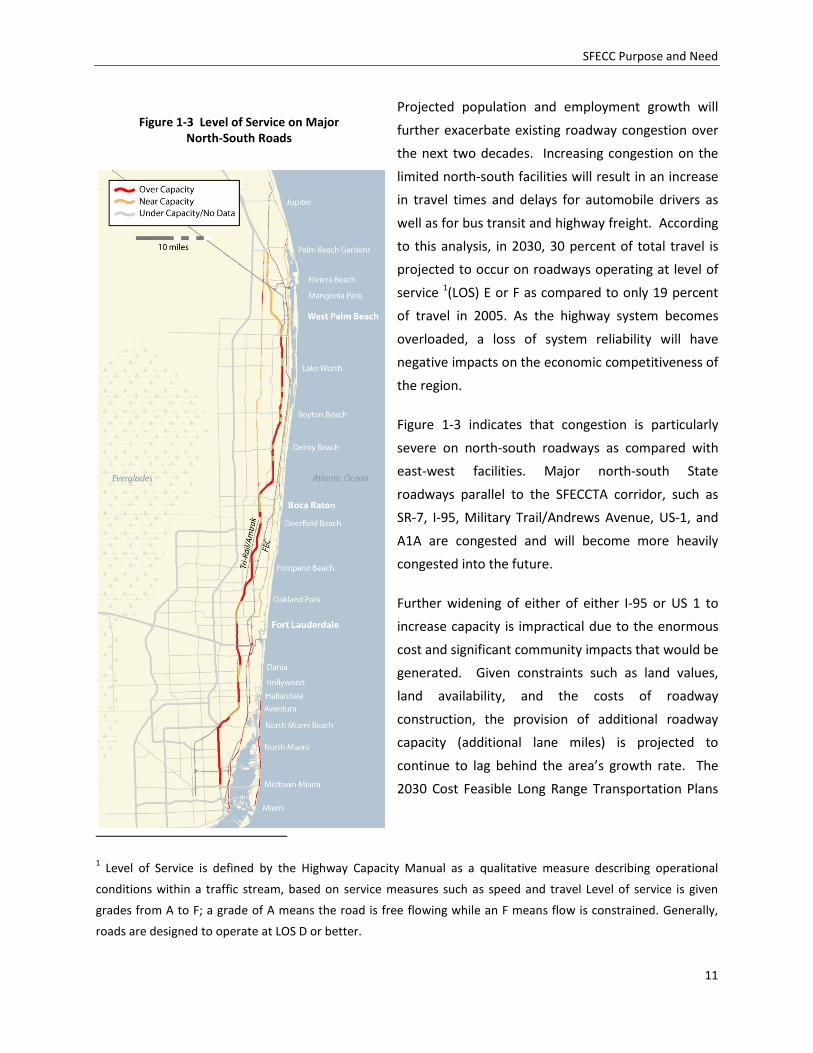
Projected population and employment growth will
further exacerbate existing roadway congestion over
the next two decades. Increasing congestion on the
limited north-south facilities will result in an increase
in travel times and delays for automobile drivers as
well as for bus transit and highway freight. According
to this analysis, in 2030, 30 percent of total travel is
projected to occur on roadways operating at level of
service 1(LOS) E or F as compared to only 19 percent
of travel in 2005. As the highway system becomes
overloaded, a loss of system reliability will have
negative impacts on the economic competitiveness of
the region.
Figure 1-3 indicates that congestion is particularly
severe on north-south roadways as compared with
east-west facilities. Major north-south State
roadways parallel to the SFECCTA corridor, such as
SR-7, I-95, Military Trail/Andrews Avenue, US-1, and
A1A are congested and will become more heavily
congested into the future.
Further widening of either of either I-95 or US 1 to
increase capacity is impractical due to the enormous
cost and significant community impacts that would be
generated. Given constraints such as land values,
land availability, and the costs of roadway
construction, the provision of additional roadway
capacity (additional lane miles) is projected to
continue to lag behind the area’s growth rate. The
2030 Cost Feasible Long Range Transportation Plans
1 Level of Service is defined by the Highway Capacity Manual as a qualitative measure describing operational
conditions within a traffic stream, based on service measures such as speed and travel Level of service is given
grades from A to F; a grade of A means the road is free flowing while an F means flow is constrained. Generally,
roads are designed to operate at LOS D or better.
Figure 1-3 Level of Service on Major
North-South Roads

SFECC Purpose and Need
12
of the respective counties include a 16 percent increase in total lane miles and 19 percent increase in
total capacity for the entire tri-county area between 2005 and 2030. The Region’s freeways will witness
a 13 percent increase in lane miles. However, during this same period, the tri-county region is projected
to witness a 39 percent increase in traffic volume. Much of the additional lane miles of capacity will be
added in the less densely-developed areas, away from the east coast and the SFECCTA corridor. The
planned additional roadway supply will be far outstripped by the growth in demand.
According to the 2007 National
Mobility Report, in order to
maintain current flow of traffic, the
Miami area alone needs an
additional 330 lane miles every year.
However, the planned growth of
supply indicates that the entire tri-
county area will add an average of
92 lane miles per year until 2030
thus; congestion will only worsen
over time without other alternatives
to address this issue. Increased
congestion will to lead to further
travel time delays and, ultimately, a
loss in productivity and economic
competitiveness. The National
Mobility Report indicates that in
2007, an average commuter in
Miami spent 47 hours every year in
congestion that resulted in a
congestion cost of $903 per peak
traveler and cumulative cost of
$2.69 billion for the Miami area
alone. The Miami area was ranked
fourth in the nation in terms of total
delay and fifth in terms of
congestion cost. Roadway Congestion on I-95
SFECC Purpose and Need
13
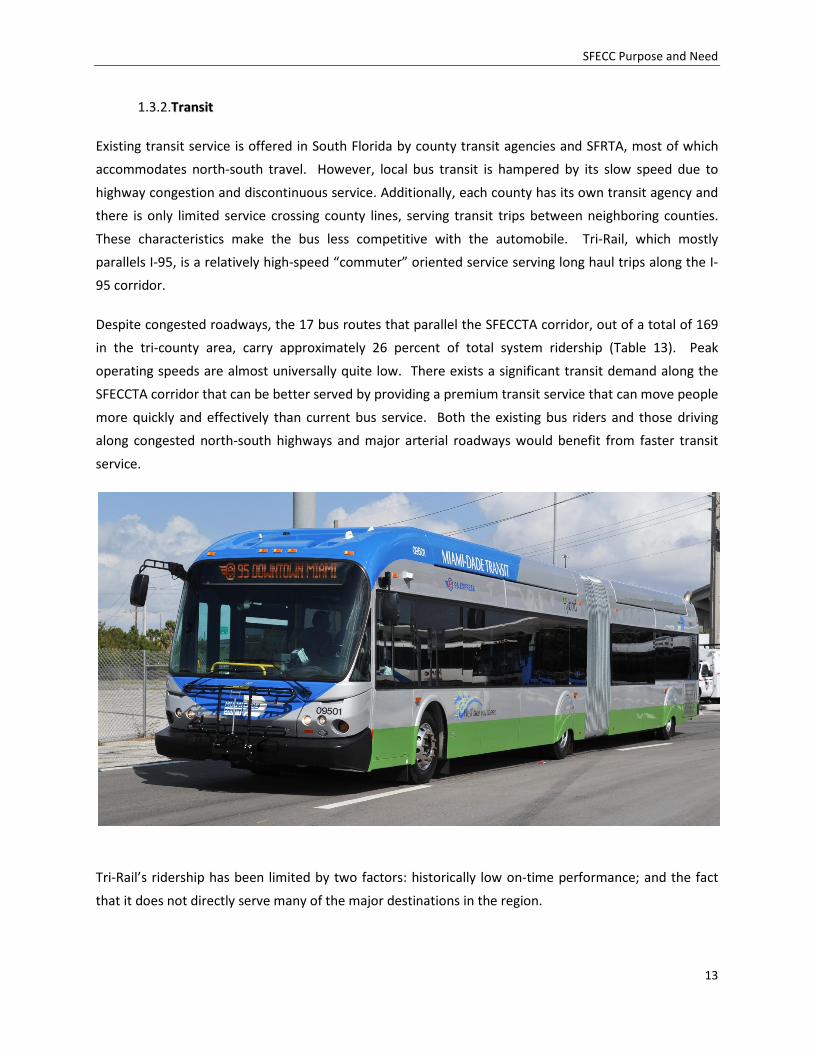
1.3.2.TTrraannssiitt
Existing transit service is offered in South Florida by county transit agencies and SFRTA, most of which
accommodates north-south travel. However, local bus transit is hampered by its slow speed due to
highway congestion and discontinuous service. Additionally, each county has its own transit agency and
there is only limited service crossing county lines, serving transit trips between neighboring counties.
These characteristics make the bus less competitive with the automobile. Tri-Rail, which mostly
parallels I-95, is a relatively high-speed “commuter” oriented service serving long haul trips along the I-
95 corridor.
Despite congested roadways, the 17 bus routes that parallel the SFECCTA corridor, out of a total of 169
in the tri-county area, carry approximately 26 percent of total system ridership (Table 13). Peak
operating speeds are almost universally quite low. There exists a significant transit demand along the
SFECCTA corridor that can be better served by providing a premium transit service that can move people
more quickly and effectively than current bus service. Both the existing bus riders and those driving
along congested north-south highways and major arterial roadways would benefit from faster transit
service.
Tri-Rail’s ridership has been limited by two factors: historically low on-time performance; and the fact
that it does not directly serve many of the major destinations in the region.
SFECC Purpose and Need
14
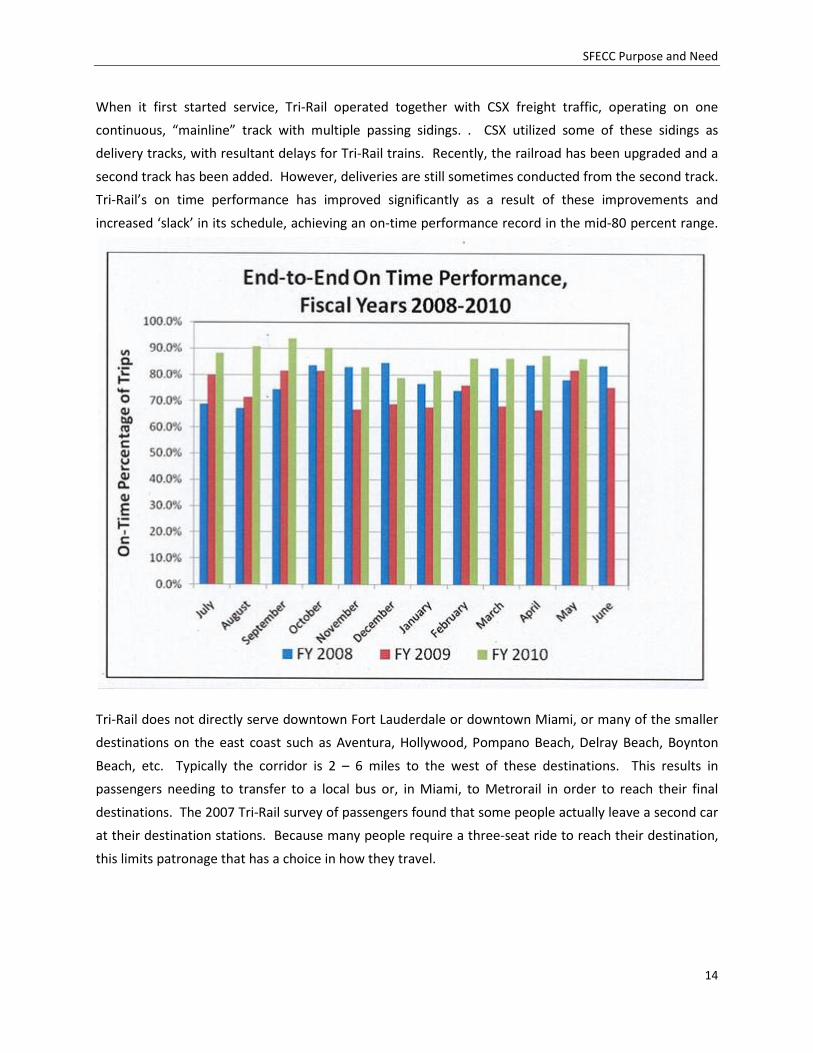
When it first started service, Tri-Rail operated together with CSX freight traffic, operating on one
continuous, “mainline” track with multiple passing sidings. . CSX utilized some of these sidings as
delivery tracks, with resultant delays for Tri-Rail trains. Recently, the railroad has been upgraded and a
second track has been added. However, deliveries are still sometimes conducted from the second track.
Tri-Rail’s on time performance has improved significantly as a result of these improvements and
increased ‘slack’ in its schedule, achieving an on-time performance record in the mid-80 percent range.
Tri-Rail does not directly serve downtown Fort Lauderdale or downtown Miami, or many of the smaller
destinations on the east coast such as Aventura, Hollywood, Pompano Beach, Delray Beach, Boynton
Beach, etc. Typically the corridor is 2 – 6 miles to the west of these destinations. This results in
passengers needing to transfer to a local bus or, in Miami, to Metrorail in order to reach their final
destinations. The 2007 Tri-Rail survey of passengers found that some people actually leave a second car
at their destination stations. Because many people require a three-seat ride to reach their destination,
this limits patronage that has a choice in how they travel.
SFECC Purpose and Need
15
11..44.. DDeemmooggrraapphhiiccss aanndd LLaanndd UUssee
1.4.1.PPooppuullaattiioonn aanndd EEmmppllooyymmeenntt
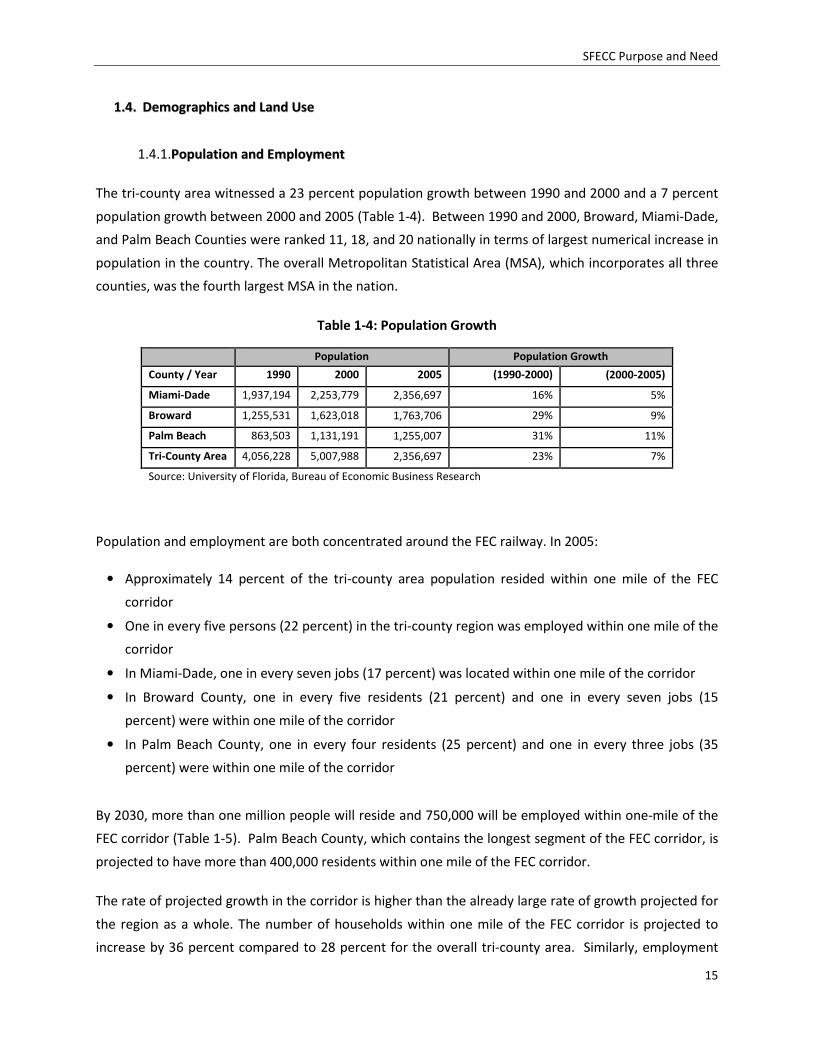
The tri-county area witnessed a 23 percent population growth between 1990 and 2000 and a 7 percent
population growth between 2000 and 2005 (Table 1-4). Between 1990 and 2000, Broward, Miami-Dade,
and Palm Beach Counties were ranked 11, 18, and 20 nationally in terms of largest numerical increase in
population in the country. The overall Metropolitan Statistical Area (MSA), which incorporates all three
counties, was the fourth largest MSA in the nation.
Table 1-4: Population Growth
Population and employment are both concentrated around the FEC railway. In 2005:
• Approximately 14 percent of the tri-county area population resided within one mile of the FEC
corridor
• One in every five persons (22 percent) in the tri-county region was employed within one mile of the
corridor
• In Miami-Dade, one in every seven jobs (17 percent) was located within one mile of the corridor
• In Broward County, one in every five residents (21 percent) and one in every seven jobs (15
percent) were within one mile of the corridor
• In Palm Beach County, one in every four residents (25 percent) and one in every three jobs (35
percent) were within one mile of the corridor
By 2030, more than one million people will reside and 750,000 will be employed within one-mile of the
FEC corridor (Table 1-5). Palm Beach County, which contains the longest segment of the FEC corridor, is
projected to have more than 400,000 residents within one mile of the FEC corridor.
The rate of projected growth in the corridor is higher than the already large rate of growth projected for
the region as a whole. The number of households within one mile of the FEC corridor is projected to
increase by 36 percent compared to 28 percent for the overall tri-county area. Similarly, employment
Population Population Growth
County / Year 1990 2000 2005 (1990-2000) (2000-2005)
Miami-Dade 1,937,194 2,253,779 2,356,697 16% 5%
Broward 1,255,531 1,623,018 1,763,706 29% 9%
Palm Beach 863,503 1,131,191 1,255,007 31% 11%
Tri-County Area 4,056,228 5,007,988 2,356,697 23% 7%
Source: University of Florida, Bureau of Economic Business Research
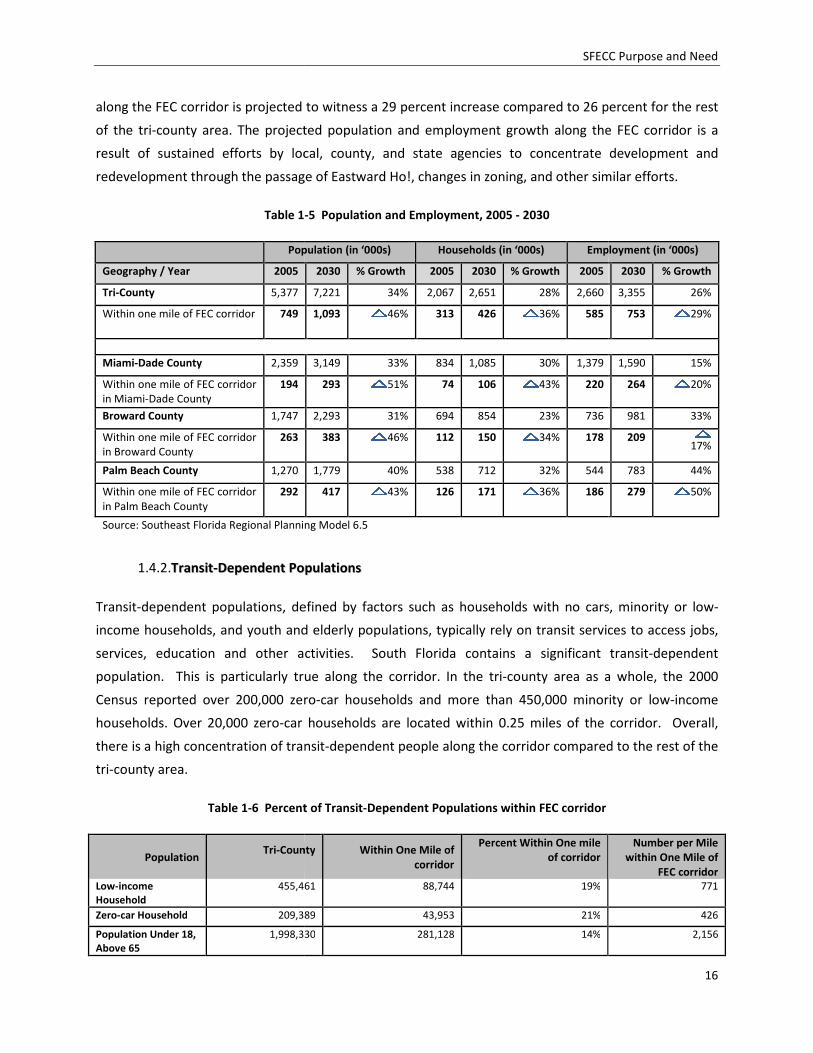
along the FEC corridor is projected to witness a 29 percent increase compared to 26 percent for the rest
of the tri-county area. The projected
result of sustained efforts by local, county, and state agencies
redevelopment through the passage of Eastward Ho!, changes in zoning, and other similar efforts.
Table 1
Population (in ‘000s)
Geography / Year 2005
Tri-County 5,377
Within one mile of FEC corridor 749
Miami-Dade County 2,359
Within one mile of FEC corridor
in Miami-Dade County
194
Broward County 1,747
Within one mile of FEC corridor
in Broward County
263
Palm Beach County 1,270
Within one mile of FEC corridor
in Palm Beach County
292
Source: Southeast Florida Regional Planning Model 6.5
1.4.2.TTrraannssiitt--DDeeppeennddeenntt PPoo
Transit-dependent populations, defined by factors such as households with no car
income households, and youth and elderly populations
services, education and other activities. South Florida contains
population. This is particularly true along the corridor. In the tri
Census reported over 200,000 zero
households. Over 20,000 zero-car households are located within 0.25 miles of the
there is a high concentration of transit
tri-county area.
Table 1-6 Percent of Transit
Population Tri-County
Low-income
Household
455,461
Zero-car Household 209,389
Population Under 18,
Above 65
1,998,330
SFECC Purpose and Need
along the FEC corridor is projected to witness a 29 percent increase compared to 26 percent for the rest
projected population and employment growth along the FEC corridor
ts by local, county, and state agencies to concentrate development and
redevelopment through the passage of Eastward Ho!, changes in zoning, and other similar efforts.
1-5 Population and Employment, 2005 - 2030
Population (in ‘000s) Households (in ‘000s) Employment (in ‘000s)
2030 % Growth 2005 2030 % Growth 2005
7,221 34% 2,067 2,651 28% 2,660
1,093 46% 313 426 36% 585
3,149 33% 834 1,085 30% 1,379
293 51% 74 106 43% 220
2,293 31% 694 854 23% 736
383 46% 112 150 34% 178
1,779 40% 538 712 32% 544
417 43% 126 171 36% 186
Southeast Florida Regional Planning Model 6.5
ooppuullaattiioonnss
, defined by factors such as households with no cars, minority
income households, and youth and elderly populations, typically rely on transit services
services, education and other activities. South Florida contains a significant transit
This is particularly true along the corridor. In the tri-county area as a whole, the 2000
Census reported over 200,000 zero-car households and more than 450,000 minority or low
car households are located within 0.25 miles of the
there is a high concentration of transit-dependent people along the corridor compared to the rest of the
Percent of Transit-Dependent Populations within FEC corridor
County
Within One Mile of
corridor
Percent Within One mile
of corridor
455,461 88,744 19%
209,389 43,953 21%
1,998,330 281,128 14%
SFECC Purpose and Need
16
along the FEC corridor is projected to witness a 29 percent increase compared to 26 percent for the rest
along the FEC corridor is a
to concentrate development and
redevelopment through the passage of Eastward Ho!, changes in zoning, and other similar efforts.
Employment (in ‘000s)
2030 % Growth
3,355 26%
753 29%
1,590 15%
264 20%
981 33%
209 17%
783 44%
279 50%
s, minority or low-
typically rely on transit services to access jobs,
a significant transit-dependent
county area as a whole, the 2000
car households and more than 450,000 minority or low-income
car households are located within 0.25 miles of the corridor. Overall,
ng the corridor compared to the rest of the
Number per Mile
within One Mile of
FEC corridor
771
426
2,156

SFECC Purpose and Need
17
1.4.3.EExxiissttiinngg LLaanndd UUssee aanndd AAccttiivviittyy
CCeenntteerrss iinn tthhee RReeggiioonn
The entire 85-mile study area from Jupiter to
Miami is developed. There are three major cities
– Miami, Fort Lauderdale and West Palm Beach
and 25 smaller towns on the corridor. The FEC
Railway passes directly through the downtown
of almost all these communities. The three
major cities are all major employment
destinations but, in recent years, significant
high-rise residential development has been built
within their downtown cores. Many of the
smaller communities such as Boca Raton,
Boynton Beach, North Miami, Aventura,
Hollywood, Lake Worth and Delray Beach also
have high-to-medium density downtowns with
mixed residential, commercial, and office land
uses. These towns, which were established and
developed prior to World War II, are organized
around a grid of streets with continuous
sidewalks and other essential elements of
transit-oriented development. In contrast, to
the west of I-95, development is lower density,
organized in single-use developments and gated
communities. Only north of Riviera Beach does
the land use pattern change to a suburban type
of development. This development took place in
a time when gated communities and large blocks
were the organizing principles. Palm Beach
Gardens has a suburban, auto-oriented land use
pattern, but has approximately 20,000 jobs
within a half mile of the corridor. Jupiter has a
pedestrian scale, mixed uses and a small block
pattern of development to the west of the FEC
tracks. Both of these communities are working
towards focused growth and higher densities.
Figure 1-4 Activity Centers

SFECC Purpose and Need
18
There are numerous activity centers within the study area in
addition to the town centers. These are: three international
airports; major medical campuses; college and university
campuses; and major shopping/entertainment centers.
1.4.4.RReecceenntt aanndd PPrroojjeecctteedd EEccoonnoommiicc TTrreennddss
In recent years, smaller urban communities have once again
become fashionable places to live and conduct business –
partly because the architecture of the era has become
fashionable again and partly because regional and local
policies have encouraged, and continue to encourage,
redevelopment with mixed use, mid-rise buildings.
For example, the cities of Boynton Beach, Boca Raton, Wilton
Manors and Hollywood all have recently allowed the
construction of five-to-eight story mixed-use buildings with
retail on the ground floor and residential above within
walking distance of the FEC railway. Many other projects in
other communities have been designed and approved and
are ready for implementation once the economy recovers.
To facilitate and promote redevelopment activities within the
communities on the corridor, local governments have
included land adjacent to the FEC Railway in Community
Redevelopment Areas (CRA). Having a CRA designation
provides a funding mechanism for infrastructure and other
improvements within the designated area through Tax
Increment Financing (TIF) whereby total property taxes for a
CRA are assessed in a base year and any increase in tax
revenue in the subsequent years is directly reinvested into
the CRA. There are 12 CRAs in Miami-Dade County, seven
existing and one proposed in Broward County and nine in
Palm Beach County within or in the immediate vicinity of the
study area. In total, the land areas of the CRAs in the study
area comprise more than 21,000 acres.
Dense development along the FEC corridor
in West Palm Beach, Wilton Manors,
Hollywood, and Midtown Miami

SFECC Purpose and Need
19
1.4.5.MMoobbiilliittyy NNeeeeddss ooff HHiigghh--DDeennssiittyy LLaanndd UUsseess
Because of the limited availability of developable land, the tri-county area has been experiencing a large
amount of redevelopment, mostly in the CBDs of the medium to large cities along the corridor.
Integrated land use and transportation is critical to the success of development and redevelopment
efforts, particularly for high-density development. The combination of existing and proposed land uses
along the SFECCTA study corridor will ensure that a new, premium transit service will serve a wide
variety of markets (commuters, students, visitors, tourists, residents).
The majority of the 28 municipalities along the corridor have recently amended (or are in the process of
amending) their Comprehensive Plans and recognize the FEC corridor as a premium transit corridor. In
this process, these municipalities are adopting new policies to increase density and create transit-
friendly mixed uses along the corridor and around potential station locations. Though each community
has its own character and vision for the future, all but a handful have or are in the process of adopting
zoning codes that benefit transit. This is being accomplished either by increasing residential densities or
by designating areas for employment and mixed use. The minority of municipalities that are not
planning to change their densities tend to be small, completely built-out, stable, and are comprised,
primarily, of residential neighborhoods.
11..55.. TTrraavveell MMaarrkkeettss
An analysis of the 2005 and 2030 trip productions and attractions within the tri-county area indicates a
significantly high concentration of activity along the FEC corridor. By 2030, a high trip production
density is projected throughout the eastern communities along the FEC corridor. Seventeen percent of
all trip productions in the tri-county area are forecast to be within one mile of the FEC corridor, which
would directly serve the CBDs of Miami, Ft Lauderdale and West Palm Beach (Table 1-7). Similarly, one
in every five trips (21 percent) will have destinations within one mile of the FEC corridor.
Table 1-7 Daily Productions and Attractions along the FEC corridor
Year Number of Trip Productions or
Attractions
Percent of Tri-County
within One-Mile of
FEC corridor
Number per
Acre within
One-Mile of
FEC corridor
Within One-mile of
FEC corridor
Tri-County
Productions 2005 3,058,864 18,633,079 16% 53
2030 4,277,540 25,162,437 17% 85
Attractions 2005 3,781,423 18,639,069 20% 100
2030 5,168,900 25,167,419 21% 151
SFECC Purpose and Need
20
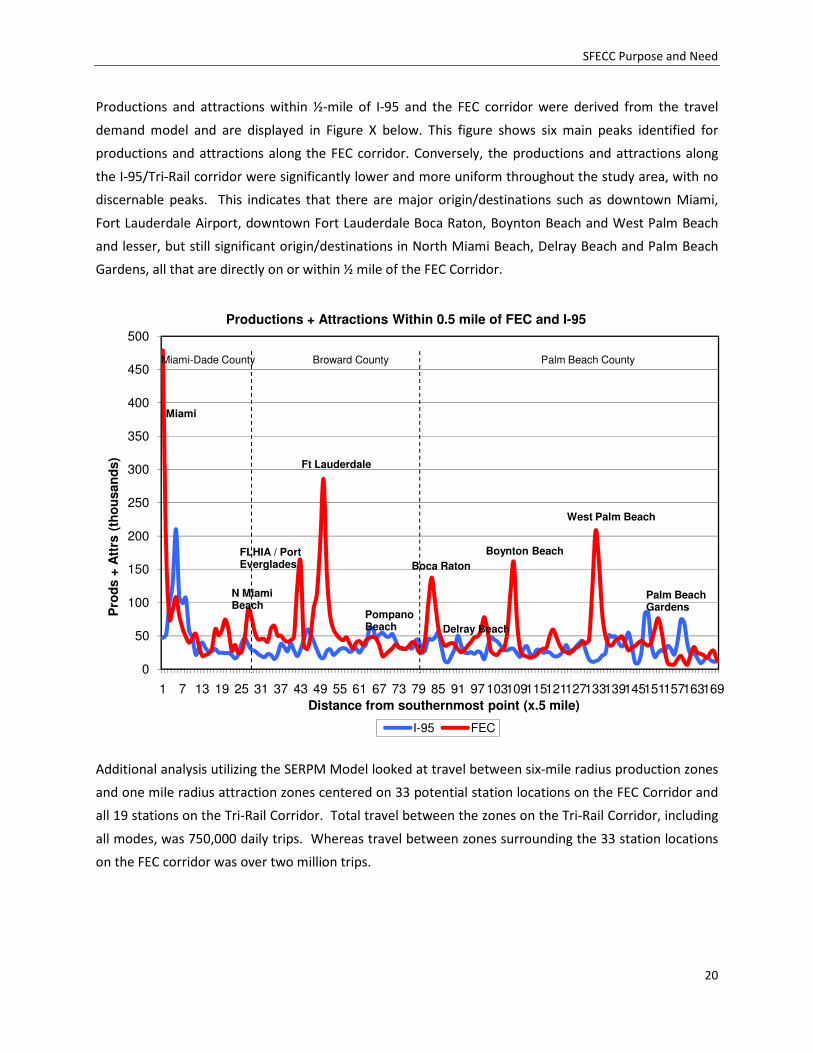
Productions and attractions within ½-mile of I-95 and the FEC corridor were derived from the travel
demand model and are displayed in Figure X below. This figure shows six main peaks identified for
productions and attractions along the FEC corridor. Conversely, the productions and attractions along
the I-95/Tri-Rail corridor were significantly lower and more uniform throughout the study area, with no
discernable peaks. This indicates that there are major origin/destinations such as downtown Miami,
Fort Lauderdale Airport, downtown Fort Lauderdale Boca Raton, Boynton Beach and West Palm Beach
and lesser, but still significant origin/destinations in North Miami Beach, Delray Beach and Palm Beach
Gardens, all that are directly on or within ½ mile of the FEC Corridor.
Additional analysis utilizing the SERPM Model looked at travel between six-mile radius production zones
and one mile radius attraction zones centered on 33 potential station locations on the FEC Corridor and
all 19 stations on the Tri-Rail Corridor. Total travel between the zones on the Tri-Rail Corridor, including
all modes, was 750,000 daily trips. Whereas travel between zones surrounding the 33 station locations
on the FEC corridor was over two million trips.
0
50
100
150
200
250
300
350
400
450
500
1 7 13 19 25 31 37 43 49 55 61 67 73 79 85 91 97103109115121127133139145151157163169
Pro
ds +
Att
rs (
tho
usan
ds)
Distance from southernmost point (x.5 mile)
Productions + Attractions Within 0.5 mile of FEC and I-95
I-95 FEC
Miami-Dade County Broward County Palm Beach County
Miami
N MiamiBeach
Ft Lauderdale
Boca Raton
Delray Beach
Boynton Beach
West Palm Beach
Palm BeachGardens
PompanoBeach
FLHIA / PortEverglades

SFECC Purpose and Need
21
Figure 1-5 indicates the twenty-five pairs
of stations along the FEC with the greatest
potential travel between them. Even if only
a small percentage of these trips will be
captured by transit, the numbers indicate
the potential for substantial transit
ridership.
The major travel markets which exist within
the FEC corridor that can be served by new
premium transit service include work and
non-work trips. Ridership forecasts from the
regional travel demand model indicate that
for the build alternatives, work trips are bi-
directional with commuters traveling both
north and south to the major employment
centers on the corridor. For example people
travel from the Boca Raton area both north
to West Palm Beach and south to Fort
Lauderdale in approximately equal numbers.
Boca Raton itself is also an employment
destination. Similarly, further south,
Hollywood commuters go both north to Fort
Lauderdale and south to Miami.
Many middle and long distance commuters
can be expected to drive to the corridor and
will park-and-ride to their destinations.
However, the pedestrian-friendly nature of
the surrounding land use and demographics
of the population on the FEC Corridor
suggest that there is a significant market for
shorter trips by people who live close to the
corridor and may walk to local stations. This
market includes residents of new, mid-rise
developments that have already been
constructed in anticipation of future
Figure 1-5 Travel Markets

SFECC Purpose and Need
22
premium, transit service, future residents of additional planned development, as well as transit-
dependent people in the surrounding communities. This market includes travel for off peak trips for
shopping, entertainment and medical appointments.
11..66.. TTrraannssppoorrttaattiioonn PPrroobblleemmss aanndd NNeeeeddss
The fundamental need for the project results from the following key issues:
• Increased Population and Employment: Southeast Florida has been growing rapidly due to in-
migration and high birth rates and is expected to continue to grow in the foreseeable future. By
2030, the number of households in the study area is projected to increase by 36% compared to 28%
for the overall tri-county region. Population will increase even more with a 34% growth in the
region and 46% in the study area, bringing total population within one mile of the FEC Corridor to
over one million by 2030. Employment is also expected to grow faster in the study area than in the
region as a whole, with a 29% increase in the study area compared to 26% for the region.
Automobile ownership and vehicle miles traveled (VMT) are expected to increase even more
dramatically than population.
• Highway Capacity and Traffic Congestion: Existing north-south highways in southeastern Florida,
such as I-95 and US 1, are severely congested today and as growth takes place, this congestion is
expected to get more severe. While the population is expected to increase by 28% by 2030, and
highway traffic volume is projected to grow by 35%, the planned increase in highway capacity is only
19%. The entire region is built-out, making the addition of capacity on existing highways extremely
impactful and costly. The volume of traffic and the number of lanes on these facilities results in an
elevated number of traffic accidents. These incidences lead to delay and decreased safety and make
travel time unpredictable for roadway users.
• Sustainable Economic Development and Land Use: The region’s “Eastward Ho!” initiative
emphasizes redevelopment and promotes greater density of development in coastal, southeast
Florida rather than continued sprawl in less developed areas in the west. All three counties also
have policies in place to focus future development within the study area. This initiative will help
protect the environment by keeping growth away from the Everglades and reducing green house
gas production by reducing trip lengths. The communities within the study area already have a
walkable pattern of development, but many of the buildings are reaching the end of their useful
lifespan. Land values are increasing as vacant land further west has become scarcer leading to the
potential for higher and better uses than the current buildings serve. Investment in premium
transit, along with new land use and zoning regulations for increased density and mixed use could
be expected to help attract redevelopment to these areas. Without additional premium transit

SFECC Purpose and Need
23
service, however, these higher densities may not be realized because the road network is already
congested and cannot accommodate the increased travel demand created by denser development.
• Access to Eastern Travel Destinations: Existing rail transit on Tri-Rail does not conveniently serve
the travel destinations in the cities and towns east of I-95. There are a number of medical facilities
such as the Jupiter Medical Center, St. Mary’s and Good Samaritan Hospital in West Palm Beach,
Broward General Medical Center and Aventura Hospital all of which are directly on the FEC Corridor.
The major government centers in West Palm Beach, Fort Lauderdale and Miami are also adjacent to
the corridor and several college campuses are within walking distance or short shuttle rides from
the FEC. The Scripps Campus at Florida Atlantic University in Jupiter is also an easy shuttle bus ride
distance from the Corridor. The existing Tri-Rail corridor is two to six miles to the west of these and
other destinations, with stations that are not within walking distance of most destinations. This
means that almost all of Tri-Rail riders need to transfer to local buses, circulators or, in Miami,
Metrorail to reach their final destinations. Since the Tri-Rail corridor is immediately to the west of I-
95, I-95 acts as a barrier between the Tri-Rail stations and the coastal communities and their transit-
friendly neighborhoods.
• Transit Service Deficiencies: The local buses that run throughout the study area are slow due to
traffic congestion and frequent stopping patterns. The average travel speed of local buses is 11 to
16 mph, which is not competitive with the automobile. This limits local bus ridership to transit-
dependent customers and short trips. The study area includes three major CBDs and other, smaller
downtowns that serve as regional and local destinations and attract large numbers of trips. Today,
these communities are connected in a limited fashion by slow, local bus routes and most travel is
carried out by automobile. By 2030, 17% of all trip productions and 20% of trip attractions in the tri-
county area will be in the study area, with clear peaks in productions and attractions in the multiple
downtowns that bisect the FEC corridor and yet no current transit provider optimizes the links
between these major travel markets.
• Large Transit-Dependent Populations: Large transit-dependent populations in each of the three
counties are located within the study area. Increased mobility options are needed to improve the
ability of this population to travel to jobs, education, healthcare and leisure activities and improve
their opportunities for economic advancement and their quality of life. A large portion of the
existing Tri-Rail’s riders are the transit-dependent and providing direct access to destinations to the
east would serve this population directly. Stations would be within walking distance of many origins
and destinations.

SFECC Purpose and Need
24
11..77.. PPrroojjeecctt PPuurrppoossee
The purpose of the South Florida East Coast Corridor Transit Analysis (SFECCTA) is to provide reliable
transportation options for South Floridians, and to support the region’s Eastward Ho! initiative by
improving north-south mobility in the study corridor. This project will create an integrated system of
premium transit through the redeveloping coastal cities in Palm Beach, Broward and Miami-Dade
Counties, to supplement the existing highway network including I-95, and to enhance the utilization of
existing transit services. The resulting improved accessibility to and within the study corridor will serve
as a catalyst for revitalization and increased economic development within the adjacent communities.
The project would supplement highway capacity, improve north/south connectivity and improve the
quality of transit services especially for those who are dependent on transit. This project would also
accommodate robust future growth in population and employment consistent with regional land use
objectives. The project would improve mobility for shorter trips and provide direct access to existing
and planned development along the economic spine of South Florida.
Proposals to use existing and new east-west track connections between SFECCTA and Tri-Rail would
permit Tri-Rail trains to operate over portions of the SFECCTA corridor and vice versa. An integrated
system, offering “one–seat, no transfer rides”, could attract more riders than two parallel rail services
with connecting buses. More origins and destinations would be directly served by such an integrated
system.
Regional environmental goals are being achieved by concentrating development to the east, rather than
between I-95 and the Everglades. A new premium transit service along the FEC Railway corridor would
support such development activities in Community Redevelopment Areas (CRA).
The goals and objectives reflect the project purpose, and are as follows:

SFECC Purpose and Need
25
11..88.. GGooaallss aanndd OObbjjeeccttiivveess
GGooaall 11:: IImmpprroovvee mmoobbiilliittyy aanndd aacccceessss ffoorr ppeerrssoonnaall ttrraavveell aanndd ggooooddss mmoovveemmeenntt..
• Expand transit options to accommodate future travel demand in the corridor and serve major transportation hubs, employment, medical,
retail, educational, and entertainment centers, and residents in the region.
• Provide regional transit options that improve travel time reliability for people and goods and results in travel time savings.
• Integrate the proposed transit options with existing and planned transit in the region.
• Integrate the proposed transit options with existing and planned freight transport and potentially intercity passenger transport located
within or traversing the study area.
• Provide for seamless connections to all modes of transportation including bicycle and pedestrian facilities.
• Provide regional access and mobility improvements for minority, transportation disadvantaged and low-income groups.
• Support goods movement in the corridor with higher capacity and connectivity.
GGooaall 22:: CCoooorrddiinnaattee ccoorrrriiddoorr ttrraannssppoorrttaattiioonn iinnvveessttmmeennttss ttoo ccoonnttrriibbuuttee ttoo aa sseeaammlleessss,, iinntteeggrraatteedd rreeggiioonnaall mmuullttii--mmooddaall ttrraannssppoorrttaattiioonn
nneettwwoorrkk..
• Invest in infrastructure, facilities and services that improve connectivity, transfer and circulation in the region.
• Coordinate and integrate with other regional rail, mass transit, and roadway projects.
• Maintain working relationships with transportation partners, including the FTA, FDOT, Regional Transportation Authority, MPOs,
Counties, Cities, Regional Planning Councils, Business Groups, Florida East Coast Industries, and other stakeholders.
• Avoid or minimize duplication of premium transportation services.
• Coordinate with other transportation and land use planning efforts that are supportive of transit options.
• Accommodate a proposed greenway along the corridor.
GGooaall 33:: EEnnccoouurraaggee tthhee iimmpplleemmeennttaattiioonn ooff ttrraannssiitt ssuuppppoorrttiivvee ddeevveellooppmmeenntt..
• Locate transit stations where higher density development exists or can readily be accommodated and near activity centers.
• Complement and support economic development/redevelopment and potential joint development activities that include a mix of uses
and affordable housing, within the study area.
• Establish a transit improvement that will contribute, guide and support the urban, transit-oriented scale envisioned for the various
downtowns, commercial corridors and abutting residential areas.
• Facilitate creation of transit-supportive and context sensitive development guidelines, zoning and policies.
• Provide transit that complements the scale and character of neighborhoods, housing, and business developments.
GGooaall 44:: MMiinniimmiizzee aaddvveerrssee iimmppaaccttss ttoo tthhee ccoommmmuunniittyy aanndd llooccaall bbuussiinneesssseess..
• Minimize or mitigate adverse local traffic, parking and safety impacts.
• Minimize or mitigate adverse noise and vibration impacts.
• Avoid or minimize adverse impacts to minority and low income communities.
• Minimize adverse right-of-way and physical impacts to established communities and businesses.
• Optimize the use of existing infrastructure and transportation corridors for expansion of transit.
GGooaall 55:: PPrreesseerrvvee aanndd eennhhaannccee tthhee eennvviirroonnmmeenntt..
• Minimize or mitigate adverse impacts to existing environmental resources.
• Preserve historical and cultural resources.
• Provide transit options that reduce traffic congestion and energy consumption.
• Protect environmentally sensitive areas.
• Improve regional air quality by promoting alternative transportation modes and reducing auto emissions.
GGooaall 66:: PPrroovviiddee aa ccoosstt--eeffffeeccttiivvee ttrraannssppoorrttaattiioonn ssoolluuttiioonn ttoo mmeeeett iiddeennttiiffiieedd ttrraavveell nneeeeddss..
• Ensure that the investment strategy for the corridor will be eligible to receive federal funding.
• Optimize transportation funding resources and obtain local financial support.
• Explore lower technology cost solutions, where applicable, than can be upgraded over time to a higher transit technology solution based
on changing needs.