sf-1617 evaluation of soils for suitability for tile
TRANSCRIPT

www.ag.ndsu.edu ■ 1
Evaluation of Soils for Suitability for Tile Drainage Performance
which the tile functions properly when fi rst installed, but within a few growing seasons, the effi cacy or performance may appear to decrease and areas in fi elds may not appear to drain as expected. This may be from changes in soil chemistry due to the removal of salts and resulting soil swelling and dispersion rather than improper installation of the tile drains.
Due to the high cost of tile installation, poor subsurface drainage performance can have a signifi cant economic impact on a farming operation.
The loss of subsurface drainage effectiveness may be due, in part, to tile being placed in or below a zone of sodic or saline-sodic subsoils. The sodic or saline-sodic characteristics often are not noted readily at the soil surface. Characteristics of saline, sodic and saline-sodic soils are shown in Table 1.
Table 1. Characteristics of saline, sodic and saline-sodic soils (from USDA Handbook no. 60).
Exchangeable Sodium Electrical Sodium AdsorptionSoil type pH Conductivity (EC)† Percentage (ESP) Ratio (SAR)
mmhos/cm % Saline <8.5 >4 <15 <13Sodic >8.5 <4 >15 >13Saline-sodic <8.5 >4 >15 >13
† mmhos/cm – millimhos per centimeter; 1mmhos/cm = 1 deci-Siemen per meter (dS/m)
Larry J. CihacekAssociate Professor, Soil Science
Dave FranzenExtension Soil Specialist
Xinhua JiaAssistant Professor, Ag and Biosystems Engineering
Roxanne JohnsonExtension Water Quality Associate
Tom SchererExtension Agricultural Engineer
The presence of salts and high water tables in North Dakota soils due to an extended climactic wet cycle recently has stimulated interest in the installa-tion of tile drainage systems. The tile controls the water table and encour-ages the leaching and removal of salts from the soil above the tile lines. This improves soil productivity, culminating in improved crop yields.
Other advantages of drainage include lower crop production risks, increasing management options, reduced seasonal wetness and improved timeliness of fi eld operations. On the other hand, the cost of installation and maintenance, wetland issues, outfl ow management, the need for water in dry seasons and strained relationships with neighbors may be disadvantages associated with drainage.
Although soil drainage is usually successful, instances may occur in
SF-1617
August 2012
Photo by Hans Kandel

2 ■ SF-1617 Evaluation of Soils for Suitability for Tile Drainage Performance
Tile installed in soils or subsoils that are sodic or saline-sodic often will function normally for a period of time after installation because these soils often contain divalent (2+ charged) calcium (Ca2+) and magnesium (Mg2+) salts that maintain the soil materials in an adequately fl occulated state (maintain soil structure) under natural moisture conditions.
But, when the soils are drained and excess water is removed, the divalent salts also are removed, with the water leaving the soil material above or around the tile line saturated with monovalent (1+ charged) sodium (Na+). When this occurs, the soils lose their natural structure and become dispersed. This could cause sealing of the soil above and/or around the tile lines, resulting in ineffective drainage.
Reduced drainage performance is more likely to occur in fi nely textured (silty or clayey) soils and to a much lesser extent in coarser-textured (sandy) soils. Once drainage performance is reduced, little can be done economically to restore the effectiveness of the drainage system.
However, producers can take precautions prior to tile installation on soils where drainage performance is likely to occur. These precautions include: (1) knowing the soil series (soil types) in the fi eld under consider-ation for drainage, (2) evaluating the soil chemical characteristics for each of the soils mapped in the fi eld, (3) evaluating the soil properties for suitability for having tile installed and (4) verifying soil types and chemical characteristics (items 1 and 2 above) by deep soil sampling and testing. Using these precautions can help avoid installation of drain lines where poor subsurface drainage performance is likely.
Knowledge of Soil SeriesThe occurrence of a specifi c soil series, types or map units on a parcel of land under consideration for drainage can be obtained from a county soil survey map or online from the U.S. Depart-ment of Agriculture-Natural Resources Conservation Service’s Web Soil Survey (http://websoilsurvey.nrcs.usda.gov). The soil series listed in Tables 2 and 3 are soils that are most likely to have dispersion problems when drained.
Also, soils with the greatest probability of drainage problems are those soils with pH values greater than 8.5 in the surface or subsurface zones. A pH greater than 8.5 often indicates high sodium (Na+) saturation, which could lead to tile sealing when salts are leached out of the soil above the tile line. If any of the soils listed in Tables 2 and 3 occur in the parcel of land to be drained, the soil chemical characteristics need to be evaluated.
Most drainage system designers and installers evaluate soil texture in a fi eld as a part of the system design process. However, soil chemical characteristics are not normally part of this process. Preliminary evaluation of soil chemical characteristics can be accomplished using the soil chemical data embedded in the Web Soil Survey. In addition, a soil drainage suitability rating for North Dakota soils is available in the Web Soil Survey.
Using Web Soil SurveyThe Web Soil Survey is an Internet-based digital product provided by the USDA Natural Resources Conservation Service at http://websoilsurvey.nrcs.usda.gov. Most soils in North Dakota can be evaluated from maps and information contained in the Web Soil Survey. Figures 1-4 are an example of how to access this information from a personal computer or other device with Internet access.
Table 2. Soil series with sodium-affected subsoils.
Aberdeen Ferney Mekinock RyanCamtown Harriet Miranda StirumCathay Heil Nahon TottenCavour Larson Niobell TurtonCresbard Lemert Noonan UrandaDaglum Letcher Ojata Easby Ludden Playmoor Exline Manfred Ranslo
Table 3. Soil series with potentially sodium-affected subsoils.
Antler Fargo Karlsruhe ReisArveson Fossum Kratka RockwellAugsburg Fram Koto RolissBearden Gilby Lamoure RosewoodBohnsack Glyndon Lowe ThiefriverBorup Grano McKranz UlenClearwater Grimsted Mantador VallersColvin Gunclub Marysland VikingCubden Hamerly Moritz WheatvilleDivide Hedman Nielsville WingerEaglesnest Hegne Northcote WyndmereElmville Holmquist Putney WyreneEnloe Huffton Regan

www.ag.ndsu.edu ■ 3
Evaluation of Soil Chemical CharacteristicsSoil chemical properties can be evalu-ated utilizing the “Soil Data Explorer” tab in the Web Soil Survey. Once a parcel of land is selected, choosing the “Soil Chemical Properties” menu in “Soil Data Explorer” provides options for soil evaluation, which will bring up a menu of several chemical characteristics that can be evaluated.
The characteristic of interest for this soil evaluation is the sodium adsorption ratio (SAR). Clicking on “Sodium Adsorption Ratio” will bring up an interactive area where depths to be evaluated can be specifi ed in inches or centimeters (cm). A general evaluation of SAR to a depth of 5 feet (150 cm) can give a realistic evaluation of soil chemical properties.
However, for greater accuracy, the evaluation should be carried out for successive 1-foot increments to a minimum depth of 5 feet, or at least 2 feet below the deepest depth of the drain line. For each increment, a colored fi eld map will appear over the photo base map showing the level of hazard related to each soil type.
A table with an interpretation and average electrical conductivity (EC) or SAR values accompanies the map and interpretative information. In this evaluation, red, green and
yellow generally indicate lower hazards, while blue indicates higher hazards. Dark blue indicates the highest hazard. Maps for each depth increment can be printed for reference.
The information contained in these evaluations is generalized for each soil series or map unit based on the total composition of the map unit. The data for each map unit is populated with chemical and physical property information that is aggregated from various soil laboratories and the National Soil Survey Laboratory. This information may change from time to time as the database is updated.
Each mapping unit provides four options for evaluating the soil layers. Because each soil mapping unit includes small areas of varying size of soils that may not be suitable for drainage, using the worst-case scenario is important to identify soils that can contribute to problems with subsurface drainage.
The four choices for soil map unit evaluation are: (1) evaluation of all soil components, (2) evaluation of dominant soil components, (3) evaluation of dominant soil condition and (4) evaluation of a weighted average of all soil components.
Figure 1.
To access the Web Soil Survey (http://websoilsurvey.nrcs.usda.gov),
click on the large green “START WSS” button near the top
of the page.

4 ■ SF-1617 Evaluation of Soils for Suitability for Tile Drainage Performance
Figure 5 (page 7) illustrates a comparison of these four choices for a general evaluation of the 5-foot (150-cm) depth zone of an actual parcel of land with sodium-affected subsoils.
Table 4 shows a comparison of the associated soil SAR ratings with these evaluations. As shown in Table 4, evaluating the soil map units on the basis of all components will give the ratings for the most limiting soils within the map unit and provide for identifi cation of the highest risk (or worst-case) scenarios.
Data embedded in the Web Soil Survey is based on typical characterization sites across the normal geographic range of the occurrence of a specifi c soil type. Due to natural variability, the soils in the parcel of interest may vary from the “typical” map unit of the soil designated when the soil survey was conducted.
In addition, detailed variability and small inclusions within a soil map unit are diffi cult to show at the scale
of typical soil surveys. Thus, a more detailed survey of the fi eld to be drained will be useful for determining whether problems with subsurface drainage may exist.
All soils with an SAR value of greater than 6 should be sampled for detailed chemical characterization. A qualifi ed professional soil scientist or classifi er should be consulted when making these evaluations.
Figure 2.
The Web Soil Survey navigation page. Note the 10 different “Quick Navigation” methods to get the parcel of land of interest. Another method is to use the mouse to repeatedly draw a rectangle around the area of interest until the fi eld of interest is highlighted.
www.ag.ndsu.edu ■ 5
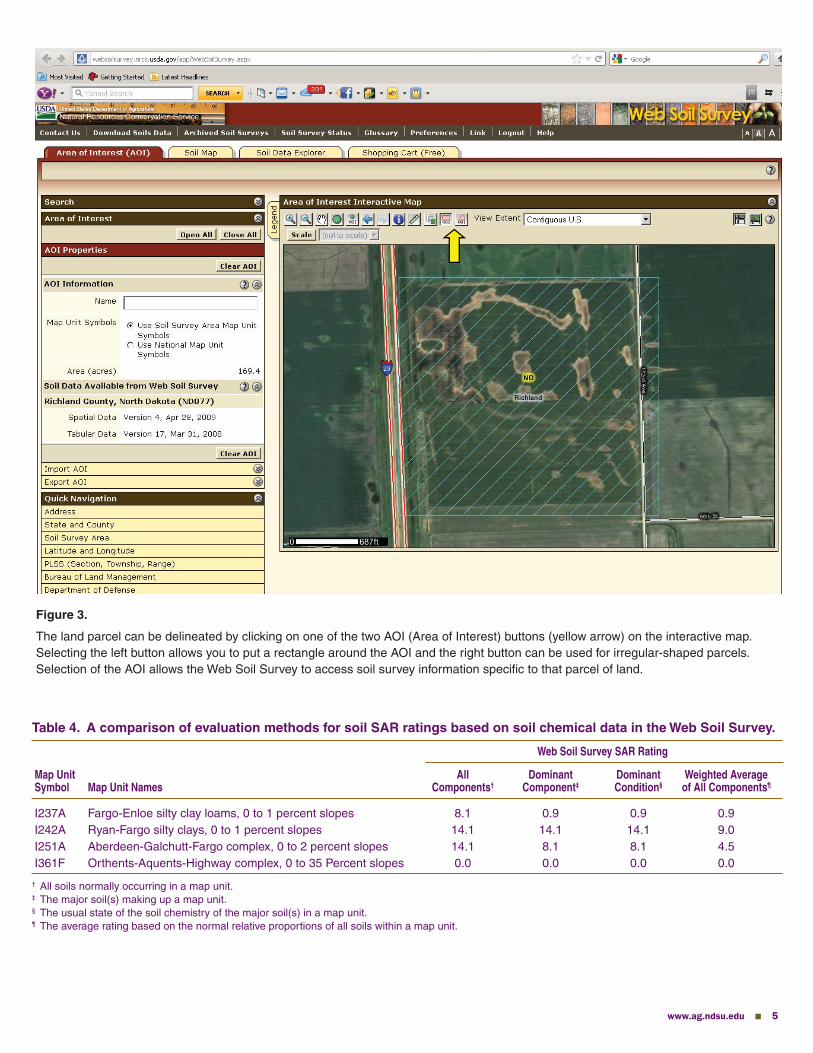
Figure 3.
The land parcel can be delineated by clicking on one of the two AOI (Area of Interest) buttons (yellow arrow) on the interactive map. Selecting the left button allows you to put a rectangle around the AOI and the right button can be used for irregular-shaped parcels. Selection of the AOI allows the Web Soil Survey to access soil survey information specifi c to that parcel of land.
Table 4. A comparison of evaluation methods for soil SAR ratings based on soil chemical data in the Web Soil Survey.
Web Soil Survey SAR Rating
Map Unit All Dominant Dominant Weighted AverageSymbol Map Unit Names Components† Component‡ Condition§ of All Components¶
I237A Fargo-Enloe silty clay loams, 0 to 1 percent slopes 8.1 0.9 0.9 0.9I242A Ryan-Fargo silty clays, 0 to 1 percent slopes 14.1 14.1 14.1 9.0I251A Aberdeen-Galchutt-Fargo complex, 0 to 2 percent slopes 14.1 8.1 8.1 4.5I361F Orthents-Aquents-Highway complex, 0 to 35 Percent slopes 0.0 0.0 0.0 0.0
† All soils normally occurring in a map unit.‡ The major soil(s) making up a map unit.§ The usual state of the soil chemistry of the major soil(s) in a map unit.¶ The average rating based on the normal relative proportions of all soils within a map unit.
6 ■ SF-1617 Evaluation of Soils for Suitability for Tile Drainage Performance
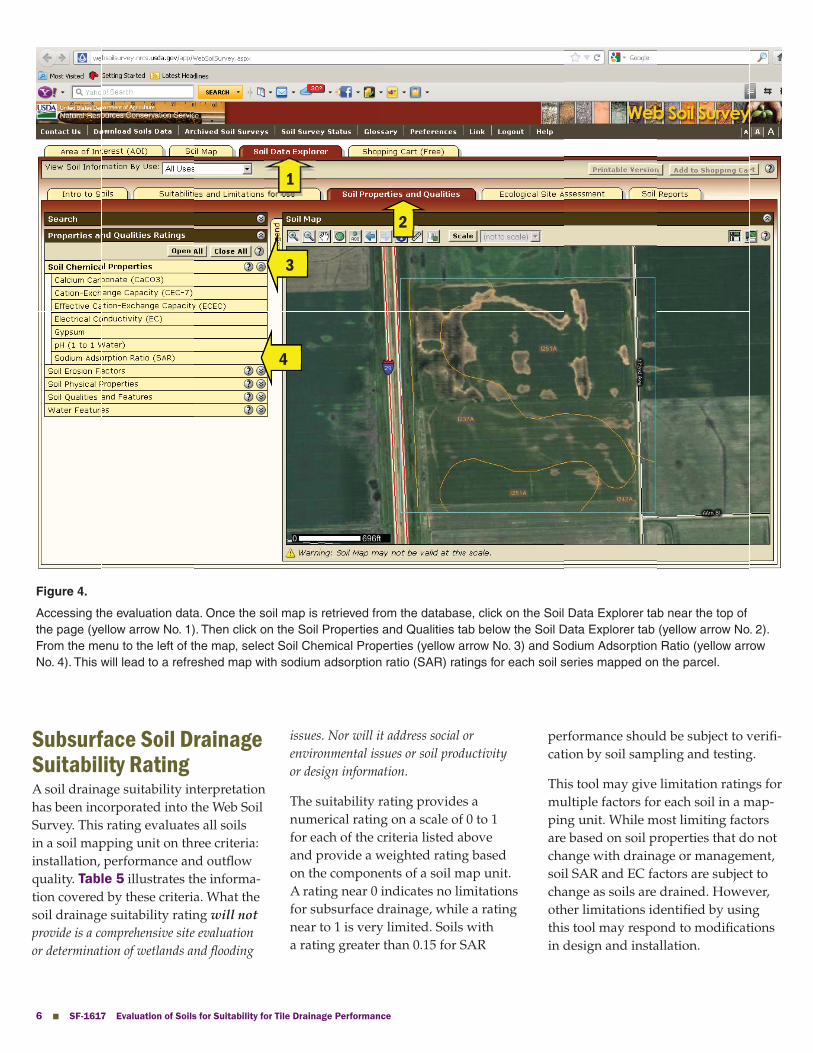
Figure 4.
Accessing the evaluation data. Once the soil map is retrieved from the database, click on the Soil Data Explorer tab near the top of the page (yellow arrow No. 1). Then click on the Soil Properties and Qualities tab below the Soil Data Explorer tab (yellow arrow No. 2). From the menu to the left of the map, select Soil Chemical Properties (yellow arrow No. 3) and Sodium Adsorption Ratio (yellow arrow No. 4). This will lead to a refreshed map with sodium adsorption ratio (SAR) ratings for each soil series mapped on the parcel.
Subsurface Soil Drainage Suitability RatingA soil drainage suitability interpretation has been incorporated into the Web Soil Survey. This rating evaluates all soils in a soil mapping unit on three criteria: installation, performance and outfl ow quality. Table 5 illustrates the informa-tion covered by these criteria. What the soil drainage suitability rating will not provide is a comprehensive site evaluation or determination of wetlands and fl ooding
issues. Nor will it address social or environmental issues or soil productivity or design information.
The suitability rating provides a numerical rating on a scale of 0 to 1 for each of the criteria listed above and provide a weighted rating based on the components of a soil map unit. A rating near 0 indicates no limitations for subsurface drainage, while a rating near to 1 is very limited. Soils with a rating greater than 0.15 for SAR
performance should be subject to verifi -cation by soil sampling and testing.
This tool may give limitation ratings for multiple factors for each soil in a map-ping unit. While most limiting factors are based on soil properties that do not change with drainage or management, soil SAR and EC factors are subject to change as soils are drained. However, other limitations identifi ed by using this tool may respond to modifi cations in design and installation.
1
2
3
4

www.ag.ndsu.edu ■ 7
Figure 5.
General evaluation of soil SAR in the 5-foot depth zone: (a) evaluation of dominant component, (b) evaluation of dominant condition, (c) evaluation of weighted average of all components and (d) evaluation of all soil components in each map unit.
Note that for this fi eld, Figures 5 a, b and c are identical, but that may not be true for all land parcels.
Evaluation of all components within each map unit provides the most stringent information regarding soil SAR conditions. Dark blue indicates a high degree of SAR hazard. (See Table 4 for SAR ratings.)
The soil drainage suitability rating is not designed to tell the landowner, land manager or tile installer that a fi eld should or should not be drained. The rating mainly is designed to present information that can be used in making a decision whether drainage is a suitable option as a land treatment.
Table 5. Criteria evaluated in subsurface drainage suitability ratings for subsurface water management in the Web Soil Survey.
Installation Performance Outfl ow Quality Agronomic Concerns
Depth to bedrock Presence of Soil salinity Plant establishmentor cemented pan dense layers in soil
Stability of Soil permeability Pesticide and Plant growthexcavations nutrient potential
Amount of soil clay Flooding Soil cracking Soil erosion potential
Presence of stones Surface pH Physical limitations
Slope gradient Soil sodium content Pesticide and nutrient Soil gypsum content management Soil subsidence Sedimentation
a.
b.
c.
d.
Stability of Soil permeability Pesticide and Plant growthexcavations nutrient potential
8 ■ SF-1617 Evaluation of Soils for Suitability for Tile Drainage Performance
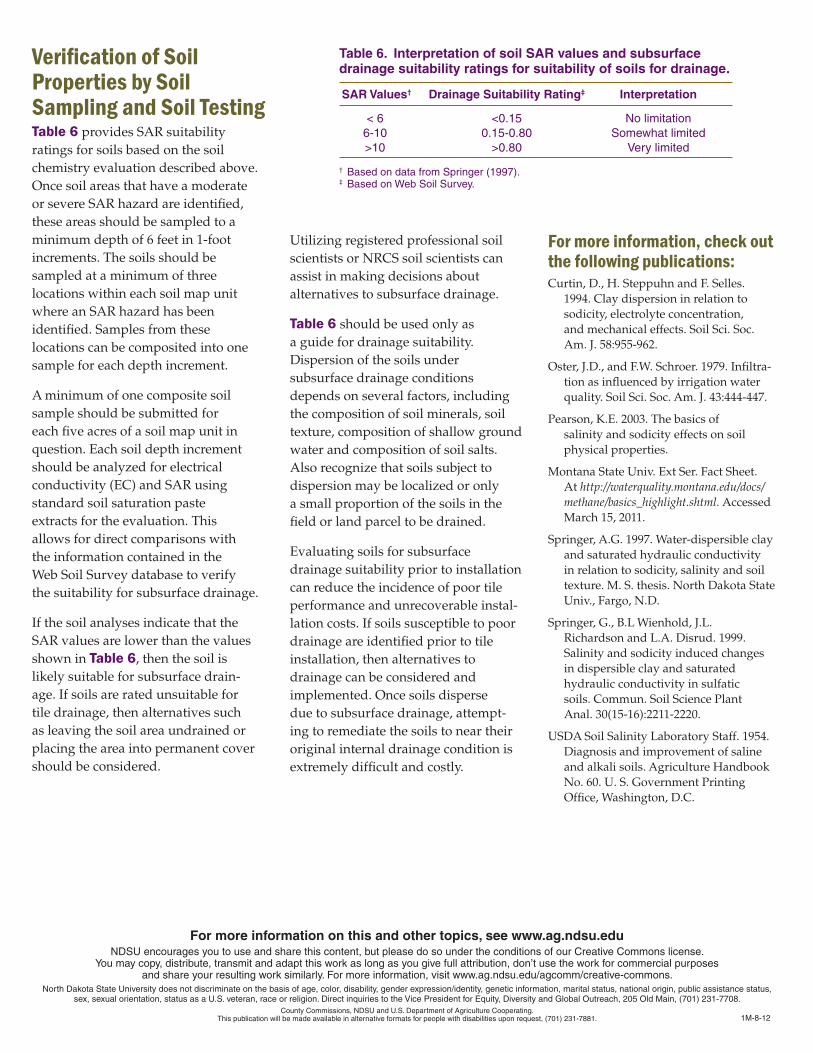
Verifi cation of Soil Properties by Soil Sampling and Soil TestingTable 6 provides SAR suitability ratings for soils based on the soil chemistry evaluation described above. Once soil areas that have a moderate or severe SAR hazard are identifi ed, these areas should be sampled to a minimum depth of 6 feet in 1-foot increments. The soils should be sampled at a minimum of three locations within each soil map unit where an SAR hazard has been identifi ed. Samples from these locations can be composited into one sample for each depth increment.
A minimum of one composite soil sample should be submitted for each fi ve acres of a soil map unit in question. Each soil depth increment should be analyzed for electrical conductivity (EC) and SAR using standard soil saturation paste extracts for the evaluation. This allows for direct comparisons with the information contained in the Web Soil Survey database to verify the suitability for subsurface drainage.
If the soil analyses indicate that the SAR values are lower than the values shown in Table 6, then the soil is likely suitable for subsurface drain-age. If soils are rated unsuitable for tile drainage, then alternatives such as leaving the soil area undrained or placing the area into permanent cover should be considered.
Utilizing registered professional soil scientists or NRCS soil scientists can assist in making decisions about alternatives to subsurface drainage.
Table 6 should be used only as a guide for drainage suitability. Dispersion of the soils under subsurface drainage conditions depends on several factors, including the composition of soil minerals, soil texture, composition of shallow ground water and composition of soil salts. Also recognize that soils subject to dispersion may be localized or only a small proportion of the soils in the fi eld or land parcel to be drained.
Evaluating soils for subsurface drainage suitability prior to installation can reduce the incidence of poor tile performance and unrecoverable instal-lation costs. If soils susceptible to poor drainage are identifi ed prior to tile installation, then alternatives to drainage can be considered and implemented. Once soils disperse due to subsurface drainage, attempt-ing to remediate the soils to near their original internal drainage condition is extremely diffi cult and costly.
For more information, check out the following publications:Curtin, D., H. Steppuhn and F. Selles.
1994. Clay dispersion in relation to sodicity, electrolyte concentration, and mechanical effects. Soil Sci. Soc. Am. J. 58:955-962.
Oster, J.D., and F.W. Schroer. 1979. Infi ltra-tion as infl uenced by irrigation water quality. Soil Sci. Soc. Am. J. 43:444-447.
Pearson, K.E. 2003. The basics of salinity and sodicity effects on soil physical properties.
Montana State Univ. Ext Ser. Fact Sheet. At http://waterquality.montana.edu/docs/methane/basics_highlight.shtml. Accessed March 15, 2011.
Springer, A.G. 1997. Water-dispersible clay and saturated hydraulic conductivity in relation to sodicity, salinity and soil texture. M. S. thesis. North Dakota State Univ., Fargo, N.D.
Springer, G., B.L Wienhold, J.L. Richardson and L.A. Disrud. 1999. Salinity and sodicity induced changes in dispersible clay and saturated hydraulic conductivity in sulfatic soils. Commun. Soil Science Plant Anal. 30(15-16):2211-2220.
USDA Soil Salinity Laboratory Staff. 1954. Diagnosis and improvement of saline and alkali soils. Agriculture Handbook No. 60. U. S. Government Printing Offi ce, Washington, D.C.
Table 6. Interpretation of soil SAR values and subsurface drainage suitability ratings for suitability of soils for drainage.
SAR Values† Drainage Suitability Rating‡ Interpretation
< 6 <0.15 No limitation 6-10 0.15-0.80 Somewhat limited >10 >0.80 Very limited
† Based on data from Springer (1997).‡ Based on Web Soil Survey.
For more information on this and other topics, see www.ag.ndsu.eduNDSU encourages you to use and share this content, but please do so under the conditions of our Creative Commons license.
You may copy, distribute, transmit and adapt this work as long as you give full attribution, don’t use the work for commercial purposes and share your resulting work similarly. For more information, visit www.ag.ndsu.edu/agcomm/creative-commons.
North Dakota State University does not discriminate on the basis of age, color, disability, gender expression/identity, genetic information, marital status, national origin, public assistance status, sex, sexual orientation, status as a U.S. veteran, race or religion. Direct inquiries to the Vice President for Equity, Diversity and Global Outreach, 205 Old Main, (701) 231-7708.
County Commissions, NDSU and U.S. Department of Agriculture Cooperating. This publication will be made available in alternative formats for people with disabilities upon request, (701) 231-7881. 1M-8-12