seyyed mohammad hossein abtahi persistent contaminants post-use due to their high colloidal...
TRANSCRIPT
Implications of Shape Factors on Fate, Uptake, and Nanotoxicity of Gold Nanomaterials
Seyyed Mohammad Hossein Abtahi
Dissertation submitted to the faculty of the Virginia Polytechnic Institute and State University in
partial fulfillment of the requirements for the degree of
Doctor of Philosophy
In
Civil Engineering
Peter J. Vikesland Chair
Richey M. Davis
Williams A. Ducker
Catherine J. Murphy
Linsey C. Marr
April 19, 2018
Blacksburg, VA 24061
Keywords:
Nanotechnology, nanomaterials, nanotoxicity, gold nanoparticles, gold nanorods, aggregation, colloidal stability, filter-feeders, Corbicula fluminea, fate and transport, Vis-NIR spectroscopy, TEM, Dynamic light
scattering (DLS)
Implications of Shape Factors on Fate, Uptake, and Nanotoxicity of Gold Nanomaterials
Seyyed Mohammad Hossein Abtahi
ABSTRACT
Noble metal nanoparticles such as gold and silver are of interest because of the unique
electro-optical properties (e.g., localized surface plasmon resonance [LSPR]) that
originate from the collective behavior of their surface electrons. These nanoparticles are
commonly developed and used for biomedical and industrial application. A recent report
has predicted that the global market for gold nanoparticles will be over 12.7 tons by year
2020. However, these surface-functionalized nanoparticles can be potential
environmental persistent contaminants post-use due to their high colloidal stability in the
aquatic systems. Despite, the environmental risks associated with these nanoparticles,
just a few studies have investigated the effect of nanofeature factors such as size and
shape on the overall fate/transport and organismal uptake of these nanomaterials in the
aquatic matrices.
This study presents a comprehensive approach to evaluate the colloidal stability,
fate/transport, and organismal uptake of these nanoparticles while factoring in the size
and shape related properties. We demonstrate the importance and effect of anisotropicity
of a gold nanoparticle on the colloidal behavior and interaction with ecologically
susceptible aquatic biota. We also show how readily available characterization
techniques can be utilized to monitor and assess the fate/transport of this class of
nanoparticles. We further describe and investigate the relationship between the aspect
ratio (AR) of these elongated gold nanoparticles with clearance mechanisms and rates
from the aquatic suspension columns including aggregation, deposition, and
biopurification. We illustrate how a fresh water filter-feeder bivalve, Corbicula fluminea,
can be used as a model organism to study the size and shape-selective biofiltration and
nanotoxicity of elongated gold nanoparticles. The results suggest that biofiltration by C.
fluminea increases with an increase in the size and AR of gold nanoparticle. We develop
a simple nanotoxicity assay to investigate the short-term exposure nanotoxicity of gold
nanoparticles to C. fluminea. The toxicity results indicate that for the tested concentration
and exposure period that gold nanoparticles were not acutely toxic (i.e., not lethal).
However, gold nanoparticles significantly inhibited the activities of some antioxidant
enzymes in gill and digestive gland tissues. These inhibitions could directly affect the
resistance of these organisms to a secondary stressor (temperature, pathogens, hypoxia
etc.) and threaten organismal health.
Implications of Shape Factors on Fate, Uptake, and Nanotoxicity of Gold Nanomaterials
Seyyed Mohammad Hossein Abtahi
GENERAL AUDIENCE ABSTRACT
Nanoparticles are fine particles that cannot be seen with naked eye and possess unique
chemical and physical properties. Gold and silver nanoparticles are specifically of interest
due to tunable optical properties and are commonly developed and used for biomedical
and industrial applications. Unfortunately, these metallic nanoparticles can be potential
environmental persistent contaminants post-use in the soil and aquatic systems. Despite,
the environmental risks associated with these metallic nanoparticles, just a few studies
have investigated the effect of size and shape of these nanoparticles on their interaction
and transportation in the surrounding environment and with existing organisms.
This study presents a comprehensive approach to evaluate the stability, transportation,
and organismal uptake of these nanoparticles while factoring in the size and shape
related properties. We also show how readily available detection techniques can be
utilized to monitor and assess the presence and transport of this class of nanoparticles.
We illustrate how a fresh water bivalve, Corbicula fluminea, can be used as a model
organism to study the size and shape-selective uptake and toxicity of gold nanoparticles.
The results suggest that nanoparticles uptake by C. fluminea increases with an increase
in the size of gold nanoparticle. We develop a simple toxicity assay to investigate the

short-term exposure toxicity of gold nanoparticles to C. fluminea. The toxicity results
suggest that for the tested concentration and exposure period that gold nanoparticles
were not acutely toxic (i.e., not lethal) but affect the resistance of these organisms to an
environmental change (temperature, pathogens, hypoxia etc.) and threaten organismal
health.

vi
Dedication
Dedicated to Farzaneh Heidary and Sadegh Abtahi, my parents—thank you for your love
and support these past five years, and the countless sacrifices you’ve made so that I can
have this opportunity.
vii
Acknowledgements
I am grateful to the people who made it possible for me to do my doctoral research at
Virginia Tech. Foremost, I would like to express my sincere gratitude to my advisor Prof.
Peter Vikesland for the continuous support of my Ph.D. study and research, for his
patience, motivation, enthusiasm, and immense knowledge. His guidance helped me in
all the time of research and writing of this dissertation. Special thanks to Prof. Richey
Davis, my committee member and my M.Sc. advisor and to committee members Prof.
Linsey Marr, Prof. Catherine Murphy, and Prof. William Ducker whose encouragement
and critical research insights have been invaluable these past five years. I express much
gratitude to the National Science Foundation (NSF) and Environmental Engineering
programs, the Center for Environmental Implications of Nanotechnology (CEINT) at Duke
University, and the VT Institute for Critical Technology and Applied Science (ICTAS) for
generous funding support and creating opportunities for interdisciplinary research and
professional development. Special thanks to Beth Lucas, and Bonnie Franklin in CEE
Department. Special thanks to past and present labmates particularly Dr. Weinan Leng,
Dr. Matt Chan, Dr. Haoran Wei, and Dr. Marjorie Willner. Thank you to my collaborators
and friends across the VT campus: Steve McCartney, Christopher Winkler, and Jeffery
Parks. Many thanks to my collaborators at Dr. Di Giulio’s lab at Duke university specially
Dr. Rafael Trevisan who helped with the toxicity studies. A special thank you to my
parents, Farzaneh and Sadegh Abtahi, who taught me the value of hard work and
compassion towards others.

viii
Table of Contents
Chapter 1. Introduction .................................................................................................. 1
1.1 Background ............................................................................................................ 1
1.2 Research objectives ............................................................................................... 6
1.3 Dissertation outline ................................................................................................ 9
1.4 References ........................................................................................................... 10
Chapter 2. Implications of Aspect Ratio on Uptake and Nanotoxicity of Gold
Nanomaterials ............................................................................................................ 16
2.1 Abstract ................................................................................................................ 17
2.2 Introduction .......................................................................................................... 18
2.3 Materials and methods ......................................................................................... 20
2.4 Results and disscusion ........................................................................................ 28
2.5 Conclusions ......................................................................................................... 45
2.6 References ........................................................................................................... 45
2.7 Supporting information ......................................................................................... 56
Chapter 3. Sulfate Mediated End-to-End Assembly of Gold Nanorods ....................... 60
3.1 Abstract ................................................................................................................ 61
3.2 Introduction .......................................................................................................... 62
3.3 Materials and methods ......................................................................................... 64
3.4 Results and disscusion ........................................................................................ 66
3.5 Conclusions ......................................................................................................... 86
3.6 Acknowledgemnets .............................................................................................. 87
3.7 References ........................................................................................................... 87
3.8 Supporting information ......................................................................................... 97
Chapter 4. Size, Shape, and Surface Coating Impacts on the Colloidal Stability and
Aggregation Rate of Gold Nanoparticles in Aquatic Matrices .................................. 118
4.1 Abstract .............................................................................................................. 119
4.2 Introduction ........................................................................................................ 119
4.3 Materials and methods ....................................................................................... 122
4.4 Results and disscusion ...................................................................................... 125
4.5 References ......................................................................................................... 136
4.6 Supporting information ....................................................................................... 144
ix
Chapter 5. Environmental Implications and Future Works ........................................ 152
5.1 Environmental implications ................................................................................ 152
5.2 Summary and future works ................................................................................ 154
5.3 References ......................................................................................................... 155
Appendix A. Plasmonic Colorimetric and SERS Sensors for Environmental Analysis 157
A1.1 Introduction ...................................................................................................... 160
A1.2 Background and photonics .............................................................................. 163
A1.3 Colorimetric detection ...................................................................................... 170
A1.4 SERS detection ............................................................................................... 178
A1.5 Challenges ....................................................................................................... 192
A1.6 Acknowledgements ......................................................................................... 193
A1.7 References ...................................................................................................... 194
x
List of Figures
Chapter 2. Implications of Aspect Ratio on Uptake and Nanotoxicity of Gold
Nanomaterials…...……………………………………………………………………………16
Figure 2.1. Vis-NIR normalized absorption and TEM images of synthesized AuNPs and
AuNRs prior to BSA coating .......................................................................................... 28
Figure 2.2. A) Elemental gold concentration in suspension column versus time within the
72 hour time course of the uptake study. The dashed lines indicate the upper and lower
95% confidence intervals. The data points are connected with straight lines to illustrate
the depletion of nanoparticles from the suspension column. B) Clearance rate
calculations as fitted by first order kinetic rate modeling. The linear regressions and line
equations represent the first order kinetic expressions. ................................................ 30
Figure 2.3. Elemental gold ICP-MS measurements presenting the gold content present
in different tissues and on the top of the clam shells as expressed in mass percentages
versus the initial gold mass ........................................................................................... 35
Figure 2.4. Rutherford backscattering SEM images of BSA coated AuNPs and AuNRs
adsorbed on the clams’ shells. A) 19 nm AuNPs B) 45 nm AuNPs C) AR4 AuNRs D) AR8
AuNRs. .......................................................................................................................... 37
Figure 2.5. TEM images of AuNPs and AuNRs present in the clam’s organic wastes. The
samples are collected after experiment termination and prepared by drop cast technique
A) 19 nm AuNP B) 45 nm AuNP C) AR4 AuNR D) AR8 AuNR ..................................... 38
Figure 2.6. Activity of antioxidant enzymes related to peroxide breakdown in clams
exposed to ionic gold and different types of gold nanoparticles. Activities of glutathione
peroxidase (GPx, A and C) and catalase (Cat, B and D) were analyzed in the gills (left)
and digestive gland (right). Data were analyzed by one-way ANOVA and Tukey’s post
hoc or Kruskal-Wallis and Dunn’s post hoc tests, when appropriate. No significant
differences were detected (p > 0.05, n = 10-12). ........................................................... 39
xi
Figure 2.7. Activity of thiol reductase antioxidant enzymes in clams exposed to ionic gold
and different types of gold nanoparticles. Activities of glutathione reductase (GR, A and
C) and thioredoxin reductase (TrxR, B and D) were analyzed in the gills (left) and digestive
gland (right). Data were analyzed by one-way ANOVA and Tukey’s post hoc or Kruskal-
Wallis and Dunn’s post hoc tests, when appropriate. Groups not sharing letters are
significantly different (p<0.05, n=10-12). ....................................................................... 41
Figure 2.8. Protein damage in gills and digestive gland of clams exposed to ionic gold
and different types of gold nanoparticles. The levels of reduced protein thiols (P-SH, A
and C) and protein carbonyl groups (P-CO, B and D) were analyzed in the gills (left) and
digestive gland (right). Data were analyzed by one-way ANOVA and Tukey’s post hoc or
Kruskal-Wallis and Dunn’s post hoc tests, when appropriate. Groups not sharing letters
are significantly different (p<0.05, n=9-12). ................................................................... 44
Figure 2.S1. TEM images of synthesized citrate coated A&B) Small GNPs (19 nm) C&D)
large GNPs (45 nm). ..................................................................................................... 56
Figure 2.S2. TEM images of synthesized A&B) CTAB coated AR4 AuNRs C&D)
CTAB/BDAC AR8 AuNRs ............................................................................................. 57
Chapter 3. Sulfate Mediated End-to-End Assembly of Gold Nanorods .................. 60
Figure 3.1. Vis-NIR extinction spectrum for the synthesized CTAB-GNRs after centrifugal
purification and washing. Inset: Transmission electron micrograph of CTAB-GNRs ..... 67
Figure 3.2. Vis-NIR extinction spectra of 1.1×10¹⁴ GNRs/L exposed to A) 2 mM CaSO4
and B) 2 mM MgSO4 from zero hours (red spectra) to 24 hours (blue spectra). Changes
in the average normalized transverse band and longitudinal band extinction maxima of
CTAB-GNRs (1.1×10¹⁴ GNRs/L) in 1-5 mM CaSO4 and MgSO4 solutions as a function
of exposure time. (C) Transverse band-CaSO4 (D) Longitudinal band-CaSO4 (E)
Transverse band-MgSO4 (F) Longitudinal band- MgSO4 ............................................. 70
xii
Figure 3.3. A) Representative AFM image of CTAB-GNRs after 3 h exposure to 2 mM
CaSO4, B) TEM image of CTAB-GNRs after 3 h exposure to 2 mM CaSO4, C) TEM
image of CTAB-GNRs after 10 h exposure to 2 mM CaSO4 ......................................... 73
Figure 3.4. A) Plasmon band wavelengths of different GNR end-to-end assemblies as
calculated by extended Mie theory. B) Exemplary Figure 3.illustrating quality of fit for
experimental vs. fitted Vis-NIR spectrum for GNRs exposed to 5 mM MgSO4 after 1 hr.
The magnitudes of individual extinction bands are illustrated ....................................... 75
Figure 3.5. Extinction intensities of different Lorentzian distribution band end-to-end
assemblies of GNRs exposed to three different CaSO4 concentrations A) Transverse
bands of single rod B) Longitudinal bands of single rod C) Longitudinal bands of dimer D)
Longitudinal bands of trimer E) Longitudinal bands of tetramer .................................... 77
Figure 3.6. Percentage of GNRs forming different end-to-end assemblies. Analysis of 36
TEM images taken from GNRs exposed to 2 mM CaSO4 at three different time periods.
Representative TEM images are shown Figure 3.S4 .................................................... 79
Figure 3.7. DLVO modeling of GNR particle-particle interaction potential energy for the
illustrated possible orientations of assembled CTAB-GNRs in 2 mM CaSO4 solution: (A)
End-to-End assembly, (B) End-to-Side assembly, and (C) Side-by-Side assembly ...... 84
Figure 3.S1. TEM image analysis of synthesized GNRs. The GNRs have an average
length of 28.8 0.1 nm and an average diameter of 6.6 ± 0.1 nm (the noted errors reflect
the 95% confidence interval based on n = 2104 measurements obtained using ImageJ)
...................................................................................................................................... 98
Figure 3.S2. Image of 20 mg/L CTAB-GNRs in DI water and in the presence of different
concentrations of CaSO4 after 24 hours of exposure ................................................. 100
Figure 3.S3. A) Normalized Extinction intensity of transverse band and longitudinal band
of single GNRs suspension in DI water at different concentrations B) Vis-NIR extinction
xiii
intensity of single GNRs suspension in DI water at different concentrations (Note:
C0=1.1×10¹⁴ gold nanorods/L ; spectra 1 in graph B represents this concentration) . 101
Figure 3.S4. TEM images of end-to-end assemblies of GNRs exposed to 2 mM CaSO4
after A,B,C) 3 hours; D,E,F) 10 hours; G,H,I) 24 hours ............................................... 102
Figure 3.S5. Calculated extinction intensity of dimer GNRs end-to-end assembly versus
wavelength (nm) of incident light using extended Mie theory. ..................................... 106
Figure 3.S6. Calculated extinction intensity of side-by-side and end-to-side GNRs
assemblies versus wavelength (nm) of incident light using extended Mie theory ........ 109
Figure 3.S7. Extinction intensities of different Lorentzian distribution band end-to-end
assemblies of GNRs exposed to three different MgSO4 concentrations A) Transverse
bands of single rod B) Longitudinal bands of single rod C) Longitudinal bands of dimer D)
Longitudinal bands of trimer E) Longitudinal bands of tetramer .................................. 110
Figure 3.S8. Vis-NIR extinction spectra of 4 µM CTAB-GNRs (1.1×10¹⁴ gold nanorods/L)
exposed to different concentrations of Na2SO4 and NaCl from t=0 hours (red spectrum)
to t=24 hours (blue spectrum). (A) 5 mM Na2SO4, (B) 2 mM Na2SO4, (C) 1 mM Na2SO4,
(D) 15 mM NaCl, (E) 6 mM NaCl, and (F) 3 mM NaCl ................................................ 111
Figure 3.S9. Vis-NIR extinction spectra of 4 µM CTAB-GNRs (1.1×10¹⁴ gold nanorods/L)
exposed to different concentrations of CaCl2 and MgCl2 solutions from t=0 hours (red
spectrum) to t=24 hours (blue spectrum). (A) 5 mM CaCl2, (B) 2 mM CaCl2, (C) 1 mM
CaCl2, (D) 5 mM MgCl2, (E) 2 mM MgCl2, and (F) 1 mM MgCl2 ............................... 111
Figure 3.S10. Normalized transverse band extinction maxima of 4 µM CTAB-GNRs
(1.1×10¹⁴ gold nanorods/L) in different (A) Na2SO4, (B) NaCl, (C) CaCl2, and (D) MgCl2
solutions as a function of exposure time. Insets show an expanded view of 0 to 2 hours
exposure ..................................................................................................................... 112
Figure 3.S11. Normalized longitudinal band extinction maxima of 4 µM CTAB-GNRs
(1.1×10¹⁴ gold nanorods/L) in different (A) Na2SO4, (B) NaCl, (C) CaCl2, and (D) MgCl2
xiv
solutions as a function of exposure time. Insets show an expanded view of 0 to 2 hours
exposure ..................................................................................................................... 113
Figure 3.S12. A-D: TEM image of CTAB-GNRs taken after 10 h exposure to (A) 5 mM
Na2SO4, (B) 15 mM NaCl, (C) 5 mM CaCl2, and (D) 5 mM MgCl2 solutions. All scale
bars represent 100 nm. E-H: Percentage of counted GNRs forming different end-to-end
assemblies. Analysis from E) 4 TEM images taken from GNRs exposed to 5 mM Na2SO4,
(F) 7 TEM images taken from GNRs exposed to 15 mM NaCl, (G) 3 TEM images taken
from GNRs exposed to 5 mM CaCl2, and (H) 4 TEM images taken from GNRs exposed
to 5 mM MgCl2 solutions ............................................................................................. 114
Figure 3.S13. Sulfate ion interaction with CTAB’s quaternary ammonium head group on
GNR surface ............................................................................................................... 115
Chapter 4. Size, Shape, and Surface Coating Impacts on the Colloidal Stability and
Aggregation Rate of Gold Nanoparticles in Aquatic Matrices............................... 118
Figure 4.1. Vis-NIR normalized absorption and TEM images of synthesized AuNP and
AR4 and AR8 AuNRs prior to BSA coating ................................................................. 126
Figure 4.2. Elemental gold concentration changes of monomer (colloidally stable single
nanoparticles) nanoparticles in the suspension versus time A) Citrate coated AuNP B)
CTAB coated AR4 AuNR C) CTAB/BDAC coated AR8 AuNR .................................... 130
Figure 4.3. Aggregation rates for different ionic strength solutions. A) First-order
aggregation rates for citrate AuNP B) Second order aggregation rate for CTAB AR4 AuNR
C) Second order aggregation rate for CTAB/BDAC AR8 AuNR .................................. 132
Figure 4.4. Aggregation rate half times for different non-BSA coated gold nanoparticles
versus the hardness of the exposure solutions ........................................................... 133
Figure 4.5. Water hardness distribution in the USA .................................................... 135

xv
Figure 4.S1. TEM images of synthesized A-B) 19 nm citrate AuNPs C-D) CTAB AR4
AuNRs E-F) CTAB/BDAC AR8 AuNRs ....................................................................... 146
Figure 4.S2. Vis-NIR absorption spectra of 2 mg/L Citrate coated AuNP in different ionic
strength EPA waters A) Very hard B) Hard C) Moderately hard D) Soft E) Very soft F) DI
water ........................................................................................................................... 147
Figure 4.S3. Vis-NIR absorption spectra of 2 mg/L CTAB coated AR4 AuNR in different
ionic strength EPA waters A) Very hard B) Hard C) Moderately hard D) Soft E) Very soft
F) DI water .................................................................................................................. 147
Figure 4.S4. Vis-NIR absorption spectra of 2 mg/L CTAB/BDAC coated AR8 AuNR in
different ionic strength EPA waters A) Very hard B) Hard C) Moderately hard D) Soft E)
Very soft F) DI water ................................................................................................... 148
Figure 4.S5. Elemental gold concentration changes of monomer (colloidally stable single
nanoparticles) BSA coated nanoparticles in the suspension versus time A) AuNP B) AR4
AuNR C) AR8 AuNR ................................................................................................... 148
Appendix A. Plasmonic Colorimetric and SERS Sensors for Environmental
Analysis ..................................................................................................................... 157
Figure A1.1. TEM images of silver spheres, pentagons, and triangles with different size
(above) and their size-dependent peak LSPR wavelength. The size of a silver triangle is
its edge length; the size of a silver pentagon is the distance between its opposite corners;
the size of a silver sphere is its diameter.12 Reprinted with permission from J. Mock, M.
Barbic, D. Smith, D. Schultz and S. Schultz, J. Chem. Phys., 2002, 116, 6755–6759.
Copyright 2014 American Institute of Physics ............................................................. 165
Figure A1.2. Schematic of SERS phenomenon for an organic analyte on AuNPs ..... 167
Figure A1.3 A) DNAzyme-directed assembly formation and cleavage of gold
nanoparticles in a Pb+ colorimetric sensor;102 Reprinted with permission from J. Liu and
Y. Lu, J. Am. Chem. Soc., 2003, 125, 6642–6643. Copyright 2014 American Chemical
xvi
Society. B) Schematic of the Griess reaction and Griess reaction induced aggregation of
AuNPs.14 Reprinted with permission from W. L. Daniel, M. S. Han, J. S. Lee and C. A.
Mirkin, J. Am. Chem. Soc., 2009, 131, 6362–6363. Copyright 2014 American Chemical
Society ........................................................................................................................ 173
Figure A1.4. A) Schematic of colorimetric detection of Cu2+ by etching AuNR tips by
Cu2+ in the presence of CTAB and HBr.106Reprinted with permission from Z. Zhang, Z.
Chen, C. Qu and L. Chen, Langmuir, 2014, 30, 3625–3630. Copyright 2014 American
Chemical Society. B) DNA-hybridized AuNP aggregates on a hydrophobic paper after
exposure to DNase I droplets.108 Reprinted with permission from W. Zhao, M. M. Ali, S.
D. Aguirre, M. A. Brook and Y. Li, Anal. Chem., 2008, 80, 8431–8437. Copyright 2014
American Chemical Society. C) Spent paper substrates are burnt to minimize hazardous
chemical handling.109 Reprinted with permission from S. C. Tseng, C. C. Yu, D. Wan, H.
L. Chen, L. A. Wang, M. C. Wu, W. F. Su, H. C. Han and L. C. Chen, Anal. Chem., 2012,
84, 5140–5145. Copyright 2014 American Chemical Society. .................................... 176
Figure A1.5. A) CN[n] induced AuNP aggregation with a fixed sub nanometer
gap;115 Reprinted with permission from R. W. Taylor, R. J. Coulston, F. Biedermann, S.
Mahajan, J. J. Baumberg and O. A. Scherman, Nano Lett., 2013, 13, 5985–5990.
Copyright 2014 American Chemical Society. B) Formation of 1 nm gap between AuNP
core and shell linked with a Au nanobridge.116 Reprinted with permission from D. K. Lim,
K. S. Jeon, J. H. Hwang, H. Kim, S. Kwon, Y. D. Suh and J. M. Nam, Nat. Nanotechnol.,
2011, 6, 452–460. Copyright 2014 Nature Publishing Group. C) Chemical structures of
three dithiolcarbamate pesticides.117Reproduced from B. Saute, R. Premasiri, L. Ziegler
and R. Narayanan, Analyst, 2012, 137, 5082–5087. With permission from The Royal
Society of Chemistry. Copyright 2014 The Royal Society of Chemistry ...................... 180
Figure A1.6. A) A glass with 1,4-BDT residue is swabbed by the paper-based SERS
substrate;129 Reprinted with permission from C. H. Lee, L. Tian and S. Singamaneni, ACS
Appl. Mater. Interfaces, 2010, 2, 3429–3435. Copyright 2014 American Chemical Society.
B) A star-shape paper with eight fingers were coated by polyelectrolyte, which could
separate and preconcentrate chemicals efficiently;133 Reprinted with permission from A.
xvii
Abbas, A. Brimer, J. M. Slocik, L. Tian, R. R. Naik and S. Singamaneni, Anal. Chem.,
2013, 85, 3977–3983. Copyright 2014 American Chemical Society. C) The photo and D)
SEM image of AgNP/PVA membrane fabricated by electrospinning.135 Reprinted with
permission from D. He, B. Hu, Q. F. Yao, K. Wang and S. H. Yu, ACS Nano, 2009, 3,
3993–4002. Copyright 2014 American Chemical Society ........................................... 183
Figure A1.7. A) Trinitrotoluene (TNT) is captured by cysteine-functionalized AuNPs by
formation of a Meisenheimer complex;141Reprinted with permission from S. S. Dasary, A.
K. Singh, D. Senapati, H. Yu and P. C. Ray, J. Am. Chem. Soc., 2009, 131, 13806–13812.
Copyright 2014 American Chemical Society. B) calix[4]arene links PAHs and AgNPs.142 L.
Guerrini, J. V. Garcia-Ramos, C. Domingo and S. Sanchez-Cortes, Anal. Chem.,
2009, 81, 953–960. Copyright 2014 American Chemical Society ............................... 187
Figure A1.8. Schematic for AuNP/GO/Rubpy/GA SERS tag synthesis and its application
for monitoring the photothermal ablation of bacteria.154 Reprinted with permission from D.
Lin, T. Qin, Y. Wang, X. Sun and L. Chen, ACS Appl. Mater. Interfaces, 2014, 6, 1320–
1329. Copyright 2014 American Chemical Society ..................................................... 191
xviii
List of Tables
Chapter 2. Implications of Aspect Ratio on Uptake and Nanotoxicity of Gold
Nanomaterials…...……………………………………………………………………………16
Table 2.1. Plasmon band wavelengths of AuNPs and AuNRs before and after BSA
coating ........................................................................................................................... 29
Table 2.2. The overall first-order clearance rates for gold nanoparticles over a 72 hour
exposure to C. fluminea clam as sorted by longest axis of gold nanoparticles. ............. 33
Table 2.S1. Preparation of synthetic fresh water using reagent grade chemicals ......... 56
Table 2.S2. Final adsorption percentage of gold nanoparticles adsorbed to the biolayer
on the top of the shells observed in control 2 microcosms. These values are calculated
by converting the plasmon band absorption intensity drop to number concentration of
nanoparticles using Lambert-Beer’s law. ....................................................................... 57
Chapter 3. Sulfate Mediated End-to-End Assembly of Gold Nanorods .................. 60
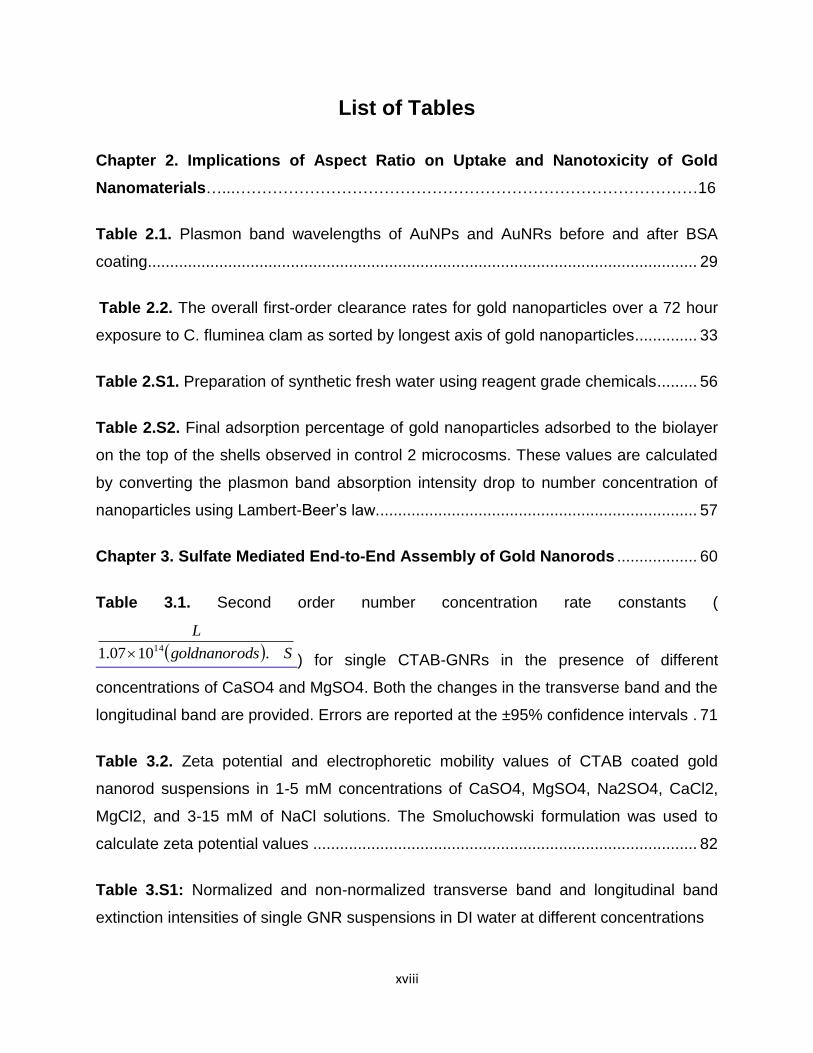
Table 3.1. Second order number concentration rate constants (
Sdsgoldnanoro
L
.1007.1 14 ) for single CTAB-GNRs in the presence of different
concentrations of CaSO4 and MgSO4. Both the changes in the transverse band and the
longitudinal band are provided. Errors are reported at the ±95% confidence intervals . 71
Table 3.2. Zeta potential and electrophoretic mobility values of CTAB coated gold
nanorod suspensions in 1-5 mM concentrations of CaSO4, MgSO4, Na2SO4, CaCl2,
MgCl2, and 3-15 mM of NaCl solutions. The Smoluchowski formulation was used to
calculate zeta potential values ...................................................................................... 82
Table 3.S1: Normalized and non-normalized transverse band and longitudinal band
extinction intensities of single GNR suspensions in DI water at different concentrations
xix
.................................................................................................................................... 102
Table 3.S2. n (refractive index) and k (extinction coefficient) of gold, calculated , , and
ϒ” values for dimer GNRs end-to-end assembly versus incident light wavelength. (n and
k values are derived from McPeak, Kevin M., et al. "Plasmonic films can easily be better:
rules and recipes." ACS photonics 2.3 (2015): 326-333). ........................................... 105
Table 3.S3. n (refractive index) and k (extinction coefficient) of gold, calculated , , and
ϒ” values for GNRs side-by-side and end-to-side assemblies versus incident light
wavelength. (n and k values are derived from McPeak, Kevin M., et al. "Plasmonic films
can easily be better: rules and recipes." ACS photonics 2.3 (2015): 326-333)............ 107
Chapter 4. Size, Shape, and Surface Coating Impacts on the Colloidal Stability and
Aggregation Rate of Gold Nanoparticles in Aquatic Matrices............................... 118
Table 4.1. Plasmon band wavelengths, Zeta potential, and electrophoretic mobility (EM)
values of citrate AuNP, CTAB AR4 AuNR, and CTAB/BDAC coated AR8 AuNR
suspension in DI water before and after BSA coating ................................................. 127
Table 4.2. Zeta potential measurements of AuNP and AuNRs having different surface
coating exposed to EPA waters ranging from very soft to very hard ........................... 131
Table 4.3. Calculated aggregation rates for non-BSA coated AuNP and AR4 and AR8
AuNRs in different EPA waters with various ionic strength hardness .......................... 132
Table 4.S1. Chemical speciation, and chemical specifications of EPA standard waters
.................................................................................................................................... 145
1
Chapter 1. Introduction
1.1 Background
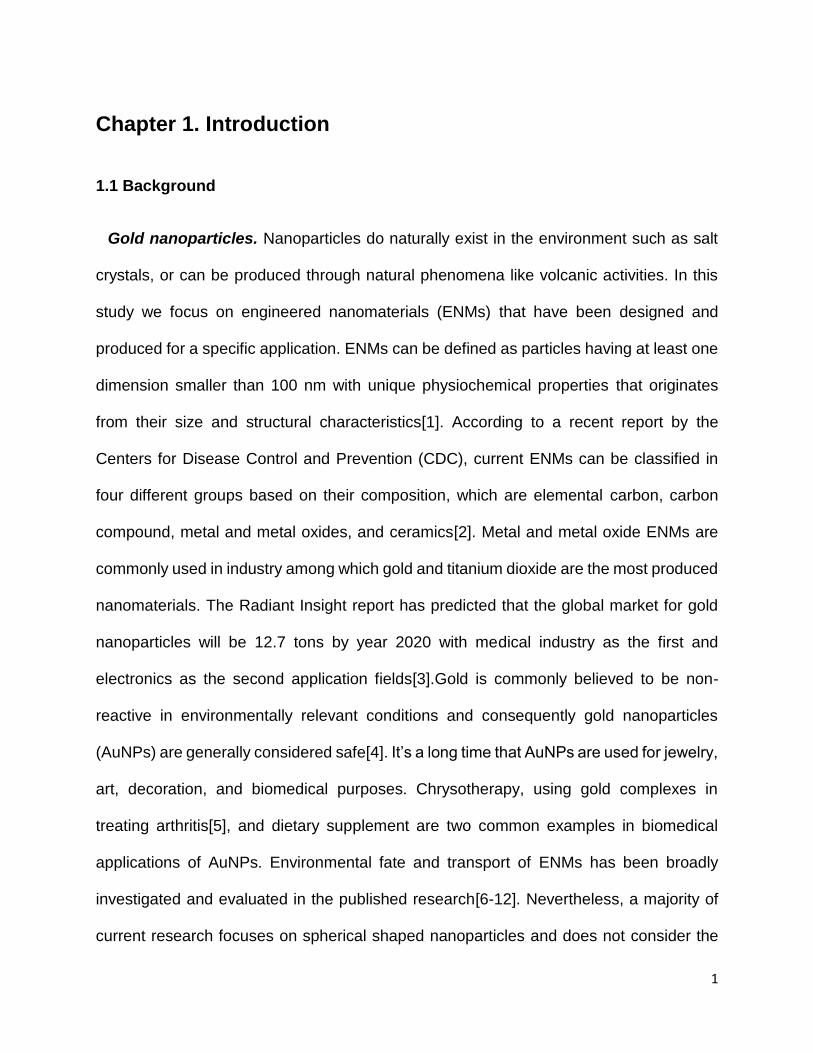
Gold nanoparticles. Nanoparticles do naturally exist in the environment such as salt
crystals, or can be produced through natural phenomena like volcanic activities. In this
study we focus on engineered nanomaterials (ENMs) that have been designed and
produced for a specific application. ENMs can be defined as particles having at least one
dimension smaller than 100 nm with unique physiochemical properties that originates
from their size and structural characteristics[1]. According to a recent report by the
Centers for Disease Control and Prevention (CDC), current ENMs can be classified in
four different groups based on their composition, which are elemental carbon, carbon
compound, metal and metal oxides, and ceramics[2]. Metal and metal oxide ENMs are
commonly used in industry among which gold and titanium dioxide are the most produced
nanomaterials. The Radiant Insight report has predicted that the global market for gold
nanoparticles will be 12.7 tons by year 2020 with medical industry as the first and
electronics as the second application fields[3].Gold is commonly believed to be non-
reactive in environmentally relevant conditions and consequently gold nanoparticles
(AuNPs) are generally considered safe[4]. It’s a long time that AuNPs are used for jewelry,
art, decoration, and biomedical purposes. Chrysotherapy, using gold complexes in
treating arthritis[5], and dietary supplement are two common examples in biomedical
applications of AuNPs. Environmental fate and transport of ENMs has been broadly
investigated and evaluated in the published research[6-12]. Nevertheless, a majority of
current research focuses on spherical shaped nanoparticles and does not consider the
2
effect of shape[7, 11-14]. Currently there is a lack of knowledge on the environmental
implications of elongated nanoparticles such as rods, tubes, and wires. This class of
highly anisotropic ENMs are interesting due to their unique physiochemical properties and
are commonly used in everyday consumer products[15-20]. Based on a recent report,
metallic nanorods and nanowires are the most commonly fabricated ENMs after carbon
nanotubes (CNTs)[21]. CNTs are the exception in the elongated nanomaterials category
in that they are well studied for their environmentally relevant implications and concerns
[22-26]. However, recent studies have shown some level of toxicity associated with gold
nanorods (AuNRs) under certain conditions[27-31].
Elongated shape gold nanoparticles. Anisotropic metal and metal oxide nanoparticles
such as nanorods are commonly tested and used in variety of applications. ZnO nanorods
possess unique optical bandgap and are widely used to fabricate nanoscale electronic
devices such as field effect transistor, ultraviolet photodetector, Schottky diode, and ultra-
bright light-emitting diodes (LEDs)[16, 19, 32]. Silver nanorods are used in antimicrobial
applications, sensors, and conductors[33-36]. Titanium dioxide nanorods are used in
electro catalysis, photo catalysis, energy storage, and solar cells[37-39]. AuNRs are
mainly used in biomedical applications such as biosensors, cancer therapy, and drug and
gene delivery[40, 41]. Presently there are two approaches to produce elongated metal
and metal oxide nanorods, wet chemistry seed-mediated bottom-up and hard template
top-down. In the case of AuNRs, gold salt reduction by a mild reducing agent such as
ascorbic acid in the presence of shape-directing agents such as cetyltrimethylammonium
bromide (CTAB) is the main production approach. CTAB is a positively charged cationic
surfactant that covers the AuNR surface as a vesicle-like bilayer and its primary goal is
3
to protect nanoparticles from aggregation under low ionic strength conditions. CTAB
toxicity to living cells is well-known[42] and therefore excess CTAB in colloidal suspension
is normally removed by centrifugal washing or dialysis. The remaining CTAB on the
surface remains toxic and methods like layer by layer coating of GNR with a negatively
charged polymer such as PAA (poly acrylic acid) and PVP (poly vinyl chloride) have been
shown to be effective in reducing toxicity. If a positive surface charge is desired, then
negatively charged polymer coated CTAB AuNR is coated in an extra layer of PAH (poly
allylamine hydrochloride). Replacing CTAB with a more biocompatible polymer such as
PEG (poly ethyleneglychol) or covering CTAB with a thick silica layer are other promising
methods in biomedical applications. Production of AuNRs in the 1-20 aspect ratio (AR;
length to width) range is achievable by controlling growth conditions. Adjusting the
amount of introduced silver nitrate (AgNO3) or stepwise growth of gold crystal in the
presence of a cosurfactant such as dodecyltrimethylammonium bromide (DTAB) are
commonly applied methods to tune the AR of produced AuNRs.
Aspect ratio associated toxicity. Prior studies have shown the toxicity of elongated-
shape AuNRs to living cells under certain biological conditions. AR related cellular
apoptosis and necrosis of cells have been reported while binding of AuNRs to cellular
DNA has been shown to influence transcription and potentially induce inflammatory
response and apoptosis in liver cells[5, 43]. The chemically non-reactive nature of gold is
in contrast with the finding in the recent studies and raises the concern of shape and size
driven ecotoxicity of AuNRs in the environment.
Aggregation rate, deposition mechanism, and interaction of anisotropic
nanoparticles. There is a wide body of research on aggregation and deposition of ENMs
4
in aquatic systems, but unfortunately only a few of these studies have focused on the role
of anisotropicity and AR. Petosa et.al recently reviewed the aggregation and deposition
of various ENMs in aquatic environments including carbon nanotubes, fullerenes, metallic
nanoparticles such as gold and iron, metal oxide nanoparticles such as titanium dioxide
and ZnO plus quantum dots[44]. None of the studies reviewed in this paper systematically
investigated the effect of shape and AR. To the best of our knowledge currently there are
only two environmentally relevant published studies on ZnO nanorods[45] and GNRs[46]
aggregation and interactions in which spheres and rods undergo different interactions
and show different aggregation kinetics.
The presence of huge and accessible surface areas makes the collision and interaction
of two different types of nanoparticles rare. Therefore, in environmental aquatic systems
homoaggregation, AuNR-AuNR interaction, is addressed as aggregation while
heteroaggregation, AuNR-other surfaces interaction, is addressed as deposition. Both of
these phenomena are a function of the NP type and the aquatic exposure (suspension)
medium characteristics. The main NP characteristics can be listed as material, size,
shape, surface chemistry, particle concentration while for the aquatic medium they are
pH, ionic strength, available surface area (media collector area). Knowing these
parameters, Derjaguin-Landau-Verwey-Overbeek (DLVO) and filtration theories can be
applied to theoretically study aggregation and deposition of NPs in aquatic systems.
However, the applicability of these theories to elongated nanorods in environmental
systems has not been well studied yet. Both DLVO and filtration theories have limitations
for cylindrical geometries such as nanorods. For example, calculation of electrostatic
interactions using the Poisson-Boltzmann equation and van der Waals (vdW) interaction
based on Hamaker’s constant are hindered by non-spherical geometries. Derjaguin
5
assumptions and mapping between cylindrical versus spherical geometry can
theoretically help in easing these challenges. While in reality there is no experimental
study to back up these assumptions in complex environmental systems.
The longitudinal LSPR band is highly sensitive to the colloidal stability of individual
AuNRs. A slight changes in the number concentration of single AuNRs or the formation
of a few agglomerates in suspension can noticeably change the absorption intensity,
width, as well as result in red or blue shifting of the longitudinal band. In the case of
anisotropic AuNRs, three different aggregation structures are possible; end-to-end, side-
by-side, and random assemblies. Each of these assembly configurations affect the LSPR
bands differently. End-to-end assembly enhances uniaxial plasmon coupling resulting in
a red shift of the longitudinal band while the transverse band will almost remain
unchanged. However, side-by-side assembly will reduce the overall AR of the
agglomerate causing a blue shift of the longitudinal band and red shifting of the transverse
band. For random assemblies, the behavior of the LSPR bands will depend on the overall
structure of the agglomerate.
C. fluminea freshwater bivalve. Bivalves are column water and sediment filter feeders
and can be found in both freshwater and marine habitats. Filter feeders are a sub-group
of organisms that feed by straining suspended matter and food particles from water,
typically by passing the water over a specialized filtering structure. As a result, they are
highly susceptible to environmental pollutants such as heavy metals, organic pollutants,
ENMs, etc[47]. This filtration mechanism makes them a good candidate to monitor and
investigate a wide variety of contaminants in environmental studies. For example
Corbicula fluminea has been used by scientists as an aquatic contaminant biodetector for
6
many decades[48]. C. fluminea is of an Asian origin and thus it is often commonly
called the Asian clam or Asiatic clam. The species has been introduced into many parts
of the world, including North American and Europe. They feed primarily
on phytoplankton (algae), which they filter from the sandy or muddy bottoms of streams,
lakes, or canals. According to the USGS, C. fluminea is known as an invasive species
and likely will continue to expand its North American range until it reaches its lower
temperature tolerance. C. fluminea has the highest filtration rate of freshwater bivalves
and filters 45 L water/ g (dry weight)/day[49]. This exceptionally high filtration rate and
ease of access and collecting from riverine ecosystems are the main reasons that they
are used in many studies as contaminant biodetector organism. Prior studies have
suggested that C. fluminea can uptake and accumulate ENMs based on size[50-52].
However, none of these studies have investigated the effect of anisotropicity and AR of
ENMs on uptake rate.
1.2 Research Objectives
Objective 1. Synthesis of colloidally stable AuNRs with different aspect ratios and
surface coatings
AuNRs with different aspect ratios of 1, 4, and 8 were synthesized. Synthesized CTAB
coated AuNRs were latterly coated by bovine serum albumin (BSA). Vis-NIR
spectroscopy, electrophoretic mobility measurements, and transmission electron
microscopy (TEM) were used to characterize AuNRs.
Hypothesis.

7
H1.1) AuNRs with a fixed diameter and aspect ratios of 1, 4, and 8 (with 10% standard
deviation in dimension) can be synthesized and be readily used.
H1.2) Surface coated AuNRs are well-dispersed and colloidally stable in nanopure DI
water
Objective 2. Aggregation kinetics, and aggregation assembly study on AuNRs
The aggregation and agglomeration rate of AuNRs were kinetically studied through
exposure of AuNRs to different ionic strength and salt composition aquatic environments.
The effect of AR and surface coating were further evaluated by comparing results. The
kinetics of aggregation were investigated using Vis-NIR spectroscopy while the structural
conformation of aggregates were determined by TEM. A simple extended DLVO theory
model was developed. The observed data from experiments were compared to modeling
outputs to further investigate the aggregation kinetics and mechanism.
Hypothesis.
H2.1) The blue shifting and red shifting of transverse and longitudinal bands in Vis-
NIR spectroscopy represent the formation of new suspended agglomeration or
aggregates in the suspension
H2.2) Appearance of a new LSPR band at a different wavelength than transverse and
longitudinal band of single AuNR in Vis-NIR spectroscopy shows the formation of a new
nanoparticle agglomerate species
H2.3) Decrease in the intensity of a particular LSPR band in Vis-NIR spectroscopy is
linearly related to the decrease in number concentration of that nanoparticle species.
8
H2.4) CTAB coated AuNRs are protected with a dense vesicle-like bilayer of CTAB
on the sidewall facets while tip facets are covered with a nondense CTAB coating.
H2.5) Increasing ionic strength of suspension increases aggregation rate.
Objective 3. AuNRs and AuNPs uptake and nanotoxicity study on C. fluminea
filter-feeding bivalve clam
Organismal uptake of suspended AuNRs and AuNPs by C. fluminea filter feeding
bivalves in an environmentally relevant freshwater microcosms was studied. The overall
uptake was determined and evaluated by the whole-body organism burden that was later
normalized by body mass while the residue of NPs in the suspension was monitored in
real time during the time course of experiment by Vis-NIR spectroscopy. The uptake per
body mass for each set of experiment was determined and its relation to the tested AuNRs
and AuNPs dimensional such as size and AR was developed. The protein damage and
antioxidant enzyme activity reduction of C. fluminea cells that were associated to the gold
nanoparticles exposure were studied by taking sample tissues from dissected clams post
exposure to AuNRs and AuNPs. The relationship between NP physical characteristics
such as shape and AR and the extent of protein damage and antioxidant enzyme activity
reduction were further evaluated.
Hypothesis.
H3.1) AuNRs uptake by clams is size and aspect ratio dependent
H3.2) BSA coated AuNRs and AuNPs are colloidally stable in suspension and do not
aggregate during the time course of experiment

9
H3.3) During organismal uptake and tissue fixation, AuNRs and AuNPs retain their
physiochemical structure
H3.4) BSA coated AuNRs and AuNPs at an environmentally relevant concentration
do not expose an immediate life threat to the clams.
1.3 Dissertation Outline
This dissertation contains a total of five chapters including this introductory chapter.
Chapter 2 describes a comprehensive evaluation of the size and shape-selective
uptake of BSA coated gold nanomaterials by the Asian clam (Corbicula fluminea), to
expand our knowledge on how collidally stable nanoparticles are processed by these
aquatic filter-feeders. Chapter 3 describes how the aggregation assembly of elongated
gold nanoparticles can be influenced by individual ions present in the aquatic solutions.
Chapter 4 presents our efforts to apply characterization techniques particularly UV-vis
spectroscopy, to evaluate the aggregation kinetics of gold nanoparticles and nanorods in
environmentally relevant electrolyte solutions. Chapter 5 shows our general conclusions
regarding the fate/transport and organismal interaction of gold nanoparticles in aquatic
systems with a specific emphasis on the effects of nanoparticle anisotropicity.

10
1.4 References
1. Rotello, V.M., Nanoparticles: building blocks for nanotechnology. 2004: Springer
Science & Business Media.
2. Topmiller, J.L. and K.H. Dunn, Current strategies for engineering controls in
nanomaterial production and downstream handling processes. 2013.
3. Cooper, S., Gold Nanoparticles Market Analysis by Application (Medical &
Dentistry, Electronics, Catalysis and Sensors & Probes) And Segment Forecasts
To 2020. December, 2014, Radiant Insights.
4. Cho, W.-S., et al., Comparison of gene expression profiles in mice liver following
intravenous injection of 4 and 100nm-sized PEG-coated gold nanoparticles.
Toxicology letters, 2009. 191(1): p. 96-102.
5. Merchant, B., Gold, the noble metal and the paradoxes of its toxicology.
Biologicals, 1998. 26(1): p. 49-59.
6. Lin, D., et al., Fate and transport of engineered nanomaterials in the environment.
Journal of Environmental Quality, 2010. 39(6): p. 1896-1908.
7. Praetorius, A., M. Scheringer, and K. Hungerbuhler, Development of
Environmental Fate Models for Engineer
Nanoparticles in the Rhine River. Environmental science & technology, 2012.
46(12): p. 6705-6713.
8. Lowry, G.V., et al., Environmental occurrences, behavior, fate, and ecological
effects of nanomaterials: an introduction to the special series. Journal of
environmental quality, 2010. 39(6): p. 1867-1874.
11
9. Cornelis, G., et al., Fate and bioavailability of engineered nanoparticles in soils: a
review. Critical Reviews in Environmental Science and Technology, 2014. 44(24):
p. 2720-2764.
10. Dale, A.L., et al., Modeling nanomaterial environmental fate in aquatic systems.
Environmental science & technology, 2015. 49(5): p. 2587-2593.
11. Lowry, G.V., et al., Long-term transformation and fate of manufactured Ag
nanoparticles in a simulated large scale freshwater emergent wetland.
Environmental science & technology, 2012. 46(13): p. 7027-7036.
12. Gottschalk, F., et al., Modeled environmental concentrations of engineered
nanomaterials (TiO2, ZnO, Ag, CNT, fullerenes) for different regions.
Environmental science & technology, 2009. 43(24): p. 9216-9222.
13. Aiken, G.R., H. Hsu-Kim, and J.N. Ryan, Influence of dissolved organic matter on
the environmental fate of metals, nanoparticles, and colloids. Environmental
science & technology, 2011. 45(8): p. 3196-3201.
14. Hoecke, K.V., et al., Fate and effects of CeO2 nanoparticles in aquatic ecotoxicity
tests. Environmental science & technology, 2009. 43(12): p. 4537-4546.
15. Yang, P. and C.M. Lieber, Nanorod-superconductor composites: a pathway to
materials with high critical current densities. Science, 1996. 273(5283): p. 1836.
16. Park, W.I., et al., Fabrication and electrical characteristics of high-performance
ZnO nanorod field-effect transistors. Applied Physics Letters, 2004. 85(21): p.
5052-5054.
17. Dickerson, E.B., et al., Gold nanorod assisted near-infrared plasmonic
photothermal therapy (PPTT) of squamous cell carcinoma in mice. Cancer letters,
2008. 269(1): p. 57-66.
12
18. Law, M., et al., Nanowire dye-sensitized solar cells. Nature materials, 2005. 4(6):
p. 455-459.
19. Wan, Q., et al., Fabrication and ethanol sensing characteristics of ZnO nanowire
gas sensors. Applied Physics Letters, 2004. 84(18): p. 3654-3656.
20. Kolmakov, A., et al., Detection of CO and O2 using tin oxide nanowire sensors.
Advanced Materials, 2003. 15(12): p. 997-1000.
21. consumer product inventories. Woodrow Wilson international center for scholars:
Washington DC.
22. Petersen, E.J., et al., Potential release pathways, environmental fate, and
ecological risks of carbon nanotubes. Environmental science & technology, 2011.
45(23): p. 9837-9856.
23. Helland, A., et al., Reviewing the environmental and human health knowledge
base of carbon nanotubes. Ciência & Saúde Coletiva, 2008. 13(2): p. 441-452.
24. Saleh, N.B., L.D. Pfefferle, and M. Elimelech, Aggregation kinetics of multiwalled
carbon nanotubes in aquatic systems: measurements and environmental
implications. Environmental science & technology, 2008. 42(21): p. 7963-7969.
25. Lam, C.-w., et al., A review of carbon nanotube toxicity and assessment of
potential occupational and environmental health risks. Critical reviews in
toxicology, 2006. 36(3): p. 189-217.
26. Petersen, E.J., et al., Biological uptake and depuration of carbon nanotubes by
Daphnia magna. Environmental science & technology, 2009. 43(8): p. 2969-2975.
27. Goodman, C.M., et al., Toxicity of gold nanoparticles functionalized with cationic
and anionic side chains. Bioconjugate chemistry, 2004. 15(4): p. 897-900.
13
28. Hauck, T.S., A.A. Ghazani, and W.C. Chan, Assessing the effect of surface
chemistry on gold nanorod uptake, toxicity, and gene expression in mammalian
cells. Small, 2008. 4(1): p. 153-159.
29. Wang, S., et al., Challenge in understanding size and shape dependent toxicity of
gold nanomaterials in human skin keratinocytes. Chemical physics letters, 2008.
463(1): p. 145-149.
30. Schaeublin, N.M., et al., Does shape matter? Bioeffects of gold nanomaterials in
a human skin cell model. Langmuir, 2012. 28(6): p. 3248-3258.
31. Pan, Y., et al., Size‐dependent cytotoxicity of gold nanoparticles. Small, 2007.
3(11): p. 1941-1949.
32. Park, W., et al., Schottky nanocontacts on ZnO nanorod arrays. Applied Physics
Letters, 2003. 82(24): p. 4358-4360.
33. Chaney, S.B., et al., Aligned silver nanorod arrays produce high sensitivity surface-
enhanced Raman spectroscopy substrates. Applied Physics Letters, 2005. 87(3):
p. 031908.
34. Abdullayev, E., et al., Natural tubule clay template synthesis of silver nanorods for
antibacterial composite coating. ACS applied materials & interfaces, 2011. 3(10):
p. 4040-4046.
35. Yang, X., et al., Preparation and properties of a novel electrically conductive
adhesive using a composite of silver nanorods, silver nanoparticles, and modified
epoxy resin. Journal of Materials Science: Materials in Electronics, 2012. 23(1): p.
108-114.
36. Langley, D., et al., Flexible transparent conductive materials based on silver
nanowire networks: a review. Nanotechnology, 2013. 24(45): p. 452001.

14
37. Barea, E., et al., Origin of efficiency enhancement in Nb 2 O 5 coated titanium
dioxide nanorod based dye sensitized solar cells. Energy & Environmental
Science, 2011. 4(9): p. 3414-3419.
38. Kandiel, T.A., et al., Tailored titanium dioxide nanomaterials: anatase
nanoparticles and brookite nanorods as highly active photocatalysts. Chemistry of
materials, 2010. 22(6): p. 2050-2060.
39. Chen, X. and S.S. Mao, Titanium dioxide nanomaterials: synthesis, properties,
modifications, and applications. Chem. Rev, 2007. 107(7): p. 2891-2959.
40. Pérez-Juste, J., et al., Gold nanorods: synthesis, characterization and
applications. Coordination Chemistry Reviews, 2005. 249(17): p. 1870-1901.
41. Huang, X., S. Neretina, and M.A. El-Sayed, Gold nanorods: from synthesis and
properties to biological and biomedical applications. Advanced Materials, 2009.
21(48): p. 4880.
42. Isomaa, B., J. Reuter, and B. Djupsund, The subacute and chronic toxicity of
cetyltrimethylammonium bromide (CTAB), a cationic surfactant, in the rat. Archives
of toxicology, 1976. 35(2): p. 91-96.
43. Akiyama, Y., et al., The effects of PEG grafting level and injection dose on gold
nanorod biodistribution in the tumor-bearing mice. Journal of Controlled Release,
2009. 139(1): p. 81-84.
44. Petosa, A.R., et al., Aggregation and deposition of engineered nanomaterials in
aquatic environments: role of physicochemical interactions. Environmental science
& technology, 2010. 44(17): p. 6532-6549.
45. Zhou, D. and A.A. Keller, Role of morphology in the aggregation kinetics of ZnO
nanoparticles. Water research, 2010. 44(9): p. 2948-2956.
15
46. Afrooz, A.N., et al., Spheres vs. rods: The shape of gold nanoparticles influences
aggregation and deposition behavior. Chemosphere, 2013. 91(1): p. 93-98.
47. Baun, A., et al., Ecotoxicity of engineered nanoparticles to aquatic invertebrates:
a brief review and recommendations for future toxicity testing. Ecotoxicology,
2008. 17(5): p. 387-395.
48. Doherty, F.G., The Asiatic clam, Corbicula spp., as a biological monitor in
freshwater environments. Environmental monitoring and assessment, 1990. 15(2):
p. 143-181.
49. McLeod, P.B., S.N. Luoma, and R.G. Luthy, Biodynamic modeling of PCB uptake
by Macoma balthica and Corbicula fluminea from sediment amended with
activated carbon. Environmental Science & Technology, 2007. 42(2): p. 484-490.
50. Hull, M.S., et al., Filter-feeding bivalves store and biodeposit colloidally stable gold
nanoparticles. Environmental science & technology, 2011. 45(15): p. 6592-6599.
51. Pan, J.-F., et al., Size dependent bioaccumulation and ecotoxicity of gold
nanoparticles in an endobenthic invertebrate: the Tellinid clam Scrobicularia plana.
Environmental pollution, 2012. 168: p. 37-43.
52. Renault, S., et al., Impacts of gold nanoparticle exposure on two freshwater
species: a phytoplanktonic alga (Scenedesmus subspicatus) and a benthic bivalve
(Corbicula fluminea). Gold bulletin, 2008. 41(2): p. 116-126.

16
Chapter 2. Implications of Aspect Ratio on Uptake and
Nanotoxicity of Gold Nanomaterials
S.M.H. Abtahi,1, 2, 3 Rafael Trevisan,3, 4 Richard Di Giulio, 3, 4 Catherine J. Murphy,5
Navid B. Saleh,6 and Peter J. Vikesland*1, 2, 3
1.Virginia Tech, Department of Civil and Environmental Engineering,
Blacksburg, VA, USA
2.Virginia Tech, Institute for Critical Technology and Applied Science (ICTAS) Center for
Sustainable Nanotechnology (VTSuN), Blacksburg, VA, USA
3.Center for the Environmental Implications of Nanotechnology (CEINT), Duke
University, Durham, NC, USA
4. Nicholas School of the Environment, Duke University, Durham, NC, 27710, USA
5.Department of Chemistry, University of Illinois at Urbana-Champaign,
600 S. Matthews Ave., Urbana, IL, 61801, USA
6.The University of Texas at Austin, Department of Civil, Architectural and
Environmental Engineering, Austin, TX 78712, USA
17
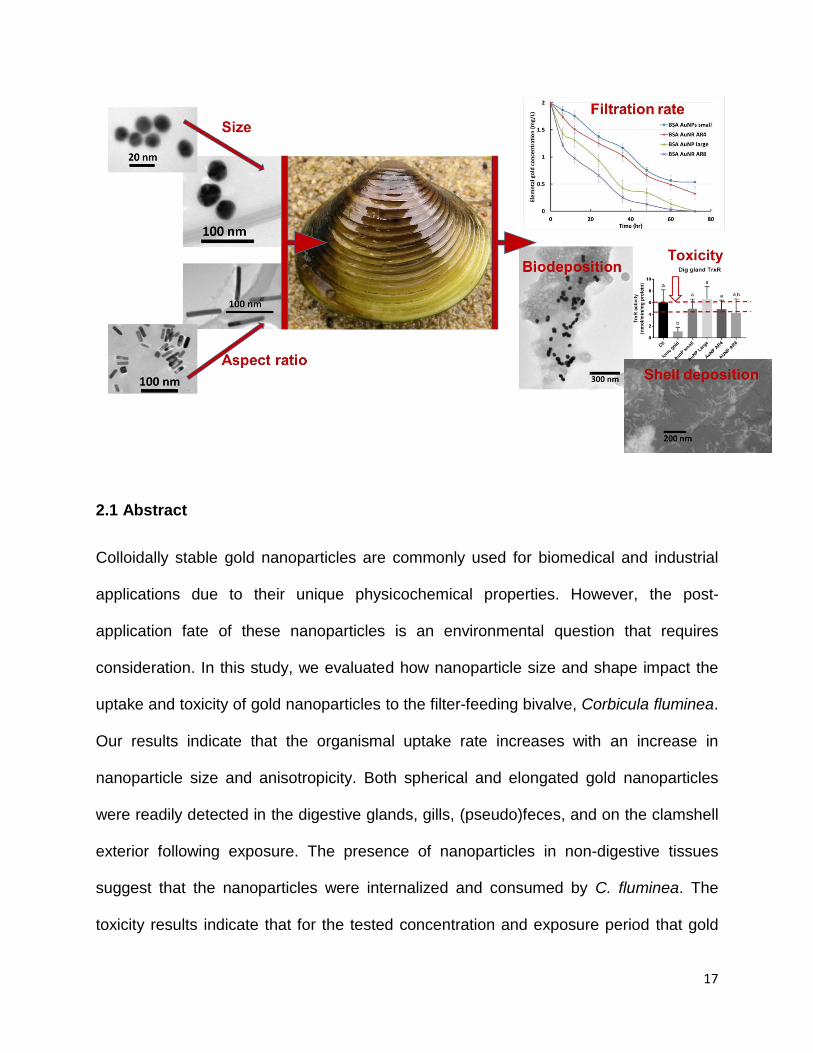
2.1 Abstract
Colloidally stable gold nanoparticles are commonly used for biomedical and industrial
applications due to their unique physicochemical properties. However, the post-
application fate of these nanoparticles is an environmental question that requires
consideration. In this study, we evaluated how nanoparticle size and shape impact the
uptake and toxicity of gold nanoparticles to the filter-feeding bivalve, Corbicula fluminea.
Our results indicate that the organismal uptake rate increases with an increase in
nanoparticle size and anisotropicity. Both spherical and elongated gold nanoparticles
were readily detected in the digestive glands, gills, (pseudo)feces, and on the clamshell
exterior following exposure. The presence of nanoparticles in non-digestive tissues
suggest that the nanoparticles were internalized and consumed by C. fluminea. The
toxicity results indicate that for the tested concentration and exposure period that gold
18
nanoparticles were not acutely toxic (i.e., not lethal). However, gold nanoparticles
significantly inhibited the activity of some antioxidant enzymes in gill and digestive gland
tissues. This inhibition could affect the resistance of these organisms to a secondary
stressor (e.g., temperature, pathogens, and hypoxia) and threaten organismal health.
2.2 Introduction
The environmental fate, transport, and toxicity of engineered nanomaterials (ENMs)
have been broadly investigated and discussed in the literature [1-7]. Nevertheless, a
majority of the research published to date has focused on spherical nanoparticles and
has not explicitly considered the effects of shape [2, 6-9]. Currently there is a general lack
of knowledge with respect to the environmental implications of elongated nanoparticles
such as rods, tubes, and wires. This class of highly anisotropic ENMs are interesting due
to their unique physiochemical properties and are being incorporated in everyday
consumer products [10-15]. Metallic nanorods and nanowires are the most commonly
fabricated ENMs after carbon nanotubes (CNTs) [16]. Gold is commonly believed to be
non-reactive under environmentally relevant conditions and consequently gold
nanoparticles are generally considered safe [17]. For many years, gold nanoparticles
(GNPs) have been used for jewelry, art, decorative, and biomedical purposes.
Chrysotherapy, using gold complexes to treat arthritis [18], and dietary supplements are
two examples of the biomedical applications of GNPs. Their unique optical properties and
their ease of manufacturing and shape-tuning make GNPs good candidates for industrial
applications such as catalysis and biosensing [19]. However, recent studies have shown
some toxicity is imparted by gold nanorods (AuNRs) under certain conditions [20-25] and
has raised concerns about the inertness of gold nanoparticles.

19
Freshwater Corbicula fluminea bivalves are water column and sediment filter feeders
and can be found in both freshwater and marine habitats [26]. Filter feeders are a group
of organisms that feed by straining suspended matter and food particles from water,
typically by passing the water over a specialized filtering structure. As a result, they are
highly susceptible to environmental pollutants such as heavy metals, organic pollutants,
and ENMs [27] and as such they have been used by scientists as aquatic contaminant
biodetectors for decades [28]. C. fluminea is an invasive organism introduced to North
America from Asia. C. fluminea feeds primarily on phytoplankton (algae) that it filters from
the sandy or muddy bottoms of streams, lakes, or canals. Interestingly, C. fluminea has
the highest filtration rate of freshwater bivalves and filters approximately 45 L water/g (dry
weight)/day [29]. This exceptionally high filtration rate and the relative ease of access for
collection from riverine ecosystems are the primary reasons that they are used in many
studies as a contaminant biodetector. Prior studies have suggested that C. fluminea can
uptake and accumulate ENMs [30-32]. Our previous study indicated that the biofiltration
rates of colloidally stable gold nanoparticles were related to the size and concentration of
nanoparticles, with larger particles exhibiting a higher rate of filtration. Gold nanoparticles
were easily detected in the digestive glands and pseudo(feces) of exposed clams [30].
However, none of the existing studies investigated the effect of anisotropicity and aspect
ratio (AR) on ENM uptake. Prior studies suggest that shape-related parameters such as
AR can significantly affect colloidal behavior, aggregation rates[33], and biotoxicity [22,
34]. As a result, we hypothesized that shape and AR will affect the biofiltration and
biotoxicity of these AuNPs. The objective of this study was to investigate the shape related
uptake and potential associated toxicity of gold nanoparticles to C. fluminea.
20
2.3 Materials and Methods
Gold Nanoparticle Synthesis. 19 nm citrate stabilized gold nanoparticles (citrate-AuNP)
were prepared using the method of Jana et al. [35] that is based upon that of Turkevich
[36]. 45 nm citrate-AuNPs were prepared using the seed-mediated method of Frens [37].
In both synthesis processes, citrate was used as the reducing agent and colloidal
stabilizer. Post synthesis, the AuNP suspensions were filter sterilized (0.2 μm) and then
stored in amber glass vials at 4 °C.
Aspect ratio 4 (AR4) CTAB coated gold nanorod synthesis. AR4 AuNRs were
synthesized via the well-established seed-mediated surfactant-directed method [38-40].
In brief, 4 nm spherical gold seeds were prepared through the reduction of chloroauric
acid (HAuCl4) by the addition of ice-cooled and freshly prepared sodium borohydride in
the presence of cetyltrimethylammonium bromide (CTAB). AR4 AuNRs were then grown
from an aqueous growth solution consisting of CTAB, HAuCl4, and AgNO3 using ascorbic
acid as the reducing agent. Gold seeds were added to the growth solution and the mixture
was left undisturbed for 2 hours till growth completion. Post synthesis, other shape gold
nanoparticles, such as spheres and cubes, were removed by centrifugation (25 min at
8,000 x g) repeated five times with pellet resuspension in 800 μM CTAB.
Aspect ratio 8 (AR8) CTAB coated gold nanorod synthesis. AR8 AuNRs were
synthesized following the method of Nikoobakht et al. [39] with a few modifications. Gold
seed nanoparticles were prepared following the process described for AR4 AuNRs. The
growth solution consisted of HAuCl4, AgNO3, ascorbic acid, CTAB, and
benzyldimethylammonium chloride (BDAC). The molar ratio of BDAC/CTAB was adjusted
to 2.7. It has been shown that ratios between 2 and 5.5 favor decreased formation of

21
spherical particles. To further increase the yield of AR8 AuNRs, 200 µL of 1 M HCl was
added to 10 mL growth solution. The mixture was left undisturbed for 24 hours in a 30 ºC
water bath until growth completion. Post synthesis, the suspension was centrifuged at
2,000 x g for 5 min. The supernatant primarily consisting of AR8 gold nanorods was
separated by a pipette from the pellet that primarily contained large nanoparticle
byproducts.
Bovine serum albumin (BSA) coating of AuNPs and AuNRs. BSA coated AuNPs
were prepared by incubating citrate-AuNP with 0.1 mg BSA/mL. The pH of the mixture
was adjusted to 9.0 by addition of 1 M NaOH. The mixture was left undisturbed for 24
hours and centrifuged at 10,000 x g for 30 minutes to remove excess unreacted BSA and
citrate. BSA coating of AR4 and AR8 AuNRs was done following the protocol of Tebbe
et.al. [41]. In brief, for AR4 the CTAB and for AR8 the CTAB/BDAC concentration of the
suspension was reduced to <0.1 mM by centrifugation and by replacing the supernatant
with DI water. The AuNRs are not colloidally stable at this low surfactant concentration
for more than 30 min. Accordingly, this step was done immediately prior to ligand
exchange. The suspension was added to a concentrated BSA solution (10 mg/mL) at pH
7 under vigorous stirring and bath sonicated for 30 minutes. The volume ratio of BSA
solution to AuNR suspension was 3:1. The mixture was then centrifuged and the
supernatant was replaced by 1 mg/mL BSA solution at pH 12 and left undisturbed for 24
hours. Excess BSA and detached CTAB and BDAC were removed by several sequential
centrifugal wash steps.
Gold NPs and NRs characterization. The size, shape, and quality of the synthesized
nanoparticles were characterized by dynamic light scattering (DLS), vis-NIR
22
spectroscopy, inductively coupled plasma mass spectroscopy (ICP-MS), scanning
electron microscopy (SEM), and transmission electron microscopy (TEM). The primary
intensity particle size distributions of the GNPs were measured using a Malvern Zetasizer
NanoZS DLS based on analysis of the correlation functions using the General Purpose
algorithm and a non-negative least squares fit[42]. The Malvern NanoZS is equipped with
a 4mW He-Ne 633 nm laser and a 175° angle backscattering detector. A Philips EM420
conventional electron microscope equipped with a CCD camera was used to measure
the size and shape of the AuNRs and AuNPs. TEM samples were prepared using a drop-
cast technique. In brief, a 10 µL droplet of sample was dropped onto a 300 mesh carbon
coated copper TEM grid in a well ventilated hood and dried for 24 hours. The elemental
gold content of the synthesized gold nanoparticles was measured using an Agilent
7500ce ICP-MS. For this purpose, 1 mL of synthesized gold NPs and NRs was washed
twice using consecutive centrifugal washes at 10000 x g for 20 min and diluted 100x.
Later the sample was transferred to a polystyrene tube followed by addition of 200 µL
aqua regia (1:3, Trace metal grade HNO3:HCl) and after 2 hours brought to 10 mL volume
by addition of DI water. The absorption intensity and plasmon band (transverse and
longitudinal) locations were characterized using a Cary 5000 UV-Vis-NIR spectrometer.
The presence of gold nanoparticles on the clam shell was imaged using a LEO (Zeiss)
1550 field-emission scanning electron microscope.
C. fluminea clam collection and preparation. The collected adult C. fluminea (Asian
clam) on average were 17.7 ± 0.6 mm long and 12.3 ± 0.4 mm thick (the noted errors
reflect 95% confidence intervals based on n=20 measurements). Clams were collected
from the Eno River (Longitude 36.0701855, Latitude -78.9112751), Durham, NC in mid-
23
summer and acclimated for 10 days to laboratory conditions. In this acclimation period,
the clams were stored under ample aeration and starved in 10 gallon glass aquarium
tanks. Each tank contained 75 clams kept in freshly prepared moderately hard standard
EPA synthetic water (Table S1 provides solution composition). The water was changed
on a daily basis to assure that (pseudo)feces and other suspended particles did not
accumulate in the gills and digestive glands of the clams.
AuNP and AuNR uptake and clearance assays with C. fluminea clams. Microcosm
reactors consisted of 100 mL glass beakers. Each microcosm contained two clams
exposed to 40 mL of ~2 mg (elemental gold)/L BSA coated AuNP or AuNR suspensions
for 72 hours. Seven replicate microcosms were used per experiment to assure data
quality. Test solutions were prepared by quantitative addition of AuNP or AuNR
suspension to moderately hard synthetic EPA water followed by addition to microcosms.
To evaluate deposit feeding by C. fluminea bivalves an artificial bed consisting of glass
beads was added to a few of microcosms prior to addition of AuNR suspension. Two
types of controls were conducted in parallel to the experiments. A positive control where
the microcosm only contained dissolved gold having the same atomic concentration as
used in the nanoparticle uptake experiments, and a negative control that did not have any
dissolved gold or nanoparticles in it. We note that previous studies have shown that
nanoparticles easily adhere to the C. fluminea shells. Therefore, organismal uptake as
well as deposition to the glass beads and the bivalve shell surfaces are possible
nanoparticle removal mechanisms. To investigate deposition on either glass beads or
shells the following control experiments were conducted. A beaker containing glass beads
and AuNR suspension was subjected to the same procedure as the actual experiment.

24
In the other control, two clams were dissected, their tissue and shells separated, the shells
glued back together, and then these shells were exposed to the same concentration
nanoparticle suspensions while the water column was tested accordingly.
Vis-NIR spectroscopy and ICP-MS were used to monitor the absorption intensity and
elemental gold concentration of the water columns at 0, 6, 12, 24, 36, 48, 60, and 72 hour
time-points during the time course of the experiments. Water column aliquots of 1 mL
were removed by pipette and transferred to a 10 mm pathlength plastic cuvette. The
sample was then characterized by vis-NIR spectroscopy in the wavelength range of 400-
1300 nm prior to being returned to the microcosm. For ICP-MS sample preparation, 50
µL sample was taken and transferred to a polystyrene tube to which 200 mL of aqua regia
(1:3, Trace metal grade HNO3:HCl) was added and then left undisturbed for 2 hours.
Finally the mixture was brought to 10 mL volume by addition of ultrapure DI water. Upon
termination of the experiment, clams were removed from the microcosms and dissected.
The dark tissue (digestive glands and gills) was separated from the rest of the tissue.
Tissue segments and shells were separately wet digested [43] and the elemental gold
content was measured by ICP-MS. In brief, 5 mL of trace metal grade HNO3 was added
to 0.5 g of the wet tissue or shell sample in a 20 mL beaker and left undisturbed for 24
hours. The mixture was heated in a 60°C water bath for an hour and then cooled at room
temperature. Next 2 mL 30% H2O2 was added and the mixture was heated in a 60°C
water bath for an hour. Finally, the sample was diluted to a volume of 25 mL by adding
ultrapure DI water. In addition, (pseudo)feces samples were collected from the bottom of
the microcosm using a 10 µL pipette. TEM samples of (pseudo)feces were prepared by
the drop cast technique on a 300 mesh carbon coated copper grid. Clam shells were

25
crushed into tiny pieces and mounted on top of SEM stubs using carbon conductive tape
for SEM characterization of AuNP and AuNR deposition on shells.
Toxicity Measurement Assay. For protein damage and antioxidant enzyme activity
measurements, clams were exposed to 2 mg/L AuNP and AuNR suspensions at room
temperature, as previously described. A 100 mL beaker containing 4 clams and 40 mL
gold nanoparticle suspension was used as a microcosm for the 72 hour time course of an
exposure experiment. To assure measurement consistency, three replicates and two
controls were conducted. Control 1 in which the clams were exposed to 40 mL medium
hard EPA water not containing any gold nanoparticles, and control 2 where the clams
were exposed to 2 mg/L HAuCl4. It should be noted that control 1 was carried out as the
background for blank measurements, while control 2 directly measured the toxicity
associated with ionic gold. At the end of the exposure, clams were weighed, the gills and
digestive glands were dissected and then immediately frozen in liquid nitrogen and stored
at -80°C.
Gills and digestive glands were individually homogenized in 200 µL of 50 mM potassium
phosphate buffer pH 7.0 containing 0.5 mM EDTA (KPB50) supplemented with protease
inhibitor cocktail (#P8340, MilliporeSigma - St. Louis, US). The homogenates were
centrifuged at 15,000 x g for 15 minutes at 4 °C, and the supernatant was collected and
stored as aliquots at -80°C until further analysis, as described below.
Protein damage assays. For protein thiol levels (P-SH), 20 µL of sample (approximately
100 µg protein) was added to 10 µL of KPB50 buffer and incubated with 300 µM
monobromobimane (mBrB, #B4380, MilliporeSigma – St. Louis, US) for 4 hours at room
temperature in the dark. The non-fluorescent dye mBrB specifically binds to reduced
26
sulfhydryl groups, after which it becomes fluorescent [44]. After the incubation, proteins
were extracted using cold acetone (150 µL) and incubated overnight at -20°C. Samples
were centrifuged at 15,000 x g for 10 min at 4°C, and the protein extracts were then further
washed with cold acetone at least 3×, until no residual color from mBrB was visible.
Proteins were resuspended in 25 µL of 25 mM pH 7.0 TRIS buffer containing 8 M urea
and 2% SDS, and the protein concentration was determined by the bicinchoninic acid
assay using the Pierce™ BCA protein assay kit (23225, ThermoFisher Scientific –
Waltham, US). A standard curve of bovine serum albumin (BSA) was used containing
urea and SDS concentrations equivalent to the samples. For the fluorescence
measurements, 10 µg of protein were added to 384 well solid black plates and the volume
of each well was adjusted to 100 µL with 25 mM TRIS buffer at pH 7.0 containing 8 M
urea and 2% SDS. Samples were read at 340-10nm (excitation) and 520 nm (emission).
Wells containing buffer, but no sample were used as blanks. The fluorescence of each
sample was subtracted from the blank and normalized by the average for the control
group.
For protein carbonyl groups (P-CO), samples were treated similar to the P-SH assay,
except by replacing mBrB with 200 µM coumarin hydrazide (7-(diethylamino)-coumarin-
3-carbohydrazide, 36798, MilliporeSigma, St. Loius - US). This non-fluorescent dye binds
specifically to carbonyl groups, after which it becomes fluorescent.[45] Samples were
analyzed at 400-10 nm (excitation) 470-12 (emission), and data were analyzed as
described for the P-SH assay.
Enzyme assays. For glutathione reductase (GR) activity, samples were analyzed at 340
nm to measure = NADPH consumption by the reduction of disulfide glutathione in 100

27
mM potassium phosphate buffer pH 7.0 containing 1 mM EDTA, 200 µM NADPH, and 1
mM oxidized glutathione [46].
For glutathione peroxidase (GPx) activity, samples were analyzed at 340 nm to measure
NAPDH consumption associated with peroxide breakdown in 50 mM potassium
phosphate buffer pH 7.0 containing 0.5 mM EDTA, 200 µM NADPH, 1 mM reduced
glutathione, 0.2 U/mL purified baker’s yeast glutathione reductase, and 0.5 mM cumene
hydroperoxide [47].
For catalase (Cat) activity, samples were analyzed at 240 nm to measure hydrogen
peroxide consumption in 50 mM potassium phosphate buffer pH 7.0 containing 0.5 mM
EDTA, 0.01% Triton x-100 and 10 mM hydrogen peroxide [48].
For thioredoxin reductase (TrxR) activity, samples were analyzed at 412 nm to measure
the 5,5'-dithio-bis-(2-nitrobenzoic acid) (DTNB) reduction in 100 mM potassium
phosphate buffer pH 7.0 containing 10 mM EDTA, 5 mM DTNB, 0.2 mg/ml BSA and 200
µM NADPH [49].
Specific enzyme activity was calculated by normalizing enzyme activity by the protein
content, which was determined using the Pierce™ BCA protein assay kit (23225,
ThermoFisher Scientific – Waltham, US) and BSA as standard.
Statistics. Data were analyzed for normality distribution using the Kolmogorov-Smirnov
test and outliers were removed using the Grubs test. Data were further analyzed by one-
way ANOVA and Tukey’s post hoc or Kruskal-Wallis and Dunn’s post hoc tests when
appropriate. Significant differences were accepted when p < 0.05.

28
2.4 Results and Discussion
Figure 2.1. Vis-NIR normalized absorption and TEM images of synthesized AuNPs and AuNRs prior to BSA coating.
Vis-NIR and corresponding TEM images of synthesized AuNPs and AuNRs are shown
in Figure 2.1 (Additional TEM images and particle size distributions of the nanoparticles
are provided in Figures 2.S1-S2). Citrate-AuNPs were 19.2 ± 0.2 and 45.3 ± 0.1 nm
average diameter, while CTAB coated AR4 and CTAB/BDAC coated AR8 AuNRs were
43 ± 0.1 nm and 84 ± 0.3 nm long and 11± 0.1 nm and 10 ± 0.2 nm in diameter,
respectively (the noted errors reflect 95% confidence interval based on n=30
measurements of TEM images obtained using ImageJ). The average AR values were 3.9
± 0.1 and 8.4 ± 0.2, but for simplicity we refer to these AuNRs as AR4 and AR8. Following

29
BSA treatment, the coated AuNPs and AuNRs retained their shapes while the plasmon
bands red shifted due to the change in local dielectric constant ɛm. The relative impacts
of medium dielectric constant are well-developed and previously described in the
literature [40, 50] The plasmon band location of the nanoparticles before and after BSA
coating are presented in Table 2.1.
Table 2.1. Plasmon band wavelengths of AuNPs and AuNRs before and after BSA coating
Initial coating BSA coating
Transverse
band (nm)
Longitudinal
band (nm)
Transverse
band (nm)
Longitudinal
band (nm)
Small AuNP (19 nm) 520 N.A. 526 N.A.
Large AuNP (45 nm) 533 N.A. 537 N.A.
AR4 AuNR 514 728 517 733
AR8 AuNR 530 1120 535 1128
Nanoparticles did not aggregate within the time course of the ligand exchange and C.
fluminea exposure experiment. As a result, any reported changes in absorption intensity
of the plasmon bands can be directly related to particle concentration changes in the
water column using the Beer-Lambert law [51, 52].
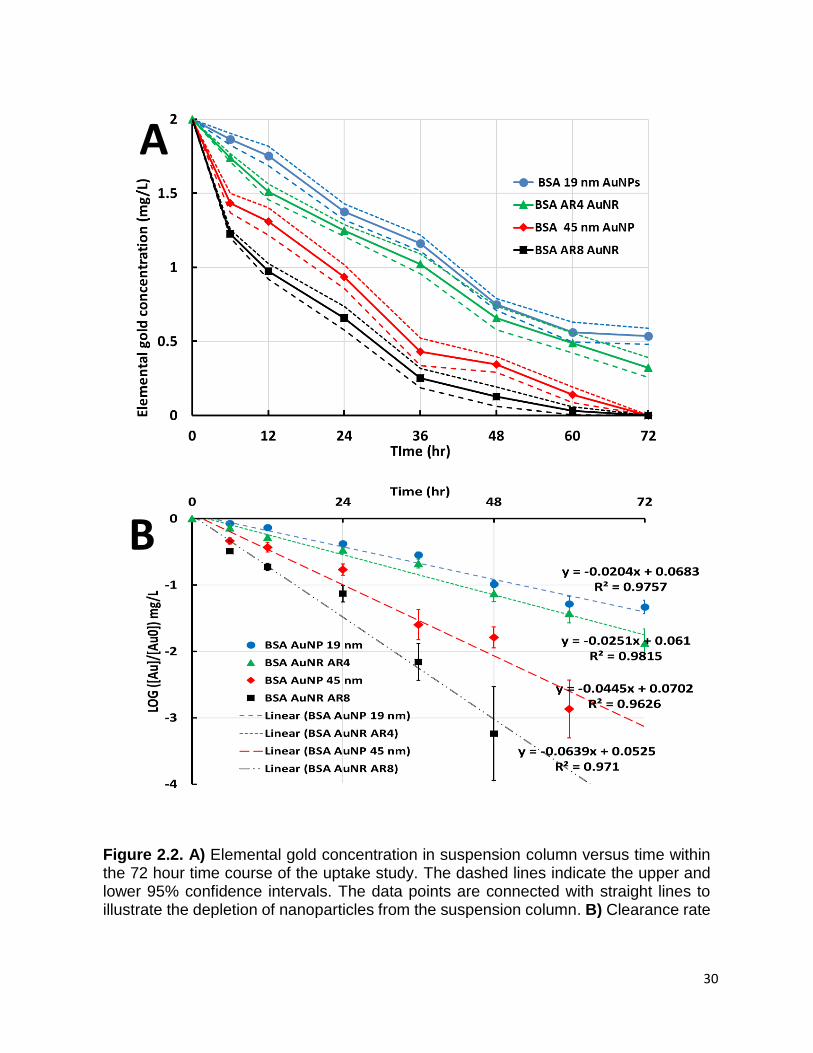
30
Figure 2.2. A) Elemental gold concentration in suspension column versus time within the 72 hour time course of the uptake study. The dashed lines indicate the upper and lower 95% confidence intervals. The data points are connected with straight lines to illustrate the depletion of nanoparticles from the suspension column. B) Clearance rate
A
B

31
calculations as fitted by first order kinetic rate modeling. The linear regressions and line equations represent the first order kinetic expressions.
Figure 2.2A indicates how the 2 mg/L initial gold nanoparticle concentration in
suspension changes within the 72 hour exposure period of each experiment. Each
reported value represents the average of seven replicates and the associated 95%
confidence intervals for each measurement are presented as dashed lines. Data points
were calculated by directly measuring the absorption intensity of the plasmon bands and
linearly relating them to the elemental gold concentration in the suspension column. The
results shown in Figure 2.2A are not surprising based upon our previous work[30] that
showed the clearance efficiency of nanoparticles is size related. After 72 hours, the
removal efficiencies for 19 nm AuNP, AR4 AuNR, 45 nm AuNP, and AR8 AuNR from the
suspension column were 73, 84, 100, and 100%, respectively. To compare results
obtained with the high AR AuNRs to the spherical AuNPs, the equivolume spherical
diameter was calculated (the shape conversion calculations are presented in the SI). The
equivolume spherical diameters of the AR4 and AR8 AuNRs were 16 and 19 nm,
respectively. The kinetics of nanoparticle clearance were evaluated using a first-order
model, since the clearance of each size particle follows a logarithmic pattern with a sharp
drop within the first 12 hours and a linear drop over the remainder of the experiment. Our
prior study has shown that nanoparticle removal via filter-feeding is most appropriately
characterized by a first-order model [30]. As shown in Figure 2.2B and summarized in
Table 2.2, the kinetic coefficients range from 0.020+0.002 to 0.064+0.012 h-1 and are size
and shape dependent (calculation details are presented in the SI).
32
In general, the clearance rates increase with an increase in the nanoparticle size. AR8
AuNRs had the highest clearance rate (=0.064 h-1) among all tested nanoparticles despite
having a smaller equivolume spherical diameter than the 45 nm AuNPs. The clearance
rate of the AR8 AuNRs was 45% higher than 45 nm AuNPs. AR4 AuNRs followed the
same trend with a 25% higher clearance rate compared to 19 nm GNPs. We found out
that AuNRs despite having a smaller equivolume spherical diameter compared to
spherical AuNPs have a higher clearance rate due to elongation along one axis. A clear
pattern relating clearance rates and shape-related nanoparticle size was observed, if
these rates are sorted based on the longest axis (nanoscale feature) of these
nanoparticles rather than apparent spherical size, Table 2.2. Accordingly, these results
suggest that not only size, but shape-related features such as AR play an important role
in the filtration of nanoparticles by C. fluminea. C. fluminea is generally known as a non-
selective filter-feeder with a filtration mechanism that is mainly based on the quantity and
the size of particulates rather than quality[53, 54]. Filter-feeders such as C. fluminea suck
in and expel water through siphons for feeding and respiration. The water is pushed
through the organism by the collective movement of millions of hairlike fibers called cilia
on the gills. Simultaneously, cilia strain food (mainly particles) from the influent water and
transport it into the clam[26, 55]. The net removal rate of particles via these fibers are
governed by the following mechanisms 1) direct interception, 2) inertial impaction, 3)
gravitational deposition, 4) diffusion, and 5) electrostatic attraction[56]. Due to the high
fluid velocity inside the gills, diffusion and gravitational deposition are generally negligible
compared to other mechanisms. The magnitudes of direct interception, inertial impaction,
and electrostatic attractions are directly related to the available surface area of the
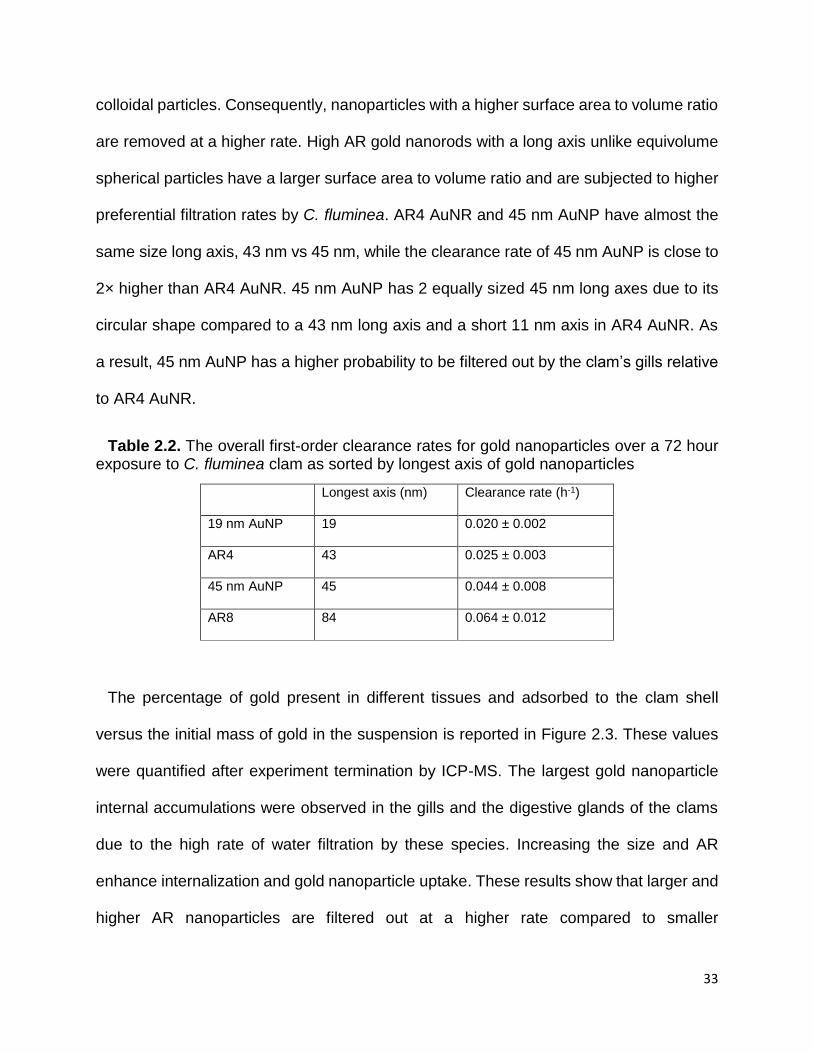
33
colloidal particles. Consequently, nanoparticles with a higher surface area to volume ratio
are removed at a higher rate. High AR gold nanorods with a long axis unlike equivolume
spherical particles have a larger surface area to volume ratio and are subjected to higher
preferential filtration rates by C. fluminea. AR4 AuNR and 45 nm AuNP have almost the
same size long axis, 43 nm vs 45 nm, while the clearance rate of 45 nm AuNP is close to
2× higher than AR4 AuNR. 45 nm AuNP has 2 equally sized 45 nm long axes due to its
circular shape compared to a 43 nm long axis and a short 11 nm axis in AR4 AuNR. As
a result, 45 nm AuNP has a higher probability to be filtered out by the clam’s gills relative
to AR4 AuNR.
Table 2.2. The overall first-order clearance rates for gold nanoparticles over a 72 hour exposure to C. fluminea clam as sorted by longest axis of gold nanoparticles
Longest axis (nm) Clearance rate (h-1)
19 nm AuNP 19 0.020 ± 0.002
AR4 43 0.025 ± 0.003
45 nm AuNP 45 0.044 ± 0.008
AR8 84 0.064 ± 0.012
The percentage of gold present in different tissues and adsorbed to the clam shell
versus the initial mass of gold in the suspension is reported in Figure 2.3. These values
were quantified after experiment termination by ICP-MS. The largest gold nanoparticle
internal accumulations were observed in the gills and the digestive glands of the clams
due to the high rate of water filtration by these species. Increasing the size and AR
enhance internalization and gold nanoparticle uptake. These results show that larger and
higher AR nanoparticles are filtered out at a higher rate compared to smaller

34
nanoparticles. As a result, they are more available for the clams to be taken up as a
potential food source. These measurements are consistent with the vis-NIR spectroscopy
measurements (Figure 2.2A). Much lower amounts of gold nanoparticles were detected
in other tissues including anterior and posterior adductor muscles and the foot. It should
be noted that due to the small size of these tissue compartments and very low
concentration of gold nanoparticles in them, we did not investigate each tissue separately.
After separating the gills and digestive glands, the rest of the tissues were wet digested
and sampled as a collective unit. There is an inherent error in the gold values reported
for (pseudo)feces that originates from the difficulty associated with retrieving all of the
(pseudo)feces after the experiment termination. This error is due to the stickiness and
fine size of the (pseudo)feces. Moreover, (pseudo)feces are exposed to gold
nanoparticles present within the suspension and gold nanoparticle sorption to these
organic matrices is feasible. However, the overall mass balance accuracies of gold
nanoparticle fate within these exposure experiments fall in the range of 88.6-106.7%
(calculations and details are provided in the SI). Since the collected amount and the
elemental gold mass concentration in (pseudo)feces are much smaller than other
specimens, its associated inaccuracy should not noticeably change the overall mass
balance.
35
Figure 2.3. Elemental gold ICP-MS measurements presenting the gold content present in different tissues and on the top of the clam shells as expressed in mass percentages versus the initial gold mass.
Elemental gold ICP-MS measurements suggest that nanoparticles are not only
internalized in the digestive glands of clams, but are also internally taken up and
consumed by the clams. In all sets of experiments, a noticeably large drop in the Vis-NIR
absorption intensity of plasmon bands of control 2 (microcosm containing nanoparticle
suspension and glued shells of dissected clams) was observed, confirming nanoparticle
adsorption to the shells. These plasmon band intensity drops were converted to
adsorption percentages and the final values are reported in Table 2.S2. We believe that
the presence of a thick organic biolayer on the top of the shells facilitates sorption of BSA
coated gold nanoparticles. This biolayer mainly consists of natural organic matter (NOM),
organic waste (pseudo)feces, and other organic materials present in the system. As
indicated in Figure 2.3 and Table 2.S2, 45 and 19 nm AuNPs showed a higher affinity
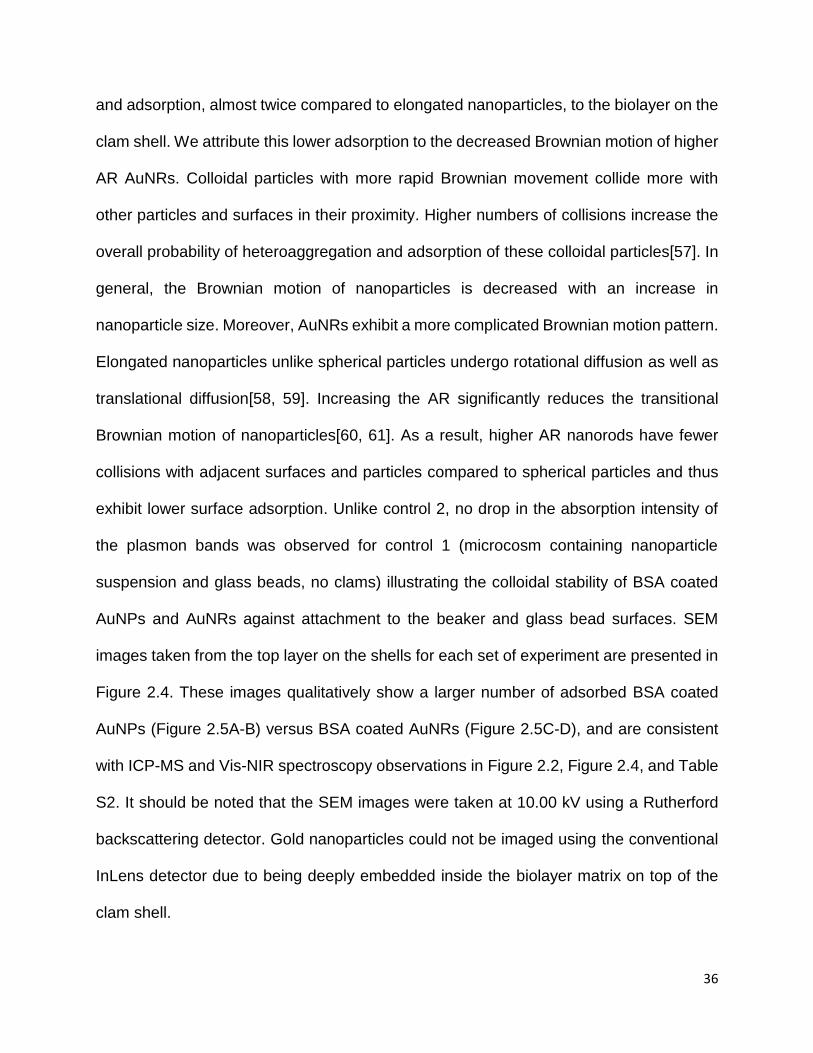
36
and adsorption, almost twice compared to elongated nanoparticles, to the biolayer on the
clam shell. We attribute this lower adsorption to the decreased Brownian motion of higher
AR AuNRs. Colloidal particles with more rapid Brownian movement collide more with
other particles and surfaces in their proximity. Higher numbers of collisions increase the
overall probability of heteroaggregation and adsorption of these colloidal particles[57]. In
general, the Brownian motion of nanoparticles is decreased with an increase in
nanoparticle size. Moreover, AuNRs exhibit a more complicated Brownian motion pattern.
Elongated nanoparticles unlike spherical particles undergo rotational diffusion as well as
translational diffusion[58, 59]. Increasing the AR significantly reduces the transitional
Brownian motion of nanoparticles[60, 61]. As a result, higher AR nanorods have fewer
collisions with adjacent surfaces and particles compared to spherical particles and thus
exhibit lower surface adsorption. Unlike control 2, no drop in the absorption intensity of
the plasmon bands was observed for control 1 (microcosm containing nanoparticle
suspension and glass beads, no clams) illustrating the colloidal stability of BSA coated
AuNPs and AuNRs against attachment to the beaker and glass bead surfaces. SEM
images taken from the top layer on the shells for each set of experiment are presented in
Figure 2.4. These images qualitatively show a larger number of adsorbed BSA coated
AuNPs (Figure 2.5A-B) versus BSA coated AuNRs (Figure 2.5C-D), and are consistent
with ICP-MS and Vis-NIR spectroscopy observations in Figure 2.2, Figure 2.4, and Table
S2. It should be noted that the SEM images were taken at 10.00 kV using a Rutherford
backscattering detector. Gold nanoparticles could not be imaged using the conventional
InLens detector due to being deeply embedded inside the biolayer matrix on top of the
clam shell.
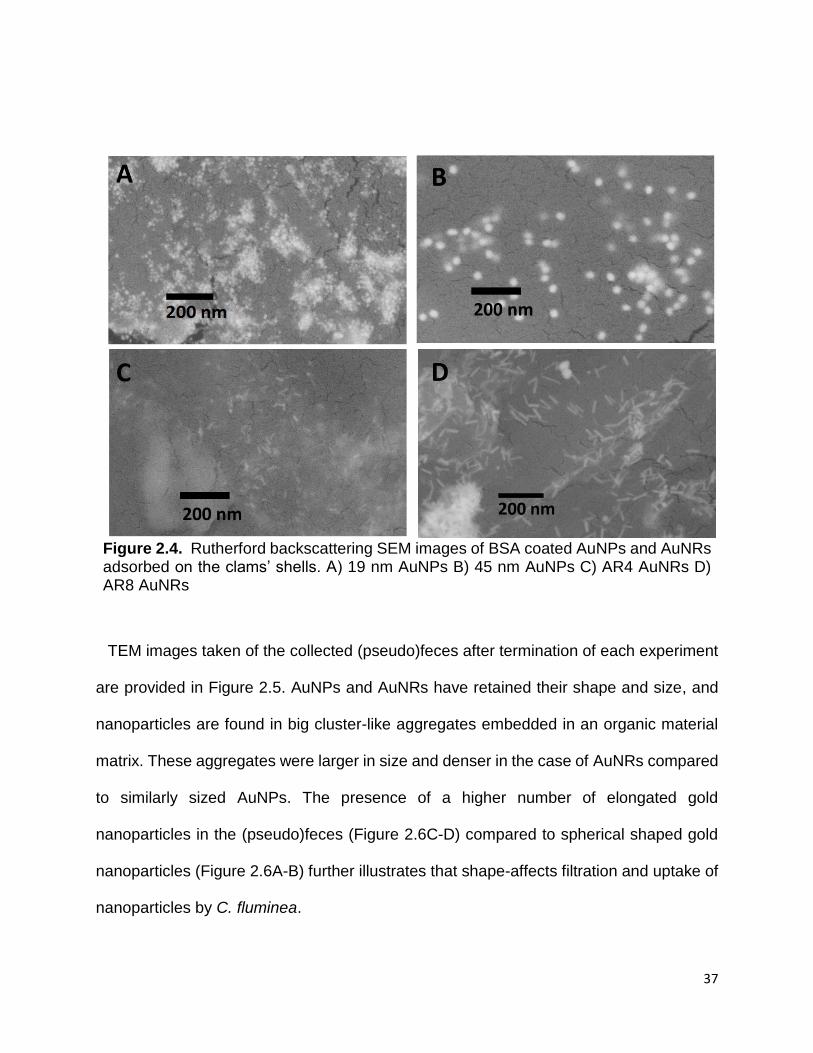
37
Figure 2.4. Rutherford backscattering SEM images of BSA coated AuNPs and AuNRs adsorbed on the clams’ shells. A) 19 nm AuNPs B) 45 nm AuNPs C) AR4 AuNRs D) AR8 AuNRs
TEM images taken of the collected (pseudo)feces after termination of each experiment
are provided in Figure 2.5. AuNPs and AuNRs have retained their shape and size, and
nanoparticles are found in big cluster-like aggregates embedded in an organic material
matrix. These aggregates were larger in size and denser in the case of AuNRs compared
to similarly sized AuNPs. The presence of a higher number of elongated gold
nanoparticles in the (pseudo)feces (Figure 2.6C-D) compared to spherical shaped gold
nanoparticles (Figure 2.6A-B) further illustrates that shape-affects filtration and uptake of
nanoparticles by C. fluminea.
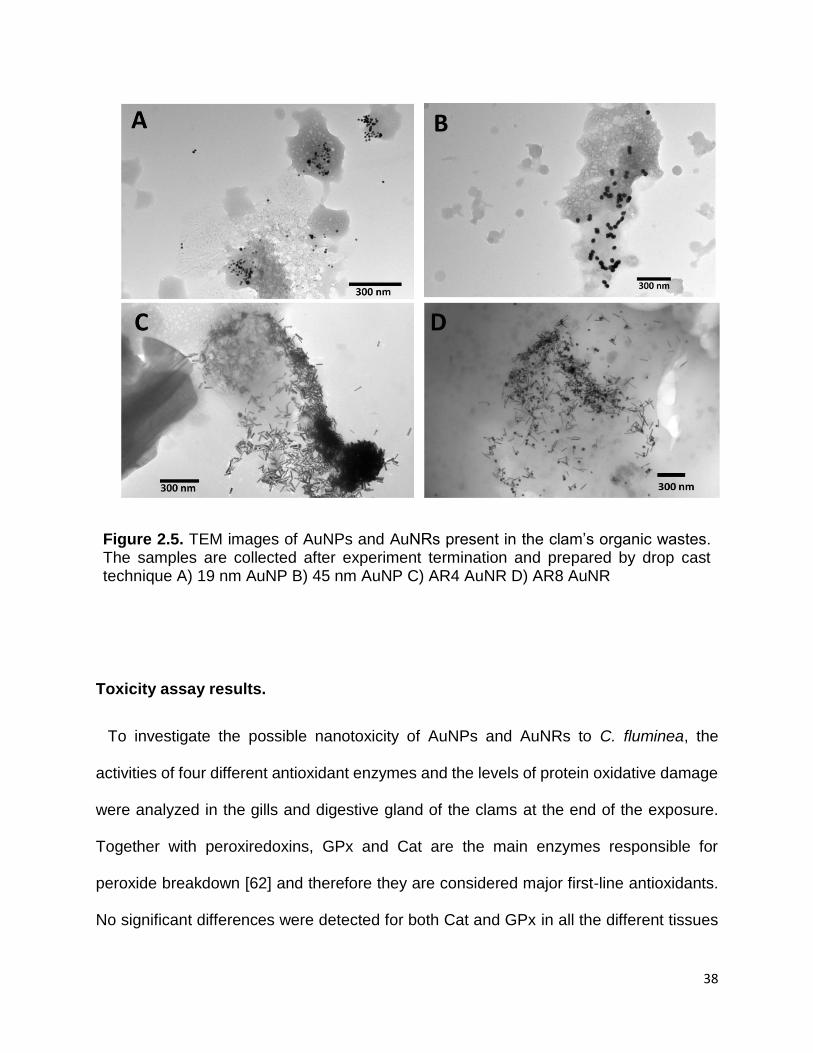
38
Figure 2.5. TEM images of AuNPs and AuNRs present in the clam’s organic wastes. The samples are collected after experiment termination and prepared by drop cast technique A) 19 nm AuNP B) 45 nm AuNP C) AR4 AuNR D) AR8 AuNR
Toxicity assay results.
To investigate the possible nanotoxicity of AuNPs and AuNRs to C. fluminea, the
activities of four different antioxidant enzymes and the levels of protein oxidative damage
were analyzed in the gills and digestive gland of the clams at the end of the exposure.
Together with peroxiredoxins, GPx and Cat are the main enzymes responsible for
peroxide breakdown [62] and therefore they are considered major first-line antioxidants.
No significant differences were detected for both Cat and GPx in all the different tissues
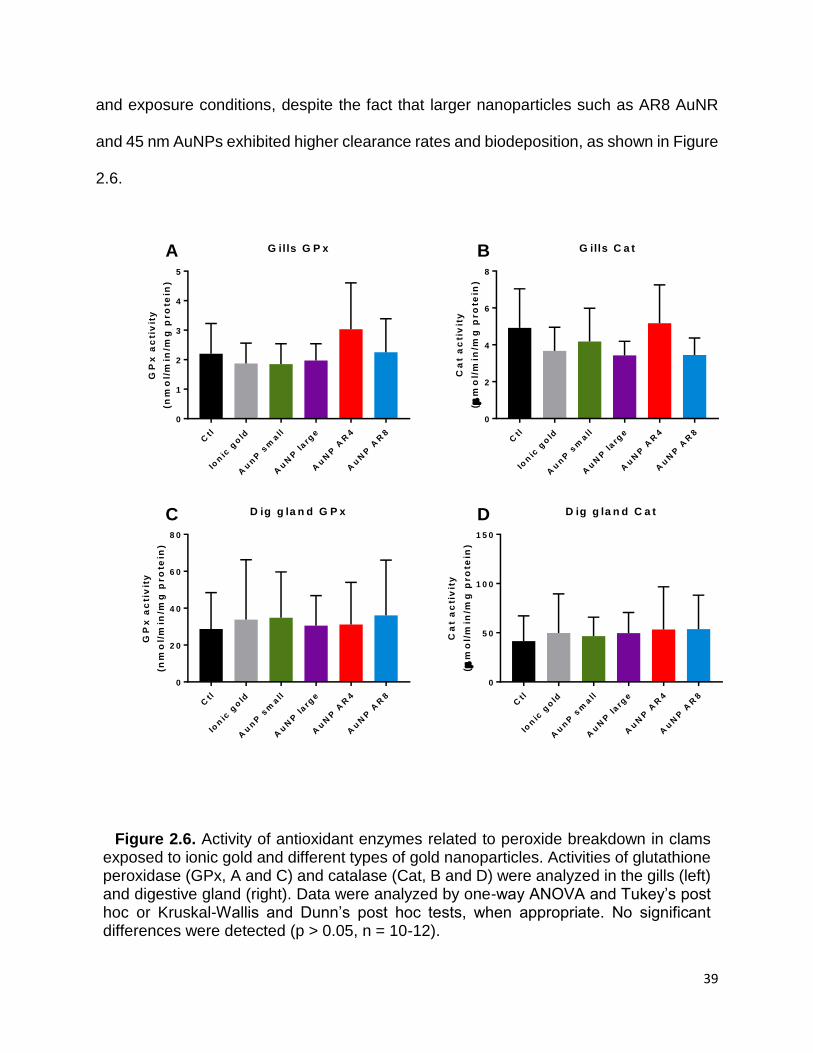
39
and exposure conditions, despite the fact that larger nanoparticles such as AR8 AuNR
and 45 nm AuNPs exhibited higher clearance rates and biodeposition, as shown in Figure
2.6.
Ctl
Ion
ic g
old
Au
nP
sm
all
Au
NP
larg
e
Au
NP
AR
4
Au
NP
AR
8
0
1
2
3
4
5
G ills G P x
GP
x a
cti
vit
y
(nm
ol/
min
/mg
pro
tein
)
Ctl
Ion
ic g
old
Au
nP
sm
all
Au
NP
larg
e
Au
NP
AR
4
Au
NP
AR
8
0
2
4
6
8
G ills C a t
Ca
t a
cti
vit
y
(
mo
l/m
in/m
g p
ro
tein
)
Ctl
Ion
ic g
old
Au
nP
sm
all
Au
NP
larg
e
Au
NP
AR
4
Au
NP
AR
8
0
2 0
4 0
6 0
8 0
D ig g la n d G P x
GP
x a
cti
vit
y
(nm
ol/
min
/mg
pro
tein
)
Ctl
Ion
ic g
old
Au
nP
sm
all
Au
NP
larg
e
Au
NP
AR
4
Au
NP
AR
8
0
5 0
1 0 0
1 5 0
D ig g la n d C a t
Ca
t a
cti
vit
y
(
mo
l/m
in/m
g p
ro
tein
)
A B
C D
Figure 2.6. Activity of antioxidant enzymes related to peroxide breakdown in clams exposed to ionic gold and different types of gold nanoparticles. Activities of glutathione peroxidase (GPx, A and C) and catalase (Cat, B and D) were analyzed in the gills (left) and digestive gland (right). Data were analyzed by one-way ANOVA and Tukey’s post hoc or Kruskal-Wallis and Dunn’s post hoc tests, when appropriate. No significant differences were detected (p > 0.05, n = 10-12).

40
The activities of the thiol reductase enzymes GR and TrxR were also analyzed, as they
are key antioxidant ancillary enzymes [62]. GR is responsible for the reduction of the
oxidized form of glutathione and plays a role in peroxide breakdown mediated by GPx.
Similarly, TrxR reduces the oxidized form of thioredoxin, which is an electron donor for
peroxide breakdown by peroxiredoxins. As shown in Figure 2.7, GR activity decreased in
the gills after exposure to AR4 and AR8 AuNRs (Figure 2.7A), but not in the digestive
gland (Figure 2.7B). This result reflects the higher the number of elongated nanoparticles
captured in the gills relative to the amounts transported into the digestive gland.
Regarding TrxR activity, ionic gold had a strong inhibitory (80-90% inhibition) effect in
both tissues, which was expected since many gold complexes are known inhibitors of this
enzyme [63]. This same effect was detected in gills after exposure to Large (45 nm)
AuNPs, AR4, and AR8 AuNRs (Figure 2.7C), but at lower levels (25-30% inhibition). The
observed lack of inhibition of TrxR activity in the case of small (19 nm) AuNPs is
consistent with the ICP-MS observations of lower concentration of 19 nm AuNP in the
gills, Figure 2.3. In the digestive gland, only partial inhibition was detected in the digestive
gland (30%) after exposure to AR8 AuNRs (Figure 2.7D), as TrxR activity was similar to
both the control and ionic gold group. It should be noted that AR8 AuNRs had the highest
rate of filtration and accumulation in the digestive gland and gills, Figure 2.3. Thus,
observed partial inhibition can be correlated to the higher presence of AR8 AuNRs in
these tissues.

41
Ctl
Ion
ic g
old
Au
nP
sm
all
Au
NP
larg
e
Au
NP
AR
4
Au
NP
AR
8
0
5
1 0
1 5
2 0
2 5
G ills G RG
R a
cti
vit
y
(nm
ol/
min
/mg
pro
tein
)
bb
a
a ,b
a ,ba ,b
Ctl
Ion
ic g
old
Au
nP
sm
all
Au
NP
larg
e
Au
NP
AR
4
Au
NP
AR
8
0
1 0
2 0
3 0
4 0
5 0
D ig g la n d G R
GR
ac
tiv
ity
(nm
ol/
min
/mg
pro
tein
)
Ctl
Ion
ic g
old
Au
nP
sm
all
Au
NP
larg
e
Au
NP
AR
4
Au
NP
AR
8
0
2
4
6
8
1 0
G ills T rx R
Trx
R a
cti
vit
y
(nm
ol/
min
/mg
pro
tein
)
b
cc
a
a ,cc
Ctl
Ion
ic g
old
Au
nP
sm
all
Au
NP
larg
e
Au
NP
AR
4
Au
NP
AR
8
0
2
4
6
8
1 0
D ig g la n d T rx R
Trx
R a
cti
vit
y
(nm
ol/
min
/mg
pro
tein
)
a
b
a
a
a a ,b
A B
C D
Figure 2.7. Activity of thiol reductase antioxidant enzymes in clams exposed to ionic gold and different types of gold nanoparticles. Activities of glutathione reductase (GR, A and C) and thioredoxin reductase (TrxR, B and D) were analyzed in the gills (left) and digestive gland (right). Data were analyzed by one-way ANOVA and Tukey’s post hoc or Kruskal-Wallis and Dunn’s post hoc tests, when appropriate. Groups not sharing letters are significantly different (p<0.05, n=10-12).
It is unclear if inhibition of GR and TrxR by the different gold nanoparticles was related
to intracellular gold dissociation after nanoparticle uptake. BSA-coated nanoparticles
were found in the shell and feces of the animals at the end of the exposure (Figures 2.4
and 2.5) while retaining their initial shapes, an indication of the high stability of these
42
nanomaterials. In addition, the mode of action for the TrxR inhibition by gold(I) and
gold(III) complexes is not dependent on the release of ionic gold, but by the direct binding
to the TrxR selenol group[63]. Due to the lack of a selenol group, GR activity is not as
sensitive to gold exposure as TrxR, which is in accordance to our data. Nevertheless, GR
and TrxR inhibition was evident in animals exposed to AuNR and to large (45 nm) AuNP,
which were also the groups with the highest gold bioaccumulation in the digestive gland
and gills (Figure 2.3).
To account for the role of oxidative damage as one of the mechanisms of toxicity for
metal nanoparticles [64], protein oxidation in gills and digestive gland was assessed using
fluorescent-labeling techniques. As shown in Figure 2.8, P-SH levels remained unaltered
in the gills, but increased 76% in the digestive gland (Figure 2.8C), suggesting higher
levels of reduced protein sulfhydryl groups. For P-CO levels, no significant effects were
observed in both tissues. These data suggest a low reactivity and probably lower toxicity
of BSA coated gold nanomaterials, as already shown in vitro with cell cultures [65]. Such
increases in P-SH can be indicative of synthesis of sulfhydryl–containing proteins. For
instance, metallothioneins are sulfhydryl-rich proteins with the ability to bind to and
dispose gold [66, 67] and can be upregulated by AuNP exposure in other
invertebrates.[31] Interestingly, the increase in P-SH levels was detected only in the
digestive gland of clams exposed to small AuNP, which was the group with the lowest
gold bioaccumulation (Figure 2.3). This may indicate that different signaling pathways
related to cellular defenses and stress response could be activated depending not only
on the size and type of gold nanomaterial, but also on their uptake and body burden,
which remains to be elucidated.

43
Despite no signs of increased oxidative damage detected in this study, the inhibition of
GR and TrxR by gold nanoparticles can cause further consequences to the organisms
when exposed to additional stressors, what is usually the case when taking into
consideration an environmental scenario. For instance, inhibition of GR and TrxR in the
gills of brown mussels Perna perna and oysters Crassostrea gigas decreases their
survival rate to quinone and peroxide exposure, as well as their in vivo peroxide
breakdown rate [68, 69]. This is indicative of the importance of these enzymes for the
maintenance of the cellular redox environment, cell function and survival. An interesting
example of how these antioxidant enzymes can be associated with cellular function was
found in oyster immune cells: depletion of glutathione and inhibition of GR and TrxR in
hemocytes causes loss of important cellular functions associated with pathogen
recognition and clearance [70], such as cellular adhesion, phagocytosis and oxidative
burst. Additional studies with these AuNP and AuNR in the presence of temperature or
hypoxic stress, pathogen exposure, or even other pro-oxidant chemicals, could help to
clarify this scenario.
It is also important to note that this study focused only on the antioxidant system and
protein oxidative damage to investigate the potential toxicity of these nanomaterials. Yet,
different types of gold nanomaterials have caused other effects on bivalve species: loss
of hemocyte or digestive cell lysosomal membrane integrity [71, 72]; changes on cellular
element composition and tissue histological changes [73] and inflammation [74]. In
addition, mitochondrial TrxR is known to be inhibited by gold complexes, as well as
mitochondrial enzyme complexes [63]. In fact, the mitochondrial effects of nanoparticles
in bivalves are still poorly understood, and apparently the mitochondrial

44
TrxR/peroxiredoxin system could be a target for gold nanomaterial in bivalves. Bivalve
mitochondria were already shown to uptake and are sensitive to different nanoparticles,
such as glass wool [75], silver [76], and zinc oxide [77], and have been considered an
important target for nanotoxicity in bivalves.
Ctl
Ion
ic g
old
Au
nP
sm
all
Au
NP
larg
e
Au
NP
AR
4
Au
NP
AR
8
0 .0
0 .5
1 .0
1 .5
2 .0
G ills P -S H
Pro
tein
th
iol
lev
els
(fo
ld)
Ctl
Ion
ic g
old
Au
nP
sm
all
Au
NP
larg
e
Au
NP
AR
4
Au
NP
AR
8
0 .0
0 .5
1 .0
1 .5
2 .0
G ills P -C O
Pro
tein
ca
rb
on
yl
lev
els
(fo
ld)
Ctl
Ion
ic g
old
Au
nP
sm
all
Au
NP
larg
e
Au
NP
AR
4
Au
NP
AR
8
0
1
2
3
D ig e s t iv e g la n d P -S H
Pro
tein
th
iol
lev
els
(fo
ld)
a
a
b
a a a
Ctl
Ion
ic g
old
Au
nP
sm
all
Au
NP
larg
e
Au
NP
AR
4
Au
NP
AR
8
0 .0
0 .5
1 .0
1 .5
D ig e s t iv e g la n d P -C O
Pro
tein
ca
rb
on
yl
lev
els
(fo
ld)
A B
C D
Figure 2.8. Protein damage in gills and digestive gland of clams exposed to ionic gold and different types of gold nanoparticles. The levels of reduced protein thiols (P-SH, A and C) and protein carbonyl groups (P-CO, B and D) were analyzed in the gills (left) and digestive gland (right). Data were analyzed by one-way ANOVA and Tukey’s post hoc or Kruskal-Wallis and Dunn’s post hoc tests, when appropriate. Groups not sharing letters are significantly different (p<0.05, n=9-12).
45
2.5 Conclusions
This study has shown that AR affects gold nanomaterial uptake and biodeposition by
the filter feeder C. fluminea. To the best of our knowledge, this study was the first to
investigate the impact of nanoparticle elongation on the fate and nanotoxity to C.
fluminea, and establishing a mass distribution balance. As shown, on a mass basis the
highest AR nanomaterials were retained more effectively than lower AR nanomaterials in
the gills and digestive glands. On the basis of an equivolume sphere calculation it is
apparent that elongated rods are filtered more effectively than equivolume spheres, while
spherical BSA coated gold nanoparticles exhibited higher sorption onto the organic
biolayer of the shells. This result suggests that the elongated rods are preferentially
removed due to a better association with the gills or other tissues during the filter feeding
process. Based on the analysis of antioxidant enzyme responses and protein oxidations,
the toxicological impacts of nanoparticle uptake were generally minor, with a higher
impact in the case of higher AR elongated nanorods, but other physiological
consequences may not be ruled out.
46
2.6 References
1. Lin, D., et al., Fate and transport of engineered nanomaterials in the
environment. Journal of Environmental Quality, 2010. 39(6): p. 1896-1908.
2. Praetorius, A., M. Scheringer, and K. Hungerbuhler, Development of
TiO2 Nanoparticles in the Rhine River. Environmental science & technology,
2012. 46(12): p. 6705-6713.
3. Lowry, G.V., et al., Environmental occurrences, behavior, fate, and ecological
effects of nanomaterials: an introduction to the special series. Journal of
environmental quality, 2010. 39(6): p. 1867-1874.
4. Cornelis, G., et al., Fate and bioavailability of engineered nanoparticles in soils: a
review. Critical Reviews in Environmental Science and Technology, 2014.
44(24): p. 2720-2764.
5. Dale, A.L., et al., Modeling nanomaterial environmental fate in aquatic systems.
Environmental science & technology, 2015. 49(5): p. 2587-2593.
6. Lowry, G.V., et al., Long-term transformation and fate of manufactured Ag
nanoparticles in a simulated large scale freshwater emergent wetland.
Environmental science & technology, 2012. 46(13): p. 7027-7036.
7. Gottschalk, F., et al., Modeled environmental concentrations of engineered
nanomaterials (TiO2, ZnO, Ag, CNT, fullerenes) for different regions.
Environmental science & technology, 2009. 43(24): p. 9216-9222.
47
8. Aiken, G.R., H. Hsu-Kim, and J.N. Ryan, Influence of dissolved organic matter on
the environmental fate of metals, nanoparticles, and colloids. Environmental
science & technology, 2011. 45(8): p. 3196-3201.
9. Hoecke, K.V., et al., Fate and effects of CeO2 nanoparticles in aquatic
ecotoxicity tests. Environmental science & technology, 2009. 43(12): p. 4537-
4546.
10. Yang, P. and C.M. Lieber, Nanorod-superconductor composites: a pathway to
materials with high critical current densities. Science, 1996. 273(5283): p. 1836.
11. Park, W.I., et al., Fabrication and electrical characteristics of high-performance
ZnO nanorod field-effect transistors. Applied Physics Letters, 2004. 85(21): p.
5052-5054.
12. Dickerson, E.B., et al., Gold nanorod assisted near-infrared plasmonic
photothermal therapy (PPTT) of squamous cell carcinoma in mice. Cancer
letters, 2008. 269(1): p. 57-66.
13. Law, M., et al., Nanowire dye-sensitized solar cells. Nature materials, 2005. 4(6):
p. 455-459.
14. Wan, Q., et al., Fabrication and ethanol sensing characteristics of ZnO nanowire
gas sensors. Applied Physics Letters, 2004. 84(18): p. 3654-3656.
15. Kolmakov, A., et al., Detection of CO and O2 using tin oxide nanowire sensors.
Advanced Materials, 2003. 15(12): p. 997-1000.
16. consumer product inventories. Woodrow Wilson international center for scholars:
Washington DC.

48
17. Cho, W.-S., et al., Comparison of gene expression profiles in mice liver following
intravenous injection of 4 and 100nm-sized PEG-coated gold nanoparticles.
Toxicology letters, 2009. 191(1): p. 96-102.
18. Merchant, B., Gold, the noble metal and the paradoxes of its toxicology.
Biologicals, 1998. 26(1): p. 49-59.
19. Daniel, M.-C. and D. Astruc, Gold nanoparticles: assembly, supramolecular
chemistry, quantum-size-related properties, and applications toward biology,
catalysis, and nanotechnology. Chemical reviews, 2004. 104(1): p. 293-346.
20. Goodman, C.M., et al., Toxicity of gold nanoparticles functionalized with cationic
and anionic side chains. Bioconjugate chemistry, 2004. 15(4): p. 897-900.
21. Hauck, T.S., A.A. Ghazani, and W.C. Chan, Assessing the effect of surface
chemistry on gold nanorod uptake, toxicity, and gene expression in mammalian
cells. Small, 2008. 4(1): p. 153-159.
22. Wang, S., et al., Challenge in understanding size and shape dependent toxicity
of gold nanomaterials in human skin keratinocytes. Chemical physics letters,
2008. 463(1-3): p. 145-149.
23. Schaeublin, N.M., et al., Does shape matter? Bioeffects of gold nanomaterials in
a human skin cell model. Langmuir, 2012. 28(6): p. 3248-3258.
24. Pan, Y., et al., Size‐dependent cytotoxicity of gold nanoparticles. Small, 2007.
3(11): p. 1941-1949.
25. Metch, J.W., et al., Metagenomic analysis of microbial communities yields insight
into impacts of nanoparticle design. Nature nanotechnology, 2018: p. 1.
49
26. Sousa, R., C. Antunes, and L. Guilhermino. Ecology of the invasive Asian clam
Corbicula fluminea (Müller, 1774) in aquatic ecosystems: an overview. in Annales
de Limnologie-International Journal of Limnology. 2008. EDP Sciences.
27. Baun, A., et al., Ecotoxicity of engineered nanoparticles to aquatic invertebrates:
a brief review and recommendations for future toxicity testing. Ecotoxicology,
2008. 17(5): p. 387-395.
28. Doherty, F.G., The Asiatic clam, Corbicula spp., as a biological monitor in
freshwater environments. Environmental monitoring and assessment, 1990.
15(2): p. 143-181.
29. McLeod, P.B., S.N. Luoma, and R.G. Luthy, Biodynamic modeling of PCB uptake
by Macoma balthica and Corbicula fluminea from sediment amended with
activated carbon. Environmental Science & Technology, 2007. 42(2): p. 484-490.
30. Hull, M.S., et al., Filter-feeding bivalves store and biodeposit colloidally stable
gold nanoparticles. Environmental science & technology, 2011. 45(15): p. 6592-
6599.
31. Pan, J.-F., et al., Size dependent bioaccumulation and ecotoxicity of gold
nanoparticles in an endobenthic invertebrate: the Tellinid clam Scrobicularia
plana. Environmental pollution, 2012. 168: p. 37-43.
32. Renault, S., et al., Impacts of gold nanoparticle exposure on two freshwater
species: a phytoplanktonic alga (Scenedesmus subspicatus) and a benthic
bivalve (Corbicula fluminea). Gold bulletin, 2008. 41(2): p. 116-126.
50
33. Guo, Z., et al., Shape separation of colloidal gold nanoparticles through salt-
triggered selective precipitation. Chemical Communications, 2011. 47(14): p.
4180-4182.
34. Albanese, A. and W.C. Chan, Effect of gold nanoparticle aggregation on cell
uptake and toxicity. ACS nano, 2011. 5(7): p. 5478-5489.
35. Jana, N.R., L. Gearheart, and C.J. Murphy, Wet chemical synthesis of high
aspect ratio cylindrical gold nanorods. The Journal of Physical Chemistry B,
2001. 105(19): p. 4065-4067.
36. Turkevich, J., P.C. Stevenson, and J. Hillier, A study of the nucleation and growth
processes in the synthesis of colloidal gold. Discussions of the Faraday Society,
1951. 11: p. 55-75.
37. Frens, G., Controlled nucleation for the regulation of the particle size in
monodisperse gold suspensions. Nature, 1973. 241(105): p. 20-22.
38. Murphy, C.J., et al., Gold nanorod crystal growth: from seed-mediated synthesis
to nanoscale sculpting. Current Opinion in Colloid & Interface Science, 2011.
16(2): p. 128-134.
39. Nikoobakht, B. and M.A. El-Sayed, Preparation and growth mechanism of gold
nanorods (NRs) using seed-mediated growth method. Chem. Mater, 2003.
15(10): p. 1957-1962.
40. Abtahi, S., et al., Sulfate-Mediated End-to-End Assembly of Gold Nanorods.
Langmuir, 2017. 33(6): p. 1486-1495.
51
41. Tebbe, M., et al., Colloidally stable and surfactant-free protein-coated gold
nanorods in biological media. ACS applied materials & interfaces, 2015. 7(10): p.
5984-5991.
42. Lawson, C.L. and R.J. Hanson, Solving least squares problems. Vol. 15. 1995:
Siam.
43. Miekeley, N., M.D. Carneiro, and C.P. da Silveira, How reliable are human hair
reference intervals for trace elements? Science of the total environment, 1998.
218(1): p. 9-17.
44. Fahey, R.C., et al., Analysis of biological thiols: quantitative determination of
thiols at the picomole level based upon derivatization with monobromobimanes
and separation by cation-exchange chromatography. Analytical biochemistry,
1981. 111(2): p. 357-365.
45. Vemula, V., Z. Ni, and M. Fedorova, Fluorescence labeling of carbonylated lipids
and proteins in cells using coumarin-hydrazide. Redox biology, 2015. 5: p. 195-
204.
46. Carlberg, I. and B. Mannervik, [59] Glutathione reductase. Methods in
enzymology, 1985. 113: p. 484-490.
47. Wendel, A., [44] Glutathione peroxidase. Methods in enzymology, 1981. 77: p.
325-333.
48. Aebi, H., [13] Catalase in vitro. Methods in enzymology, 1984. 105: p. 121-126.
49. Arnér, E.S., L. Zhong, and A. Holmgren, Preparation and assay of mammalian
thioredoxin and thioredoxin reductase. Methods in enzymology, 1999. 300: p.
226-239.
52
50. Link, S., M. Mohamed, and M. El-Sayed, Simulation of the optical absorption
spectra of gold nanorods as a function of their aspect ratio and the effect of the
medium dielectric constant. The Journal of Physical Chemistry B, 1999. 103(16):
p. 3073-3077.
51. Jain, P.K., et al., Calculated absorption and scattering properties of gold
nanoparticles of different size, shape, and composition: applications in biological
imaging and biomedicine. J. Phys. Chem. B, 2006. 110(14): p. 7238-7248.
52. Schneider, L., H.J. Schmid, and W. Peukert, Influence of particle size and
concentration on the second-harmonic signal generated at colloidal surfaces.
Applied Physics B: Lasers and Optics, 2007. 87(2): p. 333-339.
53. Boltovskoy, D., I. Izaguirre, and N. Correa, Feeding selectivity of Corbicula
fluminea (Bivalvia) on natural phytoplankton. Hydrobiologia, 1995. 312(3): p. 171-
182.
54. Atkinson, C.L., et al., Suspended material availability and filtration–biodeposition
processes performed by a native and invasive bivalve species in streams.
Hydrobiologia, 2011. 667(1): p. 191-204.
55. Way, C.M., et al., Dynamics of filter feeding in Corbicula fluminea (Bivalvia:
Corbiculidae). Canadian Journal of Zoology, 1990. 68(1): p. 115-120.
56. Rubenstein, D.I. and M. Koehl, The mechanisms of filter feeding: some
theoretical considerations. The American Naturalist, 1977. 111(981): p. 981-994.
57. Barton, L.E., et al., Theory and methodology for determining nanoparticle affinity
for heteroaggregation in environmental matrices using batch measurements.
Environmental Engineering Science, 2014. 31(7): p. 421-427.
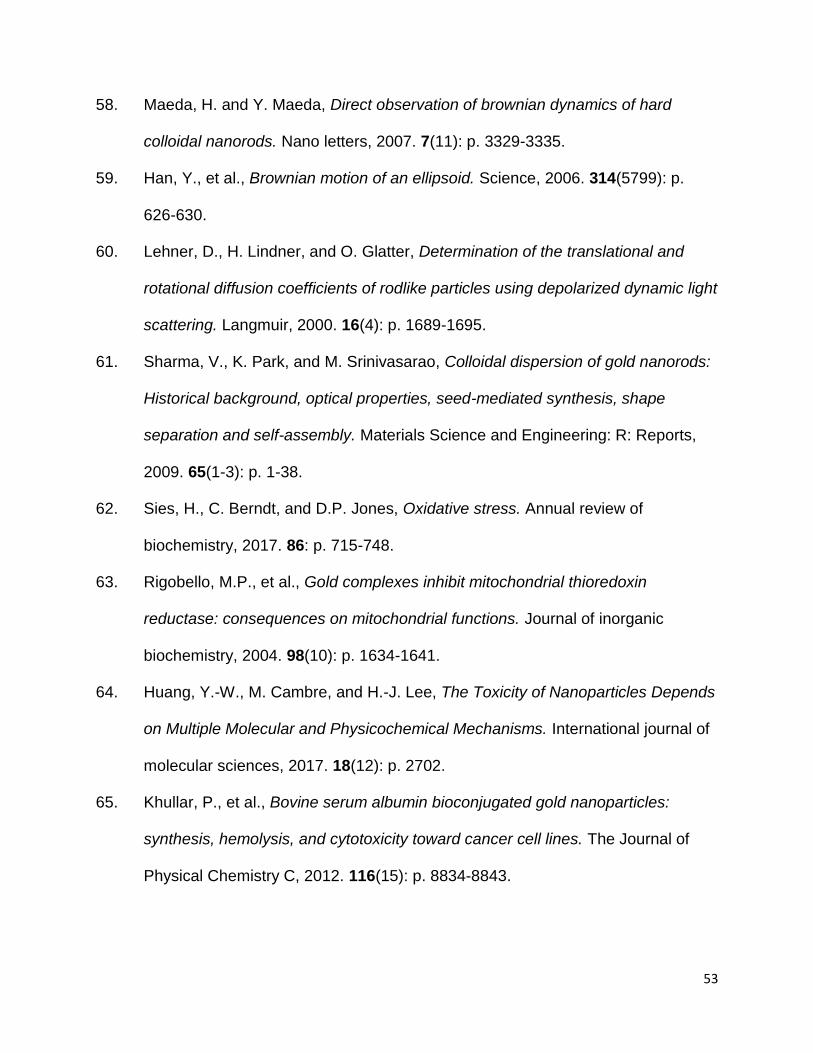
53
58. Maeda, H. and Y. Maeda, Direct observation of brownian dynamics of hard
colloidal nanorods. Nano letters, 2007. 7(11): p. 3329-3335.
59. Han, Y., et al., Brownian motion of an ellipsoid. Science, 2006. 314(5799): p.
626-630.
60. Lehner, D., H. Lindner, and O. Glatter, Determination of the translational and
rotational diffusion coefficients of rodlike particles using depolarized dynamic light
scattering. Langmuir, 2000. 16(4): p. 1689-1695.
61. Sharma, V., K. Park, and M. Srinivasarao, Colloidal dispersion of gold nanorods:
Historical background, optical properties, seed-mediated synthesis, shape
separation and self-assembly. Materials Science and Engineering: R: Reports,
2009. 65(1-3): p. 1-38.
62. Sies, H., C. Berndt, and D.P. Jones, Oxidative stress. Annual review of
biochemistry, 2017. 86: p. 715-748.
63. Rigobello, M.P., et al., Gold complexes inhibit mitochondrial thioredoxin
reductase: consequences on mitochondrial functions. Journal of inorganic
biochemistry, 2004. 98(10): p. 1634-1641.
64. Huang, Y.-W., M. Cambre, and H.-J. Lee, The Toxicity of Nanoparticles Depends
on Multiple Molecular and Physicochemical Mechanisms. International journal of
molecular sciences, 2017. 18(12): p. 2702.
65. Khullar, P., et al., Bovine serum albumin bioconjugated gold nanoparticles:
synthesis, hemolysis, and cytotoxicity toward cancer cell lines. The Journal of
Physical Chemistry C, 2012. 116(15): p. 8834-8843.
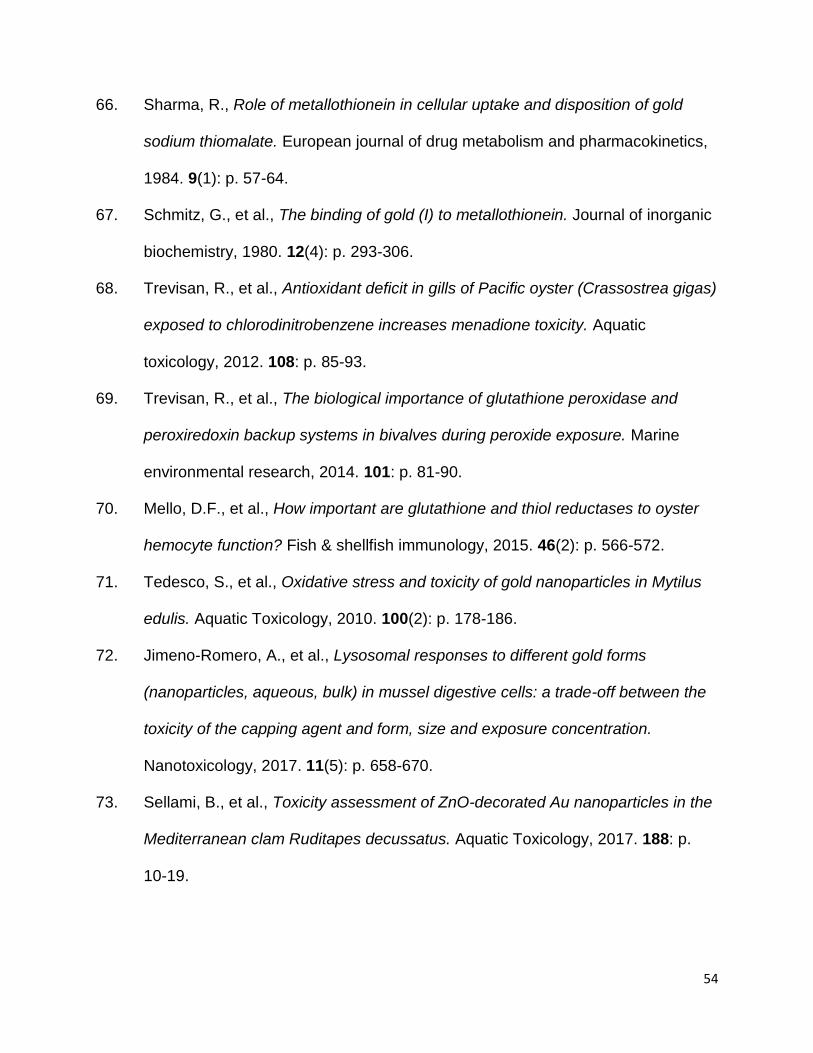
54
66. Sharma, R., Role of metallothionein in cellular uptake and disposition of gold
sodium thiomalate. European journal of drug metabolism and pharmacokinetics,
1984. 9(1): p. 57-64.
67. Schmitz, G., et al., The binding of gold (I) to metallothionein. Journal of inorganic
biochemistry, 1980. 12(4): p. 293-306.
68. Trevisan, R., et al., Antioxidant deficit in gills of Pacific oyster (Crassostrea gigas)
exposed to chlorodinitrobenzene increases menadione toxicity. Aquatic
toxicology, 2012. 108: p. 85-93.
69. Trevisan, R., et al., The biological importance of glutathione peroxidase and
peroxiredoxin backup systems in bivalves during peroxide exposure. Marine
environmental research, 2014. 101: p. 81-90.
70. Mello, D.F., et al., How important are glutathione and thiol reductases to oyster
hemocyte function? Fish & shellfish immunology, 2015. 46(2): p. 566-572.
71. Tedesco, S., et al., Oxidative stress and toxicity of gold nanoparticles in Mytilus
edulis. Aquatic Toxicology, 2010. 100(2): p. 178-186.
72. Jimeno-Romero, A., et al., Lysosomal responses to different gold forms
(nanoparticles, aqueous, bulk) in mussel digestive cells: a trade-off between the
toxicity of the capping agent and form, size and exposure concentration.
Nanotoxicology, 2017. 11(5): p. 658-670.
73. Sellami, B., et al., Toxicity assessment of ZnO-decorated Au nanoparticles in the
Mediterranean clam Ruditapes decussatus. Aquatic Toxicology, 2017. 188: p.
10-19.
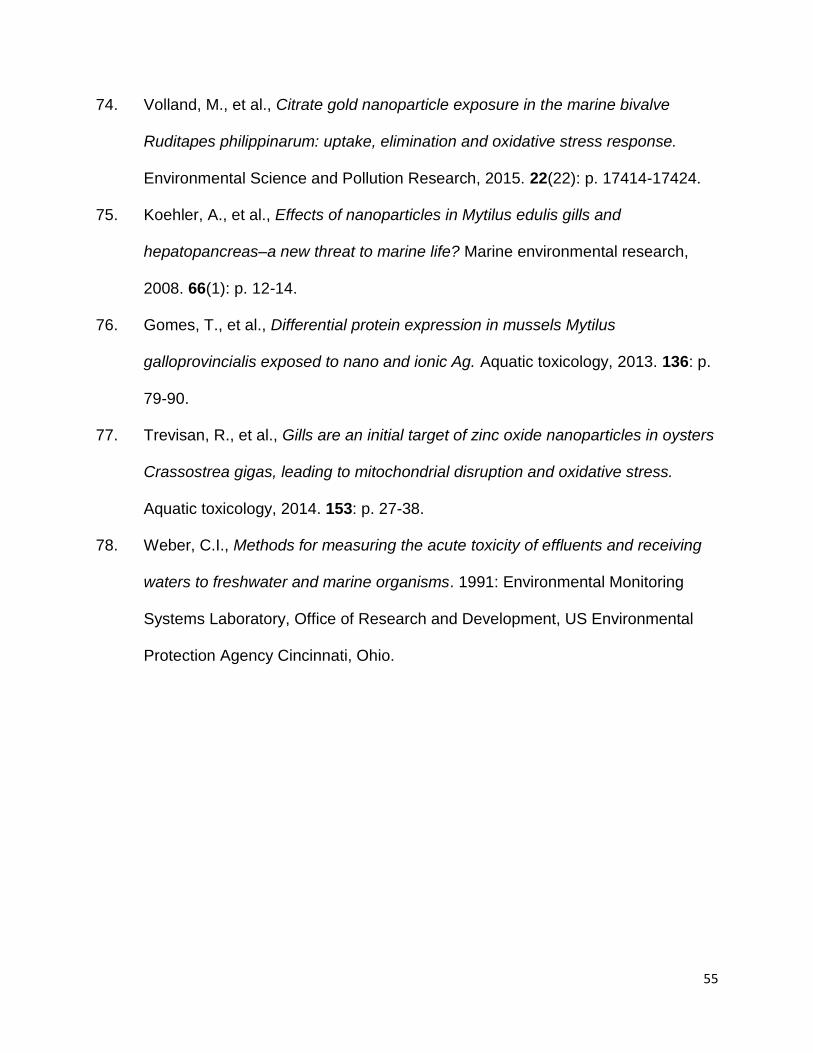
55
74. Volland, M., et al., Citrate gold nanoparticle exposure in the marine bivalve
Ruditapes philippinarum: uptake, elimination and oxidative stress response.
Environmental Science and Pollution Research, 2015. 22(22): p. 17414-17424.
75. Koehler, A., et al., Effects of nanoparticles in Mytilus edulis gills and
hepatopancreas–a new threat to marine life? Marine environmental research,
2008. 66(1): p. 12-14.
76. Gomes, T., et al., Differential protein expression in mussels Mytilus
galloprovincialis exposed to nano and ionic Ag. Aquatic toxicology, 2013. 136: p.
79-90.
77. Trevisan, R., et al., Gills are an initial target of zinc oxide nanoparticles in oysters
Crassostrea gigas, leading to mitochondrial disruption and oxidative stress.
Aquatic toxicology, 2014. 153: p. 27-38.
78. Weber, C.I., Methods for measuring the acute toxicity of effluents and receiving
waters to freshwater and marine organisms. 1991: Environmental Monitoring
Systems Laboratory, Office of Research and Development, US Environmental
Protection Agency Cincinnati, Ohio.
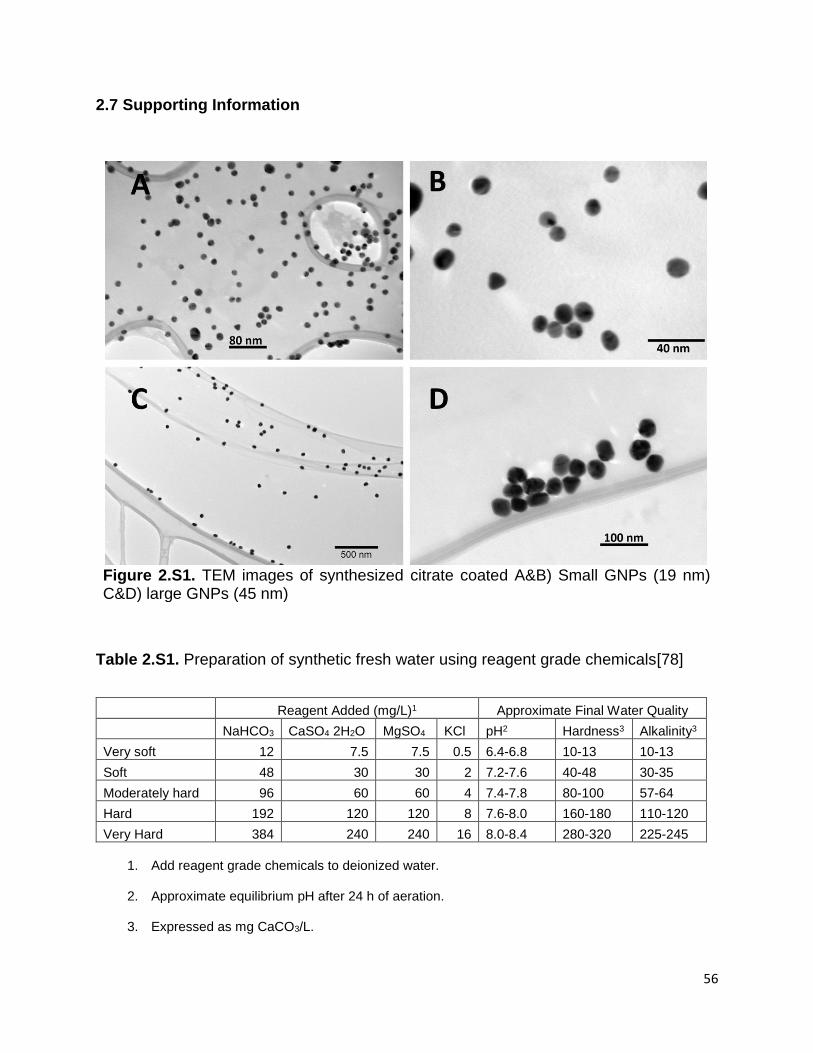
56
2.7 Supporting Information
Figure 2.S1. TEM images of synthesized citrate coated A&B) Small GNPs (19 nm) C&D) large GNPs (45 nm)
Table 2.S1. Preparation of synthetic fresh water using reagent grade chemicals[78]
Reagent Added (mg/L)1 Approximate Final Water Quality
NaHCO3 CaSO4 2H2O MgSO4 KCl pH2 Hardness3 Alkalinity3
Very soft 12 7.5 7.5 0.5 6.4-6.8 10-13 10-13
Soft 48 30 30 2 7.2-7.6 40-48 30-35
Moderately hard 96 60 60 4 7.4-7.8 80-100 57-64
Hard 192 120 120 8 7.6-8.0 160-180 110-120
Very Hard 384 240 240 16 8.0-8.4 280-320 225-245
1. Add reagent grade chemicals to deionized water.
2. Approximate equilibrium pH after 24 h of aeration.
3. Expressed as mg CaCO3/L.

57
Table 2.S2. Final adsorption percentage of gold nanoparticles adsorbed to the biolayer on the top of the shells observed in control 2 microcosms. These values are calculated by converting the plasmon band absorption intensity drop to number concentration of nanoparticles using Lambert-Beer’s law.
Overall Adsorption percentage on clam shells
Small GNPs (19 nm) 34%
Large GNPs (45 nm) 24%
AR4 AuNRs 18%
AR8 AuNRs 12%
Figure 2.S2. TEM images of synthesized A&B) CTAB coated AR4 AuNRs C&D) CTAB/BDAC AR8 AuNRs
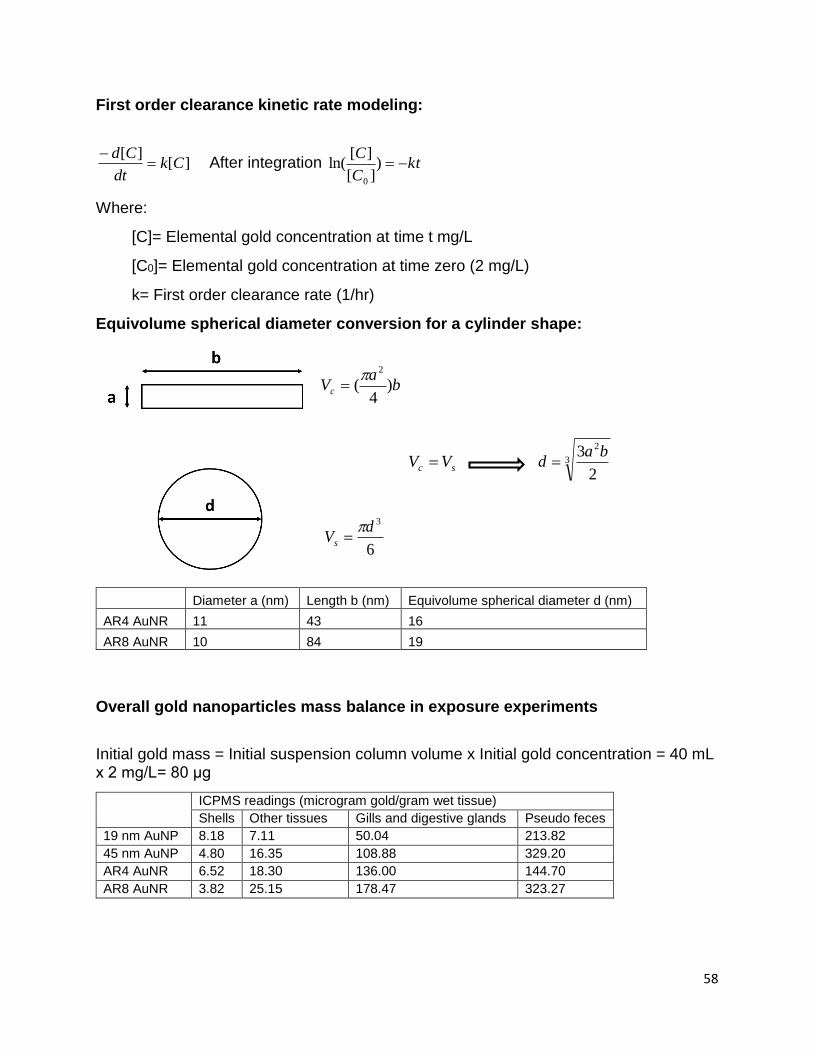
58
First order clearance kinetic rate modeling:
][][
Ckdt
Cd
After integration kt
C
C)
][
][ln(
0
Where:
[C]= Elemental gold concentration at time t mg/L
[C0]= Elemental gold concentration at time zero (2 mg/L)
k= First order clearance rate (1/hr)
Equivolume spherical diameter conversion for a cylinder shape:
ba
Vc )4
(2
sc VV 3
2
2
3 bad
6
3dVs
Diameter a (nm) Length b (nm) Equivolume spherical diameter d (nm)
AR4 AuNR 11 43 16
AR8 AuNR 10 84 19
Overall gold nanoparticles mass balance in exposure experiments
Initial gold mass = Initial suspension column volume x Initial gold concentration = 40 mL x 2 mg/L= 80 μg
ICPMS readings (microgram gold/gram wet tissue)
Shells Other tissues Gills and digestive glands Pseudo feces
19 nm AuNP 8.18 7.11 50.04 213.82
45 nm AuNP 4.80 16.35 108.88 329.20
AR4 AuNR 6.52 18.30 136.00 144.70
AR8 AuNR 3.82 25.15 178.47 323.27
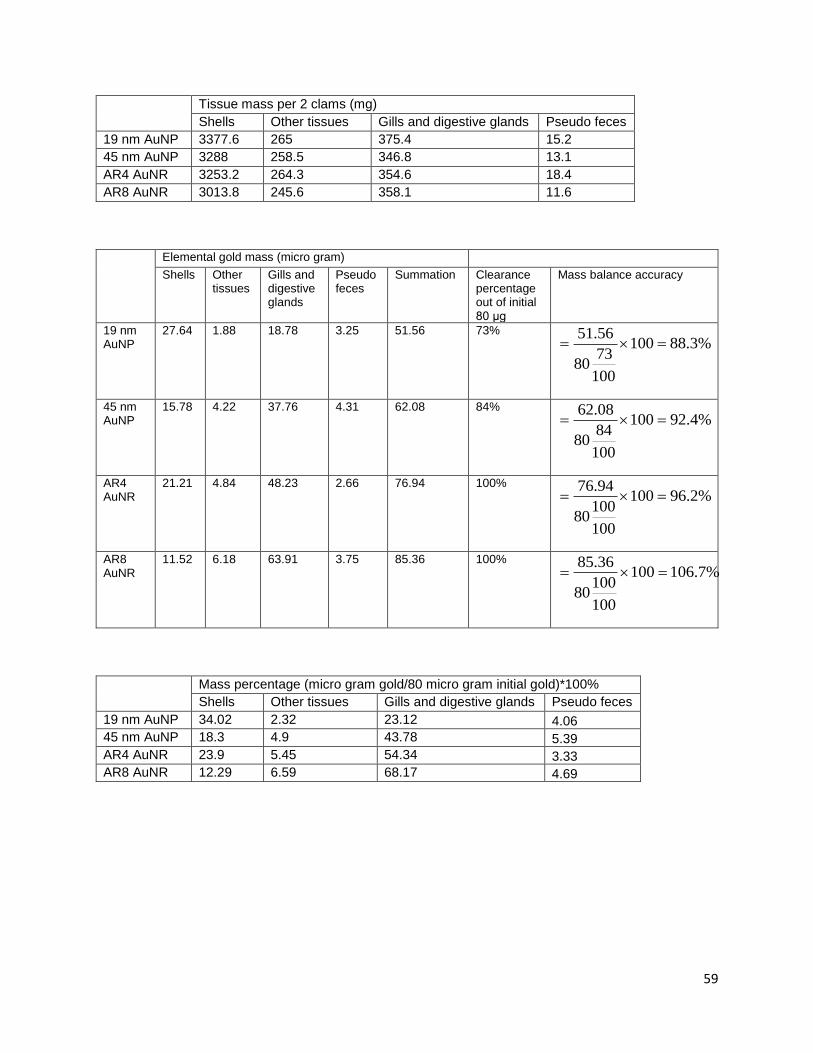
59
Tissue mass per 2 clams (mg)
Shells Other tissues Gills and digestive glands Pseudo feces
19 nm AuNP 3377.6 265 375.4 15.2
45 nm AuNP 3288 258.5 346.8 13.1
AR4 AuNR 3253.2 264.3 354.6 18.4
AR8 AuNR 3013.8 245.6 358.1 11.6
Elemental gold mass (micro gram)
Shells Other tissues
Gills and digestive glands
Pseudo feces
Summation Clearance percentage out of initial 80 μg
Mass balance accuracy
19 nm AuNP
27.64 1.88 18.78 3.25 51.56 73% %3.88100
100
7380
56.51
45 nm AuNP
15.78 4.22 37.76 4.31 62.08 84% %4.92100
100
8480
08.62
AR4 AuNR
21.21 4.84 48.23 2.66 76.94 100% %2.96100
100
10080
94.76
AR8 AuNR
11.52 6.18 63.91 3.75 85.36 100% %7.106100
100
10080
36.85
Mass percentage (micro gram gold/80 micro gram initial gold)*100%
Shells Other tissues Gills and digestive glands Pseudo feces
19 nm AuNP 34.02 2.32 23.12 4.06
45 nm AuNP 18.3 4.9 43.78 5.39
AR4 AuNR 23.9 5.45 54.34 3.33
AR8 AuNR 12.29 6.59 68.17 4.69

60
Chapter 3. Sulfate Mediated End-to-End Assembly
of Gold Nanorods
S.M.H. Abtahi,1, 2, 3 Nathan D. Burrows,4 Fred A. Idesis,4 Catherine J. Murphy,4
Navid B. Saleh,5 and Peter J. Vikesland*1, 2, 3
1.Virginia Tech, Department of Civil and Environmental Engineering,
Blacksburg, VA, USA
2.Virginia Tech, Institute for Critical Technology and Applied Science (ICTAS) Center
for Sustainable Nanotechnology (VTSuN), Blacksburg, VA, USA
3.Center for the Environmental Implications of Nanotechnology (CEINT), Duke
University, Durham, NC, USA
4.Department of Chemistry, University of Illinois at Urbana-Champaign,
600 S. Matthews Ave., Urbana, IL, 61801, USA
5.The University of Texas at Austin, Department of Civil, Architectural and
Environmental Engineering, Austin, TX 78712, USA
Langmuir, 2017, 33 (6), pp 1486–1495
DOI: 10.1021/acs.langmuir.6b04114
Publication Date (Web): January 18, 2017

61
3.1 Abstract
There is interest in the controlled aggregation of gold nanorods (GNRs) for the
production of extended nanoassemblies. Prior studies have relied upon chemical
modification of the GNR surface to achieve a desired final aggregate structure. Herein,
we illustrate that control of electrolyte composition can facilitate end-to-end assembly of
cetyltrimethylammonium bromide (CTAB) coated GNRs. By adjusting either the sulfate
anion concentration or the exposure time it is possible to connect GNRs in chain-like
assemblies. In contrast, end-to-end assembly was not observed in control experiments
using monovalent chloride salts. We attribute the end-to-end assembly to the localized
association of sulfate with exposed quaternary ammonium head groups of CTAB at the
nanorod tip. To quantify the assembly kinetics, visible-near infrared extinction spectra
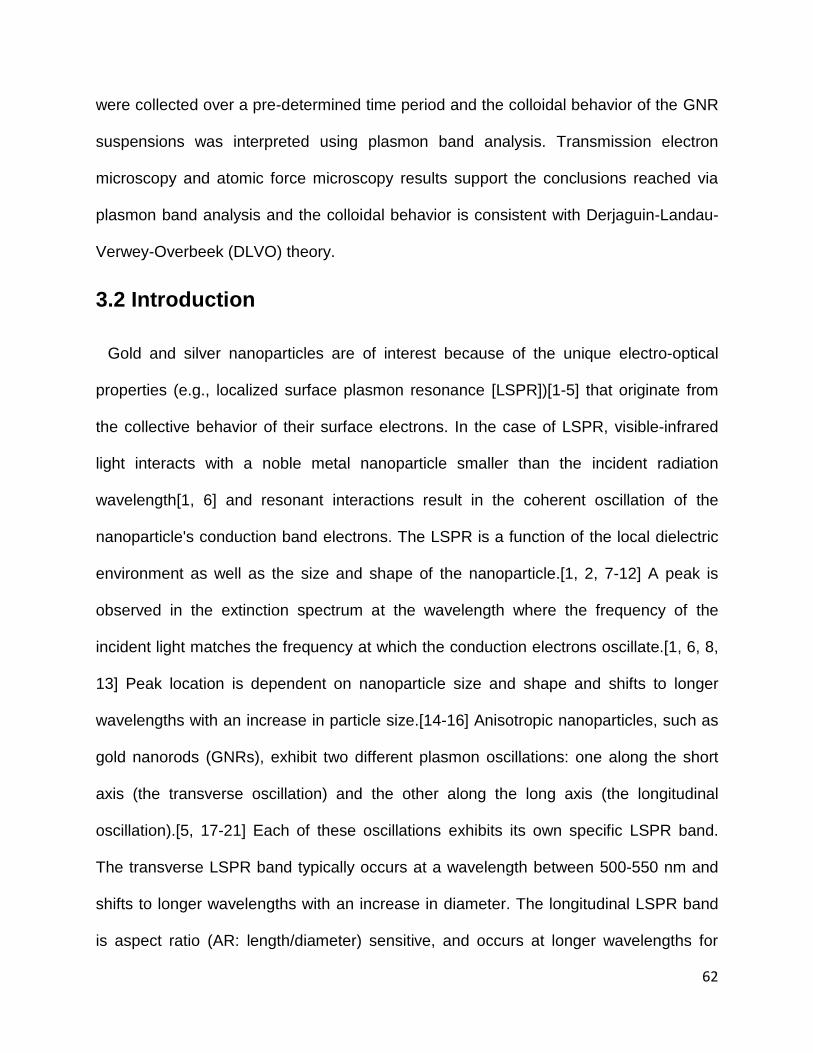
62
were collected over a pre-determined time period and the colloidal behavior of the GNR
suspensions was interpreted using plasmon band analysis. Transmission electron
microscopy and atomic force microscopy results support the conclusions reached via
plasmon band analysis and the colloidal behavior is consistent with Derjaguin-Landau-
Verwey-Overbeek (DLVO) theory.
3.2 Introduction
Gold and silver nanoparticles are of interest because of the unique electro-optical
properties (e.g., localized surface plasmon resonance [LSPR])[1-5] that originate from
the collective behavior of their surface electrons. In the case of LSPR, visible-infrared
light interacts with a noble metal nanoparticle smaller than the incident radiation
wavelength[1, 6] and resonant interactions result in the coherent oscillation of the
nanoparticle's conduction band electrons. The LSPR is a function of the local dielectric
environment as well as the size and shape of the nanoparticle.[1, 2, 7-12] A peak is
observed in the extinction spectrum at the wavelength where the frequency of the
incident light matches the frequency at which the conduction electrons oscillate.[1, 6, 8,
13] Peak location is dependent on nanoparticle size and shape and shifts to longer
wavelengths with an increase in particle size.[14-16] Anisotropic nanoparticles, such as
gold nanorods (GNRs), exhibit two different plasmon oscillations: one along the short
axis (the transverse oscillation) and the other along the long axis (the longitudinal
oscillation).[5, 17-21] Each of these oscillations exhibits its own specific LSPR band.
The transverse LSPR band typically occurs at a wavelength between 500-550 nm and
shifts to longer wavelengths with an increase in diameter. The longitudinal LSPR band
is aspect ratio (AR: length/diameter) sensitive, and occurs at longer wavelengths for

63
GNRs with higher AR.[19, 22, 23] The extinction (absorbance + scattering) of these
peaks is linearly related to the concentration of nanoparticles in suspension. Changes in
the number concentration, the AR, or the local dielectric environment can be detected
by a change in extinction or by the shift of these two plasmon peaks.[14, 24]
The electro-optical properties of GNRs can be significantly altered by
nanoparticle assembly. We use the term controlled assembly to refer either to end-to-
end, end-to-side, or side-by-side assembly.[25, 26] End-to-end assemblies couple the
longitudinal plasmon preferentially and are of particular interest for sensing technologies
that rely on large electric fields.[26-28] Extended end-to-end GNR assemblies have
previously been produced by manipulation of GNR surface chemistry,[29-32] by
alteration of the chemistry of the solution in which the GNRs are suspended,[13, 30, 33,
34] by applying polystyrene and surface enhanced Raman spectroscopy (SERS)
markers,[35] or by attachment of pH-responsive DNA[36] to the GNR surface. Side-by-
side assemblies of GNRs have been prepared by cysteine conjugated GNRs in the
presence of lead[37] and in adiptic acid treated GNR suspensions.[38] Interchangeable
end-to-end and side-by-side assemblies of GNRs have been prepared by addition of
tetrahydrofuran,[39] dithiol polyethylene glycol,[40] bifunctional poly(ethylene glycol,
PEG),[26] or antibodies,[25] onto GNR surfaces where the final assembled
configuration is controlled by the concentration of the organic molecule. Each of these
approaches requires extensive nanoparticle functionalization.
In this work, we illustrate a simple method in which sulfate ions are used to
facilitate end-to-end GNR assembly in aqueous suspension. The coordinating activity of
sulfate anions enables conversion of >80% of well-dispersed GNRs in a suspension into
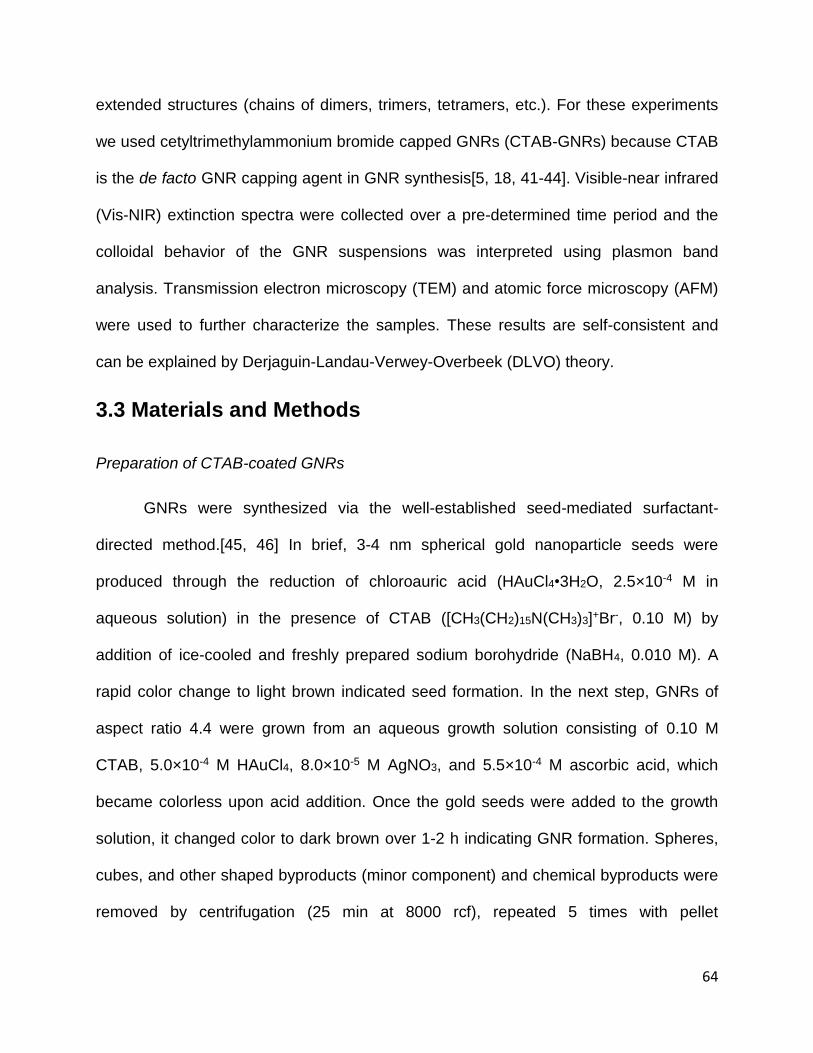
64
extended structures (chains of dimers, trimers, tetramers, etc.). For these experiments
we used cetyltrimethylammonium bromide capped GNRs (CTAB-GNRs) because CTAB
is the de facto GNR capping agent in GNR synthesis[5, 18, 41-44]. Visible-near infrared
(Vis-NIR) extinction spectra were collected over a pre-determined time period and the
colloidal behavior of the GNR suspensions was interpreted using plasmon band
analysis. Transmission electron microscopy (TEM) and atomic force microscopy (AFM)
were used to further characterize the samples. These results are self-consistent and
can be explained by Derjaguin-Landau-Verwey-Overbeek (DLVO) theory.
3.3 Materials and Methods
Preparation of CTAB-coated GNRs
GNRs were synthesized via the well-established seed-mediated surfactant-
directed method.[45, 46] In brief, 3-4 nm spherical gold nanoparticle seeds were
produced through the reduction of chloroauric acid (HAuCl4•3H2O, 2.5×10⁻⁴ M in
aqueous solution) in the presence of CTAB ([CH3(CH2)15N(CH3)3]+Br-, 0.10 M) by
addition of ice-cooled and freshly prepared sodium borohydride (NaBH4, 0.010 M). A
rapid color change to light brown indicated seed formation. In the next step, GNRs of
aspect ratio 4.4 were grown from an aqueous growth solution consisting of 0.10 M
CTAB, 5.0×10⁻⁴ M HAuCl4, 8.0×10⁻⁵ M AgNO3, and 5.5×10⁻⁴ M ascorbic acid, which
became colorless upon acid addition. Once the gold seeds were added to the growth
solution, it changed color to dark brown over 1-2 h indicating GNR formation. Spheres,
cubes, and other shaped byproducts (minor component) and chemical byproducts were
removed by centrifugation (25 min at 8000 rcf), repeated 5 times with pellet

65
resuspension in 800 µM CTAB, yielding CTAB-GNRs. ICP-MS measurements indicated
that the GNR stock had a 41.0±0.3 mg/L atomic gold concentration. Accordingly, a
concentration of 2.1×10¹⁴ GNRs/L was calculated based on the density of gold (19.3
g/cm3)[47] and the TEM determined average GNR size of 28.8 0.1 nm length and 6.6
± 0.1 nm diameter.
End-to-end linkage of CTAB-GNRs in CaSO4 and MgSO4
Suspensions of CTAB-GNRs (1.1×10¹⁴ GNRs/L) were incubated over a range of
CaSO4 and MgSO4 concentrations (1-5 mM) for 24 h. To initiate an experiment, CTAB-
GNRs were washed by centrifugation (20 min at 11000 rcf) and 90% of the supernatant
was replaced with DI water, followed by bath sonication for 1 min. The resuspended
GNRs were readily dispersed and were colloidally stable 2-. This step removed excess
CTAB from the GNR suspension. Following a second centrifugation step (20 min at
11000 rcf), 90% of the supernatant was replaced with a given CaSO4 or MgSO4 solution
followed by 1 min of bath sonication. The GNR suspensions were then transferred to
Vis-NIR cuvettes that were used for colloidal stability monitoring over 24 h. During the
first hour, 10 min sampling intervals were used. Subsequently, one-hour intervals were
used for the remaining 23 h. Vis-NIR extinction spectra were collected between 400-
1200 nm. TEM samples were prepared after 3 and 10 h of exposure to salt solutions. To
quantitatively capture the temporal changes in the extinction of the GNR suspensions,
individual peaks within the Vis-NIR spectrum were fit with Lorentzian distributions[48,
49] using Grams/AI software (Thermo-Fisher, Waltham, MA).
TEM samples were prepared by submerging 200 mesh carbon film coated
copper grids in a given GNR suspension and then fast dried by putting the grid on top of
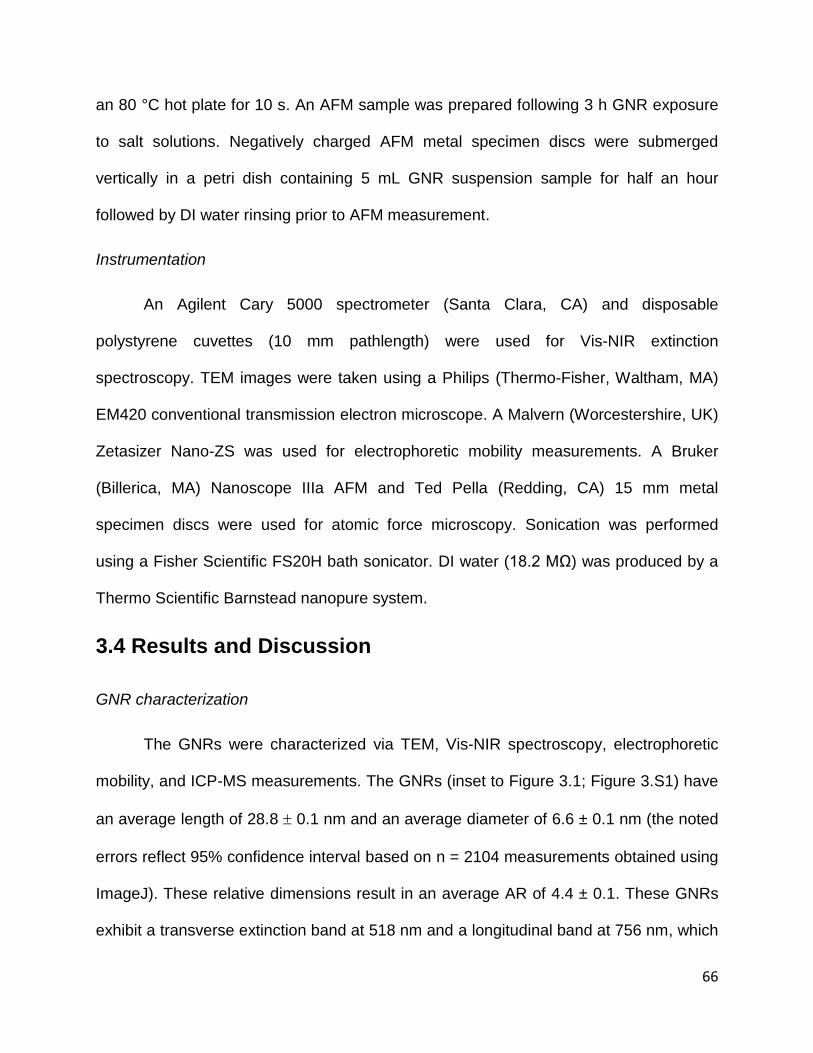
66
an 80 °C hot plate for 10 s. An AFM sample was prepared following 3 h GNR exposure
to salt solutions. Negatively charged AFM metal specimen discs were submerged
vertically in a petri dish containing 5 mL GNR suspension sample for half an hour
followed by DI water rinsing prior to AFM measurement.
Instrumentation
An Agilent Cary 5000 spectrometer (Santa Clara, CA) and disposable
polystyrene cuvettes (10 mm pathlength) were used for Vis-NIR extinction
spectroscopy. TEM images were taken using a Philips (Thermo-Fisher, Waltham, MA)
EM420 conventional transmission electron microscope. A Malvern (Worcestershire, UK)
Zetasizer Nano-ZS was used for electrophoretic mobility measurements. A Bruker
(Billerica, MA) Nanoscope IIIa AFM and Ted Pella (Redding, CA) 15 mm metal
specimen discs were used for atomic force microscopy. Sonication was performed
using a Fisher Scientific FS20H bath sonicator. DI water (18.2 MΩ) was produced by a
Thermo Scientific Barnstead nanopure system.
3.4 Results and Discussion
GNR characterization
The GNRs were characterized via TEM, Vis-NIR spectroscopy, electrophoretic
mobility, and ICP-MS measurements. The GNRs (inset to Figure 3.1; Figure 3.S1) have
an average length of 28.8 0.1 nm and an average diameter of 6.6 ± 0.1 nm (the noted
errors reflect 95% confidence interval based on n = 2104 measurements obtained using
ImageJ). These relative dimensions result in an average AR of 4.4 ± 0.1. These GNRs
exhibit a transverse extinction band at 518 nm and a longitudinal band at 756 nm, which
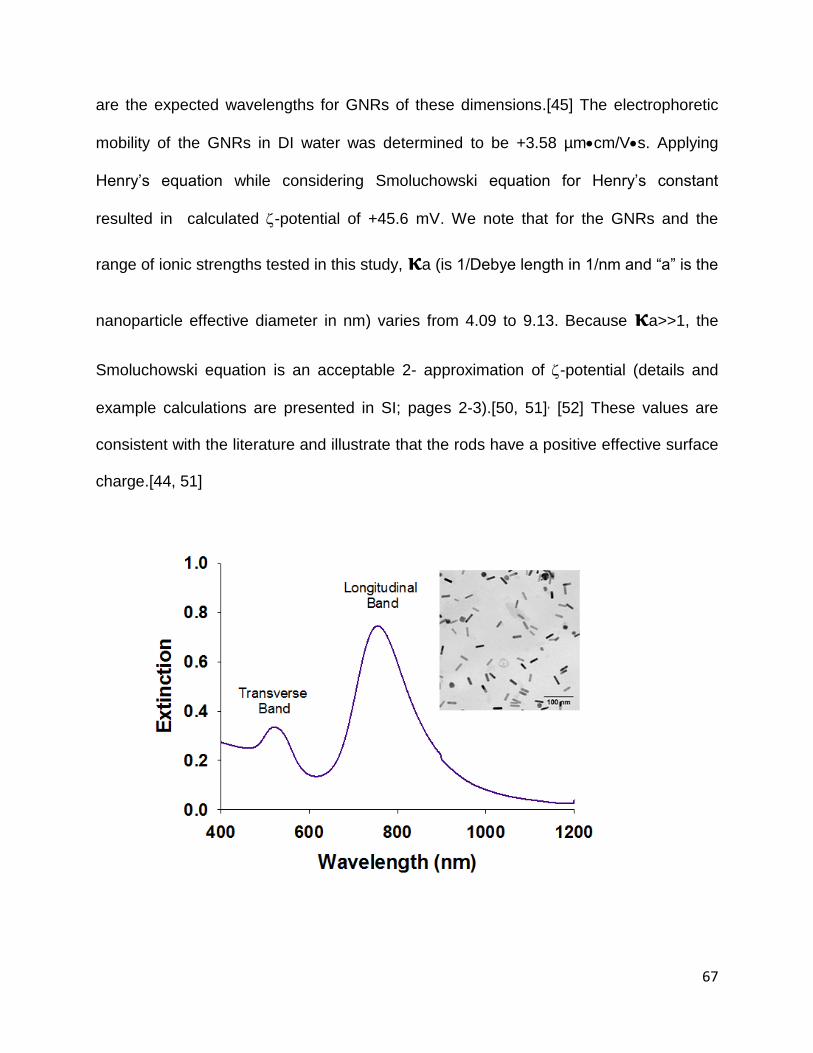
67
are the expected wavelengths for GNRs of these dimensions.[45] The electrophoretic
mobility of the GNRs in DI water was determined to be +3.58 µmcm/Vs. Applying
Henry’s equation while considering Smoluchowski equation for Henry’s constant
resulted in calculated -potential of +45.6 mV. We note that for the GNRs and the
range of ionic strengths tested in this study, 𝛋a (is 1/Debye length in 1/nm and “a” is the
nanoparticle effective diameter in nm) varies from 4.09 to 9.13. Because 𝛋a>>1, the
Smoluchowski equation is an acceptable 2- approximation of -potential (details and
example calculations are presented in SI; pages 2-3).[50, 51], [52] These values are
consistent with the literature and illustrate that the rods have a positive effective surface
charge.[44, 51]

68
Figure 3.1. Vis-NIR extinction spectrum for the synthesized CTAB-GNRs after
centrifugal purification and washing. Inset: Transmission electron micrograph of CTAB-GNRs.
End-to-end assembly of CTAB-coated gold nanorods in CaSO4 and MgSO4
The in situ development of GNR assemblies was probed via Vis-NIR extinction
spectroscopy. It has been shown previously that during side-to-side and end-to-side
assemblies, the extinction of the initial transverse LSPR band increases and the band
slightly red shifts to higher wavelengths; while the extinction of the longitudinal band
decreases and blue shifts to lower wavelengths, thus resulting in the convergence of the
two bands.[26] The calculated extinction intensity change versus incident light
wavelength and corresponding transverse and longitudinal bands of these two
assemblies are presented in Table 3.S3 and Figure 3.S6. These calculations are
developed based on our experiment parameters while employing extended Mie theory
modeling. In end-to-end assembly the bands behave quite differently. For aggregates
with this configuration, neither the transverse nor the longitudinal band shifts; however,
the extinction of the longitudinal band significantly decreases as the total average length
of the GNR chain increases. Under these conditions, a third plasmon band appears at
wavelengths larger than that of the original longitudinal band, Figure 3.S5. Because of
extended plasmonic coupling this new plasmon band red shifts to longer and longer
wavelengths as the GNR chain length increases.[22, 26, 53-55]
To evaluate the aggregation behavior of the GNRs, CTAB-GNR suspensions
were exposed to 1, 2, and 5 mM CaSO4 or MgSO4. We observed salt concentration
dependent changes in the visual characteristics of the suspensions. In the presence of
69
DI water the suspension is brownish in color, while at higher salt concentrations the
color darkens. At a salt concentration of 5 mM the colloidal stability of the suspension
was lost within 24 h (Figure 3.S2). As illustrated in representative plots for 2 mM CaSO4
and 2 mM MgSO4 (Figure 3.2) there are readily observable declines in the intensities of
both the transverse and longitudinal bands and additional bands appear at longer
wavelengths. Such behavior is consistent with the previously described end-to-end
aggregation process. Qualitatively similar results were observed at the other salt
concentrations.
To quantify the declines in peak intensity we plotted the change in extinction for
both the transverse and longitudinal bands for each salt concentration. As shown in
Figure 3.2C-F, a sharp drop in the longitudinal peak intensity was observed within the
first hour of exposure of the GNRs to all concentrations of CaSO4 and MgSO4,
accompanied by a slower decrease in intensity over the next 23 h. In contrast, the
transverse band intensity did not change as noticeably. To interpret the temporal
changes in the longitudinal and transverse bands we fitted our collected data using a
simple second order aggregation model[56, 57] (details are presented in the SI; page
4):
𝑑[𝑟𝑜𝑑]
𝑑𝑡= −𝑘[𝑟𝑜𝑑]2 (1)
Where [rod] is the number concentration of individual, fully dispersed rods and k is the
observed second order rate constant. Other more complex aggregation models may be
more appropriate for this system due to its complexity; however, our purpose in using
this model is to capture the differential behavior of the two extinction bands. Number
concentration-based rate constants and associated 95% confidence intervals for single

70
CTAB-GNRs in the presence of CaSO4 and MgSO4 are presented in Table 3.1. We note
that for 5 mM CaSO4 the second order model did not fit the collected data as well as it
did for other experimental conditions. We attribute this behavior to the more rapid
aggregation observed with CaSO4 and the greater degree of colloidal instability.
Figure 3.2. Vis-NIR extinction spectra of 1.1×10¹⁴ GNRs/L exposed to A) 2
mM CaSO4 and B) 2 mM MgSO4 from zero hours (red spectra) to 24 hours (blue spectra). Changes in the average normalized transverse band and longitudinal band extinction maxima of CTAB-GNRs (1.1×10¹⁴ GNRs/L) in 1-5 mM CaSO4 and MgSO4 solutions as a function of exposure time. (C) Transverse band-CaSO4 (D) Longitudinal band-CaSO4 (E) Transverse band-MgSO4 (F) Longitudinal band- MgSO4.

71
Table 3.1. Second order number concentration rate constants
( Sdsgoldnanoro
L
.1007.1 14 ) for single CTAB-GNRs in the presence of different concentrations of CaSO4 and MgSO4. Both the changes in the transverse band and the longitudinal band are provided. Errors are reported at the ±95% confidence intervals.
Salt Concentration Transverse band Longitudinal band
(mM) CaSO4 MgSO4 CaSO4 MgSO4
1 0.0006 ± 0.0001 0.0007 ± 0.0001
0.025 ± 0.0020 0.019 ± 0.0021
2 0.0065 ± 0.0000 0.0032 ± 0.0001 0.05 ± 0.0051 0.028 ± 0.0026
5 0.22 ± 0.049 0.012 ± 0.0006 0.49 ± 0.072 0.051 ± 0.0053
An increase in ionic strength significantly increased the rate at which the GNRs
assembled. In all cases, the rate of change of the longitudinal band was greater than
that of the transverse band (Table 3.1). Over the 24 h period that the GNRs were
exposed to 1 mM and 2 mM of CaSO4 and MgSO4 there was minimal change in the
transverse band intensity, while simultaneously there was a 40-60% decline in the
longitudinal band intensity. If the assemblies were colloidally unstable 2- and were
precipitating out of suspension and leaving only single GNRs behind then the rate
constants for the change in the transverse and longitudinal bands of single GNRs
should be equal (Table 3.S1 and Figure 3.S3). However, the much slower change in the
transverse band relative to the longitudinal band supports the conclusion that the GNRs
are assembling into extended structures. In end-to-end nanoparticle assembly the
transverse band is not expected to shift, while the longitudinal band will decrease in
intensity and red-shift.
Following exposure of the GNRs to CaSO4 or MgSO4 a new shoulder with an
extinction maximum at a wavelength greater than the longitudinal band appears. The
72
intensity of this shoulder increases and red-shifts to longer wavelengths over time and
at increased salt concentrations. Formation of this shoulder is consistent with the
assembly of GNRs to produce new structures with elongated AR (i.e., end-to-end
assemblies). Past studies have illustrated that chain-like assemblies of GNRs display
the formation of an extinction band at longer wavelengths compared to individual
rods.[25, 26, 30, 34] The peak wavelength is strongly related to the number of linked
rods and shifts to longer wavelengths as the chains become increasingly extended over
time.
TEM and AFM images consistent with formation of end-to-end assemblies are
shown in Figure 3.3. Both the TEM and AFM images illustrate the formation of end-to-
end linkages. The AFM images unlike the TEM images were collected in situ without
sample drying. Observation of an extended end-to-end assembly in the AFM image
supports the argument that the presence of these assemblies in the TEM images is not
necessarily a result of drying mediated artifacts. TEM images taken at different times
and salt concentrations suggest that the end-to-end chains of GNRs grow longer over
time and with an increase in ionic strength (Figure 3.3B-C, Figure 3.S4).

73
Figure 3.3. A) Representative AFM image of CTAB-GNRs after 3 h exposure to 2 mM CaSO4, B) TEM image of CTAB-GNRs after 3 h exposure to 2 mM CaSO4, C) TEM image of CTAB-GNRs after 10 h exposure to 2 mM CaSO4.
A
B
C
50 nm
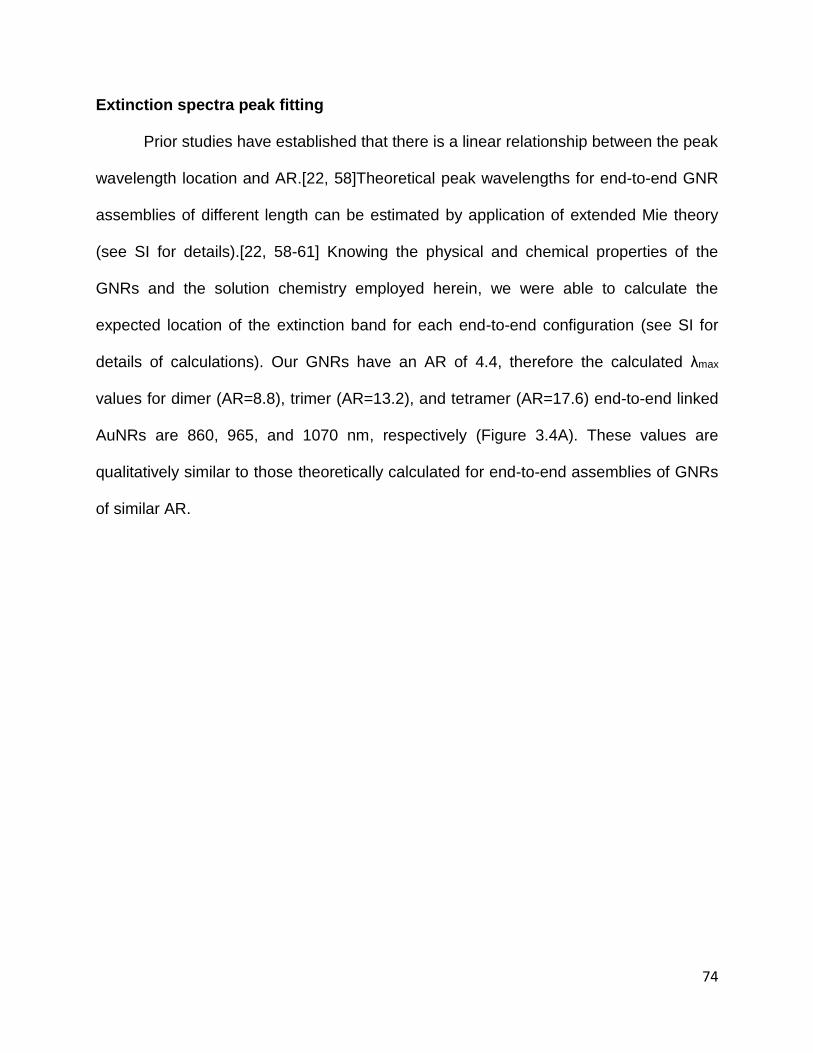
74
Extinction spectra peak fitting
Prior studies have established that there is a linear relationship between the peak
wavelength location and AR.[22, 58]Theoretical peak wavelengths for end-to-end GNR
assemblies of different length can be estimated by application of extended Mie theory
(see SI for details).[22, 58-61] Knowing the physical and chemical properties of the
GNRs and the solution chemistry employed herein, we were able to calculate the
expected location of the extinction band for each end-to-end configuration (see SI for
details of calculations). Our GNRs have an AR of 4.4, therefore the calculated λmax
values for dimer (AR=8.8), trimer (AR=13.2), and tetramer (AR=17.6) end-to-end linked
AuNRs are 860, 965, and 1070 nm, respectively (Figure 3.4A). These values are
qualitatively similar to those theoretically calculated for end-to-end assemblies of GNRs
of similar AR.

75
Figure 3.4. A) Plasmon band wavelengths of different GNR end-to-end assemblies as calculated by extended Mie theory. B) Exemplary Figure 3.illustrating quality of fit for experimental vs. fitted Vis-NIR spectrum for GNRs exposed to 5 mM MgSO4 after 1 hr. The magnitudes of individual extinction bands are illustrated.
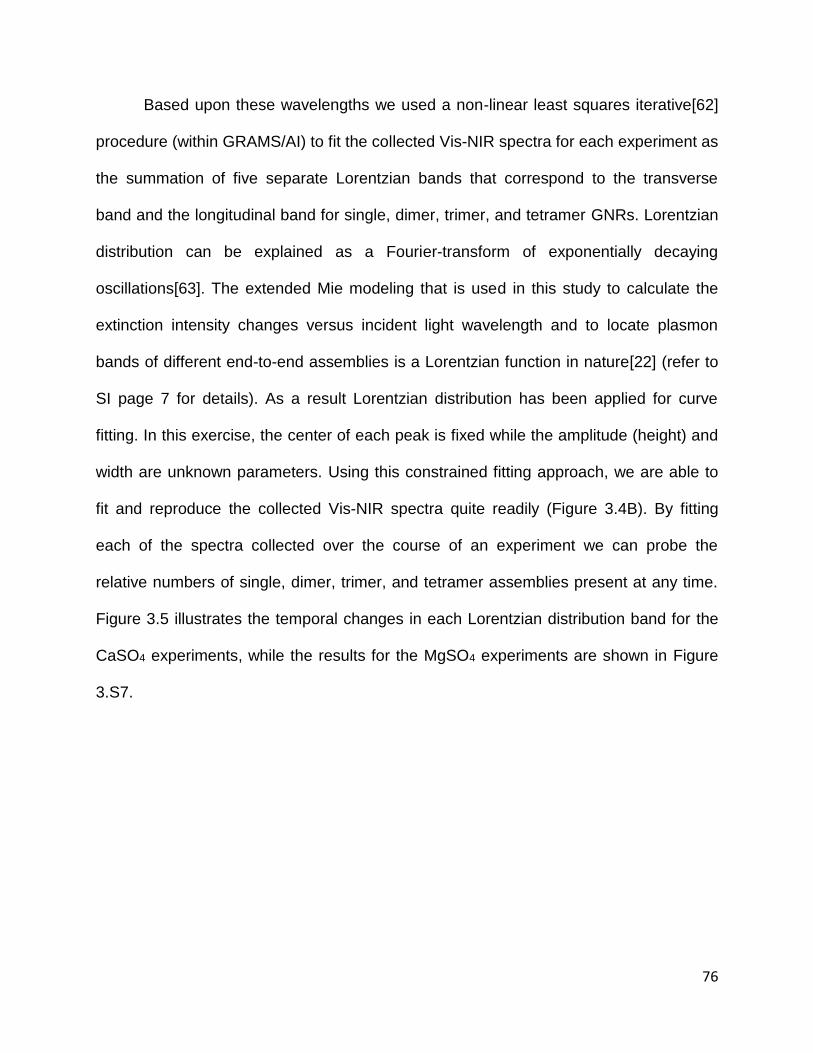
76
Based upon these wavelengths we used a non-linear least squares iterative[62]
procedure (within GRAMS/AI) to fit the collected Vis-NIR spectra for each experiment as
the summation of five separate Lorentzian bands that correspond to the transverse
band and the longitudinal band for single, dimer, trimer, and tetramer GNRs. Lorentzian
distribution can be explained as a Fourier-transform of exponentially decaying
oscillations[63]. The extended Mie modeling that is used in this study to calculate the
extinction intensity changes versus incident light wavelength and to locate plasmon
bands of different end-to-end assemblies is a Lorentzian function in nature[22] (refer to
SI page 7 for details). As a result Lorentzian distribution has been applied for curve
fitting. In this exercise, the center of each peak is fixed while the amplitude (height) and
width are unknown parameters. Using this constrained fitting approach, we are able to
fit and reproduce the collected Vis-NIR spectra quite readily (Figure 3.4B). By fitting
each of the spectra collected over the course of an experiment we can probe the
relative numbers of single, dimer, trimer, and tetramer assemblies present at any time.
Figure 3.5 illustrates the temporal changes in each Lorentzian distribution band for the
CaSO4 experiments, while the results for the MgSO4 experiments are shown in Figure
3.S7.
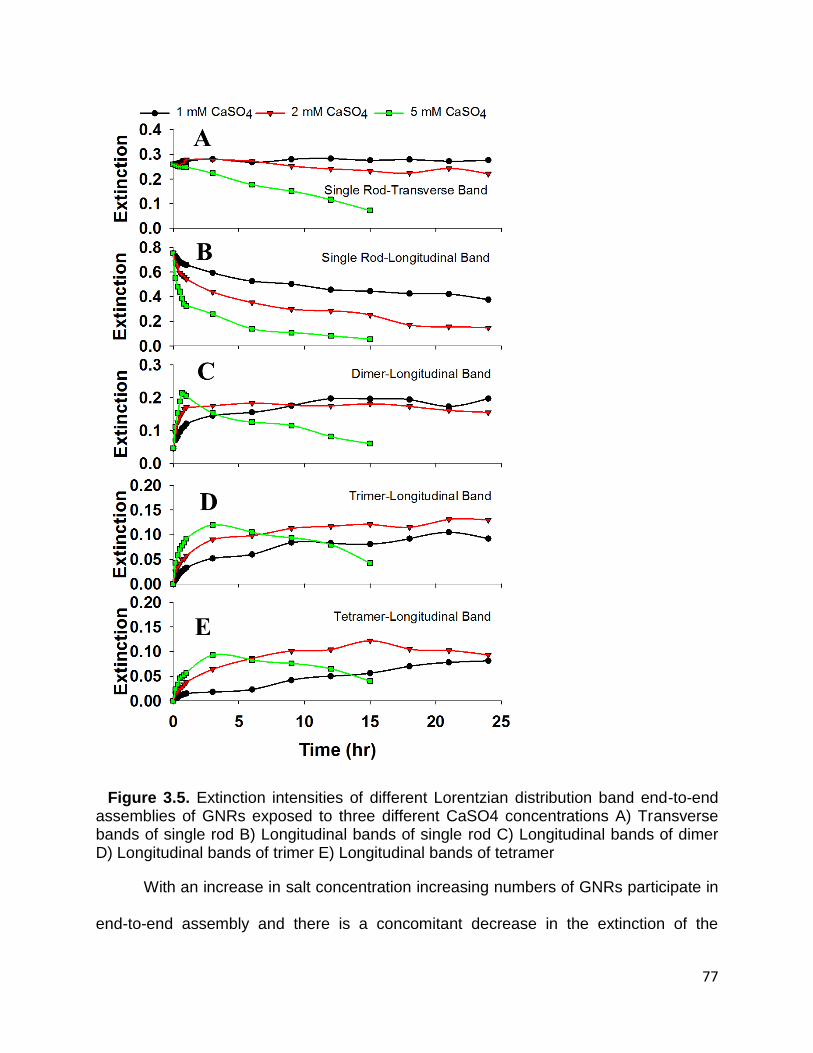
77
Figure 3.5. Extinction intensities of different Lorentzian distribution band end-to-end assemblies of GNRs exposed to three different CaSO4 concentrations A) Transverse bands of single rod B) Longitudinal bands of single rod C) Longitudinal bands of dimer D) Longitudinal bands of trimer E) Longitudinal bands of tetramer
With an increase in salt concentration increasing numbers of GNRs participate in
end-to-end assembly and there is a concomitant decrease in the extinction of the

78
longitudinal band that represents single GNRs (Figure 3.5B). At 1 and 2 mM CaSO4, the
extinction of the dimer band at 860 nm increases rapidly and then plateaus, while at 5
mM it increases and then decreases with time (Figure 3.5C). At 5 mM CaSO4, the
dimer, trimer, and tetramer extinction intensities rapidly increase but then decrease over
extended time. These results collectively show that at high salt concentrations the end-
to-end GNRs assemblies that are formed initially, grow further to be colloidally unstable
2-, and finally undergo precipitation. This precipitation trend is consistent with visual
observation of large dark pellets at the bottom of the sample cuvette (Figure 3.S2).
The validity of our curve fitting technique was studied by analyzing 36 TEM images
taken from one sample (GNRs exposed to 2 mM CaSO4) at three different time periods
(3, 10, and 24 h). A total of 270 GNRs were counted via TEM image analysis. Figure 3.6
shows the change in percentage of these assemblies as a function of time. As
expected, the length of the end-to-end assemblies generally increase over time. As an
example, after 3 h almost 50% of GNRs are in the dimer form and no tetramers were
found; but after 24 h 50% of GNRs are in the tetramer form while only 12% single GNRs
were observed. Because of the potential for drying mediated artifacts and the potential
effects of the TEM substrate on aggregate formation the results presented in Figure 3.6
cannot be directly compared to the plasmon band analyses; however, the general trend
is the same with longer and longer assemblies forming with extended time.
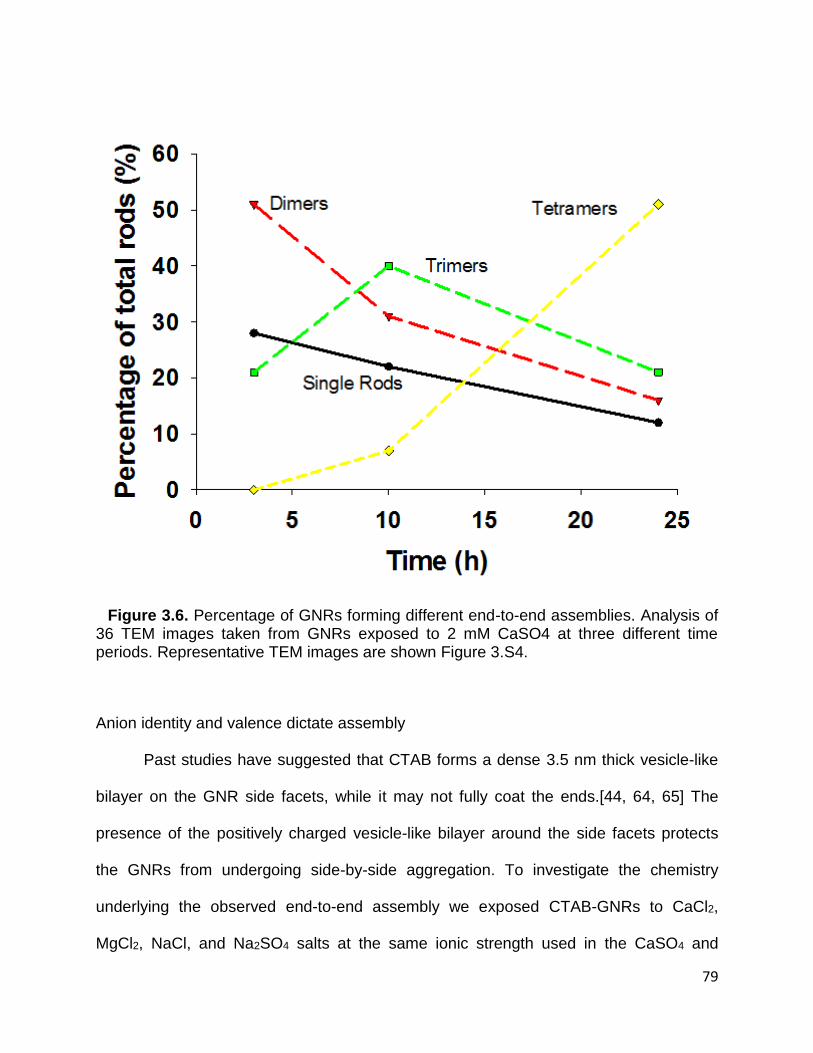
79
Figure 3.6. Percentage of GNRs forming different end-to-end assemblies. Analysis of 36 TEM images taken from GNRs exposed to 2 mM CaSO4 at three different time periods. Representative TEM images are shown Figure 3.S4.
Anion identity and valence dictate assembly
Past studies have suggested that CTAB forms a dense 3.5 nm thick vesicle-like
bilayer on the GNR side facets, while it may not fully coat the ends.[44, 64, 65] The
presence of the positively charged vesicle-like bilayer around the side facets protects
the GNRs from undergoing side-by-side aggregation. To investigate the chemistry
underlying the observed end-to-end assembly we exposed CTAB-GNRs to CaCl2,
MgCl2, NaCl, and Na2SO4 salts at the same ionic strength used in the CaSO4 and
80
MgSO4 experiments. The collected Vis-NIR extinction spectra over a period of 24 h are
shown in Figures S8 and S9. The decline in the transverse and longitudinal absorption
bands is shown in Figures S10 and S11.
No change in the extinction of the transverse band, a <15% drop in the
longitudinal band, and no new absorption band at wavelengths longer than the
longitudinal band occurred when CTAB-GNRs were exposed to non-sulfate salts. These
observations collectively suggest that CTAB-GNRs are colloidally stable 2- and exhibit
no significant aggregation when exposed to CaCl2, MgCl2, and NaCl over the range of
ionic strengths considered in this study. -potential measurements of CTAB-GNRs
exposed to salts show that unlike SO42- the interaction of Cl- with CTAB is weak,
resulting in a much smaller change in measured potential (Table 3.2). Over this ionic
strength range the -potential values of CTAB-GNRs are close to the value of CTAB-
GNRs in DI water. TEM images taken for CTAB-GNRs exposed to CaCl2, MgCl2, and
NaCl salts over the concentration range of 1-5 mM show no apparent GNR aggregation
(Figure 3.S12), which is consistent with the Vis-NIR and -potential measurements. On
the other hand, TEM images taken from CTAB-GNRs exposed to Na2SO4 exhibit a
similar end-to-end assembly pattern as CaSO4 and MgSO4, but with shorter end-to-end
chain length.
As reported in Table 3.2 CTAB-GNRs exposed to salt solutions containing SO42-
ions have significantly lower -potential values compared to other salts. The measured
values are approximately 50% of the measured potentials for the non-sulfate salts.
Previous studies have shown that increasing the salt concentration of a CTAB solution
reduces the CTAB CMC (critical micelle concentration) and produces larger micelles
81
due to a shape change from spherical to cylindrical.[66-69] We note, however, that the
reported CMC is ~0.9 mM, while our free CTAB concentration was only 4 µM and thus
well-below the point at which micelle formation can be expected. Collectively these
studies suggest that the observed reduction in -potential values in our study is not
caused by the desorption of CTAB from the gold surface.
Sulfate as a divalent anion interacts with the quaternary ammonium head group of
CTAB and significantly reduces the measured surface charge of the GNRs in DI water
(45.6 mV) to 20.3±0.8 mV for sulfate concentrations of 1-5 mM (Figure 3.S13). Our
hypothesis is that when two GNR tips with a non-dense bilayer of CTAB are in close
proximity to each other, sulfate effectively bridges adjacent GNRs to form an end-to-end
assembly. By increasing the concentration of the CaSO4 or MgSO4 solutions from 1 mM
to 5 mM, the ionic strength increases and the electrostatic double layer thickness (i.e.,
the Debye length) surrounding the GNRs decreases thus enhancing the overall end-to-
end assembly of the GNRs. Changes in -potential and Debye length with ionic strength
are shown in Table 3.2.

82
Table 3.2. Zeta potential and electrophoretic mobility values of CTAB coated gold nanorod suspensions in 1-5 mM concentrations of CaSO4, MgSO4, Na2SO4, CaCl2, MgCl2, and 3-15 mM of NaCl solutions. The Smoluchowski formulation was used to calculate zeta potential values.
Ionic
Strength
(M)
Debye
Length
(nm)
Electrophoreti
c
Mobility
(µmcm/Vs)
-Potential
(mV)
CaSO4
1 mM 3.71×10⁻³ 4.8 1.69 20.9
2 mM 6.88×10⁻³ 3.4 1.67 20.6
5 mM 1.54×10⁻² 2.15 1.71 21.3
MgSO4
1 mM 3.78×10⁻³ 4.8 1.57 19.5
2 mM 7.08×10⁻³ 3.4 1.58 19.5
5 mM 1.61×10⁻² 2.15 1.62 20.1
Na2SO4
1 mM 2.98×10⁻³ 4.85 2.17 26.84
2 mM 5.94×10⁻³ 3.43 2.01 24.9
5 mM 1.47×10⁻² 2.18 1.72 21.31
CaCl2
1 mM 3.00×10⁻³ 4.85 3.51 44.0
2 mM 6.00×10⁻³ 3.43 3.45 43.3
5 mM 1.50×10⁻² 2.17 3.41 42.8
MgCl2
1 mM 3.00×10⁻³ 4.85 3.48 42.6
2 mM 6.00×10⁻³ 3.43 3.40 41.7
5 mM 1.50×10⁻² 2.17 3.34 41.1
NaCl
3 mM 3.00×10⁻³ 4.85 4.41 56.4
6 mM 6.00×10⁻³ 3.43 3.99 51.1
15 mM 1.50×10⁻² 2.17 2.62 33.6
The evidence suggests that end-to-end assembly of GNRs is enabled by sulfate
bridges between adjacent nanorod tips. Due to the strong charge interaction between
the quaternary ammonium head group of CTAB on the GNR surface and sulfate anions,
electrostatic repulsion between particles is noticeably reduced while the attractive van
der Waals (vdW) forces are roughly constant. As DLVO theory based simulations
suggest (discussed in the next section), charge repulsion between adjacent GNR side
facets (having a high density CTAB coating) is strong enough to prevent side-to-side
83
assembly. Compared to the side facets, the tip facets are expected to have CTAB
coverage and therefore charge-charge repulsion between the tip facets of two adjacent
GNRs is weaker. Consequently, strong vdW interactions overcome charge repulsion
and favor end-to-end assembly. A noticeable difference in -potential was observed
when di-valent versus mono-valent cation counter-ions were present. Such a result is
due to the lower dielectric constant of the medium in the presence of divalent cations as
compared to monovalent cations at equivalent ionic strength. The decreased dielectric
constant of the medium favors the instability of the colloidal suspension toward larger
extended end-to-end assemblies of GNRs. As a result, in case of Na2SO4 where no
divalent cation is present, the end-to-end linkage of CTAB-GNRs occurs less frequently
compared to CaSO4 and MgSO4.
DLVO interaction potential energy simulations
We developed a DLVO based particle-particle interaction model that considers
both van der Waals attractive forces as well as electrostatic repulsion (Details are
presented in SI; Pages 13-15). We note that more complicated models considering
additional attractive or repulsive forces could have been considered; however, such
models require assumptions with unknown applicability to elongated nanostructures.[70,
71] DLVO modeling results for CTAB-GNRs in 2 mM CaSO4 are shown in Figure 3.7.
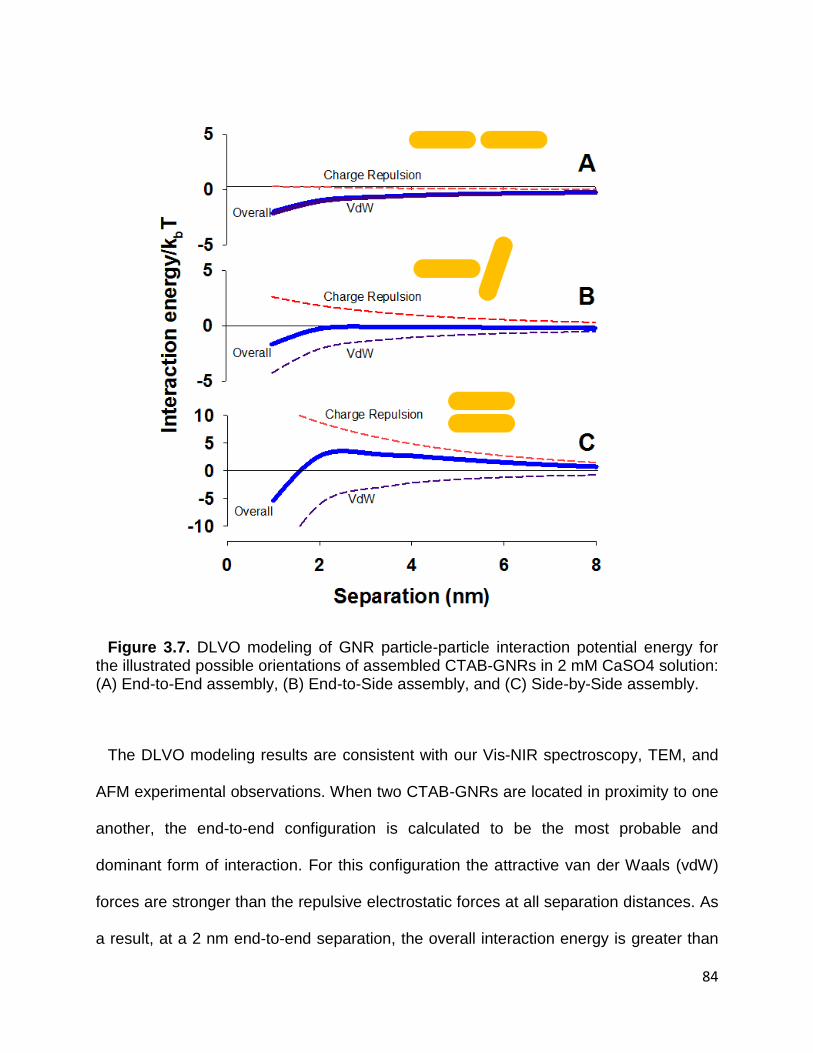
84
Figure 3.7. DLVO modeling of GNR particle-particle interaction potential energy for the illustrated possible orientations of assembled CTAB-GNRs in 2 mM CaSO4 solution: (A) End-to-End assembly, (B) End-to-Side assembly, and (C) Side-by-Side assembly.
The DLVO modeling results are consistent with our Vis-NIR spectroscopy, TEM, and
AFM experimental observations. When two CTAB-GNRs are located in proximity to one
another, the end-to-end configuration is calculated to be the most probable and
dominant form of interaction. For this configuration the attractive van der Waals (vdW)
forces are stronger than the repulsive electrostatic forces at all separation distances. As
a result, at a 2 nm end-to-end separation, the overall interaction energy is greater than
85
-kBT (=4.1×10⁻²¹ J) and stable 2- end-to-end assemblies are favorable. Modeling of the
end-to-side configuration shows neither strong attraction nor repulsion for separations
over 2 nm. In this range, vdW and electrostatic repulsive interactions are of comparable
strength. For separations smaller than 2 nm, the overall interaction energy becomes
theoretically strong enough to form end-to-side assemblies; however, the presence of a
dense CTAB bilayer on the side facets prevents the nanorods from getting that close to
one another. Modeling of the side-to-side configuration shows a large charge repulsion
between the positively charged CTAB bilayer of each side facet compared to attractive
vdW interactions. Similar to the end-to-side assembly, the overall interaction energy
becomes attractive at separation distances shorter than the expected length of the
CTAB bilayer (~3.5 nm)[72, 73]. Therefore, as observed in the TEM and AFM images,
the end-to-end assembly is the dominant configuration, followed by the occasional end-
to-side assembly. Side-by-side assembly was not observed at low salt concentrations.
For CTAB-GNRs in 5 mM CaSO4 or MgSO4, although end-to-end assembly is
the primary expected configuration, the increase in the number of dimer end-to-end
assemblies increases the accessible side facet surface area. Due to the high salt
concentration and low electrostatic repulsion, these side facets are subject to side-by-
side assembly. Consequently, a 6 nm red shift in the transverse peak and an 11 nm
blue shift in the longitudinal peak were observed, while the new end-to-end peak
increased and red shifted to longer wavelengths. The drop in the height of the
longitudinal peak followed by convergence of the transverse and longitudinal peaks,
show side-by-side assembly compared to end-to-end and end-to-side assemblies.
Suspension color change and precipitated GNRs were consistent with Vis-NIR

86
extinction observations at higher salt concentrations. Neither a shift in the longitudinal
and transverse peaks, nor a change in suspension color was observed in other
concentrations of CaSO4 or MgSO4. At high salt concentrations (i.e., 5 mM CaSO4 and
MgSO4), end-to-end, end-to-side, and side-by-side assemblies were frequently
observed in TEM images.
3.5 Conclusions
In this paper we introduced a simple one step mechanism to produce chain like end-
to-end assemblies of CTAB coated GNRs. We propose that sulfate as a divalent anion
effectively interacts with the quaternary ammonium head group of CTAB on the GNRs
surface and bridges the tip facets of adjacent rods. This bridging produces chainlike
end-to-end assemblies of GNRs and the length of assembly can be controlled by sulfate
ion concentration, GNR concentration, and exposure time. In contrast to end-to-end
assembly, side-by-side and end-to-side assemblies are hindered by strong electrostatic
repulsion between the dense CTAB bilayers present on the side facets. Our simple
DLVO model supports the observed assembly trend. Furthermore, we showed that by
analyzing the UV-Vis extinction spectrum and knowing the absorption band of each
order of assembly that we can separately track the formation and growth of these
assemblies over time.
It has been shown that end-to-end assembly of GNRs produces a strong SERS
(surface enhanced Raman spectroscopy) template,[35, 74] and can be used in bio-
sensing and contaminant detection.[25, 75] The majority of prior studies to produce
elongated assemblies involve complex, laborious antibody or polymer involved chemical
reactions while in our work only exposure to a simple divalent anion, sulfate, triggers
87
and enhances formation of these chain-like assemblies. Isolating these assemblies and
protecting them with a stable 2- coatings such as silica may make them a good choice
for SERS based detection strategies.
3.6 Acknowledgements
Funding for this study was provided by the US National Science Foundation (NSF;
CBET 1236005 and 1133736) and the Virginia Tech Institute for Critical Technology and
Applied Science. Additional funding was provided by NSF and the Environmental
Protection Agency under NSF Cooperative Agreement EF-0830093, Center for the
Environmental Implications of NanoTechnology (CEINT). With special thanks to Dr.
Samuel Lohse for his contribution to this study at the beginning phase. Any opinions,
findings, conclusions or recommendations expressed in this material are those of the
authors and do not necessarily reflect the views of the NSF or the EPA. This work has
not been subjected to EPA review and no official endorsement should be inferred.
88
3.7 References
1. Kelly, K.L., et al., The optical properties of metal nanoparticles: the influence of
size, shape, and dielectric environment. The Journal of Physical Chemistry B,
2003. 107(3): p. 668-677.
2. Sosa, I.O., C. Noguez, and R.G. Barrera, Optical properties of metal
nanoparticles with arbitrary shapes. The Journal of Physical Chemistry B, 2003.
107(26): p. 6269-6275.
3. McConnell, W.P., et al., Electronic and optical properties of chemically modified
metal nanoparticles and molecularly bridged nanoparticle arrays. The Journal of
Physical Chemistry B, 2000. 104(38): p. 8925-8930.
4. Yu, Y.-Y., et al., Gold nanorods: electrochemical synthesis and optical properties.
The Journal of Physical Chemistry B, 1997. 101(34): p. 6661-6664.
5. Murphy, C.J., et al., Anisotropic metal nanoparticles: synthesis, assembly, and
optical applications. The Journal of Physical Chemistry B, 2005. 109(29): p.
13857-13870.
6. Willets, K.A. and R.P. Van Duyne, Localized surface plasmon resonance
spectroscopy and sensing. Annu. Rev. Phys. Chem., 2007. 58: p. 267-297.
7. Hornyak, G.L., C.J. Patrissi, and C.R. Martin, Fabrication, characterization, and
optical properties of gold nanoparticle/porous alumina composites: the
nonscattering Maxwell-Garnett limit. The Journal of Physical Chemistry B, 1997.
101(9): p. 1548-1555.
89
8. Link, S. and M.A. El-Sayed, Spectral properties and relaxation dynamics of
surface plasmon electronic oscillations in gold and silver nanodots and nanorods.
The Journal of Physical Chemistry B, 1999. 103(40): p. 8410-8426.
9. Kottmann, J.P., et al., Dramatic localized electromagnetic enhancement in
plasmon resonant nanowires. Chemical Physics Letters, 2001. 341(1): p. 1-6.
10. Imura, K., T. Nagahara, and H. Okamoto, Plasmon mode imaging of single gold
nanorods. Journal of the American Chemical Society, 2004. 126(40): p. 12730-
12731.
11. Elghanian, R., et al., Selective colorimetric detection of polynucleotides based on
the distance-dependent optical properties of gold nanoparticles. Science, 1997.
277(5329): p. 1078-1081.
12. Afrooz, A.N., et al., Mechanistic heteroaggregation of gold nanoparticles in a
wide range of solution chemistry. Environmental science & technology, 2013.
47(4): p. 1853-1860.
13. Ghosh, S.K. and T. Pal, Interparticle coupling effect on the surface plasmon
resonance of gold nanoparticles: from theory to applications. Chemical Reviews,
2007. 107(11): p. 4797-4862.
14. Haiss, W., et al., Determination of size and concentration of gold nanoparticles
from UV-vis spectra. Analytical chemistry, 2007. 79(11): p. 4215-4221.
15. Liu, X., et al., Extinction coefficient of gold nanoparticles with different sizes and
different capping ligands. Colloids and Surfaces B: Biointerfaces, 2007. 58(1): p.
3-7.
90
16. Amendola, V. and M. Meneghetti, Size evaluation of gold nanoparticles by UV−
vis spectroscopy. The Journal of Physical Chemistry C, 2009. 113(11): p. 4277-
4285.
17. Gou, L. and C.J. Murphy, Fine-tuning the shape of gold nanorods. Chemistry of
materials, 2005. 17(14): p. 3668-3672.
18. Jana, N.R., L. Gearheart, and C.J. Murphy, Wet chemical synthesis of high
aspect ratio cylindrical gold nanorods. The Journal of Physical Chemistry B,
2001. 105(19): p. 4065-4067.
19. Pérez-Juste, J., et al., Gold nanorods: synthesis, characterization and
applications. Coordination Chemistry Reviews, 2005. 249(17): p. 1870-1901.
20. Prescott, S.W. and P. Mulvaney, Gold nanorod extinction spectra. Journal of
applied physics, 2006. 99(12): p. 123504.
21. Afrooz, A.N., et al., Spheres vs. rods: The shape of gold nanoparticles influences
aggregation and deposition behavior. Chemosphere, 2013. 91(1): p. 93-98.
22. Link, S., M. Mohamed, and M. El-Sayed, Simulation of the optical absorption
spectra of gold nanorods as a function of their aspect ratio and the effect of the
medium dielectric constant. The Journal of Physical Chemistry B, 1999. 103(16):
p. 3073-3077.
23. Eustis, S. and M.A. El-Sayed, Determination of the aspect ratio statistical
distribution of gold nanorods in solution from a theoretical fit of the observed
inhomogeneously broadened longitudinal plasmon resonance absorption
spectrum. Journal of applied physics, 2006. 100(4): p. 044324.
91
24. Kim, T., et al., Kinetics of gold nanoparticle aggregation: experiments and
modeling. Journal of colloid and interface science, 2008. 318(2): p. 238-243.
25. Wang, L., et al., Side‐by‐Side and End‐to‐End Gold Nanorod Assemblies for
Environmental Toxin Sensing. Angewandte Chemie International Edition, 2010.
49(32): p. 5472-5475.
26. Zhong, L., et al., Rational design and SERS properties of side-by-side, end-to-
end and end-to-side assemblies of Au nanorods. Journal of Materials Chemistry,
2011. 21(38): p. 14448-14455.
27. Jain, P.K., S. Eustis, and M.A. El-Sayed, Plasmon coupling in nanorod
assemblies: optical absorption, discrete dipole approximation simulation, and
exciton-coupling model. The Journal of Physical Chemistry B, 2006. 110(37): p.
18243-18253.
28. Funston, A.M., et al., Plasmon coupling of gold nanorods at short distances and
in different geometries. Nano letters, 2009. 9(4): p. 1651-1658.
29. Chen, H. and E. Ruckenstein, Controlling Nanorod Oligomer Aggregation in
Solutions. The Journal of Physical Chemistry C, 2016.
30. Leung, F.C.-M., et al., Metal–Metal and π–π Interactions Directed End-to-End
Assembly of Gold Nanorods. Journal of the American Chemical Society, 2016.
138(9): p. 2989-2992.
31. Wang, Y., et al., End-to-end assembly of gold nanorods by means of
oligonucleotide–mercury (II) molecular recognition. Chemical Communications,
2010. 46(8): p. 1332-1334.
92
32. Jain, T., et al., End-to-end assembly of gold nanorods via oligopeptide linking
and surfactant control. Journal of colloid and interface science, 2012. 376(1): p.
83-90.
33. Gordel, M., et al., End-to-end self-assembly of gold nanorods in isopropanol
solution: experimental and theoretical studies. Journal of Nanoparticle Research,
2015. 17(12): p. 1-12.
34. Wang, Y., et al., Solvent-mediated end-to-end assembly of gold nanorods. The
Journal of Physical Chemistry Letters, 2010. 1(18): p. 2692-2698.
35. Stewart, A.F., et al., Rational design for the controlled aggregation of gold
nanorods via phospholipid encapsulation for enhanced Raman scattering. ACS
nano, 2014. 8(6): p. 5462-5467.
36. Zhao, D., et al., Reversible gold nanorod assembly triggered by pH-responsive
DNA nanomachine. Applied Physics Letters, 2013. 102(12): p. 123101.
37. Cai, H.-H., et al., Controlled side-by-side assembly of gold nanorods: A strategy
for lead detection. Sensors and Actuators B: Chemical, 2014. 196: p. 252-259.
38. Orendorff, C.J., P.L. Hankins, and C.J. Murphy, pH-triggered assembly of gold
nanorods. Langmuir, 2005. 21(5): p. 2022-2026.
39. Ke, S., et al., Controlled assembly of gold nanorods using tetrahydrofuran. RSC
Advances, 2013. 3(8): p. 2690-2696.
40. Liu, J., et al., End-to-end and side-by-side assemblies of gold nanorods induced
by dithiol poly (ethylene glycol). Applied Physics Letters, 2014. 104(25): p.
253105.
93
41. Gao, J., C.M. Bender, and C.J. Murphy, Dependence of the gold nanorod aspect
ratio on the nature of the directing surfactant in aqueous solution. Langmuir,
2003. 19(21): p. 9065-9070.
42. Nikoobakht, B. and M.A. El-Sayed, Preparation and growth mechanism of gold
nanorods (NRs) using seed-mediated growth method. Chemistry of Materials,
2003. 15(10): p. 1957-1962.
43. Smith, D.K. and B.A. Korgel, The importance of the CTAB surfactant on the
colloidal seed-mediated synthesis of gold nanorods. Langmuir, 2008. 24(3): p.
644-649.
44. Nikoobakht, B. and M.A. El-Sayed, Evidence for bilayer assembly of cationic
surfactants on the surface of gold nanorods. Langmuir, 2001. 17(20): p. 6368-
6374.
45. Murphy, C.J., et al., Gold nanorod crystal growth: from seed-mediated synthesis
to nanoscale sculpting. Current Opinion in Colloid & Interface Science, 2011.
16(2): p. 128-134.
46. Lohse, S.E. and C.J. Murphy, The quest for shape control: a history of gold
nanorod synthesis. Chemistry of Materials, 2013. 25(8): p. 1250-1261.
47. Haynes, W.M., CRC handbook of chemistry and physics. 2014: CRC press.
48. Li, Z., et al., Absorption Spectroscopy of Single Optically Trapped Gold
Nanorods. Nano letters, 2015. 15(11): p. 7731-7735.
49. Scolari, M., et al., Surface enhanced Raman scattering of carbon nanotubes
decorated by individual fluorescent gold particles. The Journal of Physical
Chemistry C, 2008. 112(2): p. 391-396.

94
50. Israelachvili, J.N., Intermolecular and surface forces: revised third edition. 2011:
Academic press.
51. Dougherty, G.M., et al., The zeta potential of surface‐functionalized metallic
nanorod particles in aqueous solution. Electrophoresis, 2008. 29(5): p. 1131-
1139.
52. Ohshima, H., Theory of colloid and interfacial electric phenomena. Vol. 12. 2006:
Academic Press.
53. Thomas, K.G., et al., Uniaxial plasmon coupling through longitudinal self-
assembly of gold nanorods. The Journal of Physical Chemistry B, 2004. 108(35):
p. 13066-13068.
54. Vigderman, L., B.P. Khanal, and E.R. Zubarev, Functional Gold Nanorods:
Synthesis, Self‐Assembly, and Sensing Applications. Advanced Materials, 2012.
24(36): p. 4811-4841.
55. Payne, E.K., et al., Multipole plasmon resonances in gold nanorods. The Journal
of Physical Chemistry B, 2006. 110(5): p. 2150-2154.
56. Lebovka, N.I., Aggregation of charged colloidal particles, in Polyelectrolyte
Complexes in the Dispersed and Solid State I. 2014, Springer. p. 57-96.
57. Gregory, J., Particles in water: properties and processes. 2005: CRC Press.
58. Link, S. and M.A. El-Sayed, Shape and size dependence of radiative, non-
radiative and photothermal properties of gold nanocrystals. International Reviews
in Physical Chemistry, 2000. 19(3): p. 409-453.
59. Papavassiliou, G.C., Optical properties of small inorganic and organic metal
particles. Progress in Solid State Chemistry, 1979. 12(3): p. 185-271.

95
60. Kerker, M., The scattering of light. 1969, Academic Press, New York.
61. Bohren, C.F. and D.R. Huffman, Absorption and scattering of light by small
particles. 2008: John Wiley & Sons.
62. Antonov, L. and D. Nedeltcheva, Resolution of overlapping UV–Vis absorption
bands and quantitative analysis. Chemical Society Reviews, 2000. 29(3): p. 217-
227.
63. Schärtl, W., C. Roos, and K. Gohr, Oscillating time correlation functions from
dynamic light scattering of gold-labeled tracers. The Journal of chemical physics,
1998. 108(22): p. 9594-9597.
64. Wang, Z., et al., Surface reconstruction of the unstable 110 surface in gold
nanorods. The Journal of Physical Chemistry B, 2000. 104(23): p. 5417-5420.
65. Wang, Z., et al., Crystallographic facets and shapes of gold nanorods of different
aspect ratios. Surface science, 1999. 440(1): p. L809-L814.
66. Zhang, W., et al., Effect of KBr on the micellar properties of CTAB. Chinese
Science Bulletin, 2000. 45(20): p. 1854-1857.
67. Goyal, P., et al., Form factors for different aggregation models of micelles.
Physica B: Condensed Matter, 1991. 174(1): p. 192-195.
68. Kuperkar, K., et al., Formation and growth of micelles in dilute aqueous CTAB
solutions in the presence of NaNO3 and NaClO3. Journal of Surfactants and
Detergents, 2010. 13(3): p. 293-303.
69. Cates, M. and S. Candau, Statics and dynamics of worm-like surfactant micelles.
Journal of Physics: Condensed Matter, 1990. 2(33): p. 6869.

96
70. Choi, J., et al., Electrical Repulsive Energy between Two Cylindrical Particles
with Finite Length: Configuration Dependence. BULLETIN-KOREAN CHEMICAL
SOCIETY, 2008. 29(6): p. 1131.
71. Min, Y., et al., The role of interparticle and external forces in nanoparticle
assembly. Nature materials, 2008. 7(7): p. 527.
72. Gomez-Grana, S., et al., Surfactant (bi) layers on gold nanorods. Langmuir,
2011. 28(2): p. 1453-1459.
73. Hore, M.J., et al., Probing the Structure, Composition, and Spatial Distribution of
Ligands on Gold Nanorods. Nano letters, 2015. 15(9): p. 5730-5738.
74. Caswell, K., et al., Preferential end-to-end assembly of gold nanorods by biotin-
streptavidin connectors. Journal of the American Chemical Society, 2003.
125(46): p. 13914-13915.
75. Zhu, Y., et al., Gold nanorod assembly based approach to toxin detection by
SERS. Journal of Materials Chemistry, 2012. 22(6): p. 2387-2391.
97
3.8 Supporting Information for
Sulfate Mediated End-to-End Assembly of Gold
Nanorods
S.M.H. Abtahi,1, 2, 3 Nathan D. Burrows,4 Fred A. Idesis,4 Catherine J. Murphy,4
Navid B. Saleh,5 and Peter J. Vikesland*1, 2, 3
1.Virginia Tech, Department of Civil and Environmental Engineering,
Blacksburg, VA, USA
2.Virginia Tech, Institute for Critical Technology and Applied Science (ICTAS)
Center for Sustainable Nanotechnology (VTSuN), Blacksburg, VA, USA
3.Center for the Environmental Implications of Nanotechnology (CEINT), Duke
University, Durham, NC, USA
4.Department of Chemistry, University of Illinois at Urbana-Champaign,
600 S. Matthews Ave., Urbana, IL, 61801.
5.The University of Texas at Austin, Department of Civil, Architectural, and
Environmental Engineering, Austin, TX 78750, USA

98
Figure 3.S1. TEM image analysis of synthesized GNRs. The GNRs have an average
length of 28.8 0.1 nm and an average diameter of 6.6 ± 0.1 nm (the noted errors reflect the 95% confidence interval based on n = 2104 measurements obtained using ImageJ)
Henry Equation
Zeta potential value can be directly calculated from measured electrophoretic mobility
by means of Henry equation. Knowing the medium and nanoparticle characteristics and
appropriate Henry’s constant value are the keys parameters in this calculation.
𝑈𝐸 =2𝜀𝜁𝑓(𝜅𝑎)
3𝜂
𝑈𝐸: 𝐸𝑙𝑒𝑐𝑡𝑟𝑜𝑝ℎ𝑜𝑟𝑒𝑡𝑖𝑐 𝑚𝑜𝑏𝑖𝑙𝑖𝑡𝑦
𝜀: 𝐷𝑖𝑒𝑙𝑒𝑐𝑡𝑟𝑖𝑐 𝑐𝑜𝑛𝑠𝑡𝑎𝑛𝑡
𝜁: 𝑍𝑒𝑡𝑎 𝑝𝑜𝑡𝑒𝑛𝑡𝑖𝑎𝑙
𝑓(𝜅𝑎): 𝐻𝑒𝑛𝑟𝑦’𝑠 𝑐𝑜𝑛𝑠𝑡𝑎𝑛𝑡
𝜂: 𝑉𝑖𝑠𝑐𝑜𝑠𝑖𝑡𝑦

99
𝑎: 𝑅𝑎𝑑𝑖𝑢𝑠 𝑜𝑓 𝑝𝑎𝑟𝑡𝑖𝑐𝑙𝑒
1𝜅⁄ : 𝐷𝑜𝑢𝑏𝑙𝑒 𝑙𝑎𝑦𝑒𝑟 𝑡ℎ𝑖𝑐𝑘𝑛𝑒𝑠𝑠
Smoluchowski equation
Smoluchowski equation is an approximation for Henry’s constant (f(κa)=1.5). This
approximation works best if the particles are fairly large while suspended in an aqueous
medium with moderate electrolyte concentration. In order to justify the application of
Smoluchowski approximation during zeta potential calculations, It is suggested that the
κa>>1 condition should be met.
If 𝜅𝑎 ≫ 1 then 𝑓(𝜅𝑎) = 1.5
𝜅 = (2𝐼𝑒2
𝜀0𝜀𝑟𝑘𝐵𝑇)
12⁄
𝜀0: 𝑃𝑒𝑟𝑚𝑖𝑡𝑡𝑖𝑣𝑖𝑡𝑦 𝑜𝑓 𝑣𝑎𝑐𝑢𝑢𝑚
𝜀𝑟: 𝑅𝑒𝑙𝑎𝑡𝑖𝑣𝑒 𝑠𝑡𝑎𝑡𝑖𝑐 𝑝𝑒𝑟𝑚𝑖𝑡𝑡𝑖𝑣𝑖𝑡𝑦 𝑜𝑓 𝑠𝑜𝑙𝑢𝑡𝑖𝑜𝑛
𝐼: 𝐼𝑜𝑛𝑖𝑐 𝑠𝑡𝑟𝑒𝑛𝑔𝑡ℎ 𝑜𝑓 𝑠𝑜𝑙𝑢𝑡𝑖𝑜𝑛
𝑒: 𝐶ℎ𝑎𝑟𝑔𝑒 𝑜𝑓 𝑎𝑛 𝑒𝑙𝑒𝑐𝑡𝑟𝑜𝑛
𝑘𝐵: 𝐵𝑜𝑙𝑡𝑧 − 𝑚𝑎𝑛𝑛 𝑐𝑜𝑛𝑠𝑡𝑎𝑛𝑡
𝑇: 𝑇𝑒𝑚𝑝𝑒𝑟𝑎𝑡𝑢𝑟𝑒
Synthesized GNRs have cylindrical shape with 28.8 nm length and 6.6 nm diameter.
An equivolume sphere will have a radius of 19.65 nm. All calculation and measurements
occurred at 20°C and DI water was the solvent.
𝑎 = 19.65 𝑛𝑚
5 mM CaSO4 ; 𝐼 = 1.54 × 10⁻² 𝑚𝑜𝑙𝐿⁄ , therefore 𝜅 = 4.65 × 10⁸ 1 𝑚⁄ and 𝜅𝑎 = 9.13

100
1 mM CaSO4 ; 𝐼 = 3.71 × 10⁻³ 𝑚𝑜𝑙𝐿⁄ , therefore 𝜅 = 2.08 × 10⁸ 1 𝑚⁄ and 𝜅𝑎 = 4.09
At all ranges of ionic strengths in this study, κa ≫ 1 always , therefore Smoluchowski
model for zeta potential measurements is valid.
Figure 3.S2. Image of 20 mg/L CTAB-GNRs in DI water and in the presence of different concentrations of CaSO4 after 24 hours of exposure.
Second Order GNR aggregation rate:
In this study the aggregation rate of gold nanorods, decay in single GNRs number
concentration, at different experiments is calculated based on a second order kinetics
rate. Beer-Lambert law suggests that change in the measured extinction intensity of the
single GNRs longitudinal band is linearly related to the change in the GNRs number
concentration. The reported aggregation rates are calculated based on plotting the
inverse of single GNRs longitudinal band extinction intensity versus time.
𝐴 = 𝐸𝑥𝑡𝑖𝑛𝑐𝑡𝑖𝑜𝑛 𝑖𝑛𝑡𝑒𝑛𝑠𝑖𝑡𝑦 𝑡 = 𝑡𝑖𝑚𝑒
𝑘 = 𝑠𝑒𝑐𝑜𝑛𝑑 𝑟𝑎𝑡𝑒 𝑐𝑜𝑛𝑠𝑡𝑎𝑛𝑡 𝐶 = 𝑠𝑖𝑛𝑔𝑙𝑒 𝐺𝑁𝑅 𝑛𝑢𝑚𝑏𝑒𝑟 𝑐𝑜𝑛𝑐𝑒𝑛𝑡𝑟𝑎𝑡𝑖𝑜𝑛
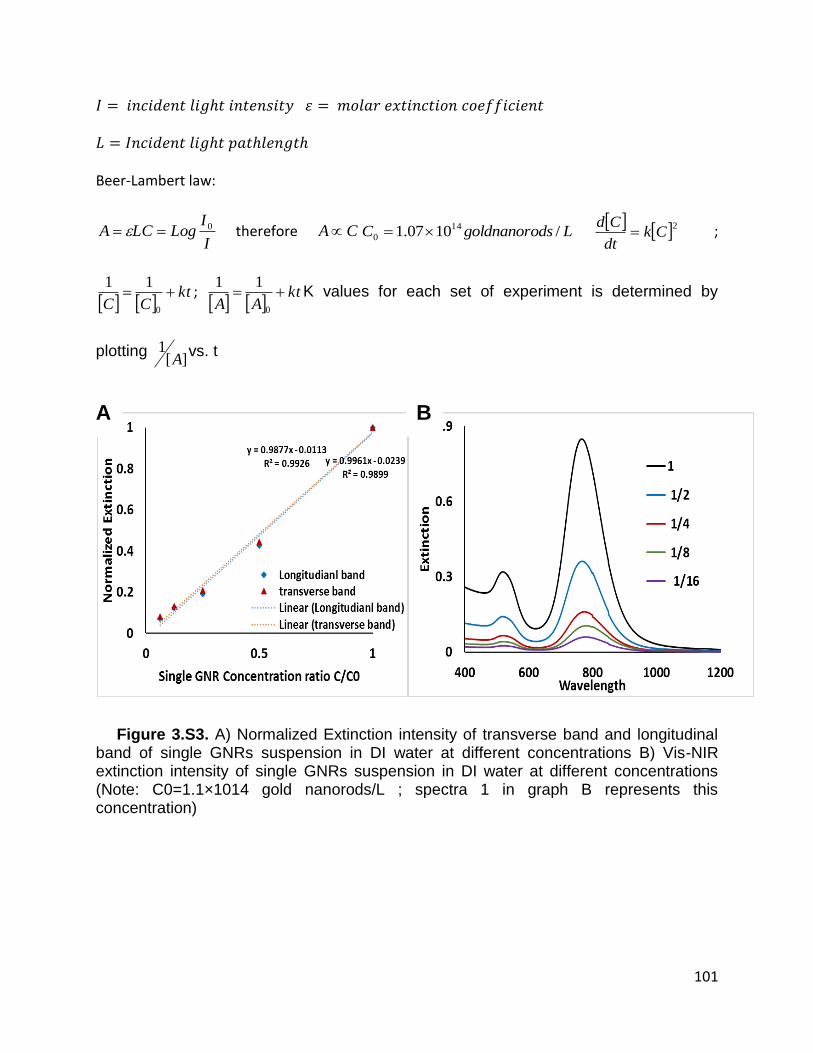
101
𝐼 = 𝑖𝑛𝑐𝑖𝑑𝑒𝑛𝑡 𝑙𝑖𝑔ℎ𝑡 𝑖𝑛𝑡𝑒𝑛𝑠𝑖𝑡𝑦 𝜀 = 𝑚𝑜𝑙𝑎𝑟 𝑒𝑥𝑡𝑖𝑛𝑐𝑡𝑖𝑜𝑛 𝑐𝑜𝑒𝑓𝑓𝑖𝑐𝑖𝑒𝑛𝑡
𝐿 = 𝐼𝑛𝑐𝑖𝑑𝑒𝑛𝑡 𝑙𝑖𝑔ℎ𝑡 𝑝𝑎𝑡ℎ𝑙𝑒𝑛𝑔𝑡ℎ
Beer-Lambert law:
I
ILogLCA 0 therefore CA LdsgoldnanoroC /1007.1 14
0
2Ckdt
Cd ;
kt
CC
0
11;
ktAA
0
11K values for each set of experiment is determined by
plotting ][
1A
vs. t
Figure 3.S3. A) Normalized Extinction intensity of transverse band and longitudinal band of single GNRs suspension in DI water at different concentrations B) Vis-NIR extinction intensity of single GNRs suspension in DI water at different concentrations (Note: C0=1.1×10¹⁴ gold nanorods/L ; spectra 1 in graph B represents this concentration)
A B
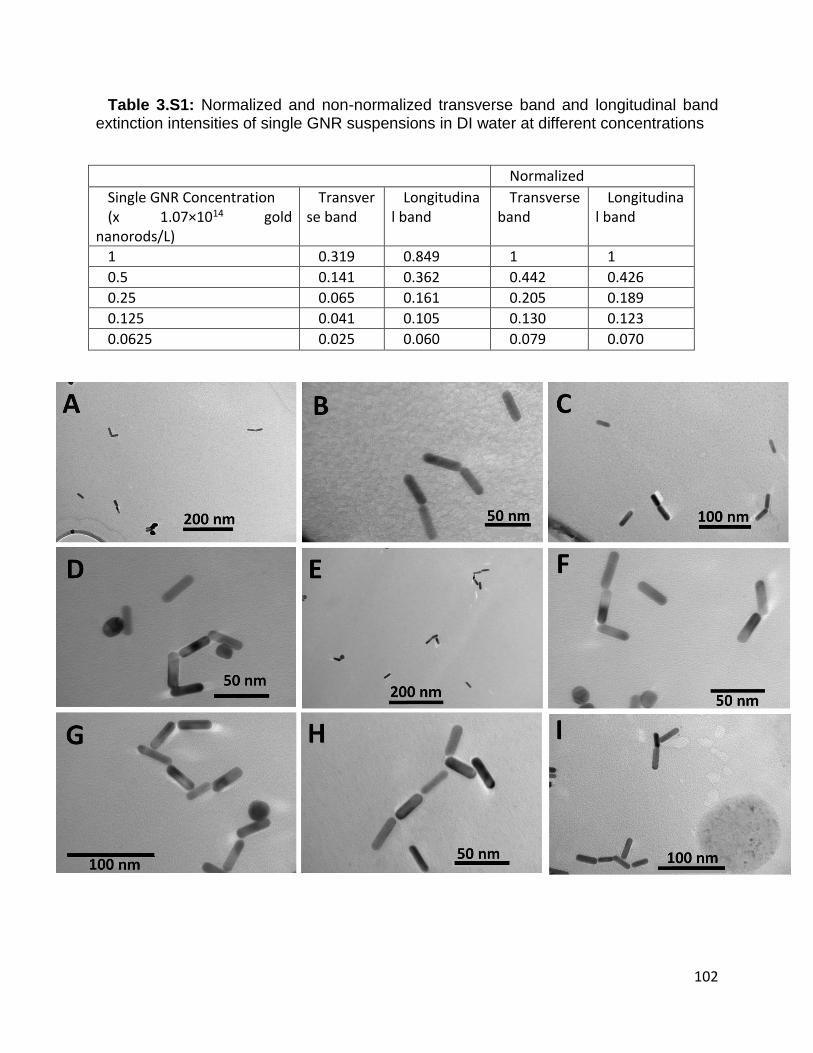
102
Table 3.S1: Normalized and non-normalized transverse band and longitudinal band extinction intensities of single GNR suspensions in DI water at different concentrations
Normalized
Single GNR Concentration (x 1.07×10¹⁴ gold
nanorods/L)
Transverse band
Longitudinal band
Transverse band
Longitudinal band
1 0.319 0.849 1 1
0.5 0.141 0.362 0.442 0.426
0.25 0.065 0.161 0.205 0.189
0.125 0.041 0.105 0.130 0.123
0.0625 0.025 0.060 0.079 0.070
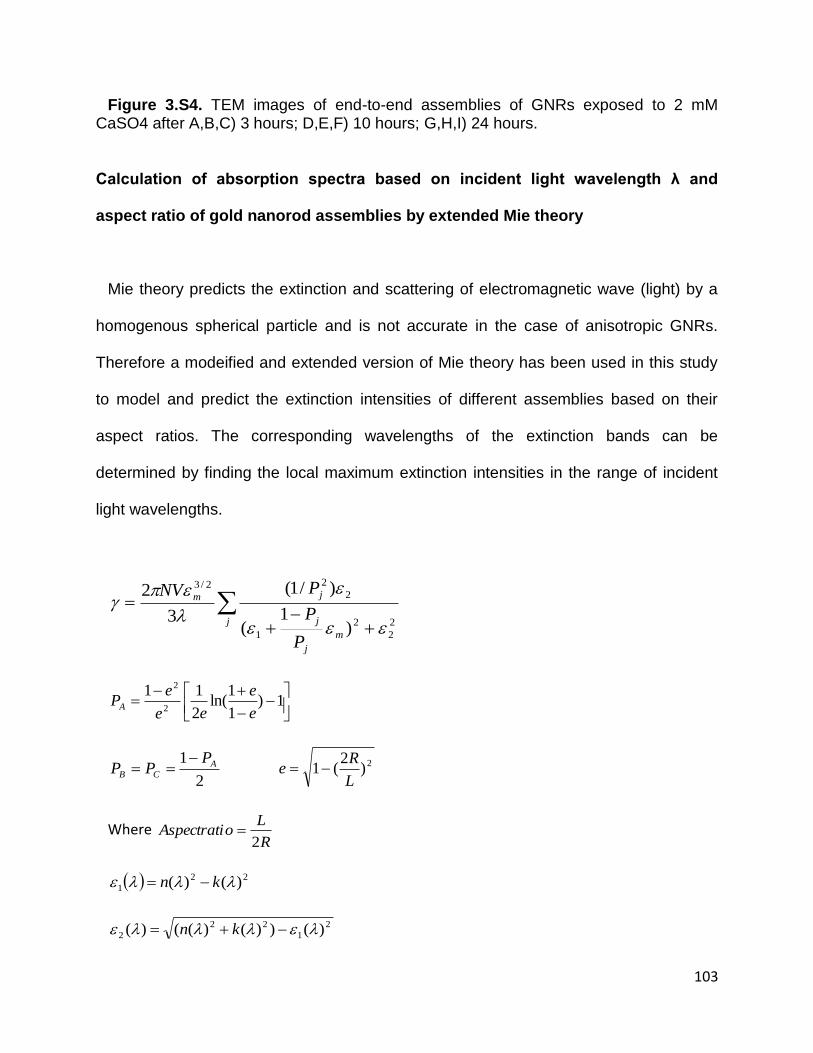
103
Figure 3.S4. TEM images of end-to-end assemblies of GNRs exposed to 2 mM CaSO4 after A,B,C) 3 hours; D,E,F) 10 hours; G,H,I) 24 hours.
Calculation of absorption spectra based on incident light wavelength λ and
aspect ratio of gold nanorod assemblies by extended Mie theory
Mie theory predicts the extinction and scattering of electromagnetic wave (light) by a
homogenous spherical particle and is not accurate in the case of anisotropic GNRs.
Therefore a modeified and extended version of Mie theory has been used in this study
to model and predict the extinction intensities of different assemblies based on their
aspect ratios. The corresponding wavelengths of the extinction bands can be
determined by finding the local maximum extinction intensities in the range of incident
light wavelengths.
j
m
j
j
jm
P
P
PNV
2
2
2
1
2
22/3
)1
(
)/1(
3
2
1)
1
1ln(
2
112
2
e
e
ee
ePA
2
1 ACB
PPP
2)
2(1
L
Re
Where R
LoAspectrati
2
22
1 )()( kn
2
1
22
2 )())()(()( kn
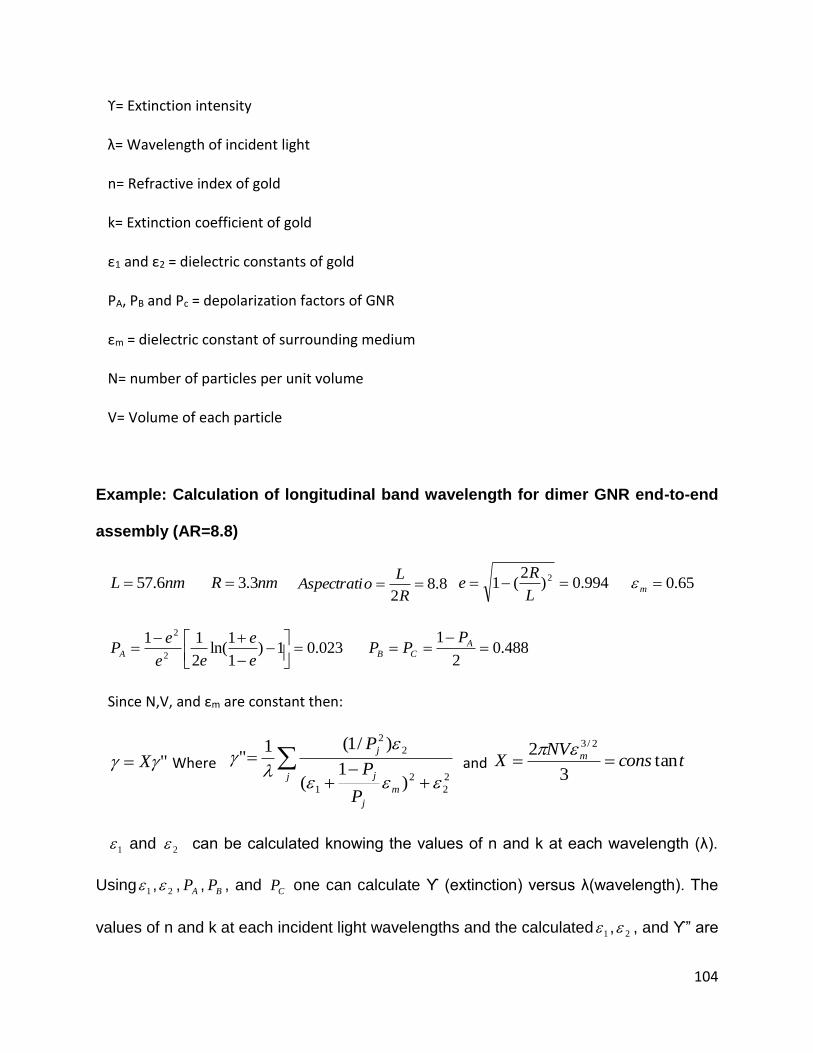
104
ϒ= Extinction intensity
λ= Wavelength of incident light
n= Refractive index of gold
k= Extinction coefficient of gold
ε1 and ε2 = dielectric constants of gold
PA, PB and Pc = depolarization factors of GNR
εm = dielectric constant of surrounding medium
N= number of particles per unit volume
V= Volume of each particle
Example: Calculation of longitudinal band wavelength for dimer GNR end-to-end
assembly (AR=8.8)
nmL 6.57 nmR 3.3 8.82
R
LoAspectrati 994.0)
2(1 2
L
Re 65.0m
023.01)1
1ln(
2
112
2
e
e
ee
ePA 488.0
2
1
A
CB
PPP
Since N,V, and εm are constant then:
" X Where
j
m
j
j
j
P
P
P
2
2
2
1
2
2
)1
(
)/1(1"
and tcons
NVX m tan
3
2 2/3
1 and 2 can be calculated knowing the values of n and k at each wavelength (λ).
Using 1 , 2 , AP , BP , and CP one can calculate ϒ (extinction) versus λ(wavelength). The
values of n and k at each incident light wavelengths and the calculated 1 , 2 , and ϒ” are

105
reported at Table 3.S2. ϒ” is linearly related to the extinction intensity (ϒ) and
represents the magnitude of light absorption at that specific incident light wavelength.
Figure 3.S5 shows how these calculated extinction intensities change versus incident
light wavelengths.
Table 3.S2. n (refractive index) and k (extinction coefficient) of gold, calculated 1 , 2 , and ϒ” values for dimer GNRs end-to-end assembly versus incident light wavelength. (n and k values are derived from McPeak, Kevin M., et al. "Plasmonic films can easily be better: rules and recipes." ACS photonics 2.3 (2015): 326-333)
wavelength (λ) n k ε1 ε2 ϒ”
800 0.104 5.224 -
27.2794 1.086592 0.072452
810 0.106 5.313 -
28.2167 1.126356 0.103348
820 0.104 5.407 -
29.2248 1.124656 0.156777
830 0.104 5.492 -
30.1512 1.142336 0.255183
840 0.107 5.577 -
31.0915 1.193478 0.480281
845 0.109 5.619 -
31.5613 1.224942 0.690112
850 0.111 5.66 -
32.0233 1.25652 0.994327
855 0.111 5.705 -
32.5347 1.26651 1.42718
860 0.111 5.75 -
33.0502 1.2765 1.714754
865 0.112 5.791 -
33.5231 1.297184 1.545007
870 0.112 5.831 -
33.988 1.306144 1.164572
875 0.113 5.872 -
34.4676 1.327072 0.809401
880 0.114 5.913 -
34.9506 1.348164 0.565538
890 0.116 5.993 -
35.9026 1.390376 0.307517
900 0.117 6.082 -
36.977 1.423188 0.177924
910 0.117 6.164 - 1.442376 0.11712
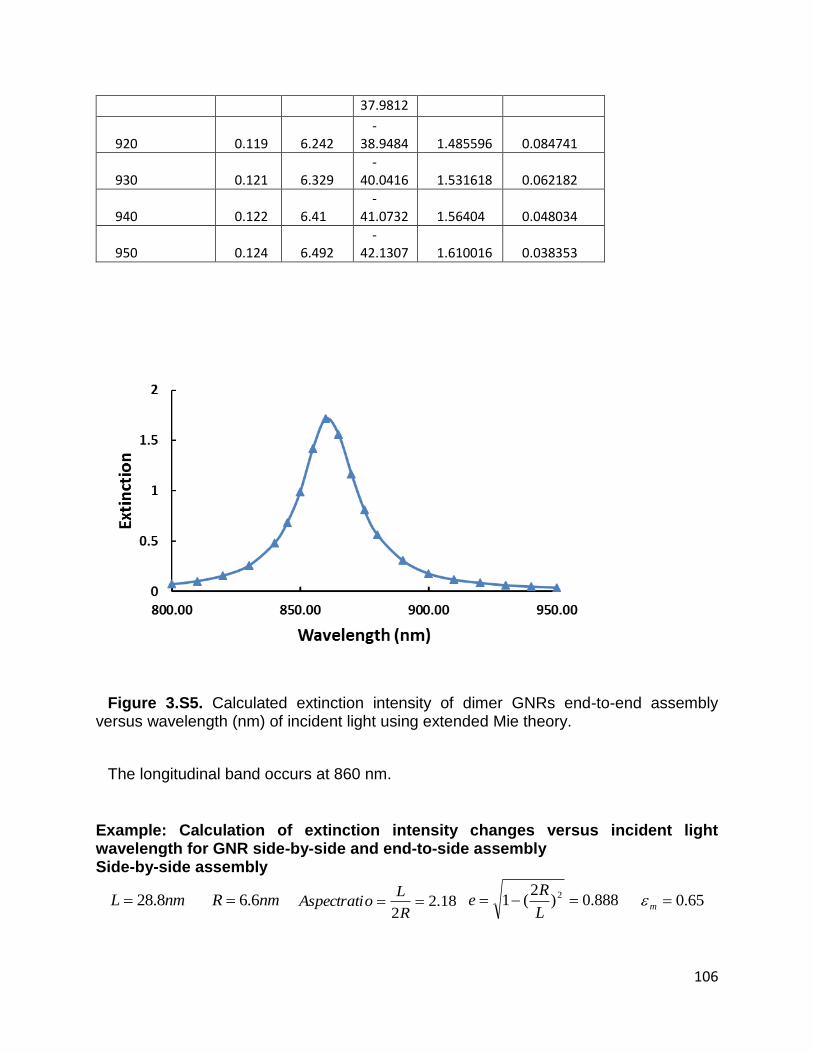
106
37.9812
920 0.119 6.242 -
38.9484 1.485596 0.084741
930 0.121 6.329 -
40.0416 1.531618 0.062182
940 0.122 6.41 -
41.0732 1.56404 0.048034
950 0.124 6.492 -
42.1307 1.610016 0.038353
Figure 3.S5. Calculated extinction intensity of dimer GNRs end-to-end assembly versus wavelength (nm) of incident light using extended Mie theory.
The longitudinal band occurs at 860 nm.
Example: Calculation of extinction intensity changes versus incident light wavelength for GNR side-by-side and end-to-side assembly Side-by-side assembly
nmL 8.28 nmR 6.6 18.22
R
LoAspectrati 888.0)
2(1 2
L
Re 65.0m
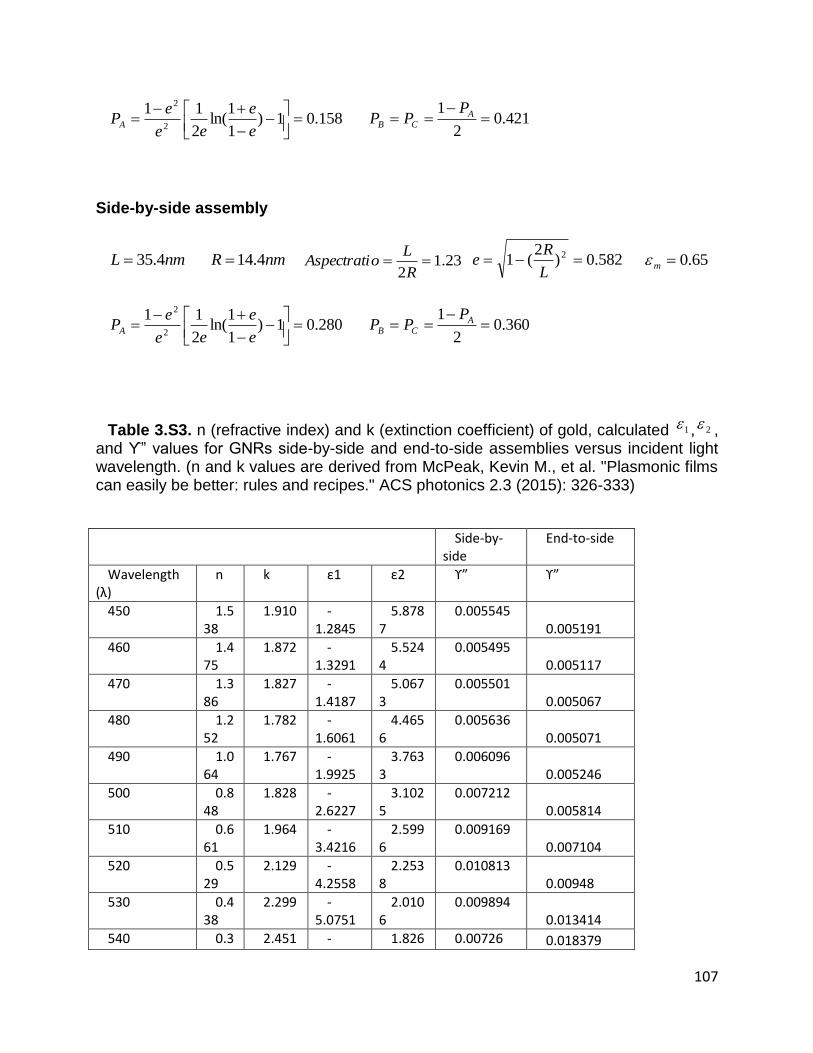
107
158.01)1
1ln(
2
112
2
e
e
ee
ePA 421.0
2
1
A
CB
PPP
Side-by-side assembly
nmL 4.35 nmR 4.14 23.12
R
LoAspectrati 582.0)
2(1 2
L
Re 65.0m
280.01)1
1ln(
2
112
2
e
e
ee
ePA 360.0
2
1
A
CB
PPP
Table 3.S3. n (refractive index) and k (extinction coefficient) of gold, calculated 1 , 2 , and ϒ” values for GNRs side-by-side and end-to-side assemblies versus incident light wavelength. (n and k values are derived from McPeak, Kevin M., et al. "Plasmonic films can easily be better: rules and recipes." ACS photonics 2.3 (2015): 326-333)
Side-by-
side End-to-side
Wavelength (λ)
n k ε1 ε2 ϒ” ϒ”
450 1.538
1.910 -1.2845
5.8787
0.005545 0.005191
460 1.475
1.872 -1.3291
5.5244
0.005495 0.005117
470 1.386
1.827 -1.4187
5.0673
0.005501 0.005067
480 1.252
1.782 -1.6061
4.4656
0.005636 0.005071
490 1.064
1.767 -1.9925
3.7633
0.006096 0.005246
500 0.848
1.828 -2.6227
3.1025
0.007212 0.005814
510 0.661
1.964 -3.4216
2.5996
0.009169 0.007104
520 0.529
2.129 -4.2558
2.2538
0.010813 0.00948
530 0.438
2.299 -5.0751
2.0106
0.009894 0.013414
540 0.3 2.451 - 1.826 0.00726 0.018379
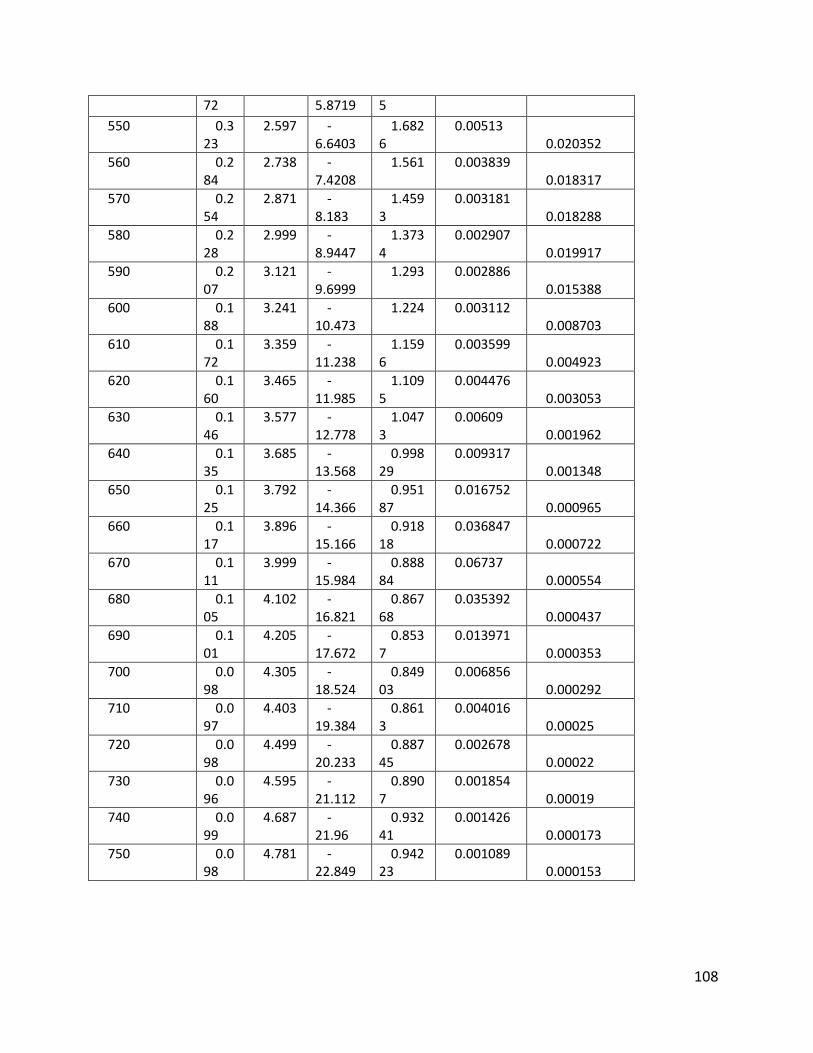
108
72 5.8719 5
550 0.323
2.597 -6.6403
1.6826
0.00513 0.020352
560 0.284
2.738 -7.4208
1.561 0.003839 0.018317
570 0.254
2.871 -8.183
1.4593
0.003181 0.018288
580 0.228
2.999 -8.9447
1.3734
0.002907 0.019917
590 0.207
3.121 -9.6999
1.293 0.002886 0.015388
600 0.188
3.241 -10.473
1.224 0.003112 0.008703
610 0.172
3.359 -11.238
1.1596
0.003599 0.004923
620 0.160
3.465 -11.985
1.1095
0.004476 0.003053
630 0.146
3.577 -12.778
1.0473
0.00609 0.001962
640 0.135
3.685 -13.568
0.99829
0.009317 0.001348
650 0.125
3.792 -14.366
0.95187
0.016752 0.000965
660 0.117
3.896 -15.166
0.91818
0.036847 0.000722
670 0.111
3.999 -15.984
0.88884
0.06737 0.000554
680 0.105
4.102 -16.821
0.86768
0.035392 0.000437
690 0.101
4.205 -17.672
0.8537
0.013971 0.000353
700 0.098
4.305 -18.524
0.84903
0.006856 0.000292
710 0.097
4.403 -19.384
0.8613
0.004016 0.00025
720 0.098
4.499 -20.233
0.88745
0.002678 0.00022
730 0.096
4.595 -21.112
0.8907
0.001854 0.00019
740 0.099
4.687 -21.96
0.93241
0.001426 0.000173
750 0.098
4.781 -22.849
0.94223
0.001089 0.000153
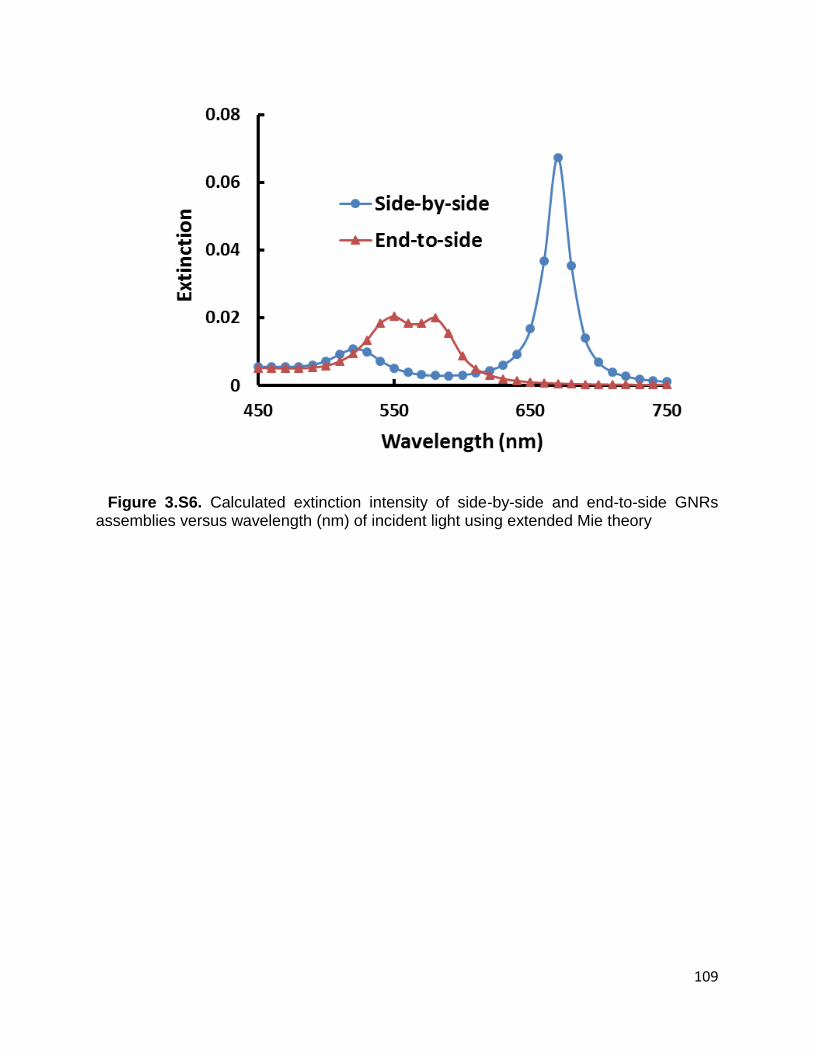
109
Figure 3.S6. Calculated extinction intensity of side-by-side and end-to-side GNRs assemblies versus wavelength (nm) of incident light using extended Mie theory
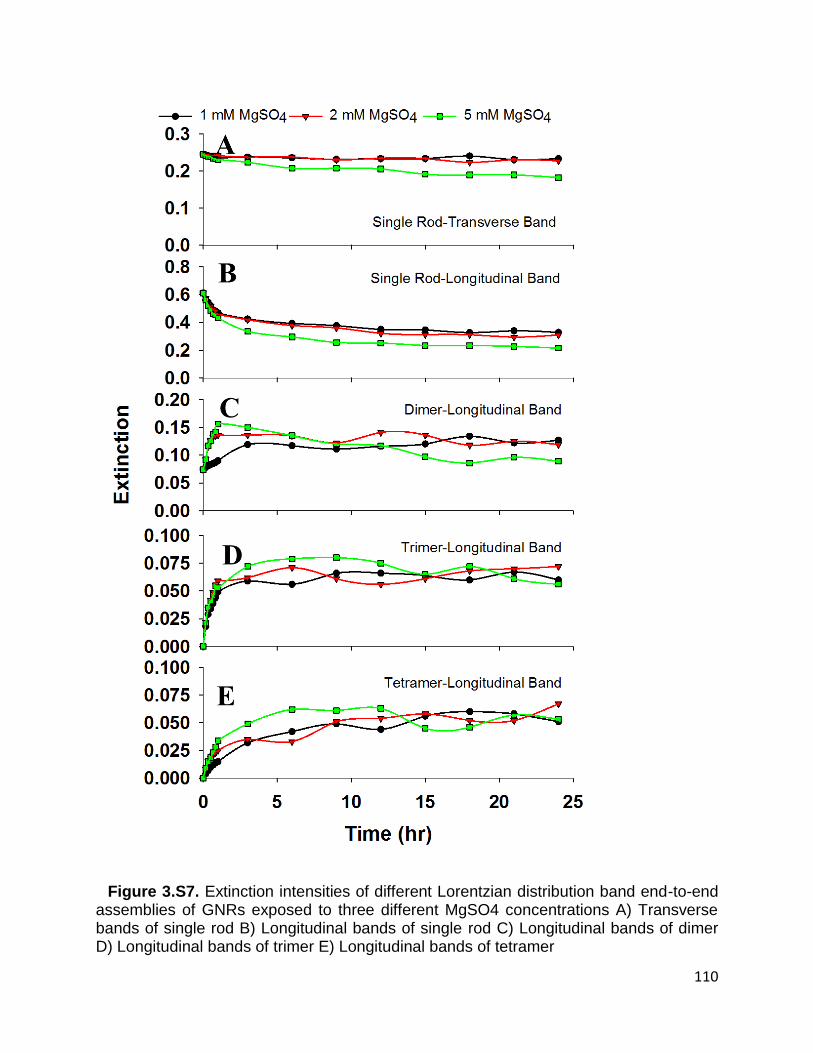
110
Figure 3.S7. Extinction intensities of different Lorentzian distribution band end-to-end assemblies of GNRs exposed to three different MgSO4 concentrations A) Transverse bands of single rod B) Longitudinal bands of single rod C) Longitudinal bands of dimer D) Longitudinal bands of trimer E) Longitudinal bands of tetramer
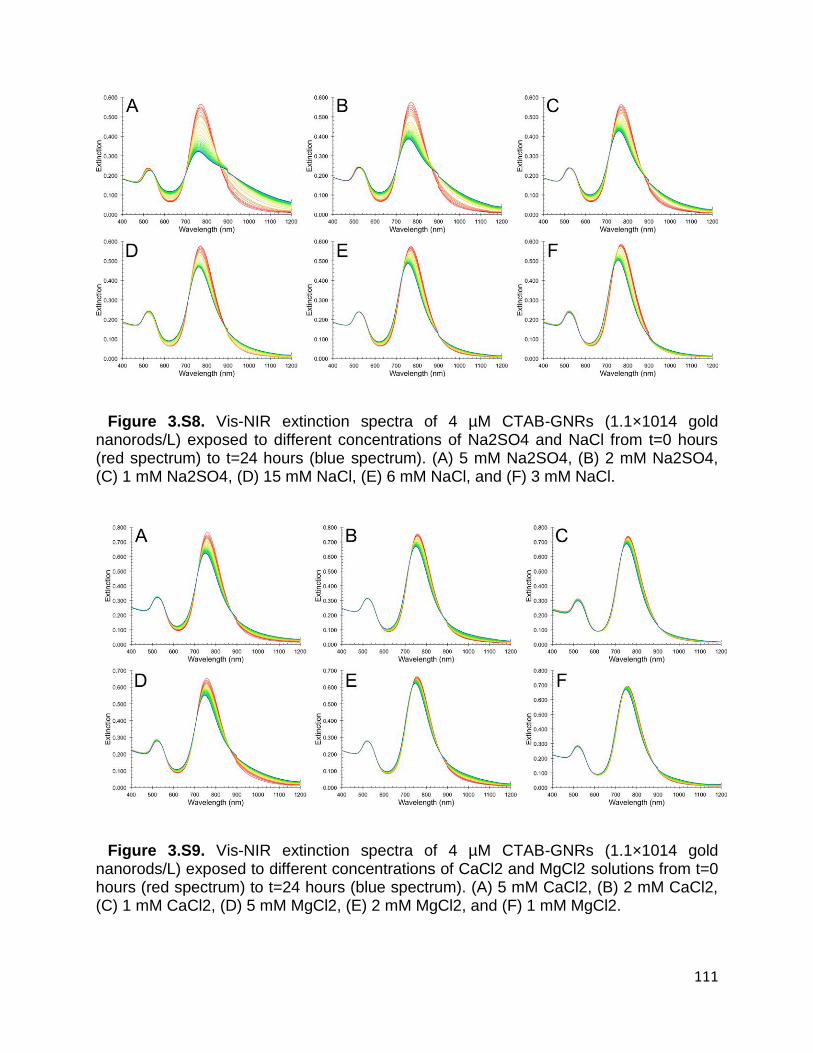
111
Figure 3.S8. Vis-NIR extinction spectra of 4 µM CTAB-GNRs (1.1×10¹⁴ gold nanorods/L) exposed to different concentrations of Na2SO4 and NaCl from t=0 hours (red spectrum) to t=24 hours (blue spectrum). (A) 5 mM Na2SO4, (B) 2 mM Na2SO4, (C) 1 mM Na2SO4, (D) 15 mM NaCl, (E) 6 mM NaCl, and (F) 3 mM NaCl.
Figure 3.S9. Vis-NIR extinction spectra of 4 µM CTAB-GNRs (1.1×10¹⁴ gold nanorods/L) exposed to different concentrations of CaCl2 and MgCl2 solutions from t=0 hours (red spectrum) to t=24 hours (blue spectrum). (A) 5 mM CaCl2, (B) 2 mM CaCl2, (C) 1 mM CaCl2, (D) 5 mM MgCl2, (E) 2 mM MgCl2, and (F) 1 mM MgCl2.
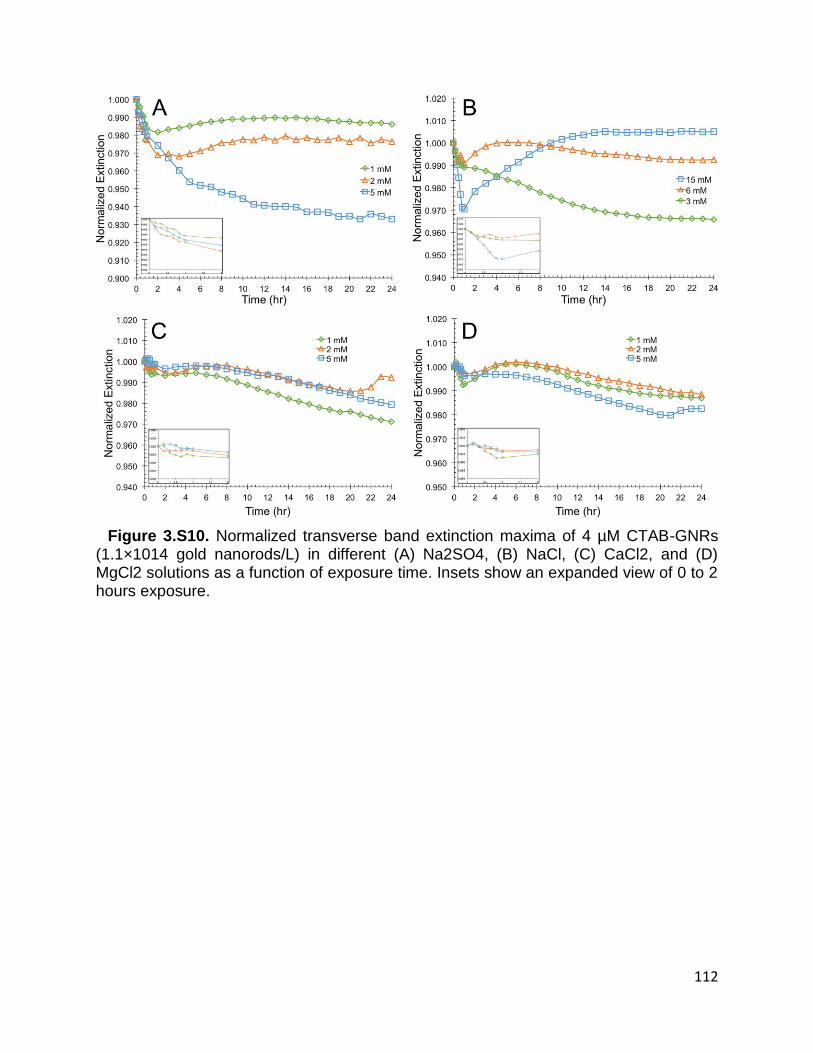
112
Figure 3.S10. Normalized transverse band extinction maxima of 4 µM CTAB-GNRs (1.1×10¹⁴ gold nanorods/L) in different (A) Na2SO4, (B) NaCl, (C) CaCl2, and (D) MgCl2 solutions as a function of exposure time. Insets show an expanded view of 0 to 2 hours exposure.
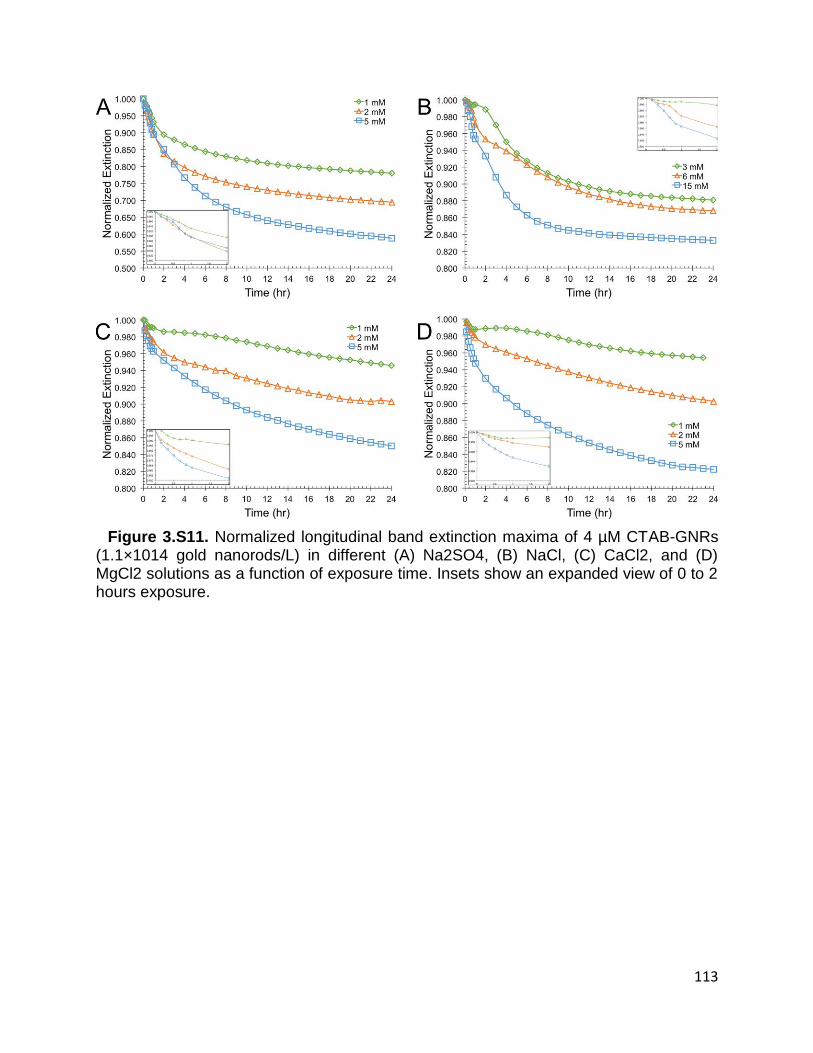
113
Figure 3.S11. Normalized longitudinal band extinction maxima of 4 µM CTAB-GNRs (1.1×10¹⁴ gold nanorods/L) in different (A) Na2SO4, (B) NaCl, (C) CaCl2, and (D) MgCl2 solutions as a function of exposure time. Insets show an expanded view of 0 to 2 hours exposure.
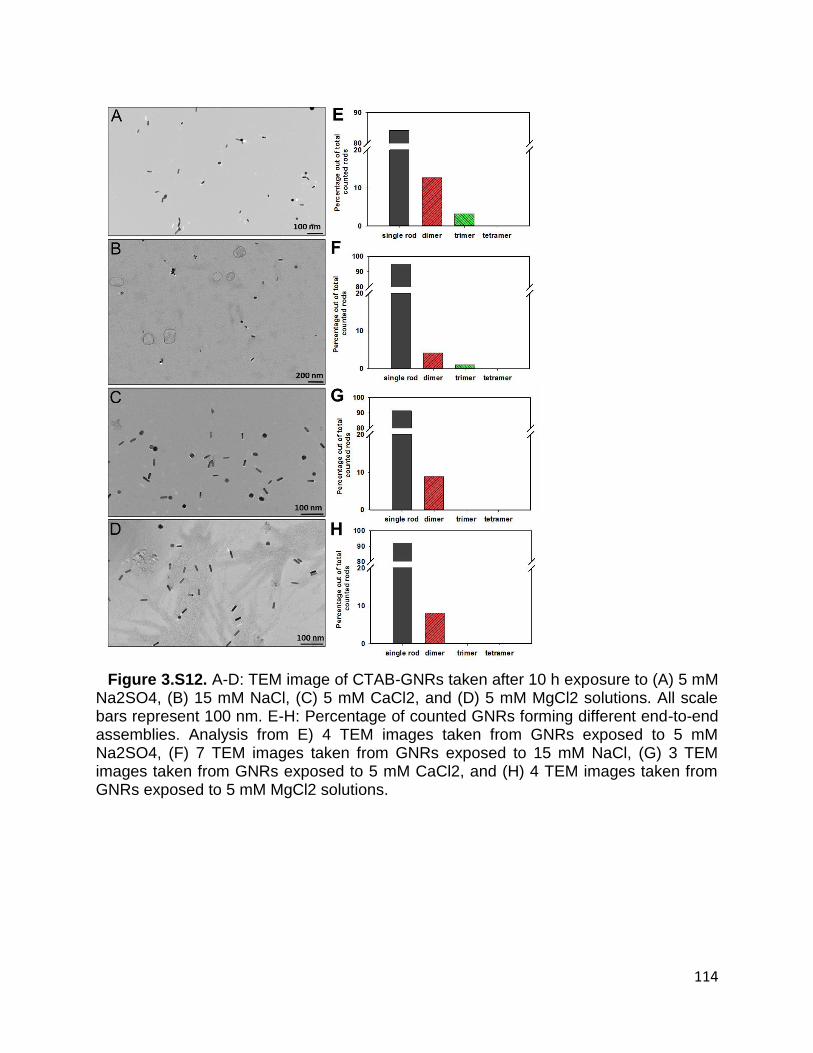
114
Figure 3.S12. A-D: TEM image of CTAB-GNRs taken after 10 h exposure to (A) 5 mM Na2SO4, (B) 15 mM NaCl, (C) 5 mM CaCl2, and (D) 5 mM MgCl2 solutions. All scale bars represent 100 nm. E-H: Percentage of counted GNRs forming different end-to-end assemblies. Analysis from E) 4 TEM images taken from GNRs exposed to 5 mM Na2SO4, (F) 7 TEM images taken from GNRs exposed to 15 mM NaCl, (G) 3 TEM images taken from GNRs exposed to 5 mM CaCl2, and (H) 4 TEM images taken from GNRs exposed to 5 mM MgCl2 solutions.

115
Figure 3.S13. Sulfate ion interaction with CTAB’s quaternary ammonium head group on GNR surface
DLVO particle-particle interaction modeling
The introduced DLVO model here accounts van der Waals attraction and charge-
charge repulsion as the dominant particle-particle interaction forces. Based on the
relative positions (end-to-end, side-by-side, and end-to-side) of two adjacent GNRs the
corresponding vdW attraction and charge repulsion equations are developed. Note that
for end-to-end GNRs interaction, the tips of GNRs are modeled as two spheres having
the same diameter as the GNRs. For end-to-side interaction one of the rods is modeled
as an infinite plate while the other rod’s tip is modeled as a sphere having the same
diameter. For side-by-side interaction, both nanorods are modeled as cylinders having
the same length and diameter as the GNR. We note that different facets of CTAB
coated gold nanorods do have different surface charges. However, modeling this
difference is challenging because at present there is no readily available technique to
directly measure the surface charge of the side and tip facets of gold nanorods. The
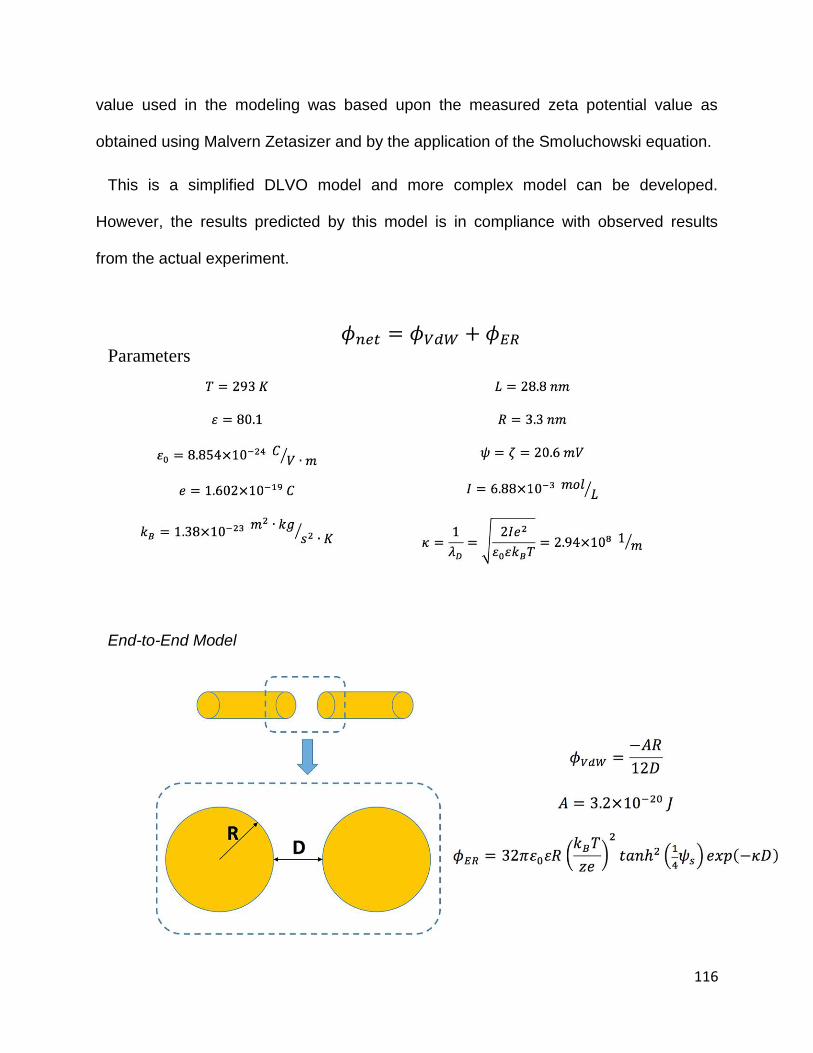
116
value used in the modeling was based upon the measured zeta potential value as
obtained using Malvern Zetasizer and by the application of the Smoluchowski equation.
This is a simplified DLVO model and more complex model can be developed.
However, the results predicted by this model is in compliance with observed results
from the actual experiment.
𝜙𝑛𝑒𝑡 = 𝜙𝑉𝑑𝑊 + 𝜙𝐸𝑅 Parameters
End-to-End Model
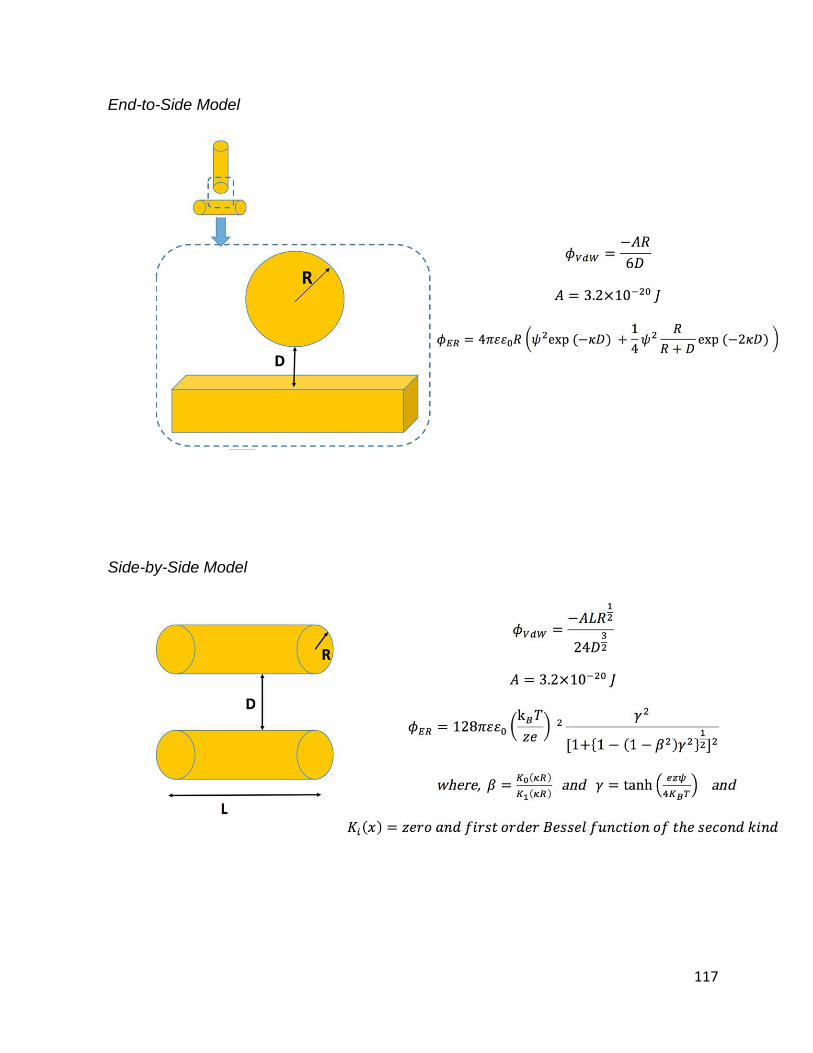
117
End-to-Side Model
Side-by-Side Model
118
Chapter 4. Size, Shape, and Surface Coating Impacts on the
Colloidal Stability and Aggregation Rate of Gold
Nanoparticles in Aquatic Matrices
S.M.H. Abtahi1, 2, 3, 4, Catherine J. Murphy5, Navid B. Saleh6, and P. J. Vikesland1, 2, 3, 4
1. Virginia Polytechnic Institute and State University, Department of Civil and
Environmental Engineering, Blacksburg, Virginia, USA
2. Virginia Polytechnic Institute and State University, Institute for Critical
Technology and Applied Science (ICTAS), Blacksburg, Virginia, USA
3. Virginia Polytechnic Institute and State University, Center for Sustainable
Nanotechnology (VT SuN), Blacksburg, Virginia, USA
4. Center for the Environmental Implications of Nanotechnology (CEINT),
USA
5. University of Illinois at Urbana-Champaign, Department of Chemistry,
Champaign, Illinois, USA.
6. The University of Texas at Austin, Department of Civil, Architectural, and
Environmental Engineering, Austin, Texas, USA
119
4.1 Abstract
GoId nanoparticles with different shapes and surface coatings are being developed for
biomedical and industrial applications because of their unique properties. However, these
nanoparticles can be a potential environmental contaminants post-use due to their high
colloidal stability. In this study, the impacts of size, aspect ratio (AR), and surface coating
on the colloidal stability of these gold nanoparticles in aquatic matrices were evaluated.
Gold nanoparticles were exposed to synthetic fresh water solutions with ionic
compositions ranging from very soft to very hard and the colloidal stability and
aggregation rates of the particles were characterized by UV-VIS spectroscopy and ICP-
MS (inductively coupled plasma mass spectrometry). As expected, the results suggest
that for citrate coated AuNP, CTAB coated AR4 AuNR, and CTAB/BDAC coated AR8
AuNR the colloidal stabilities were reduced with an increase in ionic strength. Aggregation
rates were evaluated using both first and second order kinetic rate equations. Moreover,
the changes in aggregation rate versus solution hardness were determined for each type
of gold nanoparticle. The collected results were consistent with electrolyte mediated
double layer compression. For BSA coated gold nanoparticles of different shapes where
the steric repulsion is strong, colloidal stability was not hindered by ionic strength of the
solution and no aggregation was observed.
4.2 Introduction
ENMs (engineered nanomaterials) can be defined as particles that possess at least one
dimension smaller than 100 nm and that possess unique physiochemical properties that
originate from their size and structural characteristics[1]. According to a recent report by
120
the Centers for Disease Control and Prevention (CDC), current ENMs can be classified
into four different groups based on their composition: elemental carbon, carbon
compounds, metals and metal oxides, and ceramics[2]. Metal and metal oxide ENMs,
among which gold and titanium dioxide are the most widely produced nanomaterials, are
commonly used in industry. The Radiant Insights has predicted that the global market for
gold nanoparticles will be approximately 13 tons by year 2020 with the medical industry
as the first and electronics as the second largest application fields[3]. Noble metal
nanoparticles such as gold are of interest for their potential application in biomedicine and
electronics due to their unique electro-optical properties [4-8]. These properties result
from the collective resonance of free surface electrons during their interaction with an
electromagnetic field whose incident wavelength is longer than the size of the
nanoparticle[4, 9]. This local coherent oscillation of conductive free electrons is termed
LSPR (localized surface plasmon resonance) and is highly dependent on the size and
shape of the nanoparticle [4, 5, 10-14]. The LSPR spectrum of gold nanospheres (AuNPs)
shows a distinctive band at 500-550 nm within the visible range. The location of this band
is size dependent and red shifts to higher wavelengths with an increase in size [15-17].
Unlike spherical nanoparticles, elongated nanoparticles such as gold nanorods (AuNRs),
show two separate conduction electron oscillations along both the short axis (transverse
oscillation) and the long axis (longitudinal oscillation) [8, 18-21]. The longitudinal plasmon
band is highly aspect ratio (AR) dependent and red shifts to longer wavelengths with an
increase in AR [20, 22, 23]. The Beer-Lambert equation (provided in the SI) suggests that
the extinction intensity of these plasmon bands are linearly related to the suspension

121
nanoparticle concentration [15, 24]. As a result, aggregation rates can be determined
based upon the decrease in the longitudinal and transverse plasmon bands with time.
There is a wide body of research examining the aggregation and deposition of ENMs
in aquatic systems, but unfortunately only a few of these studies have focused on the
roles of anisotropicity and AR. Petosa et.al recently reviewed the aggregation and
deposition of various ENMs in aquatic environments including carbon nanotubes,
fullerenes, metallic nanoparticles such as gold and iron, metal oxide nanoparticles such
as titanium dioxide and ZnO plus quantum dots[25]. None of the studies reviewed in this
paper systematically investigated the effects of shape and AR. To our best knowledge, in
addition to our previous study on the aggregation kinetics and assembly of AuNRs[26]
currently there are only two other environmentally relevant published studies on ZnO
nanorods[27] and GNR[28] aggregation and interactions in which spheres and rods
undergo different interactions and show different aggregation kinetics.
This study focused on the investigation of the impacts of size, shape, and surface
coating of nanoparticles on their colloidal stability, fate, and aggregation rates in complex
environmentally relevant aquatic matricies. Citrate coated AuNPs,
cetyltrimethylammonium bromide (CTAB) coated AuNRs with different AR, and BSA
(Bovine serum albumin) coated versions of these nanoparticles were used to carry out
the experiments. Citrate and CTAB were chosen because they are commonly used during
synthesis of AuNPs and AuNRs and are the primary coatings on these nanoparticle
surfaces [8, 19, 29-32]. The effects of the aquatic matrix ionic strength on the colloidal
stability of these nanoparticles were investigated by UV-Vis absorbance spectroscopy.
122
4.3 Materials and Methods
Gold Nanoparticle Synthesis. 19 nm citrate stabilized (citrate-AuNP) were prepared
following the technique introduced by Jana et al. [19] based upon that originally developed
by Turkevich [33].
Aspect ratio 4 (AR4) CTAB coated gold nanorod synthesis. AR4 AuNRs were
synthesized via the seed-mediated surfactant-directed method [26, 34, 35]. Initially, 4 nm
spherical gold seeds were synthesized through the reduction of chloroauric acid (HAuCl4)
in a 10 mM solution of cetyltrimethylammonium bromide (CTAB) by the addition of freshly
prepared and ice-cooled sodium borohydride. AR4 AuNRs were then grown by a
surfactant directed method in a growth solution consisting of CTAB, HAuCl4, AgNO3, and
ascorbic acid. After addition of the gold seeds to the growth solution, the mixture was left
undisturbed at 25°C for 2 hours. Other shape gold nanoparticle by-products such as
spheres and cubes were removed by five sequential centrifugal wash (25 min at 8,000 x
g) and pellet resuspension in 800 μM CTAB steps.
Aspect ratio 8 (AR8) CTAB coated gold nanorod synthesis. The Nikoobakht et al.
synthesis method was used to synthesize AR8 AuNRs [35]. However, a few modifications
were done to tune the size and overall yield of the AuNRs. 4 nm gold nanoseeds were
prepared following the same process as for AR4 AuNRs, but the growth solution had a
different combination consisting of HAuCl4, AgNO3, ascorbic acid, CTAB, and
benzyldimethylammonium chloride (BDAC). The molar ratio of BDAC/CTAB was adjusted
to 2.7 because it has been shown that ratios ranging from 2-5.5 result in less spherical
nanoparticle byproducts. Moreover, 200 µL of 1 M HCl was added to 10 mL growth
solution to further increase the yield of AR8 AuNRs. The growth solution was left
123
undisturbed in a 30 ºC water bath for 24 hours. Post synthesis, the mixture was
centrifuged at 2,000 x g for 5 min. AR8 gold nanorods were primarily suspended in the
supernatant, while the large spherical nanoparticles were precipitated as a pellet.
Supernatant and pellet were later separated by pipette.
Bovine serum albumin (BSA) coating of AuNP and AR4 & AR8 AuNRs. BSA coating
of AuNPs was done by incubating citrate-AuNP with a solution of 0.1 mg BSA/mL. The
pH was adjusted to 9.0 by addition of 1 M NaOH. The mixture was then left undisturbed
for 24 hours at 25°C. Excess unreacted BSA and citrate were removed by centrifugation
at 10,000 x g for 30 minutes. AR4 and AR8 AuNR coating by BSA was done following
the protocol developed by Tebbe et.al. [36]. For AR4 the CTAB and for AR8 the
CTAB/BDAC concentrations were reduced to <0.1 mM by sequential centrifugal washing
and replacement of the supernatant with DI water. It should be noted that the AuNRs
were colloidally stable at this low surfactant concentration for just half an hour. Therefore,
the residual surfactant reduction step was done immediately prior to ligand exchange.
Afterwards, the gold nanoparticle suspension was added to a 10 mg/mL BSA solution
under vigorous stirring. The volume ratio of BSA solution to AuNR suspension was 3:1.
The pH of the mixture was adjusted to 7.0 and kept in a bath sonicator for 30 minutes.
The mixture was centrifuged at 10,000 x g for 20 minutes and the supernatant was
replaced by 1 mg/mL BSA solution at pH 12 and left undisturbed for 24 hours. The
detached CTAB and BDAC and unreacted BSA were further separated by several
sequential centrifugal washings.
Gold NP and NR characterization. The monodispersity, size distribution, and shape of
the synthesized nanoparticles were characterized by dynamic light scattering (DLS), vis-
124
NIR spectroscopy, inductively coupled plasma mass spectroscopy (ICP-MS), and
transmission electron microscopy (TEM). The primary intensity particle size distributions
and monodispersity of the GNPs were assessed using a Malvern Zetasizer NanoZS DLS
based on analysis of the correlation functions using the General Purpose algorithm and
a non-negative least squares fit[37]. The Malvern NanoZS is equipped with a 175° angle
backscattering detector and a 4 mW He-Ne 633 nm laser. The elemental gold content of
the synthesized gold nanoparticles was measured using an Agilent 7500ce ICP-MS. In
brief, a 1 mL sample of synthesized gold NPs and NRs was washed twice using
sequential centrifugal washing at 10,000 x g for 20 min followed by 100× dilution in DI
water. The sample was then transferred to a polystyrene tube where a 200 µL aliquot of
aqua regia (1:3, Trace metal grade HNO3:HCl) was added. After 2 hours digestion, the
total volume was brought to 10 mL by addition of DI water. A Philips EM420 conventional
electron microscope equipped with a CCD camera was used to measure the size
distribution and shape of the AuNRs and AuNPs. In brief, TEM samples were prepared
by drop-cast technique. A 10 µL droplet of sample was put on a 300 mesh carbon coated
copper TEM grid and left undisturbed in a ventilated hood for 24 hours to dry. A Cary
5000 UV-Vis-NIR spectrometer and disposable 10 mm pathlength polystyrene cuvettes
were used to measure the absorption intensity and plasmon band (transverse and
longitudinal) locations of the AuNPs and AuNRs. DI water with a resistivity of 18.2 MΩ
was produced by a Thermo Scientific Barnstead nanopure system. 10-100 µL and 100-
1000 µL micropipettes with disposable tips were used during all sets of experiments.
Colloidal stability assay of AuNPs and AuNRs in different ionic strength solutions.
2 mg/L elemental gold concentration of AuNPs and AuNRs with different surface coatings
125
were exposed to freshly prepared synthetic EPA standard waters of various hardness for
24 hours. The detailed water chemistries of these waters are described in Table 4.S1.
To initiate an experiment, non-BSA and BSA coated AuNPs and AuNRs were washed
by centrifugation at 10,000 x g for 15 min and replacement of 95% of the supernatant with
DI water prior to resuspension. Nanoparticles were resuspended in DI water by bath
sonication for 1 min. Resuspended AuNRs and AuNPs were readily redispersed and
colloidally stable in suspension without any perceptible aggregation. Following a second
centrifugation step, the supernatant was replaced with a predetermined volume of given
EPA standard water solutions ranging from very soft to very hard hardness to achieve a
final 2 mg/L elemental gold concentration. The nanoparticle suspensions were transferred
to vis-NIR plastic cuvettes that were used for 24-hour colloidal stability tests. 20 min
sampling intervals and 1 hr intervals were used for the first hour and the rest of the time
course of the experiments. Vis-NIR extinction spectra ranging from 400-800 nm, 400-
1050 nm, and 400-1350 nm were used to collect absorption intensities of 19 nm AuNPs,
AR4 AuNRs, and AR8 AuNRs, respectively.
4.4 Results and discussion
Gold nanoparticle characterization. Nanoparticles were primarily characterized by
TEM, UV-Vis-NIR, electrophoretic mobility, and ICP-MS measurements. TEM images of
these nanoparticles are shown as insets in Figure 4.1 along with the associated vis-NIR
absorption spectra. Additional TEM images are provided in Figure 4.S1. Citrate-AuNPs
were 19.2 ± 0.2 nm while AR4 and AR8 AuNRs had average lengths of 42.1 ± 0.3 and
83.4 ± 0.2 nm and diameters of 11.2 ± 0.1 and 10.5 ± 0.3 nm, respectively. The noted
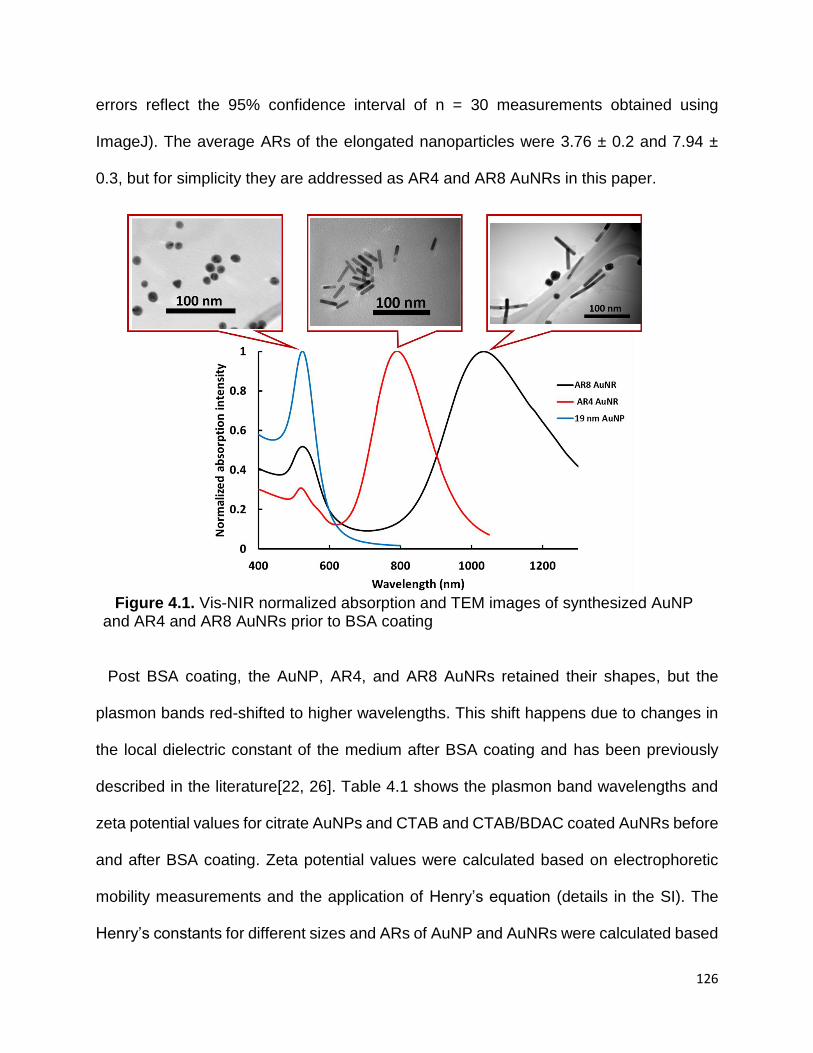
126
errors reflect the 95% confidence interval of n = 30 measurements obtained using
ImageJ). The average ARs of the elongated nanoparticles were 3.76 ± 0.2 and 7.94 ±
0.3, but for simplicity they are addressed as AR4 and AR8 AuNRs in this paper.
Figure 4.1. Vis-NIR normalized absorption and TEM images of synthesized AuNP and AR4 and AR8 AuNRs prior to BSA coating
Post BSA coating, the AuNP, AR4, and AR8 AuNRs retained their shapes, but the
plasmon bands red-shifted to higher wavelengths. This shift happens due to changes in
the local dielectric constant of the medium after BSA coating and has been previously
described in the literature[22, 26]. Table 4.1 shows the plasmon band wavelengths and
zeta potential values for citrate AuNPs and CTAB and CTAB/BDAC coated AuNRs before
and after BSA coating. Zeta potential values were calculated based on electrophoretic
mobility measurements and the application of Henry’s equation (details in the SI). The
Henry’s constants for different sizes and ARs of AuNP and AuNRs were calculated based

127
on Ohshima’s correction[38, 39]. The reported values are the average of 3 measurements
of 15 runs each. ICP-MS measurements indicate that the stock suspension of AuNP, AR4
AuNR, and AR8 AuNR had 93.6 ± 0.1, 41.1 ± 0.3, and 19.4 ± 0.2 mg/L elemental gold
concentrations.
Table 4.1. Plasmon band wavelengths, Zeta potential, and electrophoretic mobility (EM) values of citrate AuNP, CTAB AR4 AuNR, and CTAB/BDAC coated AR8 AuNR suspension in DI water before and after BSA coating
Initial coating BSA coating
Transverse band (nm)
Longitudinal band (nm)
Zeta potential (mv)
EM (µm.cm/V.s)
Transverse band (nm)
Longitudinal band (nm)
Zeta potential (mv)
EM (µm.cm/V.s)
AuNP 19 nm
523 N.A. -36.0 ± 2.2 -2.90 ± 0.12 529 N.A. -45.3 ± 1.2 -3.78 ± 0.02
AR4 AuNR
510 798 +39.2 ± 3.1 3.45 ± 0.09 513 803 -29.4 ± 0.6 -2.46 ± 0.15
AR8 AuNR
524 1044 +41.4 ± 0.8 4.18 ± 0.18 529 1052 -21.5 ± 1.1 -1.91 ± 0.07
Gold nanoparticle colloidal stability and aggregation rates in EPA standard waters.
The changes in the monomer (colloidally stable single nanoparticle) concentrations in
the suspensions over the 24-hour time course of the experiments are presented in Figure
4.2. As we reported before, these graphs were created by considering a linear correlation
between the change in the plasmon band absorption intensities and changes in the mass
concentration of nanoparticles, based upon the Beer-Lambert law[26]. As expected,
citrate coated AuNPs, CTAB coated AR4 AuNRs, and CTAB/BDAC coated AR8 AuNRs
become increasingly unstable with an increase in solution hardness. The harder the
water, the more rapidly the nanoparticles aggregate and there was a concomitant
decrease in both the transverse and longitudinal bands, Figure 4.S2-4. For non-BSA
coated AuNPs and AuNRs, electrostatic repulsion among the adjacent nanoparticles is
the main deterrent to aggregation. By increasing the ionic strength of the solution from
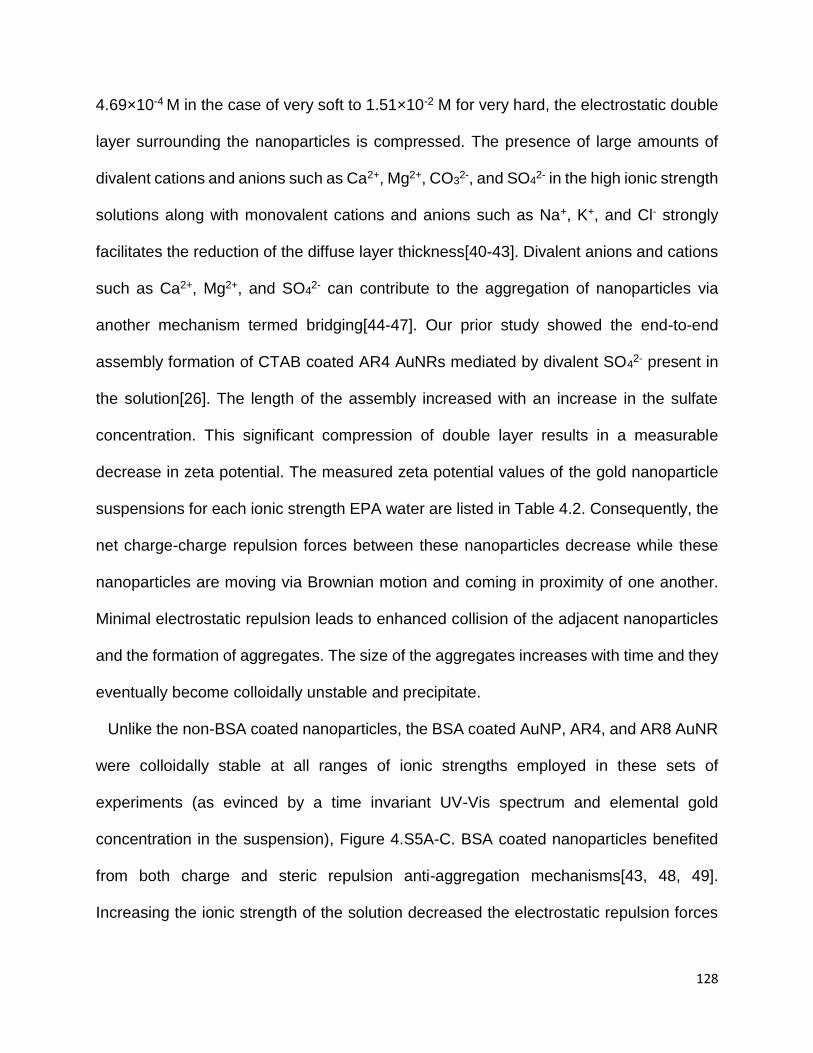
128
4.69×10⁻⁴ M in the case of very soft to 1.51×10⁻² M for very hard, the electrostatic double
layer surrounding the nanoparticles is compressed. The presence of large amounts of
divalent cations and anions such as Ca2+, Mg2+, CO32-, and SO4
2- in the high ionic strength
solutions along with monovalent cations and anions such as Na+, K+, and Cl- strongly
facilitates the reduction of the diffuse layer thickness[40-43]. Divalent anions and cations
such as Ca2+, Mg2+, and SO42- can contribute to the aggregation of nanoparticles via
another mechanism termed bridging[44-47]. Our prior study showed the end-to-end
assembly formation of CTAB coated AR4 AuNRs mediated by divalent SO42- present in
the solution[26]. The length of the assembly increased with an increase in the sulfate
concentration. This significant compression of double layer results in a measurable
decrease in zeta potential. The measured zeta potential values of the gold nanoparticle
suspensions for each ionic strength EPA water are listed in Table 4.2. Consequently, the
net charge-charge repulsion forces between these nanoparticles decrease while these
nanoparticles are moving via Brownian motion and coming in proximity of one another.
Minimal electrostatic repulsion leads to enhanced collision of the adjacent nanoparticles
and the formation of aggregates. The size of the aggregates increases with time and they
eventually become colloidally unstable and precipitate.
Unlike the non-BSA coated nanoparticles, the BSA coated AuNP, AR4, and AR8 AuNR
were colloidally stable at all ranges of ionic strengths employed in these sets of
experiments (as evinced by a time invariant UV-Vis spectrum and elemental gold
concentration in the suspension), Figure 4.S5A-C. BSA coated nanoparticles benefited
from both charge and steric repulsion anti-aggregation mechanisms[43, 48, 49].
Increasing the ionic strength of the solution decreased the electrostatic repulsion forces

129
among these nanoparticles due to the decrease of the zeta potential values, Table 4. 2.
However, steric repulsion forces originating from the thick polymeric layer of BSA
covering these nanoparticles were unaffected and strong enough to keep these
nanoparticles colloidally stable at all ranges of ionic strengths[48, 50-52].
An intense sharp drop in both the transverse and longitudinal peak intensities were
observed within the first hour of exposure of non-BSA coated nanoparticles to EPA waters
in almost all cases, Figure 4.S2-4, Figure 4.2A-C. This decreasing trend smoothly and
less-intensely continues for the remaining 23 hours in the case of elongated AuNRs.
Unlike AuNRs, the plasmon band intensity of citrate AuNP kept dropping intensely for the
first 10 hours and smoothed-out for the remaining 14 hours for very hard, hard, and
moderately hard EPA waters, Figure 4.2A. These consistent sharp drops indicate that
citrate AuNPs are more substantially affected by higher ionic strength solutions compared
to elongated AuNRs. Zeta potential measurements of these nanoparticles over the time
course of the experiment further prove that citrate coated nanoparticles had lower zeta
potential values at moderately hard, hard, and very hard ionic strength solutions, Table
4. 2. Moreover, elongated gold nanorods have an extra rotational diffusion mechanism as
compared to gold nanospheres that only have transitional diffusion[53, 54]. The diffusion
coefficient of AuNP and the transitional and rotational diffusion coefficients of the AuNRs
were calculated based on physical parameters used in the experiment (details in the SI).
The diffusion coefficient of the AuNPs was 11.2 x 10⁻¹¹ (m2/S). The transitional diffusion
coefficients of AR4 AuNR and AR8 AuNR were, 10.7 x 10⁻¹¹ and 4.14 x 10⁻¹¹(m2/S),
respectively. The transitional diffusion coefficient of AR4 AuNR was comparable in
magnitude to AuNP while AR8 AuNR had the smallest transitional diffusion coefficient. A
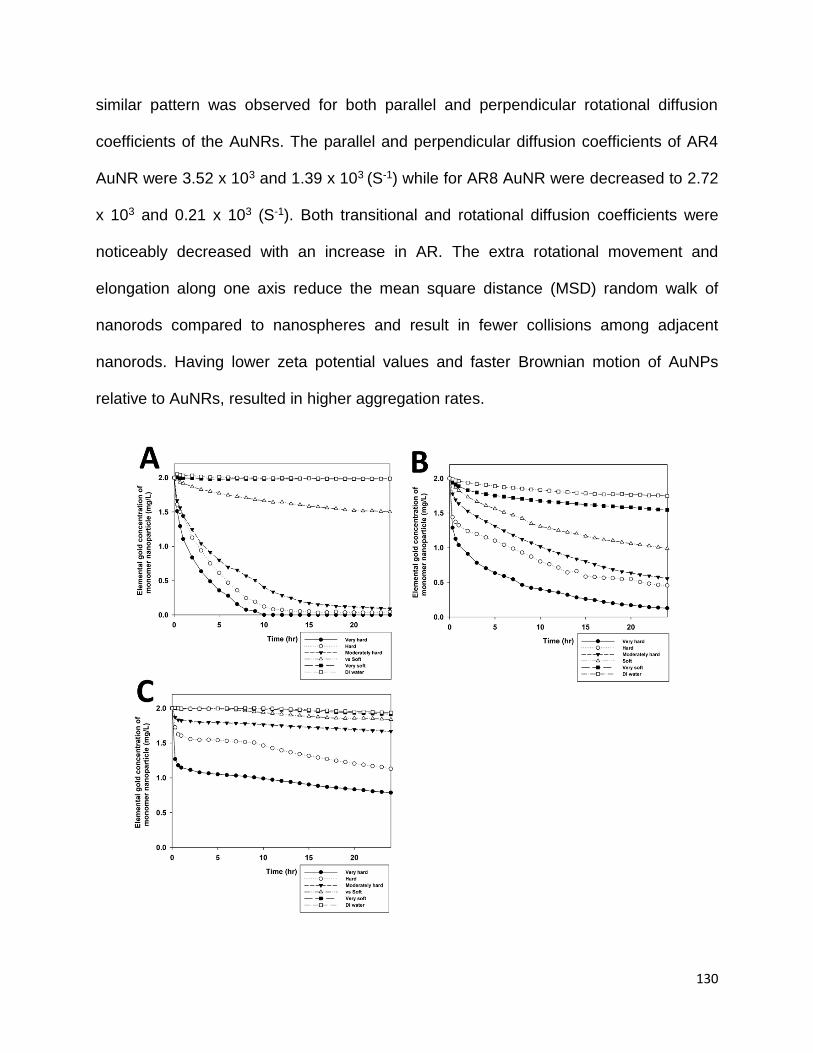
130
similar pattern was observed for both parallel and perpendicular rotational diffusion
coefficients of the AuNRs. The parallel and perpendicular diffusion coefficients of AR4
AuNR were 3.52 x 10³ and 1.39 x 10³ (S-1) while for AR8 AuNR were decreased to 2.72
x 103 and 0.21 x 10³ (S-1). Both transitional and rotational diffusion coefficients were
noticeably decreased with an increase in AR. The extra rotational movement and
elongation along one axis reduce the mean square distance (MSD) random walk of
nanorods compared to nanospheres and result in fewer collisions among adjacent
nanorods. Having lower zeta potential values and faster Brownian motion of AuNPs
relative to AuNRs, resulted in higher aggregation rates.
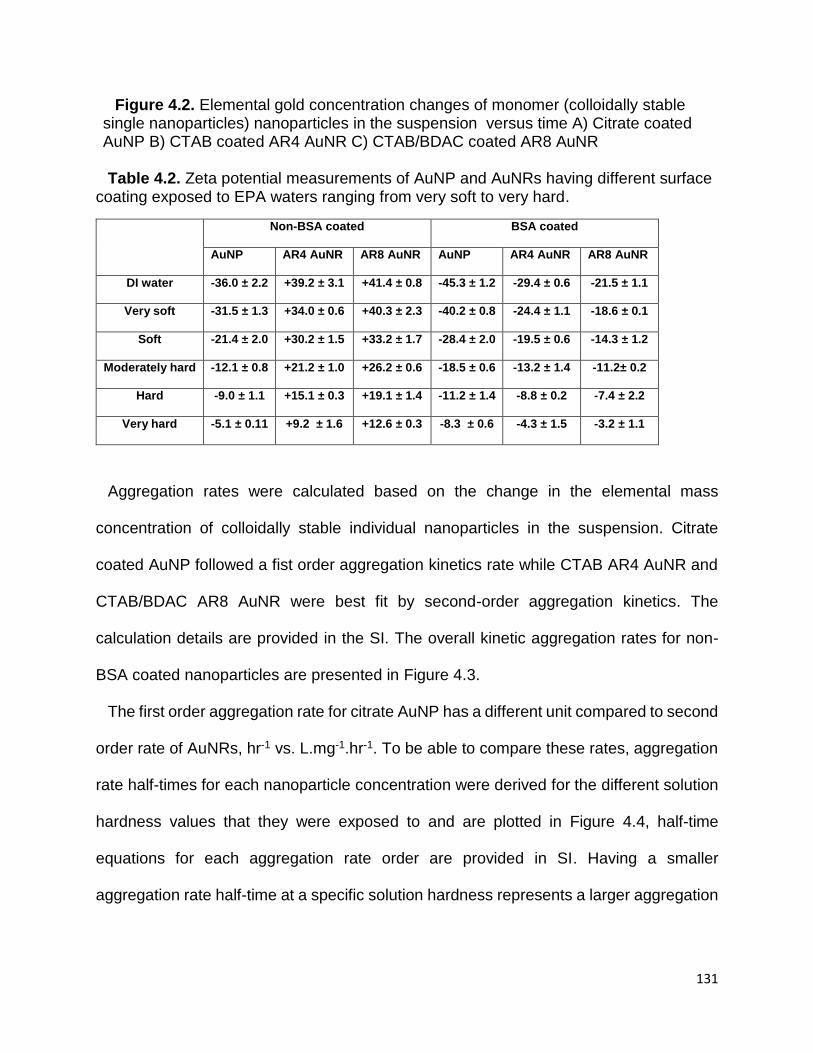
131
Figure 4.2. Elemental gold concentration changes of monomer (colloidally stable single nanoparticles) nanoparticles in the suspension versus time A) Citrate coated AuNP B) CTAB coated AR4 AuNR C) CTAB/BDAC coated AR8 AuNR
Table 4.2. Zeta potential measurements of AuNP and AuNRs having different surface
coating exposed to EPA waters ranging from very soft to very hard.
Non-BSA coated BSA coated
AuNP AR4 AuNR AR8 AuNR AuNP AR4 AuNR AR8 AuNR
DI water -36.0 ± 2.2 +39.2 ± 3.1 +41.4 ± 0.8 -45.3 ± 1.2 -29.4 ± 0.6 -21.5 ± 1.1
Very soft -31.5 ± 1.3 +34.0 ± 0.6 +40.3 ± 2.3 -40.2 ± 0.8 -24.4 ± 1.1 -18.6 ± 0.1
Soft -21.4 ± 2.0 +30.2 ± 1.5 +33.2 ± 1.7 -28.4 ± 2.0 -19.5 ± 0.6 -14.3 ± 1.2
Moderately hard -12.1 ± 0.8 +21.2 ± 1.0 +26.2 ± 0.6 -18.5 ± 0.6 -13.2 ± 1.4 -11.2± 0.2
Hard -9.0 ± 1.1 +15.1 ± 0.3 +19.1 ± 1.4 -11.2 ± 1.4 -8.8 ± 0.2 -7.4 ± 2.2
Very hard -5.1 ± 0.11 +9.2 ± 1.6 +12.6 ± 0.3 -8.3 ± 0.6 -4.3 ± 1.5 -3.2 ± 1.1
Aggregation rates were calculated based on the change in the elemental mass
concentration of colloidally stable individual nanoparticles in the suspension. Citrate
coated AuNP followed a fist order aggregation kinetics rate while CTAB AR4 AuNR and
CTAB/BDAC AR8 AuNR were best fit by second-order aggregation kinetics. The
calculation details are provided in the SI. The overall kinetic aggregation rates for non-
BSA coated nanoparticles are presented in Figure 4.3.
The first order aggregation rate for citrate AuNP has a different unit compared to second
order rate of AuNRs, hr-1 vs. L.mg-1.hr-1. To be able to compare these rates, aggregation
rate half-times for each nanoparticle concentration were derived for the different solution
hardness values that they were exposed to and are plotted in Figure 4.4, half-time
equations for each aggregation rate order are provided in SI. Having a smaller
aggregation rate half-time at a specific solution hardness represents a larger aggregation
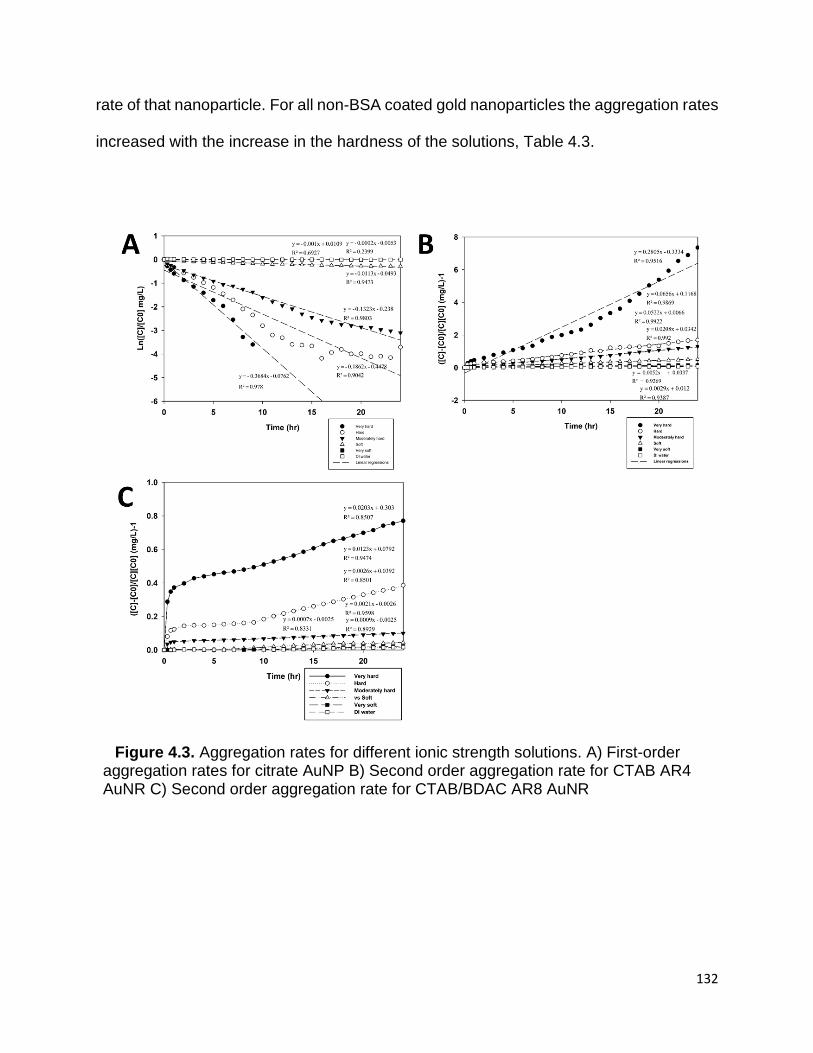
132
rate of that nanoparticle. For all non-BSA coated gold nanoparticles the aggregation rates
increased with the increase in the hardness of the solutions, Table 4.3.
Figure 4.3. Aggregation rates for different ionic strength solutions. A) First-order
aggregation rates for citrate AuNP B) Second order aggregation rate for CTAB AR4 AuNR C) Second order aggregation rate for CTAB/BDAC AR8 AuNR
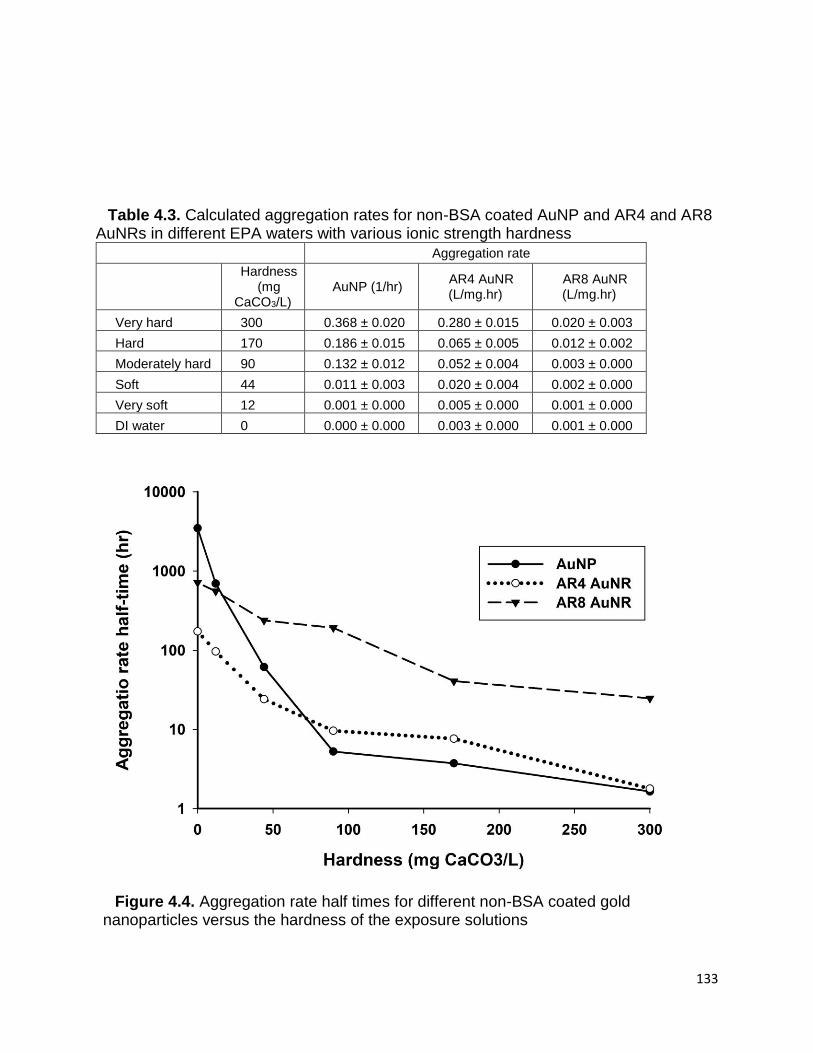
133
Table 4.3. Calculated aggregation rates for non-BSA coated AuNP and AR4 and AR8
AuNRs in different EPA waters with various ionic strength hardness
Aggregation rate
Hardness
(mg CaCO3/L)
AuNP (1/hr) AR4 AuNR (L/mg.hr)
AR8 AuNR (L/mg.hr)
Very hard 300 0.368 ± 0.020 0.280 ± 0.015 0.020 ± 0.003
Hard 170 0.186 ± 0.015 0.065 ± 0.005 0.012 ± 0.002
Moderately hard 90 0.132 ± 0.012 0.052 ± 0.004 0.003 ± 0.000
Soft 44 0.011 ± 0.003 0.020 ± 0.004 0.002 ± 0.000
Very soft 12 0.001 ± 0.000 0.005 ± 0.000 0.001 ± 0.000
DI water 0 0.000 ± 0.000 0.003 ± 0.000 0.001 ± 0.000
Figure 4.4. Aggregation rate half times for different non-BSA coated gold
nanoparticles versus the hardness of the exposure solutions
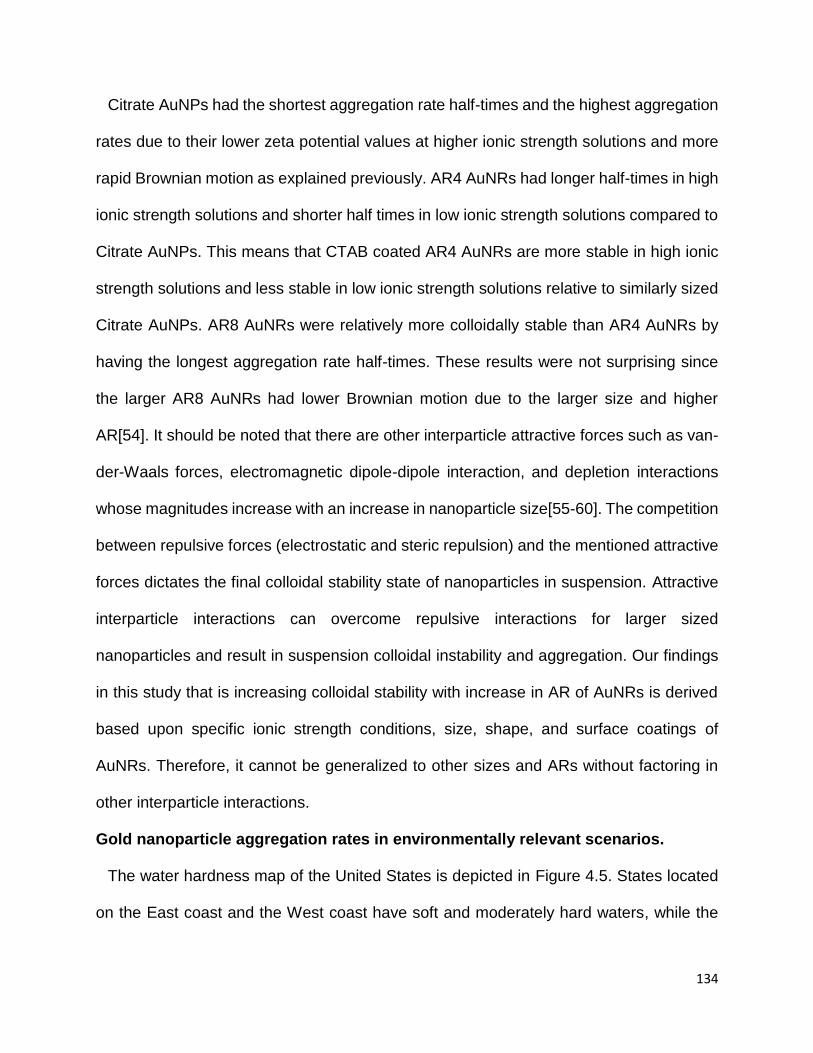
134
Citrate AuNPs had the shortest aggregation rate half-times and the highest aggregation
rates due to their lower zeta potential values at higher ionic strength solutions and more
rapid Brownian motion as explained previously. AR4 AuNRs had longer half-times in high
ionic strength solutions and shorter half times in low ionic strength solutions compared to
Citrate AuNPs. This means that CTAB coated AR4 AuNRs are more stable in high ionic
strength solutions and less stable in low ionic strength solutions relative to similarly sized
Citrate AuNPs. AR8 AuNRs were relatively more colloidally stable than AR4 AuNRs by
having the longest aggregation rate half-times. These results were not surprising since
the larger AR8 AuNRs had lower Brownian motion due to the larger size and higher
AR[54]. It should be noted that there are other interparticle attractive forces such as van-
der-Waals forces, electromagnetic dipole-dipole interaction, and depletion interactions
whose magnitudes increase with an increase in nanoparticle size[55-60]. The competition
between repulsive forces (electrostatic and steric repulsion) and the mentioned attractive
forces dictates the final colloidal stability state of nanoparticles in suspension. Attractive
interparticle interactions can overcome repulsive interactions for larger sized
nanoparticles and result in suspension colloidal instability and aggregation. Our findings
in this study that is increasing colloidal stability with increase in AR of AuNRs is derived
based upon specific ionic strength conditions, size, shape, and surface coatings of
AuNRs. Therefore, it cannot be generalized to other sizes and ARs without factoring in
other interparticle interactions.
Gold nanoparticle aggregation rates in environmentally relevant scenarios.
The water hardness map of the United States is depicted in Figure 4.5. States located
on the East coast and the West coast have soft and moderately hard waters, while the
135
states located on central united states have hard and very hard waters with a relatively
higher ionic strengths. The current study shows how the colloidal stability and aggregation
rates of these gold nanoparticles with different size, shape, and surface coatings can have
different environmental impacts depending on the exposure location in the US. In a same
exposure scenario model, gold nanoparticles released into the surface waters located on
east coast and west coast states stay colloidally stable for a longer period of time and can
distribute farther compared to the surface waters located on the central united states. The
current aggregation rate study can enhance the overall understanding and predicting
abilities during an environmental exposure fate, and transport modeling for these gold
nanoparticles.
Figure 4.5. Water hardness distribution in the USA
136
4.5 References
1. Rotello, V.M., Nanoparticles: building blocks for nanotechnology. 2004: Springer
Science & Business Media.
2. Topmiller, J.L. and K.H. Dunn, Current strategies for engineering controls in
nanomaterial production and downstream handling processes. 2013.
3. Cooper, S., Gold Nanoparticles Market Analysis by Application (Medical &
Dentistry, Electronics, Catalysis and Sensors & Probes) And Segment Forecasts
To 2020. December, 2014, Radiant Insights.
4. Kelly, K.L., et al., The optical properties of metal nanoparticles: the influence of
size, shape, and dielectric environment. The Journal of Physical Chemistry B,
2003. 107(3): p. 668-677.
5. Sosa, I.O., C. Noguez, and R.G. Barrera, Optical properties of metal
nanoparticles with arbitrary shapes. The Journal of Physical Chemistry B, 2003.
107(26): p. 6269-6275.
6. McConnell, W.P., et al., Electronic and optical properties of chemically modified
metal nanoparticles and molecularly bridged nanoparticle arrays. The Journal of
Physical Chemistry B, 2000. 104(38): p. 8925-8930.
7. Yu, Y.-Y., et al., Gold nanorods: electrochemical synthesis and optical properties.
The Journal of Physical Chemistry B, 1997. 101(34): p. 6661-6664.
8. Murphy, C.J., et al., Anisotropic metal nanoparticles: synthesis, assembly, and
optical applications. The Journal of Physical Chemistry B, 2005. 109(29): p.
13857-13870.
137
9. Willets, K.A. and R.P. Van Duyne, Localized surface plasmon resonance
spectroscopy and sensing. Annu. Rev. Phys. Chem., 2007. 58: p. 267-297.
10. Hornyak, G.L., C.J. Patrissi, and C.R. Martin, Fabrication, characterization, and
optical properties of gold nanoparticle/porous alumina composites: the
nonscattering Maxwell-Garnett limit. The Journal of Physical Chemistry B, 1997.
101(9): p. 1548-1555.
11. Link, S. and M.A. El-Sayed, Spectral properties and relaxation dynamics of
surface plasmon electronic oscillations in gold and silver nanodots and nanorods.
The Journal of Physical Chemistry B, 1999. 103(40): p. 8410-8426.
12. Kottmann, J.P., et al., Dramatic localized electromagnetic enhancement in
plasmon resonant nanowires. Chemical Physics Letters, 2001. 341(1): p. 1-6.
13. Imura, K., T. Nagahara, and H. Okamoto, Plasmon mode imaging of single gold
nanorods. Journal of the American Chemical Society, 2004. 126(40): p. 12730-
12731.
14. Elghanian, R., et al., Selective colorimetric detection of polynucleotides based on
the distance-dependent optical properties of gold nanoparticles. Science, 1997.
277(5329): p. 1078-1081.
15. Haiss, W., et al., Determination of size and concentration of gold nanoparticles
from UV-vis spectra. Analytical chemistry, 2007. 79(11): p. 4215-4221.
16. Liu, X., et al., Extinction coefficient of gold nanoparticles with different sizes and
different capping ligands. Colloids and Surfaces B: Biointerfaces, 2007. 58(1): p.
3-7.
138
17. Amendola, V. and M. Meneghetti, Size evaluation of gold nanoparticles by UV−
vis spectroscopy. The Journal of Physical Chemistry C, 2009. 113(11): p. 4277-
4285.
18. Gou, L. and C.J. Murphy, Fine-tuning the shape of gold nanorods. Chemistry of
materials, 2005. 17(14): p. 3668-3672.
19. Jana, N.R., L. Gearheart, and C.J. Murphy, Wet chemical synthesis of high
aspect ratio cylindrical gold nanorods. The Journal of Physical Chemistry B,
2001. 105(19): p. 4065-4067.
20. Pérez-Juste, J., et al., Gold nanorods: synthesis, characterization and
applications. Coordination Chemistry Reviews, 2005. 249(17): p. 1870-1901.
21. Prescott, S.W. and P. Mulvaney, Gold nanorod extinction spectra. Journal of
applied physics, 2006. 99(12): p. 123504.
22. Link, S., M. Mohamed, and M. El-Sayed, Simulation of the optical absorption
spectra of gold nanorods as a function of their aspect ratio and the effect of the
medium dielectric constant. The Journal of Physical Chemistry B, 1999. 103(16):
p. 3073-3077.
23. Eustis, S. and M.A. El-Sayed, Determination of the aspect ratio statistical
distribution of gold nanorods in solution from a theoretical fit of the observed
inhomogeneously broadened longitudinal plasmon resonance absorption
spectrum. Journal of applied physics, 2006. 100(4): p. 044324.
24. Kim, T., et al., Kinetics of gold nanoparticle aggregation: experiments and
modeling. Journal of colloid and interface science, 2008. 318(2): p. 238-243.
139
25. Petosa, A.R., et al., Aggregation and deposition of engineered nanomaterials in
aquatic environments: role of physicochemical interactions. Environmental
science & technology, 2010. 44(17): p. 6532-6549.
26. Abtahi, S., et al., Sulfate-Mediated End-to-End Assembly of Gold Nanorods.
Langmuir, 2017. 33(6): p. 1486-1495.
27. Zhou, D. and A.A. Keller, Role of morphology in the aggregation kinetics of ZnO
nanoparticles. Water research, 2010. 44(9): p. 2948-2956.
28. Afrooz, A.N., et al., Spheres vs. rods: The shape of gold nanoparticles influences
aggregation and deposition behavior. Chemosphere, 2013. 91(1): p. 93-98.
29. Gao, J., C.M. Bender, and C.J. Murphy, Dependence of the gold nanorod aspect
ratio on the nature of the directing surfactant in aqueous solution. Langmuir,
2003. 19(21): p. 9065-9070.
30. Nikoobakht, B. and M.A. El-Sayed, Preparation and growth mechanism of gold
nanorods (NRs) using seed-mediated growth method. Chemistry of Materials,
2003. 15(10): p. 1957-1962.
31. Smith, D.K. and B.A. Korgel, The importance of the CTAB surfactant on the
colloidal seed-mediated synthesis of gold nanorods. Langmuir, 2008. 24(3): p.
644-649.
32. Nikoobakht, B. and M.A. El-Sayed, Evidence for bilayer assembly of cationic
surfactants on the surface of gold nanorods. Langmuir, 2001. 17(20): p. 6368-
6374.
140
33. Turkevich, J., P.C. Stevenson, and J. Hillier, A study of the nucleation and growth
processes in the synthesis of colloidal gold. Discussions of the Faraday Society,
1951. 11: p. 55-75.
34. Murphy, C.J., et al., Gold nanorod crystal growth: from seed-mediated synthesis
to nanoscale sculpting. Current Opinion in Colloid & Interface Science, 2011.
16(2): p. 128-134.
35. Nikoobakht, B. and M.A. El-Sayed, Preparation and growth mechanism of gold
nanorods (NRs) using seed-mediated growth method. Chem. Mater, 2003.
15(10): p. 1957-1962.
36. Tebbe, M., et al., Colloidally stable and surfactant-free protein-coated gold
nanorods in biological media. ACS applied materials & interfaces, 2015. 7(10): p.
5984-5991.
37. Lawson, C.L. and R.J. Hanson, Solving least squares problems. Vol. 15. 1995:
Siam.
38. Park, S., N. Sinha, and K. Hamad-Schifferli, Effective size and zeta potential of
nanorods by Ferguson analysis. Langmuir, 2010. 26(16): p. 13071-13075.
39. Ohshima, H., Henry's function for electrophoresis of a cylindrical colloidal
particle. Journal of colloid and interface science, 1996. 180(1): p. 299-301.
40. Stankus, D.P., et al., Interactions between natural organic matter and gold
nanoparticles stabilized with different organic capping agents. Environmental
science & technology, 2010. 45(8): p. 3238-3244.
141
41. Baalousha, M., et al., Effect of monovalent and divalent cations, anions and fulvic
acid on aggregation of citrate-coated silver nanoparticles. Science of the Total
Environment, 2013. 454: p. 119-131.
42. Lee, B.-T. and J.F. Ranville, The effect of hardness on the stability of citrate-
stabilized gold nanoparticles and their uptake by Daphnia magna. Journal of
hazardous materials, 2012. 213: p. 434-439.
43. Pfeiffer, C., et al., Interaction of colloidal nanoparticles with their local
environment: the (ionic) nanoenvironment around nanoparticles is different from
bulk and determines the physico-chemical properties of the nanoparticles.
Journal of The Royal Society Interface, 2014. 11(96): p. 20130931.
44. Stover, R.J., et al., Formation of small gold nanoparticle chains with high NIR
extinction through bridging with calcium ions. Langmuir, 2016. 32(4): p. 1127-
1138.
45. Wang, H., et al., Effects of monovalent and divalent metal cations on the
aggregation and suspension of Fe3O4 magnetic nanoparticles in aqueous
solution. Science of the Total Environment, 2017. 586: p. 817-826.
46. Zhang, X., et al., Potential of mean force between like-charged nanoparticles:
Many-body effect. Scientific reports, 2016. 6: p. 23434.
47. Afrooz, A.N., et al., Mechanistic heteroaggregation of gold nanoparticles in a
wide range of solution chemistry. Environmental science & technology, 2013.
47(4): p. 1853-1860.
48. Hotze, E.M., T. Phenrat, and G.V. Lowry, Nanoparticle Aggregation: Challenges
to Understanding Transport and Reactivity in the Environment All rights reserved.
142
No part of this periodical may be reproduced or transmitted in any form or by any
means, electronic or mechanical, including photocopying, recording, or any
information storage and retrieval system, without permission in writing from the
publisher. Journal of environmental quality, 2010. 39(6): p. 1909-1924.
49. Nghiem, T.H.L., et al., Synthesis, capping and binding of colloidal gold
nanoparticles to proteins. Advances in Natural Sciences: nanoscience and
nanotechnology, 2010. 1(2): p. 025009.
50. Dominguez-Medina, S., et al., Adsorption of a protein monolayer via hydrophobic
interactions prevents nanoparticle aggregation under harsh environmental
conditions. ACS sustainable chemistry & engineering, 2013. 1(7): p. 833-842.
51. Sperling, R.A. and W.J. Parak, Surface modification, functionalization and
bioconjugation of colloidal inorganic nanoparticles. Philosophical Transactions of
the Royal Society of London A: Mathematical, Physical and Engineering
Sciences, 2010. 368(1915): p. 1333-1383.
52. Sapsford, K.E., et al., Functionalizing nanoparticles with biological molecules:
developing chemistries that facilitate nanotechnology. Chemical reviews, 2013.
113(3): p. 1904-2074.
53. Xiao, L., et al., Imaging translational and rotational diffusion of single anisotropic
nanoparticles with planar illumination microscopy. Journal of the American
Chemical Society, 2011. 133(27): p. 10638-10645.
54. Glidden, M. and M. Muschol, Characterizing gold nanorods in solution using
depolarized dynamic light scattering. The Journal of Physical Chemistry C, 2012.
116(14): p. 8128-8137.
143
55. Rance, G.A., et al., Van der Waals interactions between nanotubes and
nanoparticles for controlled assembly of composite nanostructures. ACS nano,
2010. 4(8): p. 4920-4928.
56. Parsegian, V.A., Van der Waals forces: a handbook for biologists, chemists,
engineers, and physicists. 2005: Cambridge University Press.
57. Gobre, V.V. and A. Tkatchenko, Scaling laws for van der Waals interactions in
nanostructured materials. Nature communications, 2013. 4: p. 2341.
58. Min, Y., et al., The role of interparticle and external forces in nanoparticle
assembly. Nature materials, 2008. 7(7): p. 527.
59. Tavares, F.W., et al., Ion-Specific Effects in the Colloid− Colloid or Protein−
Protein Potential of Mean Force: Role of Salt− Macroion van der Waals
Interactions. The Journal of Physical Chemistry B, 2004. 108(26): p. 9228-9235.
60. Klimov, V. and A. Lambrecht, Van der Waals forces between plasmonic
nanoparticles. Plasmonics, 2009. 4(1): p. 31-36.
144
4.6 Supporting Information
Size, Shape, and Surface Coating Impacts on the Colloidal
Stability and Aggregation Rate of Gold Nanoparticles in
Aquatic Matrices
S.M.H. Abtahi1, 2, 3, 4, Catherine J. Murphy5, Navid B. Saleh6, and P. J. Vikesland1, 2, 3, 4
1. Virginia Polytechnic Institute and State University, Department of Civil and
Environmental Engineering, Blacksburg, Virginia, USA
2. Virginia Polytechnic Institute and State University, Institute for Critical
Technology and Applied Science (ICTAS), Blacksburg, Virginia, USA
3. Virginia Polytechnic Institute and State University, Center for Sustainable
Nanotechnology (VT SuN), Blacksburg, Virginia, USA
4. Center for the Environmental Implications of Nanotechnology (CEINT),
USA
5. University of Illinois at Urbana-Champaign, Department of Chemistry,
Champaign, Illinois, USA.
6. The University of Texas at Austin, Department of Civil, Architectural, and
Environmental Engineering, Austin, Texas, USA

145
Table 4.S1. Chemical speciation, and chemical specifications of EPA standard waters
Reagent Added mg/L Approximate Final Water Quality
NaHCO3 CaSO4+2H2O MgSO4 KCl pH Hardness2 Alkalinity2
18.9 MΩ (nanopure water) 0.00 0.00 0.00 0.00
Very Soft 12.0 7.5 7.5 0.5 6.4 - 6.8 10 - 13 10 - 13
Soft 48.0 30.0 30.0 2.0 7.2 - 7.6 40 - 18 30 - 35
Moderately Hard 96.0 60.0 60.0 4.0 7.4 - 7.8 80 - 100 57 - 64
Hard 192.0 120.0 120.0 8.0 7.6 - 8.0 160 - 180 110 - 120
Very Hard 384.0 240.0 240.0 16.0 8.0 - 8.4 280 - 320 225 - 245
1Taken in part from Marking and Dawson (1973).
2Expressed as mg CaCO3/L.

146
Figure 4.S1. TEM images of synthesized A-B) 19 nm citrate AuNPs C-D) CTAB AR4 AuNRs E-F) CTAB/BDAC AR8 AuNRs
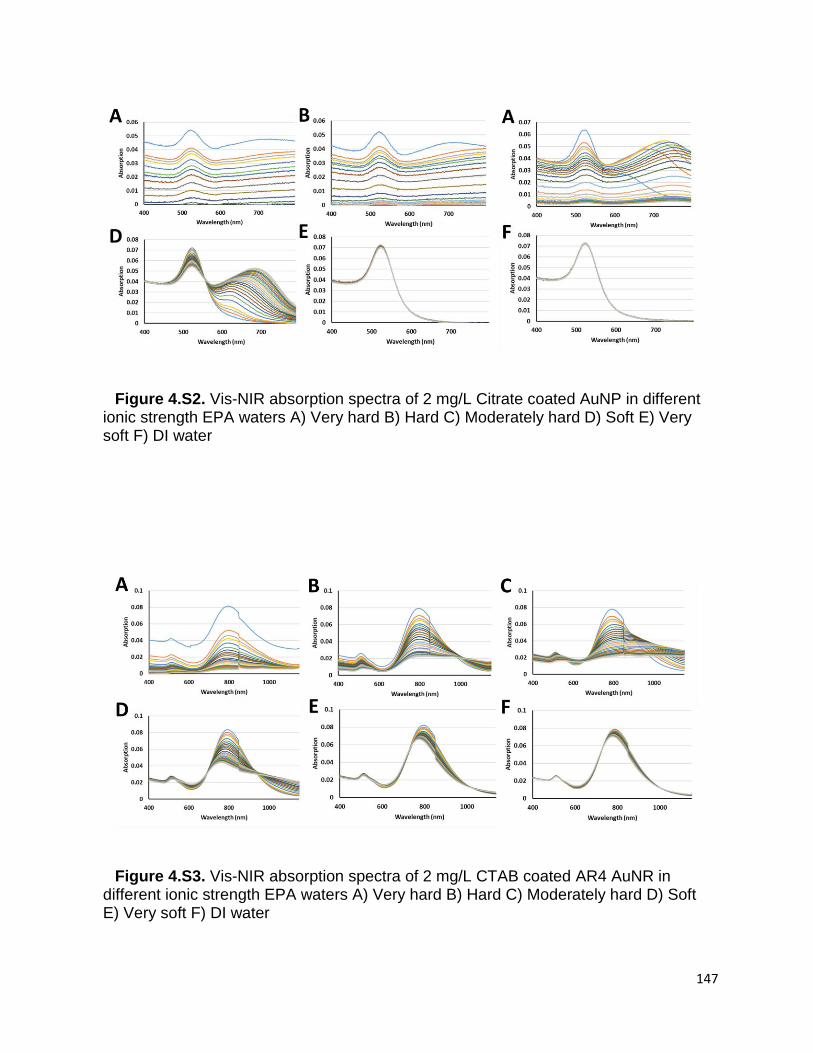
147
Figure 4.S2. Vis-NIR absorption spectra of 2 mg/L Citrate coated AuNP in different ionic strength EPA waters A) Very hard B) Hard C) Moderately hard D) Soft E) Very soft F) DI water
Figure 4.S3. Vis-NIR absorption spectra of 2 mg/L CTAB coated AR4 AuNR in different ionic strength EPA waters A) Very hard B) Hard C) Moderately hard D) Soft E) Very soft F) DI water

148
Figure 4.S4. Vis-NIR absorption spectra of 2 mg/L CTAB/BDAC coated AR8 AuNR in different ionic strength EPA waters A) Very hard B) Hard C) Moderately hard D) Soft E) Very soft F) DI water
Figure 4.S5. Elemental gold concentration changes of monomer (colloidally stable single nanoparticles) BSA coated nanoparticles in the suspension versus time A) AuNP B) AR4 AuNR C) AR8 AuNR

149
Henry equation
𝑈𝐸 =2𝜀𝜁𝑓(𝜅𝑎)
3𝜂
𝑈𝐸: Electrophoretic mobility 𝜀: Dielectric constant 𝜁: Zeta potential 𝑓(𝜅𝑎): Henry’s constant 𝜂: Viscosity 𝑎: Radius of particle 1
𝜅⁄ : Double layer thickness
Ohshima’s correction to Henry’s constant
𝜅 = (2𝐼𝑒2
𝜀0𝜀𝑟𝑘𝐵𝑇)
12⁄
𝜀0: Permittivity of vacuum 𝜀𝑟: Relative static permittivity of solution 𝐼: Ionic strength of solution
𝑒: Charge of an electron 𝑘𝐵: Boltz − mann constant 𝑇: Temperature
For spherical particles:
1)5.2
1(2
11)(
kakaf
For cylindrical particles:
2)))exp(1(
55.21(
2
11)(
kakakaf
Examples for Henry’s constant calculations
Synthesized AR4 AuNRs have cylindrical shape with 42.1 nm length and 11.2 nm diameter. Equivolume sphere will be 19.93 nm. All calculation and measurements occurred at 20°C and DI water was the solvent.
𝑎 = 9.96 𝑛𝑚
Very hard EPA water; 𝐼 = 1.51 × 10⁻² 𝑚𝑜𝑙𝑙𝑖𝑡⁄ ; 𝜅 = 4.0 × 10⁸ 1 𝑚⁄ ; 𝜅𝑎 = 39.87
𝑓(𝑘𝑎) = 1.41
Very soft EPA water; 𝐼 = 4.69 × 10⁻⁴ 𝑚𝑜𝑙𝑙𝑖𝑡⁄ ; 𝜅 = 7.1 × 10⁷ 1 𝑚⁄ ; 𝜅𝑎 = 7.07
𝑓(𝑘𝑎) = 1.15
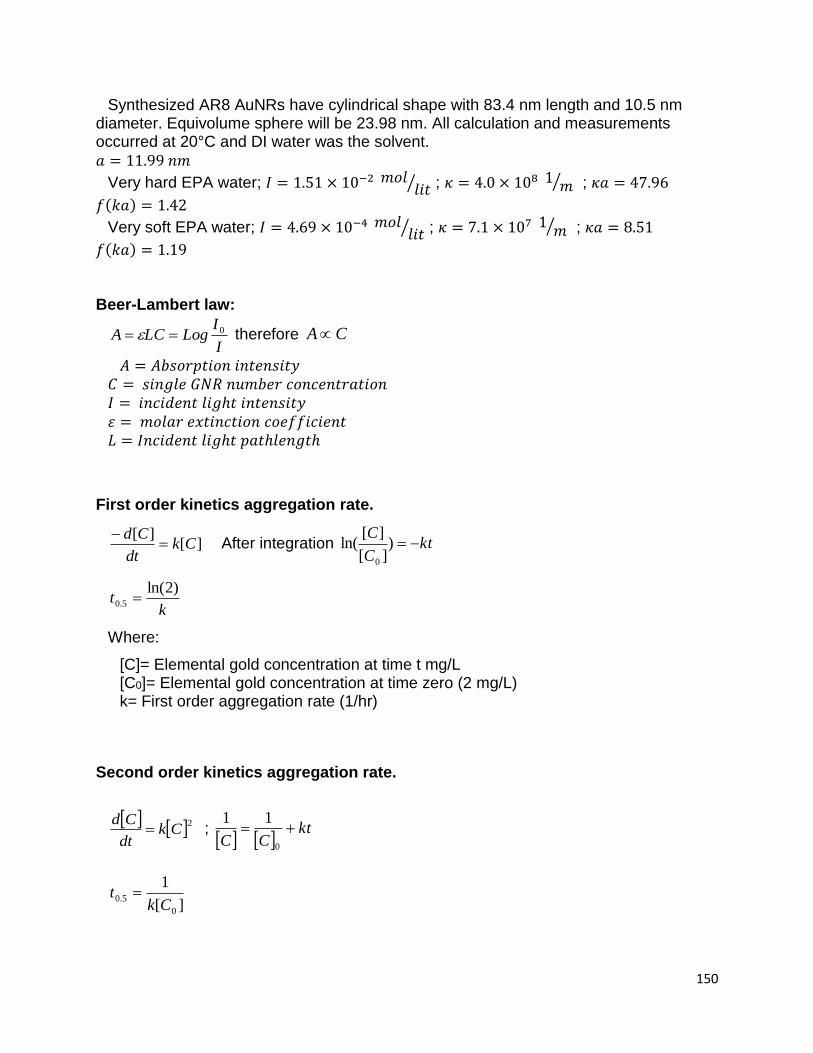
150
Synthesized AR8 AuNRs have cylindrical shape with 83.4 nm length and 10.5 nm diameter. Equivolume sphere will be 23.98 nm. All calculation and measurements occurred at 20°C and DI water was the solvent.
𝑎 = 11.99 𝑛𝑚
Very hard EPA water; 𝐼 = 1.51 × 10⁻² 𝑚𝑜𝑙𝑙𝑖𝑡⁄ ; 𝜅 = 4.0 × 10⁸ 1 𝑚⁄ ; 𝜅𝑎 = 47.96
𝑓(𝑘𝑎) = 1.42
Very soft EPA water; 𝐼 = 4.69 × 10⁻⁴ 𝑚𝑜𝑙𝑙𝑖𝑡⁄ ; 𝜅 = 7.1 × 10⁷ 1 𝑚⁄ ; 𝜅𝑎 = 8.51
𝑓(𝑘𝑎) = 1.19 Beer-Lambert law:
I
ILogLCA 0 therefore CA
𝐴 = 𝐴𝑏𝑠𝑜𝑟𝑝𝑡𝑖𝑜𝑛 𝑖𝑛𝑡𝑒𝑛𝑠𝑖𝑡𝑦 𝐶 = 𝑠𝑖𝑛𝑔𝑙𝑒 𝐺𝑁𝑅 𝑛𝑢𝑚𝑏𝑒𝑟 𝑐𝑜𝑛𝑐𝑒𝑛𝑡𝑟𝑎𝑡𝑖𝑜𝑛 𝐼 = 𝑖𝑛𝑐𝑖𝑑𝑒𝑛𝑡 𝑙𝑖𝑔ℎ𝑡 𝑖𝑛𝑡𝑒𝑛𝑠𝑖𝑡𝑦
𝜀 = 𝑚𝑜𝑙𝑎𝑟 𝑒𝑥𝑡𝑖𝑛𝑐𝑡𝑖𝑜𝑛 𝑐𝑜𝑒𝑓𝑓𝑖𝑐𝑖𝑒𝑛𝑡 𝐿 = 𝐼𝑛𝑐𝑖𝑑𝑒𝑛𝑡 𝑙𝑖𝑔ℎ𝑡 𝑝𝑎𝑡ℎ𝑙𝑒𝑛𝑔𝑡ℎ
First order kinetics aggregation rate.
][][
Ckdt
Cd
After integration kt
C
C)
][
][ln(
0
kt
)2ln(5.0
Where:
[C]= Elemental gold concentration at time t mg/L [C0]= Elemental gold concentration at time zero (2 mg/L) k= First order aggregation rate (1/hr)
Second order kinetics aggregation rate.
2Ck
dt
Cd ;
kt
CC
0
11
][
1
0
5.0Ck
t
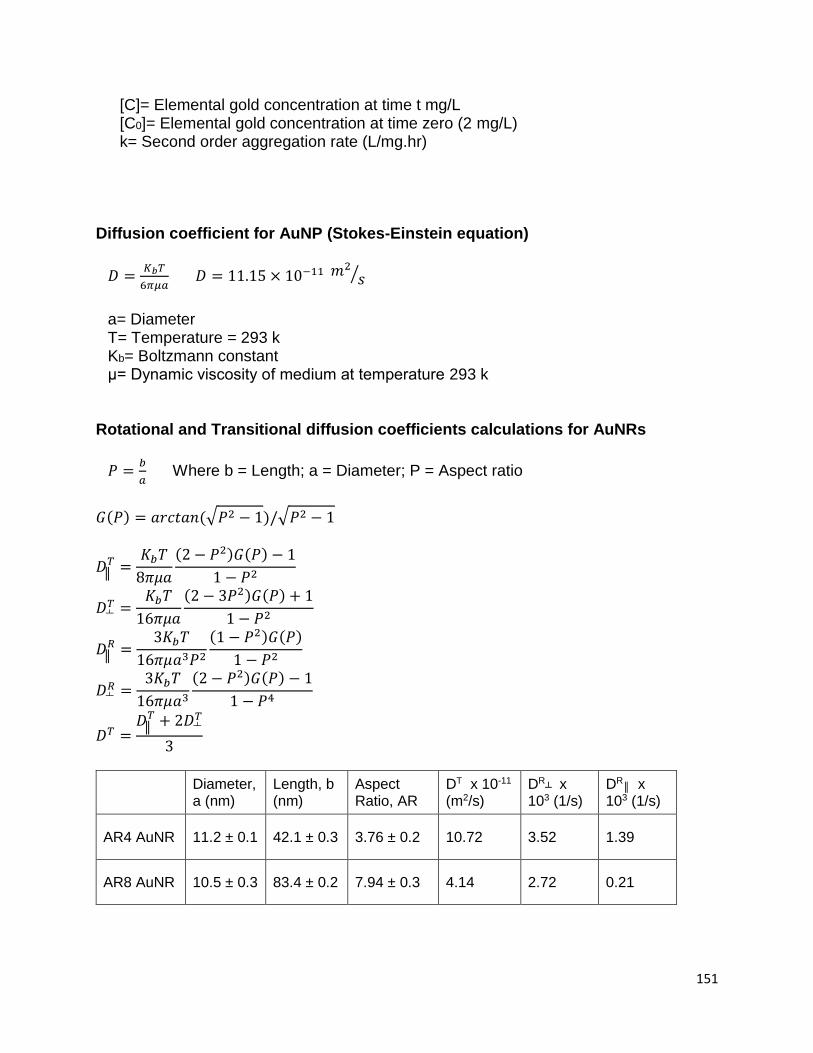
151
[C]= Elemental gold concentration at time t mg/L [C0]= Elemental gold concentration at time zero (2 mg/L) k= Second order aggregation rate (L/mg.hr)
Diffusion coefficient for AuNP (Stokes-Einstein equation)
𝐷 =𝐾𝑏𝑇
6𝜋𝜇𝑎 𝐷 = 11.15 × 10⁻¹¹ 𝑚
2
𝑠⁄
a= Diameter T= Temperature = 293 k Kb= Boltzmann constant μ= Dynamic viscosity of medium at temperature 293 k
Rotational and Transitional diffusion coefficients calculations for AuNRs
𝑃 =𝑏
𝑎 Where b = Length; a = Diameter; P = Aspect ratio
𝐺(𝑃) = 𝑎𝑟𝑐𝑡𝑎𝑛(√𝑃2 − 1)/√𝑃2 − 1
𝐷𝑇 =
𝐾𝑏𝑇
8𝜋𝜇𝑎
(2 − 𝑃2)𝐺(𝑃) − 1
1 − 𝑃2
𝐷𝑇 =
𝐾𝑏𝑇
16𝜋𝜇𝑎
(2 − 3𝑃2)𝐺(𝑃) + 1
1 − 𝑃2
𝐷𝑅 =
3𝐾𝑏𝑇
16𝜋𝜇𝑎3𝑃2
(1 − 𝑃2)𝐺(𝑃)
1 − 𝑃2
𝐷𝑅 =
3𝐾𝑏𝑇
16𝜋𝜇𝑎3
(2 − 𝑃2)𝐺(𝑃) − 1
1 − 𝑃4
𝐷𝑇 =𝐷𝑇 + 2𝐷
𝑇
3
Diameter, a (nm)
Length, b (nm)
Aspect Ratio, AR
DT x 10-11 (m2/s)
DR x
103 (1/s) DR
x 103 (1/s)
AR4 AuNR 11.2 ± 0.1 42.1 ± 0.3 3.76 ± 0.2 10.72 3.52 1.39
AR8 AuNR 10.5 ± 0.3 83.4 ± 0.2 7.94 ± 0.3 4.14 2.72 0.21
153
Chapter 5. Environmental Implications and Future Work
5.1 Environmental implications
Given their stability in high ionic strength aquatic solutions, surface-functionalized gold
nanoparticles can be a persistent aquatic nano-contaminent. Anisotropic gold
nanoparticles such gold nanorods (AuNRs) are commonly tested and used in variety of
applications due to their unique optical properties Environmental fate and transport of
engineered nanomaterials (ENMs) has been broadly investigated and evaluated in the
published research studies[1-7]. Nevertheless, majority of current researches focus on
spherical shaped nanoparticles not considering the shape factor effects[2, 6-9]. The
important objective of this study was to investigate the effects of nanoparticle
anisotropicity and surface coating on the overall fate, transportation, deposition, and
organismal uptake in aquatic matrices. To achieve this goal, we developed well-
characterized stock suspensions of AuNPs and AuNRs with aspect ratios ranging from 1
to 8 having various surface coatings. The gold nanoparticles were characterized by
complimentary characterization techniques such as Vis-NIR spectroscopy, transmission
electron microscopy (TEM), dynamic light scattering (DLS), electrophoretic mobility
measurements, and Inductively coupled plasmon mass spectrometry (ICP-MS).
At first, the colloidal stability and aggregation kinetic rates of these nanoparticles in
environmentally relevant ionic strength solutions were studied and the results are
reported in Chapter 4. In this chapter, we particularly focused on how the aggregation
rate of elongated nanoparticles changed with altering the aspect ratio and surface coating
of nanoparticles in EPA fresh waters. We found out that for citrate coated AuNP, CTAB
154
coated AR4 AuNR, and CTAB/BDAC coated AR8 AuNR the colloidal stabilities were
reduced with an increase in ionic strength. Aggregation rates were evaluated using both
first and second order kinetic rate equations. Moreover, the changes in aggregation rate
versus solution hardness were derived for each type of gold nanoparticle. The collected
results were consistent with electrolyte mediated double layer compression. For BSA
coated gold nanoparticles of different shapes where the steric repulsion was strong,
colloidal stability was not hindered by ionic strength of the solution and no aggregation
was observed.
As the next step, the role and significance of individual monovalent and divalent ions in
the solution on the kinetic aggregation rates and structural composition of aggregates
were investigated. Our observations and findings are summarized in chapter 3. In brief,
a simple one step mechanism to produce chain like end-to-end assemblies of CTAB
coated AuNRs was introduced. We proposed that sulfate as a divalent anion effectively
interacted with the quaternary ammonium head group of CTAB on the AuNR surface and
bridged the tip facets of adjacent rods. The length of assembly were controlled by sulfate
ion concentration, AuNR concentration, and exposure time. In contrast to end-to-end
assembly, side-by-side and end-to-side assemblies were hindered by strong electrostatic
repulsion between the dense CTAB bilayers present on the side facets. Our simple DLVO
model supported the observed assembly trend. Furthermore, we showed that by
analyzing the UV-Vis extinction spectrum and knowing the absorption band of each order
of assembly that we could separately track the formation and growth of these assemblies
over time.
155
At last we studied the shape characteristics and properties that govern the uptake and
nanotoxicity of AuNPs and AuNRs to a model organism, C. fluminea. The presented
results in chapter 2 indicate that the organismal uptake rate increased with increasing
nanoparticle size and anisotropicity. Gold nanoparticles were readily detected in the
digestive glands, gills, (pseudo)feces, and on top of the shells after exposure. The
presence of nanoparticles in non-digestive tissues showed that the nanoparticles were
internalized and consumed by clams. The toxicity results indicated that for the tested
concentration and exposure period that gold nanoparticles were not acutely toxic (i.e., not
lethal). However, gold nanoparticles significantly inhibited the activities of some
antioxidant enzymes in gill and digestive gland tissues. These inhibitions could directly
affect the resistance of these organisms to a secondary stressor (temperature,
pathogens, hypoxia etc.) and threaten organismal health.
5.2 Summary and future work
In the current study we showed how shape-related characteristics of gold nanomaterials
such as aspect ratio can affect their overall colloidal stability, fate, and organismal
interaction in environmentally relevant aquatic matrices. We showed how the existing
characterization techniques could be effectively utilized to monitor the colloidal behavior
and fate of these elongated nanomaterials.
Prospects for future research in general can include the following:
- Studies on aggregation mechanism and governing parameters of gold
nanomaterials should be expanded to hetroaggregation (deposition) since in this study
we mainly focused on homoaggregation of these nanomaterials.
156
- Although the gold nanomaterials used in the current study were not found acutely
toxic to test organism (C. fluminea) in a short-term exposure time, further studies are
important to investigate the long-term exposure toxicity of elongated nanomaterials.
5.3 References
1. Lin, D., et al., Fate and transport of engineered nanomaterials in the environment.
Journal of Environmental Quality, 2010. 39(6): p. 1896-1908.
2. Praetorius, A., M. Scheringer, and K. Hungerbuhler, Development of
Environmental Fate Models for Engineered Nanoparticles: A Case Study of TiO2
Nanoparticles in the Rhine River. Environmental science & technology, 2012. 46(12):
p. 6705-6713.
3. Lowry, G.V., et al., Environmental occurrences, behavior, fate, and ecological
effects of nanomaterials: an introduction to the special series. Journal of environmental
quality, 2010. 39(6): p. 1867-1874.
4. Cornelis, G., et al., Fate and bioavailability of engineered nanoparticles in soils: a
review. Critical Reviews in Environmental Science and Technology, 2014. 44(24): p.
2720-2764.
5. Dale, A.L., et al., Modeling nanomaterial environmental fate in aquatic systems.
Environmental science & technology, 2015. 49(5): p. 2587-2593.
6. Lowry, G.V., et al., Long-term transformation and fate of manufactured Ag
nanoparticles in a simulated large scale freshwater emergent wetland. Environmental
science & technology, 2012. 46(13): p. 7027-7036.

157
7. Gottschalk, F., et al., Modeled environmental concentrations of engineered
nanomaterials (TiO2, ZnO, Ag, CNT, fullerenes) for different regions. Environmental
science & technology, 2009. 43(24): p. 9216-9222.
8. Aiken, G.R., H. Hsu-Kim, and J.N. Ryan, Influence of dissolved organic matter on
the environmental fate of metals, nanoparticles, and colloids. Environmental science &
technology, 2011. 45(8): p. 3196-3201.
9. Hoecke, K.V., et al., Fate and effects of CeO2 nanoparticles in aquatic ecotoxicity
tests. Environmental science & technology, 2009. 43(12): p. 4537-4546.

158
Appendix A. Plasmonic Colorimetric and SERS
Sensors for Environmental Analysis
Haoran Wei abc, Seyyed M. Hossein Abtahi abc and Peter J. Vikesland *abc
aDepartment of Civil and Environmental Engineering, Virginia Tech, Blacksburg, Virginia, USA.
E-mail: [email protected]; Tel: (540) 231 3568
bVirginia Tech Institute of Critical Technology and Applied Science (ICTAS) Sustainable
Nanotechnology Center (VTSuN), Blacksburg, Virginia, USA
cCenter for the Environmental Implications of Nanotechnology (CEINT), Duke University,
Durham, North Carolina, USA
Received 22nd December 2014 , Accepted 9th March 2015
First published on 10th March 2015
The potential for water pollution outbreaks requires the development of rapid, yet simple
detection methods for water quality monitoring. Plasmonic nanostructures such as gold
(AuNPs) and silver (AgNPs) nanoparticles are compelling candidates for the development
of highly sensitive biosensors due to their unique localized surface plasmon resonances
(LSPRs). The LSPR of AuNPs and AgNPs lies in the visible and infrared light range and
is sensitive to the composition, size, shape, surrounding medium, and aggregation state
of these NPs. This plasmonic behavior provides the basis for fabrication of colorimetric
sensors for environmental analyses. Furthermore, the LSPR also enhances the
electromagnetic field near the NP surface, which provides the basis for surface-enhanced
Raman spectroscopy (SERS) based detection. Organic or inorganic pollutants and
159
pathogens can be detected and differentiated based upon the finger-print spectra that
arise when they enter SERS-active hot spots. In this tutorial review, we summarize
progress made towards environmental analysis based on LSPR-based colorimetric and
SERS detection. The problems and challenges that have hindered the development of
LSPR-based nanosensors for real-world environmental pollutant monitoring are
extensively discussed.
Haoran Wei
Haoran Wei received a MS (July 2013) in Environmental
Engineering from Tsinghua University after receiving his BS
(June 2010) in Environmental Engineering from Shandong
University. He is currently a Ph.D. candidate in Civil and
Environmental Engineering at Virginia Tech. His research
interests are in the development of nanotechnology-based
biosensors for detection of waterborne pathogens or
contaminants.
160
Seyyed M. Hossein Abtahi
Seyyed Mohammad Hossein Abtahi received a second MS
(December 2013) in Chemical Engineering from Virginia
Tech after receiving his first MS (June 2008) and BS (June
2006) in Chemical Engineering from Sharif University of
Technology. He is currently a Ph.D. candidate in Civil and
Environmental Engineering at Virginia Tech. His research
interests are to assess the colloidal stability, fate, transport,
and organismal uptake of anisotropic nanomaterials in
aquatic matrices.
Peter J. Vikesland
Peter J. Vikesland is a Professor of Civil and
Environmental Engineering at Virginia Tech. He received
his BA (1993) in Chemistry from Grinnell College and
obtained his MS (1995) and Ph.D. (1998) in Civil and
Environmental Engineering from the University of Iowa.
After completing a postdoctoral fellowship at Johns
Hopkins University he joined the faculty at Virginia Tech in
2002. Vikesland is a NSF CAREER awardee and currently
serves as the Co-Director of the Virginia Tech ICTAS
Sustainable Nanotechnology Center and the Director of
the Virginia Tech Interdisciplinary Graduate Education
Program. His research group is interested in the
development of nanotechnology-based approaches for the
protection of water and air.

161
Nano impact
The localized surface plasmon resonance (LSPR) of gold (AuNP) and silver
nanoparticles (AgNP) enables rapid identification and detection of environmental
pollutants. Using a LSPR-based colorimetric assay it is possible to detect contaminants
either visually or via spectroscopic approaches. For even greater sensitivity, LSPR
enabled surface-enhanced Raman spectroscopy (SERS) makes single molecule or
single pathogen detection achievable.
A1.1. Introduction
One notorious side effect of global development is the ever-increasing number of gaseous
and aqueous pollutants that pose ecosystem and human-health risks. Rapid pollutant
recognition is vitally important in some emergent situations. For example, in the 2014 Elk
River, WV incident in excess of 7500 gallons of 4-methylcyclohexanemethanol (4-MCHM)
rapidly leaked into the Elk River such that the drinking water distribution system for the
greater Charleston, WV area was heavily contaminated.1Similarly, in the summer of 2014
a massive algal bloom led to closure of the Toledo, OH drinking water treatment plant
due to the contamination of the water by microcystin toxins.2 In addition to outbreaks
caused by chemicals, outbreaks of waterborne pathogens are also problematic. For
example, the 1993 Milwaukee Cryptosporidium outbreak in drinking water caused 104
deaths in only two weeks.3 In November 2010, Cryptosporidium infected ≈27 000 people
in Östersund, Sweden viacontaminated drinking water, and in December 2012 an

162
outbreak of waterborne norovirus caused acute gastrointestinal illness in a district
containing 368 families in Denmark.4,5 In addition to waterborne contaminants, airborne
contaminants, such as dioxins from garbage incineration plants or potentially pandemic
bird flu, also threaten people's health.6,7
To prevent contaminants from causing environmental catastrophes it would be ideal to
detect such contamination events as quickly as possible in order to rapidly initiate
remedial strategies. Unfortunately, the most commonly used detection methods for water
and airborne contaminants such as gas/liquid chromatography-mass spectrometry,
inductively coupled plasma mass spectroscopy, and quantitative polymerase chain
reaction, although very sensitive and quantitative, require either laborious sample
preparation procedures or onerous analysis methods and are thus very time-consuming.
Besides, they all require expensive instruments and high level of expertise and thus
cannot be conducted on site. Plasmonic nanostructures such as gold and silver
nanoparticles (AuNPs and AgNPs) provide a promising avenue for the development of
rapid, cost-effective and highly sensitive sensor platforms, which also exhibit the potential
for onsite detection.8 Many of the sensing capabilities enabled by AuNPs and AgNPs rely
upon localized surface plasmon resonance (LSPR). When excited by light of a specific
wavelength, the conduction electrons on the nanoparticle surface collectively oscillate
and generate a significantly enhanced electromagnetic field or LSPR.8–10 LSPR is an
extremely sensitive optical transducer, which is dependent on the type, size, shape and
aggregation state of plasmonic nanoparticles as well as the refractive index of the
surrounding environment.11–13 Changes in the LSPR result in color changes of the colloid

163
suspension. Based on this phenomenon, LSPR-based colorimetric sensors have been
developed.14–16
When the incident light wavelength is coupled with the LSPR of plasmonic NPs the
electromagnetic field near the NP surface is significantly enhanced.17,18 When analytes
closely associate with the NP surface, their Raman scattering cross-section increases
substantially and this phenomenon is the basis for surface-enhanced Raman scattering
(SERS).18 SERS is an ultrasensitive sensing technique that has been shown to enable
the detection of single molecules.19–22 Compared with fluorescent techniques, SERS has
greater potential for multiplex analysis due to the narrower peak widths in the collected
Raman spectra. Because SERS is a vibrational spectroscopy method it provides chemical
bonding information that facilitates differentiation of highly similar molecules and different
molecular orientations.23,24 Unlike other environmental analysis techniques such as
inductively coupled plasmon atomic emission spectroscopy and gas chromatography-
mass spectroscopy, SERS does not require complex sample pretreatment, sophisticated
analytical method optimization, or advanced analyst training. During the last decade, the
rapid development of nanotechnology has created a number of novel nanostructures that
have the potential for ultrasensitive SERS detection of environmental contaminants.25–27
Ultrasensitive chemical analysis via SERS was reviewed in the late 1990s, with the focus
on the mechanisms responsible for “single molecule detection”.28,29 Subsequently, many
review papers have appeared that describe the fundamental theories, material fabrication
methods, and applications of SERS.17,18,21,30–36 Reviews on colorimetric sensors that
monitor the LSPR band location have also been produced.37–39 However, relatively few
of these reviews focus explicitly on environmental applications of LSPR based sensing.
164
A number of recent reviews discuss nanomaterial-based sensors for environmental
monitoring.40–45However, these reviews covered either a broad suite of nanoparticles and
sensing techniques or focused exclusively on SERS-based sensors. Herein we focus on
the application of AuNPs and AgNPs for environmental sensing via either colorimetric or
SERS approaches because these two related methods dominate much of the current
literature. Readers interested in SPR sensors based on refractive index sensing are
referred elsewhere.46–48 This review is organized into five parts (including this
introduction). The second part briefly introduces the photonic behavior responsible for
LSPR-based colorimetric and SERS sensors. The third and fourth parts summarize
recent progress in environmental analysis with colorimetric and SERS sensors,
respectively. In the SERS portion of the review, we focus on organic pollutants,
biomolecules, and pathogen detection. For SERS detection of inorganic analytes the
reader is referred elsewhere.49 The concluding part of this tutorial review discusses the
extant challenges associated with ultimate application of these sensors in environmental
samples.
A1.2. Background on photonics
Colloidal gold and silver nanoparticles exhibit intense colors due to a phenomenon known
as surface plasmon resonance.12,50–52This phenomenon occurs when conduction band
electrons undergo coherent oscillations following excitation by an electromagnetic field.
The interaction between the electric field of the incoming light and NPs with dimension
smaller than the incident wavelength causes polarization of the electrons in the
nanoparticle relative to its heavier ionic core.53 This net charge difference is confined to
the nanoparticle surface and acts as a restoring force that causes the collective oscillation
165
of the surface electrons (i.e., a surface plasmon).53 The frequency at which these surface
plasmons oscillate is known as the LSPR.
The LSPR bands for gold and silver are within the visible portion of the electromagnetic
spectrum. For example, the LSPR of spherical 50 nm gold nanoparticles is at ≈530 nm,
which falls into the green light range (495–570 nm). Accordingly, green light is absorbed
and red light is transmitted thus causing suspensions of this size AuNP to exhibit red
colors under visible light excitation. Similarly, the LSPR of spherical 50 nm silver
nanoparticles is at ≈430 nm, which falls in the violet light range, leading suspensions of
this size AgNP to exhibit green colors.12,52 The exact location of the LSPR band is highly
dependent on the identity, size, shape, and aggregation state of the noble metal
nanoparticle, and the chemistry of the suspension medium.12,50Increases in size result in
red-shifts (an absorption peak shift to a longer wavelength), while changes in shape result
in more complicated effects. For example, the peak LSPR wavelength of 100 nm edge-
length silver triangles is approximately 100 nm larger than that for 100 nm silver
pentagons (pentagon length is defined as the distance between opposite corners), which
is in turn 100 nm greater than that of 50 nm diameter silver spheres (Figure.
1).12 Asymmetric gold nanorods exhibit two LSPR bands – one that corresponds to the
longitudinal direction and the other the transverse direction of the rods.54,55
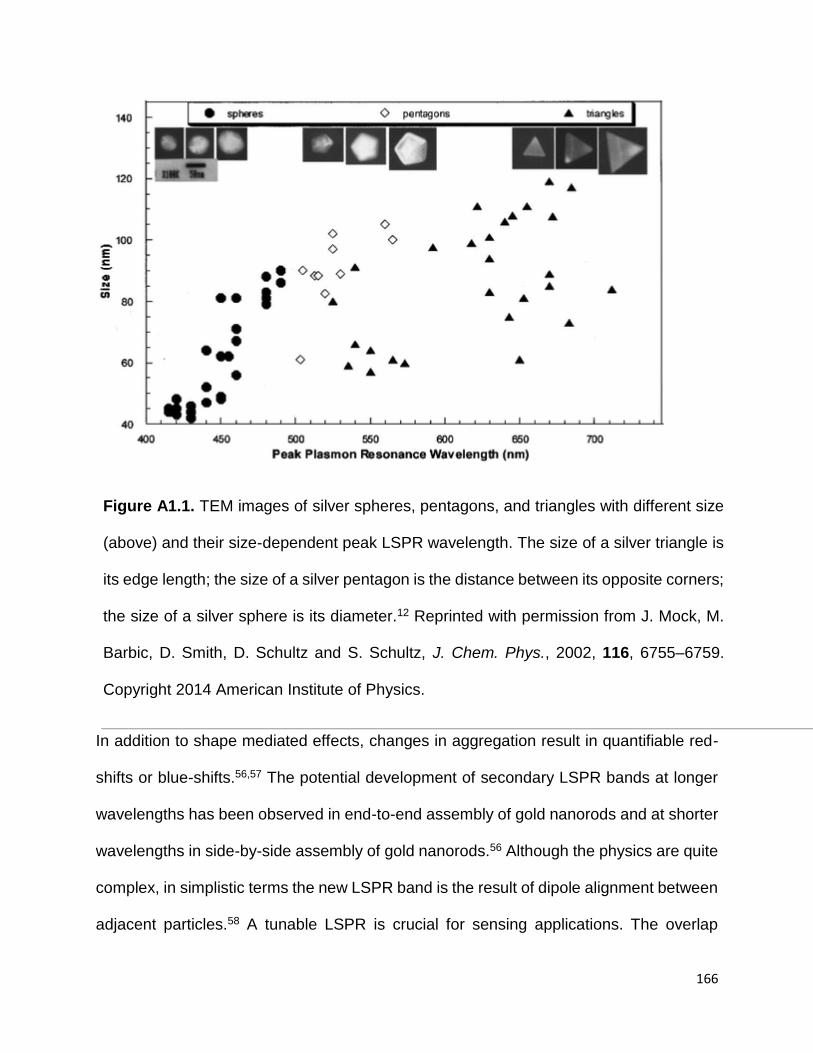
166
Figure A1.1. TEM images of silver spheres, pentagons, and triangles with different size
(above) and their size-dependent peak LSPR wavelength. The size of a silver triangle is
its edge length; the size of a silver pentagon is the distance between its opposite corners;
the size of a silver sphere is its diameter.12 Reprinted with permission from J. Mock, M.
Barbic, D. Smith, D. Schultz and S. Schultz, J. Chem. Phys., 2002, 116, 6755–6759.
Copyright 2014 American Institute of Physics.
In addition to shape mediated effects, changes in aggregation result in quantifiable red-
shifts or blue-shifts.56,57 The potential development of secondary LSPR bands at longer
wavelengths has been observed in end-to-end assembly of gold nanorods and at shorter
wavelengths in side-by-side assembly of gold nanorods.56 Although the physics are quite
complex, in simplistic terms the new LSPR band is the result of dipole alignment between
adjacent particles.58 A tunable LSPR is crucial for sensing applications. The overlap

167
between laser wavelength and the LSPR peak results in high SERS enhancement
factors, which will be discussed later.17 Changes in the LSPR band location can also elicit
quantifiable color changes. Using 50 nm AuNPs as an example, aggregation results in
the development of a new red-shifted peak at about 700 nm that falls in the red light
range. Therefore, red light will be absorbed, while blue light will be scattered and the
suspension color changes to blue. Because this color change is distinct and can be easily
measured, it has been found to be highly useful for analyte detection.14,38,59 A broad range
of analytes have been detected solely on the basis of this color change.15,59–61
Surface-enhanced Raman scattering (SERS) is another phenomenon that arises due to
LSPR. A schematic illustrating the basic working principle of SERS is shown in Figure. 2.
Raman scattering is the inelastic scattering of photons by the vibrational chemical bonds
of a molecule. The Raman spectrum is unique for each molecule due to the different
vibrational modes present within it. Unfortunately, the Raman scattering signal is at most
10−7 of the total scattering, which makes it challenging to use Raman to detect low
concentration analytes. When a molecule is adsorbed on AuNPs or AgNPs, its Raman
cross section can be enhanced by several orders of magnitude due to SERS. Two primary
mechanisms are responsible for SERS: electromagnetic and chemical. The former refers
to the enhanced electromagnetic field near the nanoparticle surface, which is a long-
range mechanism.62Long-range enhancements occur at greater distances away from the
nanoparticle surface whose edge is schematically shown by the dotted red circle
in Figure. 2. As shown in Figure. 2, analyte molecules located within the dotted red circle
(position 2 and 3) exhibit clear Raman spectra, while analytes located outside the dotted
red circle (position 1) exhibit no detectable Raman signal. For example, the SERS signal
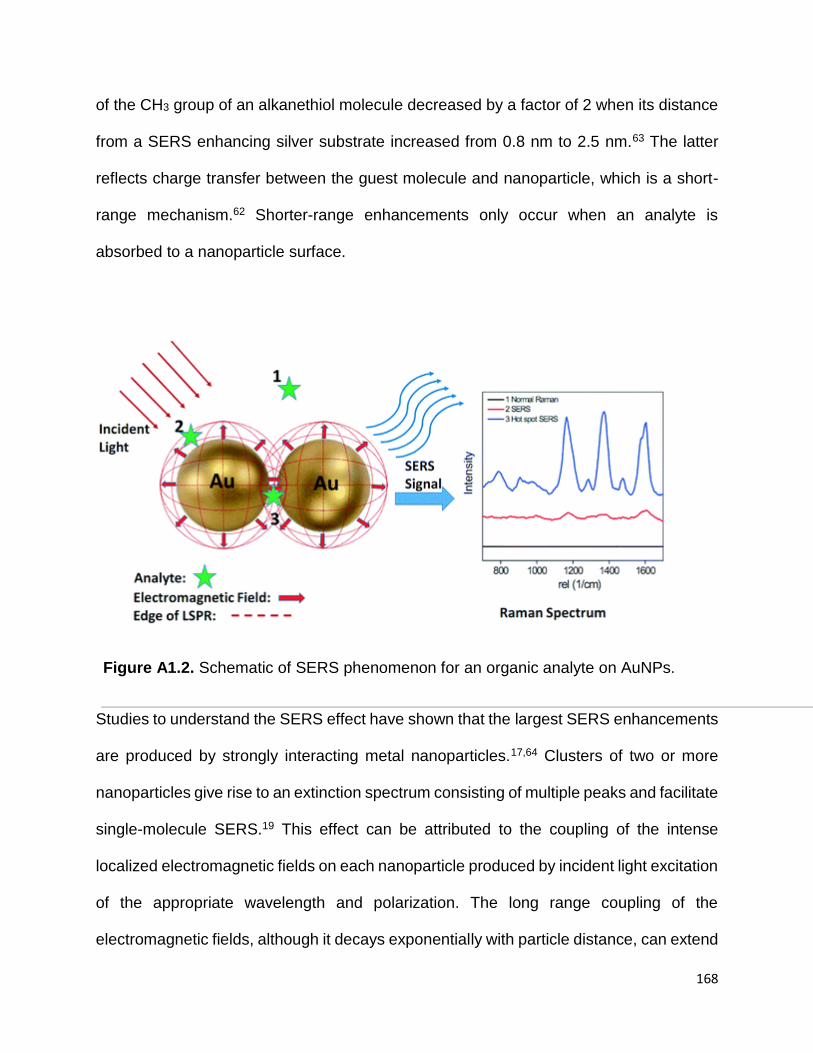
168
of the CH3 group of an alkanethiol molecule decreased by a factor of 2 when its distance
from a SERS enhancing silver substrate increased from 0.8 nm to 2.5 nm.63 The latter
reflects charge transfer between the guest molecule and nanoparticle, which is a short-
range mechanism.62 Shorter-range enhancements only occur when an analyte is
absorbed to a nanoparticle surface.
Figure A1.2. Schematic of SERS phenomenon for an organic analyte on AuNPs.
Studies to understand the SERS effect have shown that the largest SERS enhancements
are produced by strongly interacting metal nanoparticles.17,64 Clusters of two or more
nanoparticles give rise to an extinction spectrum consisting of multiple peaks and facilitate
single-molecule SERS.19 This effect can be attributed to the coupling of the intense
localized electromagnetic fields on each nanoparticle produced by incident light excitation
of the appropriate wavelength and polarization. The long range coupling of the
electromagnetic fields, although it decays exponentially with particle distance, can extend
169
to a distance of 2.5× the nanoparticle diameter.64,65 It is generally thought that significant
Raman enhancements primarily occur within gaps smaller than 10 nm although the exact
distance is still a topic of debate.66–68 These localized areas are often referred to as
'hotspots' (Figure. 2).69 As shown in Figure. 2, analyte molecules located within the hot
spot (position 3) exhibit a much stronger Raman signal than those located on an AuNP
monomer surface (position 2). In addition to the gap between two adjacent nanoparticles,
the sharp corners and tips of anisotropic plasmonic nanoparticles such as nanorods,
nanoprisms, and nanostars produce another type of SERS “hot spot”.70,71 A recent study
demonstrated that isolated single gold nanorods can generate strong SERS signals that
approach those obtained in the gap between spherical particles.72 Because of the
importance of hot spots for SERS application, a substantial body of research has focused
on the creation and maximization of the number and location of SERS hot spots.73–76
Other than SERS hot spots, several additional factors significantly influence SERS, such
as nanoparticle type, shape, size, solution pH and so on.77–83 AgNPs can generate
stronger SERS intensities than AuNPs because the extinction coefficient of AgNPs can
be 4× larger than AuNPs of the same size and shape.84,85 Anisotropic plasmonic
nanoparticles show multiple LSPR modes and are suitable for use under different laser
lines.86–88 For example, gold nanostars (40 nm) show a second LSPR peak at 730 nm,
while gold nanospheres (40 nm) show only one peak at 530 nm. Therefore, when excited
by a 785 nm laser, the SERS intensity of gold nanostars is 2–3 orders of magnitude higher
than that of gold nanospheres.89 The size of a nanoparticle affects its LSPR, which
determines its SERS intensity as well. A recent study shows even under random
aggregation conditions, nanoparticle size still plays an important role in the Raman signal.
170
With 785 nm laser excitation, AuNPs with size between 46–74 nm showed the strongest
Raman signal. It has been shown that for elongated shape gold nanoparticles such as
rods that the aspect ratio (length/diameter) is an important factor. Results suggest that
enhancement can be two orders of magnitude greater when the plasmon band of the gold
nanorod overlaps with the excitation wavelength.90 These results indicate that it is
necessary to carefully choose nanoparticle size according to the excitation laser
wavelength.91 Solution pH influences analyte adsorption to the NP surface and can
subsequently influence its SERS signal.77 For example, diclofenac sodium only exhibited
a clear SERS spectrum under acidic and neutral pH conditions and not under alkaline pH
conditions due to electrostatic repulsion between its carboxylic group and the citrate-
coated AgNP surface.92
Organic chemical detection is comparatively easy to achieve because small molecules
can readily enter SERS hot spots. Pathogens, however, such as bacteria and viruses,
are too large to enter SERS hot spots thus resulting in several orders of magnitude lower
Raman enhancement factors. To circumvent this problem, a SERS tag is often
employed.31,93 A SERS tag includes a recognition element, Raman reporter, and a signal
transducer.45 AuNPs and AgNPs are most commonly used signal transducers, while dyes
with large Raman cross-sections are used as Raman reporters. Specific antibodies or
aptamers against the target pathogens are used as recognition elements. Generally, a
protection layer is needed for the Raman reporter modified nanoparticle to prevent the
leakage of Raman reporter and improve the stability of the nanoparticle.
171
A1.3. Colorimetric detection
Perhaps the most convenient mechanism for a rapid, field-deployable contaminant
detection assay would be to observe color changes with our naked eye. Because the
LSPRs of gold and silver colloids fall within the visible spectrum, color changes that occur
due to changes in aggregation state have been exploited for colorimetric sensor
fabrication. Colorimetric sensing of DNA using functionalized AuNPs was pioneered by
Mirkin et al.94 In that study, two batches of 13 nm AuNPs were functionalized with two
non-complementary oligonucleotides and were then combined. After the addition of a
target DNA duplex with two “sticky ends” (complementary to the oligonucleotides on each
type of AuNP), the suspension color changed from red to purple due to DNA hybridization
induced AuNP aggregation.94 Both the oligonucleotide modification position and the
AuNP size greatly influenced probe sensitivity. When the two batches of AuNPs were
modified with 5′-oligonucleotide and 3′-oligonucleotide, respectively, single base
imperfections could be detected.59 Importantly, larger AuNPs (50 nm, 100 nm) were found
to be more sensitive than smaller AuNPs (13 nm) because of their larger extinction
coefficients.95 In addition to oligonucleotide-gold nanoparticle (OGN) conjugates,
oligonucleotide-silver nanoparticle (OSN) conjugates were also used as DNA probes.
Because of the larger extinction coefficients of AgNPs compared with AuNPs, the
detection limit for target DNA by the OSNs was 50× lower than with the OGNs.96
Aggregation induced by oligonucleotide hybridization is one example of a cross-linked
colorimetric sensor. Similar sensor designs have been applied for detection of a range of
biomolecules, heavy metal ions, and pathogens.97 When the target directly binds to a
recognition element on the nanoparticle surface, it induces aggregation and, in the e of
172
AuNPs, a red to blue color change. Alternatively, the target can induce dissociation of
nanoparticle aggregates by competitively binding to the linker between nanoparticles.
Under these conditions a blue to red color change is expected. For example, an aptamer-
linked gold nanoparticle aggregate was developed for adenosine detection. Aptamers are
single oligonucleotide strands of DNA or RNA that can bind pathogens, molecules, or
even ions with high affinity and specificity.98 Adenosine addition resulted in dissociation
of the aptamer-linked aggregates due to its competitive binding to the aptamer linker
between the two AuNPs. Following addition of adenosine, the suspension color changed
from purple to red indicating the transformation from AuNP aggregates to monomers. This
result was further indicated by the blue shift of the LSPR band in the UV–VIS spectrum
from 700 to 522 nm.99 A similar protocol was successfully applied for the fabrication of a
cocaine sensor with a detection limit of 50–500 μM.61 Recently this protocol was extended
to development of a “smart hydrogel” sensor, where dissociation of the cross-linked
hydrogel following addition of target resulted in the release of AuNPs to the solution and
a change in color.100
In a non cross-linked detection protocol there is no hybridization between different
gold/silver nanoparticles. In this e, aggregation/dissociation of the nanoparticles is
achieved by decreasing/increasing the concentration of stabilizer on the nanoparticle
surface. For example, an ultrasensitive colorimetric DNA probe (1 pM detection limit by
eye) was developed by using a polyelectrolyte that forms conjugates with single stranded
DNA. Following polyelectrolyte addition, AuNPs stabilized with single stranded DNA
aggregated due to preferential binding between the aptamer and the polyelectrolyte, while
AuNPs stabilized with target double stranded DNA remained stable.15

173
The detection protocols described above have been used for heavy metal detection due
to their capacity to form strong complexes with chelators and other recognition agents. In
this manner, a sensitive and selective probe for Hg2+ was fabricated by modifying the 13
nm AuNP surface with mercaptopropionic acid (MPA). Hg2+ forms complexes with the
carboxylate groups of MPA and induces AuNP aggregation. After addition of 2,6-
pyridinedicarboxylic acid (PDCA) into the probe suspension, the selectivity for
Hg2+ relative to other heavy metals was significantly improved. This result was attributed
to the 100× higher complexation coefficient of PDCA for Hg2+ than for other heavy metals.
The combined method enabled quantitative detection of Hg2+ over a concentration range
of 250–500 nM with a limit of detection of 100 nM.60 In addition to using toxic organic
compounds as recognition elements, urine can also be used for Hg2+ sensing. The uric
acid and creatinine in urine can synergistically bind to AuNPs as well as selectively adsorb
Hg2+. In addition to the low cost sensor fabrication, a low detection limit of 50 nM was
achieved in this manner.16 It has been shown that Zn2+ and Cu2+ can be detected using
agglomeration and the resulting suspension color change of 20 nm chitosan-capped gold
nanoparticles.101 Chitosan is a well-known chelating agent for heavy metals and the
presence of Zn2+ and Cu2+ can cause colloidal instability and loose aggregation
(agglomeration) of gold nanoparticles. This phenomenon causes a rapid color change
that is directly related to the heavy metal concentration. Pb2+ with a tunable detection limit
of 100 nM to 200 μM has been detected following an aggregation-dissociation protocol.
The DNAzyme-directed assembly of gold nanoparticles cleaves in the presence of
Pb2+ and results in a blue to red color change (Figure. 3A).

174
Figure A1.3 A) DNAzyme-directed assembly formation and cleavage of gold
nanoparticles in a Pb+ colorimetric sensor;102 Reprinted with permission from J. Liu and
Y. Lu, J. Am. Chem. Soc., 2003, 125, 6642–6643. Copyright 2014 American Chemical
Society. B) Schematic of the Griess reaction and Griess reaction induced aggregation
of AuNPs.14 Reprinted with permission from W. L. Daniel, M. S. Han, J. S. Lee and C.
A. Mirkin, J. Am. Chem. Soc., 2009, 131, 6362–6363. Copyright 2014 American
Chemical Society.
175
Nitrate and nitrite ions are two regulated contaminants in drinking water. A simple
colorimetric method was developed for their detection based upon the Griess reaction
(Figure. 3B). As shown in Figure. 3B, two batches of AuNPs were functionalized with 5-
[1,2]dithiolan-3-yl-pentazoic acid [2-(4-amino-phenyl)ethyl]amide (DPAA) and 5-
[1,2]dithiolan-3-yl-pentazoic acid [2-(naphthalene-1-ylamino)ethyl]amide, respectively.
Following nitrite ion addition, the amino group and naphthalene group were linked via an
azide linkage, which then resulted in AuNP aggregation and the fading of the suspension
color. The color change threshold could be controlled by adjusting the incubation time
and temperature to meet the EPA standard (1 ppm for nitrite ion). The same procedure
was applied for nitrate detection after the nitrate ions were reduced to nitrite by nitrate
reductase. The specificity of this probe is high enough that it is not affected by the
presence of other inorganic ions (F−, SO42−, HCO3
−, etc.) even when their concentrations
are two orders of magnitude larger than that of nitrite.14
A majority of the plasmonic nanoparticle based colorimetric detection methods rely upon
crosslinking. However, non-crosslinking methods are also sometimes employed. A
homogeneous method for the selective detection of Hg2+ and Ag+ using Tween 20-
modified AuNPs has been developed. Citrate-capped AuNPs were modified with Tween
20. In the presence of silver and mercury ions, citrate ions reduce Hg2+ and Ag+ to form
Hg0 and Ag0 on the surface of the AuNPs. This phenomenon was followed by Tween 20
removal from the NP surface and aggregation of AuNPs. The detection limit can be as
low as 0.1 μM in the presence of NaCl and EDTA.103 In another study, a sensor for
quantitative detection and differentiation of two nitroamine explosives – hexahydro-1,3,5-
trinitro-1,3,5-triazine (RDX) and octahydro-1,3,5,7-tetranitro-1,3,5,7-tetrazocine (HMX)
176
was developed.104 In this sensor, nitrite hydrolyzed from RDX and HMX reacted with 4-
aminothiolphenol on AuNPs to form an azo dye with naphthylene diamine. Dye formation
changed the LSPR of the AuNPs because of a charge-transfer interaction on the AuNP
surface. The absence of a second LSPR peak indicated the color change was not due to
AuNP aggregation, but instead due to dye formation. AuNPs improved the sensitivity of
the probe, but the mechanism responsible for this behavior was not clearly elucidated.
Some special detection protocols have also been used for heavy metal ion detection.
Cr6+ can selectively etch the tips of gold nanorods (AuNRs) due to its strong oxidation
state. Shortening of the nanorod induces a blue shift in its longitudinal LSPR band and a
corresponding color change. Using this approach a detection limit of 90 nM was
obtained.105 This method does not require aggregation or dissociation of nanoparticles
and as such it can be described as a non-aggregation method. Cu2+ can also etch the
tips of AuNRs in the presence of HBr. In this e, Au0 was oxidized to Au+ and Cu2+ was
reduced to Cu+, which was subsequently oxidized to Cu2+ by dissolved oxygen (Figure.
4A). The presence of cetyltrimethylammonium bromide (CTAB) was key to this redox
reaction because it reduced the redox potential of Au+/Au0 from 0.93 V to less than 0.2 V.
The decrease in aspect ratio due to etching resulted in a blue shift of the LSPR band and
a color change from blue to red (Figure. 4A). With this method, 50 nM Cu2+ was detected
by the naked eye and 0.5 nM Cu2+ was detectable by UV–VIS.106 A similar protocol was
applied for Hg2+ detection. In the presence of ascorbic acid, Hg2+ was reduced to Hg0 and
deposited on AuNRs, which induced a color change from purple to blue green. The
detection limit of Hg2+ was 800 pM. The Hg0–AuNR can subsequently be used as a
S2− sensor because S2− can exfoliate Hg0 from the AuNR surface.107
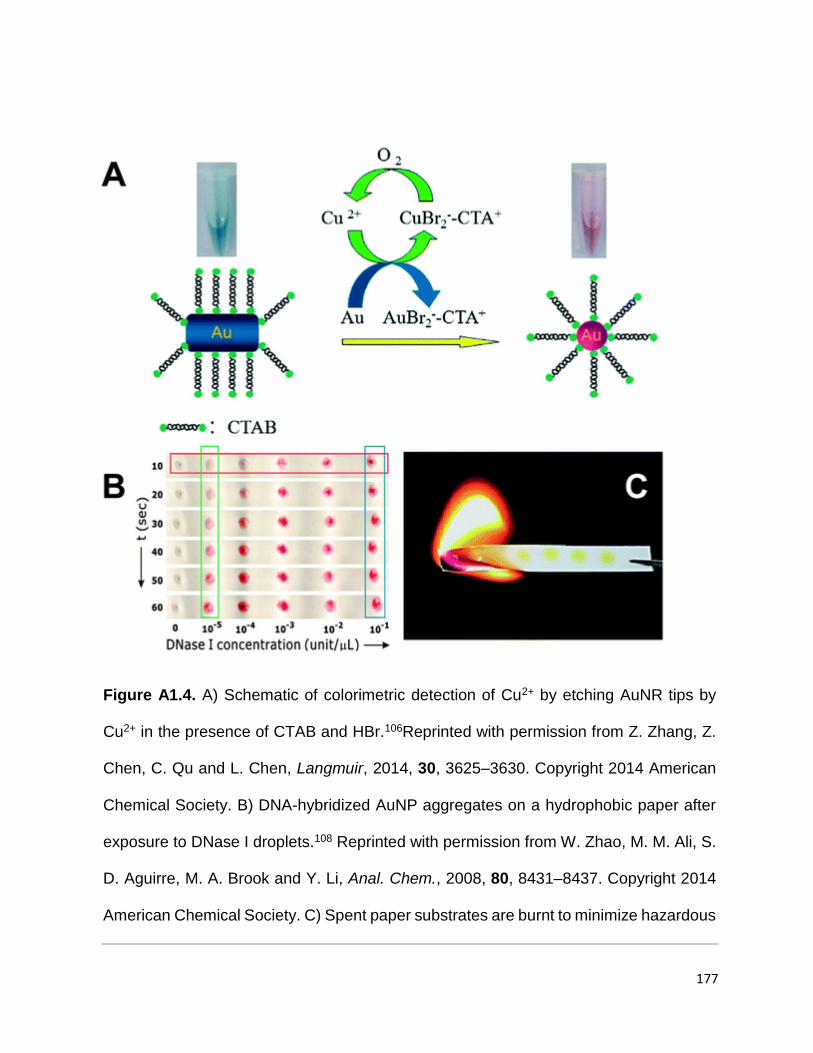
177
Figure A1.4. A) Schematic of colorimetric detection of Cu2+ by etching AuNR tips by
Cu2+ in the presence of CTAB and HBr.106Reprinted with permission from Z. Zhang, Z.
Chen, C. Qu and L. Chen, Langmuir, 2014, 30, 3625–3630. Copyright 2014 American
Chemical Society. B) DNA-hybridized AuNP aggregates on a hydrophobic paper after
exposure to DNase I droplets.108 Reprinted with permission from W. Zhao, M. M. Ali, S.
D. Aguirre, M. A. Brook and Y. Li, Anal. Chem., 2008, 80, 8431–8437. Copyright 2014
American Chemical Society. C) Spent paper substrates are burnt to minimize hazardous

178
chemical handling.109 Reprinted with permission from S. C. Tseng, C. C. Yu, D. Wan, H.
L. Chen, L. A. Wang, M. C. Wu, W. F. Su, H. C. Han and L. C. Chen, Anal. Chem.,
2012, 84, 5140–5145. Copyright 2014 American Chemical Society.
For practical field applications, paper-based colorimetric sensors may be better than
suspension-based ones due to their smaller volume, longer-term stability, and convenient
handling and processing. Recently it has been reported that the protocols for suspension-
based colorimetric detection can also be applied on a paper substrate.108,110 For example,
DNA-hybridized AuNP aggregates that were spotted on paper can be redispersed into a
droplet that contains endonuclease (DNase I), which could cleave hybridized DNA.
Following endonuclease addition, the blue or black spot on paper rapidly changed color
to red and this color change could be discerned by the naked eye even at low nM
endonuclease concentrations (Figure. 4B).108 It is notable that the paper used in these
assays should be hydrophobic paper or surfactant-treated hydrophilic paper to avoid the
rapid spread and drying of the droplet applied on the surface. In addition to drop-coated
AuNP suspensions on paper, paper/AuNP composites can also be synthesized by a
laser-induced thermal method. When 15 nm thin gold films coated on paper were exposed
to KrF excimer laser irradiation, AuNPs (46 nm) formed on the paper surface with a high
density of 318 μm−2. Following immersion into cysteine solution the color of the paper
changed from light yellow to dark yellow. The paper could be burnt after use, which is a
simple mechanism for hazardous waste disposal (Figure. 4C).109 Another paper-based
analytical protocol has been reported for colorimetric sensing of Cu2+ by AgNPs
functionalized with homocysteine and dithiothreitol. The LSPR peak intensity of AgNPs
at 404 nm decreased while a new red-shifted band at 502 nm appeared as Cu2+ was

179
added. Consequently, the color of the paper coated with AgNPs changed from yellow to
orange or green-brown. A linear response was observed for the color intensity change as
a function of Cu2+ concentration in the range of 7.8–62.8 μM.111 Based on these results,
we are confident that paper-based colorimetric LSPR sensors should have applicability
for detection of a broad range of environmental pollutants.
A1.4. SERS detection
The SERS phenomenon was first observed in 1974 when the Raman signal of pyridine
adsorbed on a roughened silver electrode was substantially enhanced.112 SERS was
subsequently proposed as an analytical technique for many organic compounds using
substrates such as roughed Ag electrodes or Ag films on nanospheres
(AgFON).113,114 However, the detection limits achieved with these methods are high
(above 1 μM), which limits their application. In 1997, however, single molecule detection
was achieved for resonant dye molecules, such as rhodamine 6G (R6G) and crystal violet
(CV) using AgNP colloids as SERS substrates.19,22 It was subsequently realized that
aggregates in the colloid are responsible for the substantially enhanced Raman signal
and the concept of the aforementioned SERS “hot spot”, the gap between the aggregates,
was proposed.
In the past decade, numerous research efforts have been devoted to create and maximize
the number of “hot spots” within SERS substrates.116,118,119 Adding salts or organic
electrolytes to gold or silver colloid suspensions can induce aggregation and generate
SERS “hot spots”.120 However, the aggregation process is random and thus hard to
replicate. Recently, methods to generate highly reproducible and controllable SERS hot
spots in suspension have been reported.115,116,121,122 For example, the supermolecule
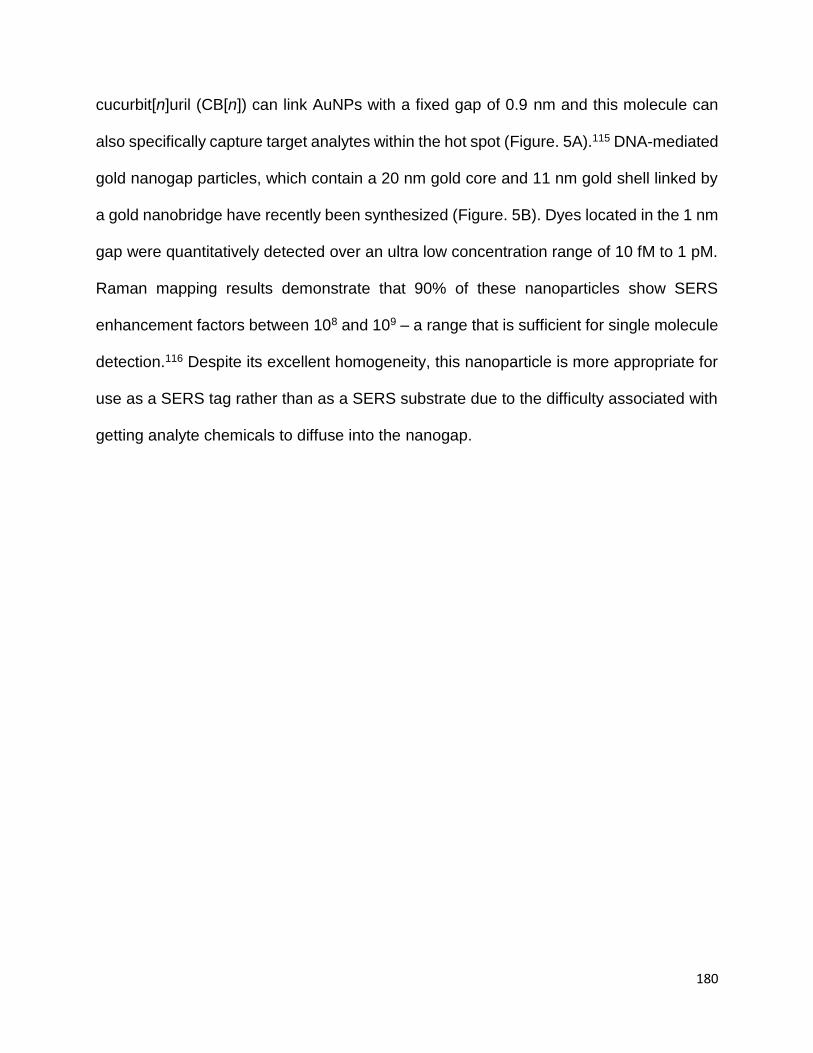
180
cucurbit[n]uril (CB[n]) can link AuNPs with a fixed gap of 0.9 nm and this molecule can
also specifically capture target analytes within the hot spot (Figure. 5A).115 DNA-mediated
gold nanogap particles, which contain a 20 nm gold core and 11 nm gold shell linked by
a gold nanobridge have recently been synthesized (Figure. 5B). Dyes located in the 1 nm
gap were quantitatively detected over an ultra low concentration range of 10 fM to 1 pM.
Raman mapping results demonstrate that 90% of these nanoparticles show SERS
enhancement factors between 108 and 109 – a range that is sufficient for single molecule
detection.116 Despite its excellent homogeneity, this nanoparticle is more appropriate for
use as a SERS tag rather than as a SERS substrate due to the difficulty associated with
getting analyte chemicals to diffuse into the nanogap.

181
Figure A1.5. A) CN[n] induced AuNP aggregation with a fixed sub nanometer
gap;115 Reprinted with permission from R. W. Taylor, R. J. Coulston, F. Biedermann, S.
Mahajan, J. J. Baumberg and O. A. Scherman, Nano Lett., 2013, 13, 5985–5990.
Copyright 2014 American Chemical Society. B) Formation of 1 nm gap between AuNP
core and shell linked with a Au nanobridge.116 Reprinted with permission from D. K. Lim,
K. S. Jeon, J. H. Hwang, H. Kim, S. Kwon, Y. D. Suh and J. M. Nam, Nat. Nanotechnol.,
2011, 6, 452–460. Copyright 2014 Nature Publishing Group. C) Chemical structures of
three dithiolcarbamate pesticides.117Reproduced from B. Saute, R. Premasiri, L. Ziegler
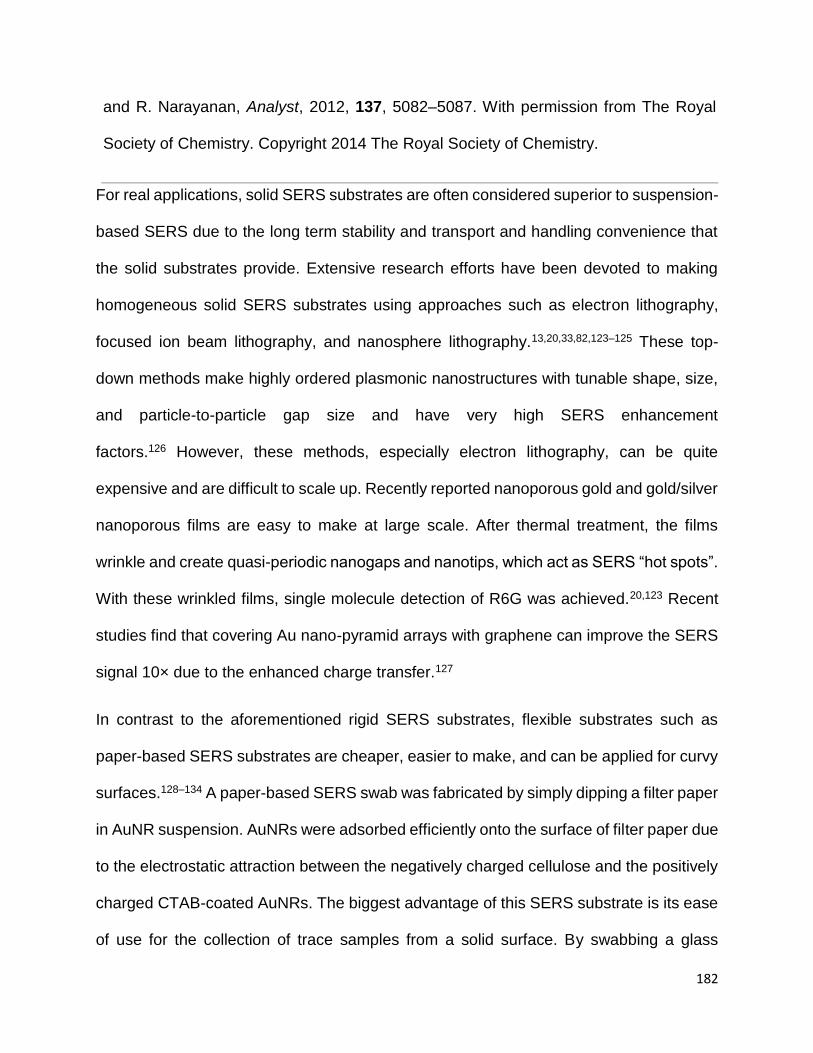
182
and R. Narayanan, Analyst, 2012, 137, 5082–5087. With permission from The Royal
Society of Chemistry. Copyright 2014 The Royal Society of Chemistry.
For real applications, solid SERS substrates are often considered superior to suspension-
based SERS due to the long term stability and transport and handling convenience that
the solid substrates provide. Extensive research efforts have been devoted to making
homogeneous solid SERS substrates using approaches such as electron lithography,
focused ion beam lithography, and nanosphere lithography.13,20,33,82,123–125 These top-
down methods make highly ordered plasmonic nanostructures with tunable shape, size,
and particle-to-particle gap size and have very high SERS enhancement
factors.126 However, these methods, especially electron lithography, can be quite
expensive and are difficult to scale up. Recently reported nanoporous gold and gold/silver
nanoporous films are easy to make at large scale. After thermal treatment, the films
wrinkle and create quasi-periodic nanogaps and nanotips, which act as SERS “hot spots”.
With these wrinkled films, single molecule detection of R6G was achieved.20,123 Recent
studies find that covering Au nano-pyramid arrays with graphene can improve the SERS
signal 10× due to the enhanced charge transfer.127
In contrast to the aforementioned rigid SERS substrates, flexible substrates such as
paper-based SERS substrates are cheaper, easier to make, and can be applied for curvy
surfaces.128–134 A paper-based SERS swab was fabricated by simply dipping a filter paper
in AuNR suspension. AuNRs were adsorbed efficiently onto the surface of filter paper due
to the electrostatic attraction between the negatively charged cellulose and the positively
charged CTAB-coated AuNRs. The biggest advantage of this SERS substrate is its ease
of use for the collection of trace samples from a solid surface. By swabbing a glass
183
surface contaminated with a 140 pg 1,4-benzenedithiol (1,4-BDT) residue, the chemicals
were readily adsorbed on the paper surface and their Raman spectrum was easily
obtained (Figure. 6A).129 Similarly, a star-shaped μPAD whose fingers were coated with
polyelectrolyte was fabricated (Figure. 6B). This μPAD showed the capability to separate
chemicals based upon their charge and to concentrate the chemicals into the small
volume of the tips (Figure. 6B). For example, positively charged R6G readily moved to
the finger tip coated with positively charged poly(allylamine hydrochloride), while it was
retained at the entrance of the finger coated with negatively charged poly(sodium 4-
styrenesulfonate). This μPAD exhibited a preconcentration factor of 109 for R6G and thus
a super low detection limit of 100 aM was detected.133 In addition to paper, electrospun
nanofiber mats have also been used as the SERS substrate scaffold.134,135 For example,
an AgNP/PVA (poly(vinyl alcohol)) membrane was fabricated by electrospinning AgNPs
and PVA mixture. The bulk material and nanofibers coated with AgNPs are shown
in Figure. 6C and D, respectively. 4-mercaptobenzoic acid (4-MBA) at a concentration of
10−6 M was detected using this SERS substrate.135

184
Figure A1.6. A) A glass with 1,4-BDT residue is swabbed by the paper-based SERS
substrate;129 Reprinted with permission from C. H. Lee, L. Tian and S.
Singamaneni, ACS Appl. Mater. Interfaces, 2010, 2, 3429–3435. Copyright 2014
American Chemical Society. B) A star-shape paper with eight fingers were coated by
polyelectrolyte, which could separate and preconcentrate chemicals
efficiently;133 Reprinted with permission from A. Abbas, A. Brimer, J. M. Slocik, L. Tian,
R. R. Naik and S. Singamaneni, Anal. Chem., 2013, 85, 3977–3983. Copyright 2014
American Chemical Society. C) The photo and D) SEM image of AgNP/PVA membrane
fabricated by electrospinning.135 Reprinted with permission from D. He, B. Hu, Q. F. Yao,
185
K. Wang and S. H. Yu, ACS Nano, 2009, 3, 3993–4002. Copyright 2014 American
Chemical Society.
Although significantly improved average enhancement factors (EF) have been achieved
(generally greater than 109) for Raman active dyes and other test materials, the
application of such SERS substrates for ultrasensitive detection of organic pollutants are
few.117,136–140 The reason for this is that many organic pollutants are non-resonant under
the laser excitation wavelengths (>514 nm) typically used for Raman spectroscopy.
Accordingly, their Raman cross-sections are generally several orders of magnitude lower
than those for the resonant dyes most commonly used for SERS substrate development.
SERS detection of pesticides with high affinity to AuNPs has been
reported.117,138 Dithiolcarbamate pesticides – thiram, ferbam, and ziram were detected
and differentiated by SERS using a gold nanorod suspension as the SERS substrate. The
structures of these three chemically similar pesticides are shown in Figure. 5C. Each
pesticide contains sulfur groups that can form covalent Au–S bonds with the AuNP
surface. To obtain high SERS intensity, gold nanorods whose longitudinal LSPR was well
coupled with the laser wavelength were used as the SERS substrate. The detection limits
of these three pesticides are 34 nM, 26 nM, and 13 nM, respectively, well below the EPA
standards (17 μM, 10 μM, 23 μM).117 These results indicate that for organic pollutants
showing high affinity with gold or silver nanoparticles, SERS detection is feasible if the
LSPR of the SERS substrate matches the excitation laser wavelength. An
organophosphorus pesticide – paraoxon at a concentration of 10 nM was detected using
a self-assembled gold nanoparticle film. The film is made by ting methoxy-mercapto-
poly(ethylene glycol) (mPEG-SH) functionalized AuNP suspension onto a solid substrate.

186
The AuNPs were closely packed on the substrate with 5 nm gaps. Self-assembly induced
by mPEG-SH modification significantly improved the SERS intensity and homogeneity of
the film.138 This is a simple and cost-efficient method for SERS substrate fabrication.
However, the author did not explain how the mPEG-SH-AuNP suspension and the
analyte solution overcame the “coffee ring effect” when t on a solid substrate.
A significant challenge that has limited SERS detection of organic pollutants is not only
their generally small Raman cross sections, but also their low affinity to the NP surface.
Therefore, methods to enhance the affinity between pollutants and the gold/silver NP
surface have been pursued to solve this problem.141–146 One way to achieve this goal is
through addition of a molecular trap on the gold/silver nanoparticle surface to specifically
capture organic molecules. The thermally sensitive polymer poly-(N-isopropylacrylamide)
(pNIPAM) was recently used as the trap for 1-naphthol (1-NOH). At a temperature of 277
K, pNIPAM exists in a swollen state, such that 1-NOH trapped within the polymer is far
away from the AuNP surface, which then results in a weak SERS signal. In contrast, at a
temperature of 333 K, pNIPAM shrinks to half of its swollen volume, thus bringing 1-NOH
closer to the AuNP surface resulting in a substantial increase in the SERS signal.143 This
method enabled acquisition of the SERS spectrum of 1-NOH for the first time. However,
the limit of detection for 1-NOH is high (10 μM). TNT was trapped on a cysteine-
functionalized AuNP surface by the formation of a Meisenheimer complex with cysteine
(Figure. 7A). Electrostatic attraction between Meisenheimer complex-bound AuNPs and
cysteine-bound AuNPs subsequently resulted in AuNP aggregation and the generation
of a number of SERS hot spots. With this method, 2 pM TNT was detected in aqueous
solution.141 TNT has also been adsorbed onto the AuNR surface by a peptide linker
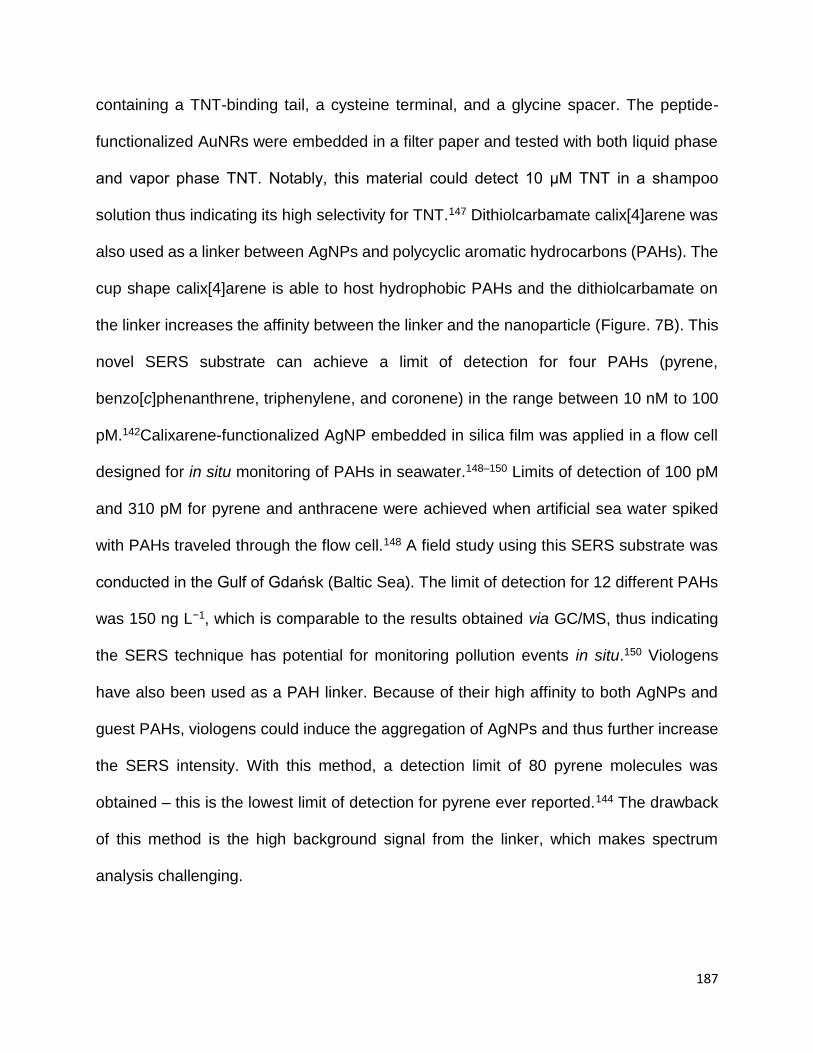
187
containing a TNT-binding tail, a cysteine terminal, and a glycine spacer. The peptide-
functionalized AuNRs were embedded in a filter paper and tested with both liquid phase
and vapor phase TNT. Notably, this material could detect 10 μM TNT in a shampoo
solution thus indicating its high selectivity for TNT.147 Dithiolcarbamate calix[4]arene was
also used as a linker between AgNPs and polycyclic aromatic hydrocarbons (PAHs). The
cup shape calix[4]arene is able to host hydrophobic PAHs and the dithiolcarbamate on
the linker increases the affinity between the linker and the nanoparticle (Figure. 7B). This
novel SERS substrate can achieve a limit of detection for four PAHs (pyrene,
benzo[c]phenanthrene, triphenylene, and coronene) in the range between 10 nM to 100
pM.142Calixarene-functionalized AgNP embedded in silica film was applied in a flow cell
designed for in situ monitoring of PAHs in seawater.148–150 Limits of detection of 100 pM
and 310 pM for pyrene and anthracene were achieved when artificial sea water spiked
with PAHs traveled through the flow cell.148 A field study using this SERS substrate was
conducted in the Gulf of Gdańsk (Baltic Sea). The limit of detection for 12 different PAHs
was 150 ng L−1, which is comparable to the results obtained via GC/MS, thus indicating
the SERS technique has potential for monitoring pollution events in situ.150 Viologens
have also been used as a PAH linker. Because of their high affinity to both AgNPs and
guest PAHs, viologens could induce the aggregation of AgNPs and thus further increase
the SERS intensity. With this method, a detection limit of 80 pyrene molecules was
obtained – this is the lowest limit of detection for pyrene ever reported.144 The drawback
of this method is the high background signal from the linker, which makes spectrum
analysis challenging.
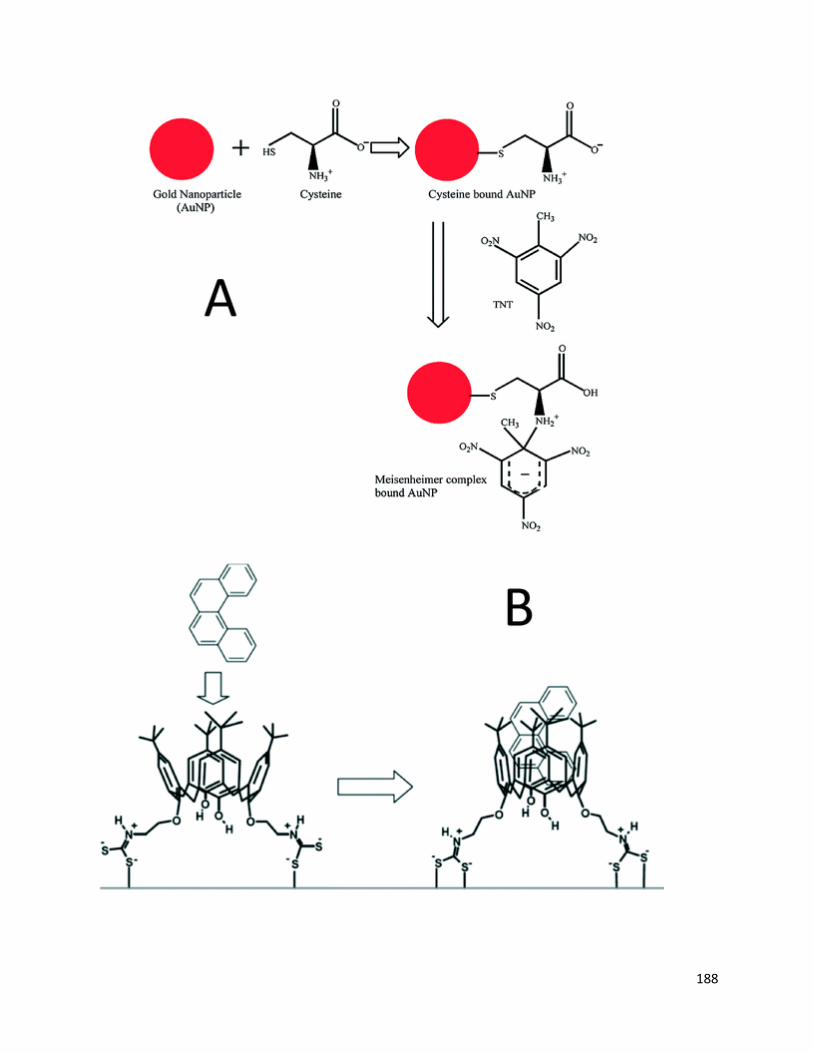
188
189
Figure A1.7. A) Trinitrotoluene (TNT) is captured by cysteine-functionalized AuNPs by
formation of a Meisenheimer complex;141Reprinted with permission from S. S. Dasary,
A. K. Singh, D. Senapati, H. Yu and P. C. Ray, J. Am. Chem. Soc., 2009, 131, 13806–
13812. Copyright 2014 American Chemical Society. B) calix[4]arene links PAHs and
AgNPs.142 L. Guerrini, J. V. Garcia-Ramos, C. Domingo and S. Sanchez-Cortes, Anal.
Chem., 2009, 81, 953–960. Copyright 2014 American Chemical Society.
The SERS spectrum of the dioxin 2-benzoyldibenzo-p-dioxin (BDPD), a highly toxic
compound, was first reported in 2009 using AgNPs loaded in
poly(diallyldimethylammonium chloride) (PDDA) and poly-(acrylic acid) (PAA) film. This
film was fabricated using a layer-by-layer method and subsequently impregnated with
AgNPs. After drying in air, this SERS substrate showed a 5× higher Raman signal for 1-
naphthalenethiol (1-NAT) than an AgNP suspension due to hot spot formation in the 3D
structure. More importantly, the SERS dioxin spectrum at 10 nM was observed on this
substrate although the signal was very weak.140 This substrate works for dioxin partly
because the PDDA–PAA can trap dioxin in the film thus creating the opportunity for dioxin
contact with the AgNP surface. Recently, a detection limit down to three molecules was
reported for atrazine detection via SERS.151 This detection limit was achieved by directly
adding a specific volume of 100 μM atrazine to an AgNP colloid suspension. This result
demonstrates that SERS achieved similar detection limit (ppt) to sophisticated liquid
chromatography-tandem mass spectroscopy (LC-MS/MS) and outperformed it due to its
facile operation and fast measurement. However, this paper did not report a detailed
characterization of the SERS substrate, the Raman measurement conditions, or the
reproducibility of the data. The reason why the authors were able to achieve such a low

190
detection limit is probably the addition of high concentrations of atrazine (100 μM) that
induced AgNP aggregation. More research efforts are required in this field to discuss if
SERS can be used for single or few molecule detection of organic pollutants in
environmentally relevant samples.
To facilitate on site pollutant detection, a portable Raman instrument integrating a SERS
sensor is highly desired.152,153 Recently such an instrument containing a silver dendrite
SERS substrate was developed for pesticide detection. The large laser spot of 2 mm
minimizes SERS intensity variation among parallel samples. The pesticide ferbam with
concentrations of 0 ppm, 4 ppm, 7 ppm, and 14 ppm was used as reference materials
indicating no risk, low risk, risk, and high risk, respectively. The self checking tests for the
four references all passed, indicating this instrument shows potential for on site pesticide
detection.152 Combining microfluidic chips and SERS substrates in the portable Raman
instrument is promising for real-time on site pollutant detection. With a micropillar array
PDMS chip integrated in the instrument, complete mixing of the two confluents – AgNPs
and pollutants (dipicolinic acid and malachite green) is achieved. Dipicolinic acid and
malachite green were quantitatively detected with limits of detection of 200 ppb and 500
ppb, respectively.153
For larger targets, such as biomolecules, viruses, cancer cells, bacteria and protozoa, it
is very difficult to directly acquire their SERS spectra by adding them to SERS substrates
because they are too big to fit into the hot spots due to their large size.155,156Instead, a
SERS tag is used to specifically bind the targets and the SERS spectrum of a Raman
reporter functionalized on the SERS tag is then monitored.93,157 Raman reporter is usually
a dye having a large Raman cross section. Ideal SERS tags are able to generate strong
191
enough signals for single target detection. Interested readers are referred to a very good
review for additional details on SERS tags.31 Yang et al. fabricated a nanopillar-based
SERS substrate to detect the macromolecule vasopressin, which was labeled by a
Raman reporter 5-carboxytetramethylrhodamine. The nanopillar is made by depositing
gold vapor onto etched silicon wafer. The coated gold film on the tip of silicon wire formed
a pillar, which was functionalized with a vasopressin-specific aptamer. After exposure to
vasopressin and subsequent drying, the intensified SERS signal of TAMRA was acquired
due to the capillary force-driven aggregation of the nanopillars. The detection limit of
vasopressin was reported to be 1 pM.119 Recently, graphene oxide (GO) was used for
SERS tag fabrication because of its capacity to significantly enhance the SERS
signal.154,158 The schematic of this SERS tag synthesis is shown in Figure. 8. Different
from the traditional SERS tag fabrication, the Raman reporter – tris(2,2′-
bipyridyl)ruthenium(II) chloride (Rubpy) was first adsorbed on GO and subsequently
AuNPs formed by in situ reduction of HAuCl4 on GO/Rubpy. GO was able to not only
enhance the SERS signal by two fold but also improve the colloid stability by wrapping
around the small nanoparticle aggregates. AuNP/GO/Rubpy was subsequently
functionalized with positively charged poly(allylamine hydrochloride) (PAH), which
provided amine groups to link to the recognition element glutaraldehyde (GA). GA can
bind to both gram-positive and gram-negative bacteria by crosslinking with the
peptidoglycan layer on their surfaces. In addition to its single cell identification capability,
this SERS tag can also be used for photothermal ablation of bacteria when exposed to a
400 mW 785 nm laser. The decrease in the SERS signal can be used to monitor the
bacterial ablation process (Figure. 8).154

192
Figure A1.8. Schematic for AuNP/GO/Rubpy/GA SERS tag synthesis and its
application for monitoring the photothermal ablation of bacteria.154 Reprinted with
permission from D. Lin, T. Qin, Y. Wang, X. Sun and L. Chen, ACS Appl. Mater.
Interfaces, 2014, 6, 1320–1329. Copyright 2014 American Chemical Society.
Although detecting large targets using SERS tags can achieve very high sensitivity, it is
complex and costly to fabricate these tags. Most recently, the SERS spectrum of virus on
SERS substrates without a SERS tag has been reported. This is called label-free SERS
detection of virus.159 Progress made in this promising area of research was recently
summarized elsewhere.159 Briefly, a highly sensitive and reproducible SERS substrate
was fabricated by oblique angle deposition. The obtained SERS substrate contains tilted
silver nanowire arrays. Virus was directly added to the SERS substrate and its SERS
spectrum was readily acquired. Using this technique, three viruses – adenovirus,
193
rhinovirus, and HIV were distinguished and even different strains of respiratory syncytial
virus (RSV) could be differentiated. This approach was also applied to measure the SERS
spectrum of RSV in its infected cell lysate although the background interference is strong.
These results indicate that label-free detection of virus is feasible if SERS substrates are
well designed. However, the weak signal, strong background disturbance, and subtle
change of spectrum between different viruses make the data analysis challenging.
Principle component analysis (PCA) and other chemometic approaches are often
required to differentiate the viruses from the background and from one another.
A1.5. Challenges
Although the rapid development of nanotechnology has facilitated substantial progress
towards improved colorimetric and SERS detection, the high costs of sensor fabrication
still impede their practical environmental applications. Development of low-cost and
scalable detection platforms remains a big challenge. It is thus desirable to incorporate
detection components within paper or other sustainable materials without using costly
lithography techniques. Paper-based colorimetric sensors can be used at home to
monitor drinking water quality by simply dipping test strips into water. However, the
sensitivity and resistance of these test strips to potential interferents such as drinking
water disinfectants should be improved to make such a sensor truly useful. SERS sensors
have the capacity to replace the complex lab assays currently used in water and
wastewater treatment plants because of their simple sample preparation and rapid
detection process. Suspension-based sensors may not be appropriate for use in real
water samples since the colloids may not be stable in complex water chemistries and the
challenges associated with long-term storage. As noted, paper-based SERS substrates
194
have potential application. However, their SERS hot spot densities and affinities for
specific organic pollutants currently do not meet real world application requirements. It is
a considerable challenge to develop universal SERS substrates that have broad
applicability to all of the organic chemicals of interest because the size, polarity, and
isoelectric point of the chemicals determine their capacity to enter the hot spots on the
SERS substrate. For on-site detection, portable SERS instrumentation is required and
those systems currently rely only on near infrared lasers because of their ease of
miniaturization. Accordingly, the SERS substrate must be optimized for application with
near infrared lasers. Unfortunately, most organic pollutants are non-resonant at this laser
wavelength, which makes their detection more challenging. Moreover, if we want to
achieve real-time detection, the laser integration time must be very short, which further
increases the difficulty. In addition to organic pollutant detection, SERS sensors also
show potential for label-free pathogen detection. Since pathogens are generally too large
to readily enter hot spots, the SERS substrate must have extremely high enhancement
factor to make the pathogen spectrum visible. The reproducibility of SERS pathogen
detection is also challenged because the contact between pathogens and Au or AgNPs
may vary with time. The steps required for development of low-cost and efficient SERS
substrates for pathogen detection are an ongoing area of research focus.
A1.6. Acknowledgements
Funding for this study was provided by the US National Science Foundation (NSF; CBET
1236005 and 1133736) and the Virginia Tech Institute for Critical Technology and Applied
Science. Support for HW was provided by the Virginia Tech Graduate School through the
Sustainable Nanotechnology Interdisciplinary Graduate Education Program (VTSuN

195
IGEP). Additional funding was provided by NSF and the Environmental Protection Agency
under NSF Cooperative Agreement EF-0830093, Center for the Environmental
Implications of NanoTechnology (CEINT). Any opinions, findings, conclusions or
recommendations expressed in this material are those of the authors and do not
necessarily reflect the views of the NSF or the EPA. This work has not been subjected to
EPA review and no official endorsement should be inferred.
A1.7. References
1. J. Manuel, Environ. Health Perspect., 2014, 122, A214–A219
2. C. Fitzpatrick, Water21 - Magazine of The International Water Association, 2014
3. W. R. Mac Kenzie, N. J. Hoxie, M. E. Proctor, M. S. Gradus, K. A. Blair, D. E.
Peterson, J. J. Kazmierczak, D. G. Addiss, K. R. Fox and J. B. Rose, N. Engl. J.
Med., 1994, 331, 161–167
4. M. Widerström, C. Schönning, M. Lilja, M. Lebbad, T. Ljung, G. Allestam, M. Ferm,
B. Björkholm, A. Hansen and J. Hiltula,Emerging Infect. Dis., 2014, 20, 581–589
5. L. B. van Alphen, F. Dorléans, A. C. Schultz, J. Fonager, S. Ethelberg, C. Dalgaard,
M. Adelhardt, J. H. Engberg, T. K. Fischer and S. G. Lassen, PLoS One, 2014, 9,
e105053
6. A. Abbott and H. Pearson, Nature, 2004, 427, 472–473
7. F. Karasek and O. Hutzinger, Anal. Chem., 1986, 58, 633A–642A
8. A. J. Haes, C. L. Haynes, A. D. McFarland, G. C. Schatz, R. P. Van Duyne and S.
Zou, MRS Bull., 2005, 30, 368–375
196
9. A. J. Haes and R. P. Van Duyne, Anal. Bioanal. Chem., 2004, 379, 920–930
10. S. Link and M. A. El-Sayed, J. Phys. Chem. B, 1999, 103, 8410–8426
11. B. Sepúlveda, P. C. Angelomé, L. M. Lechuga and L. M. Liz-Marzán, Nano Today,
2009, 4, 244–251
12. J. Mock, M. Barbic, D. Smith, D. Schultz and S. Schultz, J. Chem. Phys., 2002, 116,
6755–6759
13. C. L. Haynes and R. P. Van Duyne, J. Phys. Chem. B, 2001, 105, 5599–5611
14. W. L. Daniel, M. S. Han, J.-S. Lee and C. A. Mirkin, J. Am. Chem. Soc., 2009, 131,
6362–6363
15. F. Xia, X. Zuo, R. Yang, Y. Xiao, D. Kang, A. Vallée-Bélisle, X. Gong, J. D. Yuen,
B. B. Hsu and A. J. Heeger, Proc. Natl. Acad. Sci. U. S. A., 2010, 107, 10837–
10841
16. J. Du, B. Zhu and X. Chen, Small, 2013, 9, 4104–4111
17. G. C. Schatz, M. A. Young and R. P. Van Duyne, Surface-enhanced Raman
Scattering, Springer, 2006, pp. 19–45
18. C. L. Haynes, A. D. McFarland and R. P. V. Duyne, Anal. Chem., 2005, 77, 338 A–
346 A
19. S. Nie and S. R. Emory, Science, 1997, 275, 1102–1106
20. H. Liu, L. Zhang, X. Lang, Y. Yamaguchi, H. Iwasaki, Y. Inouye, Q. Xue and M.
Chen, Sci. Rep., 2011, 1, 1–5

197
21. J. Kneipp, H. Kneipp and K. Kneipp, Chem. Soc. Rev., 2008, 37, 1052–1060 RSC.
22. K. Kneipp, Y. Wang, H. Kneipp, L. T. Perelman, I. Itzkan, R. R. Dasari and M. S.
Feld, Phys. Rev. Lett., 1997, 78, 1667
23. E. Podstawka, Y. Ozaki and L. M. Proniewicz, Appl. Spectrosc., 2005, 59, 1516–
1526
24. J. C. Costa, R. A. Ando, P. H. Camargo and P. Corio, J. Phys. Chem. C, 2011, 115,
4184–4190
25. N. A. Abu Hatab, J. M. Oran and M. J. Sepaniak, ACS Nano, 2008, 2, 377–385
26. R. Tan, A. Agarwal, N. Balasubramanian, D. Kwong, Y. Jiang, E. Widjaja and M.
Garland, Sens. Actuators, A, 2007, 139, 36–41
27. W. J. Cho, Y. Kim and J. K. Kim, ACS Nano, 2011, 6, 249–255
28. A. Campion and P. Kambhampati, Chem. Soc. Rev., 1998, 27, 241–250 RSC.
29. K. Kneipp, H. Kneipp, I. Itzkan, R. R. Dasari and M. S. Feld, Chem. Rev., 1999, 99,
2957–2976
30. M. D. Porter, R. J. Lipert, L. M. Siperko, G. Wang and R. Narayanan, Chem. Soc.
Rev., 2008, 37, 1001–1011 RSC.
31. Y. Wang, B. Yan and L. Chen, Chem. Rev., 2012, 113, 1391–1428
32. M. Vendrell, K. K. Maiti, K. Dhaliwal and Y. T. Chang, Trends Biotechnol., 2013, 31,
249–257
198
33. S. C. Luo, K. Sivashanmugan, J. D. Liao, C. K. Yao and H. C. Peng, Biosens.
Bioelectron., 2014, 61, 232–240
34. R. A. Halvorson and P. J. Vikesland, Environ. Sci. Technol., 2010, 44, 7749–7755
35. B. Sharma, R. R. Frontiera, A. I. Henry, E. Ringe and R. P. Van Duyne, Mater.
Today, 2012, 15, 16–25
36. S. Schlücker, Angew. Chem., Int. Ed., 2014, 53, 4756–4795
37. D. Liu, Z. Wang and X. Jiang, Nanoscale, 2011, 3, 1421–1433 RSC.
38. W. Zhao, M. A. Brook and Y. Li, ChemBioChem, 2008, 9, 2363–2371
39. D. Vilela, M. C. González and A. Escarpa, Anal. Chim. Acta, 2012, 751, 24–43
40. S. Su, W. Wu, J. Gao, J. Lu and C. Fan, J. Mater. Chem., 2012, 22, 18101–
18110 RSC.
41. R. Alvarez-Puebla and L. Liz-Marzan, Energy Environ. Sci., 2010, 3, 1011–1017
42. T. Masciangioli and W. X. Zhang, Environ. Sci. Technol., 2003, 37, 102A–108A
43. C. Wang and C. Yu, Rev. Anal. Chem., 2013, 32, 1–14
44. L. Wang, W. Ma, L. Xu, W. Chen, Y. Zhu, C. Xu and N. A. Kotov, Mater. Sci. Eng.,
R, 2010, 70, 265–274
45. P. J. Vikesland and K. R. Wigginton, Environ. Sci. Technol., 2010, 44, 3656–3669
46. S. Szunerits and R. Boukherroub, Chem. Commun., 2012, 48, 8999–9010 RSC.
199
47. J. N. Anker, W. P. Hall, O. Lyandres, N. C. Shah, J. Zhao and R. P. Van Duyne, Nat.
Mater., 2008, 7, 442–453
48. J. Homola, Chem. Rev., 2008, 108, 462–493
49. R. A. Alvarez-Puebla and L. M. Liz-Marzán, Angew. Chem., Int. Ed., 2012, 51,
11214–11223
50. Y. Sun and Y. Xia, Analyst, 2003, 128, 686–691 RSC.
51. P. Mulvaney, Langmuir, 1996, 12, 788–800
52. A. Zielińska, E. Skwarek, A. Zaleska, M. Gazda and J. Hupka, Procedia Chem.,
2009, 1, 1560–1566
53. S. Link and M. A. El-Sayed, Annu. Rev. Phys. Chem., 2003, 54, 331–366
54. C. J. Orendorff, T. K. Sau and C. J. Murphy, Small, 2006, 2, 636–639
55. C. L. Nehl and J. H. Hafner, J. Mater. Chem., 2008, 18, 2415–2419 RSC.
56. L. Zhong, X. Zhou, S. Bao, Y. Shi, Y. Wang, S. Hong, Y. Huang, X. Wang, Z. Xie
and Q. Zhang, J. Mater. Chem., 2011, 21, 14448–14455 RSC.
57. I. Blakey, Z. Merican and K. J. Thurecht, Langmuir, 2013, 29, 8266–8274
58. K. A. Willets and R. P. Van Duyne, Annu. Rev. Phys. Chem., 2007, 58, 267–297
59. J. J. Storhoff, R. Elghanian, R. C. Mucic, C. A. Mirkin and R. L. Letsinger, J. Am.
Chem. Soc., 1998, 120, 1959–1964
60. C. C. Huang and H. T. Chang, Chem. Commun., 2007, 1215–1217 RSC.

200
61. J. Liu and Y. Lu, Angew. Chem., 2006, 118, 96–100
62. I. Mrozek and A. Otto, J. Electron Spectrosc. Relat. Phenom., 1990, 54, 895–911
63. G. Compagnini, C. Galati and S. Pignataro, Phys. Chem. Chem. Phys., 1999, 1,
2351–2353 RSC.
64. K. H. Su, Q. H. Wei, X. Zhang, J. Mock, D. R. Smith and S. Schultz, Nano Lett.,
2003, 3, 1087–1090
65. X. Qian, X. Zhou and S. Nie, J. Am. Chem. Soc., 2008, 130, 14934–14935
66. L. Qin, S. Zou, C. Xue, A. Atkinson, G. C. Schatz and C. A. Mirkin, Proc. Natl. Acad.
Sci. U. S. A., 2006, 103, 13300–13303
67. H. Im, K. C. Bantz, N. C. Lindquist, C. L. Haynes and S. H. Oh, Nano Lett., 2010, 10,
2231–2236
68. H. Wang, C. S. Levin and N. J. Halas, J. Am. Chem. Soc., 2005, 127, 14992–
14993
69. K. L. Wustholz, A.-I. Henry, J. M. McMahon, R. G. Freeman, N. Valley, M. E. Piotti,
M. J. Natan, G. C. Schatz and R. P. V. Duyne, J. Am. Chem. Soc., 2010, 132,
10903–10910
70. L. Fabris, A. S. D. Indrasekara, S. Meyers, S. Shubeita, L. C. Feldman and T.
Gustafsson, Nanoscale, 2014
71. M. Potara, A. M. Gabudean and S. Astilean, J. Mater. Chem., 2011, 21, 3625–
3633 RSC.

201
72. A. McLintock, C. A. Cunha-Matos, M. Zagnoni, O. R. Millington and A. W.
Wark, ACS Nano, 2014, 8, 8600–8609
73. G. Braun, I. Pavel, A. R. Morrill, D. S. Seferos, G. C. Bazan, N. O. Reich and M.
Moskovits, J. Am. Chem. Soc., 2007, 129, 7760–7761
74. S. L. Kleinman, R. R. Frontiera, A.-I. Henry, J. A. Dieringer and R. P. Van
Duyne, Phys. Chem. Chem. Phys., 2013, 15, 21–36 RSC.
75. A. Shiohara, Y. Wang and L. M. Liz-Marzán, J. Photochem. Photobiol., C, 2014, 21,
2–25
76. N. H. Kim, S. J. Lee and M. Moskovits, Adv. Mater., 2011, 23, 4152–4156
77. R. A. Alvarez-Puebla, E. Arceo, P. J. Goulet, J. J. Garrido and R. F. Aroca, J. Phys.
Chem. B, 2005, 109, 3787–3792
78. L. S. Lawson, J. W. Chan and T. Huser, Nanoscale, 2014, 6, 7971–7980 RSC.
79. K. V. Kong, U. Dinish, W. K. O. Lau and M. Olivo, Biosens. Bioelectron., 2014, 54,
135–140
80. W. Ji, N. Spegazzini, Y. Kitahama, Y. Chen, B. Zhao and Y. Ozaki, J. Phys. Chem.
Lett., 2012, 3, 3204–3209
81. W. Hill and B. Wehling, J. Phys. Chem., 1993, 97, 9451–9455
82. R. Alvarez-Puebla, B. Cui, J. P. Bravo-Vasquez, T. Veres and H. Fenniri, J. Phys.
Chem. C, 2007, 111, 6720–6723
83. U. K. Sarkar, Chem. Phys. Lett., 2003, 374, 341–347

202
84. H. Yuan, A. M. Fales, C. G. Khoury, J. Liu and T. Vo-Dinh, J. Raman Spectrosc.,
2013, 44, 234–239
85. D. K. Lim, I. J. Kim and J. M. Nam, Chem. Commun., 2008, 5312–5314 RSC.
86. C. J. Murphy, T. K. Sau, A. M. Gole, C. J. Orendorff, J. Gao, L. Gou, S. E. Hunyadi
and T. Li, J. Phys. Chem. B, 2005, 109, 13857–13870
87. L. J. Sherry, R. Jin, C. A. Mirkin, G. C. Schatz and R. P. Van Duyne, Nano Lett.,
2006, 6, 2060–2065
88. J. E. Millstone, S. Park, K. L. Shuford, L. Qin, G. C. Schatz and C. A. Mirkin, J. Am.
Chem. Soc., 2005, 127, 5312–5313
89. L. Rodríguez-Lorenzo, R. A. Alvarez-Puebla, I. Pastoriza-Santos, S. Mazzucco, O.
Stéphan, M. Kociak, L. M. Liz-Marzán and F. J. García de Abajo, J. Am. Chem.
Soc., 2009, 131, 4616–4618
90. C. J. Orendorff, L. Gearheart, N. R. Jana and C. J. Murphy, Phys. Chem. Chem.
Phys., 2006, 8, 165–170 RSC.
91. S. E. Bell and M. R. McCourt, Phys. Chem. Chem. Phys., 2009, 11, 7455–
7462 RSC.
92. T. Iliescu, M. Baia and W. Kiefer, Chem. Phys., 2004, 298, 167–174
93. H. Y. Lin, C. H. Huang, W. H. Hsieh, L. H. Liu, Y. C. Lin, C. C. Chu, S. T. Wang, I.
Kuo, L. K. Chau and C. Y. Yang, Small, 2014,10, 4700–4710
94. C. A. Mirkin, R. L. Letsinger, R. C. Mucic and J. J. Storhoff, Nature, 1996, 382, 607–
609
203
95. R. A. Reynolds, C. A. Mirkin and R. L. Letsinger, J. Am. Chem. Soc., 2000, 122,
3795–3796
96. D. G. Thompson, A. Enright, K. Faulds, W. E. Smith and D. Graham, Anal. Chem.,
2008, 80, 2805–2810
97. L. Liu, S. Li, L. Liu, D. Deng and N. Xia, Analyst, 2012, 137, 3794–3799 RSC.
98. D. E. Huizenga and J. W. Szostak, Biochemistry, 1995, 34, 656–665
99. J. Liu and Y. Lu, Nat. Protoc., 2006, 1, 246–252
100. Z. Zhu, C. Wu, H. Liu, Y. Zou, X. Zhang, H. Kang, C. J. Yang and W. Tan, Angew.
Chem., 2010, 122, 1070–1074
101. A. Sugunan, C. Thanachayanont, J. Dutta and J. Hilborn, Sci. Technol. Adv.
Mater., 2005, 6, 335–340
102. J. Liu and Y. Lu, J. Am. Chem. Soc., 2003, 125, 6642–6643
103. C. Y. Lin, C. J. Yu, Y. H. Lin and W. L. Tseng, Anal. Chem., 2010, 82, 6830–6837
104. A. E. Üzer, Z. Can, I. l. Akın, E. Erçağ and R. A. Apak, Anal. Chem., 2013, 86,
351–356
105. F. M. Li, J. M. Liu, X. X. Wang, L. P. Lin, W. L. Cai, X. Lin, Y. N. Zeng, Z. M. Li and
S. Q. Lin, Sens. Actuators, B, 2011, 155, 817–822
106. Z. Zhang, Z. Chen, C. Qu and L. Chen, Langmuir, 2014, 30, 3625–3630
107. G. Wang, Z. Chen, W. Wang, B. Yan and L. Chen, Analyst, 2011, 136, 174–
178 RSC.
204
108. W. Zhao, M. M. Ali, S. D. Aguirre, M. A. Brook and Y. Li, Anal. Chem., 2008, 80,
8431–8437
109. S. C. Tseng, C. C. Yu, D. Wan, H. L. Chen, L. A. Wang, M. C. Wu, W. F. Su, H. C.
Han and L. C. Chen, Anal. Chem., 2012, 84, 5140–5145
110. D. Mazumdar, J. Liu, G. Lu, J. Zhou and Y. Lu, Chem. Commun., 2010, 46, 1416–
1418 RSC.
111. N. Ratnarathorn, O. Chailapakul, C. S. Henry and W. Dungchai, Talanta, 2012, 99,
552–557
112. M. Fleischmann, P. Hendra and A. McQuillan, Chem. Phys. Lett., 1974, 26, 163–
166
113. T. Vo-Dinh, M. Hiromoto, G. Begun and R. Moody, Anal. Chem., 1984, 56, 1667–
1670
114. M. M. Carrabba, R. B. Edmonds and R. D. Rauh, Anal. Chem., 1987, 59, 2559–
2563
115. R. W. Taylor, R. J. Coulston, F. Biedermann, S. Mahajan, J. J. Baumberg and O.
A. Scherman, Nano Lett., 2013, 13, 5985–5990
116. D. K. Lim, K. S. Jeon, J. H. Hwang, H. Kim, S. Kwon, Y. D. Suh and J. M. Nam, Nat.
Nanotechnol., 2011, 6, 452–460
117. B. Saute, R. Premasiri, L. Ziegler and R. Narayanan, Analyst, 2012, 137, 5082–
5087 RSC.
205
118. D. K. Lim, K. S. Jeon, H. M. Kim, J. M. Nam and Y. D. Suh, Nat. Mater., 2009, 9,
60–67
119. J. Yang, M. Palla, F. G. Bosco, T. Rindzevicius, T. S. Alstrøm, M. S. Schmidt, A.
Boisen, J. Ju and Q. Lin, ACS Nano, 2013, 7, 5350–5359
120. W. Leng and P. J. Vikesland, Langmuir, 2014, 30, 8342–8349
121. S. Basu, S. Pande, S. Jana, S. Bolisetty and T. Pal, Langmuir, 2008, 24, 5562–
5568
122. R. W. Taylor, T. C. Lee, O. A. Scherman, R. Esteban, J. Aizpurua, F. M. Huang, J.
J. Baumberg and S. Mahajan, ACS Nano, 2011, 5, 3878–3887
123. L. Zhang, X. Lang, A. Hirata and M. Chen, ACS Nano, 2011, 5, 4407–4413
124. A. Tao, F. Kim, C. Hess, J. Goldberger, R. He, Y. Sun, Y. Xia and P. Yang, Nano
Lett., 2003, 3, 1229–1233
125. T. H. Reilly, J. D. Corbman and K. L. Rowlen, Anal. Chem., 2007, 79, 5078–5081
126. Y. Jin, Adv. Mater., 2012, 24, 5153–5165
127. P. Wang, O. Liang, W. Zhang, T. Schroeder and Y. H. Xie, Adv. Mater., 2013, 25,
4918–4924
128. R. Zhang, B. B. Xu, X. Q. Liu, Y. L. Zhang, Y. Xu, Q. D. Chen and H. B. Sun, Chem.
Commun., 2012, 48, 5913–5915 RSC.
129. C. H. Lee, L. Tian and S. Singamaneni, ACS Appl. Mater. Interfaces, 2010, 2,
3429–3435
206
130. W. Zhang, B. Li, L. Chen, Y. Wang, D. Gao, X. Ma and A. Wu, Anal. Methods,
2014, 6, 2066–2071 RSC.
131. Y. H. Ngo, D. Li, G. P. Simon and G. Garnier, Langmuir, 2012, 28, 8782–8790
132. L. Polavarapu and L. M. Liz-Marzán, Phys. Chem. Chem. Phys., 2013, 15, 5288–
5300 RSC.
133. A. Abbas, A. Brimer, J. M. Slocik, L. Tian, R. R. Naik and S. Singamaneni, Anal.
Chem., 2013, 85, 3977–3983
134. L. Zhang, X. Gong, Y. Bao, Y. Zhao, M. Xi, C. Jiang and H. Fong, Langmuir,
2012, 28, 14433–14440
135. D. He, B. Hu, Q. F. Yao, K. Wang and S. H. Yu, ACS Nano, 2009, 3, 3993–4002
136. H. Ko, S. Chang and V. V. Tsukruk, ACS Nano, 2008, 3, 181–188
137. P. Aldeanueva-Potel, E. Faoucher, R. N. A. Alvarez-Puebla, L. M. Liz-Marzán and
M. Brust, Anal. Chem., 2009, 81, 9233–9238
138. X. Zhou, F. Zhou, H. Liu, L. Yang and J. Liu, Analyst, 2013, 138, 5832–5838 RSC.
139. B. Saute and R. Narayanan, Analyst, 2011, 136, 527–532 RSC.
140. S. Abalde-Cela, S. Ho, B. Rodríguez-González, M. A. Correa-Duarte, R. A.
Álvarez-Puebla, L. M. Liz-Marzán and N. A. Kotov,Angew. Chem., 2009, 121,
5430–5433
141. S. S. Dasary, A. K. Singh, D. Senapati, H. Yu and P. C. Ray, J. Am. Chem. Soc.,
2009, 131, 13806–13812
207
142. L. Guerrini, J. V. Garcia-Ramos, C. Domingo and S. Sanchez-Cortes, Anal. Chem.,
2009, 81, 953–960
143. R. A. Álvarez-Puebla, R. Contreras-Cáceres, I. Pastoriza-Santos, J. Pérez-Juste
and L. M. Liz-Marzán, Angew. Chem., Int. Ed., 2009, 48, 138–143
144. L. Guerrini, J. V. Garcia-Ramos, C. Domingo and S. Sanchez-Cortes, Anal. Chem.,
2009, 81, 1418–1425
145. P. Leyton, C. Domingo, S. Sanchez-Cortes, M. Campos-Vallette and J. Garcia-
Ramos, Langmuir, 2005, 21, 11814–11820
146. L. Guerrini, J. V. Garcia-Ramos, C. Domingo and S. Sanchez-Cortes, Langmuir,
2006, 22, 10924–10926
147. S. Z. Nergiz, N. Gandra, M. E. Farrell, L. Tian, P. M. Pellegrino and S.
Singamaneni, J. Mater. Chem. A, 2013, 1, 6543–6549
148. A. Kolomijeca, Y. Kwon, K. Sowoidnich, R. Prien, D. Schulz-Bull and H.
Kronfeldt, Proc. 21th, 2011, 859–862
149. H. Schmidt, N. Bich Ha, J. Pfannkuche, H. Amann, H.-D. Kronfeldt and G.
Kowalewska, Mar. Pollut. Bull., 2004, 49, 229–234
150. J. Pfannkuche, L. Lubecki, H. Schmidt, G. Kowalewska and H.-D. Kronfeldt, Mar.
Pollut. Bull., 2012, 64, 614–626
151. R. J. Rubira, S. A. Camacho, P. H. Aoki, M. D. Maximino, P. Alessio, C. S. Martin,
O. N. Oliveira Jr, F. M. Fatore, F. V. Paulovich and C. J. Constantino, Colloid
Polym. Sci., 2014, 1–10
208
152. J. Zheng, S. Pang, T. P. Labuza and L. He, Analyst, 2013, 138, 7075–7078 RSC.
153. L. XuanáQuang, G. HunáSeong and K. JunáDo, Lab Chip, 2008, 8, 2214–
2219 RSC.
154. D. Lin, T. Qin, Y. Wang, X. Sun and L. Chen, ACS Appl. Mater. Interfaces, 2014, 6,
1320–1329
155. K. L. Rule and P. J. Vikesland, Environ. Sci. Technol., 2009, 43, 1147–1152
156. K. K. Maiti, U. Dinish, C. Y. Fu, J. J. Lee, K. S. Soh, S. W. Yun, R. Bhuvaneswari,
M. Olivo and Y. T. Chang, Biosens. Bioelectron., 2010, 26, 398–403
157. B. Guven, N. Basaran-Akgul, E. Temur, U. Tamer and İ. H. Boyacı, Analyst,
2011, 136, 740–748 RSC.
158. S. Deng, W. Xu, J. Wang, X. Ling, J. Wu, L. Xie, J. Kong, M. S. Dresselhaus and
J. Zhang, Nano Res., 2014, 7, 1271–1279
159. R. A. Tripp, R. A. Dluhy and Y. Zhao, Nano Today, 2008, 3, 31–37