sex differences in academic achievement are modulated by
TRANSCRIPT
Contents lists available at ScienceDirect
Learning and Individual Differences
journal homepage: www.elsevier.com/locate/lindif
Sex differences in academic achievement are modulated by evaluation type☆
Ava Guezc,⁎, Hugo Peyrea,b,c, Franck Ramusca Neurodiderot, INSERM UMR 1141, Paris Diderot University, Paris, Franceb Department of Child and Adolescent Psychiatry, Robert Debré Hospital, APHP, Francec LSCP, Département d'études cognitives, ENS, EHESS, PSL University, CNRS, Paris, France
A R T I C L E I N F O
Keywords:Sex differencesEvaluation characteristicsStandardized testsNational examinationsTeacher grades
A B S T R A C T
Studies on sex differences in academic skills have often reported diverging results depending on the type ofevaluation used, with girls typically obtaining better school grades and results at national examinations, andboys scoring higher at standardized tests. In this paper, we provide a framework for better understanding andinterpreting these differences, integrating previously established factors that affect variations in the gender gapacross evaluation types: writing skills, stakes, self-discipline and grading bias. We apply this framework to adataset containing the results of 23,451 French students in three evaluations characterized by different com-binations of these factors: teacher evaluations, national examinations, and standardized tests. We find that,overall, girls show lower performance than boys in mathematics and higher in French. However, this main effectis modulated by evaluation type: relative to boys, girls over-perform in teacher evaluations and under-perform instandardized achievement tests, compared to national examinations. These effects are larger in mathematicsthan in French. These results offer new insights regarding the extent to which writing skills, stakes, self-disciplineand grading bias may influence the observed gap.
1. Introduction
The question of sex differences in academic skills has garneredmuch attention and concern from researchers and policy-makers in thelast decades. However, studies on the topic often report diverging re-sults depending on how these skills are measured, which muddles in-terpretation.
On the one hand, several meta-analyses analyzing differences inachievement test scores have shown that girls obtain better results atlanguage tests (Hedges & Nowell, 1995; Hyde & Linn, 1988), while boysperform better in mathematics (Else-Quest et al., 2010; Hyde et al.,1990; Reilly et al., 2015), albeit not consistently (Lindberg et al., 2010).The much publicized PISA (Programme for International Student As-sessment) studies have confirmed these findings: at age 15, in mostparticipating countries, girls outperformed boys in reading assessments,while the gap was reversed in mathematics (OECD, 2015). On the otherhand, studies focusing on school marks and examinations consistentlyreported an advantage of girls in all subjects. Thus, the meta-analysis byVoyer and Voyer (2014) revealed that girls outperformed boys acrossall course materials, the largest difference being in language and thesmallest in mathematics. Similarly, in a large sample of UK students,
Deary et al. (2007) found that girls performed better than boys in allsubjects of the GCSE (with the exception of Physics where there was nodifference). Several factors can help explain this apparent contradictionbetween results stemming from achievement tests and school evalua-tions.
First, some evaluations are more likely to assess certain aspects ofstudents' personality and behavior, and in particular, self-discipline. Inthis context, self-discipline is defined as the ability to make a consciouseffort to resist impulses in order to reach a higher goal (Duckworth &Seligman, 2006). As such, it is likely to affect teacher evaluation grades,since they reflect students' behavior in class and homework assignmentcompletion. Previous research has shown that girls tend to displayhigher levels of self-discipline than boys (e.g., meta-analysis of gratifi-cation delay tasks by Silverman, 2003), and this difference partly ex-plains why girls obtain better report card grades than predicted by theirachievement test scores (Duckworth et al., 2015; Duckworth &Seligman, 2006; Kling et al., 2013). Similarly, Steinmayr and Spinath(2008) found that girls' lesser tendency to avoid work (as well as greateragreeableness) partly explained girls' advantage in German schoolmarks (but not in mathematics).
Second, some evaluations tend to assess writing skills more than
https://doi.org/10.1016/j.lindif.2020.101935Received 22 January 2020; Received in revised form 7 August 2020; Accepted 6 September 2020
☆ We acknowledge funding from Agence Nationale de la Recherche (ANR-17-EURE-0017 and ANR-10-IDEX-0001-02 PSL). We thank the Direction de l'Evaluation,de la Prospective et de la Performance for providing us access to the Panel 2007.
⁎ Corresponding author at: LSCP, Département d'Etudes Cognitives, Ecole Normale Supérieure, 29 rue d'Ulm, 75005 Paris, France.E-mail address: [email protected] (A. Guez).
Learning and Individual Differences 83–84 (2020) 101935
1041-6080/ © 2020 Elsevier Inc. All rights reserved.
T
others, depending on the type of response used (typically, open answersversus multiple choice questions). Since girls display higher writingabilities than boys (Feingold, 1988; Hedges & Nowell, 1995; Reillyet al., 2018; Scheiber et al., 2015), this in turn may alter the observedgender gap. Indeed, when presented with open-ended questions, girlsperform relatively better than boys, while boys obtain relatively betterresults when multiple choice questions are used; these results werefound both in language and in mathematics (Bolger & Kellaghan, 1990;Lafontaine and Monseur, 2009b; Lindberg et al., 2010; Reardon et al.,2018 – however, it is possible that this may not hold when item diffi-culty is high: see Beller & Gafni, 2000; Routitsky & Turner, 2003;Willingham & Cole, 1997).
Third, some evaluations create more stress in students due to theirhigh-stakes, which may affect boys' and girls' academic performancedifferently. Exploiting a pure change in stakes in school examinations(high-, medium- and low-stakes), Azmat et al. (2016) found that girlsperformed worse in higher- compared to lower-stakes settings (in Cat-alan, but not in mathematics). Similarly, in settings combining high-stakes and competition, girls obtain lower results than expected acrossall subjects (Cai et al., 2018; Jurajda & Münich, 2011; Ors et al., 2013).One should note that the effect of stress may be confounded with themotivation to perform well at low-stakes tests. Indeed, there is someindication that girls are more motivated than boys to do their best atlow-stakes tests compared to higher-stakes ones, which may affect thesex differences in performance across tests in the same way as stress(DeMars et al., 2013; Eklöf, 2007; OECD, 2015; O'Neil et al., 2005 - notehowever that it is not clear from these papers whether the motivationdifference had any effect on performance at the test).
Fourth, some evaluations, due to their non-blind nature, may gen-erate a grading bias based on students' gender. Past studies have shownin a variety of countries that girls obtain higher results in non-anon-ymous evaluations compared to anonymous ones – thus suggesting thatthere is a grading bias in favor of girls (Breda & Ly, 2015; Falch &Naper, 2013; Lavy, 2008; Protivínský & Münich, 2018; Terrier, 2015;but see Lafontaine & Monseur, 2009a). It may be that this effect ismoderated by ability level, as Lafontaine and Monseur (2009a) foundthat teachers tend to underestimate the performance of high-achievinggirls' in mathematics, and over-estimate the performance of low-achieving girls'.
1.1. Goals of the study
To what extent does each of these evaluation characteristics affectdifferences between boys and girls in academic performance? Howmuch do sex differences in performance depend on these differences inevaluation characteristics? In the present paper, we aimed to explorethese questions by studying differences between boys and girls inmeasured academic performance. We compared boys' and girls' resultsin two subjects (French and mathematics) at three different types ofevaluations for the same set of students (teacher evaluations, nationalexaminations, and standardized achievement tests) from a large, re-presentative sample of middle school students in France.
2. Method
2.1. Sample
We used data from the DEPP Panel 2007, a large cohort study led bythe Direction de l'Evaluation, de la Prospective et de la Performance(DEPP; French Ministry of Education) containing rich data on 34,986French students from their first year of middle school in 2007 (grade 6,11 years old) to their last year of middle school (grade 9, 14 years old)(Trosseille et al., 2013). The study was compulsory and approved by theNational Council for Statistical Information (CNIS) (visa n°2008A061EDand 2011A082ED), ensuring public interest and conformity withethical, statistical and confidentiality standards. The sample was
randomly selected from an exhaustive sampling frame, ensuring re-presentativeness by balancing available characteristics (region, public/private status of the school, urban unit, school establishment, age ofentry in grade 6). The sample was constituted in such a way as to berepresentative of the population of French middle school students, witha slight over-representation of students in schools belonging to theRéseau Ambition Réussite (Success Ambition Network – schools in dis-advantaged areas). The present study focusses on the grade 9 wave,when three different measures of achievement were reported: Nationalexamination grades, teacher grades, and standardized test scores. Ourworking sample includes students for whom results at the three tests inFrench and mathematics were available (N = 23,451). Thus, thesample size was not determined based on expected effect sizes but onavailable data. With this sample size, we are able to detect a sex dif-ference of size d = 0.037 with 80% power. 52% of the participants inour working sample were girls. Students' average age in grade 9 wasequal to 14.09 years (SD = 0.42).
2.2. Measures
2.2.1. Academic achievementThree different measures of academic achievement, in French and
mathematics, were collected in grade 9:
National examination grades: At the end of grade 9 (in June), allFrench students have to take the written tests of a national ex-amination, the Diplôme national du Brevet (DNB). The tests, lasting2 h each, are graded anonymously by teachers, and assess schoolknowledge acquired throughout the school year. They are composedof open-ended questions. In French, the exam is divided in threeparts: open-ended questions on reading comprehension andgrammar; text dictation; and essay. In mathematics, the exam isdivided in three parts as well, including: numerical activities (open-ended questions in arithmetic, algebra and statistics); geometricalactivities (open-ended questions in geometry); and problem solving(open-ended questions on a real-world problem). The DNB writtenexaminations are the first official, nationwide examination thatstudents take, and the grade they obtain constitutes about 40% oftheir final grade at the DNB (the remaining 60% coming from tea-cher grades in grade 9 in all subjects). Therefore, they are relativelyhigh stakes for students.1
Teacher grades: Teacher average grades include grades at in-classtests as well as homework grades throughout the year – therebymore influenced by students' self-discipline (both in terms of dili-gence with respect to school work and behavior in class). The gradescount in the final DNB grade and are of great importance for se-lection into high school. Therefore, they also are relatively highstakes for students.Standardized tests: For the purpose of the Panel 2007 cohort study,the DEPP administered standardized tests to students. These testswere carried out solely for national statistics and research, and hadno impact on students', teachers' or schools' prospects, and were noteven sent back to teachers. They are therefore low stakes for stu-dents. The mathematics test included short open-ended and multiplechoice questions testing students in logic, mental arithmetic, pro-blem solving, units and time calculations, and geometry (45 items)(Aubret & Blanchard, 1992; Blanchard & Berger, 1994; OECD,2011). In French, two tests were administered: a cloze test (blank-filling task) composed of three short texts with missing logical
1We only had access to the final grade of the national examination, not to thedifferent items composing the exam. Therefore, we could not compute relia-bility and consistency indices. We nevertheless provided the correlations be-tween grades at the national examination, teacher grades and standardizedexamination as a proxy for reliability and validity (in Table A2).
A. Guez, et al. Learning and Individual Differences 83–84 (2020) 101935
2

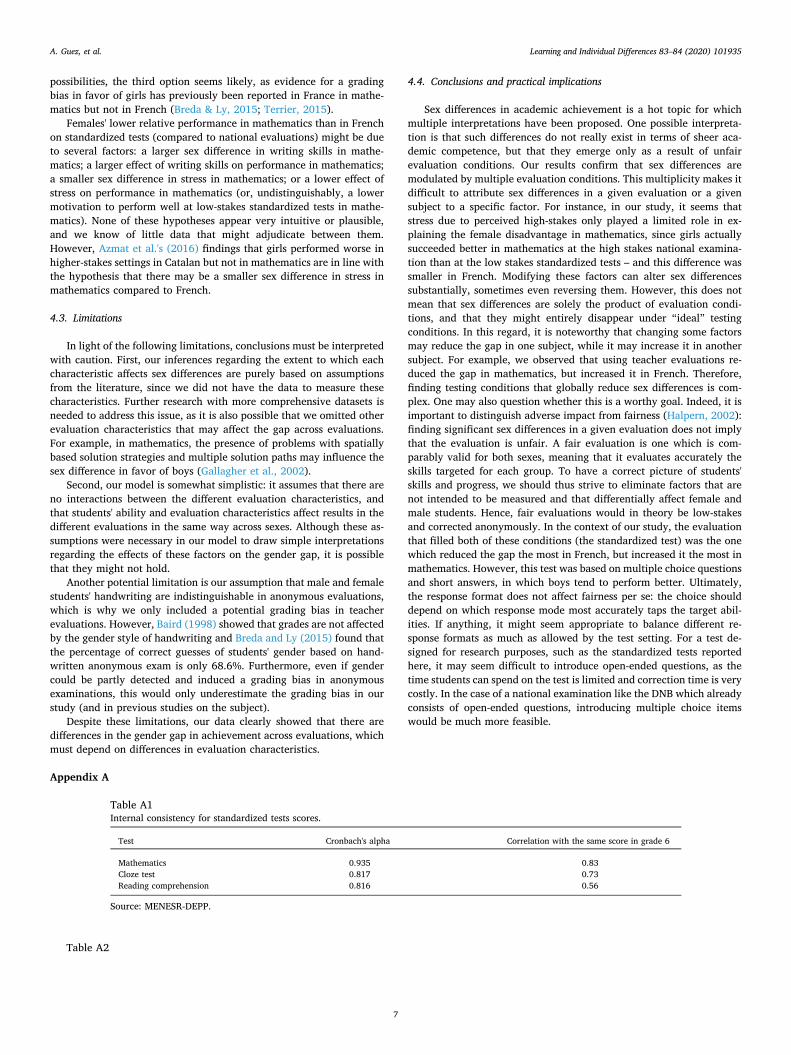
connectors, determiners or pronouns (20 items) (Aubret et al.,2006); and a reading comprehension test in limited time (12 min)composed of three short texts, each followed by five short open-ended questions (Aubret et al., 2006). The tests were administeredfrom April to May. Internal consistency was good (see Table A1).The same tests were administered in grade 6 (except for some itemsthat changed to match students' level), with high correlations be-tween both mathematics and cloze tests in grade 6 and grade 9, anda moderate correlation for the reading comprehension test, sug-gesting an acceptable test-retest reliability (see Table A1).
Note that in the standardized tests, both in mathematics and French,open-ended questions did not require students to write full sentences,but merely to write down a short answer. In contrast, both teacherevaluations and national examinations expected student to write fullsentences as answers. Table A2 shows correlation between the threetypes of evaluation, in Mathematics and in French. Table 1 summarizesthe main characteristics of the three types of evaluation available. Allscores were standardized with a mean 0 and a standard deviation of 1.
2.2.2. CovariatesWe used the following variables in our analysis in order to control
for students' differences in socio-demographic and cognitive char-acteristics:
Socio-demographic variables: As part of the cohort study, parentshad to fill in questionnaires in grade 9. We used information ex-tracted from this questionnaire in our analysis in order to control forsocio-demographic factors: parental education (average of the yearsof education of the mother and the father), household monthly in-come (in logarithmic scale), number of books and CDs at home, ageof entry in grade 6, extracurricular activities, and being schooled ina priority school.Cognitive variables: Along with standardized tests assessing aca-demic performance, students completed a nonverbal intelligencetest in grade 9, Chartier's Reasoning Test on Playing Cards(Raisonnement sur Cartes de Chartier, RCC) (Cronbach's α = 0.87)(Terriot, 2014). They also filled in a questionnaire measuring theirperceived self-efficacy in three different aspects (autoregulation,social, and academic), the Children's Perceived Self-Efficacy scales(Bandura, 1990), from which three factor scores were constructedusing confirmatory factor analysis (Cronbach's α above 0.80 foreach of the three scores). Lastly, they answered a questionnairemeasuring school related motivation (intrinsic motivation, extrinsicmotivation, and amotivation) derived from the Academic Self-Reg-ulation Questionnaire (Ryan & Connell, 1989), from which threefactor scores were constructed using confirmatory factor analysis(Cronbach's α = 0.85 for intrinsic motivation and 0.68 for extrinsicmotivation and amotivation).
2.3. Analyses
Statistical analyses were carried out with the software SAS.2
2.3.1. Descriptive statisticsWe first used descriptive statistics to understand how the gender gap
in performance varies with the subject and evaluation type. We assessedthe effect size of the difference for each evaluation score by computingCohen's d, i.e. the standardized difference between male and femalestudents' means.
2.3.2. Omnibus testsIn a second step, we performed omnibus tests with a repeated
measured ANOVA in order to test whether the main effects of sex,subject and evaluation type, as well as their interactions with sex, arestatistically significant. Note that, since scores were standardized foreach test, there should be no main effect of subject and evaluation type.
2.3.3. Difference-in-differencesIn a third step, we used difference-in-differences regressions to es-
timate the sign and significance of the effects of evaluation type on thegender gap in achievement in French and mathematics. This methodhas already been used in sex differences studies, in particular to assessthe existence of a grading bias (Breda & Ly, 2015; Lavy, 2008; Terrier,2015). As is summarized in Table 1, we assume that the three evalua-tion types (national examinations, teacher evaluations, and standar-dized tests) have different characteristics. Independently from socio-demographic and individual factors which affect performance similarlyacross evaluations, we suppose that results at standardized tests solelyreflect students' ability in the subject; that results at the national ex-aminations are, in addition, dependent on students' writing skills andtheir ability to cope with stress (induced by the high stakes involved)3;and that results at teacher evaluations are, in addition to all of theabove, influenced by students' self-discipline and teachers' biases (sincethey are not anonymous). It is likely that these characteristics affectmale and female students differently. Based on the literature, we hy-pothesize for example that female students would have an advantagewhen the evaluation relies more heavily on writing skills, when it isinfluenced by self-discipline, and when it is not anonymous. Similarly,we hypothesize that they would be at a disadvantage when the stakesare higher. In order to assess the relative influence of these differentfactors on the achievement gap between male and female students, weanalyzed how the gender gap changes depending on the evaluationused. The presence of the three scores (standardized score, teachergrade, and national examinations grade) in each subject (French andmathematics) allowed us to use a difference-in differences estimationstrategy with three different conditions. The score obtained by a stu-dent i on evaluation j (Score – standardized with a mean 0 and astandard deviation of 1) depends on her sex (dummy variable Fem equalto 1 if the student is a female) and on the type of the evaluation(dummy variables Teach and Std equal to 1 for teacher evaluation orstandardized test, respectively – the national examinations constitutethe reference condition here). We may thus write the equation of thescore for student i at evaluation j as follow:
= + + + + × +
× + u
Score
Fem Teach Std (Fem Teach )
(Fem Std )
ij
i ij ij i ij
i ij ij
1 2 1 2
(1)
Our coefficients of interest are those of the interaction terms, δ1 andδ2. Estimating δ1 and δ2 with Eq. (1) is equivalent to estimating them
Table 1Characteristics of the three types of tests available in grade 9.
Characteristics Teachergrades
Nationalexaminations
Standardized tests
Anonymous scoring No Yes YesStakes High High LowAssessing writing
skillsYes Yes No
Role of self-discipline Yes No No
2 The script is available on the Open Science Framework with the link:https://osf.io/c37hb/?view_only=d227c87f5ffd439fbb5d8cc0ec84c5a7. Dataare available on request on the Quételet PROGEDO French data archives forhuman and social sciences: http://www.progedo-adisp.fr/enquetes/XML/lil-0955.xml.
3 As noted in the introduction, the effect of stress on high-stakes tests versuslow-stakes tests may be confounded with motivation to perform at low-stakestests, but it is not possible to disentangle them.
A. Guez, et al. Learning and Individual Differences 83–84 (2020) 101935
3

with a difference equation where the difference in scores is the de-pendent variable (Lavy, 2008). In order to obtain δ1 and δ2, we esti-mated Eq. (1) using generalized estimating equations (Liang & Zeger,1986) with standard errors clustered at the individual level in order tocorrect for dependence among our repeated observations (PROCGENMOD).4 In addition, we estimated Eq. (1) controlling for socio-demographic variables. We subsequently included individual cognitivevariables as covariates in order to see whether they would explain theobserved differences. Missing data in covariates (see Table 2) weredealt with using multiple imputation (Rubin, 1987) (PROC MI andPROC MIANALYZE with MCMC method and 10 imputed datasets).
δ1 measures to what extent the discrepancy between teacher eva-luation scores and national examinations (DNB) scores differs betweenmale and female students. Similarly, δ2 reflects to what extent thediscrepancy between standardized test scores and national examina-tions (DNB) scores differs between male and female students. We canindeed derive from the above equation that:
=(Teach_Score DNB_Score) (Teach_Score DNB_Score)Fem Male1
(2a)
=(Std_Score DNB_Score) (Std_Score DNB_Score)Fem Male2
(2b)
We can further express the score at each type of evaluation – henceδ1 and δ2 – in terms of the evaluation's hypothesized characteristics. Asstated above, standardized tests should solely measure ability in thesubject; while both national examinations and teacher evaluation scoresshould also reflect their writing skills, and their ability to cope withstress. In addition, teacher evaluations may reflect potential genderbiases in grading, and students' discipline. We can formalize this asfollow:
= +Std_Score abilityi i i1 (3a)
= + + + µDNB_Score ability writing stressi i i i i1 2 3 (3b)
= + + + + +Teach_Score
ability writing stress discipline Femi
i i i i i i1 2 3 4 5
(3c)
The variables ability, writing, stress and discipline represent, respec-tively, a student's general ability in the subject, her writing skills, herability to cope with stress, and her self-discipline – characteristics thatwe do not measure directly. We assume that each of these unobservedfactors affects results at the different evaluations the same way, formales and females (i.e. the coefficients α1, α2, α3 and α4 are assumed tobe the same across evaluations and sexes for a given subject). The lastcoefficient α5 represents the grading bias (such that if it is positive,there is a bias in favor of girls, and if it is negative, there is a bias infavor of boys). Injecting Eqs. (3a), (3b) and (3c) into Eqs. (2a) and (2b),we obtain:
= +(discipline discipline )1 4Fem Male
5 (4a)
= (writing writing ) (stress stress )2 2Fem Male
3Fem Male (4b)
Obviously, it will not be possible to determine the values of all theunknowns, since the observed variables will be fewer. It will never-theless be possible to make some valuable inferences. Indeed, δ1 reflectsthe difference between male and female students that can be attributedto grading bias and discipline, while δ2 reflects the difference betweenmale and female students that can be attributed to writing skills and theability to cope with stress. The signs of δ1 and δ2, estimated with Eq.(1), can thus inform us on the relative effect of the different unobservedevaluation factors on the gender gap in performance. Since higher
general ability, writing skills, ability to cope with stress and disciplineare associated with higher test scores, α1, α2, α3 and α4 are assumed tobe positive. Based on the extant literature, we expect female students toexhibit on average higher levels of self-discipline than their malecounterparts. We also expect the grading bias to be in favor of femalestudents (positive α5). Therefore, we expect to find a positive δ1. Be-sides, we expect female students to have better writing skills, but tocope less well with stress. Thus, the two terms in Eq. (4b) are expectedto be of opposite sign. A positive δ2 would thus mean that the ability tocope with stress plays a more important role than writing skills in thegender gap in performance (whether it stems from the respective sizesof the α2 and α3 coefficients or the magnitude of the gender gaps inwriting ability and stress). If δ2 is null, then this means that both factorscancel out. Lastly, a negative δ2 would suggest that writing skills play amore important role than the ability to cope with stress in the gendergap in performance.
3. Results
3.1. Sex differences between subjects and evaluation types
Table 2 shows descriptive statistics for all academic achievementvariables as well as socio-demographic variables and cognitive vari-ables by sex, and the effect size of the difference between male andfemale students.
Fig. 1 displays the distribution of evaluation scores for male andfemale students by subject and evaluation type, and Fig. 2 representsthe effect sizes of the sex difference in performance across evaluations.Globally, female students performed better than their male peers inFrench, while the reverse was true in mathematics. However, their re-spective performance appears to depend on the evaluation used. Thereis indeed a clear trend as illustrated in Fig. 1, whereby both in Frenchand mathematics female students scored the highest in teacher eva-luations, followed by national examinations and lastly by standardizedtests. Conversely, male students obtained their highest grades withstandardized tests, followed by national examinations and teacherevaluations. Consequently, the gender gap in scores varies considerablyacross evaluation types, as illustrated in Fig. 2. This is most striking ifwe look at sex differences in mathematics scores across evaluationtypes: while the gap is clearly in favor of male students in the stan-dardized test (d =−0.41, p < 0.001), it shrinks but is still in favor ofmale students in the national examination (d = −0.11, p < 0.001),and is almost null and reversed in the teacher examination (d = 0.05,p < 0.001). In French as well, the gap appears to vary across eva-luation types, although it is in favor of female students in all threeevaluations: the effect size is medium in the teacher evaluation(d = 0.43, p < 0.001) as well as in the national examination(d = 0.40, p < 0.001), but is small in the standardized test (d = 0.18,p < 0.001).
3.2. Omnibus interaction effects between subject, evaluation type, and sex
In order to assess the significance of these overall moderating effectsof subject and evaluation type on the gender gap, we turn to resultsfrom the repeated measured ANOVA. Results are reported in Table 3.First, we observe a main effect of sex (p < 0.0001), reflecting theoverall higher mean performance of girls over boys. Second, the maineffects of evaluation type and subject are, as expected, non-significant(given that the scores were standardized). Third, the interaction be-tween sex and evaluation type is significant (p < 0.0001), reflectingthat teacher evaluations and the national exam yield a mean advantagefor girls, while standardized tests yield a mean advantage for boys.Fourth, the interaction between sex and subject is significant(p < 0.0001), reflecting that girls perform better than boys in French,and less well in Mathematics. Finally, the three-way interaction be-tween sex, evaluation type, and subject was also significant
4 We could not cluster at the school or class level because such informationwas not available.
A. Guez, et al. Learning and Individual Differences 83–84 (2020) 101935
4

(p < 0.0001), reflecting that the magnitude of the sex by evaluationinteraction is larger in Mathematics than in French (all interactions areclearly visible in Fig. 2).
3.3. Relative effects of evaluation characteristics on sex differences
In order to properly measure this apparent effect of evaluation typeon the gender gap in achievement across subjects, we turn to the dif-ference-in-differences estimation.
Table 4 displays results from the difference-in-differences regressionwithout covariates. The coefficients of interest are the two interactionterms.
The coefficient δ1 of the interaction term between Female andTeacher evaluation is significantly different from zero and positive, bothin French and mathematics. Thus, female students increased theirperformance in teacher evaluations relative to the national examina-tions more than their male counterparts. According to our analysis ofEq. (4a), this may be due to greater self-discipline for homework andregular study in females, or teacher bias in favor of females, both
Table 2Descriptive statistics for achievement, socio-demographic, and cognitive variables, by sex.
Variables N Girls (N = 12,180) Boys (N = 11,271) Difference
M or % SD M or % SD d or O.R. [C.I.] p
Academic achievement variablesFrench DNB grade (z-score) 23,451 0.18 0.96 −0.21 1.00 0.40 [0.37; 0.42] <0.001French teacher grade (z-score) 23,451 0.20 0.97 −0.22 0.99 0.42 [0.40; 0.45] <0.001French standardized test (z-score) 23,451 0.09 0.99 −0.09 1.00 0.18 [0.15; 0.21] <0.001Mathematics DNB grade (z-score) 23,451 −0.05 0.97 0.05 1.03 −0.11 [−0.13; −0.08] <0.001Mathematics teacher grade (z-score) 23,451 0.03 1.00 −0.03 1.00 0.05 [0.03; 0.08] <0.001Mathematics standardized test (z-score) 23,451 −0.19 0.99 0.21 0.97 −0.40 [−0.43; −0.38] <0.001
Socio-demographic variablesParental education (years) 22,104 12.13 3.39 12.38 3.43 −0.07 [−0.10; −0.08] <0.001Household monthly income (EUR) 13,412 3309 3783 3448 4070 −0.04 [−0.07; 0.00] 0.0408Number of books and CDs in the household (score) 22,200 0.08 0.89 0.10 0.89 −0.02 [−0.05; 0.00] 0.0683Age of entry in grade 6 (years) 23,451 11.08 0.40 11.09 0.00 −0.03 [−0.05; 0.00] 0.0491Extracurricular activities (score) 21,775 0.27 0.27 0.28 0.27 −0.04 [−0.06: −0.01] 0.0049Schooled in a disadvantaged area (%, OR) 21,661 17.50 – 16.48 – 1.08 [1.00; 1.15] 0.0379
Cognitive variablesNon-verbal intelligence (out of 30) 23,306 18.85 5.59 18.82 6.02 0.00 [−0.02; 0.03] 0.7635Perceived self-efficacy in autoregulation (z-score) 23,236 0.02 1.00 −0.02 1.00 0.04 [0.01; 0.07] 0.0023Perceived academic self-efficacy (z-score) 22,517 0.10 0.97 −0.11 1.01 0.22 [0.19; 0.24] <0.001Perceived social self-efficacy (z-score) 22,692 −0.19 1.03 0.21 0.92 −0.41 [−0.44; −0.39] <0.001Intrinsic motivation (z-score) 23,089 0.04 0.99 −0.04 1.01 0.08 [0.057; 0.11] <0.001Extrinsic motivation (z-score) 23,089 −0.02 0.98 0.02 1.02 −0.04 [−0.06; −0.01] 0.0038Amotivation (z-score) 23,089 −0.17 0.85 0.18 1.11 −0.36 [−0.38; −0.33] <0.001
Source: MENESR DEPP.
Fig. 1. Distribution of test scores, by subject, sex and test type. The solid blacklines represent group means and the beans the smoothed density curves.Source: MENESR DEPP.
Fig. 2. Difference in test scores between male and female students, by subjectand test type. Error bars indicate 95% confidence intervals; and stars (*) in-dicate p < 0.001. “Standard. test” stands for standardized tests; “Nat. exam.”stands for national examinations; and “Teach. eval.” stands for teacher eva-luations.Source: MENESR DEPP.
Table 3Results from a repeated measures ANOVA with evaluation type and subject aswithin-subject variables.
Variables Df F value p-Value
Sex 1 295.60 < 0.0001Evaluation type 2 0.38 0.685Subject 1 0.33 0.564Sex ∗ Evaluation type 2 397.15 < 0.0001Sex ∗ Subject 1 2111.46 < 0.0001Evaluation type ∗ Subject 2 0.13 0.876Sex ∗ Evaluation type ∗ Subject 2 35.43 < 0.0001
Source: MENESR-DEPP.
A. Guez, et al. Learning and Individual Differences 83–84 (2020) 101935
5

factors likely to increase scores in teacher evaluations relative to na-tional examinations. The effect is very small in French (δ1 = 0.03,p = 0.0056), but larger in mathematics (δ1 = 0.16, p < 0.001).
The second coefficient of interest, δ2, is that of the interaction termbetween Female and Standardized test. It is significantly different fromzero, negative and of moderate size both in mathematics (δ2 = −0.30,p < 0.001) and in French (δ2 = −0.22, p < 0.001). Indeed, femalestudents' performance was lower in standardized tests than at the na-tional examinations, whereas that of their male peers was higher instandardized tests than at the national examinations. As indicated in Eq.(4b), the negative sign of δ2 suggests that writing skills play a moreimportant role in the observed gender gap in performance than theability to cope with stress. Indeed, female students scored lower in thestandardized tests despite the fact that these tests were lower stakes andtherefore less stressful than the national examinations.
As can be seen from Tables A3 and A4, additional adjustment onstudents' socio-demographic and cognitive factors had little effect onthe estimates of δ1 and δ2. Thus, these characteristics do not explain thegender gap in performance across evaluation types. As a last step, inorder to ensure that the estimated effects do not reflect the effects ofinteractions between evaluation type and other variables that wouldcorrelate with sex, we added interaction terms between our evaluationtype dummies and all other covariates. The results are reported in TableA5. We can see that our coefficients of interest (the interactions be-tween sex and evaluation type) are slightly reduced. In French, δ1 is stillnon-significant and reduces from 0.03 in the regression without inter-actions, to −0.02 when adding in the control interaction terms; whileδ2 reduces from −0.22 to −0.18 (p < 0.001). In mathematics, δ1reduces from 0.16 to 0.12 (p < 0.001) and δ2 from −0.30 to −0.25(p < 0.001). This decrease is due to the fact that there were significantinteraction effects between evaluation type and other covariates, mostnotably being schooled in a disadvantaged area, and academic self-ef-ficacy. However, these other interactions did not reduce by much thesex by evaluation type interaction terms, which thus strengthens ourresults.
4. Discussion
This paper aimed at better understanding the relative influences ofevaluation characteristics on sex differences in academic achievement.We compared boys' and girls' results at three different types of eva-luations (teacher evaluations, national examinations, and standardizedachievement tests) both in French and mathematics, from the same setof 23,451 middle school French students. We found that, across subjectsand evaluation types, girls performed better than boys. However, thismain effect was modulated by subject: relative to boys, girls obtainedbetter results in French, and worse in mathematics. Crucially, the effectof sex was also modulated by the evaluation type, although this mod-eration was smaller than the sex difference across subjects. This effectwas the focus of our paper, which we discuss more thoroughly now.
4.1. Evaluation conditions affect sex differences in achievement
In line with previous findings, we found that girls performed betterthan boys in French, and worse in mathematics, when assessed withstandardized achievement tests (Else-Quest et al., 2010; Hedges &Nowell, 1995; Hyde et al., 1990; Hyde & Linn, 1988; OECD, 2015; butsee Lindberg et al., 2010), and that they performed better in both whenassessed with teacher evaluations (Voyer & Voyer, 2014). Contrary toprevious findings on national examinations by Deary et al. (2007),showing that British female students scored significantly higher thanmales in both English (d = 0.41) and mathematics (d = 0.03), wefound that French female students performed higher in French(d = 0.40), but lower in mathematics (d =−0.11). This result may bedue to socio-economic and cultural differences. For instance, the UK'sGlobal Gender Gap Index (GGI), which measures gender parity in theareas of health, education, economy and politics, was higher thanFrance's in the 2000s (Hausmann et al., 2010). Moreover, boys reportedthat their parents find mathematics more important to study and fortheir future career than girls do, and this difference is lower in the UK(Stoet et al., 2016). Both the GGI and the gender gap in parentalmathematics valuation are correlated with the gender gap in mathe-matics achievement in PISA (Stoet et al., 2016). Although these resultscontrast with the larger advantage of boys over girls in PISA mathe-matics test in the UK compared to France, it is possible that such socio-economic and cultural variations are more strongly associated withresults at national examinations than at lower-stakes standardizedachievement tests such as PISA.
4.2. Interpretations of the effect of evaluation conditions
In both French and mathematics, girls over-performed in teacherevaluations, and under-performed in standardized achievement tests,compared to national examinations. The former effect was expected,given that higher stakes and grading bias are supposed to be detri-mental to girls' performance in national evaluations compared to tea-cher evaluations. The latter is more interesting. Indeed, female studentsshould have an advantage in national examinations compared to stan-dardized tests due to the higher requirements on writing skills in thefirst; however, the higher stakes in national examinations should play infavor of boys compared to standardized tests. Therefore, the findingthat girls under-performed in standardized achievement tests comparedto national examinations indicates that writing skills play a more im-portant role than stakes in the gender gap in performance. The fact thatthese effects were in the same direction in French and mathematicssuggests that the mechanisms at play are the same in both subjects.
Interestingly, both girls' over-performance in teacher evaluationsand under-performance in standardized tests were larger in mathe-matics than in French. Females' greater relative performance inmathematics than in French during teacher evaluations (compared tonational examinations) may result from superior self-discipline inmathematics, a greater effect of self-discipline on mathematics, or fromteachers having a greater grading bias in favor of females in mathe-matics. While our data does not allow us to distinguish these
Table 4Difference-in-differences regression estimates.
Parameters French Mathematics
β [C.I.] p β [C.I.] p
Female 0.40 [0.37; 0.42] < 0.0001 −0.11 [−0.13; −0.08] < 0.0001Teacher evaluation −0.01 [−0.03; 0.00] 0.0492 −0.08 [−0.10; −0.07] < 0.0001Standardized test 0.11 [0.10; 0.13] < 0.0001 0.16 [0.14; 0.17] < 0.0001Female × Teacher evaluation (δ1) 0.03 [0.01; 0.05] 0.0056 0.16 [0.14; 0.18] < 0.0001Female × Standardized test (δ2) −0.22 [−0.24; −0.20] < 0.0001 −0.30 [−0.32; −0.28] < 0.0001
Source: MENESR-DEPP.
A. Guez, et al. Learning and Individual Differences 83–84 (2020) 101935
6
possibilities, the third option seems likely, as evidence for a gradingbias in favor of girls has previously been reported in France in mathe-matics but not in French (Breda & Ly, 2015; Terrier, 2015).
Females' lower relative performance in mathematics than in Frenchon standardized tests (compared to national evaluations) might be dueto several factors: a larger sex difference in writing skills in mathe-matics; a larger effect of writing skills on performance in mathematics;a smaller sex difference in stress in mathematics; or a lower effect ofstress on performance in mathematics (or, undistinguishably, a lowermotivation to perform well at low-stakes standardized tests in mathe-matics). None of these hypotheses appear very intuitive or plausible,and we know of little data that might adjudicate between them.However, Azmat et al.'s (2016) findings that girls performed worse inhigher-stakes settings in Catalan but not in mathematics are in line withthe hypothesis that there may be a smaller sex difference in stress inmathematics compared to French.
4.3. Limitations
In light of the following limitations, conclusions must be interpretedwith caution. First, our inferences regarding the extent to which eachcharacteristic affects sex differences are purely based on assumptionsfrom the literature, since we did not have the data to measure thesecharacteristics. Further research with more comprehensive datasets isneeded to address this issue, as it is also possible that we omitted otherevaluation characteristics that may affect the gap across evaluations.For example, in mathematics, the presence of problems with spatiallybased solution strategies and multiple solution paths may influence thesex difference in favor of boys (Gallagher et al., 2002).
Second, our model is somewhat simplistic: it assumes that there areno interactions between the different evaluation characteristics, andthat students' ability and evaluation characteristics affect results in thedifferent evaluations in the same way across sexes. Although these as-sumptions were necessary in our model to draw simple interpretationsregarding the effects of these factors on the gender gap, it is possiblethat they might not hold.
Another potential limitation is our assumption that male and femalestudents' handwriting are indistinguishable in anonymous evaluations,which is why we only included a potential grading bias in teacherevaluations. However, Baird (1998) showed that grades are not affectedby the gender style of handwriting and Breda and Ly (2015) found thatthe percentage of correct guesses of students' gender based on hand-written anonymous exam is only 68.6%. Furthermore, even if gendercould be partly detected and induced a grading bias in anonymousexaminations, this would only underestimate the grading bias in ourstudy (and in previous studies on the subject).
Despite these limitations, our data clearly showed that there aredifferences in the gender gap in achievement across evaluations, whichmust depend on differences in evaluation characteristics.
4.4. Conclusions and practical implications
Sex differences in academic achievement is a hot topic for whichmultiple interpretations have been proposed. One possible interpreta-tion is that such differences do not really exist in terms of sheer aca-demic competence, but that they emerge only as a result of unfairevaluation conditions. Our results confirm that sex differences aremodulated by multiple evaluation conditions. This multiplicity makes itdifficult to attribute sex differences in a given evaluation or a givensubject to a specific factor. For instance, in our study, it seems thatstress due to perceived high-stakes only played a limited role in ex-plaining the female disadvantage in mathematics, since girls actuallysucceeded better in mathematics at the high stakes national examina-tion than at the low stakes standardized tests – and this difference wassmaller in French. Modifying these factors can alter sex differencessubstantially, sometimes even reversing them. However, this does notmean that sex differences are solely the product of evaluation condi-tions, and that they might entirely disappear under “ideal” testingconditions. In this regard, it is noteworthy that changing some factorsmay reduce the gap in one subject, while it may increase it in anothersubject. For example, we observed that using teacher evaluations re-duced the gap in mathematics, but increased it in French. Therefore,finding testing conditions that globally reduce sex differences is com-plex. One may also question whether this is a worthy goal. Indeed, it isimportant to distinguish adverse impact from fairness (Halpern, 2002):finding significant sex differences in a given evaluation does not implythat the evaluation is unfair. A fair evaluation is one which is com-parably valid for both sexes, meaning that it evaluates accurately theskills targeted for each group. To have a correct picture of students'skills and progress, we should thus strive to eliminate factors that arenot intended to be measured and that differentially affect female andmale students. Hence, fair evaluations would in theory be low-stakesand corrected anonymously. In the context of our study, the evaluationthat filled both of these conditions (the standardized test) was the onewhich reduced the gap the most in French, but increased it the most inmathematics. However, this test was based on multiple choice questionsand short answers, in which boys tend to perform better. Ultimately,the response format does not affect fairness per se: the choice shoulddepend on which response mode most accurately taps the target abil-ities. If anything, it might seem appropriate to balance different re-sponse formats as much as allowed by the test setting. For a test de-signed for research purposes, such as the standardized tests reportedhere, it may seem difficult to introduce open-ended questions, as thetime students can spend on the test is limited and correction time is verycostly. In the case of a national examination like the DNB which alreadyconsists of open-ended questions, introducing multiple choice itemswould be much more feasible.
Appendix A
Table A1Internal consistency for standardized tests scores.
Test Cronbach's alpha Correlation with the same score in grade 6
Mathematics 0.935 0.83Cloze test 0.817 0.73Reading comprehension 0.816 0.56
Source: MENESR-DEPP.
Table A2
A. Guez, et al. Learning and Individual Differences 83–84 (2020) 101935
7
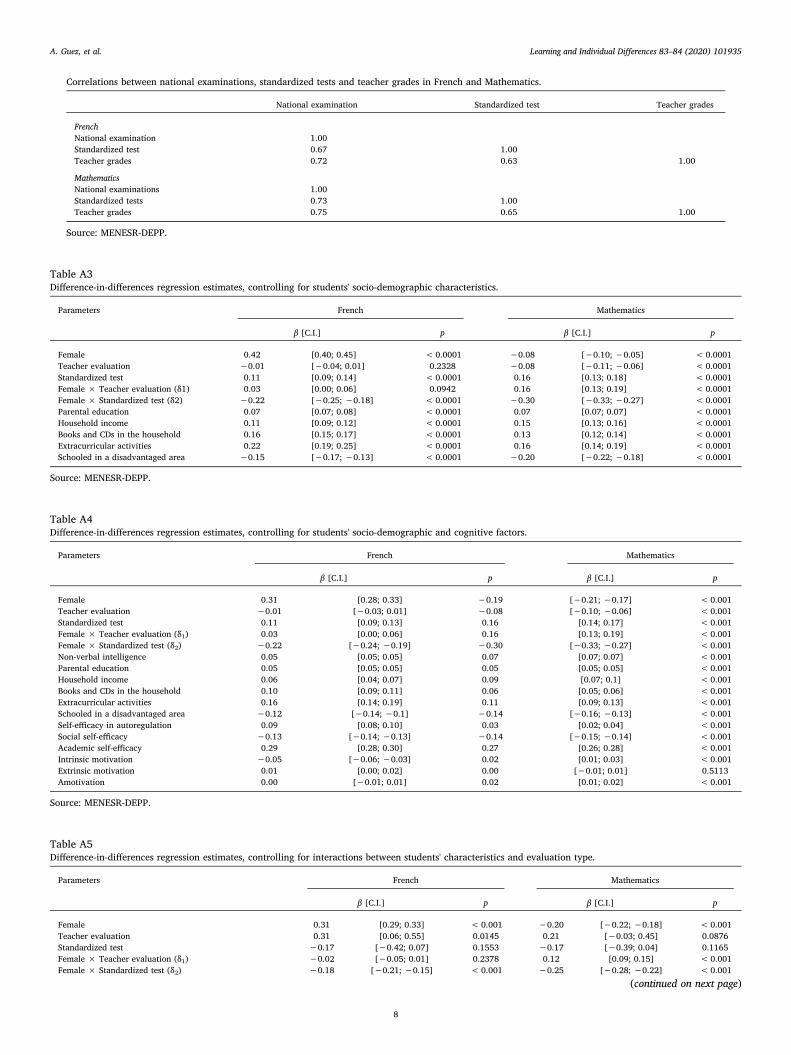
Correlations between national examinations, standardized tests and teacher grades in French and Mathematics.
National examination Standardized test Teacher grades
FrenchNational examination 1.00Standardized test 0.67 1.00Teacher grades 0.72 0.63 1.00
MathematicsNational examinations 1.00Standardized tests 0.73 1.00Teacher grades 0.75 0.65 1.00
Source: MENESR-DEPP.
Table A3Difference-in-differences regression estimates, controlling for students' socio-demographic characteristics.
Parameters French Mathematics
β [C.I.] p β [C.I.] p
Female 0.42 [0.40; 0.45] < 0.0001 −0.08 [−0.10; −0.05] < 0.0001Teacher evaluation −0.01 [−0.04; 0.01] 0.2328 −0.08 [−0.11; −0.06] < 0.0001Standardized test 0.11 [0.09; 0.14] < 0.0001 0.16 [0.13; 0.18] < 0.0001Female × Teacher evaluation (δ1) 0.03 [0.00; 0.06] 0.0942 0.16 [0.13; 0.19] < 0.0001Female × Standardized test (δ2) −0.22 [−0.25; −0.18] < 0.0001 −0.30 [−0.33; −0.27] < 0.0001Parental education 0.07 [0.07; 0.08] < 0.0001 0.07 [0.07; 0.07] < 0.0001Household income 0.11 [0.09; 0.12] < 0.0001 0.15 [0.13; 0.16] < 0.0001Books and CDs in the household 0.16 [0.15; 0.17] < 0.0001 0.13 [0.12; 0.14] < 0.0001Extracurricular activities 0.22 [0.19; 0.25] < 0.0001 0.16 [0.14; 0.19] < 0.0001Schooled in a disadvantaged area −0.15 [−0.17; −0.13] < 0.0001 −0.20 [−0.22; −0.18] < 0.0001
Source: MENESR-DEPP.
Table A4Difference-in-differences regression estimates, controlling for students' socio-demographic and cognitive factors.
Parameters French Mathematics
β [C.I.] p β [C.I.] p
Female 0.31 [0.28; 0.33] −0.19 [−0.21; −0.17] <0.001Teacher evaluation −0.01 [−0.03; 0.01] −0.08 [−0.10; −0.06] <0.001Standardized test 0.11 [0.09; 0.13] 0.16 [0.14; 0.17] <0.001Female × Teacher evaluation (δ1) 0.03 [0.00; 0.06] 0.16 [0.13; 0.19] <0.001Female × Standardized test (δ2) −0.22 [−0.24; −0.19] −0.30 [−0.33; −0.27] <0.001Non-verbal intelligence 0.05 [0.05; 0.05] 0.07 [0.07; 0.07] <0.001Parental education 0.05 [0.05; 0.05] 0.05 [0.05; 0.05] <0.001Household income 0.06 [0.04; 0.07] 0.09 [0.07; 0.1] <0.001Books and CDs in the household 0.10 [0.09; 0.11] 0.06 [0.05; 0.06] <0.001Extracurricular activities 0.16 [0.14; 0.19] 0.11 [0.09; 0.13] <0.001Schooled in a disadvantaged area −0.12 [−0.14; −0.1] −0.14 [−0.16; −0.13] <0.001Self-efficacy in autoregulation 0.09 [0.08; 0.10] 0.03 [0.02; 0.04] <0.001Social self-efficacy −0.13 [−0.14; −0.13] −0.14 [−0.15; −0.14] <0.001Academic self-efficacy 0.29 [0.28; 0.30] 0.27 [0.26; 0.28] <0.001Intrinsic motivation −0.05 [−0.06; −0.03] 0.02 [0.01; 0.03] <0.001Extrinsic motivation 0.01 [0.00; 0.02] 0.00 [−0.01; 0.01] 0.5113Amotivation 0.00 [−0.01; 0.01] 0.02 [0.01; 0.02] <0.001
Source: MENESR-DEPP.
Table A5Difference-in-differences regression estimates, controlling for interactions between students' characteristics and evaluation type.
Parameters French Mathematics
β [C.I.] p β [C.I.] p
Female 0.31 [0.29; 0.33] < 0.001 −0.20 [−0.22; −0.18] <0.001Teacher evaluation 0.31 [0.06; 0.55] 0.0145 0.21 [−0.03; 0.45] 0.0876Standardized test −0.17 [−0.42; 0.07] 0.1553 −0.17 [−0.39; 0.04] 0.1165Female × Teacher evaluation (δ1) −0.02 [−0.05; 0.01] 0.2378 0.12 [0.09; 0.15] <0.001Female × Standardized test (δ2) −0.18 [−0.21; −0.15] < 0.001 −0.25 [−0.28; −0.22] <0.001
(continued on next page)
A. Guez, et al. Learning and Individual Differences 83–84 (2020) 101935
8

Table A5 (continued)
Parameters French Mathematics
β [C.I.] p β [C.I.] p
Parental education × Teacher evaluation −0.01 [−0.01; 0.00] 0.0012 −0.01 [−0.02; −0.01] <0.001Parental education × Standardized test 0.00 [−0.01; 0] 0.2016 −0.01 [−0.02; −0.01] <0.001Household income × Teacher evaluation −0.02 [−0.05; 0.02] 0.3085 −0.01 [−0.04; 0.02] 0.5715Household income × Standardized test −0.02 [−0.05; 0.02] 0.3232 −0.01 [−0.04; 0.02] 0.3979Books and CDs × Teacher evaluation −0.02 [−0.04; 0] 0.0516 −0.03 [−0.05; −0.01] 0.0013Books and CDs × Standardized test 0.04 [0.02; 0.06] < 0.001 0.02 [0; 0.04] 0.0242Extracurricular activities × Teacher evaluation −0.01 [−0.06; 0.05] 0.8535 0.01 [−0.05; 0.06] 0.8210Extracurricular activities × Standardized test −0.01 [−0.06; 0.05] 0.7723 −0.02 [−0.07; 0.04] 0.5127Schooled in a disadvantaged area × Teacher evaluation 0.19 [0.15; 0.23] < 0.001 0.28 [0.24; 0.32] <0.001Schooled in a disadvantaged area × Standardized test −0.08 [−0.12; −0.04] < 0.001 0.01 [−0.02; 0.05] 0.4849Non-verbal intelligence × Teacher evaluation 0.00 [0; 0] 0.8188 0.00 [0; 0] 0.1595Non-verbal intelligence × Standardized test 0.02 [0.02; 0.02] < 0.001 0.03 [0.02; 0.03] <0.001Self-efficacy in autoregulation × Teacher evaluation −0.03 [−0.06; −0.01] 0.0032 −0.02 [−0.04; 0] 0.0536Self-efficacy in autoregulation × Standardized test 0.07 [0.04; 0.09] < 0.001 0.03 [0.01; 0.05] 0.0039Social self-efficacy × Teacher evaluation −0.05 [−0.07; −0.03] < 0.001 −0.03 [−0.05; −0.02] 0.0002Social self-efficacy × Standardized test 0.04 [0.02; 0.06] < 0.001 0.07 [0.06; 0.09] <0.001Academic self-efficacy × Teacher evaluation 0.13 [0.1; 0.15] < 0.001 0.09 [0.07; 0.11] <0.001Academic self-efficacy × Standardized test −0.08 [−0.1; −0.06] < 0.001 −0.11 [−0.13; −0.09] <0.001Intrinsic motivation × Teacher evaluation 0.03 [0; 0.06] 0.0211 0.02 [0; 0.05] 0.0777Intrinsic motivation × Standardized test −0.02 [−0.05; 0.01] 0.1142 −0.05 [−0.08; −0.03] <0.001Extrinsic motivation × Teacher evaluation 0.02 [−0.01; 0.04] 0.1783 0.02 [0; 0.04] 0.1221Extrinsic motivation × Standardized test −0.03 [−0.06; −0.01] 0.0083 0.00 [−0.02; 0.02] 0.8370Amotivation × Teacher evaluation 0.02 [−0.01; 0.04] 0.1450 −0.01 [−0.03; 0.01] 0.5485Amotivation × Standardized test 0.02 [0; 0.04] 0.0729 0.00 [−0.03; 0.02] 0.6708Parental education 0.06 [0.05; 0.06] < 0.001 0.06 [0.05; 0.06] <0.001Household income 0.07 [0.05; 0.09] < 0.001 0.09 [0.07; 0.12] <0.001Books and CDs in the household 0.09 [0.08; 0.11] < 0.001 0.06 [0.05; 0.07] <0.001Extracurricular activities 0.17 [0.13; 0.21] < 0.001 0.11 [0.07; 0.15] <0.001Schooled in a disadvantaged area −0.15 [−0.18; −0.13] < 0.001 −0.24 [−0.27; −0.21] <0.001Non-verbal intelligence 0.04 [0.04; 0.05] < 0.001 0.06 [0.06; 0.06] <0.001Self-efficacy in autoregulation 0.08 [0.06; 0.09] < 0.001 0.03 [0.01; 0.04] 0.0010Social self-efficacy −0.13 [−0.14; −0.12] < 0.001 −0.16 [−0.17; −0.15] <0.001Academic self-efficacy 0.28 [0.26; 0.29] < 0.001 0.28 [0.26; 0.29] <0.001Intrinsic motivation −0.05 [−0.07; −0.03] < 0.001 0.03 [0.01; 0.05] 0.0010Extrinsic motivation 0.02 [0; 0.03] 0.0707 −0.01 [−0.02; 0.01] 0.3072Amotivation −0.02 [−0.03; 0] 0.0564 0.02 [0; 0.03] 0.0135
Source: MENESR-DEPP.
References
Aubret, F., & Blanchard, S. (1992). Valeur prédictive du test analytique de mathématique.L’orientation scolaire et professionnelle, 21(4), 449–454.
Aubret, J., Blanchard, S., & Sontag, J.-C. (2006). Évaluer les compétences des collégiensen 6e/5e. L’orientation scolaire et professionnelle, 35(3), 446–473.
Azmat, G., Calsamiglia, C., & Iriberri, N. (2016). Gender differences in response to bigstakes. Journal of the European Economic Association, 14(6), 1372–1400. https://doi.org/10.1111/jeea.12180.
Baird, J. (1998). What’s in a name? Experiments with blind marking in A-level ex-aminations. Educational Research, 40(2), 191–202. https://doi.org/10.1080/0013188980400207.
Bandura, A. (1990). Multidimensional scales of perceived self-efficacy. Stanford University.Beller, M., & Gafni, N. (2000). Can item format (multiple choice vs. open-ended) account
for gender differences in mathematics achievement? Sex Roles, 42(1–2), 1–21.https://doi.org/10.1023/A:1007051109754.
Blanchard, S., & Berger, S. (1994). Valeurs prédictives d’épreuves psychopédagogiques enfrançais et en mathématiques utilisées en classe de 6e. In M. Huteau (Ed.). Les tech-niques psychologiques d’évaluation des personnes (pp. 595–598). E.A.P.
Bolger, N., & Kellaghan, T. (1990). Method of measurement and gender differences inscholastic achievement. Journal of Educational Measurement, 27(2), 165–174. https://doi.org/10.1111/j.1745-3984.1990.tb00740.x.
Breda, T., & Ly, S. T. (2015). Professors in Core science fields are not always biasedagainst women: Evidence from France. American Economic Journal: Applied Economics,7(4), 53–75. https://doi.org/10.1257/app.20140022.
Cai, X., Lu, Y., Pan, J., & Zhong, S. (2018). Gender gap under pressure: Evidence fromChina’s National College Entrance Examination. The Review of Economics andStatistics, 101(2), 249–263. https://doi.org/10.1162/rest_a_00749.
Deary, I. J., Strand, S., Smith, P., & Fernandes, C. (2007). Intelligence and educationalachievement. Intelligence, 35(1), 13–21. https://doi.org/10.1016/j.intell.2006.02.001.
DeMars, C. E., Bashkov, B. M., & Socha, A. B. (2013). The role of gender in test-takingmotivation under low-stakes conditions. Research and Practice in Assessment, 8, 69–82.
Duckworth, A. L., & Seligman, M. E. P. (2006). Self-discipline gives girls the edge: Genderin self-discipline, grades, and achievement test scores. Journal of Educational
Psychology, 98(1), 198–208. https://doi.org/10.1037/0022-0663.98.1.198.Duckworth, A. L., Shulman, E. P., Mastronarde, A. J., Patrick, S. D., Zhang, J., &
Druckman, J. (2015). Will not want: Self-control rather than motivation explains thefemale advantage in report card grades. Learning and Individual Differences, 39, 13–23.https://doi.org/10.1016/j.lindif.2015.02.006.
Eklöf, H. (2007). Test-taking motivation and mathematics performance in TIMSS 2003.International Journal of Testing, 7(3), 311–326. https://doi.org/10.1080/15305050701438074.
Else-Quest, N. M., Hyde, J. S., & Linn, M. C. (2010). Cross-national patterns of genderdifferences in mathematics: A meta-analysis. Psychological Bulletin, 136(1), 103–127.https://doi.org/10.1037/a0018053.
Falch, T., & Naper, L. R. (2013). Educational evaluation schemes and gender gaps instudent achievement. Economics of Education Review, 36, 12–25. https://doi.org/10.1016/j.econedurev.2013.05.002.
Feingold, A. (1988). Cognitive gender differences are disappearing. American Psychologist,43(2), 95–103. https://doi.org/10.1037/0003-066X.43.2.95.
Gallagher, A., Levin, J., & Cahalan, C. (2002). Cognitive patterns of gender differences onmathematics admissions tests. ETS Research Report Series, 2002(2), i–30. https://doi.org/10.1002/j.2333-8504.2002.tb01886.x.
Halpern, D. F. (2002). Sex differences in achievement scores: Can we design assessmentsthat are fair, meaningful, and valid for girls and boys? Issues in Education, 8(1), 2.
Hausmann, R., Tyson, L. D., Zahidi, S., & World Economic Forum (2010). The globalgender gap report 2010. http://www3.weforum.org/docs/WEF_GenderGap_Report_2011.pdf.
Hedges, L. V., & Nowell, A. (1995). Sex differences in mental test scores, variability, andnumbers of high-scoring individuals. Science (New York, N.Y.), 269(5220), 41–45.
Hyde, J. S., Fennema, E., & Lamon, S. J. (1990). Gender differences in mathematicsperformance: A meta-analysis. Psychological Bulletin, 107(2), 139–155. https://doi.org/10.1037/0033-2909.107.2.139.
Hyde, J. S., & Linn, M. C. (1988). Gender differences in verbal ability: A meta-analysis.Psychological Bulletin, 104(1), 53–69. https://doi.org/10.1037/0033-2909.104.1.53.
Jurajda, Š., & Münich, D. (2011). Gender gap in performance under competitive pressure:Admissions to Czech universities. American Economic Review, 101(3), 514–518.https://doi.org/10.1257/aer.101.3.514.
Kling, K. C., Noftle, E. E., & Robins, R. W. (2013). Why do standardized tests underpredictwomen’s academic performance? The role of conscientiousness. Social Psychological
A. Guez, et al. Learning and Individual Differences 83–84 (2020) 101935
9

and Personality Science, 4(5), 600–606. https://doi.org/10.1177/1948550612469038.
Lafontaine, D., & Monseur, C. (2009a). Les évaluations des performances enmathématiques sont-elles influencées par le sexe de l’élève? Mesure et évaluation enéducation, 32(2), 71–98.
Lafontaine, D., & Monseur, C. (2009b). Gender gap in comparative studies of readingcomprehension: To what extent do the test characteristics make a difference?European Educational Research Journal, 8(1), 69–79. https://doi.org/10.2304/eerj.2009.8.1.69.
Lavy, V. (2008). Do gender stereotypes reduce girls’ or boys’ human capital outcomes?Evidence from a natural experiment. Journal of Public Economics, 92(10−11),2083–2105. https://doi.org/10.1016/j.jpubeco.2008.02.009.
Liang, K.-Y., & Zeger, S. L. (1986). Longitudinal data analysis using generalized linearmodels. Biometrika, 73(1), 13. https://doi.org/10.2307/2336267.
Lindberg, S. M., Hyde, J. S., Petersen, J. L., & Linn, M. C. (2010). New trends in genderand mathematics performance: A meta-analysis. Psychological Bulletin, 136(6),1123–1135. https://doi.org/10.1037/a0021276.
OECD (2011). Résultats du PISA 2009. Savoirs et savoir-faire des élèves : Performances desélèves en compréhension de l’écrit, en mathématiques et en sciences (OECD Editions).Vol. I.
OECD (2015). The ABC of gender equality in education. OECD Publishinghttps://doi.org/10.1787/9789264229945-en.
O’Neil, H. F., Abedi, J., Miyoshi, J., & Mastergeorge, A. (2005). Monetary incentives forlow-stakes tests. Educational Assessment, 10(3), 185–208. https://doi.org/10.1207/s15326977ea1003_3.
Ors, E., Palomino, F., & Peyrache, E. (2013). Performance gender gap: Does competitionmatter? Journal of Labor Economics, 31(3), 443–499. https://doi.org/10.1086/669331.
Protivínský, T., & Münich, D. (2018). Gender Bias in teachers’ grading: What is in thegrade. Studies in Educational Evaluation, 59, 141–149. https://doi.org/10.1016/j.stueduc.2018.07.006.
Reardon, S. F., Kalogrides, D., Fahle, E. M., Podolsky, A., & Zárate, R. C. (2018). Therelationship between test item format and gender achievement gaps on math and ELAtests in fourth and eighth grades. Educational Researcher, 47(5), 284–294. https://doi.org/10.3102/0013189X18762105.
Reilly, D., Neumann, D. L., & Andrews, G. (2015). Sex differences in mathematics andscience achievement: A meta-analysis of National Assessment of Educational Progressassessments. Journal of Educational Psychology, 107(3), 645–662. https://doi.org/10.
1037/edu0000012.Reilly, D., Neumann, D. L., & Andrews, G. (2018). Gender differences in reading and
writing achievement: Evidence from the National Assessment of Educational Progress(NAEP). American Psychologist. https://doi.org/10.1037/amp0000356.
Routitsky, A., & Turner, R. (2003). Item format types and their influence on cross-nationalcomparisons of student performance. Chicago: Paper presented at the Annual Meetingof the American Educational Research Association.
Rubin, D. B. (1987). Multiple imputation for nonresponse in surveys. Wiley.Ryan, R. M., & Connell, J. P. (1989). Perceived locus of causality and internalization:
Examining reasons for acting in two domains. Journal of Personality and SocialPsychology, 57(5), 749–761. https://doi.org/10.1037/0022-3514.57.5.749.
Scheiber, C., Reynolds, M. R., Hajovsky, D. B., & Kaufman, A. S. (2015). Gender differ-ences in achievement in a large, nationally representative sample of children andadolescents: Gender and achievement. Psychology in the Schools, 52(4), 335–348.https://doi.org/10.1002/pits.21827.
Silverman, I. (2003). Gender differences in delay of gratification: A meta-analysis. SexRoles, 49(9), 451–463. https://doi.org/10.1023/A:1025872421115.
Steinmayr, R., & Spinath, B. (2008). Sex differences in school achievement: What are theroles of personality and achievement motivation? European Journal of Personality,22(3), 185–209. https://doi.org/10.1002/per.676.
Stoet, G., Bailey, D. H., Moore, A. M., & Geary, D. C. (2016). Countries with higher levelsof gender equality show larger national sex differences in mathematics anxiety andrelatively lower parental mathematics valuation for girls. PLoS One, 11(4), Articlee0153857. https://doi.org/10.1371/journal.pone.0153857.
Terrier, C. (2015). Giving a little help to girls ? Evidence on grade discrimination and itseffect on students’ achievement. CEP discussion paper no 1341. Centre for EconomicPerformance London School of Economics and Political Science.
Terriot, K. (2014). Testons les tests: Le RCC (Raisonnement sur Cartes de Chartier). ANAE-Approche Neuropsychologique des Apprentissages chez l’Enfant, 26(129), 179–183.
Trosseille, B., Champault, F., & Lieury, A. (2013). Évaluation de 30 000 élèves de 6 e ducollège français. Présentation et introduction. Bulletin de psychologie, Numéro 523(1),3. https://doi.org/10.3917/bupsy.523.0003.
Voyer, D., & Voyer, S. D. (2014). Gender differences in scholastic achievement: A meta-analysis. Psychological Bulletin, 140(4), 1174–1204. https://doi.org/10.1037/a0036620.
Willingham, W. W., & Cole, N. S. (1997). Gender and fair assessment. Lawrence ErlbaumAssociates Publishers.
A. Guez, et al. Learning and Individual Differences 83–84 (2020) 101935
10