settlement of accounts in the second the fiscal year ... · pdf fileoutline of the second...
TRANSCRIPT

November 10, 2010
Settlement of Accounts in the Second Quarter of
the Fiscal Year Ending March 31, 2011and
Medium-term Management Plan
Settlement of Accounts in the Second Quarter of
the Fiscal Year Ending March 31, 2011and
Medium-term Management Plan
<Cautionary matter of description regarding future prospect> Please bear in mind that the forecast of our business performance and future forecast described in this material are forecasts judged by our company on the basis of the business environment at this point in time, and actual business performance can be different depending on the development of the business environment hereafter.
1/22

Subject of Today’s Briefing
Fiscal Year Ending March 31, 2011Outline of the Second Quarter Consolidated Business Performance
Fiscal Year Ending March 31, 2011Forecasts of Consolidated Business Performance
Medium-tem Management Plan
2/22

Fiscal Year Ending March 31, 2011 Outline of the Second Quarter
Consolidated Business Performance
3/22

Net Sales
Operating Income
Ordinary Income
Net Income Net Income per
Share (yen)
2QFY10/Mar.
Actual Result
174
-0.2
-0.5
-2.1
-3.40
2QFY11/Mar.
217
5.8
4.1
-1.4
-2.37
43
6.0
4.6
0.7
1.03
25%
-
-
-
-
Actual Result
Fiscal Year Ending March 31, 2011 Outline of the Second Quarter Consolidated Business Performance
Change Ratio of Change
Year-over-Year
Network solutionsfield 91 97 6 7%
83 120 37 44%Security solutionsfield
(100 millions of yen)
4/22

91
83
97
120
2QFY10/Mar. 2QFY11/Mar.
Parts, etc. 5.5 billion yen
Year-over-year +2.2 billion yen
Security systems 6.5 billion yen
Year-over-year +1.5 billion yen
Network equipment, etc.3.2 billion yen
Year-over-year +0.6 billion yen
Key telephone systems 6.5 billion yen
Year-over-year ±0
Fiscal Year Ending March 31, 2011 Second Quarter Consolidated Net Sales (By Field)
(100 millions of yen)
174
217Security solutions Network solutions
5/22
2QFY10/Mar. 2QFY11/Mar.

Breakdown of Major Changes in Operating Income (2QFY10/Mar.~2QFY11/Mar.)
2QFY10/Mar.
2QFY11/Mar.
Operating income-20 million yen
6/22
Increased Sales
200 million yen
Increased expenses by
increased sales -100 million yen
Reduced material cost Improved production efficiency 100 million yen
Reduced personnel expenses
200 million yen
Reduced Development cost 100 million yen
100 million yen
Reduced depreciation expense Operating income
580 million yen

Current assets
Fixed assets
Deferred assets
Total assets
End of FY10/Mar.
(A)254193
1448
End of 2Q FY11/Mar.
261185
0446
+7-8-1-2
(B)
Fiscal Year Ending March 31, 2011 Outline of the Second Quarter Balance Sheet
(B-A)Change
(100 millions of yen)
Assets
Current liabilities
Long-term liabilities
Total liabilities and net assets
117103
448
12199
446
+4-4
-2
Total liabilities
Net assets 220228
220226
0-2
End of FY10/Mar.
(A)End of 2Q FY11/Mar.
(B) (B-A)Change
Liabilities/Net assets
7/22

Fiscal Year Ending March 31, 2011 Forecasts of Consolidated Business
Performance
8/22

Net Sales
Operating Income
Ordinary Income
Net Income
Net Income per Share (yen)
FY10/Mar.
Actual Result
386
6.0
5.9
1.4
2.28
FY11/Mar.
430
13.0
11.0
2.5
4.12
+44
+7.0
+5.1
+1.1
+1.84
11%
117%
86%
79%
81%
Forecasts
Fiscal Year Ending March 31, 2011 Forecasts of Consolidated Business Performance
Change Ratio of Change
Year-over-Year
Dividend (yen)(Forecast) - 3
Network solutions field
Securities solutions field
182 204 +22 12%
204 226 +22 10%
9/22
(100 millions of yen)

182
204
204
226
FY10/Mar. FY11/Mar. Forecast
Parts, etc. 9.2 billion yen
Year-over-year +0.6 billion yen
Security systems13.4 billion yen
Year-over-year +1.6 billion yen
Network equipment, etc.7.6 billion yen
Year-over-year +2.1 billion yen
Key telephone systems12.8 billion yenYear-over-year +0.1 billion yen
Fiscal Year Ending March 31, 2011 Forecasts of Consolidated Sales
386
430Security solutionsNetwork solutions
10/22
(100 millions of yen)

Breakdown of Major Changes of Forecasted Operating Income (FY10/Mar.~FY11/Mar.)
FY10/Mar. FY11/Mar.Forecast
Operating income600 million yen
Operating income1,300 million yen
11/22
Increased sales
300 million yen
Increased development cost -100 million yen
Increased depreciation
expense-100 million yen
Reduced material cost Improved production efficiency 300 million yen
Reduced personnel expenses300 million yen

Capital Investment, Depreciation Expense, R&D Expense
12/22
FY10/Mar.
Actual Result
FY11/Mar.
Forecasts Change
Year-over-Year
Capital Investment (Tangible) 6 +33
Capital Investment (Intangible) 17 +611
Total 23 +914
R&D Expense 55 +154
Depreciation Expense 29 +128
(100 millions of yen)

Medium-term Management Plan
13/22
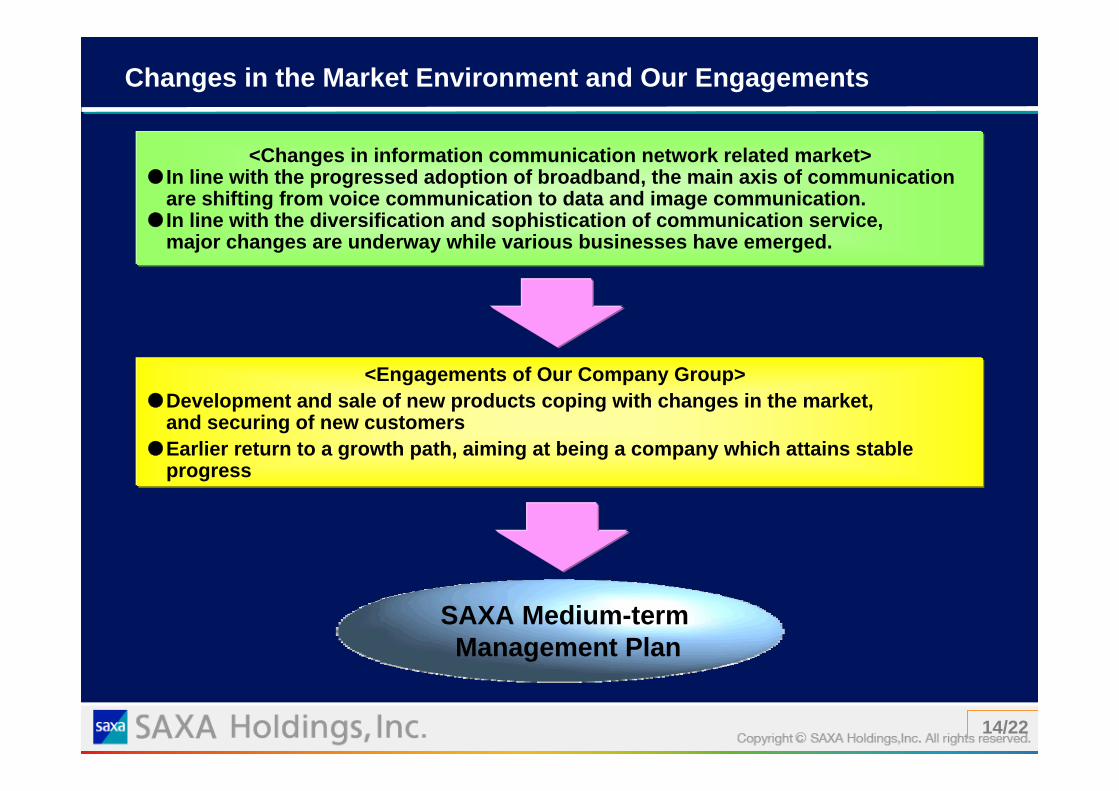
Changes in the Market Environment and Our Engagements
<Engagements of Our Company Group>Development and sale of new products coping with changes in the market, and securing of new customersEarlier return to a growth path, aiming at being a company which attains stable progress
<Changes in information communication network related market>In line with the progressed adoption of broadband, the main axis of communication are shifting from voice communication to data and image communication.In line with the diversification and sophistication of communication service, major changes are underway while various businesses have emerged.
SAXA Medium-term Management Plan
14/22

Directionality of Our Business
Not-Invented-Here (NIH)
Open innovation
Product-out Market-in
Advancing AXA GroupAdvancing AXA Group
Thorough implementation of Thorough implementation of ““marketmarket--inin”” and and ““open innovationopen innovation””
Timely provision of solutions from Timely provision of solutions from the perspective of customersthe perspective of customers
Former position ofFormer position ofour company groupour company group
Strengthening of marketing power and planning Strengthening of marketing power and planning capacitycapacityEfficient development based on the concept of Efficient development based on the concept of open innovationopen innovation
15/22

Business Fields
Future Business Domain and Product
Transport/settlement market
RailwayBusDistributionRoads
Social infrastructure Social infrastructure marketmarketEducation Nursing care, welfareTelemetering
Amusement marketTheme parkResort facilitiesGame centerHall
Office marketSmall and medium officesAutomatic security
Targeted marketsOverseas market
EuropeUSAAsia, etc.
Security solution field
Network solution field
We provide various equipment and solutions whichrealize assurance/safety/comfort/convenience in the
targeted markets.
Equipment/Solutions which we newly aim at
Visual communication
Secure solutions
Network appliance
Market-in Openinnovation
16/22

Sensor Image sensor
Automatic security
Threat equipment
Maintenance service
Our Aims in the Office Market[23.4 billion yen (FY11/Mar. Forecast of sales) → 140%]
IP TV interphone
Common platform (UTM, etc.)
Camera systems (camera pack)
Security
Small and medium officesWe facilitate various office solutions by utilizing common platforms, camera systems, security systems and others.
We provide total security by upgrading/expanding related equipment and enhancing maintenance service.
Camera systems (Camera pack)
Office Market
17/22
Receiving system
Transmitting system
Key telephone
Network equipment

Game center Theme park Resort facility
Our Aims in the Amusement Market [8.8 billion yen (FY11/Mar. Forecast of sales) 120%]
Card equipment
+Environmental
equipment Security systems
Hall
Expansion of Domain
Amusement Market
Advancement into areas other than hall is being considered.
We sell environment equipment and security systems, in addition to card equipment.
18/22

Railway
Bus Road
Distribution
Counting number of ridership
Road Detection of stopped traffic
Safety monitoring Phone callcommunication
Mobile settlement terminal
IC card terminal
Transport/Settlement Market
Our Aims in the Transport/Settlement Market[2.4 billion yen (FY11/Mar. Forecast of sales) 180%]
Facilitate transport solutions with IP interphone and image processing technology as the core
Facilitate settlement solutions with card R/W as the base
Facilitate solution with image processing technology as the core
Facilitate solutions with image processing technology as the core
19/22

Education
Remote meter
reading
Electricity related
Nursing care/Welfare/Medical
Extending to other uses
Elderly support systemsNurse call
Key telephone linkage systems
Social Infrastructure Market
Camera systems
Our Aims in the Social Infrastructure Market[3.3 billion yen (FY11/Mar. Forecast of sales) 180%]
Remote monitoring
Security
LP gas meter reading
Attendance control
systems
+IC card terminal
+
20/22

Expansion of business opportunitiesin fire alarm, security, image products, etc.
Expansion of business opportunitiesin fire alarm, security, image products, etc.
Expansion of business opportunitiesin fire alarm, security, image products, etc.in Asian region
Entry into the image market and promotion ofoffshore development supported byexisting partners in China
Promotion of open innovation with Taiwanesecompanies
Our Aims in the Overseas Market[0.4 billion yen (FY11/Mar. Forecast of sales) 280%]
21/22

Major Targets for Achievement
FY11/Mar.Forecast
Target
430430
600600 (100 millions of yen) Security solutionsNetwork solutions
FY11/Mar. Forecast
Target
Net sales 43 billion yen 60 billion yen
Ordinary income 1.1 billion yen 3 billion yen
Ordinary income margin
2.6% 5% or more
Total assets turnover 1.0 time 1.5 times or more
22/22