setting up m&e and reporting system - · pdf fileals learners 0 25 50 75 100 2009 249 121...
TRANSCRIPT

Setting Up M&E and Reporting System

Monitoring - Evaluation
• Monitoring is the routine process of data collection and measurement of progress toward program objectives.
• Normally and internal process
• Answers the question, “what are we doing?”
• Evaluation is the use of specific study designs and special studies to measure the extent to which changes in desired health outcomes are attributable to a program’s interventions.
• Answers the question, “what have we achieved and what impact have we made”
Outcome Interventions

| Slide 3
EFA Goal 1: Universal Coverage of Out-of-School Children, Youths and Adults in the Provision of Basic Learning Needs
ALS Learners
0
25
50
75
100
2009
249
121
25 21%
2011
174
106
33
31%
Completers A & E Examinees A & E Test Passers % Passers over Examinees
2010
379
166
72
43%
Number of learners are in Thousands

| Slide 4
EFA Goal 2: Universal school participation & elimination of drop-outs and repetition in the first three grades
SY 2010-11, Actual SY 2011-12, Actual SY 2013-14, Targets
Net: Secondary and Elementary; Gross: Kinder

| Slide 5
Cohort Survival
0
25
50
75
100 100
76 65
58
42
100
76 66 68
51
Grade 1 Grade 4 Elem graduates HS entrants HS graduates
1975 - 2004 2001- 2010
EFA Goal 3: Universal completion of full cycle of basic educ. schooling with satisfactory achievement by all at every level

| Slide 6
National Achievement Test, Elementary
SY 2006-2007
SY 2007-2008
SY 2008-2009
SY 2009-2010
60 MPS
65 MPS
66 MPS
68 MPS
SY 2016-2017
67 MPS
SY 2010-2011
68 MPS
EFA Goal 3: Universal completion of full cycle of basic educ. schooling with satisfactory achievement by all at every level
SY 2011-2012
75 Target

| Slide 7
National Achievement Test, Secondary
SY 2006-2007
SY 2007-2008
SY 2008-2009
SY 2009-2010
47 MPS
49 MPS
47 MPS
46 MPS
SY 2016-2017
75 MPS PDP Target
SY 2010-2011
48 MPS
EFA Goal 3: Universal completion of full cycle of basic educ. schooling with satisfactory achievement by all at every level
SY 2011-2012
49 (Y4) MPS

Magallanes CES Challenges on Performance Indicators
• Attained EFA Goals by 2015
• Increased Participation Rate to 100%
• Intensify Balik – Eskwela Campaign
– Advocacy
– Campaign
– Family mapping

Basic Performance Indicators
Basic Performance Indicators
SY 2010-2011
SY 2011-2012 Level of Accomplishmen
t
Participation Rate 90 94 + 4
Completion Rate 98 100 + 2
Retention Rate 89 93 + 4
Graduation Rate 100 100
Drop-Out Rate 0 0
Achievement Rate 89 92 +3
Promotion Rate 87 89 +2

Improving the Reading Skills of Children
Reading
Abilities
Performance Level Gains Remarks
2010-
2011 2011-
2012
Data shows
that the
reading
abilities of
children
improved in
all levels
Independent
Level 17% 29% 12%
Instructional
level 41% 51% 10%
Frustration
Level 42% 20% 16%

Monitoring vs Evaluation
Monitoring Evaluation Continuous: day-to-day Periodic: important
milestones
Documents progress In-depth analysis of achievements
Focuses on inputs and outputs
Focuses on outcomes and impacts
Alerts managers to problems
Provides managers with strategy and policy options
Self-assessment External analysis

Tracks inputs and outputs and compares them to plan
Why monitor activities?
Identifies and addresses problems
Ensures effective use of resources
Ensures quality and learning to improve
activities and services
Strengthens accountability
Program management tool

Plan vs. Target
41.29%
28.83%
12.46%
0.00%
5.00%
10.00%
15.00%
20.00%
25.00%
30.00%
35.00%
40.00%
45.00%
Plan Actual Variance
Plan
Actual
Variance
PRIME Overall Accomplishment

Determines program effectiveness
Shows impact
Strengthens financial responses and accountability
Promotes a learning culture focused on service improvement
Promotes replication of successful interventions
Why evaluate activities?

What monitoring and evaluation (M&E) require?
• A plan with a monitoring and reporting framework (the logframe)
• Baseline studies
• A monitoring system
• Annual reports
• An evaluation study and report
• A project completion report

Logical Framework Matrix
The logframe defines the
objectives or desired results
to be achieved by the
program/project. Also
provide the outputs the
project will deliver.
A planning, monitoring and
evaluation tool.
The Logical Framework Matrix
Narrative
Summary
Objectively
Verifiable
Indicator
Mean of
Verification
Important
Assumption
Goal
Higher level
objective
Purpose
Immediate
objective
Outputs
Deliverables
Inputs
Resources

Three Primary Uses of Evaluation Findings
• Rendering judgments – Summative evaluations of program’s overall
effectiveness e.g., audit, renewal, quality control,
accreditation
• Facilitating improvements – Formative evaluation to improve program
e.g., program’s strengths/weaknesses, progress
• Generating knowledge – Conceptual use of findings
e.g., generalization, theory building

Proponent Variance
Region IX -38%
Division of
Zamboanga Sibugay
-18%
Division Zamboanga
Del Norte
-11%
Division of
Zamboanga Del Sur
-35%
Region IX
Proponent PRIME Grant Utilized% of
UtilizationUnutilized
Region IX 2,011,230 22,518 1% 1,988,712
Zamboanga del Sur 3,550,000 94,941 3% 3,455,059
Zamboanga del
Norte
3,606,620 46,500
1%
3,560,120
Zamboanga Sibugay 22,518 - 0% 22,518
80%
35%
56%
72%
62%
24%
21%
34%
0% 10% 20% 30% 40% 50% 60% 70% 80% 90%
Division of Zamboanga Sibugay
Division Zamboanga Del Norte
Division of Zamboanga Del Sur
Region IX
Actual
Plan
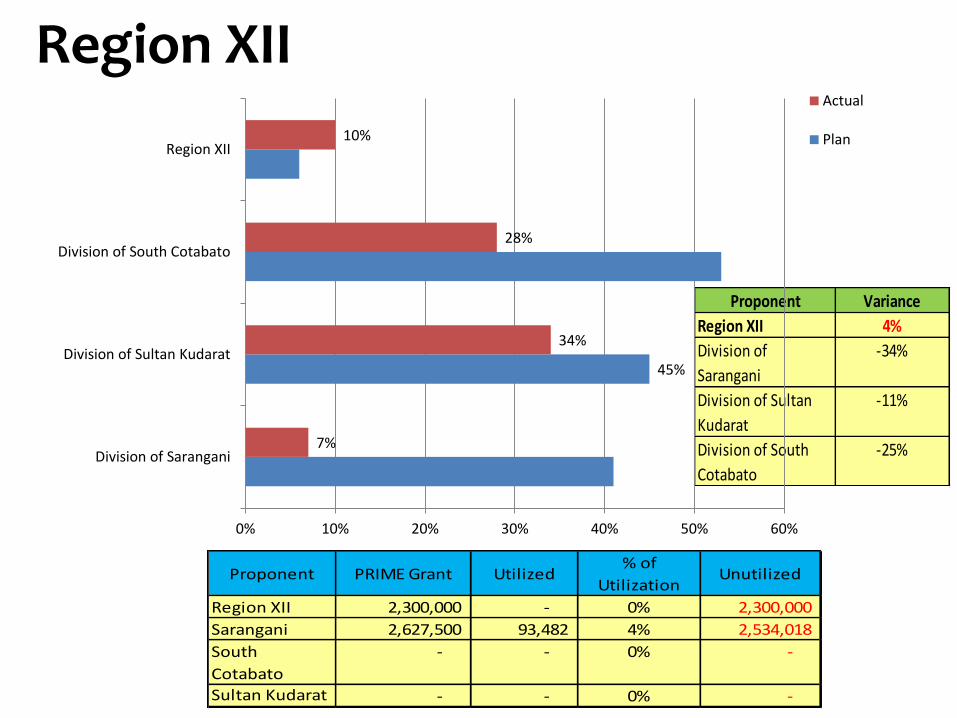
Region XII
Proponent Variance
Region XII 4%
Division of
Sarangani
-34%
Division of Sultan
Kudarat
-11%
Division of South
Cotabato
-25%
Proponent PRIME Grant Utilized% of
UtilizationUnutilized
Region XII 2,300,000 - 0% 2,300,000
Sarangani 2,627,500 93,482 4% 2,534,018
South
Cotabato
- - 0% -
Sultan Kudarat - - 0% -
45%
7%
34%
28%
10%
0% 10% 20% 30% 40% 50% 60%
Division of Sarangani
Division of Sultan Kudarat
Division of South Cotabato
Region XII
Actual
Plan

Rationale for M&E
• M&E help to make informed decisions regarding on-going programs
– They facilitate effective and efficient use of resources
– They determine whether a program is right on track and where changes need to be considered
• M&E help stakeholders conclude whether the program is a success
• M&E preserve institutional memory

Indigenous Peoples’ Education
0%
10%
20%
30%
40%
50%
60%
70%
80%
90%
100%
2011
12-J
an
12-F
eb
12-M
ar
12-A
pr
12-M
ay
12-J
un
12-J
ul
12-A
ug
12-S
ep
12-O
ct
12-N
ov
12-D
ec
13-J
an
13-F
eb
13-M
ar
13-A
pr
13
-Ma
y
13-J
un
13-J
ul
13-A
ug
13-S
ep
13-O
ct
13-N
ov
13-D
ec
14-J
an
14-F
eb
14-M
ar
14-A
pr
14
-Ma
y
14-J
un
% P
hysic
al A
ccom
plis
hm
ent
Implementation Period (in months)
Plan
Actual
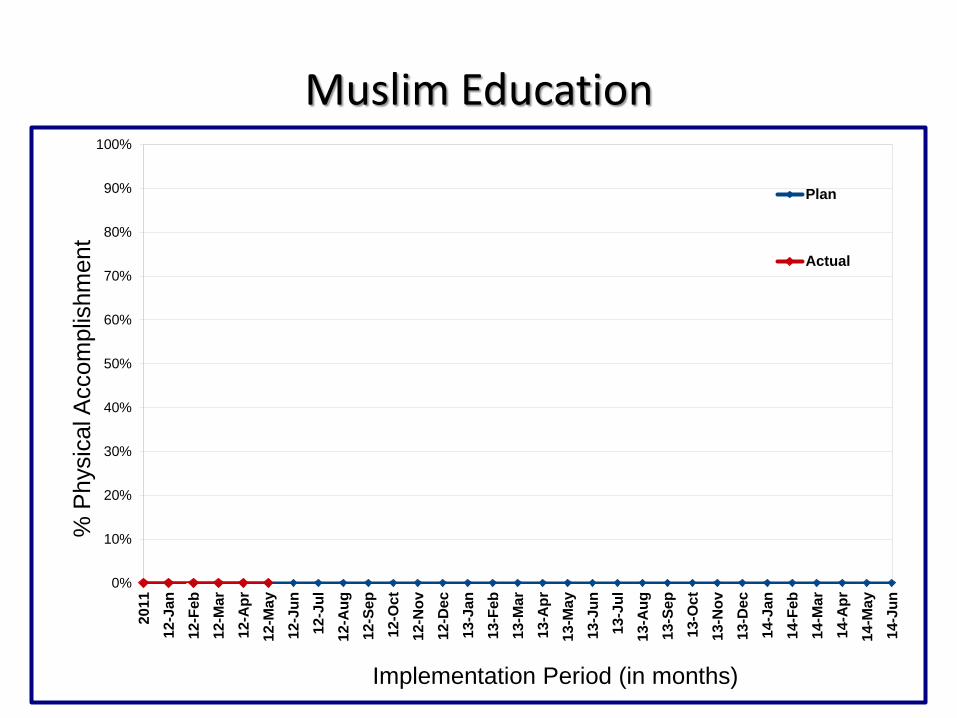
Muslim Education
0%
10%
20%
30%
40%
50%
60%
70%
80%
90%
100%2011
12-J
an
12-F
eb
12-M
ar
12-A
pr
12-M
ay
12-J
un
12-J
ul
12-A
ug
12-S
ep
12-O
ct
12-N
ov
12-D
ec
13-J
an
13-F
eb
13-M
ar
13-A
pr
13-M
ay
13-J
un
13-J
ul
13-A
ug
13-S
ep
13-O
ct
13-N
ov
13-D
ec
14-J
an
14-F
eb
14-M
ar
14-A
pr
14-M
ay
14-J
un
% P
hysic
al A
ccom
plis
hm
ent
Implementation Period (in months)
Plan
Actual

Types of Evaluation
Type Purpose Formative Initial assessment of the target populations and
contextual environment. Determines concept and design
Process Seeks to identify the extent to which planned activities have been achieved and assesses the quality of the activities/services
Outcome Examines specific program outcomes and accomplishments. What changes were observed, what does it mean, and if changes are a result of the interventions?
Impact Gauges the program’s overall impact and effectiveness. Aims to strengthen design and replication of effective programs and strategies

Evaluation areas
• Relevance • Equity • Efficiency • Effectiveness • Impact – contribution to poverty reduction,
empowerment and partnership • Sustainability • Replicability • Lessons learned • Information, Dissemination & Networking

Typical M&E Framework Level Description Frequency
Inputs Resources that are put into the project. Lead to the achievement of the outputs
Continuous
Outputs Activities or services that the project is providing. Outputs lead to outcomes
Quarterly
Outcomes Changes in behaviors or skills as a result of the implemented project. Outcomes are anticipated to lead to impacts
2-3 years
(short to medium term)
Impacts Measurable changes in health status, particularly reduced STI/HIV transmission and reduced AIDS impact. Impact results are effects of the intervention
3-5 years
(long term)

Inclusive Growth and Poverty Reduction
Equitable Access to Adequate Quality Societal Services and Assets
Improved Access to Basic
Education
Improved Quality of Basic
Education
1 Public
Kindergarten & Elementary
Education Services
2 Public
Secondary Education Services
3 Alternative Learning System Services
4 Basic
Education Sector
Management Services
5 Regulatory and Devt. Services
6 Govt.
Assist. to Students & Teachers in
Private Educ.
Services
Major Final Output (MFOs)
Organizational Outcomes
Knowledge, skills, attitude and values of Filipinos to lead
productive lives enhanced
Filipino Artistic & Cultural Traditions Preserved &
Promoted
8*
Book
Industry
Devt.
Services
7 Informal
Education
Services
-Cultural Outreach
Services (PHSA)
-Children
Television Devt.
Services
Sub-Sector Outcomes
Sector Outcomes
Societal Goal
* This is an MFO of the National Book Development Board (NBDB), an attached agency of the DepEd, and does not contribute directly to the attainment of DepEd’s
organizational outcomes. Initial recommendation is for the NBDB to be attached to the Department of Trade and Industry (DTI) since its mandate is to develop and
promote the local publishing industry 26
Organizational Performance Indicator Framework
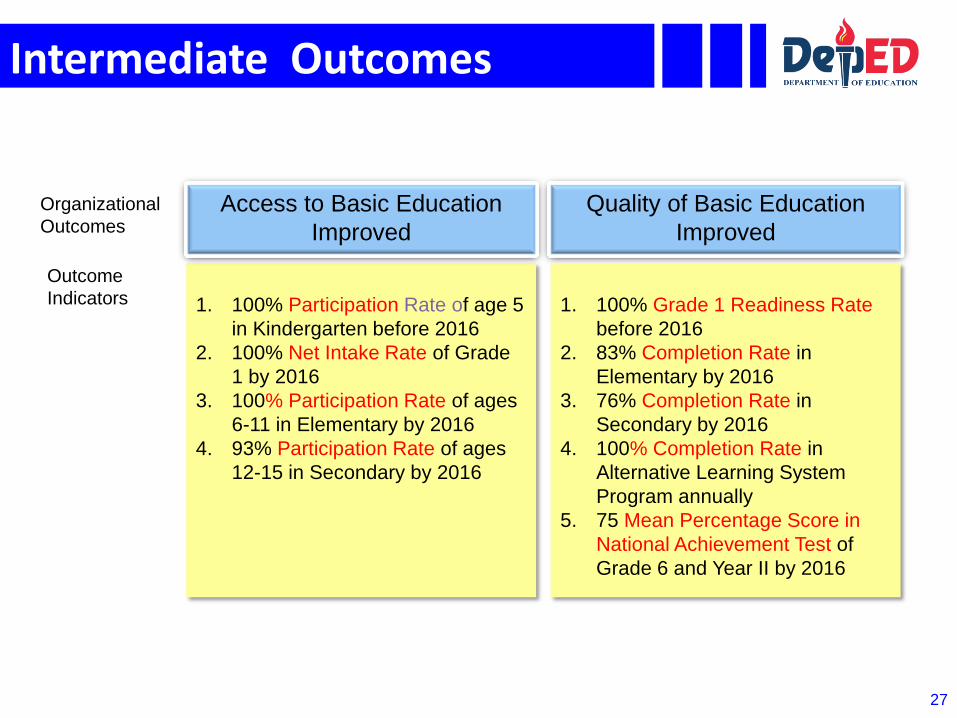
Intermediate Outcomes
27
1. 100% Participation Rate of age 5
in Kindergarten before 2016
2. 100% Net Intake Rate of Grade
1 by 2016
3. 100% Participation Rate of ages
6-11 in Elementary by 2016
4. 93% Participation Rate of ages
12-15 in Secondary by 2016
Outcome
Indicators
Access to Basic Education
Improved
Quality of Basic Education
Improved
Organizational
Outcomes
1. 100% Grade 1 Readiness Rate
before 2016
2. 83% Completion Rate in
Elementary by 2016
3. 76% Completion Rate in
Secondary by 2016
4. 100% Completion Rate in
Alternative Learning System
Program annually
5. 75 Mean Percentage Score in
National Achievement Test of
Grade 6 and Year II by 2016

• M&E should be part of the design of a program
• Ensures systematic reporting
• Communicates results and accountability
• Measures efficiency and effectiveness
• Provides information for improved decision making
• Ensures effective allocation of resources
• Promotes continuous learning and improvement
Why M&E?

Impact Evaluation
Start of Intervention
Start Up Review
End of Intervention
Progress M&E
Mid-term Review
End-of-Program Review
Quarterly Annual
Benefit Monitoring
(% of accomplishment based on Plan, Time,
Cost, Scope and Quality)
(application and utilization of outputs)
(benefits to the organization)
MEPA
Completion Report Appraisal Report
Designing of intervention
Baseline situation Project Design Results Framework Implementation Plan
Set Up M&E Mechanisms
Scope of M&E
Next Cycle
Documentation Most Significant Changes (Initial
Gains)

It’s not something new
Intersection Point between planning, program implementation and monitoring
Planning Implementation
M&E
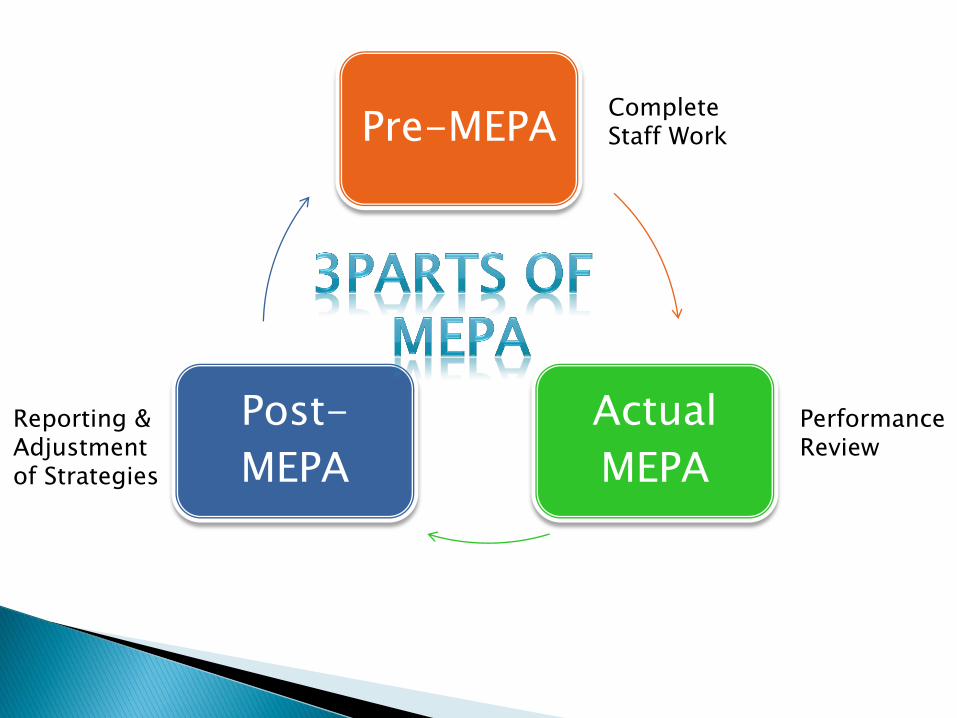
Pre-MEPA
Actual
MEPA
Post-
MEPA
Complete Staff Work
Performance Review
Reporting & Adjustment of Strategies

1. Pre-MEPA
The Pre-MEPA activity is the most critical activity in the MEPA technology.
The quality of preparations, data and information you will gather will dictate the quality of the MEPA sessions and the quality of the status reports.
Session 3 The MEPA Technology
Completed Staff Work (CSW)
What preparations do we need?
What activities do we need to do?
What forms and reports do we need to accomplish?


Actual MEPA
(i) Managing Program Implementation
(ii) Status of Projects (Grants)
(iii) Other Matters
Session 3 The MEPA Technology
Agenda
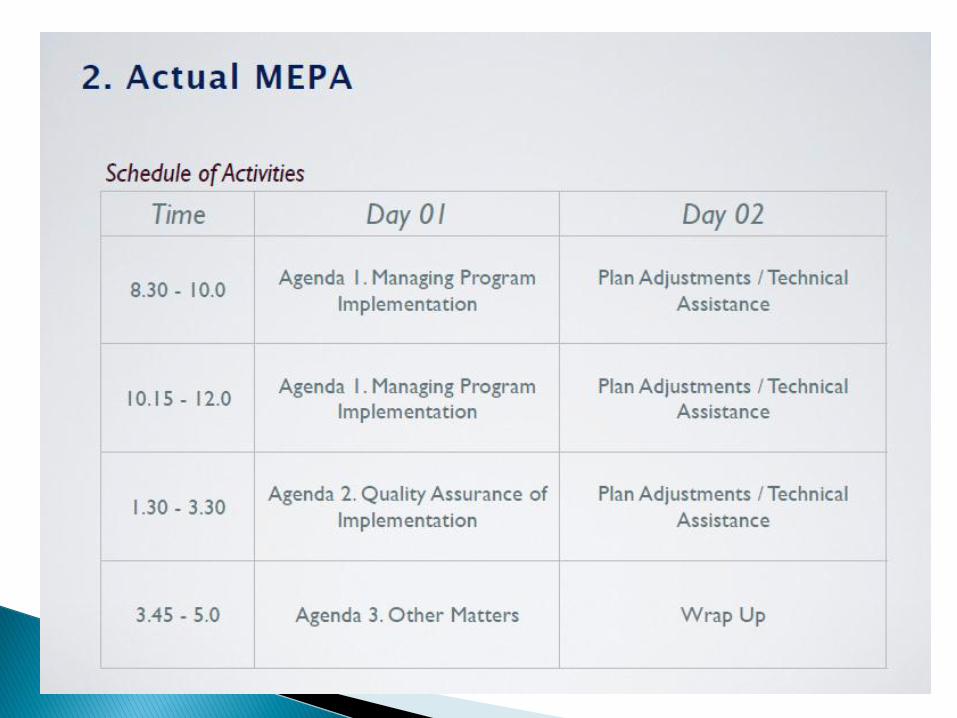

2. Actual MEPA
Agenda 1. Managing Program Implementation
Session 3 The MEPA Technology
Objectives 1. Determine the efficiency RO/DO
implementation
2. Identify issues & difficulties that contributed to delays in implementation
3. Agree on adjustment measures (input what type of adjustments they need to make) that will help implementation back on track.
Scope/Time
Cost/Time

0%
10%
20%
30%
40%
50%
60%
70%
80%
Plan
Actual


2. Actual MEPA
Agenda 2. Status of Projects
Session 3 The MEPA Technology
Objectives
1. Determine the status of school/community projects funded under PRIME including updates on # of target beneficiaries - boys and girls, ethnic group
2.Assess implementation and administrative issues and difficulties encountered in project implementation
3.Provide suggestions/recommendations that will address issues & problems identified
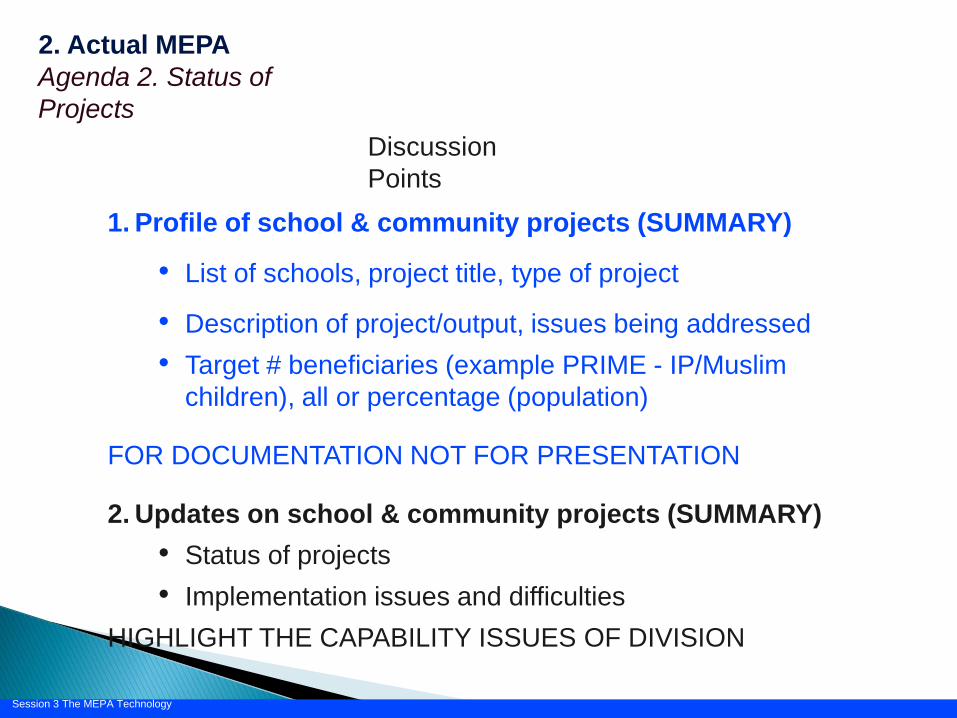
2. Actual MEPA
Agenda 2. Status of
Projects
Session 3 The MEPA Technology
Discussion
Points
1. Profile of school & community projects (SUMMARY)
• List of schools, project title, type of project
• Description of project/output, issues being addressed
• Target # beneficiaries (example PRIME - IP/Muslim
children), all or percentage (population)
FOR DOCUMENTATION NOT FOR PRESENTATION
2. Updates on school & community projects (SUMMARY)
• Status of projects
• Implementation issues and difficulties
HIGHLIGHT THE CAPABILITY ISSUES OF DIVISION

2. Actual MEPA
Agenda 3. Other Matters
Session 3 The MEPA Technology
Other matters as per Region agenda.
(Varies from region to region)

3. Post MEPA
Session 3 The MEPA Technology
1. Status Report
2. Adjustment Plan / CATCH UP PLAN (Technical Assistance)

If you do not measure results, you can not tell success from failure
If you can not see success, you can not reward it
If you can not reward success, you are probably rewarding failure
If you can not see success, you can not learn from it
If you can not recognize failure, you can not correct it
If you can demonstrate results, you can win public support
Osborne & Gaebler, 1992
