setting the stage for equity-sensitive monitoring of …€¦setting the stage for equity-sensitive...
TRANSCRIPT

Setting the stage for equity-sensitive monitoring of the maternal and child
health MDGs*
Forthcoming in Children and Poverty. Poverty Reduction Policies start with Children Delamonica and
Minujin, editors, New School University Press
Deborah Balk1
Meg Wirth2 Enrique Delamonica3
Adam Storeygard1
Emma Sacks1 Alberto Minujin3
1 Center for International Earth Science Information Network (CIESIN), Columbia University, contact: [email protected]
2 Consultant to Task Force 4 (Child health and maternal health), UN Millennium Project 3 Global Policy Section, Division of Policy and Planning, United Nations Children’s Fund (UNICEF)
Final Draft
29 July 2005
Acknowledgments:
We are grateful to Paula Braveman for input at all stages of the paper, Mushtaque Chowdhury and Cesar Victora for support during the early stage of conceptualization of the paper and Lynn Freedman for support throughout the process. We would also like to thank James Connolly for statistical and editorial support and Davidson Gwatkin and Jeanette Vega for comments on a near final draft of the paper. In addition, comments from Kiari Liman Tinguiri at the UNICEF/New School conference were helpful in revisions to this paper.
* Note that this paper is an abbreviated version of a longer Background Paper prepared for Task Force 4 (Child health and maternal health) of the UN Millennium Project.

p. ii
Setting the stage for equity-sensitive monitoring of the health MDGs
Deborah Balk, Meg Wirth, Enrique Delamonica, Adam Storeygard, Emma Sacks, Alberto Minujin
Abstract The Millennium Development Goals (MDGs) must be buttressed by an explicit and systematic commitment to equity in order to ensure that poor, marginalized and vulnerable groups are given opportunities for health and access to health services. This analysis seeks to ‘set the stage’ for equity-sensitive monitoring of the health-related MDGs using data from the broad-scale, international household-level surveys (i.e., the Demographic and Health Survey and Multiple Indicator Cluster Survey) to demonstrate that establishing an equity baseline is necessary and feasible, even in low-income, data-poor countries. We examine six countries using 20 health indicators and 6 social strata to ground our recommendations in current data. Use of singly stratified tables shows effects of single stratifiers on different population groups. We also utilize simultaneously stratified tables to expose unexpected outcomes that occur when two stratifiers are used simultaneously. We found that inequities are complex and interactive: one cannot draw inferences about the nature or extent of inequities in the health outcomes from a single indicator. We further conclude that assessing health equity across dimensions rather than simply one of them is an important element of monitoring the effectiveness of health policies and Poverty Reductions Strategies guided by the MDGs. Recommendations for implementation are made.

p. 1
I. Rationale
Increasing international attention to equity has led to recognition that, while overall health
indicators are improving in many countries, gaps between population groups are increasing or remaining
stagnant.
This general statement obscures a very complex reality on the ground. Inequities may be
narrowing for some health indicators and widening for others, and likewise, inequities between social
groups may vary widely depending upon the health indicator. Further, inequities are interactive—with
overlapping forms of disadvantage often conferring higher health risk. We argue that a complete and
country-specific analysis of inequities in health is an essential baseline for tracking policy changes and
their effect on development indicators.
We believe an explicit and systematic commitment to equity is needed to ensure that poor,
marginalized and vulnerable groups are given opportunities for health and access to health services
(Freedman et al. 2004, Gwatkin et al.2002, 2003). Monitoring equity implies an ongoing assessment of
how different groups in society are faring in absolute terms, and how they fare relative to one another
(Braveman 2003). Population averages are insufficient for monitoring the health MDGs. In order to
measure progress in reducing the extent of health inequalities, countries must have a clear baseline for
their own health MDGs, based upon unique country circumstances and socio-cultural dynamics. This
paper is an effort to move beyond the very important stages of ‘setting the values base’ for a focus on
equity and ‘sounding the alarm’ about growing gaps in health, to putting in place the requirements for
assessing progress toward achieving greater equity. We use widely available data from recent
Demographic and Health Surveys (DHS) and Multiple Indicator Cluster Surveys (MICS) to demonstrate
that establishing an equity baseline is necessary and feasible, even in very low-income, data-poor
countries. For many countries lacking vital registration systems, monitoring of the MDGs will rely—at
least in the short-term—upon these population-based surveys. We examine six countries—Cambodia,
Ethiopia, Dominican Republic, Ghana, Kenya, and Tajikistan—using 20 health indicators and 6 social
strata to ground our recommendations in current data.1 This approach is generalizable to the vast majority
of resource-poor countries, which have at least one such population-based household survey containing
information on health and on important social characteristics.
Information and data are essential in the effort to reach the MDGs and arguably, nowhere are data
as critical as in the realm of counting who lives, who dies, who is healthy and who is sick (Stansfield and
Evans 2003). Information systems must be upgraded to keep pace and measure progress. Of particular
concern, is the ability of countries to effectively gather their own health information and monitor health
status and health system outcomes within their boundaries.
1 As the largest worldwide survey programs, MICS and DHS help us illustrate our points—but note that other data sources including censuses, vital registration, qualitative studies, health facility information and surveys of refugees also must be used in order to fully describe the extent and nature of inequalities in a given country and to chart and monitor a path forward.

p. 2
This paper is based around the following four arguments and assumptions: The MDG targets
should be framed in equity-sensitive terms; equity is not simply a matter of poor versus rich—the full
complexity of social disadvantage must be considered; it is feasible to measure inequalities in health
based upon current data; yet we also need to build basic health information systems as an essential part of
strengthening health systems and donors must commit to these long-term investments.
The multiple dimensions of disparities
The definition of equity is based on simple notions of fairness and distributive justice. The
nuances of this field and the difference between disparities and inequities are briefly discussed here.
Obviously, not all individuals are the same. Thus, unfortunately, some children will die, or be
stunted while other ones will not. These differences between individuals are unavoidable. In addition,
they are random differences in the sense that they are not associated to any unalterable characteristic
which is (or could be) used to separate individuals into groups. When these differences are associated
with these characteristics,1 we are no longer dealing with inequalities but with inequities. Put another
way, disparities are simply differences in health status between groups independent of an assessment of
fairness. Inequities are a subset of disparities which are judged to be avoidable and unfair and thus
require some sort of ameliorating policy intervention (Evans, Whitehead et al 2001).
Distinguishing between disparities or inequalities2 and inequities is associated with the question:
“Inequality of what?” The answers to this question usually fall in two camps: equal opportunities or
equal outcomes. The distinction is important for assessing fairness. While most authors agree that all
individuals should have the same opportunities, few of them agree that the outcomes or results should be
same for everybody.3 Thus, value judgments enter the discussion.
In the case of both disparities and inequities, there are arbitrary thresholds. On the one hand,
whether observed differences are meaningful needs to be established and on the other hand, in the case
there is an actual difference, whether it is fair or not needs to be evaluated. We must first assess whether
in fact two apparently different indicators do in fact reveal a disparity. For instance, average weight at
birth could be 2.4 Kg in one province and 2.6 Kg in another. The former indicator appears to reveal a
problem of low birth weight (defined as <2.5kg) which may be absent in the latter. However, as these
estimates are based on samples, statistical tests must be employed to establish (for each indicator and
context) what numerical differences actually represent inequalities.4 In this analysis we make a point of
performing statistical tests in order to be definitive about which differences between indicators are
1 Below, we call these characteristics stratifiers, following the standard terminology. 2 As “disparities” and “inequality” mean basically the same, we use them interchangeably. In common usage, “inequality” seems to be associated with quantitative measures and “disparity” often implies a degree of unfairness not easily captured in numbers. Nevertheless, the dictionary definition is the same for both. 3 The reasons for this vary and their validity need not concern us here. Specifically in terms of income, they range from luck, to individual efforts and the need to maintain certain degree of inequality to provide “incentives”. 4 See McCloskey and Ziliak (1996) for the need to complement statistical test with common sense when evaluating what magnitudes are real differences or not.

p. 3
actually disparities. But the level of significance at which one tests and the magnitude of disparity which
one highlights, although grounded in statistical theory and methods, retains an arbitrary element which
may be seen as subjective.6
In assessing the fairness of disparities (to determine if they are inequities), moral or ethical
judgments come into play. “Small” differences in some types of outcomes may be considered
unacceptable while large ones are usually perceived as normal. For example, access to plastic surgery for
cosmetic reasons is highly unequal across social classes yet does not raise public outcry. However,
smaller disparities in rates of immunization for children would, in most societies, be deemed ‘unfair.’
In sum, “inequalities” or “disparities” refer to outcomes which are dissimilar without any
assumption about whether they should have been equal. Concomitantly, “inequities” refers to outcomes
which are not the same when they ought to have been similar. Nevertheless, it would not be accurate to
say that “equality” refers only to outcomes while “equity” is restricted to processes.
This is very clear when dealing with the MDGs. Some of the MDGs are outcomes (e.g. child
mortality) while others are inputs/processes (e.g. access to health care). But in both cases, there is an
expectation that equality across population groups is ‘the ideal.’ In the case of the MDG indicators
examined here, all disparities would thus be considered the result of some socio-economic mechanism or
constraint which policy-makers ought to change. In other words, they are deemed avoidable disparities
between population groups -- inequities.
Finally, it is important to highlight that some of these stratifiers lead to a natural hierarchy while
others do not. For instance, when households are classified by wealth, richer households are clearly
“above” the poorer ones. The observed disparities are then called “vertical inequities.” When comparing
provinces or sub-national regions, there is no natural ranking. Thus, we refer to these as “horizontal
inequities.”
What is unique about this analysis
First, the paper specifically addresses within country inequalities in health with the intent of
demonstrating how the MDGs can and should be monitored. Thus, we look at multiple health outcomes.
The majority of equity studies have tended to take a single health outcome—such as child mortality,
skilled birth attendants or antenatal care—and examine the distribution of this indicator across and within
countries though there are notable exceptions (Stanton and Blanc 2004, Kunst and Houweling 2001,
AbouZahr and Wardlaw 2004, Victora et al. 2000, Wagstaff and Watanabe 2000, Wagstaff et al. 2003).
Other studies consider many indicators but only one or two stratifies, such as wealth or urban/rural
residence (Gwatkin et al. 2003, Minujin and Delamonica 2003). This study evaluates many indicators
and many stratifiers.
6 For instance, in the selection of the level of significance, traditionally a threshold of 5 per cent or 10 per cent is used. Not only one or the other is a subjective choice, it could also be 4, 8 or 12 per cent. Arbitrary, then, should be interpreted as conventional (in the sense of Poincaré) and not despotic or capricious. See Poincaré, (1905).

p. 4
Second, the paper attempts to deepen analysis of inequities in health by showing the complex
reality in different country contexts. The paper addresses multiple dimensions of inequity, moving
beyond the overly simplistic poor versus rich dichotomy. Equity in health is not simply a matter of rich
versus poor. Other forms of disadvantage, such as ethnicity, educational level of the mother, region of the
country, urban versus rural residence and gender are considered important stratifiers of health and access
to health, both on their own, and in interaction with one another. We undertake and analysis where we
cross-classify indicators by either single or multiple stratifiers to capture the complexity of health
disadvantage. Note that we avoid multivariate regression analysis in order to simplify replication in low
resource settings. Third, the paper assesses the statistical significance of the inequities in health status, specifying in
which cases the gaps are a result of random variation and in which cases the inequalities are statistically
valid, and thus the basis for policy making. While such a statistical assessment should be routine, they
are generally not included.7
II. Equity Indicators for Monitoring purposes
Equity-sensitive monitoring serves primarily as an ‘early warning’ system, pointing to fault lines
in a country’s social fabric or economic system. From a human rights perspective, narrowing avoidable
disparities in health outcomes or health access between population groups is imperative. Doing so is
often highly charged politically, as there are, in perhaps most contexts, very strong interests in
maintaining the status quo or suppressing identification of fault lines. “Achieving greater equity
generally requires real changes in resource allocation to favor disadvantaged groups, who by definition,
are less influential” (Braveman 1998).
A range of studies over the last five to six years has demonstrated that inequities in health
outcomes differ across and within countries and across different health indicators (Minujin and
Delamonica 2003, Segone 2001, Evans et al. 2001, AbouZahr and Wardlaw 2004, Victora et al. 2000,
Wagstaff and Watanabe 2000, Kunst and Houweling 2001). In addition, studies have shown the extent to
which even public expenditure on health (and other social services) tends to disproportionately favor the
better-off groups in society (Gwatkin 2002, Castro-Leal et al. 2000). Though the fact that the poor suffer
greater ill-health than the rich is perhaps conventional wisdom, these recent analyses enabled a
quantification of the differentials in access to health care and in health outcomes. What has been striking
in the analyses is the oft-seen stepwise gradient in which each step up the ‘wealth ladder’ confers greater
advantage in health.
As important as ‘wealth’ is in determining who has access to care and who has better health
outcomes, other stratifiers may be equally (or more) significant in monitoring inequalities and in
7 Similar singly stratified cross-tabulations appear in the country report series of the DHS and MICS reports but no tests of statistical significance are given.

p. 5
designing appropriate policies. Gender, race/ethnicity (perhaps measured by language) and geographic
location are significant stratifiers of health opportunity that should be tracked. Yet, tracking indicators on
their own should, where possible, be supplemented by analysis that looks at interactions between
stratifiers. Examination of interaction effects allows one to specify, for example, the cumulative
disadvantage conferred on a child of a poor family whose mother has no education.
National averages are not enough to assess progress because changes in the national average do
not necessarily imply improvement for all members of society. For example, a national average
improvement could go together with increases in disparity, or countries may improve average health
outcomes while reducing disparities in health (Minujin and Delamonica 2003). Further, examining trends
over time is another critical component for health equity monitoring. While we do not undertake trend
analysis here, we note that the overarching goal of an equity analysis should go beyond simple description
of gaps between groups to quantifying the extent of the disparity and with the intent toward monitoring
the progress of policies designed to reduce disparity. This exercise establishes a baseline.
Indicators used for monitoring must meet many criteria, including being simple, reliable,
sustainable, timely, policy-relevant, and affordable (Braveman 1998). The very process of determining
what stratifies health and opportunities to be healthy exposes the ‘fault lines’ in society—pointing directly
to the ‘haves’ and ‘have-nots.’ It must be recognized that the selection and implementation of equity
analysis, which technical and scientific, takes place in the context of a highly politicized process
(Braveman 1998).
III. Methods and Data
A. Health Indicators
The health indicators used in this analysis were selected to match the MDG indicators as closely
as possible, with a few exceptions (see Table 1). For example, we include the following: under-five
mortality rate, DPT3 immunization (which may indicate which groups tend to ‘fall off’ in terms of
coverage over time (Ransom 2004)), skilled attendants at delivery, knowledge of HIV/AIDS,
contraceptive prevalence rates, and age at first intercourse and union.
The nature of the health indicators chosen varies. Some of the indicators chosen are health
outcomes (underweight, child mortality), some represent access to health care or preventative
interventions (visits to a health facility, skilled attendant at birth, measles and DPT vaccination,
contraceptive prevalence) and others represent health knowledge (AIDS knowledge) and fertility-related
or women’s status indicators (ages at first intercourse and marriage).
B. Social Stratifiers
An equity analysis requires stratifying a population into subgroups that have different levels of
underlying social advantage. The social stratifier most often used to look at inequities is income or

p. 6
wealth. Wealth is usually measured based upon a set of assets the family has, rather than in terms of
monetary income or expenditure. However, in countries where the vast majority of the population is
extremely poor, and only the capital city has a population which falls in the upper quintile, the
stratification by wealth quintile is not necessarily the most appropriate way to measure inequities in
health. Even in countries where wealth does stratify health access and health outcomes, other stratifiers
should be used to analyze the distribution of health outcomes as well.
Other important stratifiers are: age, urban-rural residence, gender, ethnicity, occupation,
geographic region, and education level. All but age8 and occupation are studied here (see Table 2). The
regions used as stratifiers here correspond to survey regions - the smallest geographic areas for which
estimates are produced. The number of regions per survey varies with the size of the sample, along with
other factors. Among the countries studied here, Kenya has only seven regions, while the Dominican
Republic has 32. Especially when used in combination with another stratifier, sample sizes in individual
regions can become too small to yield meaningful results. Between the indicator and stratifiers, over
8,000 datum form the basis of this analysis.
C. Surveys/Data Sources
Data are compiled from DHS surveys of Cambodia (2000), Dominican Republic (2002), Ethiopia
(2000), Ghana (1998), and Kenya (1998), and a MICS survey of Tajikistan (2000). These countries and
surveys were chosen because they are selected Millennium Project case studies. Tajikistan data is taken
directly from aggregate tables distributed by UNICEF, whereas most measures from DHS are calculated
from individual woman- or child-level data. The remainder were taken from DHS reports or the DHS
website. Indicator definitions were harmonized across the five DHS countries when possible. Some
indicators reported here differ from those in official DHS reports (Rutstein and Rojas 2003). For
example, values of “Don’t Know” or “Missing” were excluded from our analysis, whereas in DHS
reports, these categories are sometimes explicitly reported, or, in some types of AIDS knowledge,
considered equivalent to “No.” Similarly, DHS reports contraceptive prevalence rates for women
currently in union, whereas we report for all women. We report mean age at marriage, as opposed to
median.
D. Methods
The analysis began with single stratification analysis for each of the 20 health indicators studied.
Wherever possible, the values for health indicators were calculated for all stratifiers. However, some
indicators and stratifiers studied are based on data not available for all six countries. Others were omitted
because of indicator-specific computational difficulties. Indicators were not calculated for all
8 That is, with the exception the inherent distinction in age-specific indicators of the three child mortality rates: neonatal (NNMR) for children from birth to age 1 month, infant (IMR) for children under 12 months of age, and child (CMR) for children under 5 years of age.
p. 7
combinations of two stratifiers. For example, the cross-tabulation of ethnicity and region resulted, in
most cases, in too many very small or empty categories to allow for meaningful analysis. However,
ethnicities were recoded into dominant, not dominant, and in some cases, secondary dominant categories,
based on relevant literature9 in order to create a set of larger classes to be used as a stratifier in
combination with regions.
A “Wealth by poverty line” variable was created using the existing wealth indices (based on
DHS/Filmer and Pritchett 2001, Sahn and Stifel 2000). Data from the World Development Indicators on
the percentage of each national population living below the poverty line were applied to the wealth index
data. This approach was developed as an effort to complement the stratification by wealth quintile with a
very simple, immediately policy-relevant distinction between rich and poor.
In nearly all cases, the values presented are percentages of the class that fulfill the requirement of
the indicator (e. g. having a DPT2 vaccine, being underweight, or using a modern form of contraception).
‘Age at first intercourse’ and ‘Age at first marriage’ are exceptions, representing means. For each
stratification class (e. g. gender, region), a difference test was also calculated. These represent
probabilities of the null hypothesis that the values of an indicator for each level within a stratifier (i.e.
none, primary, and secondary within education) are not significantly different from each other. Tests of
significance were not performed on the mortality rate indicators, because they are rates rather than
proportions or percentages. However, Standard errors (SE) are given in individual DHS reports for the
national mortality rates. National-level SE can be used as a general indication of likely significance
between groups.
Our analysis next undertook simultaneous stratification and analysis for each pair of stratifiers
using each health indicator for each country. For example, in Kenya, ethnic group values are sub-
stratified by gender, region, residence, wealth, etc., and so on for each combination of stratifiers, to
determine the compounded effect of dual forms of vulnerability. Some pairings were not generated in the
simultaneously stratified analysis. For example, the raw ethnicity classifications are not combined with
regions, because doing so would result in the majority of classes being null for all countries studied.
Other indicators such as infant mortality were not included in the simultaneously stratified analysis,
because the number of events (deaths) would be too few to construct robust rates. P-values were run on
selective pairs or pair-sets. The full dataset generated by this analysis, some 14,000 cells of data is
available online.10
9 These include Moyo (2004) for Ethiopia, and Brockerhoff and Hewitt (2000) for Ghana and Kenya. For Cambodia, a rough proxy was created as follows: residents of the two provinces with ethnic minorities in the majority, as shown in Elledge et al. (2001), were designated “Not dominant”. Both provinces are more than two-thirds minority, while all other provinces of Cambodia are less than one-tenth ethnic minority. No ethnic group information was available for the Dominican Republic or Tajikistan. 10 http://www.unmillenniumproject.org/who/tf4docs.htm.

p. 8
IV. Results
This section attempts to succinctly summarize a vast amount of data generated via the
methodology described above. Our emphasis is on within country patterns, rather than comparisons
between countries. In order to organize our findings, we present data for each indicator in two categories:
first, observations or patterns which were ‘expected results’ on health inequalities and second,
observations or patterns which seem to be ‘unexpected results,’ surprising variations on the more
expected results or findings which seem to overturn conventional wisdom. One caveat worth mentioning
is that as analysis in these areas is quite sparse, determining what is the conventional wisdom is not
always straightforward.
Given the international literature on the subject, we would expect most indicators studied to be
differentiated by wealth quintile. Certain indicators such as measles immunization, we might expect to be
less differentiated by wealth because measles immunization tends to be the subject of nationwide
‘vertical’ health campaigns that should, in theory, reach everyone more or less equitably. Other indicators
such as ‘underweight’ we might expect to be more stratified by wealth quintile because, as the literature
indicates, underweight is more affected by access to food, which is in turn dependent upon wealth or
income (Wagstaff 2002). In general, we expect rural health outcomes to be worse than urban and we
expect a certain degree of heterogeneity amongst the regions, with certain regions falling behind in most
indicators. With regard to ethnic groups, the literature is far less complete on the subject, but we
hypothesize that some non-dominant ethnic groups will fall behind the national averages across all the
indicators measured. Based on a much more comprehensive literature on the role of maternal education
on family health outcomes, we expect stratification across education of the mother for all of the health
indicators.
Underweight children
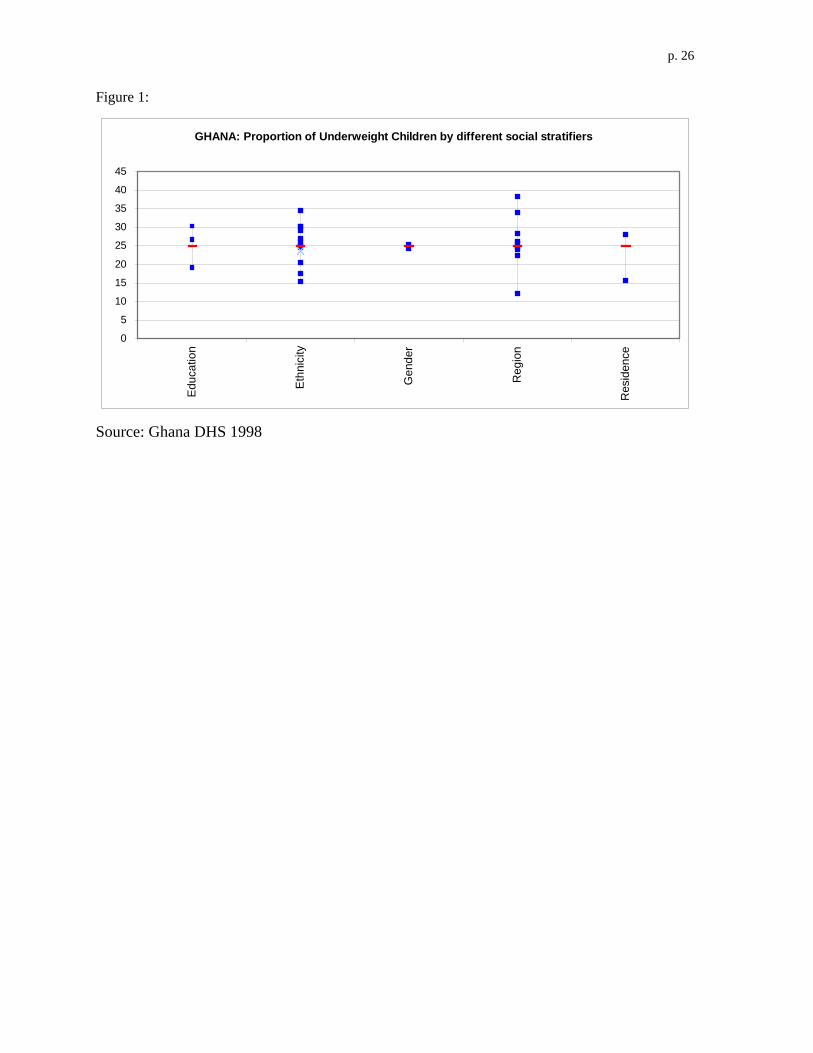
Expected Results: In Ghana, Kenya, Ethiopia and Cambodia, education, ethnicity, region and residence
all significantly stratify underweight. In Kenya and Ethiopia, where there is wealth data, wealth by
quintile and poverty line also significantly stratifies underweight. Figure 1 (at end of chapter) shows the
variation of the various strata on underweight children in Ghana. The horizontal mark indicates the
national average, or 25 percent of children. Ethnicity and region—and not wealth quintile—stand out as
having the widest range of values for underweight in Ghana. In Ethiopia, the pattern is slightly different
with region and education of the mother showing the widest range of values—ethnicity appears to be less
of a dramatic stratifier. And in Kenya, the pattern is different yet again, with education of the mother,
ethnicity, region and wealth quintile all showing a roughly equivalent range of values.
In Kenya, children whose mothers have secondary or more schooling, or were in the 5th wealth quintile, or
were of the Kikuyu ethnic group were least likely to be underweight (roughly 10 percent of these children
were), as compared to children of mothers with no education, in the poorest wealth quintile, or were of

p. 9
the Mijikenda/Swahili ethnic group, who respectively were 34 percent, 33 percent, and 32 percent
underweight. In the simultaneously stratified analysis, for each education level group, the proportion of
underweight children is two to four times as great for the children in the poorest households as they are in
wealthiest households. Rural children are more likely to be underweight, especially in families where the
mother has no or only primary education.
Unexpected Results: In none of the countries studied does gender appear to differentiate underweight
status. In Ethiopia, wealth does not appear to protect against having underweight children. Even in the
highest wealth quintile, education still matters: children of mothers with no education are twice as likely
to be underweight and six times as likely to be severely underweight. In Cambodia, the urban bias seems
to be concentrated among the households where the mother has completed primary and secondary
schooling. Among those with no formal education in Cambodia, there is no difference between rural and
urban levels of underweight children.
Immunization:
Expected results: For most countries studied, DPT1, DPT2, DPT3 and measles immunization is
significantly stratified by not just wealth quintile but education of the mother, ethnicity and region. Urban
versus rural residence also stratified all immunization indicators for Ghana and Ethiopia. These improve
significantly with the level of education of the mothers in Cambodia. The regional differences in Measles
and DPT3 immunization in Tajikistan show a range between over 90 percent to just above 60 per cent.
Unexpected results: For all of the countries studied, gender was did not significantly stratify
immunization (with the exception of DPT3 only for Dominican Republic). Rural versus urban residence
was not a strong factor in immunization inequities for any immunizations in Cambodia, for DPT
immunization in Kenya or for DPT 1 and 2 in the Dominican Republic. In Tajikistan, there is no stepwise
pattern ‘up the wealth ladder’ for immunization. For gender, girls have very slightly higher levels of
immunization, while rural areas appear to have very slightly higher levels of DPT coverage—and
increasingly higher as you move from DPT1 to 2 to 3. In Kenya, simultaneously stratified analysis shows
that ethnicity stratifies immunization (especially DPT 3 and measles), with less dominant ethnic groups
falling well behind—but without boys and girls treated more or less the same (see Table 3).
However, in Ethiopia, while the singly stratified relationship suggests a slight (though statistically
insignificant) favoring of male over female children for all vaccine, the more in-depth simultaneously
stratified analysis indicates an interaction with education: uneducated women significantly favor their
sons for all immunizations measured but DPT1, which is given at rates that are indistinguishable.
Primary educated women treat their sons and daughters more or less equally, and women with secondary
or more schooling favor their daughters significantly for measles vaccination (see Table 4). Unlike the
situation in many countries, it appears that basic immunization is very inequitably distributed, suggesting

p. 10
that there are significant challenges in the current implementation of even vertical programs. In Kenya, a
two-way view suggests that there are no gender differences in childhood immunization rates, but
differences emerge when adding other stratifiers. For example, 98 percent of urban boys were vaccinated
against measles whereas only 90 percent of urban girls were. However, no gender differences emerged
among rural children. The gender bias in vaccination rates decreases as the mother’s education increases,
but not to the extent that females are favored as in Ethiopia. DPT1 is about the same for urban and rural
residents.
Not completely unexpectedly, there is a lack of gender bias in DPT3 and measles. However, in
the simultaneously stratified analysis, males are significantly favored for measles among women with
secondary education and not those with less education. In Ghana, in urban areas, girls were more
privileged in immunizations than boys, while nationally there were no differences. In the Dominican
Republic, among women with no education, DPT3 is higher for sons, but measles is higher for girls.
Moreover, gender differentials appear at higher levels of education. For secondary-schooled women, there
is a weak DPT3 preference for daughters, but for the primary educated, there is no difference.
Child mortality rates:
Expected results: In Ghana, Ethiopia, Kenya and Cambodia, educational level of the mother, region and
residence stratify under-five mortality rates. For Kenya—the only country with ethnic group data for this
indicator—ethnicity dramatically stratifies child mortality rates with a range from 35 to 253 for under-five
mortality rates. And for Kenya, under-five mortality shows the expected stepwise decrease by increasing
wealth quintile. Phnom Penh, the capital of Cambodia, consistently shows the lowest mortality. For IMR
and U5MR, the next best region (a different one in each of the three mortality indicators) is almost twice
as high. In the worst region for all three indicators mortality rates are about 4.5 times higher than in the
capital city. In Ghana, inequality in childhood mortality is closely aligned with differences in education
and place of residence: more highly educated women and urban dwellers have much lower mortality.
Unexpected results: In Ethiopia, wealth quintile is not particularly strong in terms of stratifying
outcomes, nor is the urban/rural distinction. In fact, the third and fourth quintiles have higher U5MR than
the lowest quintiles and the highest quintile is not much different from the lowest. And in Kenya, it
appears that the difference between no maternal education and primary education does not yield large
differences in terms of NNMR, IMR and U5MR. Likewise in Ghana, primary education actually yields a
higher NNMR and IMR than no education.
Skilled birth attendants (SBA):
Expected results: Education, ethnicity, region, residence and wealth quintile all significantly stratify
skilled birth attendant usage in Ethiopia, Ghana and Kenya. For instance, in Ethiopia, major differences
are evident when the indicator is stratified by educational level with 3 percent SBA for those with no

p. 11
education, 10 percent for those with primary and 45 percent for those with secondary or more. In Kenya,
the Mijikenda/Swahili ethnic group was at a low of 27 percent and the Kikuyu at a high of 71 percent.
Similarly, in Ghana, ethnicity appears to dramatically affect delivery assistance by a skilled birth
attendant, with a near two-fold, statistically significant difference between dominant (63 percent) and the
not dominant groups (34 percent). In Ghana, education level shows a very similar pattern with mothers
with secondary or more education being attended by a SBA at a rate of 65 percent and those with no
education at 25 percent. In Cambodia, almost 90 percent of the births in Phnom Penh are assisted by
SBAs. This high level of coverage coexists with a national average of only a third of births assisted by
SBAs. Education and urban versus rural residence also stratify SBA in Cambodia. In Tajikistan, wealth
does make a difference whereby 55 percent of the lowest quintile and 87 percent of the highest use SBAs
and the rural/urban differential is 68 versus 84 percent.
Unexpected results: Simultaneously stratified analysis shows fairly dramatic stratification by education,
region and residence even amongst the non-poor (see Table 5). The Dominican Republic shows relative
equity in delivery by SBA in terms of maternal education and the urban versus rural residence. Still, it is
worth noting that SBA is at a relatively high absolute level in the Dominican Republic. In Tajikistan,
likewise, delivery by a skilled birth attendant is quite equitable in terms of level of education (74 percent
for those with no education, 77 percent for those with secondary or more) and between rural and urban
areas. Note that ‘skilled birth attendants’ yields quite different results from the ‘access to health care
facility in the last year’ indicator, suggesting that these questions measure two very different aspects of
the health system and are not proxies for one another.
AIDS Knowledge:
Expected results: In Ghana, Ethiopia and Kenya, AIDS knowledge is stratified significantly by education,
ethnicity, region and residence, suggesting a rather unequal spread and uptake of critical information and
education about HIV/AIDS. In Cambodia, knowledge that a healthy-looking person may have AIDS and
that using a condom during sex can help prevent HIV infection is also significantly related to the level of
education, though it’s worth noting that AIDS knowledge is relatively high even among women with no
formal education (87 and 72 percent respectively for the two indicators). In Tajikistan, rural populations
have much lower levels of AIDS knowledge and wealth by quintile makes a difference only for the
richest group (20 percent of individuals in this group knows that condoms can help prevent infection, as
opposed to less than 5 percent for the rest of the population). There are also large differences in AIDS
knowledge between regions and wealth quintiles in Tajikistan. In the Dominican Republic knowledge of
AIDS varies by region, with a range from 78 to 96 percent for the knowledge that a healthy-looking
person may have AIDS. As in Cambodia, where knowledge about AIDS is high (average close to 95
percent), it is still quite inequitably distributed.

p. 12
Access to a health facility:
Expected results: In Ethiopia, Ghana and Kenya, access to a health facility was stratified by education of
the mother, ethnicity, region, residence and wealth by quintile (with the exception of Ghana, for which
wealth information was not available). In Cambodia—all stratifiers measured were significant
(education, ethnicity, region and residence. In Kenya, ethnic disparities were high-- 70 percent of Kamba
women sought health services, whereas only about 40 percent of Luhya and Luo women sought health
care. In the Dominican Republic—education, and not residence was significant-- women with no
education have lower access (53 percent) than those with primary or secondary or more (a round 65
percent). In addition, this indicator is stratified by region with a range from 55 to 73 percent in the
Dominican Republic.
Unexpected results: Though wealth quintile was a significant stratifier in Ethiopia and Kenya, ethnicity
and region varied far more dramatically than did differences by wealth. And in Ethiopia, for those with
no education or a primary education, the rural/urban split in access to a health facility holds true, but for
those with a secondary or more education, rural versus urban residence gap closes (also there is no gap
between urban and rural for the fourth and fifth wealth quintiles). In the Harari region, regardless of the
level of education, access to a health facility lingers around 45 percent. Similarly, women from some
ethnic groups (e.g. Tigray) enjoy high level of access independent of their wealth level.
CPR modern method:
Expected results: In Ethiopia, Kenya and Ghana, CPR (modern method) is stratified significantly by
education, ethnic group, region, residence and wealth. In Tajikistan, there is a clear educational gradient,
with those with no education at 16 percent, 26 percent for secondary education and 41 percent for tertiary.
By wealth quintile, it is relatively equitably distributed though the richer groups have ten percentage
points higher than the rest.
Unexpected results: In Dominican Republic, surprisingly, the percentage of women using a modern
method of contraception actually declines as education increases, and the differences are statistically
significant. Among women with no education, CPR is significantly higher in urban areas, but among
women with primary education, use rates are slightly but significantly higher in rural areas [P-value:
0.03]. CPR decreases significantly with education at all levels in urban areas, and from primary to
secondary in rural areas. The level of formal education is not significant for utilization of modern
contraceptive method in Cambodia, but region and residence do stratify access. In Ethiopia, the lack of
education effect applies only in Addis (the capital).

p. 13
Age at first marriage (AAFM):
Unexpected results: Education makes a great difference in age at first marriage in Tajikistan, the
Dominican Republic, Ethiopia and Kenya but confers a statistically significant, but small difference in
Ghana and Cambodia. In both Tajikistan and Kenya, AAFM ranges from about 16 years of age for
women with no education to 20 years of age for women with secondary or more education. By contrast,
wealth quintile makes quite a difference in AAFM in Kenya (2.6 year difference from lowest to highest
quintile) and less of a difference in Ethiopia (1.2 year difference). In Ethiopia, ethnicity and region
stratify AAFM as much as education does---by as much as three years’ difference between population
groups. In Cambodia, urban and more educated women marry later than the ones lacking education or
living in rural areas. However, the pattern is dominated by education as there is no more than roughly a
month delay among urban women with no education or with secondary schooling compared to rural
women with the same level education. For women who completed primary education, the difference is
slightly larger. In Ghana, it is ethnicity, rather than education or region which has a strong effect on
AAFM—a 1.8 year difference between ethnic groups at the extremes.
V. Discussion
A. Key Findings
The first result from this analysis is that the majority of the social stratifiers chosen yield
statistically significant differences within all of the child, maternal and reproductive health indicators.
Wealth, ethnicity, educational level of the mother, gender, region and urban versus rural residence are
important dimensions of health inequity, with different implications for policy. Our analysis strongly
suggests that reliance on single indicators alone—and certainly national level averages—would lead to
limited, and even misguided, recommendations for policy.
Second, the importance of these social stratifiers must be understood as more than a statistical
exercise in mapping out health gaps. The significance of social processes (e.g. marginalization or ethnic
discrimination) in determining who is healthy and who is sick, and more profoundly who lives and who
dies, is a fundamental challenge to health policy. The current global focus on pro-poor health policies
“limits intervention to the end of the social production chain” leaving out many other core social
processes that generate health inequities (Vega and Irwin 2004). The global trend toward equating the
‘health equity agenda’ into ‘pro-poor’ health policies is a misleading oversimplification. The causes of
inequities in health are multifactorial, and the solutions are intersectoral. Oversimplification will address
only pockets of the problem. This analysis was undertaken to reduce that oversimplification while not
introducing complexities that make the analysis unrepeatable where it is needed.
The third, related, point is that inequities in health are complex and interactive. Health exclusion
is often a result of multiple and overlapping forms of social exclusion as well as differences in health

p. 14
system infrastructure that varies by region. One cannot draw inferences about the nature or extent of
inequities in the health system from a single indicator. Nor can we assume that the groups that are
disadvantaged in one indicator are necessarily the same groups disadvantaged in another. Whatever the
causal factors and the eventual policy choices made, the uncovering of severe disadvantage in certain
population groups necessitates a clear plan for mitigating or eliminating the health exclusion suffered by
certain population groups. Such a plan should be an integral part of Poverty Reduction Strategies (PRSs).
B. Limitations
The purpose of this analysis is to make an argument about the importance of disaggregating data
when tracking the MDGs and health policy outcomes. Despite the richness of the data, we note that this
brief snapshot of health inequalities is not intended to form the complete baselines for the countries we
studied.
The data sources should certainly be augmented. DHS and MICS were chosen as data sources
because, in practice, they may be the only reliable data source for some of these indicators in very low
resource or post-conflict settings. However, other (and additional) data sources may be more appropriate
to track all health indicators, or specific ones. Importantly, countries have their own unique population
based surveys such as Indonesia’s Family Life Survey (IFLS) that provide a wealth of information on
health and other social indicators that is explicitly tailored to national circumstances.
Sub-sampling from the vital registration system, demographic surveillance system (DSS) data and
facility-based surveys can also provide valid results and would be an important complement to
population-based surveys (Vega 2004, Ngom et al 2003). In addition, more in-depth and multivariate
quantitative analysis would assist in the clarification of causal pathways that lead certain groups to be
disadvantaged relative to others. Qualitative studies will play an important complementary role too.
Certain population groups such as refugee populations, orphans and ethnic or linguistic minorities
may be completely overlooked in analysis that relies about either population-based surveys or even vital
registration. Surveys must overcome long-standing shortcomings in the sampling frame such that
vulnerable populations are fully assessed.
In addition, even disaggregating data by region or by urban versus rural is often far too coarse a
level of analysis to highlight the disadvantages suffered by particular population groups—including urban
slum dwellers. For important data on these populations, rapid urban assessments or ongoing surveillance
or monitoring that is linked to policy, such as is evidenced in the ‘Equity Gauges’ will provide city-
specific data geared toward policymakers (McCoy et al 2003).
Reducing inequality in health will almost certainly require some geographic targeting of policies.
This analysis showed how important regional differences are in most countries. Being able to
georeference survey information facilities offers much more flexibility than is otherwise possible. Thus,

p. 15
geographic identifiers should be added to all surveys, including all the MICS and the DHS that have not
yet been geocoded.
For certain indicators, stratification by age may be another important aspect of an assessment of
inequalities in health. Particularly in an era when the adolescent cohort in the developing world is the
largest ever, the specific vulnerabilities of adolescents and the unique needs of vulnerable adolescents will
need special consideration. In addition, occupation would have been a very important stratifier for many
of the indicators examined but was not included.
C. Health information asymmetry
Putting aside the technical aspects of measuring and monitoring inequalities in health, we must
address a broader question of health information asymmetry. Some information on population health
exists in all countries, and in many cases, donors have injected considerable resources for population-
based surveys such as the DHS and MICS. The broader question of who owns that data and to what
purposes it is put is not the primary subject of this paper, but it is certainly a highly relevant and important
aspect of health equity.
Information about disparities in health is a potent tool, and it is critical that an adequate share of
donor resources be allocated to ensure country level involvement in the surveys—from their design and
implementation, to their use and interpretation. In particular, we note that donors should fund NGOs,
academic institutions and Parliamentary groups for the policy-relevant interpretation of this critical data
on population health. Citizens (and their representatives) must be empowered with information about
their health status—and in particular, their relative health status—how well they fare as compared to what
is possible. Furthermore, donor support must be given to developing complete vital registration systems
as a fundamental part of health systems.
VI. Conclusion
Inequities in health do exist even in the poorest countries and, as this analysis has shown, creating
a baseline from which to monitor inequities is feasible using population-based surveys.
The analysis presented in this paper has shown that various social stratifiers yield different
patterns of disparity. Regions are often co-terminus with ethnic divisions or poverty profiles, although
this codetermination is only revealed by the simultaneously stratified analysis undertaken here. For
example, measles vaccination rates seem to vary considerably significantly by wealth, but when regions
are added as substrata it becomes clear that some districts represent the bottom quintiles of the population.
While wealth is an important focus, the geographic elements of poverty would be overlooked and perhaps
misdirected without the disaggregation. In keeping with the global focus on pro-poor interventions,
understanding the correlates of poverty will be an important element in reducing it. We also note that in
many countries, ethnicity is a profoundly inflammatory subject and it may not be politically feasible to

p. 16
officially track health outcomes by ethnic group; often, however, geography is a proxy for ethnic group
and could be used as such. In addition, educational attainment of mothers is a critical social determinant of most health
indicators (for both children and mothers). Thus, investments in education must be seen as having a dual
positive effect—both within the education sector as well as in health. And concomitantly, health
messages and programs should be tailored so as to reach less educated mothers and their children.
Moreover, we found that different health indicators yield different patterns of inequity. AIDS
knowledge may be high and equitably distributed, but contraceptive prevalence rates and percentage of
children underweight within the same country may be grossly inequitable. Thus, an assessment of
inequities in health using just a handful of indicators has serious limitations. It is essential to measure and
monitor inequities in health, across multiple indicators and different social stratifiers (i.e. not just wealth
but education, gender, ethnicity and region as well). Monitoring health gaps—and being explicit about
which policies are being implemented to reduce them—is the responsibility of both governments and
donors alike. And monitoring health gaps (both in terms of gathering and analyzing data), in turn, is
crucial for the design of national health policies.
Health information systems are critical. Population based surveys such as DHS and MICS are
important sources of key health data, but long-term investments in health information systems must be
prioritized as part of the Poverty Reduction Strategies (PRSs). Donors and WHO must invest in country
capacity to oversee population based surveys and health information systems.
Once a baseline of these differences has been established, the difficult work begins. What are
the policies and programs that will address these critical issues? A range of standard behavioral and
social science methods must be used to explain and augment the quantitative data such as that generated
herein. And the policy initiatives to redress health gaps must be made explicit.
In order to monitor the progress toward greater coverage, national development goals such as the
MDGs ought to be framed so as to put priority on the groups that are lagging far behind. A baseline
assessment of inequities across multiple indicators and stratifiers should ultimately lead to participatory
dialogue that would prioritize the disadvantaged groups. Yet realistic expectations about the political
context are required. Whether the groups or regions are explicitly named in the MDGs is up to the
country (Vandemoortele 2004), but detailed tracking and monitoring should be clear about the specific
gaps that need to be closed. In many countries, interim-PRSs and PRSs have mentioned inequalities in
health. However, these strategies must be more comprehensive: first, in their evaluation of inequalities
in health—across multiple indicators and several stratifiers-- to piece together an accurate picture of
health disparities; and second, in their articulation of specific policy initiatives to redress health gaps. Practically, our recommendations mean that countries must prioritize the worse-off groups or
ensure that they improve at the same or faster rate as the better-off groups. This does not imply a
patchwork of ‘pro-poor’ interventions and ad hoc targeted programs. Rather, the results suggest that a

p. 17
universal health system that pays attention to inclusion of all population groups will likely be more
efficient and equitable. An egalitarian approach is, in many cases, a faster and more efficient way to
reach the MDGs than the current top-down model where the poorest and most marginalized are relegated
to the end of the queue.
p. 18
References AbouZahr, C., Wardlaw, T., et al. (2004). Antenatal Care in Developing Countries: Promises,
achievements and missed opportunities: An analysis of trends, levels and differentials, 1990-2001. WHO/UNICEF.
Braveman, P. (1998). Monitoring Inequities in Health: A Policy-Oriented Approach in Low- and
Middle-Income Countries. WHO/CHS/HSS/98.1. Geneva: World Health Organization. http://whqlibdoc.who.int/hq/1998/WHO_CHS_HSS_98.1.pdf
Braveman, P. and Gruskin, S. (2003). Poverty, equity, human rights and health. Bulletin of the World
Health Organization 81(7):539-545. Braveman, P. and S. Gruskin (2003). Defining equity in health. Journal of Epidemiology and Community
Health 57: 254-258. Castro-Leal, F., Dayton, J. et al. (2000). Public Spending on Health Care in Africa: Do the Poor
Benefit? Bulletin of the World Health Organization. 78(1): 66-74. Central Statistical Authority [Ethiopia] and ORC Macro. (2001). Ethiopia Demographic and Health
Survey 2000. Addis Ababa, Ethiopia and Calverton, Maryland, USA: Central Statistical Authority and ORC Macro.
Centro de Estudios Sociales y Demográficos (CESDEM) and MEASURE DHS+/ORC Macro (2003).
República Dominicana Encuesta de Demografía y Salud 2002. Calverton, Maryland, USA, Centro de Estudios Sociales y Demográficos, CESDEM and MEASURE DHS+/ORC Macro.
Evans, T. and Stansfield, S. (2003). Health Information in the New Millennium: A Gathering Storm?
Bulletin of the World Health Organization. 81(12): 856. Evans, T., Whitehead, M, et al. (2001). Challenging Inequities in Health: From Ethics to Action. New
York: Oxford University Press. Filmer, D. and Pritchett L. (2001). Estimating wealth effects without expenditure data--or tears: an
application to educational enrollments in states of India. Demography. 38(1):115-32. Freedman, L., Wirth, M. et al. (2004). Interim Report. Task Force 4: Child health and maternal health.
New York: UN Millennium Project. Freedman et al. (2003). Background Paper on Child health and Maternal Health. Task Force 4. New
York: UN Millennium Project. Ghana Statistical Service (GSS) and Macro International Inc. (MI). (1999). Ghana Demographic and
Health Survey 1998. Calverton, Maryland: GSS and MI. Gwatkin, D.R. (2002) Who would gain most from efforts to reach the Millennium Development Goals for
health?: An inquiry into the possibility of progress that fails to reach the poor. HNP Discussion Paper. Washington, DC: World Bank.
Gwatkin, D., S. Rutstein, et al. (2003). Initial country-level information about socio-economic differences
in health, nutrition, and population. Washington, DC, The World Bank.

p. 19
Kunst and Houweling (2001). A global picture of poor-rich differences in the utilisation of delivery care. Safe motherhood strategies: a review of the evidence. W. Van Lerberghe and V. De Brouwere: 297-316.
McCloskey, D. and T. Ziliak (1996) ‘The Standard Error of Regression’, Journal of Economic Literature,
March. McCoy, D., Bambas, A., et al. (2003).Global Equity Gauge Alliance: Reflections and Early Experiences.
Journal of Health Population and Nutrition. 21(3): 273-287. Minujin, A. and Delamonica, E. (2003a). Mind the Gap! Widening Child Mortality Disparities. Journal
of Human Development. 4(3): 397-418. Minujin, A. and Delamonica, E. (2003b). Equality Matters for a World Fit for Children: Lessons from the
90s. UNICEF Staff Working Papers, Division of Policy and Planning Series (Draft, Number DPP-03).
Moyo, S. (2004) “Socio-Economic Dominance of Ethnic and Racial Groups – The African Experience.”
Human Development Report Office (Occasional Paper, Background Paper for HDR 2004). United Nations Development Programme, 2004/8.
National Council for Population and Development (NCPD), Central Bureau of Statistics (CBS) (Office of
the Vice President and Ministry of Planning and National Development) [Kenya], and Macro International Inc. (MI). (1999). Kenya Demographic and Health Survey 1998. Calverton, Maryland: NDPD, CBS, and MI.
National Institute of Statistics, Directorate General for Health [Cambodia], and ORC Macro. (2001).
Cambodia Demographic and Health Survey 2000. Phnom Penh, Cambodia, and Calverton, Maryland, USA: National Institute of Statistics, Directorate General for Health, and ORC Macro.
Ngom, P, Binka, F et al. (2003). Demographic Surveillance and Health Equity in Sub-Saharan Africa:
Past and Present Efforts. African Population and Health Research Center. Working Paper Series. Nairobi: APHRC.
Poincaré. H. (1905). Science and Hypothesis, New York, NY: Dover Publications (1952 reprint). Ransom, M.K., Hanson, K., Oliveira-Cruz, V., Mills, A. (2003). Constraints to expanding access to
health interventions: an empirical analysis and country topology. Journal of International Development. 15:15-39.
Sachs, J. et al. (2004). Millennium Development Goals Needs Assessments: Country Case Studies of
Bangladesh, Cambodia, Ghana, Tanzania and Uganda. Working Paper. New York: UN Millennium Project.
Segone, M. (2001). Child Poverty in Niger: Longitudinal, Gender, Spatial and Wealth Analysis Based on
DHS 1992, MICS 1996, DHS 1998 and MICS 2000. (Draft). UNICEF, October 2001. Swinkels, R. and R. Turk (2002). Achieving the Vietnam Development Goals: An Overview of Progress
and Challenges. World Bank. United Nations Children’s Fund (UNICEF). (2000). Multiple Indicator Cluster Survey (MICS):
Tajikistan. Dushanbe: UNICEF.

p. 20
United Nations Children’s Fund (UNICEF), Division of Evaluation, Policy and Planning, Programme Division. (2000). End-Decade Multiple Indicator Survey Manual: Monitoring Progress Toward the Goals of the 1990 World Summit for Children. New York, NY, USA: UNICEF.
United Nations Development Programme (UNDP). (2003). Human Development Report 2003. New
York: UNDP. Vandemoortele, J. (2000) Absorbing Social Shocks, Protecting Children and Reducing Poverty: The Role
of Basic Social Services, UNICEF staff working papers, Evaluation, Policy and Planning Series no. 00-001. New York: UNICEF.
Vega, J. and A. Irwin. (2004). Tackling health inequalities: new approaches in public policy. Bulletin of
the World Health Organization. 82(7): 482. Vega, J. (2004). Personal communication. Victora, CG, Vaughan, P. Barros, FC, Silva, AC, Tomasi, E. (2000). Explaining trends in inequities:
evidence from Brazilian child health studies. The Lancet. 356(9235). Wagstaff, A., Bustreo, F., Bryce, J., Claeson, M., Axelsson, H. (2003). Inequalities in Child Health: Are We
Narrowing the Gap? (2003) HNP Discussion Paper. Washington D.C: The World Bank. Wagstaff, A. (2002). Poverty and health sector inequalities. Bulletin of the World Health Organization.
80(2): 97-105. Wagstaff, A. and Watanabe, N. (2000). Socioeconomic inequalities in child malnutrition in the
developing world. Policy Research Working Papers. Washington D.C.: The World Bank.

p. 21
Table 1. Definition of indicators used
Closest Related MDG
Variable Goal Target Indicator Indicator Definition
Under-five Mortality Rate (U5MR)
4 5 13 Mortality rate for children under five years old, per 1,000 live births
Infant Mortality Rate (IMR)
4 5 14 Mortality rate for children under one year old, per 1,000 live birth
Neonatal Mortality rate (NNMR)
Mortality rate for children under 30 days old, per 1,000 live births
Underweight 1 2 4 Percentage of children under age five moderately or severely underweight
Severely Underweight
Percentage of children under age five severely underweight
Moderately Underweight
Percentage of children under age five moderately underweight. (Moderately or severely underweight means more than two standard deviations below mean weight for age of reference population; severe is more than three)
KNOWLEDGE OF AIDS
6 18 19b. Percentage of population aged 15-24 years with comprehensive correct knowledge of HIV/AIDS (UNICEF-WHO)
HIV knowledge, women aged 15-24 who know that a healthy-looking person can transmit HIV, percent (UNICEF-UNAIDS-WHO)
HIV knowledge, women aged 15-24 who know that a person can protect herself from HIV infection by consistent condom use, per cent (UNICEF-UNAIDS-WHO)
CPR 6 18 19c. Contraceptive prevalence rate (UN Population Division)
Contraceptive use among currently married women aged 15-49, any method, per cent (UN Population Division)
Contraceptive use among currently married women aged 15-49, condom, per cent (UN Population Division)
Contraceptive use among currently married women aged 15-49, modern methods, per cent (UN Population Division)
MEASLES 4 5 15 Proportion of 1 year-old children immunized against measles (UNICEF-WHO)
DPT Proportion of 1 year-old children immunized against Diphtheria, Pertussis and Tetanus. (three doses)
Skilled Birth Attendant
5 6 17 Proportion of births attended by skilled health personnel (UNICEF-WHO)
Refers exclusively to people with midwifery skills (for example, doctors, midwives, nurses) who have been trained to proficiency in the skills necessary to manage normal deliveries and diagnose or refer obstetric complications.
Birth attendance by doctor
Proportion of births attended by doctor
AGE AT FIRST INTERCOURSE
Average age at first intercourse.
AGE AT FIRST MARRIAGE
Average age at first union.
HEALTH SYSTEM USE
Visited a health facility in the past 12 months.
p. 22
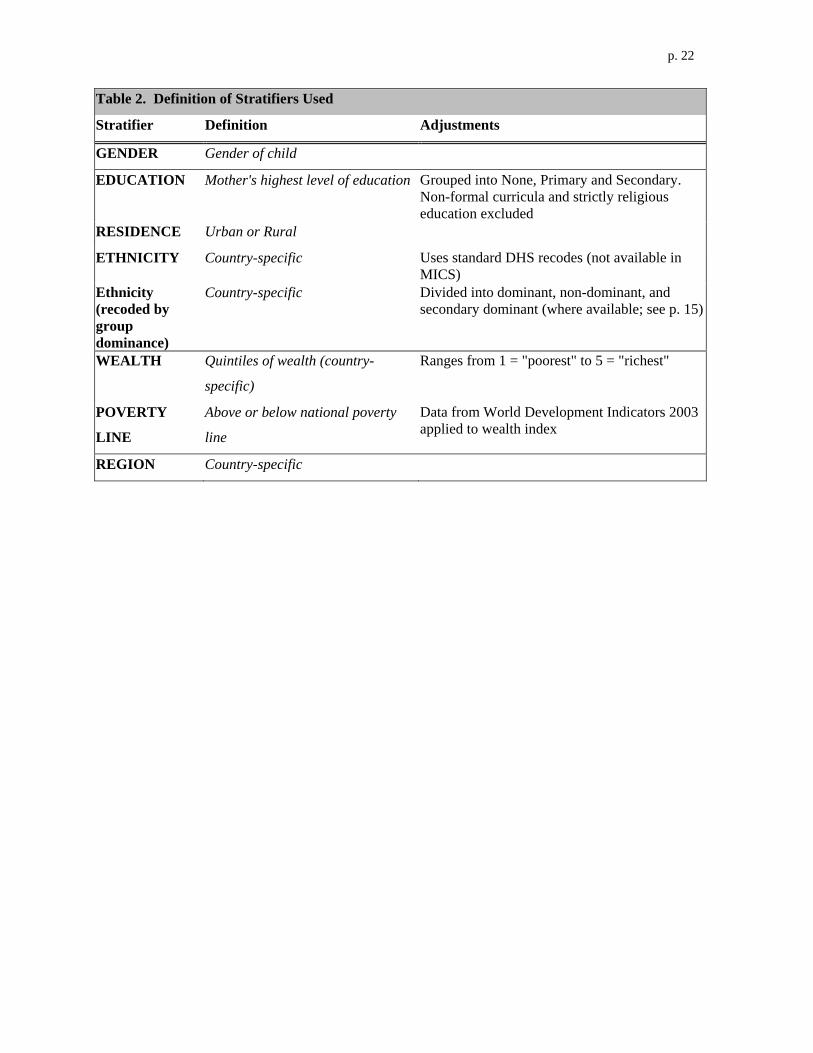
Table 2. Definition of Stratifiers Used
Stratifier Definition Adjustments
GENDER Gender of child
EDUCATION Mother's highest level of education Grouped into None, Primary and Secondary. Non-formal curricula and strictly religious education excluded
RESIDENCE Urban or Rural ETHNICITY Country-specific Uses standard DHS recodes (not available in
MICS) Ethnicity (recoded by group dominance)
Country-specific Divided into dominant, non-dominant, and secondary dominant (where available; see p. 15)
WEALTH Quintiles of wealth (country-
specific)
Ranges from 1 = "poorest" to 5 = "richest"
POVERTY
LINE
Above or below national poverty
line
Data from World Development Indicators 2003 applied to wealth index
REGION Country-specific

p. 23
Table 3. Immunization in Kenya by gender and ethnic group
St
ratif
icat
ion
Cla
ss 1
Stra
tifie
r 1
Stra
tific
atio
n C
lass
2
Stra
tifie
r 2
DPT
1
DPT
2
DPT
3
Mea
sles
Ethnicity groups Dominant - Primary 100 100 96 99 Dominant -
Secondary 99 96 91 83
Fem
ale
Not Dominant 94 86 72 75 Ethnicity groups Dominant - Primary 100 100 91 97 Dominant -
Secondary 96 90 78 83
Gen
der
Mal
e
Not Dominant 95 89 80 76

p. 24
Table 4: Immunization in Ethiopia Stratified by Gender and Education of the Mother Stratifier 1 Stratifier 2 Immunization Indicators (Gender) (Education) DPT 3 Measles Males All levels 20 26 Females All levels 23 28 Males None 19 25 Females None 13 20 Males Primary 37 39 Females Primary 34 39 Males Secondary or more 53 48 Females Secondary or more 59 76

p. 25
Table 5: Delivery assistance in Kenya by poverty status, education, region and residence
St
ratif
icat
ion
Cla
ss
#1
Stra
tifie
r 1
Stra
tific
atio
n C
lass
#2
Stra
tifie
r 2
Del
iv A
ssis
t by
Doc
tor
Del
iv A
ssis
t by
SBA
None 12 40Primary 12 45Education
Secondary or more 25 77Central 16 70Coast 21 49
Eastern 16 56Nairobi 32 78Nyanza 11 52
Rift Valley 13 50
Region
Western 10 39Rural 13 49
Not Poor
Residence Urban 24 72None 6 19
Primary 5 24Education Secondary
or more 9 43Central Coast 2 14
Eastern 8 31Nyanza 4 24
Rift Valley 9 24
Region
Western 4 26Rural 6 25
Wea
lth b
y po
verty
line
Poor
Residence Urban (9) (40)
p. 26
Figure 1:
GHANA: Proportion of Underweight Children by different social stratifiers
0
5
10
15
20
25
30
35
40
45
Edu
catio
n
Eth
nici
ty
Gen
der
Reg
ion
Res
iden
ce
Source: Ghana DHS 1998