setting of the irm and lcrs - nyiso · setting of the irm and lcrs ... pjm-seny mars model ......
TRANSCRIPT
© 2015 New York Independent System Operator, Inc. All Rights Reserved. 1 DRAFT – FOR DISCUSSION PURPOSES ONLY
Setting of the IRM and LCRs
The Basic Process
ICAP WG Task Force for LCR Review March 5, 2015
NYISO , Rensselaer, NY
Greg Drake Supervisor – Resource Adequacy
New York Independent System Operator

© 2015 New York Independent System Operator, Inc. All Rights Reserved. 2 DRAFT – FOR DISCUSSION PURPOSES ONLY
Objectives
Basic understanding of the NYSRC’s
process for setting the IRM1
Basic understanding of the NYISO’s
process for setting the LCRs2
The LCR process starts with the completed
base case database for the IRM.
1. To find NYSRC Policy 5-8 go to Documents/Policies at http://www.nysrc.org.
2. To find NYISO LCR Calculation Process go to NYISO website at nyiso.com and look
under Market Data/ICAP/Reference Documents/LCR_Calculation_Process

© 2015 New York Independent System Operator, Inc. All Rights Reserved. 3 DRAFT – FOR DISCUSSION PURPOSES ONLY
IRM Process - Background
The IRM study3 occurs over a calendar year
for an upcoming Capability Year (May-
April)
NYISO populates data and performs
simulations under guidance of NYSRC’s
ICS.
The NYISO is a technical resource for the
NYSRC
3. To find present and past IRM reports go to Documents/Reports at http://www.nysrc.org.
© 2015 New York Independent System Operator, Inc. All Rights Reserved. 4 DRAFT – FOR DISCUSSION PURPOSES ONLY
IRM Process - Background
IRM answers the question of how much
ICAP is needed to meet the peak load.
The year is simulated at least 1,000
times to give a Loss of Load
Expectation (LOLE).
Capacity is adjusted so that over the
1,000 iterations, the LOLE comes out to
the NYSRC criterion of 0.100 days/year.
© 2015 New York Independent System Operator, Inc. All Rights Reserved. 5 DRAFT – FOR DISCUSSION PURPOSES ONLY
IRM Process – Load Inputs
The load forecast is based on previous year
actual plus forecast growth (TO/NYISO agreement)
The forecast represents a 50% chance the actual load is higher
(50/50 forecast)
Uncertainty of load due to weather is
studied. Each 1,000 iteration case is run against seven load levels with
various probabilities.
For example, one of the levels could indicate the load if there
was only a 6% probability of being above that load (94/6
forecast).
Each load level can have its own historic
hourly load shape. We currently use 3 shapes.
© 2015 New York Independent System Operator, Inc. All Rights Reserved. 6 DRAFT – FOR DISCUSSION PURPOSES ONLY
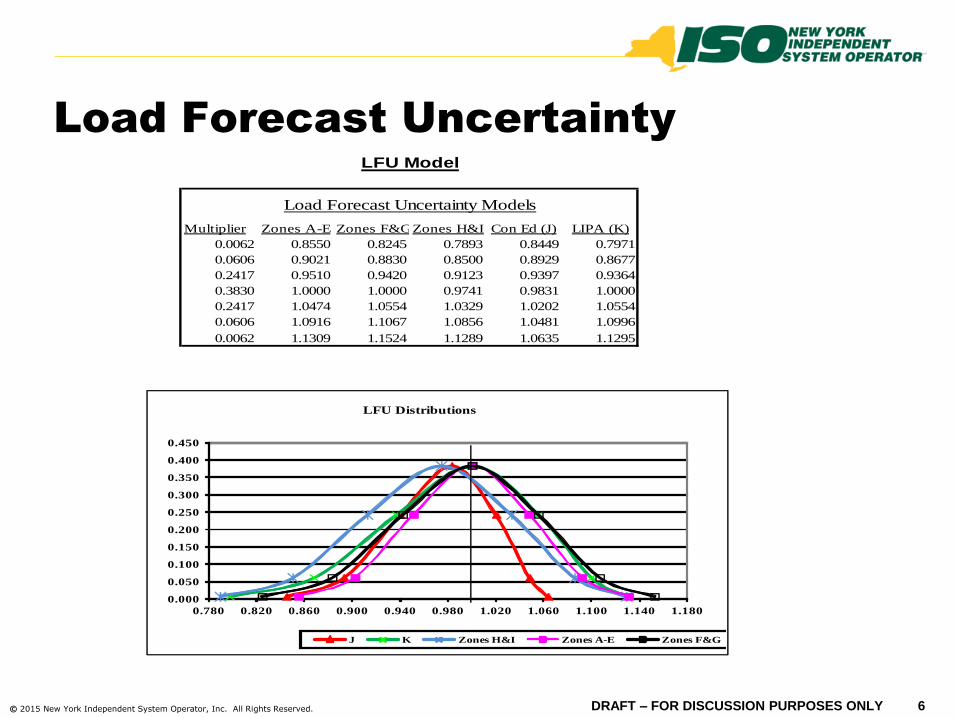
Load Forecast Uncertainty
Multiplier Zones A-E Zones F&GZones H&I Con Ed (J) LIPA (K)
0.0062 0.8550 0.8245 0.7893 0.8449 0.7971
0.0606 0.9021 0.8830 0.8500 0.8929 0.8677
0.2417 0.9510 0.9420 0.9123 0.9397 0.9364
0.3830 1.0000 1.0000 0.9741 0.9831 1.0000
0.2417 1.0474 1.0554 1.0329 1.0202 1.0554
0.0606 1.0916 1.1067 1.0856 1.0481 1.0996
0.0062 1.1309 1.1524 1.1289 1.0635 1.1295
Load Forecast Uncertainty Models
LFU Model
0.000
0.050
0.100
0.150
0.200
0.250
0.300
0.350
0.400
0.450
0.780 0.820 0.860 0.900 0.940 0.980 1.020 1.060 1.100 1.140 1.180
LFU Distributions
J K Zones H&I Zones A-E Zones F&G
© 2015 New York Independent System Operator, Inc. All Rights Reserved. 7 DRAFT – FOR DISCUSSION PURPOSES ONLY
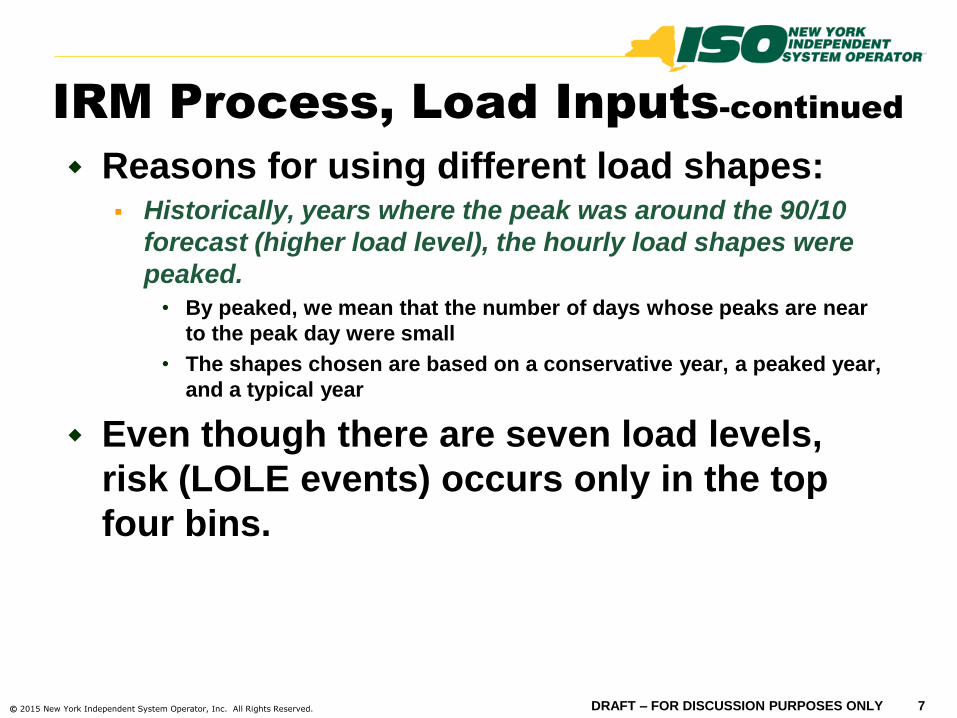
IRM Process, Load Inputs-continued
Reasons for using different load shapes: Historically, years where the peak was around the 90/10
forecast (higher load level), the hourly load shapes were
peaked.
• By peaked, we mean that the number of days whose peaks are near
to the peak day were small
• The shapes chosen are based on a conservative year, a peaked year,
and a typical year
Even though there are seven load levels,
risk (LOLE events) occurs only in the top
four bins.

© 2015 New York Independent System Operator, Inc. All Rights Reserved. 8 DRAFT – FOR DISCUSSION PURPOSES ONLY
IRM Process – Capacity Inputs
5 years of historical performance is used to predict
future availability of thermal and large hydro
generators. Wind and solar use one year of production data.
Run of river hydro uses a plot of monthly output based on
history
The simulation program uses a Monte Carlo
methodology to probabilistically generate hourly
outage patterns for thermal units for each of the
1,000 iterations.
Special Case Resources (SCRs) are modeled based
on registrations and are derated based on tested
and historic performance.

© 2015 New York Independent System Operator, Inc. All Rights Reserved. 9 DRAFT – FOR DISCUSSION PURPOSES ONLY
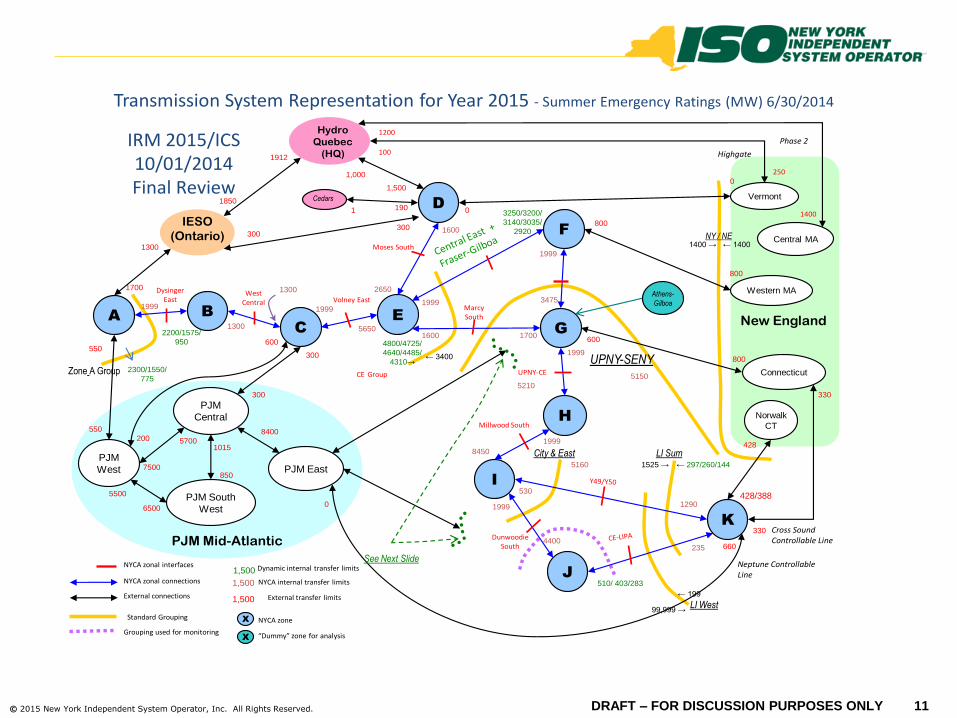
IRM Process – Other Inputs
We model interface limits between Zones and
between Areas4 (line and bubble diagram).
Unforced Deliverability Rights (UDR) facilities, to
the extent they have not elected to return them for
the upcoming Capability Year (i.e., notification to
NYISO by August 1) are modeled as contracts. Contract levels on UDRs are considered confidential
Any tie capacity left (after contracts) is available for emergency
assistance
4. Current computing capabilities do not support use of a power flow model in GE MARS.

© 2015 New York Independent System Operator, Inc. All Rights Reserved. 10 DRAFT – FOR DISCUSSION PURPOSES ONLY
IRM Process – Other Inputs
We model the Emergency Operator Procedures
(EOPs) that can be employed during a system
emergency.
Such as: Voltage reductions, Emergency Demand
Response Program (EDRP), Public Appeals, voluntary
industrial curtailments, and operating reserves.
Finally, we can ask for emergency assistance from
our neighbors.
We model neighboring interconnected Control Areas of
PJM (classic footprint), New England, Ontario and Quebec
© 2015 New York Independent System Operator, Inc. All Rights Reserved. 11 DRAFT – FOR DISCUSSION PURPOSES ONLY
D
IESO
(Ontario)
PJM
West
Connecticut
Vermont
Western MADysingerEast
AB
C
E
PJM
Central
PJM East
2200/1575/
950
1999
1300
600
200 5700
300
300
2650
1600
West Central
1999
5650
Volney East
Hydro
Quebec
(HQ)
300
1850
1,000
1,500
F
G
H
I
J
Moses South
1600
1999Marcy South
CE Group
← 3400
4800/4725/
4640/4485/
4310→
1700
3475
1999
0
0
800
800
600
New England
Norwalk
CT
330
428/388
UPNY-CE
1999
Millwood South
8450
1290
530
1999
Neptune Controllable Line
660
LI Sum
LI West
510/ 403/283
235
428
NY / NE
Cross Sound Controllable Line
330K
Dunwoodie South
External transfer limits1,500
1,500
Grouping used for monitoring
NYCA zonal connections
Standard Grouping
NYCA zonal interfaces
External connections
X NYCA zone
NYCA internal transfer limits
X “Dummy” zone for analysis
Athens-
Gilboa
8400
1999
800
Cedars
190
1912
UPNY-SENY
1
Central MA
City & East
PJM South
West
7500
1015
5500
6500
Highgate
250
Phase 2
1400
PJM Mid-Atlantic
550
550
1300
1700
300
← 14001400 →
Transmission System Representation for Year 2015 - Summer Emergency Ratings (MW) 6/30/2014
← 199
99,999 →
5160
4400
1525 → ← 297/260/144
850
100
1200
5210
See Next Slide
Zone A Group 2300/1550/
775
1300
5150
3250/3200/
3140/3035/
2920
1,500 Dynamic internal transfer limits
IRM 2015/ICS10/01/2014 Final Review
0
© 2015 New York Independent System Operator, Inc. All Rights Reserved. 12 DRAFT – FOR DISCUSSION PURPOSES ONLY
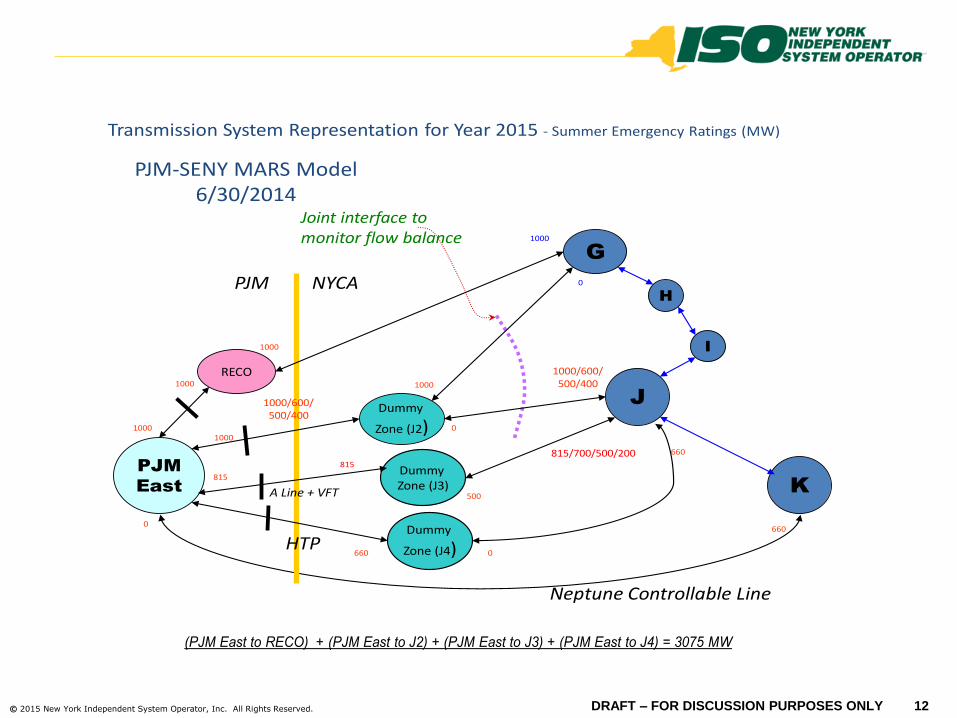
JDummy
Zone (J2)
G
PJM
East
Dummy Zone (J3) K
1000/600/500/400
815/700/500/200
1000
0
1000
1000
660
815
0
RECO
815
500
1000
0
1000
Neptune Controllable Line
Joint interface to monitor flow balance
PJM NYCA
(PJM East to RECO) + (PJM East to J2) + (PJM East to J3) + (PJM East to J4) = 3075 MW
H
I
1000
A Line + VFT
Dummy
Zone (J4)HTP660
660
1000/600/500/400
Transmission System Representation for Year 2015 - Summer Emergency Ratings (MW)
PJM-SENY MARS Model 6/30/2014
0
© 2015 New York Independent System Operator, Inc. All Rights Reserved. 13 DRAFT – FOR DISCUSSION PURPOSES ONLY
IRM Process – One Curve Point
If, after utilizing all means possible to meet
the peak load, there is still a shortage, a
loss of load event is registered.
A single load level LOLE value is the
expected loss of load events per year at this
level. The final LOLE is arrived at by multiplying each load level
probability times its result and adding the seven values.
The model is re-run varying the amount of
capacity removed until 0.100 LOLE is met. NYCA currently has excess capacity
© 2015 New York Independent System Operator, Inc. All Rights Reserved. 14 DRAFT – FOR DISCUSSION PURPOSES ONLY
IRM Process – Multiple Curve Points
Capacity upstate has a different statewide
LOLE impact than capacity downstate.
Where and how the capacity is adjusted
affects the final results.
The IRM-LCR curve (next slide) shows the
relationship of the tradeoffs between
statewide and J&K locality values (all points
are at criteria).
The NYSRC technical report indicates the
IRM at the knee (or tan 45) of the curve.
© 2015 New York Independent System Operator, Inc. All Rights Reserved. 15 DRAFT – FOR DISCUSSION PURPOSES ONLY
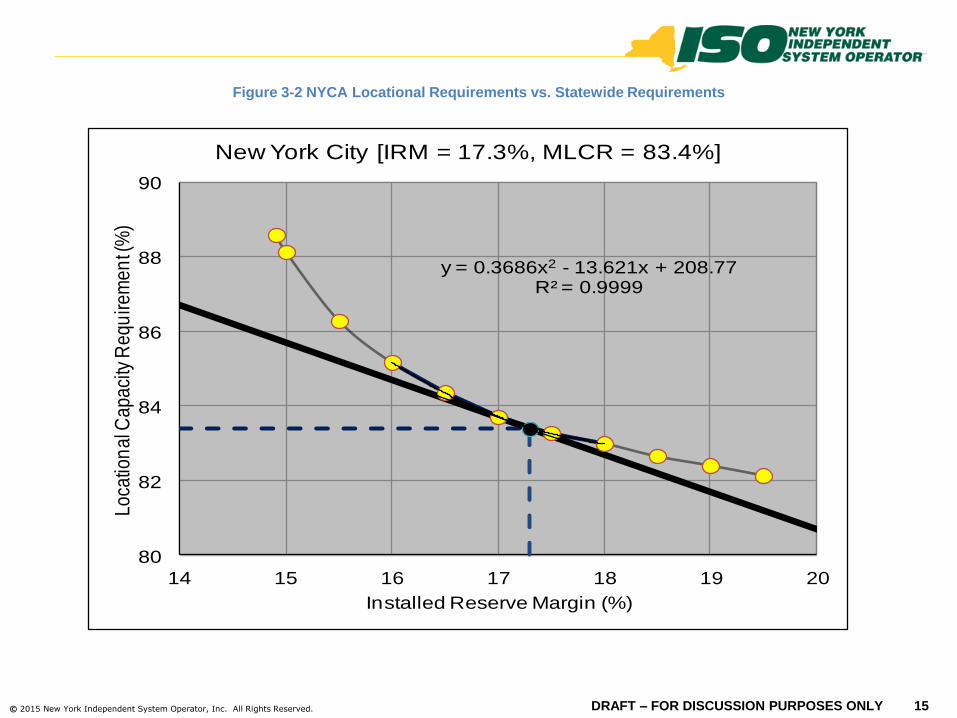
Figure 3-2 NYCA Locational Requirements vs. Statewide Requirements
y = 0.3686x2 - 13.621x + 208.77R² = 0.9999
80
82
84
86
88
90
14 15 16 17 18 19 20
Lo
catio
na
l Ca
pa
city
Re
qu
ire
me
nt (
%)
Installed Reserve Margin (%)
New York City [IRM = 17.3%, MLCR = 83.4%]

© 2015 New York Independent System Operator, Inc. All Rights Reserved. 16 DRAFT – FOR DISCUSSION PURPOSES ONLY
y = 0.4114x2 - 15.313x + 245.47R² = 0.9999
100
102
104
106
108
110
112
14 15 16 17 18 19 20
Loca
tion
al C
apac
ity R
equ
irem
ent (
%)
Installed Reserve Margin (%)
Long Island [IRM = 17.3%, MLCR = 103.7]

© 2015 New York Independent System Operator, Inc. All Rights Reserved. 17 DRAFT – FOR DISCUSSION PURPOSES ONLY
LCR Process - Background
The IRM study shows indicative LCR
values for Zones J & K. Actual LCR
values are found during the LCR study. The LCR Study starts with the completed IRM database
The LCR values must also comply with
the LOLE criteria.
A separate IRM-LCR curve is not
created since the IRM value is a fixed
input to the LCR study.
© 2015 New York Independent System Operator, Inc. All Rights Reserved. 18 DRAFT – FOR DISCUSSION PURPOSES ONLY
LCR Process – Input Changes
The load forecast is updated between
the time of the IRM and LCR studies.
Other material changes5 could also be
incorporated. The resulting LCRs could look different than the
ones shown in IRM.
5. Material capability changes are individual changes that would increase or decrease
generation, CRIS MW, or transmission transfer capability by 200 MW or greater.
© 2015 New York Independent System Operator, Inc. All Rights Reserved. 19 DRAFT – FOR DISCUSSION PURPOSES ONLY
LCR Process – Steps
At the established IRM study point: Reset all capacity to Zones J & K. to their ‘as found’
condition.
Shift capacity from Zone J to upstate zones (A, C, and D)
until the LOLE criteria is met.
Reset the capacity from J and shift from Zone K.
Reset the capacity from K and shift from J & K based on
ratios found above. This sets the recommendation for
the J and K LCRs.
Reset J’s capacity and freeze K’s at the above found LCR
level.
Shift capacity from G-J. The remaining capacity divided
by the G-J peak load is the proposed G-J LCR6.
6. The LCR values are rounded to the nearest 0.5% and the LOLE is verified to
satisfy LOLE criteria

© 2015 New York Independent System Operator, Inc. All Rights Reserved. 20 DRAFT – FOR DISCUSSION PURPOSES ONLY
Numerical Example7 of LCR Calculations
MWs Starting After Shift Peak Load Margin
Zones Shifted: J Ratio: K Ratio: Capacity Capacity Forecast %
Shift J alone 500 10500 10000 11929
Shift K alone 400 6000 5600 5539
=500/(400+500) =400/(400+500)
Ratios found: 0.5555556 0.4444444
Shift J and K 700
Final J 388.9 =700*0.56 10500 10111.1 11929 84.8%
Final K 311.1 =700*0.44 6000 5688.9 5539 102.7%
MWs Starting After Shift Peak Load Margin
Zones Shifted: J Ratio: K Ratio: Capacity Capacity Forecast %
Shift G - J 705 15425 14720 16340 90.1%
Fixed Shift of K: 311.1 6000 5688.9 5539 102.7%
Setting LCRs for the G -J Locality (example)
Setting of Zones J and K LCRs (example)
7. All capacity values are in ICAP

© 2015 New York Independent System Operator, Inc. All Rights Reserved. 21 DRAFT – FOR DISCUSSION PURPOSES ONLY
Numerical Example8 of LCR Calculations
After 600 MW Unit Addition in Zone G
MWs Starting After Shift Peak Load Margin Initial Case
Zones Shifted: J Ratio: K Ratio: Capacity Capacity Forecast % Margin(%)
Shift J alone 600 10500 9900 11929
Shift K alone 500 6000 5500 5539
Ratios found: 0.545455 0.454545
Shift J and K 900
Final J 490.9 10500 10009.1 11929 83.9% 84.8%
Final K 409.1 6000 5590.9 5539 100.9% 102.7%
MWs Starting After Shift Peak Load Margin
Zones Shifted: J Ratio: K Ratio: Capacity Capacity Forecast %
Shift G - J 905 16025 15120 16340 92.5% 90.1%
Fixed Shift of K: 409.1 6000 5590.9 5539 100.9% 102.7%
Setting of Zones J and K LCRs (example)
Setting LCRs for the G -J Locality (example)
8. All capacity values are in ICAP

© 2015 New York Independent System Operator, Inc. All Rights Reserved. 22 DRAFT – FOR DISCUSSION PURPOSES ONLY
The New York Independent System Operator (NYISO) is a not-for-profit
corporation that began operations in 1999. The NYISO operates New York’s
bulk electricity grid, administers the state’s wholesale electricity markets, and
provides comprehensive reliability planning for state’s bulk electricity system.
__________________________________________________________
www.nyiso.com