sethesdolmo 20814-505b nmri 86-52 december 1986 · concept: the unit pulmonary toxicity dose...
TRANSCRIPT
Naval Medical Research InstituteSethesdolMO 20814-505b NMRI 86-52 December 1986
PREDICTING4 PULMONARY 0 2 TOXICITY:j k,, NEW LOOK AT THE UNIT PULMONARY
"tOXICITY DOSE.IDTIC
\! L. Harobin D TIC, ll'tz-"CTEn-. D. Homer MAR 0 6 W
P. K. Weathersby"and
E. T. Flynn
Approved for public release;distribution is unlimited
°Q0-
C(-" Naval Medical Research
LLj and Development Command,, J Bethesda, Maryland 20814-5044
-4 • Department of the NavyNaval Medical CommandWashington, D.C. 20372-5210
8,5
¶ -- 87 3 5 055*,:. l
2- , v ~ . *~~ ** .~

NOTICES
The opinions and assertions contained herein are the private ones of the writer and ore not to be construed l off.ficial or reflecting the views of the naval servire at large.
When U.S. Government drawings, specifications, or other data are used for any purpose other then a definitelyreatied Government procurement operation, the Government thereby incurs no responsibility nor any obligationwhatsoever, and the fact that the Government may have formulated, furnished or in any way supplied the saiddrawings, specifications, or other date is not to be regarded by implication or otherwise, as in any manner licens-ing the holder or any other person or corporation, or conveying any rights or permission to manufacture, use, orsell any patented invention that may in any way be related thereto.
Please do not request copips of this report from the Naval Medical Research Institute. Additional copies may bepurchased from:
National Technical Information Service5285 Port Royal Road
Springfield, Virginia 22161
Federal Government agencies and their contractors registered with the Defense Technical Information Centershould direct requests for copies of this report to:
Defense Technical Information CenterCameron Station
Alexandria. Virginia 22304-6145
"TECHNICAL REVIEW AND APPROVALNMRI 86-52
V This technical report has been reviewed by the NMRI scientific and public affairs staff and is approved for publica-.W tion. It is releasable to the National Technical Information Service where it will be available to the general public."j 0including foreign nations.
'I"
-N
0 P DAILY, CAPlI, MSC, USNCommanding Of ficer
Naval Medical Reseorch Institute
UN OCLASSIFIAIEDIOWOAIG EIldsrbtini niie
j 4PERORMNG ROAIZAON EPOT , REPORT DCM NTATIN PAGEN
Navalrve fodcr peubarc release;
6@- NAME Of 11983010N4 04ONoALIAT1ON 4b OFFICE SYMSOL 7.. N'A"M"FO MONITORING ORGANIZATION
Inatitute Naval Medical Command
4C. ADDRESS (Gly. State, and lip Co*e) 7b. ADDRESS (aiy, state,. to~ COW)
Bethesda, Maryland 20814-5055 Department of the NavyWashington, D.C. 20372-5120
Be. NAME OP FU.NDING ISPONSORING ft.b OFFICE SYMBOL S. PROCUREMENT INSTRUMENT 0IENTIPICATION NUMBERORGA#4ILATION Naval Medical OIf 400k,600)
Research and Development CommmanIS. ADDRESS (city, state. $Ad ZIP Cofe) 10 SOURICE OFP UNOING NUMBERS
PROGRAM ~PROJECT jTASK' 1WORK UNITBethiesda, Maryland 20814-5044 ELEMENT NO. No. NCI ACCSSION NO,
_______________________________i'637l314 , o099 M0099 J'01C mt1770i4
II lTE Inlue ecriy ladktin)PREDICTING PULMONARY 02 TOXICITY: A NEW LOOK AT THE UNIT
PULMONARY TOXICITY DOSE
12 PIRSONAL AU"NOR(S) Harabin. Andrea L. , Homer, Louis D. , Veathersby, Paul K. , andrlvnn, Kdward T.
i Is. TYPE OF REPORT I I3b. TIME COVERED I& DATE OF REPORT (Year, Month, Day) S. PAGE COUNTFinal IFROM ____TO____Imay 19C5 61
16 SUPPLEMENTARY NOTATION
17 COSATI COOES' 14. SUBJECT TERMS (Concinaw on reverse of noensuay an'd idlefif by block nlumber)FIELD IGROUP SUsI4ROUP human pulmonary 02 toxicity; vital capacity; decompression
I sickness treatments; UPTD
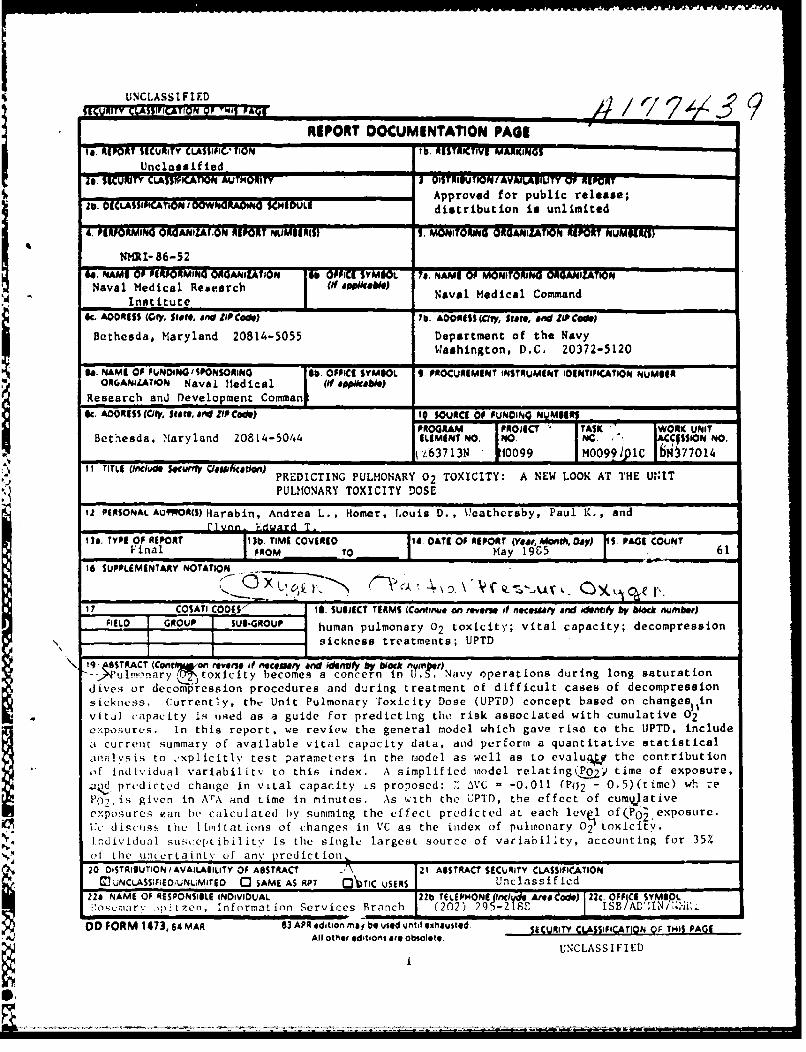
19 ABSTRACT (Conthl~oA1 revere of neceufyarW and #$ by block mymbr--Yi'ulmnary rr- toxicity becomes a concern In [.Nayoperations during long saturationdives. or decompression procedures and during treatment of difficult cases of decompressionsickness. (;urrentIy, the Unit Pulmonary roxicity Dose (UPTD) concept based on changes in
-vital capacity is used as a guide for predicting the risk associated with cumulative 02ex<posures. in this report, we review the general model which gave rise to the IJPTD. includea current summary of available vital capacity data, and perform a quantitative statisticalanal'.'sis to ,'xplicitly test parameters in the model as well as to evalu 4- the contributionof indiv.iduial variabilitv to this index. A simplified model relating(P,LO2 Lime of exposure,.a;Z predicted change in vital capacity is proposed: 7. AC - -0.011 (P02 - 0.5)(timc) wh :ePo 2 ls given in ANrA and time In minutes. As with the UPTD, the effect of cum~)ativeexposures itan be calculated by summing the effect- predicted at each lev 1 of(Po i eXPOSUre.Vc disuutjs tnu limitations of changes in VC as the index of pulmonary 02 toxlcity.IndcIividual S1lS(Ccpt ibiiLV it s the single largest source of variabil'ty, accounting for 35%ot the uncer ta inL v of anv predict ion20 DiSTRIOUTION IAVAILABILITY OF ABSTRACT '\1Z ABSTRACT SECI~iRITY CLASSIFICATION
MUNCLASSIFIED,-UNUMlTI)E3 S AME AS RPT C30T.rC USERS ['Unclassified22a NAME OF RESPONSIBLE INDIVIUAL 122b TELEPH4ONE (Inc/4de Ae~a Co*e) 122lc. 0F~ICE SYMBPL
'oc:r. .::tzen, infor-mation Services Branch (202) 295-219f: ISBIAr*iIN/i.'i00 FOM17,68A 3 APR edition mnay be used until exhiausted. SECURITY CLASSIFICATION OF THIS PAGEA) All othier editions are Obiol*t*.
UNCLASSIFIED
This study was supported by the Novel Medical Research and Development
Coamd, Research Task No. 1009913.O1C.0010. The opinions and assertions
contained heroin are the private ones of the authors and are not to be
construed as official or reflecting the vievs of the Navy Department or the
Novel fervice at lorle.
The author@ vish to ackeovledge the encoutagement offered by CAP mark 3.
Bradley, Dr. R.G. Zckeahoff for permission to use his vital capacity data,
Drs. J3.. Clark and B. Iroussolle for helpful background information, and
CAPT P.W. Catron for carefully reading the manuscript.
Acceslon F3o7NTIS CRI&I
DflC 0~:Urlarnot- 1;d [UJ.Jt'ificatwoj
.........................-•.......I.....
ByD ,, ~ ,,iO i ......... ....... ...]
Avwitability Codes
Dit Avail ddI ri /oUist l Spt'cial
ii
S.. . ... .... ... . L • • .,..J,•I.aD#'.•. r•:.~t,:_-:o. • - , . ).. • • , . , /0 .10

TABLE OF CONTENTS
Pass number
Abstract . . . . . . . . . . . .. .,
Acknowledgements ....... . . . . . . , ..........
Introduction . . . . . . . . . . . . . . . . . . . . .. . . I
Background . . ......... . . . . . . . . . . . . . . . , . . . 1
Evidence of pulmonary 02 toxicity; animal studies , , , ...... 2
Evidence of pulmonary 02 toxicity: human studies .......... 4
Vital capacity as an index of pulmonary 02 toxicity . . . . . . . . . 5
Evidence for tolerance to 0 2 exposure . . . ........ . 24
Evaluation of the UPTD concept: background . . . . . . . . . . . . . 29
Method . . . . . . . . . . . . . . . . . . . . ... 33
Results . . . . .. . . . . . . . . . . . . . . . . ........... . ..... . 38
Individual variation . . . . . . . . . . . . . . . . . . . 38
Choice of exponent . .. . ... . . . .. . . 0 . . . . . . . . . . . 39
P 0 and time asymptotes . . . . . . . . . . . . . . . . . . . . . . 39
UPTD SSE comparison . . . . .a. .a 0 . 0 . . . . . . . . . . . 40
Discussion . . . . . . . . . . . . *. . . . . . . . . . . . .. a.. . . . 41
Summary . . . . . . . . . . . . . . . . . . . . .. . .. . . . .. . 48
Peferences . . . * . . . . @ . . . . .................... . . . . . . . 49
Appendix I . . . . . . . . . . . . . . .. 55
LIST OF TABLES
Table 1. Ohlsson's (1947) raw vital capacity measured insix subjects exposed to P of 0.83 ATA . . . . . . . . . . . . 6
Table 2. Caldwell's et al. (1966) raw vital capacity datameasured in four subjects exposed to P of 0.98 ATA .......... 8
iii

Table 3. Clark's at al. (1970) rev vital capacity datemeasured in 13 subjects exposed to PO2 of 2.0 ATA . . . . . . 11
Table 4A. ckAumhoff's raw vital capacity data measured In 12experimental subjects exposed to S ALA airsaturation dive o . .. . o . . , , , , , . , . . , , . ., 1
Table 41. Eckenhoff's raw vital capacity data measured Lu 6control subjects exposed to 5 ATA vith P0 2 of
0.3 ATA . . . . a. . . . . . . . . . . . . . . . . .a & . 19
Table 5. Sumry of Couroe et al. (1945) study .... # . , , . , , . 20
Table 6. Human vital capacity response to low and moderate P0
exposures . .* 6 0 * 0 # . . . . * * & . ,* . o o * ,* 21
Table 7. Suary of Widell et al. (1974) intermittency study ..... 26
Table 8. Hendricks at al. (1977) data on percent change invital capacity in five subjects exposed tointermittent 02 exposures .... . . .. . . . . . . . . 27
Table 9. Unit pulmonary toxicity dose definition . . . . . . . . . . . 34
Table 10. Sumary of data used for analysis . . . .. . . . . . 37
Table 11. Predicted decrease In VC by different models o . . . . . . . . 46
LIST OF FIGURES
Fig. 1. Effect of exposure to 0.83 ATA 02 on human vital capacityas reported by Ohleson . . .. .. . a .. .. . . . . . . 7
Fig. 2. Effect of exposure to 0.98 ATA 02 on human vital capacityas reported by Caldvell et al . . . . . . . . . . . . . . 9
Fig. 3. Effec* of exposure to 2.0 ATA 0 on human vital capacityas reported by Clark and Lamberisen .......... . .. 12
Fig. 4. Five ATA air saturation exposure profile utilized byEckenhoff . . . . ........... . . . . . . . . . . . . . 13
Fig. 5. Human vital capacity measurements reported by Eckenhoffin subjects participating in 5 ATA air saturationexposure .................... ......................... .. 14
Fig. 6. Eckenhoff human vital capacity data collected duringcontrol period and period wien subjects were suppliedwith P of 1.05 ATA ............. ....................... 15
iv

Page Number
"Fig. 7. Vital capacity measurements made in control subjectsstudied by Eckenhoff . . . . . . . . . . . . . * . . . . . . . 17
Ig$. 8. Effect of exposure to intermittent 0 exposure at 2 ATA onhuman vital capacity as reported by &endricka at al.. ..... .. 28
Fig. 9a. Clark's pulmonary oxygen tolerance curves in normal menbased on vital capacity changes in median subject . . . . . .. 31
Pig. 9b. Log-loS transform of Fig. 9a . . . . . . . . . . . . . . . . . 31
Fig. 10. Effect of exponent on shape of predicted change in vitalcapacity as function of time......... . . . . . . . . . . . 36
Fig. 11. Range and distributiot ,f slope parameters forindividuals in which aerial VC measurements weremade . . . . . . . . . . ....... . . . ... . . ........... .... ....... 42
Fig. 12. Effect of individual variation on predicted % decreasein vital capacity resulting from exposure toP 0 of 1.0 ATA . . . . . . . . . . . . . . . . . .................. . 43
Fig. 13. Preftcted decrements in vital capacity for anindividual of median susceptibility exposed
o 4 P 02 a * * * . . . . . ................. 44
LIST OF APPENDICES
Appendix 1. UPTD SSE Comparison ........... .................... .. 55
v

INTRODUCTION
Oxygen (02) enriched uixtures are used in nany routine operational
settings, and breathing 100% 02 Is an integral part of U.S. Navy recompression
tables. The physiological and operational advantages of 02 usage must be
carefully balanced agoinst its potential hazards, the nature of which depend
on the partial pressure of 02 (P0 ). At dry ambient pressures greater than
approximately 3 ATA, exposure to 100% 02 produces a variety of central nervous
system symptoms; exposure to lover pressures facilitates a slower toxic
process that produces lung injury.
In 1970, Clark and Lambertsen suggested that decreases in vital capacity
could be used to predict the onset, rate of development, and degree of
severity of the toxic process in the lung caused by 02 exposure. They
developed a predictive graphical model relating P0 . time of exposure, and
toxicity expressed as a decrement in vital capacity (VC). Subsequently,
Bardin and Lambertsen (1970) developed a mathematical description of this
graphical process. This mathematical model had some minor complexities that
made on-site calculation inconvenient, so they developed an equivalent dose
concept: the Unit Pulmonary Toxicity Dose (UPTD). This concept permitteO
calculation of predicted effects from cumulative 02 exposures. We will
examine closely the derivation and usefulness of the UPTD, which is currently
* used in the U.S. Navy. Because this is based on the measurement of vital
capacity, we included nn extensive review and summary of these data.
BACKGROUND
In Navy operAtions, pulmonary 0 toxicity becomes a risk during long
saturAtion dives or decompression procedures where ft is desirable to maintpin
02 levels as high as possible, and during long or difficult treatmentp of
decompression sickness. Cutrrently, for saturation dives, chamber P of 0.4
d0

ATA is recommended similar to the clinical setting where a P of 0.4 ATA is
considered safe for indefinite exposures, while a P of 0.6 to 0.7 ATA 1s0 2
considered acceptable for 24 h. Recompression treatments are carried out at
60 fsw (2.8 ATA), followed by some time at 30 fsw (1.9 ATA), and consist of
alternating exposures of 02 and air. United States Navy Recompression Tables
5 and 6 (U.S. Navy Diving ManuAl, 1978) are similar, except that Table 6,
designed for treatnent of more serious decompression sickness, has one extra
20 min 0 2/5 min air cycle at 60 fsw, and two 60 min 0 2/15 min air cycles at 30
fsw instead of one 20 mn 0 2/5 min air cycle. Table 6A is used for treatment
of air embolism and adds a 30 min air exposure at 165 fsw that exposes the
patient to a P of 1.05 ATA. The Manual states that extra 02 exposures may
be added at each of the stops and, in fact, extension or repetition of the
tables is determined from the patient's response by the Diving Medical
Officer. Before extending the tables, the physician will often refer to the
UPTD for guidance when there is a concern about the development of pulmonary
02 toxicity.
Evidence of Pulmonary 02 Toxicity: Animal Studies
The fact that 02 exposure is potentially very harmful to the lungs of
animals and man was observed about 100 yenrs ago, yet 02 toxicity remains a
challenging clinical and physiological problem. Until recently, most
information was derived from survival or histological studies. Small mammals
such as dogs, cats, rats, guinea pigs, and mice survive approximately three
days on 02 at I ATA, while primates tolerate seven to 14 day exposures. The
first thorough serial study of lung pathology was done with rats (Kistler,
Caldwell, and Weibel, 1967), and revealed a progressive thickening of the air-
blood barrier, due primarily to interstitial edema, followed by interstitial
accumulation of cells and fibrin strands. The endothelium sustained the
2
earliest and ultimately the most severe damage, while the epithelium was
largely spared. The lungs of primates and ventilated human patients undergo
similar changes (Kapanci et al., 1972; Barber, Lee, and Hamilton. 1970),
except that there is destruction of Type I epithelial cells followed in time
by a proliferation of Type II epithelial cells. These proliferative and
fibrotic changes are reversible over two to three months if the primates are
first gradually weaned off the high 02 tensions (Kaplan et il., 1969; Kapanci
et al., 1969; Wolfe et al., 1978).
Although these histological studies suggested gradual impairment of
diffusing capacity and perhaps of gas exchange, recent animal experiments
(Harabin and Farhi, 1978; Matalon, Nesarajah, and Farhi, 1982; Harabin, Homer,
and Bradley, 1984), not confounded by anesthesia, mechanical ventilation, or
restraint showed that progressive hypoxemia did not occur. While there were
terminal alterations in gas exchange, it was difficult to ascribe hypoxemia as
the cause of death.
Several animal studies have been conducted to determine whether lengthy
exposures to moderately elevated P0 s produced pathological changes, and it
appeared that these exposures were not without effect. Total lung capacity
decreased 15% in rats exposed to 60% 02 for seven days due to decreased lung
compliance (Hayatdavoudi, 1981). These animals' lungs showed significant
histological changes, including edema, decreased alveolar air volume,
S.increased numbers of alveolar macrophages, and decreased endothelial volume
and thickness. Lungs of rats exposed to 50% 02 for 90 days showed increased
numbers of vesicles, fluid accumulation, and platelet aggregates (Harrison,
1974). Finally, rats exposed to 33% 0 for up to two weeks lost weight. had
decreased pulmonary surface area for gas exchange, and had increased numbers
of eosinophilic granulocytes (Kistler, Caldwell, and Weibel, 1966).
3
Evidence of Pulmonary 02 Toxicity: Human Studies
A limited number of studies have documented the pathogenesis of pulmonary
injury in normal men exposed to 02 for 6 to 74 h at pressures ranging from
0.83 to 2.0 ATA (Caldwell et al., 1966; Clark and Lambertsen, 1970; Clark and
Lambertsen, 1971a; Comroe et al., 1945; Dewar et al., 1972; Dolezal, 1962;
Fisher et al., 1968; Ohlsson, 1947; Puy et al., 1968; Van de water et al.,
1970; Widell et al., 1974). Strong subjective symptoms of pulmonary 02
toxicity developed in most men after 6 to 14 h at 1 ATA with shorter p• .7
of latency at higher P0 s, and increased severity as exposure was I n h.-.,1
The clinical manifestations included sore throat, substernal pain, cou;,.
(particularly upon Aeep inspiration), headache, anorexia, and paresthesias.
In studies that will be described in detail later (Comroe et al., 1945;
Ohlsson, 1947; Caldwell et al., 1966; Clark and Lambertsen, 1971a; DoczQ,
1962) vital capacity decreased. In two other studies conducted for 5 tn f. I
at 2 ATA, vital capacity decreased by 0 and 1.5%, respectively (Dewar Ct a3.
1972; Widell et al., 1974). Carbon monoxide diffusing capacity (OLCO) f..2
two studies (Caldwell et al., 1966; Puy et al., 1968); one study conclud•:•i
that the membrane component was responsible (Caldwell et a]., 1966). whil,: ,.
other found that pulmonary capillary blood volume had decreased (Puy et a-.,
1968). Alveolar-arterial 02 gradients do not appear to change connistenr'.
throughout 02 breathing (Clark and Lambertsen, 1971b; Puy et al., 1968; 1-
et al., 1972). Airway resistance was shown to increase by 30% (Dewar et l-.J
1972) or by less than 18% (Fisher et al., 1970). Reports of the effe:cts oti
ventilatory frequency conflict (Ohlsson, 1947; Dolezal, 1962). Physlologti
pulmonary shunt, cardiac output, extravas!ular lung water, and pulmonary
artery and systemic blood pressures were also not affected substantially 1, Z
ATA 02 exposures that did not produce symptoms (Dewar et al., 1972; Van de
4
-.mv e

water et al., 1970). Any documented changes that occurred were reversibloe
although recovery time varied from Imaediate to as I"&n as two waths,
While it is thus clear that exposure to 100% 02 has the potential to
produce pulmonary damage, questions whose answers are lose aleor inalude the
folloving. Now much 02 exposure results in irreversible duamp? What P Ito
safe for long exposures? to the Navy's choice of 0.4 ATA oplLol? II the
concentration of 02 must be Increased to 1001 betveen I and 2#1 AlA, vw1t
length exposure is safe? Aside from intermittent expaeure, are there ways
that pulmonary 02 toxicity can be prevented or amelIorsted? Whos to the
optiuuu internittercy schedule? Concerned with anioerinl eome at theee
questions and having reviewed moot of the literature doosribed sevs, Clarh
and Lambertoee (1970) proposed that change is vital capacity was She saot
reliable Index of pulmonary 02 toxicity for addressntg sonm s theoe le..es,
Vital Capacity os an Indox of Fulmo•nry 02 Toullty
There are four major human studies In whioh vital eapaeity woo eeotveod
aerially throughout continuous 02 exposu•es of stalfuiflot length# Ii 1947?
Ohlsson studied six subjects who breathed 50-11% 02 at I ATA# sad tva d"eeIf
subjects vwo breathed a P0 between 0,21-0.35 AlA, We aetrselod the dots fusp
the figures in the paper; these a&T Included I" Table I and pltited as few
data and percentage changes in fig. 1. four of the aim subjele dorvloped
syuptoms (headache, substernaO distress, poroothenlas) after 6 in 14 he
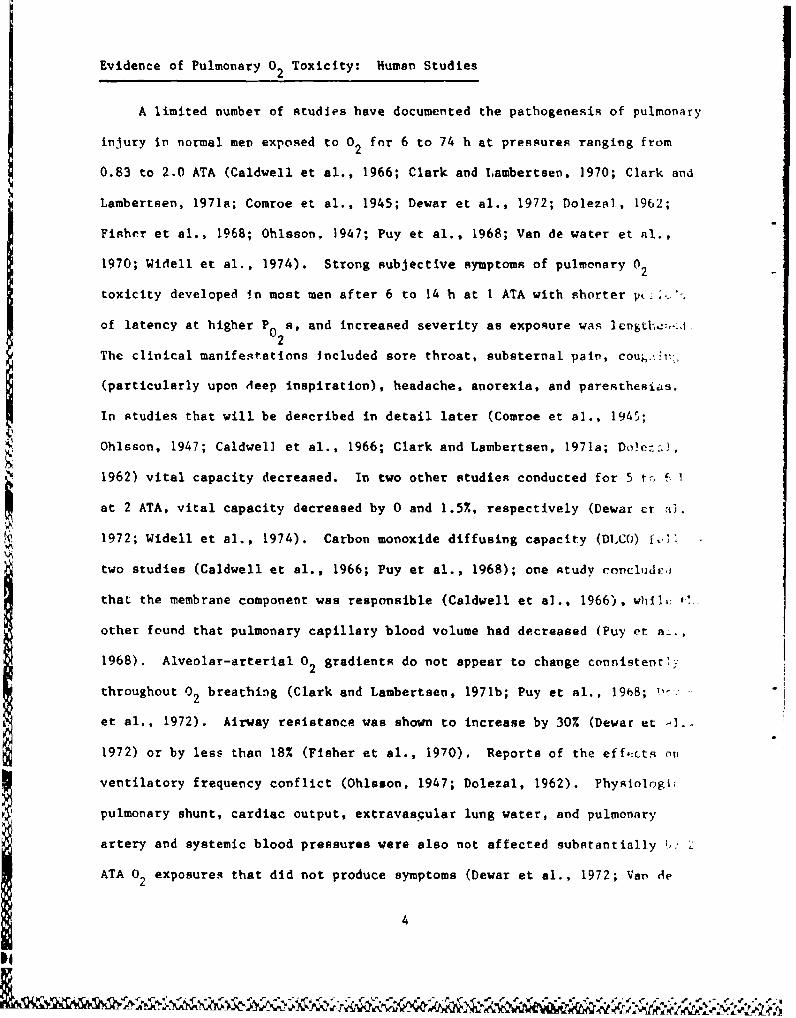
In 1966, Caldwell et al, studied fMur subjects, sash of vhne was
subjected to 30, 48, 60, or 74 h of 0,95 AIA At ateospherle |e1se0ore,
¶! These data (also extracted from figures in the paper) are sha.w I" ToYlo I aod
Fig. 2. The austhors claimed a fifth cantrol subject 4ied #.. thingesa Ise Y1e
capacity, but there were no supporting data.
'4

TABLE 1
Obleso. (1947) RaW Vital Capacity Measured in Six SubjectsUposed to P of 0.83 ATA0O2
flei Subject
1 2 3 4 5 6 7t 8t
o 5,), 4,7 4.6 4.8 5.2 4.1 5.6 4.8
6., ,1| 4.6 4.8 4.7 5.2 4.1 5.8 4.9
0,8 .2 4,6 4.6 4.8 5.0 4.0 5.6 5.0
140, $.0 4.5 4.6 4.2 4.6 3.6 5.6 4.8
toll 4.6 4.2 4.7 4.2 4.6 3.2 5.4 4.9
14 645 4.6 4.5 4.1 4.6 3.6 5.4 4.7
fil 4.1 4.6 4.6 3.8 4.6 3.6 5.5 4.7
116 4.06 416 4.6 3.6 4.6 3.7 5.6 5.0
"".4 4, 4.6 4.2 3.6 4.2 3.7 5.6 -
-1,1 $,0 6,6 4.1 3.7 3.8 3.7 5.5 5.0
64 6. 41,? 4,4 3.6 3.5 3.5 5.5 4.9
I$I-to1 L -e~1 j.1 ur4 3.7 3.5 3.5 5.6 4.8*ki41osie I sod I wvere sotrol subjects vho breathed 0.21-0.35 ATA 02.
I0
2. . . . . . . . .- - • -•.•. t.B/L /~J•i~/~, . • A i miApl

S
4
C
2
* S is Is 2S 2S 1* 35 40 46 5S
X .... .... .......
C
A
N
-30N
-40 +a 5 1* Is f 25 30 25 40 $0
Fig. 1. Effect of exposure to 0.83 ATA 0 on human vital capacity as reportedby Obleson (1947). Top panel shows raw dita (in liters) as a function oftime; bottom panel shows data expressed as % change from the control value.Each line represents the time course for an Individual subject (n -6).
7

TABLE 2
Caldvell at al. (1966) Raw Vital Capacity Data Measured inFour Subjects Exposed to P of 0.98 ATA.
Time Subject
SU 1 2 3 4
-84 - 6.1 - -
-72 5.8 4.1 -
-60 - 6.0 4.2 -
-48 5.9* 5.5 4.2 -
-36 6.0 6.1 4.4 -
-24 6.1 6.1 4.4 5.6
-12 6.3 6.0 4.4 5.4
0 6.2 5.9 4.3 5,5
8 5.8 5.5 4.2 5,3
16 5.5 - - -
20 - 5.0 4.1 5.0
30 5.9 5.1 - 5.0
32 - - 4.1 -
42 5.4 - - -
48 - 5.2 3.5 -
52 5.2 - -
60 - 3.5 -
74 3.9 - - -
*Vital capacity is measured in liters.
8
C s
4.S
3S
-OS -40 -20 a 20 40 00
TIME (h~)
4 ----------- 1°• •. .. .4
C
N * .
$ ' '3..Iv
-39
-4.
a 18 20 so 46 so so 76
TIME (h)
Fig. 2. Effect of exposure to 0.98 ATA 0 2 on human vital capacity an reportedby Caldwell et al. (1966). Panel A shows raw data (in liters) as a functionof time; panel B shows data expressed as % change from the control value.Each line represents the time course for an individual subject (n - 4).
9
Lolaw

10 1971, Clark and L~saerteee 0971a) published data from 13 PubJects
exposed to 1002 0 2 at 2 AlA for times# roangin from 6 to 11.5 h. Exposures
were terminated yuan a "significant reduction" lit vital capacity developed or
symptous became severe, In 12 of 13 subjects, the first suibjectIve symptome
developed in 3 to 6 h while the lost subject was symptom free for 8 h. All
subjects bad chest pain, all but oae coughed, most were very fatigued,
nauseous, and dyspaeic. one had parestheste. &and two fainted. The vital
capacity results are shown in Table 3 (Clark and Lasberteeng 1970) and Fig. 3.
Clark end Lambertota eliminated subjects 12 and 13 from their anelysit because
the exposurse were interrupted for 1-2 mini every few hours f or DLCO
meassurements. These subjects developed subjective and objective symptoms of
0 2 poisoning, but the authors said those brief interruptions "appeared to
have" delayed the *vast of toxic effects. (We will analyze the effect of
censoring the data of chese two subjects)
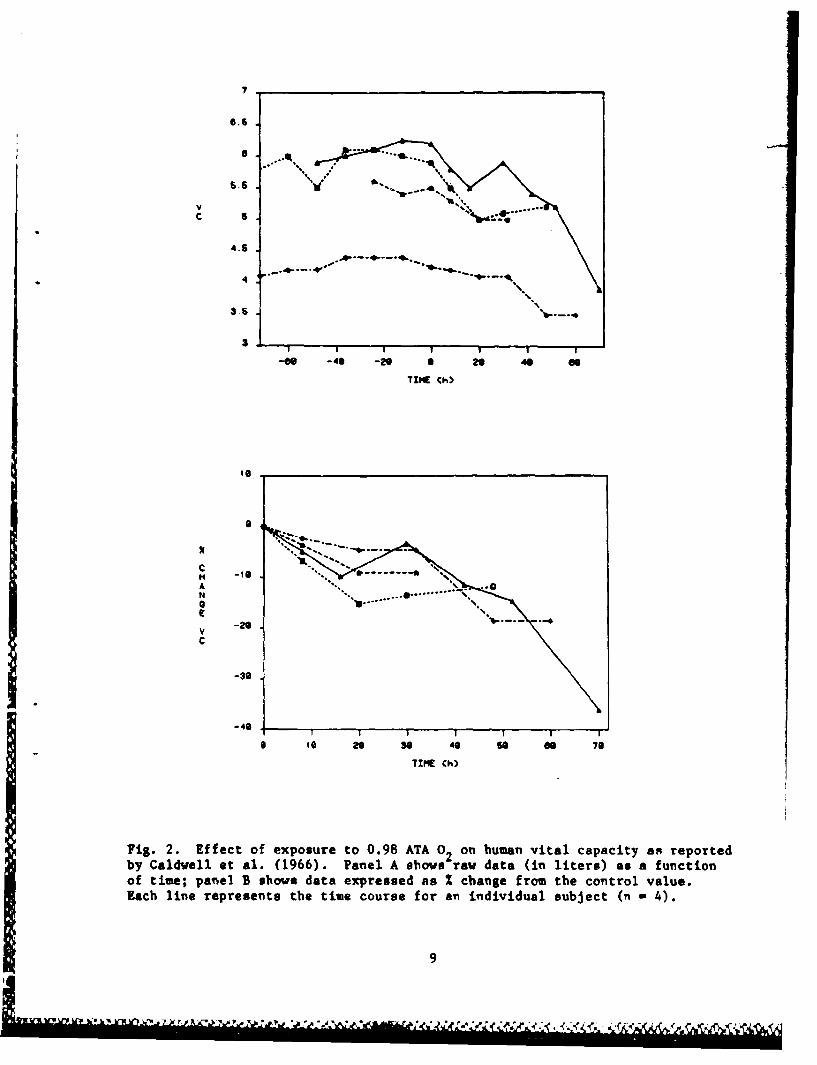
!ckenhoff and coworkers (personal communication) Irecently completed a
series of 5 ATA air saturation (AIRSAT 4) dives at the N~aval Submarine
Research Laboratory in Groton, CT, in vliich serial vital capacity measurements
were made in 12 experimental and six control subjects. The dive profile, fig.
4, shows that the men breathed 0.3 ATA 0 2 P 0 for the first 12 h, 1.05 ATA 0 2
for 48 b. and enriched 0 2 mixtures f or another 62 h during decompression.
Controls were treated the same except that they were exposed to a P 0of 0.3
ATA during the 48 b. The results of all the vital capacity measurements made
in twelve experimental subjects are shown in Fig. S. Figure 6 includes only
th.c first 60 h of the dive (includes up to the 1.05 ATA 0 2 exposure segment)
so that comparisons with data from Obisson (1947), Caldwell at al. (1966), and
'All references to Eckenhoff are personal comunications, thus only his "amewill be cited in successiv, text.
10

TARIL 3
Clark oS tl. (1970) Iaw Vital Capacity Date Measured .o 13 SubjectsUtpooed to of 2.0 ATAY2
Ties jubjoctA .L 1 2 3 4 5 6 7 6 9 to 11 12 13
0 3.0* 6.5 4.3 5.3 5.7 4.4 S.3 6.3 6.6 5.4 5.2 6.4 5.2
5 2 3.1 6.4 4.4 - -. . . . . 6.4 -
3 5.0 6.4 4.2 5.3 5.7 . . . . . . 6.3 5.0
4 5.0 6.4 4.2 5.3 3.6 4.2 5.3 5.6 6.3 5.1 4.8 - -
5 4.9 6.1 4.3 - M .- - - - 6.2 -
6 4.8 6.1 4.3 5.2 5.7 3.7 6.2 5.6 - 4.9 4.5 - 5.1
7 4.9 6.0 - - - 2.7 5.0 - - - - - 5.1
7.5 4.4 - w - - 6.0 -
. - 6.0 4.3 4.9 - 3.0 5.1 5.3 - 4.8 - -
8.4 4.6 w - - 5.4 - - - - - -
9 4.7 5.8 4.2 4.9 - - 4.8 - - - 4.3 5. 5.
9.5 M M . . 5.3 - - - - -
10.3 - 5.7 - 5.0 5.6 - - - - 4.6 6.2 -
it - 4.2 4.9 M - - - 5.1
*Vital c. is meas56e - .- - - -
11

4 0
I -"• .+-m • *.L'"t... " -/ *. .. _ _o
v ": ' &JL"• -,* *.-"•zs.t-.--•- m h. R :--D -
TIN$ 4000
fit 3, ",,ec of+ expsur to ..oo+ Auda o s.o Iuo ia o orpreby Clark and Lsb-r-ais (1.... ,lo.p dawi l shows 1 ra o$(i 91r)4
fusect(M ~~ ~ •+ of"vlbto ae hw aal exprsse as IW sh"$ IV" t
* ve
-I-
6 I I C 6I oOo'141 4100$
*fO *. U)
II" " .m'-m • ,---= , xiv • - , '+. , . • . • , + _,• , O L _ •,• . . . ¢ • . . , . • • • r .-
a
PITA$
My JJ
It$. A. live ATA air saturation exposure piofile utilited by Eckenhoff in1983. The subjects vwer compressed to 5 ATA for 60 Ib and thon slovlydeaomuaesoed. Air wes supplied for A8 h (resultitn in a 1 0 of 1.0 ATA)follovod by V -01 uixtures that kept P m 0.5 for 48 h. P0 wyo slproxiuately0.3 ATA at all ohbar tioes during the ?ofile. 2
13

4 -4
Tzlt Ch)
AN
6c
-49
TMW Ch)
jig. 5. All human vital capacity measurements reported by Eckenhoff in 1983in 12 subjects participating in 5 ATA air saturation exposure diagrammed inFig 4. Between 11 and 48 b. the subjects breathed 1.05 ATA 0 .Panel A showsrav data (in liters) as a function of time; panel B shows dat& expressed as %change from initial measurement. Each line represents the time course for ani~ndividual subject.
V 14
I 'lp .ii

% W a
\~ ~ T1 .
4- Q .. a. 0fi; j j 1 /,jid
1ig IVNaA I44 a
¶,. ,y k$.
%4 Wn
how I l- i

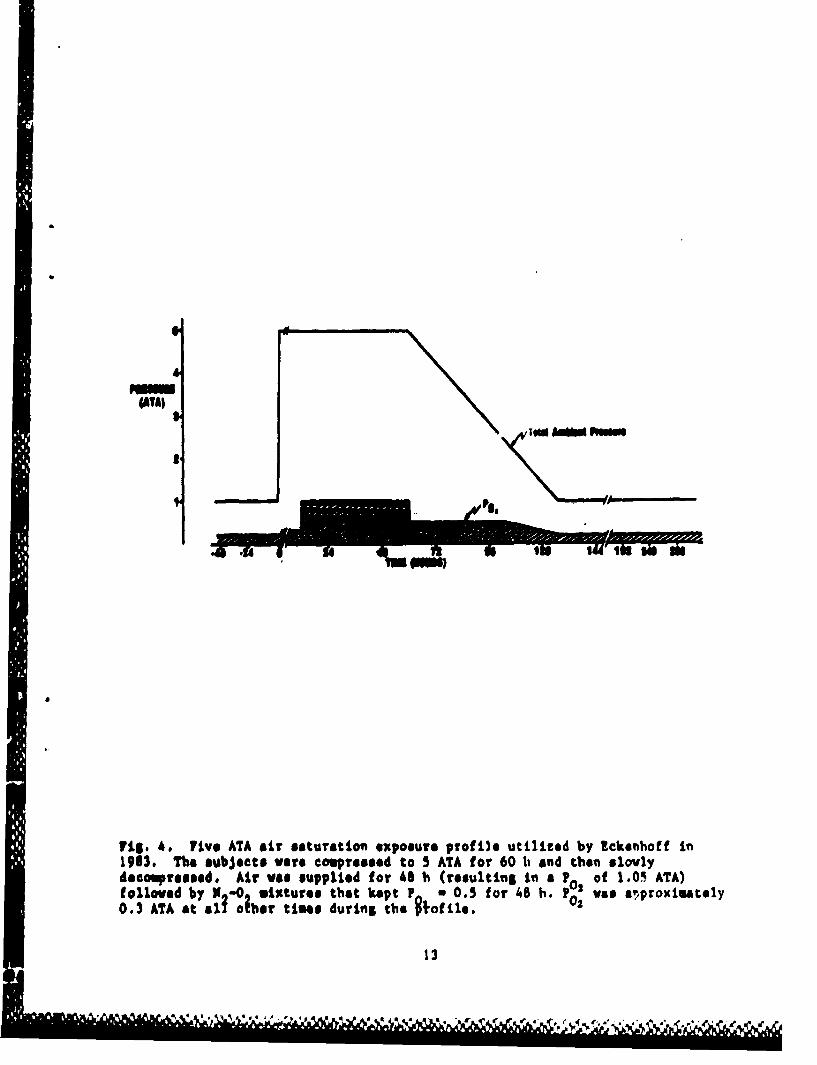
Clark and Lambartsen (1970) are simplified. The results from the six control
subjects are shown in Fig. 7, and Tables 4A and 4B include the raw data.
In 1945, Conroe et al. reported changes in vital capacity in groups of
men exposed to 1002, 752, and 50% 02 as well as various schedules of
intermittent exposure for 24 h. They did not provide actual vital capactty
measurements. From the figures in their paper, however, we calculated the
mean decrements in VC for each of these groups, and these data are included r.
Table 5. In those groups that developed symptoms (Groups A, B, o: E, F), th•-
latency period ranged from 4 to 22 h with an average of 5.2 h. Subjects that
received intermittent exposures developed symptoms that were "reduced in
severity." No specifics were provided about the types of statistics used to
analyze these data, but the claims were made that the VC decrement in zco
exposed to continuous 100% 02 (Group A) was significant, that intermittency
did not stay the development of toxicity, and that a P 0of 0.5, with or
or without N2 diluent, (Groups C, H) was completely safe. This study was
used as a source to justify a P0 of 0.5 ATA as a safe exposure level (Clazv:
and Lambertsen, 1970). This inference apparently arose from the development
or nondevelopment of subjective symptoms only because the VC results are
inconclusive.
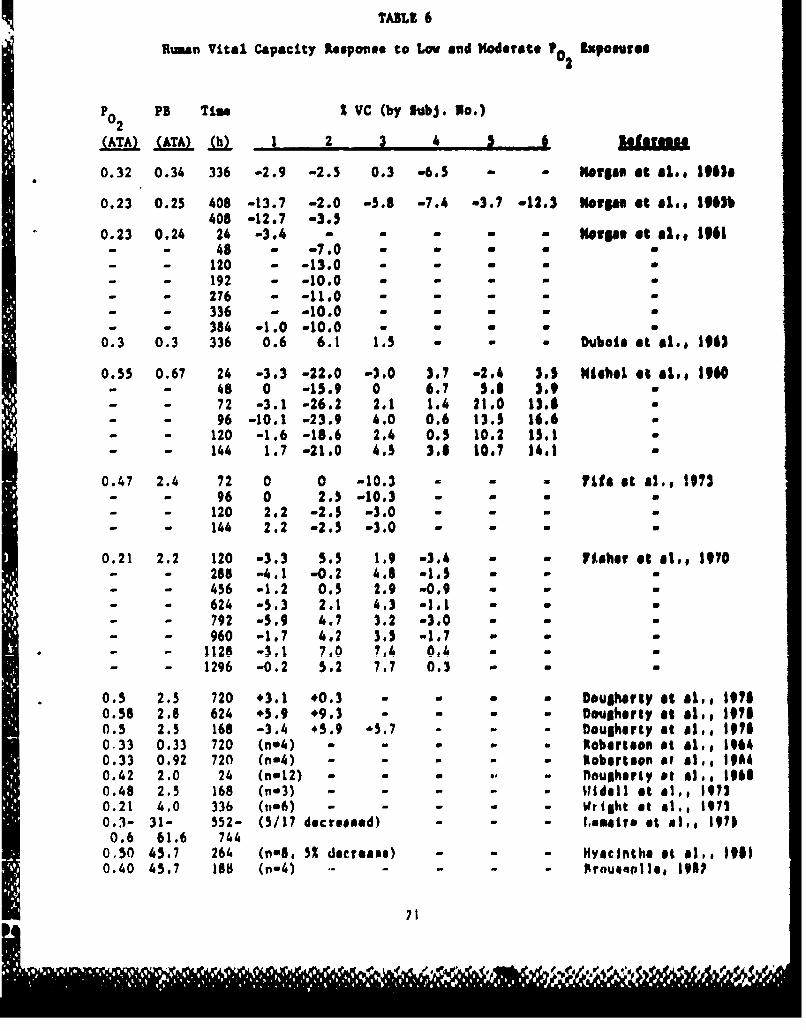
A number of other studies were conducted to determine whether long
exposures to only a moderately elevated P can be deleterious; these dre
listed in Table 6. (Control groups of Eckenhoff, and Ohlsson (1947) .
this same issue). Several studies (Morgan et al., 1963a; Morgae f-1 0.,
1963b; Dubois et al., 1963) included only measurements made before -.!,J afZLc
experiments, while others included serial measurements (Michel et al,, 1960;
Morgan et al., 1961; Fisher et al., 1970; Fife et al., 1973). We re-expiessea'
16
C
A 9-4
CV
a 25 s0 75 ISO 121 If 171 266TIME (h)
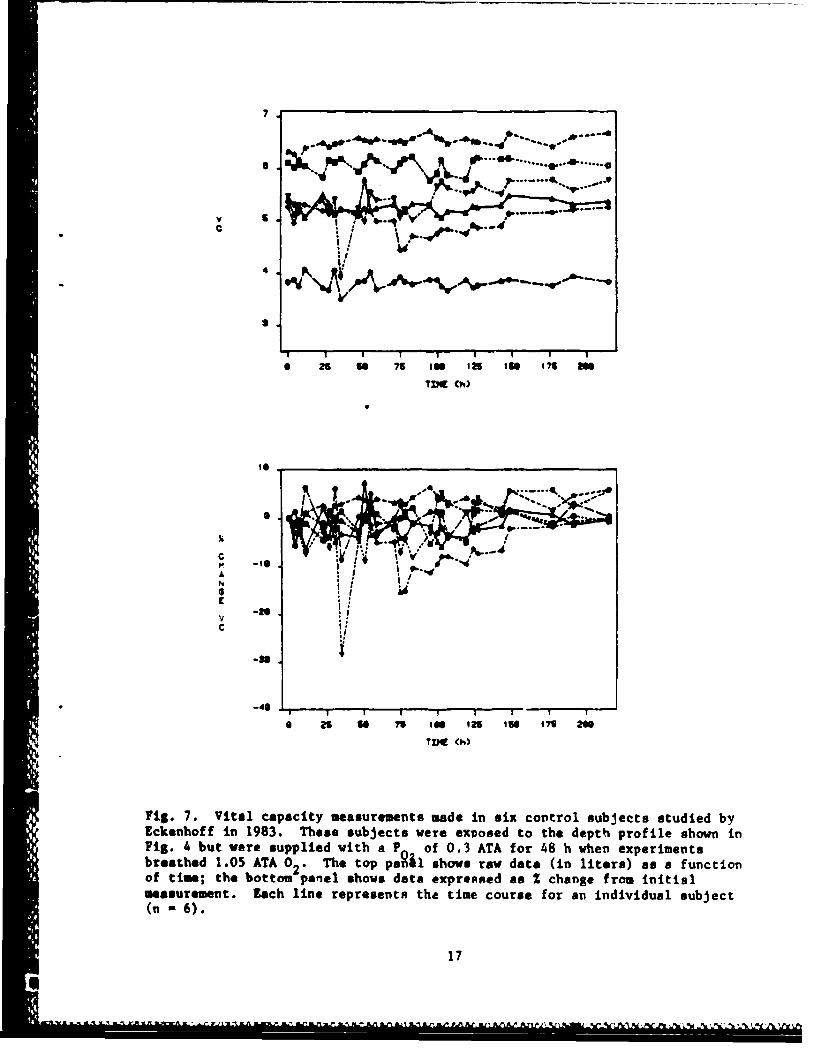
Fig 7 Vta cpait sasuemnt mdeinsi cntrl ubecs tuie b
Ecehofin183 heesbjcs ee xosdtotedet poil honi
Fi.4bu eesupidwihaP of03AA o 8h hnepeiet
breathed 1.5AA02.Tetpp&1 hw a ae(n ies safntoof tis h0otmpnlsosdt epesda hnefo nta
ussrmnt ahlnerpeetxtetm cus o a niiua ujc
£1

TABLE 4A
Eckenhoff Raw Vital Capacity Data Measured in 12 ExperimentalSubjects Exposed to 5 ATA Air Saturation Dive
Time PO Subject(h) A 1 2 3 4 5 6 7 8 9 10 11 12
0 0.21 3.9* 6.5 6.7 5.7 5.8 5.5 5.8 4.2 4.8 7.0 5.4 6.03.5 0.3 4.0 6.4 6.1 5.8 5.8 5.5 5.9 4.1 4.5 6.9 5.6 5.88 0.3 3.9 6.4 6.5 5.5 5.8 5.3 5.8 4.3 4.8 7.0 5.6 5 9.1
11.5 0.3 3.8 6.5 6.6 5.1 5.6 5.4 5.8 4.0 4.7 6.9 5.5 6:011 1.05 4.1 6.5 6.6 5.4 5.5 5.1 5.9 4.1 4.5 6.5 5.2 5.715 1.05 4.1 6.3 6.5 5.3 5.3 5.1 5.6 4.1 4.4 6.6 5.3 5.8-1
- 1.05 3.9 6.5 6.5 4.8 5.2 4.9 5.3 3.7 4.5 6.8 5.2 6.0" 1.05 3.8 6.6 6.6 4.7 5.1 4.7 5.4 3.4 4.6 6.3 5.0 5.6
" " 1.05 3.6 6.4 6.5 4.4 5.1 5.0 5.4 3.0 3.9 6.1 4.8 5.63v 1.05 3.7 5.9 6.5 4.5 4.5 4.2 5.4 3.4 4.1 6.0 4.8 5.4.3 1.05 3.2 6.1 6.7 4.1 4.4 5.0 5.4 3.2 4.0 5.8 4.4 5.4
p7.5 1.05 3.1 5.9 6.2 4.3 4.2 4.5 5.4 3.2 4.0 5.6 4.4 5.0.9 0.5 3.3 6.2 6.7 4.3 4.4 4.2 5.1 3.0 3.8 5.4 4.4 4.7, 0.5 3.5 6.2 6.8 4.3 4.5 4.5 5.3 3.3 4.3 5.2 4.3 4.866 0.5 3.5 6.3 6.6 3.9 4.4 4.4 5.4 3.1 4.1 5.0 4.8 4.171 0.5 3.5 6.4 6.8 4.7 4.7 4.2 5.1 3.0 4.1 5.5 4.6 4.610 0.5** 3.0 6.0 6.5 4.8 4.7 4.4 5.4 3.0 4.2 5.3 4.8 4.388 3.2 6.5 6.6 4.9 4.7 4.2 5.6 3.4 4.3 5.7 4.8 4.691 3.1 6.3 6.5 4.9 5.0 4.2 5.5 3.2 4.3 5.7 4.7 4.5
2.9 6.5 6.6 5.0 5.2 4.6 5.4 3.3 4.3 5.3 4.9 4.33.0 5.9 6.6 5.0 5.3 4.8 5.4 3.1 4.2 6.2 4.9 4.63.0 6.6 6.7 5.0 5.5 4.8 5.4 3.2 4.5 6.3 5.1 4.6
0.21 3.5 6.4 6.5 5.1 5.3 4.9 5.4 3.6 4.7 5.9 5.1 4.90.21 3.2 6.2 7.0 5.2 5.4 4.9 5.5 3.6 4.6 6.1 5.5 4.80.21 3.4 6.2 7.0 5.5 5.6 5.0 5.2 3.6 4.8 6.5 5.5 5.40.21 3.7 6.0 6.8 5.6 5.6 4.9 5.7 3.7 4.7 6.8 5.4 5.40.21 3.7 6.1 6.6 5.7 6.0 5.1 5.6 4.0 4.7 7.0 5.5 5.40.21 3.7 6.4 6.8 5.8 5.7 5.3 5.6 4.0 4.8 6.8 5.3 5.5
S0.21 3.6 6.3 6.8 5.8 5.8 5.2 5.8 4.1 4.8 6.9 5.3 5.5SE:Xi capacity is measured in liters."c:,r!pression occurred between 83 and 120 h and P0 was gradually brought back to 0.21 ATA.
18

TABLE 4B
Eckenhoff Raw Vital Capacity Data Measured in 6 ControlSubjects Exposed to 5 ATA with P of 0.3 ATA
02
Time P Subjects
S1 2 3 4 5 6
0 0 5.4* 6.1 5.3 6.3 3.8 5.54 0.3 5.1 6.0 5.0 6.3 3.9 5.37 0.3 5.3 6.1 5.2 6.2 3.7 5.3
11 0.3 5.1 6.0 5.3 6.4 4.1 5.123 0.3 5.5 5.8 5.2 6.5 3.7 5.427 0.3 5.3 6.2 5.2 6.4 3.7 5.131 0.3 5.1 6.1 5.1 6.5 4.1 5.435 0.3 5.2 6.2 5.2 6.5 3.5 3.947 0.3 5.2 5.9 5.1 6.6 3.8 5.251 0.3 5.7 6.1 5.2 6.6 3.8 5.055 0.3 5.2 6.2 5.2 6.5 4.0 5.559 0.3 5.2 6.2 5.0 6.6 3.7 5.471 0.5 5.3 6.0 5.0 6.5 3.8 5.485 0.5 5.2 6.1 4.4 6.6 3.9 5.188 0.5 5.2 6.2 4.5 6.5 3.8 5.293 0.5 5.3 6.2 4.7 6.6 3.8 5.0
105 0.5** 5.3 5.8 4.7 6.7 3.9 5.3110 5.1 5.9 4.8 6.6 3.9 5.7113 5.1 6.2 4.8 6.6 3.7 5.8117 5.2 5.9 4.8 6.5 3.7 5.6129 5.2 5.8 4.8 6.6 3.9 5.5134 5.3 6.2 4.9 6.5 3.7 5.6137 0.21 5.3 6.2 4.9 6.5 3.8 5.7153 0.21 5.3 6.2 4.9 6.4 3.8 5.5158 0.21 5.5 6.2 5.1 6.7 3.9 5.8177 0.21 5.4 6.0 5.2 6.4 3.8 5.8191 0.21 5.3 6.1 5.2 6.6 3.9 5.6225 0.21 5.4 6.1 5.3 6.7 3.8 5.8*Vital capacity is measured in liters.
**Decompression occurred between 83 and 120 h and P0 was gradually broughtback to 0.21 ATA. 2
19

TABLE 5
Sulvlr-y of Comroe et al. (1945) Study
Number of Mean Change in VC (tSD) % DevelopingExposure Sub jects (ml) Symptoms
A 1004. 0 2 34 -254 (t405) 82
B 75% 0 2 9 -274 (±186) 55
C 50%ft 0 2 10 -244 (±182) 0
D 1 min air/3 h 0 2 7 -185 (t169) 86
E 5 min airl3 h 0 2 7 -287 (±167) 100
1F 15 min airl3 h 0 2 7 -104 (±184) 86
G Air 10 +210 (±380) 0
11 100% 02 PB-380 6 -97 (±188) 0
*All exposures lasted 24 h.
20
IF!- .
TARL 6
Ruman Vital Capacity Response to Low and Hoderate ?O2 Iapoevres
Po2 PB Tim 2 VC (by Subj. 1No.)
(ATA) (ATA) ,a 22 .. 4. mm E.uuI1 PlauSir"
0.32 0.34 336 -2.9 -2.5 0.3 -6.5 - - mortis at at.* 19618
0.23 0.25 408 -13.7 -2.0 -5.8 -7.4 -3.7 -12.3 Worps at al.e,# 91b408 -12.7 -3.5
"0.23 0.24 24 -3.4 - "Olps aHt $lot, 1961- - 48 - -7.0- - 120 - -13.0 w G 0- - 192 - -10.0 a- - 276 - -11.0 w- - 336 - -10.0 w- - 384 -1.0 -10.0 -
0.3 0.3 336 0.6 6.1 1.5 Duba•o$ t ill., 1963
0.55 0.67 24 -3.3 -22.0 -3.0 3.7 -2.4 3.5 Htehel at &.,* 1960- - 48 0 -15.9 0 6.7 S. 3.9- - 72 -3.1 -26.2 2.1 1.4 21.0 13.6- - 96 -10.1 -23.9 4.0 0.6 13.5 16.6- - 120 -1.6 -18.6 2.4 0.5 10.2 15.1- - 144 1.7 -21.0 4.5 3.8 10.7 14.1
0.47 2.4 72 0 0 -10.3 . - - ,it. at a.,, 1973- - 96 0 2.S -10.3 - - -
- - 120 2.2 -2.5 -3.0 - -144 2.2 -2.5 -3.0 - -
0.21 2.2 120 -3.3 5.5 1.9 -3.4 -fsaher et at,, 1970-- 288 -4.1 -0.2 4,6 -1.5
- 456 -1.2 0.5 2.9 -0.9- 624 -5.3 2.1 4.3 -1.1 a- 792 -5.9 4.7 3.2 -3.0- 960 -1.7 4.2 3.5 -1.7
* - 1128 -3.1 7,0 7,4 O'k- 1296 -0.2 5.2 7.7 0.3
0.5 2.5 720 +3.1 *0.3 . Doularlyu at at,, 1970.58 2.8 624 .5.9 *9.3 - Dougherty aS al, 19710.5 2.5 168 -3.4 +5.9 '5.7 Dougherty at at,@ 1976033 0.33 720 (he4) - - Robertson 0i a.#, 10640.33 0.92 720 (n-4) - - !Robertag" of $1., 19640.42 2.0 24 (nm12) - - 'Dougherty ot a),, 19610.48 2.5 168 (n3) - - -Wide)l it 1,, 1 |970.21 4.0 336 (,-6) - -rtight Ot i&., 19710.3- 31- 552- (5/17 decremssd) -I.umr. At At,, 19700.6 61.6 744
0,50 45,7 264 (OwS, 5% decreome) - - - Hyacinths it a#,, 1910.40 45.7 188 (n- 4 ) .. . . . . PrnuenoIe, 19iP
71

the Mie et al. (191)) data as pereernee o'f thes" (Timm the fifust vital
capacity gestured as depth as doff" ps busAthilsR *avod so Imedalaw
doff$&@#, Prom this "1leotiss of effporim@1nto, P0 pe~p~Vto oratplom flie
0.2t to 0.46 A'A prodused litlei eubJsesivo evidoes sfi 10PIVuty. so" pasi
Uporn isepiratles Waoo reported after Pitt# dayo Its the "efra, Ot at (1961)
bludy. but IlfS omy have boo" due to Oe dryv sag Stivi~ftt~fmWt Fisher at al,
(1970) elothed Shot the dbom e scosvirowent 1ay %~eve led t(. Ofu"tregtoatm of
Vesstilaetry mail.. sod a 40bboquect itleteams is~ YC, but we beieve the data
did lsot atfooqly sportf Mbe idea, Subj~et.i imPeed to' a t of 0.11 AYA
(NitNel. 1,11avpill sd 0,11, 5960) empeftlet.vd imietfrflAl tIahlossa begtim"Sg
Os the ageand Olp, This study showed aft fomn~ris efuse of variability, sod
the 1616 sod Ill infrofasec is two 6030kift vital o.ipaty e*uaaea that these
Oub)0#te say Not have bes" V811 frolod Ito this "wmaevr, We wmluded the"e
dalis from Cho 11041 esalpiti
Noevoal of She eeria# is table 6 (11mberttio at al,# 19661 Dougherty aed
"rtaefaF,~ 11111 9:4611 at 41.9 11111 w1ish?~ &9 al's 1173". INGLUda as
Indiv0dual volute or asp todiesifto' of lsdlvidual or Imep varebllity# "ae
"40a values repelted all appeared atable, Sltheuvah abauvse Weis POefulS for
ouur mnlpees Lcmirelc (1971) paper owomartled the reasults of elm aeturaltlo
divec meduated it 6rbetrmio pfeecuree ra1111su from 30461 AMA Wher. FO Vaol
kept betwoo" O's $sd 0,41 AVA at depth sod at 0,0 during dealmiroetaes, Ne
6*bpoutod that five of It oubjecto had 'doierame-4d vital *epmaeiep bi t se
alaeltimitvet oe provided@ UOeatnlhs, @I @1 (1911) reported that VC
dprFS440d It to fight aubjoeta ONpOed eto a P0 0.1 ATA Arier ah 11 day
49111#41111" #1 41.7 ATAO pRusovololo (k060 1i04l report oft the Not#% divesn
MI 4ay. easturautes of Al, AtA, P n a 0.4 ATA) ehewed tin detrampwt to VC
IiMedluisly after the dive and a 31 dortoffieu after AS h, The third IH~n diva
LOl

study cited by Doulherty at a.l (1978) included daily S h uxcursions to 100
few on tir. Air at 100 few renlta to a i O2 of .64 ATA and yet choen authors
reported that 7Oreached a mazino u of 1.79 ATA. They did not explain this2
discrepancy. One subject was treated for decompression sickness (1.85 ATA 02
for 60 aim) after which his vital capacity dropped abruptly by 281.
Qualitatively, vital capacity chailae appear to be an extremely variable
frespnse owes Individuals. During 02 exposure, vital capacity can remain
UNehenpd, shana gradually sod steadily, or drop suddenly (Tgle. 1-6). The
results ti Table 6 do not lend themselves to an immediate conclusion about
What the typically sate PO2 exposure is. Chest pain ie a characteristic
complaitnt resulcing from 02 exposure, and this raises the question vhether
changes I" VC represent a change in effort more than an underlying pulmonary
disease process. I" studies where VC decreased with 02 exposure, anecdotal
evidence was provided that the change in vital capacity did not correlate with
subjeative symptoms and, furthermore, that during recovery functional changes
outlasted symptoms,
The reproducibility of the vital capacity measurements ti usually
considered to be in the range of approximately 200 ml or to have a standard
deviation that ti approxiatsely ?.5% of the VC (IRahn, Tenn. and Otis, 1949;
Dougherty at &1.. d)78). Clark and Lambortsen (1971a) claimed a pooled 95Z
confidence interval of 60 al which was unusually small, although how this
calculation wax made was not specified. Eckenhoff'. control studies
(Fig. 7) showed the variation obtained in normal sen exposed to a P0 of
0.3 ATA, while they performed multiple VC maneuvers over long exposures.
Although there wan no doubt that these data showed a different trend than
those obtained in the experimental group (Fign. 5 and 6), there probably wan a
small (1.22) decrement, even with exposure to only a slightly elevated P0 2.
231
/2
If one accepts that the decrement in VC represents more than fatigue,
there remains disagreement about whethnr istelectaets or some direct lung
tissue damage is the mechanism responsible. Burger and Mead (1969) presented
fairly convincing evidence for atelectasis. They showed that 3 h of 0.39,
0.5, 1.0, or 2.0 ATA of 100 02 altered the pressure-volume characteristics of
the mcns' lungs such that at high lung volumes a smaller pleural pressure
developed on the first pressure-volume maneuver, but this appearance of
reduced compliance was quickly reversible on subsequent efforts, This change
in lung mechanical property was documented as uncorrelated with chest pain.
The subjects were encouraged not to sigh or breath deeply, and the
InvestigatoLs found that the apparent decrease in compliance was quickly
reversible with subsequent full lung inflation. Eckenhoff's new data offer
conflicting evidence. His subjects had nearly 4 ATA of N2 diluent to breathe,
so absorptional atelectasis should have been minimized. These subjects had
significant decrements in VC (Figs. 5, 6).
Evidence for Tolerance to 02 Exposure
A final application of the vital capacity index is the detection of the
development of tolerance to 02 exposure. Several studies have shown that a
degree of tolerance is acquired when exposure to 02 is intermittent. That is,
an animal will tolerate more total time in 02 when exposure is not continuous
but interrupted by periods of exposure to air or N 2-02 mixtures. Wright et
al. (1966) used powerful statistical techniques to show that 4 h of a~r per
day was the shortest interruption able to prolong survival in mice exposed to
100% 02 at I ATA. In a master's thesis, Hall (1967) tested a series of
intermittency schedules with shorter time periods (< I h) on groups of guinea
pigs breathing 02 at 3 ATA. On the basis of the time it took 50% of the
animals (ED5O) to develop several symptoms, he proposed that 20 min of 02
24

followed by 5 min of 7? 02 in V2 (this resulted In a normoutc P02 at 3 ATA)
"was the most efficient schedule.
Widdell et al. (1974) tested three Intermittency schedules on
professional divers who breathed 02 at 2 ATA. The experiments were teruinated
at the subject's discretion; the results are summarised in Table 7. In this
study VC did not decrease in the three subjects who were exposed to continuous
02. The men who received intermittent exposures of air tolerated longer mosn
02 exposures with fewer symptoms. These subjects had larger mean decrements
in VC but Table 7 shows that they chose to tolerate more time in 02. As is
often the case with human studies, the number of subjects was small and the
variability of results so large that conclusions must be considered tentative
at best. These authors concluded that the 25 min 02/5 min air schedule wee
most effective.
Hendricks et *l. (1977) conducted an Interuittency study designed to
complement Clark and Lambertsen's (1971a) 2 ATA continuous 02 experiment.
Five experimental subjects and one control subject breathed 20 sin of 02
followed by 5 min of normoxic N2-0 (P 160 tort) at 2 ATA until VC2 02 0 6 or t2AAutlV2decreaeI by 10% or symptoms became severe. This experiment was also
influenced by the design of Hall's (1967) thesis, which utilised this normoxic
mixture during the 02 breaks. (The design vas different from that currently
utilized by the U.S. Navy for recompression treatments because compressed air
"is the breathing gas, not 7% 02 in N 2.) The results of the Hendricks at al.
(1977) study are provided in Table 8 and Fig. 8. These 5 subjects seemed to
tolerate longer 02 exposures (Fig. 8A) than did subjects exposed to continuous
02 (Fig. 3) before developing significant changes in VC. These subjects
developed symptoms of 02 toxicity I to 2 h before changes in VC were detected,
and the decrease in VC was said to continue for 4 h after termination of the
25

TABL! 7
Summary of Widell et a1. (1974) Intermittevcy Study*
Continuous 25suinO0 20Osin 0 10 in002 5 sin air 20 sin air 20 sin air
*Subjects 3 5 8 3
0 2 Time tolerated 5. O 6.2 6.9 3.1
02Time to fLtrt symptosm 2.6 4.3 3.93.
Total time tolerated 6.0 9.6 13.8 15.4
% VC change (t OD) -1.53 (1.19) -2.64 (1.3)- --7.3 (2.97) -.1.17 (0.358)
*Time@ are all seon regpoggee In hours.
26

Hendricksat et . (1977) Data on Percent Change Is Vital Capacity to
7Lve Subjects Zhposed to Tatermitteut 02 btposure* at 2 A1TA.
0 2Tim Subject(l1 2 3 4. 5 61
1 1.5' .6 .6 -2.0 0.6 +1.00
*3 2.0 -1.0 -1.5 -1.0 0.0 +1.2
5 5.5 1.0 -2.0 1.0 0.0 +1.8
7 3.0 0.0 -2.0 0.0 -2.0 + .5
9 2.0 -1.0 1.0 -1.0 -3.0 + .8
11 0.0 -3.0 W7 -2.0 -2.0 +1.2
13 -3.0 -9.0 -5.0 -.6.0 +1.2
14 -5.0 -10.0
15 -7.0 -11.0Irltermitteut exposure equals 20 sit 02/5 ate 7%0
t Subject was a control who continually breathed 7% 02.
27

eSi A
-25
CN .5
-7 $ "
1 3 5 7 9 1I 13 IS 17 Io
OXYGEN TIME (h)
S
.s]• B
C
C -7 S
Ir
-3- S 7 9 I 1 13 is 17 I9
REAL IIHE (h)
7ig. 8. Effect of exposure to intermittent 02 exposure at 2 ATA on humanvital capacity as reported by Hendricks et al. (1977). Four subjects wereexposed to 20 min of 100% 0 followed by 5 min of 7% 02 in N . Data areexpressed an % change from lhe control value. Each line repiesents the timecourse for an individual subject. Panel A shows vital capacity as a functionof time spent in 0 while panel B shows vital capacity as n function of theactual time of exp~sure.
28
02. Symptoms persisted (or even worsened) for only 2-4 h post exposure and
recovery was usually complete in 24 h.
Moseihi, Abdallah, and A.ab (1980) compared pulmonary function in -67
control subjects with that of 65 divers who had dived with 1002 02 to I to 2
at* for 90 min twice a week over a range of two to 10 years. No difference in
mean values of lung volumes, flows, or diffusing capacity in ventilation with
exercise could be detected.
Evaluation of the UPTD Concept: Background
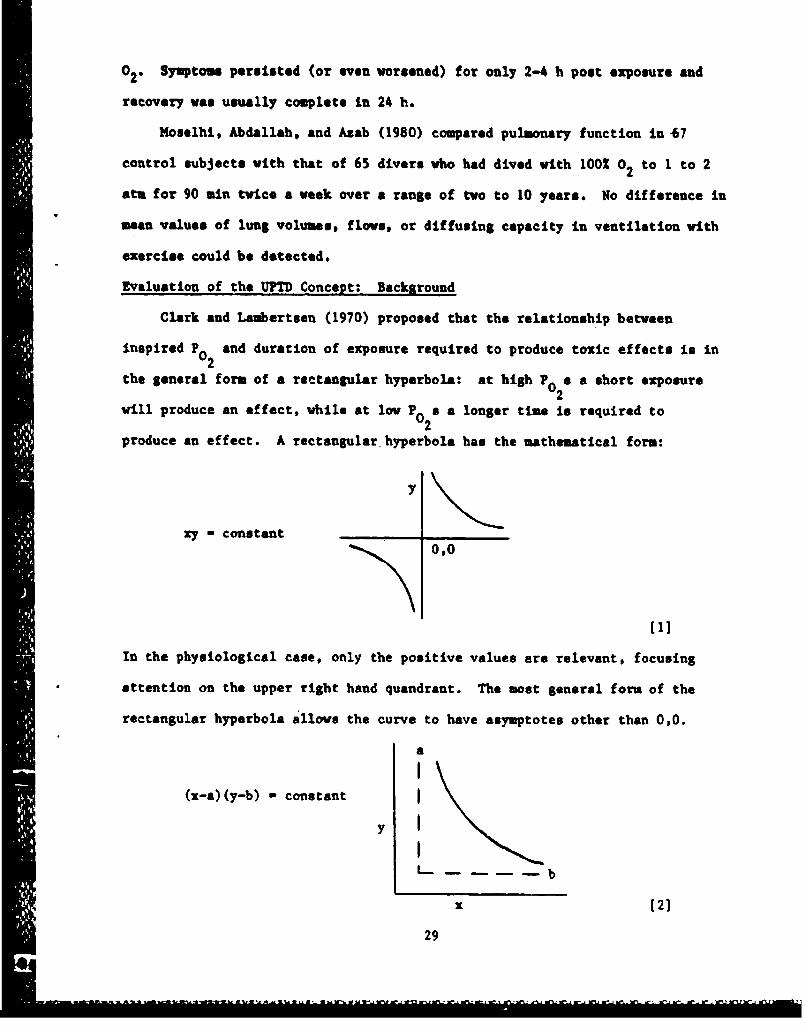
Clark and Lambertsen (1970) proposed that the relationship between
inspired P and duration of exposure required to produce toxic effects is in
the general form of a rectangular hyperbola: at high Po s a short exposure
will produce an effect, while at low Po2 a a longer time is required to
produce an effect. A rectangular hyperbola has the mathematical form:
y
zy - constant
In the physiological case, only the positive values are relevant, focusing
attention on the upper right hand quandrant. The most general form of the
rectangular hyperbola allows the curve to have asymptotes other than 0,0.
a
(x-a)(y-b) - constant Iy I
L_. b
x [2]
29
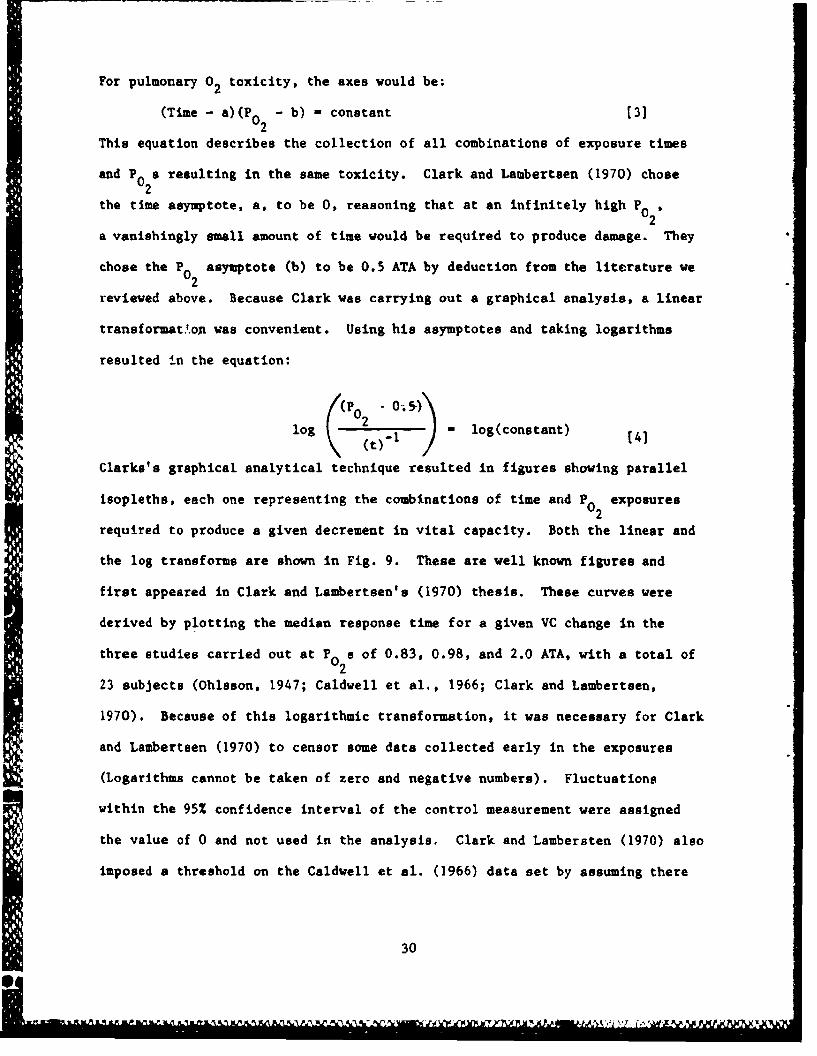
For pulmonary 02 toxicity, the axes would be:
(Time - a)(P 0 - b) - constant (3]
This equation describes the collection of all combinations of exposure times
and P0 a resulting in the same toxicity. Clark and Lambertsen (1970) chose
the time asymptote, a, to be 0, reasoning that at an infinitely high P0 2,
a vanishingly small amount of time would be required to produce damage. They
chose the P asymptote (b) to be 0.5 ATA by deduction from the literature we
reviewed above. Because Clark was carrying out a graphical analysis, a linear
transformat.on was convenient. Using his asymptotes and taking logarithms
resulted in the equation:
((P 0 - 0-; 5)
log 2 I - log(constant) (41
Clarks's graphical analytical technique resulted in figures showing parallel
isopleths, each one representing the combinations of time and P 0 exposures
required to produce a given decrement in vital capacity. Both the linear and
the log transforms are shown in Fig. 9. These are well known figures and
first appeared in Clark and Lambertsen's (1970) thesis. These curves were
derived by plotting the median response time for a given VC change in the
three studies carried out at P2 a of 0.83, 0.98, and 2.0 ATA, with a total of
23 subjects (Ohlsson, 1947; Caldwell et al., 1966; Clark and Lambertsen,
1970). Because of this logarithmic transformation, it was necessary for Clark
and Lambertsen (1970) to censor some data collected early in the exposures
(Logarithms cannot be taken of zero and negative numbers). Fluctuations
within the 95Z confidence interval of the control measurement were assigned
the value of 0 and not used in the analysis. Clark and Lambersten (1970) also
imposed a threshold on the Caldwell et al. (1966) data set by assuming there
30

- t
OURA&TiIM OF ONY@I•N 111ATHtNM (WWII
Fig. 9a. C:lark's pulmonary oxygen tolerance curves itn normal moo based onSvital capacity changes in the median subject. Each Isopleth shows thecombinations of PO0 and time of exposure required to produce a given'decrement:in vital capacity.2
O-D 50ft&
,J1-21
L4 24 -\\\ 0 -,1 40. -
C-3
2 4o 6 -,0 16
DURATION OF OXYGEN BREATHG141hou(ft)~
Fig. 9b. Clark'sa pulmonary oxygen tolerance curves in normal men based onvital capacity changes in the median subject. Tahi isalog-le hogs thesfrmo
ci aa of9ea.o.ure reqire t031
in08ital capacity.
-, oc[\\\\-- •o..g \'SYMB"L -I°:;::0 ' 2&
OURAION F OX•(# R[AT~kG-hO•
-- a
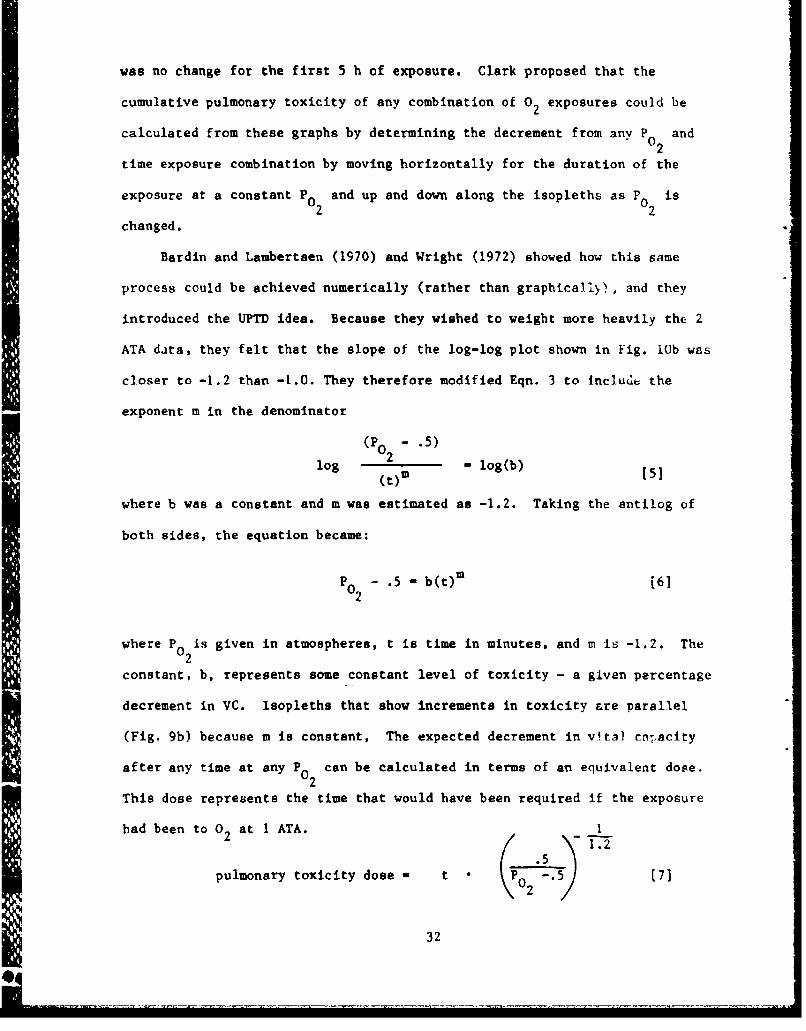
was no change for the first 5 h of exposure. Clark proposed that the
cumulative pulmonary toxicity of any combination of 02 exposures could be
calculated from these graphs by determining the decrement from any P and
time exposure combination by moving horizontally for the duration of the
exposure at a constant P0 and up and down along the isopleths as PO2 is
changed.
Bardin and Lambertsen (1970) and Wright (1972) showed how this same
process could be achieved numerically (rather than graphicaliy), and they
introduced the UPTD idea. Because they wished to weight more heavily the 2
ATA data, they felt that the slope of the log-log plot shown in Fig. lOb was
closer to -1.2 than -1.0. They therefore modified Eqn. 3 to includ.• the
exponent m in the denominator
(r02 -. 5
log 2 log(b)Mt m [51
where b was a constant and m was estimated as -1.2. Taking the antilog of
both sides, the equation became:
P - .5 - b(t)m [6]
where P2 is given in atmospheres, t is time in minutes, and m is -1.2. The
constant, b, represents some constant level of toxicity - a given percentage
decrement in VC. Isopleths that show increments in toxicity &re parallel
(Fig. 9b) because m is constant, The expected decrement in vital cntacity
after any time at any P0 can be calculated in terms of an equivalent dose.
This dose represents the time that would have been required if the exposure
bad been to 02 at I ATA. 121.2
pulmonary toxicity dose t 02
32

where t is time in minutes. If P is I ATA, the UPTD is just the time of
exposure. If P is some other value, the UPTD indicates the time at 1 ATA
which would have yielded an equivalent toxicity. Equivalent times at
different P0 exposures may then be summed to calculate the total equivalent
exposure. The defined UPTD relates to a decrease in VC as shown lu Table 9.
The UPTD definitions were derived from Fig. 9b, which shows for example that
after 10.25 h (615 m=n) of 02 at 1 ATA there is a 2% decrease in VC.
METHOD
Instead of the serial graphical process used by Clark and Lambertsen
(1970) we did a coordinated (computer) analysis that allowed us to explicitly
test certain features of the hyperbolic relationship (Eqn. 6) (the exponent,
m, and the asymptotes for time and P 0), and to evaluate the contribution of
individual variability. The latter effect was not addressed in the original
model as only the median individual response was graphed. We did a nonlinear
least squares analysis, titting the data (subject, 2 change in VC, P0 2,
and time of exposure) to the equation.
% AVC - B(s) (P0 2 - B(l))[(t - B(2))]B(3) [81
This equation is a more general form of Eqn. 6. B(1) is the P0 asymptote (in
ATA) which Clark set at 0.5 ATA; t is time in minutes; B(2) is the time
asymptote which Clark set to 0; B(3) is the exponent m, which Bardin and
Lambertsen (1970) proposed was 1.2; and B(s) is a siope parameter, which can
be different for every subject.
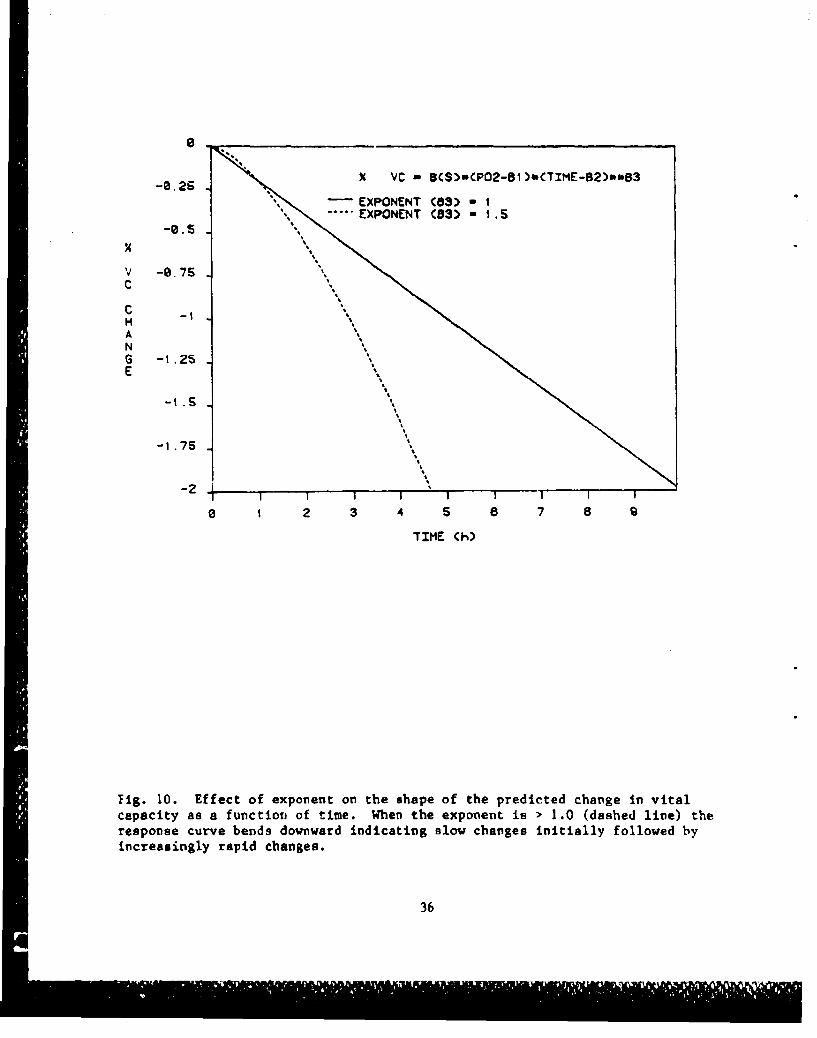
This model did not assume a linear effect: if the exponent B(3) > 1.0,
the relationship between AVC and time at any given P will curve downward, as
33
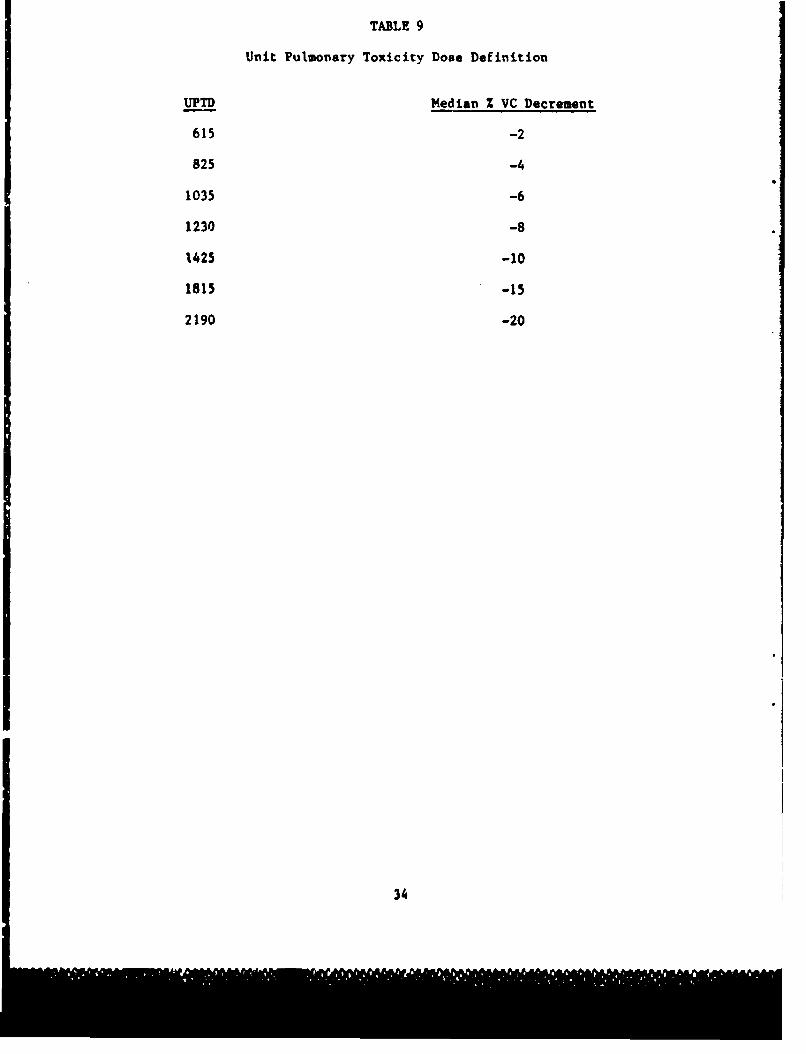
TABLE 9
Unit Pulmonary Toxicity Dose Definition
UPTD Median % VC Decrement
615 -2
825 -4
1035 -6
1230 -8
1425 -10
1815 -15
2190 -20
34

shown in f7g. 10. Varytu8 B(s) from belov 0 to afrer telsve .baoeue vill
tocrbesa the slope or the chowga to VO vith time. Lowerien the P70 aymptst
(M(M)) vwil oleo lead to a prediotim of a larger deaogaeest to VC after cay
time at a given elevation ton 10
This •n•livear fitting teohnique to exsactly oAala•sv to liceor
rOriOOOLoo, but because it may appear sews geql~ued, a abAm$ doaertpu4
may be vorthwhile. AN eduvteod gu4e, to IWO Off MIe MSt pageti a 1(1)t
5(2), and 1(3) (for osamploe, 0.5# t -AM) o veil as for 9(e)# rish Shia Set
of W'e# for every 4Lu9 ati" 0f subject, tim of ovoourbe, sed P02, A
estimatod % VC to calculated cad aemarad wish 0e WaW (mocuvrod) 1 0V0,
This diffeoreon (estimated - eaMsred) to oqVafd cad cummed Over all data
polnes. Thus, a own of squared otfers (113) to empused, The poarmteor
(l's) are then altered slightly by the computer, estimated I LVC to
rocaleulated, aSd the 551 is teoolcutedso4 This proso$$ to repealed weill she
553 Las OLLtmiscd. to &hL 10dat, vheo shM Plot 41 rhk 06e a,"jeos vat
"4uposed WON loe than the $(M) (to asymploel) beatl loeged# aNy ahepes in Vo
was considered error. The assumptieo was shoe eapeova to a 10 below the
"safe'! I02 should have produced se daeromeat 1 Va. To make asliattlie
comparieon@ about asyuptotes and suposacas parameters are fied (of values
representing a null hypothesis to be tooted) sad a now 513 Ls altevitled. An
T test Is performed to determine whieh parameters provided ske better Itt (or
S..to evaluate the pull hypotheote).
The described analysts was earrfed out An the date e•Wmmered in Table
10. OrIginal date vort firs to-oNprooted of percen$ of eseage free Ohe
control value, When aontnal valves Were mesured several times, ell
pro-expertmenscl values vear averaged, Date from the firat 6O h (0h191

C
A
o .I ",5 •€ ' c!-
CISM
Fi g. 10, M oot of e xponent an tl h #h op e of the pr ed ict ed ch oo to v it al
ChA011Iy as a function of time.P When the exponent to 0 I.0 (d~ohod line) the
roepnnnes rurve bonds dow~word indiestinft slow sheelgon initially f'ollowed by
1"I.16641011y rapid Cha"f4e4,
m 14-
_ yumU

c5hown In fig. 10. Varying B(s) from below 0 to larger negative numbers vill
increase the slope of the change toa VC with time. Lowering the P 0 asymptote
(MM) will also load to a prediction of a larger decrement in VC after any
time at a liven elevatioai in P2
This nonlinear fitting technique to exactly analagous to linear
regression, but because it may appear more complicated, a short description
may be wortlWhile. An . cod poese is sods for starting parameter. S(1,
3(2) and (30) (for example, 0.5, 0, -1.2) as veil as for B(s). With this set
of Ile, for every combination of aubject, times of exposure, sod P02, on
estimated % AYC is calculated sod compared with the actual (measured) % AVC.
This difference (estimated - measured) to squared and sumue d over all data
poitst. Thus, a sum of squared errors (0B!) is computed. The parameters
(WOs are then altered slightly by the computer. estimated 2 AVC is
recalculated, and the SSE is recalculated. This process io repeated until the
5513t istiimiged. In this model, when the P 02to which the subject was
exposed was less the" the 3(0) (P0 asymptote) being tested, any change in VC
woo considered error. The assumption vas that exposure to a P0below the
#$safe"P0 should have produced no decrement in VC. To make statistical
comparisons about asymptotes and exponent. parameters are fixed (at values
representing a null hypothesis to be tested) and a new SSE is calculated. An
F test Is performed to determine which parameters provided the better fit (or
to evaluate the null hypothesis).
The described analysis was carried out an the data summarized in Table
10. Original data were first re-expressed as percent of change from the
control value. When control values were measured several times, all
pro-experimental values were averaged. Data from the first 60 h (which
35
0.
-0.25 X VC - B($)wCP02-Bi)WCTIME-B2)**B3
'SEXPONENT (83 - I""- • EXPONENT CB3) - 15
V -0.7SC
=C -tHANG -1.25E
-2 .S
-l .75 S
-2I i !S I i I
0 1 2 3 4 5 i 7 8 9
"TIME (h)
Fig. 10. Effect of exponent on the shape of the predicted change in vitalcapacity as a function of time. When the exponent is > 1.0 (dashed line) theresponse curve bends downward indicating slow changes initially followed byincreasingly rapid changes.
36

TAILI 10
Sumary of data used for analysis
PO Number Number
SubJects Data Reference
2.0 13 73 Clark and Laubarteeu, 1971
1.05 12* 96 Eckenhoff, 1984
0.96 4 18 Caldwell, at a1., 1966
0.83 6 66 Ohlsson, 1947
0.47 3 12 Fife, et a1., 1973
0.3 6t 55 Eckemhoff, 1984
0.28 2 18 Ohlsson, 1947
0.23 2 8 Morgan, at al., 1961
0.21 4 32 Fisher, at al., 1970
0.32 4# 4 Morgan, at al., 1963a
0.3 3f 3 Dubois, at al., 1963
0.23 8 8 Morgan, at al., 1963b
* Each of these subjects was exposed to 0.3 ATA of 0 for 12 hprior to the 1.05 ATA exposure. Three VC masurau/ots were obtainedduring this time and these data were also utilized (No. data w 47).
t One subject was used as an experimental and a control.SThese data were measurements taken before and after exposures and
were therefore not used in the model where a separate B(s) wasestimated for each subject.
37
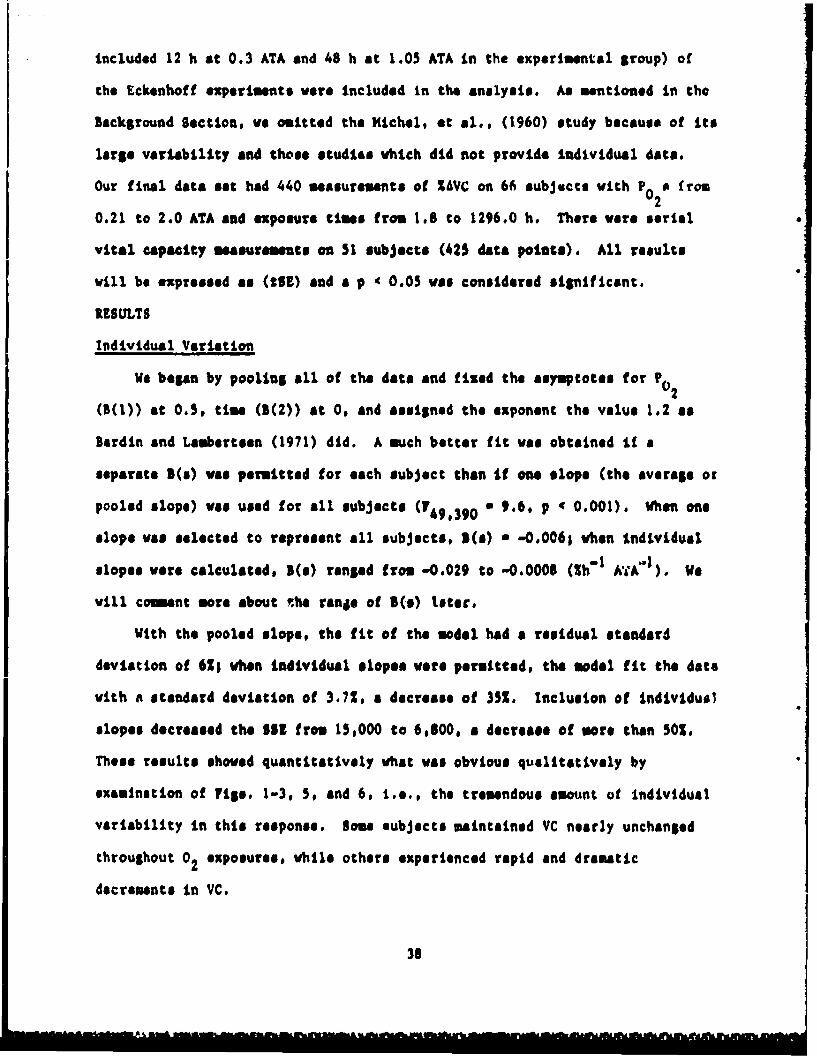
included 12 h at 0.3 ATA and 48 h at 1.05 ATA in the experimental group) of
the Eckenhoff experiments wore included in the analysis. As mentioned in the
Background Section, we omitted the Michel, et &l., (1960) study because of its
large variability and those studies vhich did not provide individual data.
Our final data set had 440 measurements of %AVC on 66 subjects wich P 02 from
0.21 to 2.0 ATA and exposure times from 1.8 to 1296.0 h. There wore serial
vital capaity measurements on 51 subjects (425 data points). All results
will be expressed as (49E) and a p 4 0.05 was considered significant.
RESULTS
Individual Variation
We began by pooling all of the data and fixed the asymptotes for PO2
(5(0)) at 0.5, time (3(2)) at 0, and assigned the exponent the value 1.2 as
Bardin and Lambertoen (1971) did. A such better fit vas obtained If a
separate a(s) was permitted for each subject than If one slope (the average or
pooled slops) was used for all subjects (T49,390 " 9.6, p 4 0.001). When one
slope vas selected to represent all subjects, 5(s) a -0.0061 when individual
slopes vera calculated, B(s) ranged from -0.029 to -0.0008 (Sb" 1 AI AXI), We
vill couent more about the ranae of I(s) toter.
With the pooled slope, the fit of the model had a residual standard
deviation of 6%1 when individual slopes vere permitted, the model fit the date
vith a standard deviation of 3.72, a decrease of 35%. Inclusion of Individual
slopes decreased the 553 from 15,000 to 6,600, a decrease of *ore then 50%.
These results shoved quantitatively vhat vas obvious qualitatively by
examination of Figs. 1-3, 5, and 6, i.e., the tremendous amount of individual
variability in this response. Some subjects maintained VC nearly unchanged
throughout 02 exposures, vhile others experienced rapid and dramatic
decrements in VC.
38

Choice of moment (a)
Navin$ determined that Individual slope paramters were appropriate, we
than examined the exponent 3(3 (the u of the UPT). With LO2 ixed at 0.5
ATA and the exponent sestimeted freell from the data, this exponent was
selected to be 1.0008 (*0.07), which was not statistically distinguishable
from 1.0. We fixed the exponent at 1.2 (as lardin and LeAertses (1970)
suggested) and this significantly voreseed the fit (F~ 1,8 5.79. 9 4 0.025).
Because the WTD is based on a suggested exponent of 1.2. we carried out
the same analysis using only the data from which the UMI concept was derived
(Ohloson, 1947; Caldwell at at., 1966; Clark and Lasbertese, 1970). shown in
Tables 1-3. This data set had 23 subjects and 157 data points. As we did not
need to work with log transformed data we did not have to coenor VC data which
showed no change or @sall increases. Ws were also able to explicitly test
whether subjects 12 and 13 were distinguishable from the rest of the subjects
and thus whether they needed to be excluded. As When all data were used for
analysis, allowtng for Individual slopes significantly Improved the fit
R 22,134 w 14.46, p 40.01). An exponent (1(0) or a) of 0.98 (*0.093) best
fit the data. This value was Aot different from 1.0 but provided a
significant improvement over 1.2 (1 1.34 , 4.4 9 4 0.05). The above results
were unarfacted by inclusion or exclusion of Clark and Laubertasn's subjects
* 12 and 13.
rC 2 and Time Asymptotes
Next, we emplicitly tested whether the VC data ware helpful in
estimatings the PO (501)) and time (3(2)) asymptotes suggested by the model or
whether Inferences from the literature would continue to be necessary. A
significant improvement In the fit was obtained when $(I) was fixed at values
39

< 0.5 ATA compared to 0.5 ATA (or even 0.6 or 0.7) (we tried 0.4, 0.3, 0.376,
and 0.2 ATA). When B(1) was freely estimated, a value of B(l) - 0.376 ATA was
chosen. This parameter had a large SE and the precision of all the slope
parameters was lost, which suggested that the data simply would not support
selection of all of the parameters shown in Eqn. 8. These results do
not encourage raising the choice for the P0 asymptote above the current
choice of 0.5 and even suggest lowering this value somewhat. The data do not
allow a more precise recommendation about the "safe" P because the number of
useful points obtained at low P 0e is limited and many of these include only
before and after (as opposed to serial) measurements. It is important to note
that lowering the P0 asymptote below 0.5 ATA produced less than a 1%
improvement in the SD of the fit (and the SSE decreased by 2.0%, from 6,766 to
6,628). This contribution pales in comparison to the 35% improvement obtained
by inclusion of individual slopes (and a 50% decrease in the SSE). A time
asymptote of 0 as proposed by Clark and Lambertsen (1970) remaii-s reasonable.
With B(1) fixed at 0.376 ATA and B(3), the exponent, fixed at 1.000, the time
asyaptote was chosen to be a number less than 1 h with a standard error that
made it indistinguishable from 0 (0.002 h ± 1.07).
UPTD SSF Comparison
Finally, we compared our model's SSE with the SSE obtained with the UPTD.
We calculated the number of UPTDs for each data point using Eqn. 7. To relate
the UPTD to %6VC, we fitted the 7 data points in Table 9 to two different
equations: one linear and one sigmoidal (more details of this analysis appear
in Appendix 1). The predicted %AVC was calculated, compared to the measured
and this difference was sumed and squared to calculate an SSE for each
equation. The SSE for the linear and sigmoid equations were 17,820 and
19,850, respectively, each of which is larger than the SSE of our model
40

(approximately 15,000 for the pooled B(s) model, 6,000 for the individual B(s)
model).
DISCUSSION
We reviewed the general model from which the UPTD concept was derived
(Bardin and Lambertsen, 1970) and performed a coordinated quantitative
"analysis that permitted explicit testing of parameters in the model. We
utilized more data than did the original authors and included vital capacity
data accumulated since 1970. This analysis showed that the single greatest
contributor to uncertainty in this model was the extreme variability in
individual response. The standard deviation of the model's fit dropped by
nearly one-half when individual slope parameters (B(s))were chosen. At this
time, there is no way to predict a given individual's slope, or even whether
an individual's response (slope) will be the same on different occasions.
With parameters which minimized the error of the fit of the model (B(1) -
0.376 ATA, B(2) - 0, B(3) - 1.0) slopes (B(s)) ranged from +0.0021 to -0.082,
Zh"I ATA 1 in 38 individuals; the distribution of these slopes is shown in
Fig. 11. Figure 12 emphasizes the importance of this individual variation.
With the P0 asymptote - 0.5 ATA and exponent - 1.0, after 20 h exposure to a
P0 of 1.0 ATA the predicted decrement in VC varied from an average value of
-5% to 1% and up to 12%, depending on whether a median slope was chosen, or a
slope belonging to the highest 10% or lowest 10% group of resistant
individuals. Figure 13 shows how VC would decrease as a function of time at 4
different P 0s in an individual of median susceptiblity. Individual
variability introduces large uncertainty at every P 02. For example, exposure
to 10 h at a P of 2.0 ATA produced a median decrement of about 8%, but withSP02
an 80% confidence interval of changes ranging from 2-18%. The impact of
variations in the other parameters was much less important given the powerful
41

-. 03SL0PE -. 02
PARAM -. 8IETE
I !I I I I I
a 5 IQ Is 28 25 30 35
SUBJECT
Fig. 11. Range and distribution of Individual slope parameters for 38individuals in which serial VC measurements were made. Cross-hatched barsindicate slope for individuals of highest 10%, median, and lovest 10%susceptibility, respectively. The median value was -0.009 h"1 ATA -.
42
[]M

X
C
NGE
-IS"-VC *
-20 LOWEST tOX INDIVIDUAL SLOPEMEAN INDIVIDUAL SLOPE
ý"• MEDIAN INDIVIDUAL SLOPE"--- HIGHEST laX INDIVIDUAL SLOPE
-25
0 10 20 30 40 so
TIME (h)
Fig. 12. Effect of individual variation on the predicted Z decrease in vital
capacity resulting from exposure to a P of 1.0 ATA. When Eqn. 7 was fittedto all available human vital capacity daia, a significant improvement was
achieved when a separate slope was permitted for each subject, but a wide
range of slopes resulted, This figure shows how the range of slopes affectsthe predicted change in vital capacity. The 38 slopes calculated for eachsubject were ordered; the fourth lowest and fourth highest slopes
(approximately the bottom and top 10%, respectively) as well as the medianslopes were used to calculate predicted VC changes. The mean individual slope
line was generated using the slope obtained when only one slope was calculated
for all subjects.
43

C '\%
A \ \,*C \ "
-IS '5'.\
- 1S \'S-2V 02iGT\ "S
SP02= ,.8t. ATA \ ,"
-- P02 =4.0 ATA
-25 *1 1" -
05 t0 15 28 25 3
TIME (h)
Fig. 13. Predicted decrement in vital capacity for an individual of mediansusceptibility exposed to 4 PO s. For simplicity, confidence limits are notincluded, but at each Pa w?3e envelope of VC changes (such as shown on Fig.12) would be included in the 80? confidence limits.
44

influence individual variability had on the response. Our analysis showed
that a P asymptote below 0.5 ATA was preferable to the previous estimate of
0.5. Here, precision on this estimate must await experiments where serial VC
measurements are made in groups of human subjects given lengthy exposures with
moderate P0 elevations. An exponent (B(3) or m) of 1.0 minimized the error
of the fit; the previous estimate of 1.2 increased the error. Our analysis
shows the model that best fits the data of an individual of median
susceptibility would be:
% AVC - -0.009(P 0 - 0.38)(time)
This is the model with parameters that "minimize" the error. For reasons of
simplicity, however, with essentially no loss of precision in the predictive
capabilities of the model, we recommend the following modification. The
cumulative effect of any combination of exposures to time and P for an
individual of median suspectibility can be predicted by summing the values
obtained with the expression:
% AVC - -0.O11(P 0 - 0.5)(time)
where P is in ATA and time is in minutes, as has routinely been done with
the UPTD calculation. In fact, our literature search shows that there is
really no evidence to support or refute the legitimacy of this summation. It
is conceivable that some recovery occurs to a certain extent when PO2 is
lowered from some experimental level but is kept above normoxic. Conversely,
damage may occur at a different rate if P is raised in steps. None of these
questions have been answered.
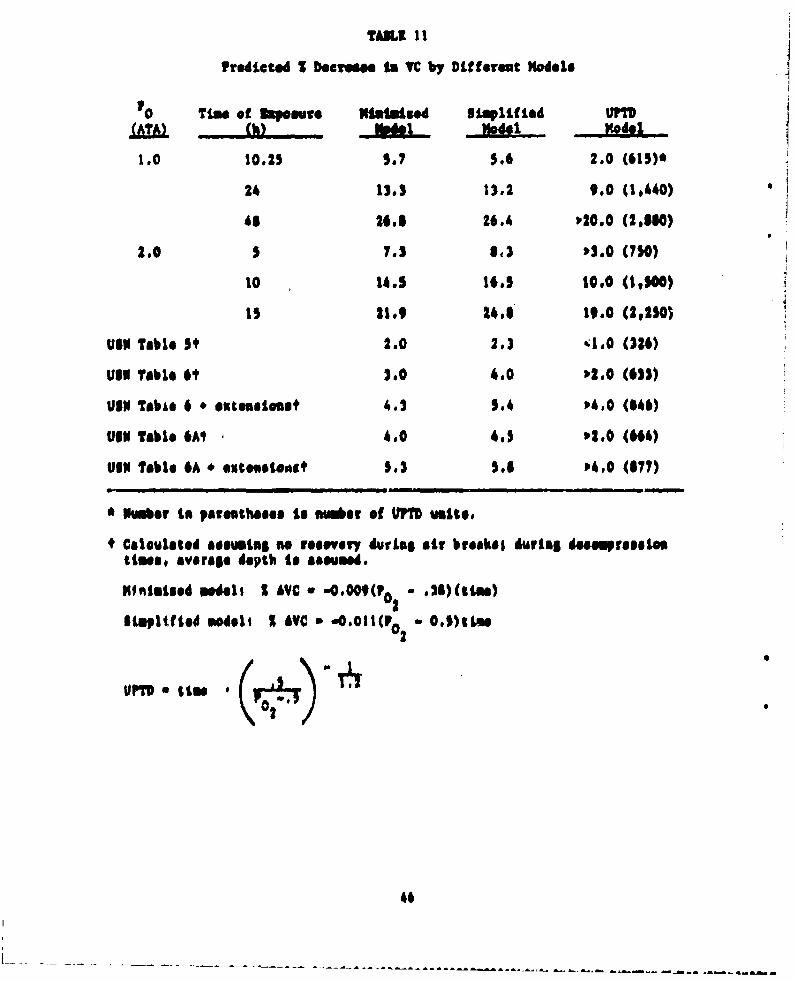
Table 11 shows the effect of the modification In parameters in the
simplified versus the minimized model and compares the predictions with those
obtained from the UPTD Model. The minimized model is based on quantitative
data fitting, which included no censoring or transformation of data, a larger,
45
TAB.I II
Predlcted I D.ereae In VC by Different Models
Timlle of Ikpemve M Siplif led UMTS(h) Xod, Vod, Z
1.0 10.25 5.7 5.6 2.0 (615)*
24 13.3 13.2 9.0 (1,440)
65 26.1 26.4 V20.0 (2,510)
2.0 5 7.3 $13 P3.0 (750)
10 14.5 16.5 10.0 (0,100)
15 21.9 24.5 19.0 (2,25O)
Us" Tible 5' 2.0 2.) CIA (324)
Ulu6 Table 61 3.0 4.0 02.0 (611)
UVI TabLe 6 * Outgselou4 4.3 5.4 04.0 (546)
OIN Table 6AI 4.0 4.5 '2.0 ("4)
UIN Table 6A * ,xteives1' 5.3 5.6 4.0 (677)
a N•m•er to parenthame•e to Mosba of WM uvole,
+ Caleulated acaumilg so reaevvry duirLa air bfsahl during deMs.presootimn, averlae depth to &&eaued.
41"16159d mOdell I A€C 0 .0002(F0 .21)(stim)
ItWpIMf Id modoo I LYVC .,Otl(002 0-5)tLm
2
46
Mnrs current data mot. Retd of eeinptimsa about a.omptot. Thus c*.martusa
with the UiI ugdel ere ostod, 01 btisrtul Legaastoo Algh"Ph' our model
appoarA to make morea eeeevvativa ,vadiattooa (i,.e. larger VC docremeet (of'
any given exposure) gives that seek piodiutor has a tosiard devittiea of 62,
the models are Very od~aire We looems retaiuning the 0. to, So)mmte lot'
..iosenoelo se, the only Pew #s ~r that seedo to No revd tooh iada
01se 00,011.
clearly# this "alysto 9Own thut a deroato in vital sepasily to set asi
ideal WONe of the devoelopeoa of pvlomsary 0 towifity &ad wo Are flat the
firAt to male this ariliunf (Vhdel '01 all, 19761 cardette sed Lesairo,
19). It is a mesouVONOss far whish a .vhjoet seedo trft'At i5 t to effort
dseptd"It, eel, o4 thi* report queettfies, VC to variable somes individuals,
The index to based a" the rvaponse of 41s ladividwal of oadises auoeptibility,
therefor# Placing sessitive individuuls as a msuh higher risk.
TMe 400419"s still11 *PON of. hto WMI dorlyies lost$ press$* Shaesoe to
VC topetaesol It ii s1eerly a geverotble offeeg (Clark end Lmibafisaeu 1970,
Lekonhoffl Caldwell as site 19O66 11Ondriee et stop 1977), but we do a#$ know
yet how to asaount (of recovery (of duties istormittert exposure) with this
mode). nou Navy aurrantly rloommslde O2 eupeOOure Choi would reolsi Is a 21
"indim" doerfeent Lto VC under "OMNIse ereuutarcoo (exposure to se$ U.S. Navy
table 6) and suggento a maNimum aNPROUVe that would beaxepetited to proouce a
* ~101 decram.,,s under introef 60ndittlms t'o do fist knowe however, whether
osilhor of the &~egain lung Vovolum Prodused by then# doosoemnt. tao o
L ~ ~ h.A~* ~A * ALA A . ý A -A ,A . --A ý*~.*A A -A-A-A -A-~A*&A A,.A LA A LA - * A ".A .ABLA

It the U.s. nevy, pleeaary 02 toxatty b)cemeeos a£ co@ during
"toratime d4tviol partsd$ of I"$ deoompraelio, awd duriug treotmaet of
doesepresoae aickoees, The ourrost practice for determinino 02 lim9it
dopsdos es heeps to vital capaeity as predicted by the UPYD, Ve reviewed
Who In•fstl m"41 fom whisk the UPD acooapl t was derived end performed a
serdisated qpeetuhsve aiialyals that permitted ezplcit testing of
PStowsOf is the Medal, We eVWStSed S 6m1pl fted limeor predictive eqUatio
that relates P0 $ad tun of exposure to cheape in vital capacity$0
S £VC a -0.0I1(02 - O.5)(Wm)
where P7 tI $ives Is ATA and tim in minutes. As with the UPVD, the effect of
uIm tltv Meoouree teo be ealculatGd by aumming the effect predicted at each
level of P0 exposvre, elthough we point out that experiments hve not bee*2
dese to support the valdity of thin sumistion. We showed that Individual
susceptibility to the si0sle 16rget Pomree of variability accountins for 35%
of the uncertainty of any prediction.
48
10S

REFERENCES
1. Barber, RE, J Lee, and WK Bamiltoti. Oxygen toxicity in man: A
prospective study in patients with irreversible brain damage. New Engi J
Med 1970; 283:1,473-1,484.
2. Bardin, H. and CJ Lambertsen. A quantitative method for calculating
cumulative pulmonary oxygen toxicity. Use of the unit pulmonary toxicity
* ~dose (UPTD). Philadelphia: Institute for Environmental Medicine,
University of Pennsylvania; 1970.
3. Broussolle, B. Entex V: Experience de plongee profonde a 450 m avec 12
tours do sojour au fond. Rapport Final du Contrat, Direction des
Recherche* at Etudes Techniques, Marine Nationale 80/1,247.
Toulon/Navel, France: Ministers de Ia Defense; 1982.
4. Burger, 13, and 3 Mlead. Static properties of lungs after oxygen
exposure. J Appl Physiol 1969; 27:191-197.
5. Caldwell, PU,. UL Lea, Jr. US Schildkraut, and ER Archibald. Changes in
lung volume. diffusing capacity, and blood gases in men breathing oxygen.
J Appl Physiol 1966; 21(5):1,477-1,483.
6. Clark, 3M, and CJ Lambertsen. Pulmonary oxygen tolerance in map and
derivation of pulmonary oxygen tolerance curves. Institute for
Environmental Medicine Report No. 1-70. Philadelphia: Institute for
* Environmental Medicine, University of Pennsylvania; 1970.
7. Clark, 3M, and CJ Lambertsen. Rate of development of pulmonary 0 2
toxicity in man during 0 2 breathing at 2.0 ATA. J Appi t'hysiol 1971a;
30(5) :739-752.
8. Clark, JM, and CJ Lambertsen. Alveolar-arteri al 0 2 differences in man at
.2, 1, 2, and 3.5 ATA inspired P 0 3 Appi Physiol 1971b; 30(5):753-763.
49

9. Conroe, Jr, JR, RD Drippe, PR Duake, and M Deming. Oxygen toxicity. J
Am Med Assoc 1945; 128:710-717.
10. Dewar, IQS, G Smith, AA Spenee, and I McA Ledingham. Effect of hyperoxia
on airways resistance in man. J Appl Physiol 1972; 32:486-490.
11. Dolezal, V. The effect of longlasting oxygen inhalation upon respiratory
parameters in man. Physiol Bohemoslov 1962; 11:149-158.
12. Dougherty, JR, RL Fraye, DA Miller, and KE Schaefer. Pulmonary function
during shallow habitat air dives (SHAD I, II, I11). Underwater
Physiology V1. Bethesda, MD: Federation of American Societies for
Experimental Biology; 1978:193-204.
13. Dougherty, JR, and KE Schaefer. Pulmonary functions during saturation
excursion dives breathing air. Aeroep Med 1968; 39:289-292.
14. Dubois, AB, RW Hyde, and E Hendler. Pulmonary mechanics and diffusing
capacity following simulated space flight of 2 weeks duration. J Appl
Physiol 1963; 18(4):696-698.
15. Eckenhoff, RG. Data obtained by personal communication and presented in
tables 4A and 4B.
16. Fife, WP, RL Edwards, WW Schroeder, IrD Ferrari, and LR Freeberg. Effect
of the hydro-lab environment on pulmonary function. Hydro-Lab Journal
1973; 2:73-80.
17. Fisher, AB, RW Hyde, RJM Puy, JM Clark, and CJ Lambertsen. Effect of
oxygen at 2 atmospheres on the pulmonary mechanics of normal man. J Appl
Physiol 1968; 24(4):529-536.
18. Fisher, AB, AB DuBois, RW Ryde, DJ Knight, and CJ Lambertsen. Effect of
2 months undersea exposure to 2 -O2 at 2.2 ATA on lung function. J Appl
Physiol 1970; 28(l):70-74.
50

19. Osrdette, •, ad C Lainfr. VarMalooe do Is c1pacit. vital, en fonction
do Ia Quantite d*oxygme inhale, a, cours des decompre.sions. Revue do
Medecine Subaquatique et Hyperbare 1977; 61:66-69.
20. Hall, DA. The influence of the systematic fluctuation of P02 upon the
nature and rate of the development of oxygen toxicity in guinea pigs.
Philadelphia, PA: Univ., of Pennsylvania; 1967. Thesis.
21. Harabin, AL, and LE Farhi. Arterial hyperoxemia with tissue hypoxia
during exposure to 1001 02 at I ATA. Physiologist 1978; 21(4):50.
22. Harabin, AL, LD Homer, and HE Bradley. Pulmonary oxygen toxicity In
awake dogs: Metabolic and physiologic effects. J Appl Physiol Rsspir
Environ Exercise Physiol, 1984; 57(5):1480-1488.
23. Harrison, GA. Ultrastructural response of rat lung to 90 days exposure
to oxygen at 450 - HS. Aerosp Ned 1974; 45(9):1,041-1,045.
24. Rayatdavoudl, G, JJ O'Neil, BE Barry, BA Freeman, and JD Crapo.
Pulmonary injury following continuous exposure tZ 601 02 for 7 days. J
Appl Physiol Respir Environ Exercise Physiol 1981; 51:1,220-1,231.
25. Hendricks, FL, DA Hall, WL Hunter, Jr, and PJ Raley. Extension of
pulmonary 02 tolerance in man at 2 ATA by intermittent 02 exposure. J
Appl Physiol Respir Environ Exercise Physiol 1977; 42(4):593-599.
26. Hyacinthe, R, P Giry, and B Broussolle. Evolution of vital capacity and
lung diffusing capacity for CO in eight subjects after a 450 meters
simulated dive. Medecine Aeronautique et Spatiale Medecine Subaquatique
et Hyperbare 1981; 20:77-80.
27. Kapanci, Y, R Tosco, J Eggeruann, and VE Gould. Oxygen pneumonitis in
man: Light and electron microscopic morphometric qtudies. Chest 1972;
62: 162-169.
51

20. Kapanciit, %R woositb WV Koplao, snd n3 moinsov. Pathogeesis and
raveastbility of the pulamnary lesionus of oxygon toxicity to wmynk~..
It. ULtrestructural &ad miorphomstric studieso. Lab lovest 19691
20(1)s 101.1 iS
29. Kaplan, 31, n3 Robtnaso, T Kapanct, and IS Vaibal. Pathopmenuis and
reversibility of the pulamiary, leatove of oxygan tosicity in waokeys. 1,
Clinical sod light, ficroosic~ studies. U6b lowest 1%919 2Os04-99.
30. Mastter, 06, M3. Ca~dvall, sod 11 VotbsI. glectrom sieroso4~mic sad
sophometvic study of rat lunge exponod to 97Z oxygas at 250 tort (27,000
fast). Aerosnpace Madiral Iiaeach Laboratories leport
AWRL-Th-66-103. WErisht'matteraon Ali For"n Sant, Malo Asroopao a MdtIc
Divisipn. AiT force System. Comndj 1966.
31. Kistler, 06, M3. Caldvell, and 11 Vatbal. Davolopmetu of fine structural
damage to alveolar sod capillary Uivsigals "Ie to xYsm-Paisned rat
lungs. J Call 31.1 19671 M3605462S,
32. Lemialre, C. Dotermitistios du taux d'hyparosie sasoeptalle pour too
PlMONgs am Ion$ Mors per Is easure do Is capasite vitals.
19751 Hadectae Aeroneutique at Spatial. Iledecinae Subaquagique ot
Nyperbare 19751 12162-16.
33. blatalon. 1, HS Nesarejab. and LZ ForbM. Pulemoary and airoulatory
chsangs in conscious oheep arnposed to 1001 02 at 1 ATA. J Appl 7hysiol
19521 M3110-116.
34. Nichol, IL, IM Langovin, nnd CY Gall. If feet of continuous hby""
exposure to oxygen tensions of 416 w Nil for 161 h. Asroop Ned 19601
31M13-144.
35. Morgan, TZ, T Ulvedal, and It Welch. Observations i" the BAN two-meu
spacs cablo oimulotor. 11. SLouwdicol stteG~. Aaroop Ha~d 19611
320591-601.
52
36. Morgan, TE, IJ Cutler, F.S Shaw, I 11lvedal, JJ Iiargreaven, JE Moyer, RE
McKenzie, and If Welch. ?hysiologic effects of exposure tn IPcreamed
oxygen tensioo at 5 pot$. Aeroap Hed 1963a& 340720-726.
37. Morgan, TE, F Ulved.l, LJ Cutler, and BE Welch. Effects cm mar of
prolonjed exposure to oxygen at a total pressure of 190 M 14H. Aeroop
Mod 1963b; 390589-592.
35. Noselbi, No SH Abdallaho and TM Asab,. Pulmonary functio Ip men vith
intermittnt long-ters exposure to hyperbaric oxygen. Undersea Homed
Res 19501 7u149-157.
39. Navy, Departmnt of. U.S. Navy Diving Manuals. Washington, D.C.: Dept.
of the Navy; 19755 Vol. 1, Chapt. S. Available froml Naval Sea Systems
coalind, Washointon. D.C.; 0094-LP.001-9010.
40, Obleson, hilL. A study on oxygen toxicity at atmoapheric pressures. Act&
Mad Seasd 1947; 126(luppl 190):l-93.
41. Puy, RIJM AN Nyde, AS 1limer, 3M Clark, J Dicksoon and CJ Lambertoep.
Alterations In the pulmonary capillary bed during early 02 toxicity in
ano. J App Phytsiol 19681 24(4)1537-543.
42. Rahe, No, WO Feon, and AS Otis. Daily variations of vital capacity,
residual air, and expiratory reserve includia& a study of the residual
air method. J Appi Physlol 19491 1(lO)1725-736.
63. Robertson, W0, JJ Marlreavei, JS Norlocher, and It Welch. Physiologic
roponese to Increased oxygen partial pressure II. Respiratory studies.
Aeroap Hed 19641 35M6160622.
44. Van do Water, 3M, %I Kagey, IT Millsr, PA Parker, Nl O'Connor, JM Shah,
.D MacArthur, IH Zolliuger, and YD Moore. Respon,, of the lung to 6 to
12 hours of 100 percent oxygen inhslation in normal man. W Yngl J Mod
19701 2W5:621-626.
53

45. Widell, ?J, PD Sennett, P KivIin, and V Gray. Pulmonary oxygen toxicity
In man at 2 ATA vith Intermittent air breathing. Aerosp Med 1974;
45:407-410.
46. WidelI, PJ, AA Pilmatis, LW Chapman, VM Pilvanis, and RR Given.
Physiological effects of saturation diving: Oxygen toxicity, stress and
-fluid volm regu~lation. Vydro-Lab J 1973; 2<1):57-72.
'7. Volft. lE, LA Idbtmso. J? Morn, ad 33 Lowe. Naversible pulsonary
*"Son toxicity is the pr/ies". Arv Surg 1978; 188:530-543.
48. Wright, WS. Use of the Uiverality of Pennsylvonia, Institute for
loviroamatal Medicine procedure for calculation of cumulative pulmonary
oxymee toxicity. Naval ffMeriam•tal Divlug Unit Report No. 2-72.
Washi•gton, D.C.:a Navy Eqerlawta] Diving Unit; 1972.
49. Wright, VS, AD visher, FL Hendricks, JS Brody, aud CJ LUbertsen.
ulswonry foactiou studies durti•g a 14-day cootInuou es posure to 5.2% 02
in V2 at pressure equivalent to 100 fse (4 ATA). Aerosp Med 1973;
44s$37-843.
50. Wright, RA, RS Weiss, Z? Viatt, and JS Rustagi. Risk of mortality in
icterrupted exposure to 1002 02: Role of air vs. lowered P0 2. Am J
Physiol 19%6; 210:1,015-1,020.
A
54

APPENDIX 1. UPTD SSE Comparison
Linear regression on the 7 data points resulted in the following
equation:
X AVC - -0.0114 - UPTD + 5.60733
SThin linear model assumes a threshold effect: below a certain number of UPTDS
(approximately 492) there would be no change in VC predicted, We forced this
to be true by resetting any positive % AVC prediction to zero.
The data were also fit to a sigmoid curve of the general form:
1y=J
where x - number of UPTDs, and y - % AVC. The following parameters were
estimated: xSO * 4619, v - 1.86.
In calculating the UPTDs for each data point, when the exposures
PO2 ' 0.5 ATA, the predicted Z AVC was set to zero.
55

910,00)