seth s. kessler christopher t. dunn - metisdesign.com of lamb wave actuating and sensing materials...
TRANSCRIPT

Optimization of Lamb Wave Actuating and Sensing Materials for Health Monitoring of
Composite Structures
Seth S. KesslerChristopher T. Dunn
Mechanical Design • Composites Engineering • SHMhttp://www.MetisDesign.com
Technology Laboratory for Advanced CompositesDepartment of Aeronautics and Astronautics
Massachusetts Institute of Technology
National Reconnaissance OfficeOffice of Space Launch
Contract #: NRO000-02-C-0625

SPIE03 3/04/03 2
Program Goals• Motivations for SHM within NRO OSL
– hidden damage possible during manufacture and handling of spacecraft– lack of access to make quantitative measurements– detect/map extent of damage before and/or on the launch pad– facilitate launch/no-launch decisions
• Sensors/actuator optimization– increase reliable, robustness, signal strength of sensor/actuator– more efficient sensing schemes (architecture)– damage evaluation algorithms in MATLAB– large set of simple test results to compare, confirm, and tune
• Three areas of research– sensor/actuator development (MIT led)– testing (joint venture)– analysis and system design (MDC led)

SPIE03 3/04/03 3
Lamb Wave Methods• Form of elastic perturbation that propagates in a solid medium
– actuation parameters determined from governing equations– excite Ao wave for long travel distances and to minimize clutter
• Damage can be identified in several ways– group velocity approximately ∝ (E/ρ)1/2, damage slows down waves– reflected wave from damage can be used to determine locations
• Research uses piezoelectric actuators/sensors to detect energy present in transmitted and reflected waves, builds off prior research
Piezoceramic Actuator
Piezoceramic Sensors

SPIE03 3/04/03 4
Sensors Material Analysis
• Use 3-1 piezoelectric coupling properties to output an open circuit voltage in response to strain wave
• Desirable attributes
– maximize where d31 is the 3-1 piezoelectric “strain” coefficient and k31 is the 3-1 coupling coefficient
– minimum stiffness to maximize strain of wave passing though it– length of (1 + n / 2)*λ where λ is the wavelength and n = 0,1,2,3,…– capacitance such that 1 MΩ (oscilloscope impedance) appears as an
open circuit to the sensor
( )23131
231
1 kdk−

SPIE03 3/04/03 5
Sensors Material Comparison
• Chart compares figure of merit for available PZT
• Separate analysis performed for PVDF
• Candidate materials which were selected to test broad range– EBL#5– EBL#1– EBL#2– EBL#23– EBL#3
Material k31 d31 g31 Y11D | (k31)2/(d31 (1 - (k31)2) |
(-) (p m / V) (mV m / N) (GPa) V / (mm µε)PZT-7A -0.300 -60 -16.2 104 1.65EBL#5 -0.300 -60 -16 103 1.65EBL#1 -0.360 -127 -10.7 106 1.17EBL#7 -0.330 -107 -10.9 104 1.14EBL#4 -0.310 -95 -10.5 110 1.12PZT-8 -0.350 -127 -12.2 89 1.10PZT-4 -0.340 -125 -10.6 91 1.05EBL#9 -0.340 -135 -10.5 92 0.97PZT-7D -0.300 -112 -9.6 94 0.88PZT-5R -0.385 -200 -11.5 75 0.87EBL#2 -0.360 -173 -11.5 76 0.86PZT-5B -0.380 -210 -10.1 79 0.80PZT-5A -0.343 -177 -11.1 71 0.75EBL#23 -0.440 -320 -9 79 0.75PZT-5J -0.375 -230 -9.8 73 0.71EBL#3 -0.380 -262 -8.6 75 0.64PZT-5H -0.375 -264 -8.9 69 0.62EBL#6 -0.370 -260 -9.8 57 0.61PZT-5M -0.370 -270 -7.6 78 0.59EBL#25 -0.300 -179 -11 49 0.55PZT-5K -0.380 -323 -6.9 73 0.52
PT2/PC6 -0.030 -3 -2.1 135 0.30

SPIE03 3/04/03 6
Actuator Material Analysis
• Uses 3-1 piezoelectric coupling properties to output a strain wave in response to voltage
• Desirable attributes– maximize the strain per volt induced in the structure, P=2πfCV2
– maximize where eP is the planar piezoelectric “stress” coefficient, hP and Q are the thickness and stiffness of the actuator, and hS and cP are the thickness and stiffness of the structure
– minimize the power delivered by the function generator by minimzingthe admittance
where kP is the planar coupling coefficient and εP the planar permittivity– resonant actuators also considered, but low frequencies required large
dimensions (3-4” for 25 kHz) and had narrow range (250 Hz PZT-5A)
( ) ( ) sPPP
P
hQQhcce
12111211
31
+++
( )( ) ( )
++++
SPPP
PP
P
P
hQQhcckc
h 12111211
211
3321ε
SPIE03 3/04/03 7
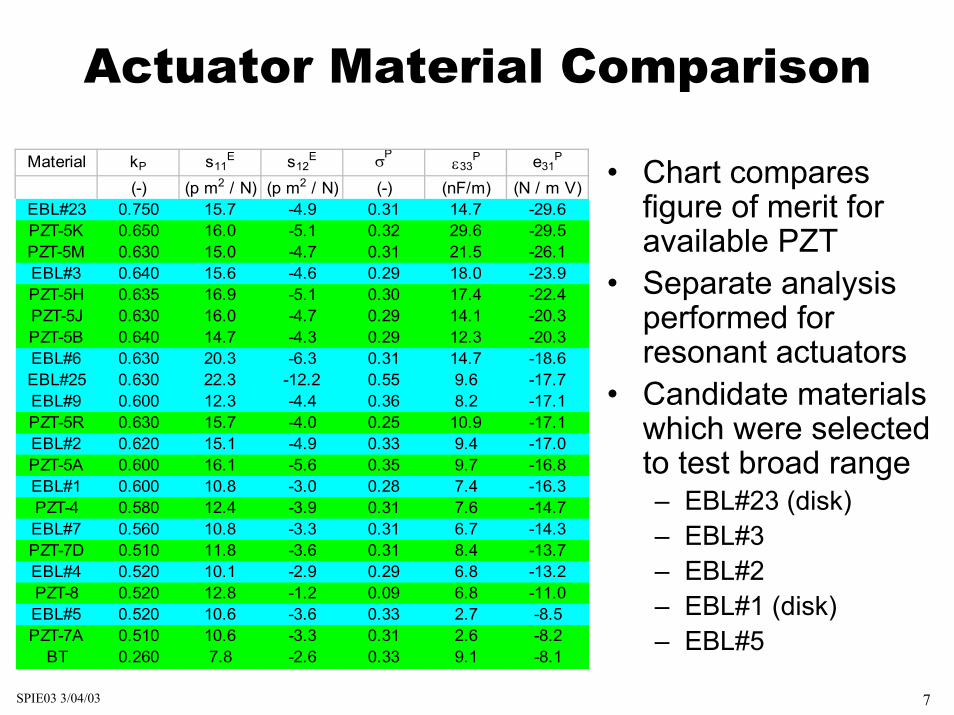
Actuator Material Comparison
• Chart compares figure of merit for available PZT
• Separate analysis performed for resonant actuators
• Candidate materials which were selected to test broad range– EBL#23 (disk)– EBL#3– EBL#2– EBL#1 (disk)– EBL#5
Material kP s11E s12
E σPε33
P e31P
(-) (p m2 / N) (p m2 / N) (-) (nF/m) (N / m V)EBL#23 0.750 15.7 -4.9 0.31 14.7 -29.6PZT-5K 0.650 16.0 -5.1 0.32 29.6 -29.5PZT-5M 0.630 15.0 -4.7 0.31 21.5 -26.1EBL#3 0.640 15.6 -4.6 0.29 18.0 -23.9PZT-5H 0.635 16.9 -5.1 0.30 17.4 -22.4PZT-5J 0.630 16.0 -4.7 0.29 14.1 -20.3PZT-5B 0.640 14.7 -4.3 0.29 12.3 -20.3EBL#6 0.630 20.3 -6.3 0.31 14.7 -18.6EBL#25 0.630 22.3 -12.2 0.55 9.6 -17.7EBL#9 0.600 12.3 -4.4 0.36 8.2 -17.1PZT-5R 0.630 15.7 -4.0 0.25 10.9 -17.1EBL#2 0.620 15.1 -4.9 0.33 9.4 -17.0PZT-5A 0.600 16.1 -5.6 0.35 9.7 -16.8EBL#1 0.600 10.8 -3.0 0.28 7.4 -16.3PZT-4 0.580 12.4 -3.9 0.31 7.6 -14.7EBL#7 0.560 10.8 -3.3 0.31 6.7 -14.3PZT-7D 0.510 11.8 -3.6 0.31 8.4 -13.7EBL#4 0.520 10.1 -2.9 0.29 6.8 -13.2PZT-8 0.520 12.8 -1.2 0.09 6.8 -11.0EBL#5 0.520 10.6 -3.6 0.33 2.7 -8.5PZT-7A 0.510 10.6 -3.3 0.31 2.6 -8.2
BT 0.260 7.8 -2.6 0.33 9.1 -8.1
SPIE03 3/04/03 8
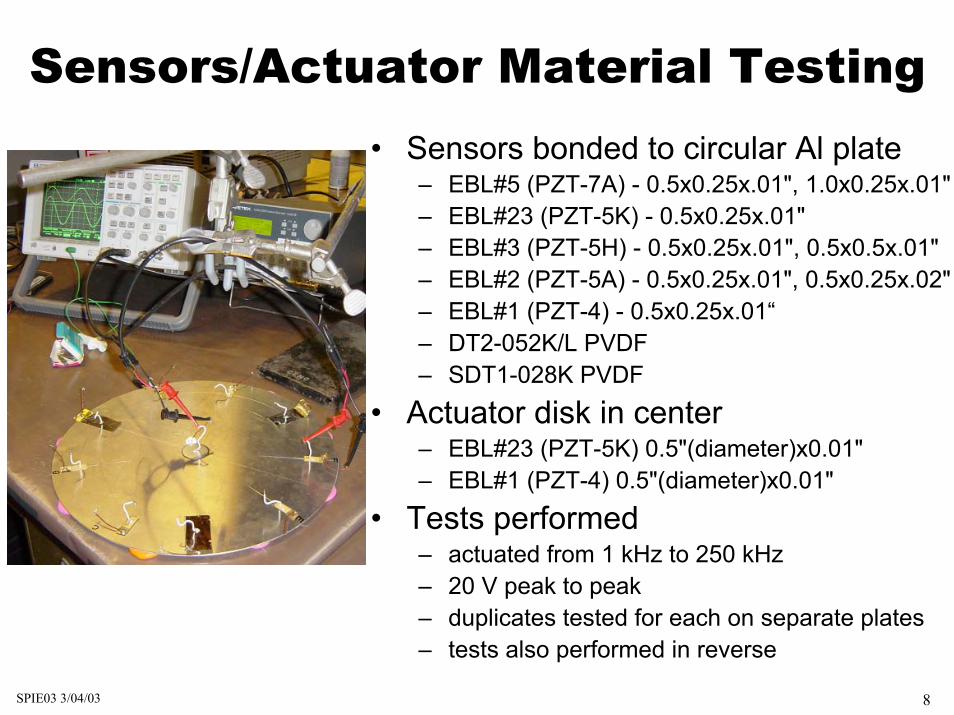
Sensors/Actuator Material Testing• Sensors bonded to circular Al plate
– EBL#5 (PZT-7A) - 0.5x0.25x.01", 1.0x0.25x.01"– EBL#23 (PZT-5K) - 0.5x0.25x.01" – EBL#3 (PZT-5H) - 0.5x0.25x.01", 0.5x0.5x.01"– EBL#2 (PZT-5A) - 0.5x0.25x.01", 0.5x0.25x.02"– EBL#1 (PZT-4) - 0.5x0.25x.01“– DT2-052K/L PVDF– SDT1-028K PVDF
• Actuator disk in center– EBL#23 (PZT-5K) 0.5"(diameter)x0.01"– EBL#1 (PZT-4) 0.5"(diameter)x0.01"
• Tests performed– actuated from 1 kHz to 250 kHz– 20 V peak to peak– duplicates tested for each on separate plates– tests also performed in reverse

SPIE03 3/04/03 9
Sensors Material Results
0
10
20
30
40
50
60
70
PZT4 PZT5A PZT5Athick
PZT5H PZT5Hwide
PZT5J PZT7A PZT5K DT2-052K/L
SDT1-028K
Ampl
itude
of s
ense
d si
gnal
(mV)
MaxAvgMin
• PZT-5A, PZT-5H, PZT-5J, PZT-5K all comparable maximums• PZT-5A and PZT-5J have highest means and minimums• PZT-5A selected because of bandwidths of maximum peaks
SPIE03 3/04/03 10
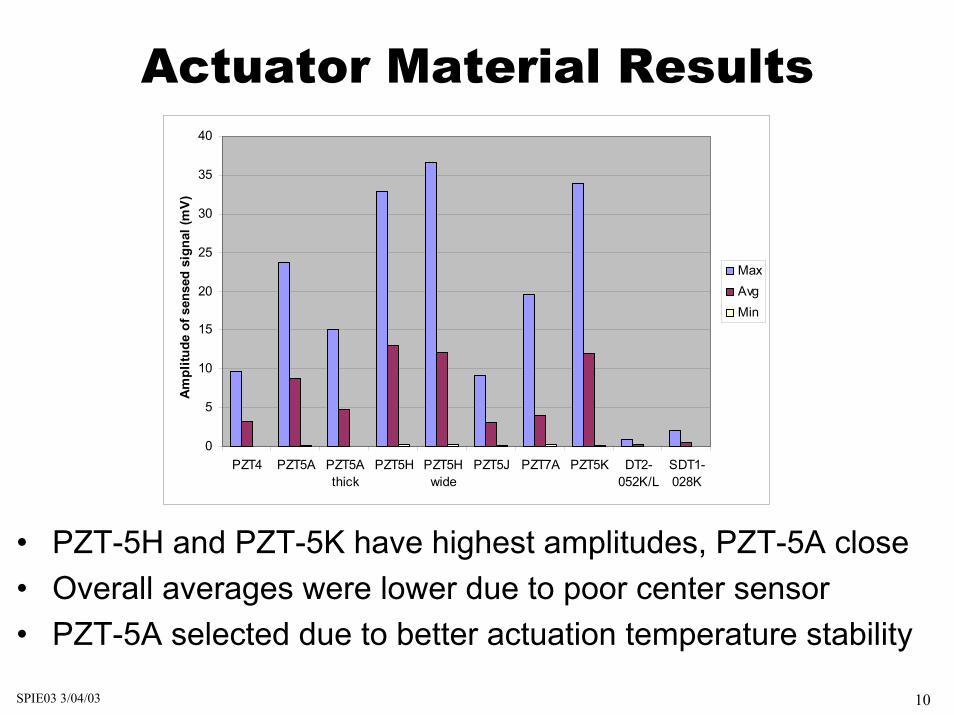
Actuator Material Results
0
5
10
15
20
25
30
35
40
PZT4 PZT5A PZT5Athick
PZT5H PZT5Hwide
PZT5J PZT7A PZT5K DT2-052K/L
SDT1-028K
Ampl
itude
of s
ense
d si
gnal
(mV)
MaxAvgMin
• PZT-5H and PZT-5K have highest amplitudes, PZT-5A close• Overall averages were lower due to poor center sensor• PZT-5A selected due to better actuation temperature stability
SPIE03 3/04/03 11
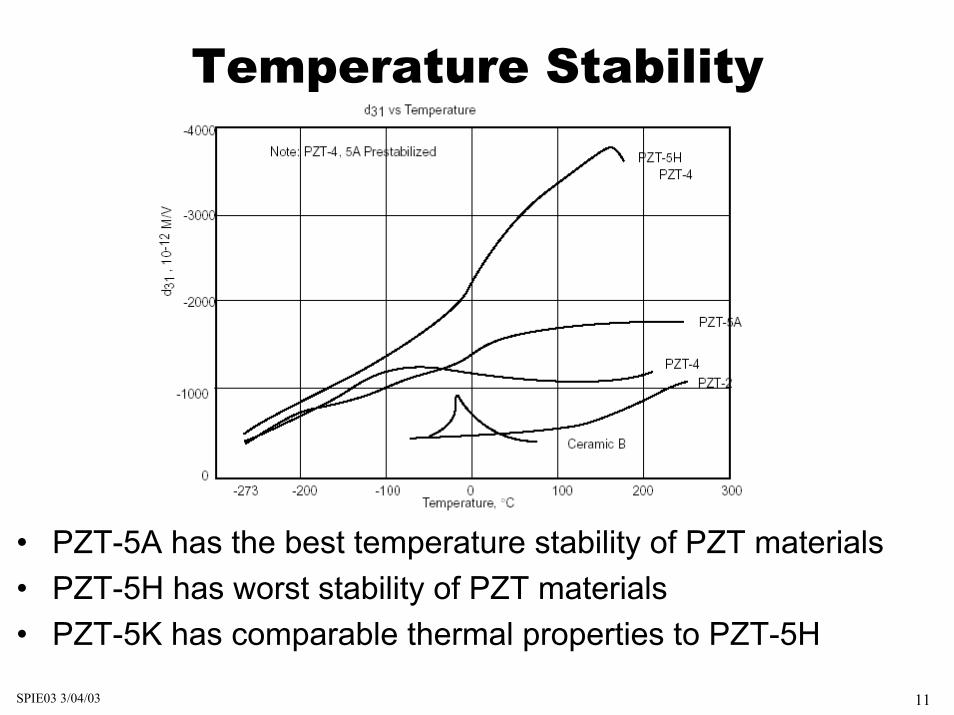
Temperature Stability
• PZT-5A has the best temperature stability of PZT materials• PZT-5H has worst stability of PZT materials• PZT-5K has comparable thermal properties to PZT-5H

SPIE03 3/04/03 12
Electrical/Mechanical Connections• Electrical connections
– provide an electrical path to the underside of the piezoelectric wafers– minimize in-plane stiffness E*t to maximize actuation (consider tearing)– reasonable through-thickness conductivity (resistance less than 1Ω)
• Mechanical connections– adhere piezoelectric wafer assembly to the structure– low application temperature, removable without damaging the structure– uniform thickness to reduce variability in surface mounting– must minimize G/t to maximum actuation
• Brass alloy 260 chosen for bottom electrode – 1 mil. thick shim stock used for conductor– 81% less stiff than copper shim used previously
• 3M 9703 electrically conductive double-sided tape chosen– used to adhere to brass and structure, non-conductive version available– 2 mil. thick chosen for adhesive– smoother and more repeatable than Ag epoxy

SPIE03 3/04/03 13
Piezoelectric Wafer Dimensions and Waveforms
• Actuator and sensor lengths – chosen to be 0.5” based upon equations for 15 kHz actuation– could be either length or diameter
• Actuator and sensor configuration– concentric disk/ring chosen for sensor/actuator, common ground– experiments demonstrated highest amplitudes with this setup– yields less electrical noise than “self-sensing” concepts
• Optimal actuation waveform – 15kHz chosen based on previous work– 3.5 sine waves w/Hanning window, will also collect data for 5.5 waves
Sent Signal

SPIE03 3/04/03 14
Actuator/Sensor Schematic
Sensor
Actuator
Electrically conductive tape
Brass shim stock
Electrically conductive tape
Complete sensor/actuator
SPIE03 3/04/03 15
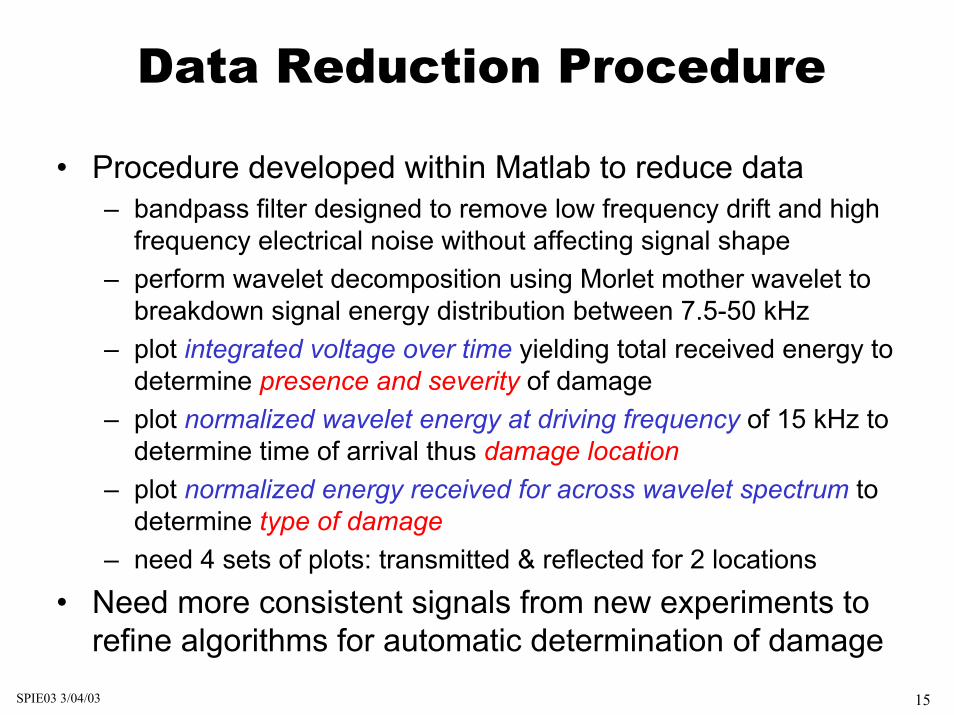
Data Reduction Procedure
• Procedure developed within Matlab to reduce data– bandpass filter designed to remove low frequency drift and high
frequency electrical noise without affecting signal shape– perform wavelet decomposition using Morlet mother wavelet to
breakdown signal energy distribution between 7.5-50 kHz– plot integrated voltage over time yielding total received energy to
determine presence and severity of damage– plot normalized wavelet energy at driving frequency of 15 kHz to
determine time of arrival thus damage location– plot normalized energy received for across wavelet spectrum to
determine type of damage– need 4 sets of plots: transmitted & reflected for 2 locations
• Need more consistent signals from new experiments to refine algorithms for automatic determination of damage

SPIE03 3/04/03 16
Experimental Results –Controls I
0 100 200 300 400 500 600 700 800 900 1000-0.1
0
0.1si
gnal
s (V
)
0 100 200 300 400 500 600 700 800 900 10000
10
20
tota
l ene
rgy
(ms)
0 5 10 15 20 25 30 35 40 45 500
0.5
1
peak
freq
(kH
z) 0 100 200 300 400 500 600 700 800 900 10000
0.5
1
ener
gy a
rriva
l
• Highly reproducible signal between same set of actuators and sensors tested several times
SPIE03 3/04/03 17
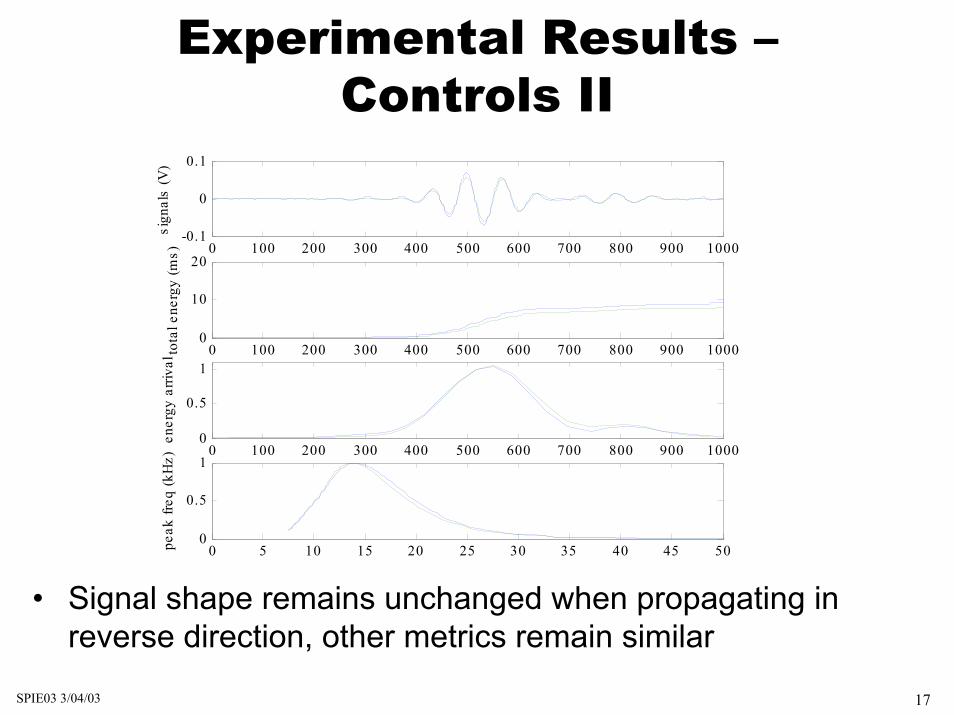
Experimental Results –Controls II
0 100 200 300 400 500 600 700 800 900 1000-0.1
0
0.1si
gnal
s (V
)
0 100 200 300 400 500 600 700 800 900 10000
10
20
tota
l ene
rgy
(ms)
0 5 10 15 20 25 30 35 40 45 500
0.5
1
peak
freq
(kH
z) 0 100 200 300 400 500 600 700 800 900 10000
0.5
1
ener
gy a
rriva
l
• Signal shape remains unchanged when propagating in reverse direction, other metrics remain similar

SPIE03 3/04/03 18
Experimental Results –Controls III
0 100 200 300 400 500 600 700 800 900 1000-0.1
0
0.1si
gnal
s (V
)
0 100 200 300 400 500 600 700 800 900 10000
10
20
tota
l ene
rgy
(ms)
0 5 10 15 20 25 30 35 40 45 500
0.5
1
peak
freq
(kH
z) 0 100 200 300 400 500 600 700 800 900 10000
0.5
1
ener
gy a
rriva
l
• Similar response across several different pairs of equally spaced actuators/sensors on same plate

SPIE03 3/04/03 19
Experimental Results –Controls IV
0 100 200 300 400 500 600 700 800 900 1000-0.1
0
0.1si
gnal
s (V
)
0 100 200 300 400 500 600 700 800 900 10000
10
20
tota
l ene
rgy
(ms)
0 5 10 15 20 25 30 35 40 45 500
0.5
1
peak
freq
(kH
z) 0 100 200 300 400 500 600 700 800 900 10000
0.5
1
ener
gy a
rriva
l
• Similar response between pairs of actuators/sensors located on several undamaged plates

SPIE03 3/04/03 20
Experimental Results –Delamination
0 100 200 300 400 500 600 700 800 900 1000-0.1
0
0.1si
gnal
s (V
)
0 100 200 300 400 500 600 700 800 900 10000
10
20
tota
l ene
rgy
(ms)
0 5 10 15 20 25 30 35 40 45 500
0.5
1
peak
freq
(kH
z) 0 100 200 300 400 500 600 700 800 900 10000
0.5
1
ener
gy a
rriva
l
• Delaminated signal is time-lagged, and has slightly lower energy content. Frequency bandwidth remains similar

SPIE03 3/04/03 21
Experimental Results –Microcracks
0 100 200 300 400 500 600 700 800 900 1000-0.1
0
0.1si
gnal
s (V
)
0 100 200 300 400 500 600 700 800 900 10000
10
20
tota
l ene
rgy
(ms)
0 5 10 15 20 25 30 35 40 45 500
0.5
1
peak
freq
(kH
z) 0 100 200 300 400 500 600 700 800 900 10000
0.5
1
ener
gy a
rriva
l
• Some matrix cracking caused a slight time delay, less tail energy and a small shift to a higher frequency bandwidth
SPIE03 3/04/03 22
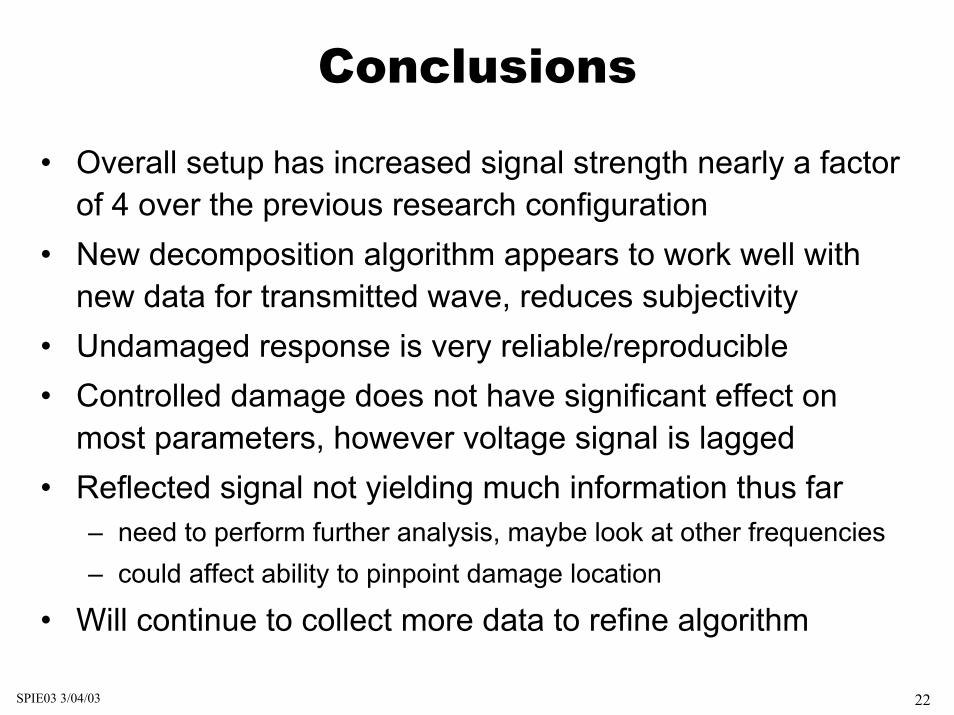
Conclusions
• Overall setup has increased signal strength nearly a factor of 4 over the previous research configuration
• New decomposition algorithm appears to work well with new data for transmitted wave, reduces subjectivity
• Undamaged response is very reliable/reproducible• Controlled damage does not have significant effect on
most parameters, however voltage signal is lagged• Reflected signal not yielding much information thus far
– need to perform further analysis, maybe look at other frequencies– could affect ability to pinpoint damage location
• Will continue to collect more data to refine algorithm

SPIE03 3/04/03 23
Future Recommended Research• Collect data on several plate specimens to refine algorithms• Collect data for beam specimens with various core E and t’s• Continue studies on other potential detection methods
– acoustic emission– eddy current
• Research focusing on other SHM components– wireless data acquisition and signal propagation– powering devices
• Increase complexity of tests– test on built up section – test in service environment (natural, mechanical, electrical noise)– use multiple sensing methods at once to increase reliability– integrate multiple SHM components