seta survey of representatives in tribunal cases 2008 ... · pdf fileseta survey of...
TRANSCRIPT

SETA survey of representatives in Tribunal cases 2008
2014
Joe Dromey (IPA)
Research Paper
MacLeod and Clarke’s Concept of Employee Engagement: An Analysis based on the Workplace Employment Relations Study
Ref: 08/14

ISBN 978-1-908370-50-1
For any further information on this study, or other aspects of the Acas Research and Evaluation programme, please telephone 020 7210 3673 or email [email protected]
Acas research publications can be found atwww.acas.org.uk/researchpapers

MacLeod and Clarke’s Concept of Employee Engagement: An Analysis based on the Workplace Employment Relations Study
2014
Joe Dromey

2
Prepared for Acas by:
Joe Dromey Head of Policy and Research IPA 2nd Floor, West Wing Somerset House Strand London, WC2R 1LA Acknowledgements
The author would like to thank Acas for funding this project and in particular to Rachel Pinto and Gill Dix for their support.
We would like to thank Kerstin Alfes of Tilburg University and Amanda Shantz of the School of HRM, York University, Canada who carried out the majority of the data analysis for this project.
Thanks to the CIPD for providing access to the Employee Outlook data.
The Workplace Employment Relations Study (WERS) was conducted by NatCen Social Research on behalf of the Department for Business, Innovation and Skills, the Economic and Social Research Council, the UK Commission for Employment and Skills, the Advisory, Conciliation and Arbitration Service and the National Institute of Economic and Social Research. The data was distributed by the UK Data Archive at the University of Essex.
Disclaimer
This report contains the views of the authors and does not represent the views of the Acas Council. Any errors or inaccuracies are the responsibility of the authors alone.

3
About the IPA
The IPA exists to promote the involvement and participation of employees in their places of work, and through doing so improve the quality of working lives. The IPA is Britain’s leading organisation delivering partnership, consultation and employee engagement in the workplace. Through our research and practice we develop new ways of working, based on trust and collaboration that deliver better workplaces and better outcomes – employee wellbeing, increased productivity and improved services.
The IPA is a not-for-profit organisation, funded by membership subscriptions and fee income from consultancy, training and research services.
We are one of the few ‘open spaces’ in the UK where employers, trade unionists and other workplace representatives, academics, legal experts, human resource and employment specialists can come together with politicians and policy makers to discuss and debate employment issues and policy.
www.ipa-involve.com

4
CONTENTS
1. Executive Summary 5
2. Introduction 7
3. The enablers of employee engagement in WERS 9
4. Employee engagement and its enablers over time 13
5. Who is engaged? 23
6. Employer actions and engagement – what works? 29
7. Engagement and organisational performance 33
8. Conclusion 35
Appendix 1 – Bibliography 38
Appendix 2 - List of tables and graphs 39
Appendix 3 – Regression analysis tables 40

5
1. EXECUTIVE SUMMARY
Employers have increasingly come to recognise the importance of employee engagement over recent years. This was in part driven by the MacLeod Report ‘Engaging for Success: Enhancing performance through employee engagement’ of 2009. In the report, David MacLeod and Nita Clarke argued that employee engagement was absolutely fundamental for organisational success. They put forward four enablers of employee engagement, factors that were “commonly agreed to lie behind successful engagement approaches” (MacLeod and Clarke, 2009, p33). These were a strategic narrative, engaging managers, employee voice and integrity.
We used the Workplace Employment Relations Study (WERS) to examine the enablers of engagement, how they have changed over time and how they vary across organisations and groups of employees. We also looked at how employer actions relate to the enablers of engagement, and the outcomes associated with them.
Employee perceptions relating to each of the enablers of engagement seem to have improved from 2004 to 2011, the period from the previous WERS to the most recent, with a particularly strong improvement in the strategic narrative enabler. This is a welcome if surprising finding given the turmoil in the labour market during the period, which included a severe recession. We also found significant improvements in organisational commitment, discretionary effort and sense of achievement in the job, three measures often used as indicators of engagement. Given the rises in both the enablers of engagement and these indicators, it appears that there has been some progress in terms of employee engagement across this period.
There are significant variations in terms of the enablers of engagement by industry and sector. Employees working in the public sector score lower on the enablers than those working in the private or third sectors. There is also significant variations by the size of the employer. Employees in large organisations score lower both on the enablers and on organisational commitment than those in smaller organisations.
There are also significant variations by employee group. Women score higher on each of the enablers than men. Older employees appear to score lower on the enablers of engagement than younger workers. There is a particularly stark and worry gap in terms of disability – employees with a disability score far lower both on the enablers of engagement and organisational commitment.
Employer actions seem to really make a difference to the presence of engagement enablers. Levels of voice are higher in organisations where there are meetings between employees and senior managers, particularly when employees are given the opportunity to raise questions or offer views.
There is growing evidence that links employee engagement to organisational success and this study of the WERS dataset adds to this. We found that at organisations with higher scores on the enablers of engagement, employers tended to be more positive about both labour productivity and financial performance.

6
The findings provide some key lessons for employers and for those interested in employment relations. First, the evidence of the link between the enablers of engagement and labour productivity and financial performance should further convince employers that engagement matters. Organisations with high levels of engagement also tend to have high levels of performance. Effectively engaging with staff should therefore be seen as a priority for employers.
Given the importance of engagement, the evidence of significant variations among groups of employees should act as a warning-call. Employers should ensure they have robust procedures for measuring engagement, and that they can identify, understand and address any gaps there might be.
Employers also need to ensure that they offer meaningful opportunities for engagement. One in two employees agree that managers are ‘good’ or ‘very good’ at seeking their views but only one in three say they are ‘good’ or ‘very good’ at allowing them to influence decision-making. Employees who rate their influence as low also tend to be far less satisfied with their influence. Contact between senior managers and frontline employees seems to be important for giving employees a sense of voice. Opportunities for engagement need to be in the category of meaningful contact between leaders and employees, with opportunities to ask questions, raise concerns and offer suggestions.
To be most effective in terms of ‘voice’ as an enabler, employers need to ensure that they engage employees in a genuine way which promotes dialogue and involvement rather than simply one way communication. The increasing use of email as a means of communication with employees in this context is a concern as it offers very limited opportunities for genuine interaction.

7
2. INTRODUCTION
2.1 MacLeod and Clarke’s concept of Employee Engagement
There has been a surge of interest in employee engagement in the last few years. Employers are increasingly aware of the importance of engagement for organisational success, and the need to measure engagement and to take steps to improve it. The MacLeod report – Engaging for Success – published in 2009 can be seen as a significant factor in driving this interest (MacLeod and Clarke, 2009). Commissioned by the previous government and written by David MacLeod and Nita Clarke, the report has been highly influential in the sphere of employee relations.
The MacLeod and Clarke work was based on a review of existing literature on engagement, as well as discussions with experts and numerous case studies. In their extensive report, MacLeod and Clarke identified a series of positive outcomes associated with engagement – both for employees, for employers and for the country as a whole. They also sought to highlight the factors that were “commonly agreed to lie behind successful engagement approaches” (MacLeod and Clarke, 2009, 33). They called these the ‘enablers’ of engagement. These four enablers, listed below, have gone on to be highly influential as a method for framing much of the subsequent work on engagement.
Strategic narrative
Engaging managers
Employee voice
Integrity
It is important to note that there are a wide variety of approaches to engagement and indeed definitions of the term. Some see engagement as a state of mind among employees. Others see it as being about the actions of employees. As Purcell explains, “engagement is a combination of attitude and behaviour. The attitude is ‘commitment’, and the behaviour is ‘going the extra mile’” (Purcell, 2010,3). Others see engagement in terms of an employer’s actions; an approach to working with employees or something that is “done to” employees (Alfes et al, 2010, 4). The definition in the MacLeod report tends to lean towards the latter but also references the former. Drawing on David Guest’s definition, it describes engagement as:
“A workplace approach designed to ensure that employees are committed to their organisation’s goals and values, motivated to contribute to organisational success, and are able at the same time to enhance their own sense of well-being.” (MacLeod and Clarke, 2009, 9)
In this study we attempt to address all of these aspects. We look at engagement in terms of attitudes (commitment, job satisfaction etc.) as well as behaviour (willingness to put in discretionary effort). We also look at employer approaches to engaging with employees – the various different methods of communicating

8
with and involving staff in workplace issues – and how they relate to employee perceptions.
2.2 The Workplace Employment Relations Study
The Workplace Employment Relations Study (WERS) offers a good opportunity to examine the state of employee engagement in the British labour market, and to test the assumptions of MacLeod and Clarke.
Findings from the 2011 WERS were released in 2013 (van Wanrooy et all 2013 a and van Wanrooy et all 2013 b). The largest study of its kind in the GB, WERS 2011 included interviews with almost 22,000 employees across 2,680 workplaces. In each workplace, an interview was conducted with employees, employee representatives (if present), and the most senior manager who deals with employment relations, human resources or personnel and staff at the workplace. With interviews conducted between March 2011 and June 2012, WERS allows us to examine the impact of the recession on employment relations and on engagement.
The aim of this research paper is to explore MacLeod and Clarke’s four drivers of employee engagement. Primarily based on statistical analysis of WERS 2011, it also draws on a literature review of research into employee engagement.
It uses the 2011 WERS to look at how engagement and its enablers have changed since 2004 when the last WERS survey was conducted. It explores the link between the enablers of engagement and indicators of engagement. These are the factors commonly associated with engagement such as discretionary effort, loyalty and job satisfaction. The research then looks at variations in engagement in the labour market; both by employer characteristics and by personal characteristics. We then look at associations between engagement and other positive outcomes that can be found in WERS. Finally, based on the findings, we make some recommendations as to how employers could most effectively engage employees in their workplace.

9
3. THE ENABLERS OF EMPLOYEE ENGAGEMENT IN WERS
3.1 The enablers of engagement
As explained above, MacLeod and Clarke outlined what they saw as the ‘enablers’ of employee engagement in the MacLeod Report of 2009. Based on their research and extensive observations, the enablers were identified as the factors that lie behind effective engagement. Get these right, they argued, and employee engagement will follow. The enablers are summarised below. We have also set out the questions from the Workplace Employment Relations Study (WERS) that we have used to examine the enablers.
3.1.1 Strategic narrative
The first enabler of employee engagement is the ‘strategic narrative’. This is defined as “a strong, transparent and explicit organisational culture which gives employees a line of sight between their job and the vision and aims of the organisation” (MacLeod and Clarke 2009, 31). They emphasise the role for leadership in setting out this strategic narrative, ensuring that employees understand it and can see how their role contributes towards it. The narrative should also be reflected in a strong organisational culture and ways of working.
To examine the ‘strategic narrative’ enabler in WERS, we have used the question on the extent to which employees agreed with the statement “I share the values of my organisation”. This represents a relatively good fit with MacLeod and Clarke’s description of the strategic narrative as it implies both understanding of and identification with the values of the employer.
3.1.2 Engaging managers
The second enabler of employee engagement is ‘engaging managers’. MacLeod and Clarke defining engaging managers as follows:
“Engaging managers who offer clarity, appreciation of employees’ effort and contribution, who treat their people as individuals and who ensure that work is organised efficiently and effectively so that employees feel they are valued, and equipped and supported to do their job.” (ibid, 31)
They go on to explain that engaging managers “facilitate and empower rather than control or restrict their staff” and that they “treat their people as individuals, with fairness and respect and with a concern for the employee’s wellbeing” (ibid, 75, 81). They emphasise the importance of this, saying that the relationship with the line manager is the most important at work, and observing that ‘people join organisations, but they leave managers’ (ibid, p80).
Thus the definition covers a series of behaviours, approaches, and actions that are focused on supporting employees, engaging them and getting the most out of them whilst also promoting employee wellbeing. To examine this enabler, we have chosen the question “in general, how would you describe relations between

10
managers and employees here?” Though it is a relatively general question, it broadly covers the ‘engaging managers’ enabler.
3.1.3 Employee voice
The third enabler of employee engagement is ‘employee voice’. This is described as follows:
“Employees’ views are sought out; they are listened to and see that their opinions count and make a difference. They speak out and challenge when appropriate. A strong sense of listening and responsiveness permeates the organisation, enabled by effective communication.” (ibid, 75)
So this is not just employees speaking up, but the employers actively encouraging them to do so, considering their views and acting on them where possible. They distinguish between individual and collective voice – both of which are seen as important to engagement.
The employee voice enabler is well-served in terms of questions in WERS. Employees are asked how good managers in the workplace are at each of the following. All of these have been included in our analysis:
“seeking the views of employees or employee representatives”
“responding to suggestions from employees or employee representatives”
“allowing employees or employee representatives to influence final decisions”.
Finally, we also look at the responses to the question “overall, how satisfied are you with the amount of involvement you have in decision-making at this workplace?” These questions therefore cover both the extent to which managers seek employees’ views, their responsiveness to them, the ability of employees to influence decision-making, and their satisfaction with this.
In addition to reporting on these questions individually, we also combined them into an employee voice index which provides a comprehensive and robust measure of the employee voice enabler. Each of the questions were based on a five point Likert scale, as follows:

11
Table 3.1 Calculating the WERS employee engagement enabler index
Question Response Score Very good 5 Good 4 Neither good nor poor
3
Poor 2
Overall, how good would you say managers at this workplace are at:
Seeking the views of employees or employee representatives?
Responding to suggestions from employees or employee representatives?
Allowing employees or employee representatives to influence final decisions?
Very Poor 1
Very satisfied 5
Satisfied 4
Neither satisfied nor dissatisfied
3
Dissatisfied 2
Overall, how satisfied are you with the amount of involvement you have in decision-making at this workplace?
Very dissatisfied 1
To compute the voice index, an average of an individual employee’s responses across the four questions was taken. This average could take any value between one and five. Given that, we divided the possible range up equally into four categories: 1 – 1.99, 2 – 2.99, 3 – 3.99 and 4 – 5. This ensured that the categories were distributed equally. Scores between 1 – 1.99 were deemed to be ‘very poor’, those between 2 – 2.99 were ‘poor’, 3 – 3.99 were ‘good’ and 4 – 5 were ‘very good’.
3.1.4 Integrity
The final enabler of employee engagement is ‘integrity’. This is defined as “A belief among employees that the organisation lives its values, and that espoused behavioural norms are adhered to, resulting in trust and a sense of integrity” (ibid, 33).
Having a gap between stated values and the reality of the organisation’s behaviours can lead to distrust and disengagement. However, when employees see the two align, MacLeod and Clarke argue it promotes trust, a sense of integrity and – consequently – employee engagement.
In terms of WERS, we use two questions to examine integrity. The first is the extent to which employees agree with the statement that managers in their workplace “can be relied upon to keep their promises.” The second is agreement that managers “deal with employees honestly.” Again, as with employee voice, we have made an index for integrity by combining these two questions using the same methodology. The indicators we’ have used for each of the enablers of engagement are set out in table 3.1.5.1 overleaf.
As well as investigating each of the enablers of engagement individually, we also combined the four together into an index of employee engagement. We took the average score for an individual across all four of the enablers mentioned above– strategic narrative, engaging managers, employee voice and integrity. For each employee, an average score was calculated across the four enablers with each
12
being equally weighted (making the assumption that each enabler is equally important for engagement). This gives us a score looking at each of the four enablers together, allowing us to understand how they have changed over the period, and how they vary across organisations and groups of employees. The questions included in this index are outlined in the table on the following page.
3.1.5 Other measures of engagement in WERS
Finally, we’ve also examined three indicators which are often seen as measures of engagement. We’ve looked at the following:
Organisational commitment, measured by agreement with the statement “I feel loyal to my organisation”
Achievement at work measured by satisfaction with “the sense of achievement you get from your work”
Discretionary effort, measured by agreement with the statement “using my own initiative, I carry out task that are not required as part of my job” (introduced in 2011)
Table 3.2: Enablers of engagement in WERS – Questions used from Employee Questionnaire
Enabler of Engagement
WERS Question
Strategic Narrative To what extent do you agree with the statement: ‘I share the values of my organisation’? - C1
Engaging Managers In general, how would you describe relations between managers and employees here? C3
Employee Voice Overall, how satisfied are you with the amount of involvement you have in decision-making in this workplace? B8 Overall, how good would you say managers are at this workplace are at seeking the views of employees? B7a Overall, how good would you say managers are at responding to suggestions? B7b Overall, how good would you say managers are at allowing employees to influence final decisions? B7c
Integrity To what extent do you agree that managers here can be relied upon to keep their promises? C2a To what extent do you agree that managers here deal with employees honestly? C2c

13
4. EMPLOYEE ENGAGEMENT AND ITS ENABLERS OVER TIME
4.1 Background
The most recent WERS was carried in from 2011 – 2012, with the previous survey having taken place in 2004. The intervening period was marked by considerable turbulence in the British economy and labour market.
As the graph below shows, the period from 2004 – 2008 was marked by steady growth, driven largely by strong growth in the service sector, with GDP increasing by 11.6 per cent from 2004 to 2008. However, the global financial crisis, triggered by the collapse of Lehman Brothers soon sent the British economy into a deep recession. GDP fell by 7.2 per cent in just five quarters from 2008 to 2009.
Figure 4.1 GDP and main components from 2004 – 2012 (ONS)
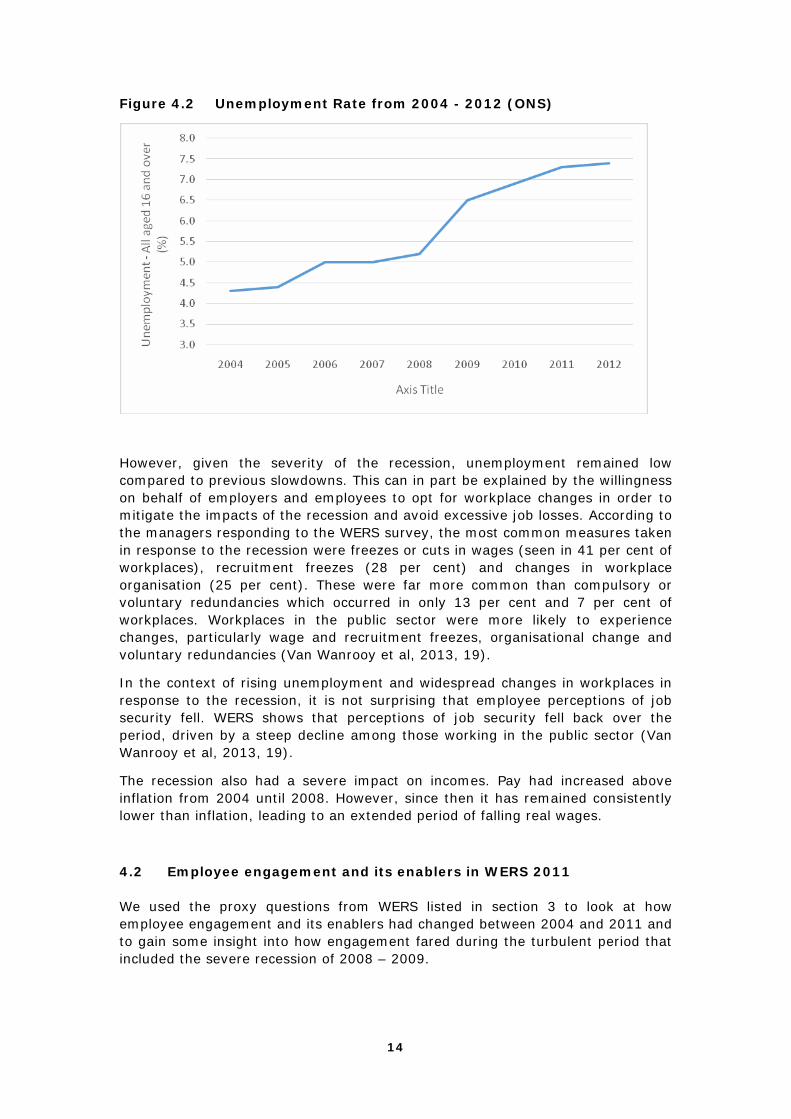
The recession soon fed through into the labour market. Unemployment, which had remained stable and low by historic standards, increased from five per cent in 2007 to over seven per cent in 2011. It has since started to come down but this trend was not evident at the time of the WERS survey fieldwork.
14
Figure 4.2 Unemployment Rate from 2004 - 2012 (ONS)
However, given the severity of the recession, unemployment remained low compared to previous slowdowns. This can in part be explained by the willingness on behalf of employers and employees to opt for workplace changes in order to mitigate the impacts of the recession and avoid excessive job losses. According to the managers responding to the WERS survey, the most common measures taken in response to the recession were freezes or cuts in wages (seen in 41 per cent of workplaces), recruitment freezes (28 per cent) and changes in workplace organisation (25 per cent). These were far more common than compulsory or voluntary redundancies which occurred in only 13 per cent and 7 per cent of workplaces. Workplaces in the public sector were more likely to experience changes, particularly wage and recruitment freezes, organisational change and voluntary redundancies (Van Wanrooy et al, 2013, 19).
In the context of rising unemployment and widespread changes in workplaces in response to the recession, it is not surprising that employee perceptions of job security fell. WERS shows that perceptions of job security fell back over the period, driven by a steep decline among those working in the public sector (Van Wanrooy et al, 2013, 19).
The recession also had a severe impact on incomes. Pay had increased above inflation from 2004 until 2008. However, since then it has remained consistently lower than inflation, leading to an extended period of falling real wages.
4.2 Employee engagement and its enablers in WERS 2011
We used the proxy questions from WERS listed in section 3 to look at how employee engagement and its enablers had changed between 2004 and 2011 and to gain some insight into how engagement fared during the turbulent period that included the severe recession of 2008 – 2009.

15
Despite this challenging context, the results show that engagement held up well and actually increased across the board during this period. Our index of engagement which combined each of the four enablers showed a modest increase in those who had ‘very good’ or ‘good’ levels of engagement from 52 per cent in 2004 to 56 per cent in 2011. Those with ‘good’ levels of engagement increased by 3 per cent as those with both ‘poor’ and ‘very poor’ fell by 2 per cent each. This is shown in figure 4.2.1.
Figure 4.3: Employee engagement index in WERS 2004 and 2011
*Statistical significance at the 95 per cent confidence level, n=21375 (2004); 21123 (2011)
This may at first seem like a surprising finding. One might have expected employee engagement to suffer during the recession as employees faced increased job insecurity, workplace change and a pay squeeze. For example, Purcell has shown previously that employee engagement is undermined by feelings of job insecurity (Purcell, 2009, p4) and yet this has increased markedly during the recession as shown by both the Skills and Employment Survey (Gallie et al, 2012, 3) and WERS (Van Wanrooy et al, 2013, 122).
The increase in engagement seems to be mirrored by an increase in job satisfaction as measured in WERS during this period across almost across the board. With the one exception of job security mentioned above, every measure of job satisfaction increased: satisfaction with the work itself, scope for using initiative, sense of achievement, influence, training and pay (Van Wanrooy et al, Feb 2013, 29). However, these improvements were largely driven by the private sector where there were significant increases in seven out of eight aspects of job satisfaction, whereas in the public sector there were increases in just three out of eight (Van Wanrooy et al, Nov 2013, 135).
These positive findings on job satisfaction contrast with a more negative picture painted by the Skills and Employment Survey 2012 on this issue. This shows that since 2006 there has been a decrease in job-related enthusiasm and job-related contentment. This is linked to an increase in insecurity, work intensification and downsizing (Green et al, 2012, 3).

16
Van Wanrooy et al explain that the impact of the recession on employer approaches to engagement may have been complex and contradictory. On the one hand, it could have led some to reduce consultation and involvement in decision-making due to the fear it may slow down their response to the crisis. While on the other hand the scale of changes may have made some managers more likely to involve employees in coming up with solutions (Van Wanrooy et al, November 2013, 55).
The following sections consider aspects of the drivers of engagement.
4.3 Strategic narrative
Taking the enablers in turn, there was a very large increase in the strategic narrative indicator, with those saying they ‘strongly agreed’ or ‘agreed’ that they shared the same values of their organisation increasing from 55 per cent of employees in 2004 to 65 per cent in 2011. This would indicate that employers are becoming increasingly effective at establishing and communicating a set of organisational aims and values, which employees can then buy-in to.
Figure 4.4: Employees sharing the same values as their organisation in WERS 2004 and 2011
*Statistical significance at the 95 per cent confidence level, n=21515 (2004); 21373 (2011)
4.4 Engaging managers
There was a more modest increase in the engaging manager indicator, shown in figure 4.4.1. In 2011, 64 per cent of employees said that relations between managers and employees were ‘good’ or ‘very good,’ a 3 per cent increase from 2004. Although the increase is relatively small, it remains impressive that the manager-employee relationship remained strong and actually improved through this turbulent period in the labour market.

17
Figure 4.5: Employee perceptions of the relationship with managers in WERS 2004 and 2011
*Statistical significance at the 95 per cent confidence level, n = 22061 (2004); 21834 (2011)
4.5 Employee voice
In terms of employee voice, there were moderate increases in each of the four indicators found in WERS. The proportion of employees who said that managers were ‘good’ or ‘very good’ at seeking views increased by four per cent; with the same increase for the question rating managers’ responses to suggestions. The question rating the extent to which managers allowed employees to influence decisions increased by just two per cent. In line with these rises in perceptions of voice, employees were slightly more satisfied with their ability to influence decision-making, with the figure rising from 40 per cent in 2004 to 43 per cent in 2011. The changes in each of these questions can be seen in the graph below. As each of the four questions all saw an improvement, the voice index also increased over the period. Whereas 52 per cent of employees in 2004 had ‘good’ or ‘very good’ levels of employee voice, this had risen to 56 per cent in 2011.
18
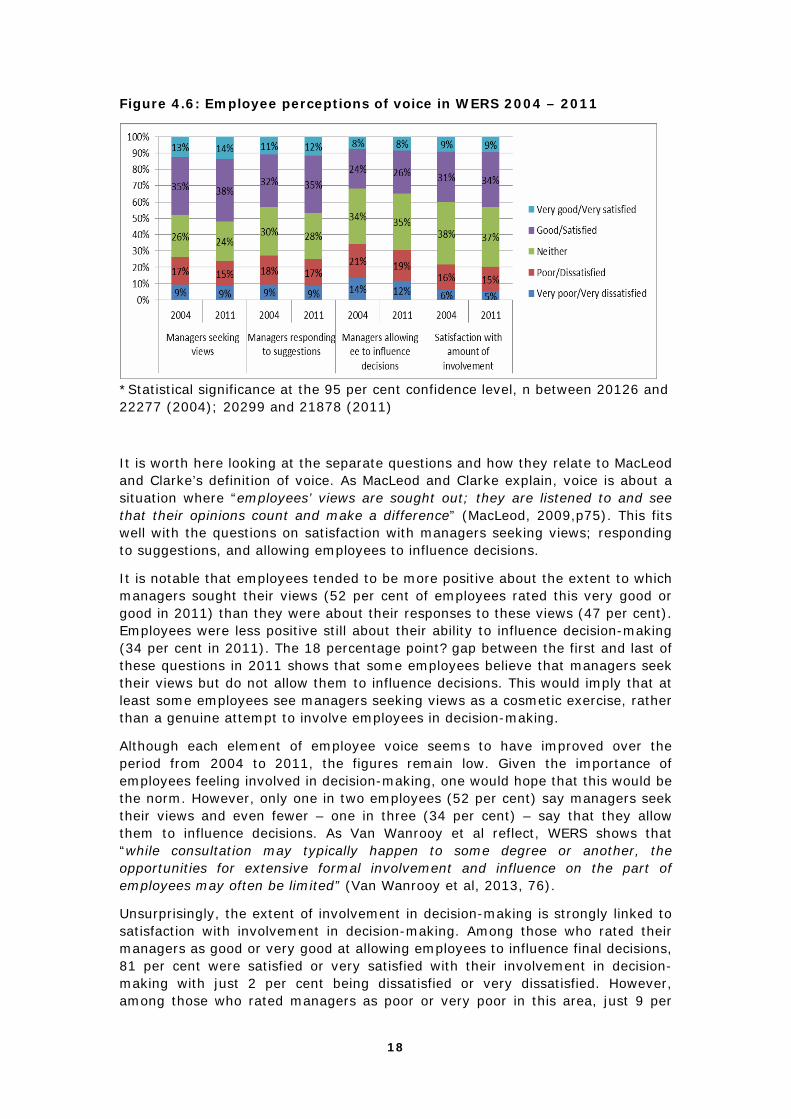
Figure 4.6: Employee perceptions of voice in WERS 2004 – 2011
*Statistical significance at the 95 per cent confidence level, n between 20126 and 22277 (2004); 20299 and 21878 (2011)
It is worth here looking at the separate questions and how they relate to MacLeod and Clarke’s definition of voice. As MacLeod and Clarke explain, voice is about a situation where “employees’ views are sought out; they are listened to and see that their opinions count and make a difference” (MacLeod, 2009,p75). This fits well with the questions on satisfaction with managers seeking views; responding to suggestions, and allowing employees to influence decisions.
It is notable that employees tended to be more positive about the extent to which managers sought their views (52 per cent of employees rated this very good or good in 2011) than they were about their responses to these views (47 per cent). Employees were less positive still about their ability to influence decision-making (34 per cent in 2011). The 18 percentage point? gap between the first and last of these questions in 2011 shows that some employees believe that managers seek their views but do not allow them to influence decisions. This would imply that at least some employees see managers seeking views as a cosmetic exercise, rather than a genuine attempt to involve employees in decision-making.
Although each element of employee voice seems to have improved over the period from 2004 to 2011, the figures remain low. Given the importance of employees feeling involved in decision-making, one would hope that this would be the norm. However, only one in two employees (52 per cent) say managers seek their views and even fewer – one in three (34 per cent) – say that they allow them to influence decisions. As Van Wanrooy et al reflect, WERS shows that “while consultation may typically happen to some degree or another, the opportunities for extensive formal involvement and influence on the part of employees may often be limited” (Van Wanrooy et al, 2013, 76).
Unsurprisingly, the extent of involvement in decision-making is strongly linked to satisfaction with involvement in decision-making. Among those who rated their managers as good or very good at allowing employees to influence final decisions, 81 per cent were satisfied or very satisfied with their involvement in decision-making with just 2 per cent being dissatisfied or very dissatisfied. However, among those who rated managers as poor or very poor in this area, just 9 per

19
cent were satisfied with their involvement with 57 per cent being dissatisfied. It is clear that employer actions make a difference to satisfaction. Van Wanrooy et al have shown that employees in organisations where an employer has consulted or negotiated over the most important change in the workplace are three per cent more likely to agree they were satisfied with involvement in decision making than where the managers just given information to employees about the changes, and four per cent more likely to be satisfied than employees in workplaces where managers had not involved staff at all (Van Wanrooy et al, 2013, 74).
There is also an apparent disparity here between the views of employees and of their managers. When managers were asked whether they do not introduce changes in the workplace without first discussing the implications with employees, 80 per cent either ‘agreed’ or ‘strongly agreed’ (Van Wanrooy et al, 2013, 56). Although the increase in voice is welcome, both the relatively modest levels of voice overall and the apparent disparity between employees perceptions and those of managers are areas of concern.
While WERS 2011 found an increase in perceptions of voice and satisfaction with involvement in decision-making, the Skills and Employment Survey found the opposite. The Skills and Employment Survey has shown a significant fall in the number of employees who feel they have a great deal or quite a lot of say over work organisation where they work. This has fallen from 36 per cent of employees in 2001 to just 27 per cent in 2012 (Inanc et al, 2012, 5).
4.6 Integrity
Again, there were modest increases in both of the questions from WERS relating to integrity. The percentage of employees agreeing that managers keep their promises increased slightly from 48 per cent in 2004 to 50 per cent in 2011 with those agreeing managers dealt with employees honestly rising from 55 per cent to 58 per cent. This is shown in figure 3 below. Looking at these two questions together in the integrity index, there was a slight increase in those with ‘high’ or ‘very high’ perceptions of organisational integrity, from 58 per cent in 2004 to 60 per cent in 2011.
As Van Wanrooy at al have shown, there is a marked difference between public and private sectors in terms of integrity. Employees in the private sector are more likely than those in the public sector to agree that managers are sincere in attempting to understand employee views by 59 per cent to 51 per cent. There is a similar gap in terms of perceptions that managers deal with employees honestly – 60 per cent agree in the private sector but just 51 per cent in the public sector. The increase in perceptions of integrity were driven by a rise in the private sector, whilst those in the public sector remained flat. This was perhaps driven by the greater impact of the recession in this period on the public sector. As we explained on page 10, leaders and line managers in the public sector are more likely to have had to resort to unpopular measures in dealing with the recession, such as wage freezes, workplace reorganisation, and redundancies. Even when handled relatively well, such changes can often cause friction and discontent in the workforce, and this could account for the growing trust gap between the public and private sectors.

20
There is also a difference in terms of size with employees in smaller workplaces being more trusting of their managers (Van Wanrooy, 120). This is perhaps explained by having greater direct contact between management and employees in smaller organisations, which can help build more trusting relationships.
Figure 4.7 – Employees’ perceptions of integrity in WERS 2004 and 2011
*Statistical significance at the 95 per cent confidence level, n=21575/21652 (2004); 21423/21433 (2011)
4.7 Other measures of engagement in WERS
In addition to looking at the enablers of engagement separately and together in the engagement index, we also examined three other indicators commonly used as measures of engagement.
The first of these, organisational commitment, showed a large increase with those ‘strongly agreeing’ or ‘agreeing’ that they felt loyal towards the organisation rising from 70 per cent to 75 per cent. The entire five per cent increase came from the number who said they strongly agreed, which was up from 21 per cent to 26 per cent. In one sense, this is a surprising finding given the negative impacts of pay restraint, workplace change and job insecurity arising from the recession. On the other hand, given the turbulence in the labour market and the increase in insecurity, loyalty may have been bolstered by many employees feeling happy still to have a job at all. Either way, the increase in organisational loyalty in the current circumstances is positive. The increases were statistically significant at the 95 per cent level.
We also looked at employees’ sense of achievement from their work. Again, there was an increase on this measure over the period with 74 per cent saying they were ‘satisfied’ or ‘very satisfied’ with the sense of achievement from their work in 2011 compared to 71 per cent in 2004. Again, the increase were statistically significant at the 95 per cent level.

21
Finally, we also examined the measure of discretionary effort at work. Employees were asked to what extent they agreed with the statement “using my own initiative I carry out tasks that are not required as part of my job”. This question was new in the 2011 WERS so there is no data on how it has changed but that year 71 per cent of employees agreed or strongly agreed with the statement.
These findings paint a positive picture of employee engagement during this period. Using proxy questions taken from WERS, there seems to have been a positive change in each of the four enablers of engagement – strategic narrative, engaging managers, employee voice and integrity. The increase was particularly strong in terms of the first of these but each enabler registered a statistically significant increase from 2004 to 2011. Looking too at other commonly used measures of engagement – employee loyalty and sense of achievement from work – both also registered an increase over the period. This shows that, far from withering in the face of recession and a turbulent labour market, employee engagement seems to have increased over the period.
4.8 Changes since WERS 2011
Given the fieldwork for the latest WERS survey was conducted between 2011 and 2012, we looked at data from Employee Outlook, a large quarterly tracker survey – provided with thanks by the CIPD – to see if there had been any significant changes around any of the enablers since then. For each enabler of engagement, we identified a question from Employee Outlook that was most similar to the questions used in WERS. We looked at six waves of Employee Outlook between March 2012 and September 2013.1
The closest question to the ‘strategic narrative’ asks employees the extent to which they agree that with the statement “I am highly motivated by my organisation’s core purpose.” Scores on this question had been relatively steady at between 56 and 59 per cent from March 2012 until March 2013. The latest results in September 2013 showed a fall to 53 per cent which might indicate a downward trend in this area.
In terms of engaging managers, the closest question asked employees how satisfied they were with their relationship with their immediate supervisor, line manager or boss. Responses to this question have remained stable over the period since WERS was carried out. In the in the six waves of the survey from 2012 – 2013, the proportion of employees feeling satisfied or very satisfied with the relationship varied from 63 per cent to 65 per cent. This figure is similar to the WERS 2011 finding that 64 per cent of employees see the relationship between managers and employees to be good or very good.
1 Employee Outlook is a quarterly survey commissioned by CIPD from YouGov of 2,000 employees. It is administered to members of the YouGov panel of 350,000 individuals who have agreed to take part in surveys. The survey is sampled was selected and weighted to be representative of the UK workforce in relation to sector and size, industry type, full/part time, and gender. The sample profile is derived from census data or, where not present, from industry accepted data. Emails were sent to panellists at random inviting them to take part and providing a generic survey link. Employee Outlook was provided with thanks by the CIPD.

22
For employee voice, the closest question in Employee Outlook asks whether employees whether directors or senior managers “consult employees about important decisions.” The proportion of employees agreeing with this statement has remained consistently low at between 24 and 27 per cent over the period. There are no indications of a consistent trend since WERS 2011.
In terms of integrity, the closest question from Employee Outlook asked whether they agreed with the statement “I trust the directors/senior management team of my organisation.” Over the period, responses varied between 36 per cent and 40 per cent either agreeing or strongly agreeing. Again, there is no indication of a consistent trend since WERS 2011.
Table 4.1 Enablers of employee engagement in CIPD Employee Outlook, 2012 - 2013
2012 Wave 1
2012 Wave 2
2012 Wave 3
2012 Wave 4
2013 Wave 1
2013 Wave 3
I am highly motivated by my organisation’s core purpose(per cent agree/strongly agree)
57 59 56 56 57 53
Overall how satisfied, or dissatisfied, are you with the relationship you have with your immediate supervisor, line manager or boss? (per cent satisfied/very satisfied)
64 65 64 63 64 64
“Directors/seniors management team of my organisation consult employees about important decisions” (per cent agree/strongly agree)
27 25 28 25 27 24
I trust the directors/senior management team of my organisation(per cent agree/strongly agree)
39 36 40 38 39 37

23
5. WHO IS ENGAGED?
5.1 Differences by employer characteristic
Having looked at how engagement changed between 2004 and 2011 across the workforce as a whole, we used the WERS data for 2011 to examine differences between employers.
5.1.1 Industry and Sector
First, we looked at differences in engagement between industries, using the engagement index on a scale of zero to five. We found quite a wide variation between industries, from 3.07 for transportation and storage up to 3.71 for accommodation and food services, as is shown in figure 4 below. A regression analysis was conducted comparing occupational type to manufacturing. This found that the following industries had significantly higher levels of engagement; construction, wholesale and retail, accommodation and food services, information and communication, financial and insurance activities, real estate, professional, scientific and technical, education, human health and social work, arts, entertainment and recreation, and other services. Compared to employees in manufacturing, employees who worked in transportation and storage, and public administration/defence had significantly lower levels of engagement. Similar patterns were found in terms of organisation commitment.
In general, it appears that engagement is particularly low in the utilities sector, in public administration and in manual work. Engagement appears higher in the private sector, in the service sector, and in professional roles.

24
Figure 5.1 – Employee engagement index by Industry from WERS 2011
*Statistical significance at the 95 per cent confidence level, n=1921
Figure 5.2 – Employee Engagement index by Employer sector from WERS 2011
*Statistical significance at the 95 per cent confidence level, n=1921
We also looked at differences by sector (figure 5.1.1.2). Generally, as is shown in the graph above, levels of employee engagement were higher in the private sector and charity/voluntary sector than in the public sector. Again, this might be

25
explained by the more severe impact of the recession on the public sector, explained on page 10.
However, this finding contrasts with the work carried out by Alfes et al for the Chartered Institute of Personnel and Development (Alfes et al, 2010, 16 – 17). They looked separately at three elements of engagement – affective, intellectual and social. They found that private sector workers had higher scores in terms of affective engagement (feeling positively about doing a good job), but lower levels of both intellectual engagement (thinking hard about the job and how to do it better) and social engagement (actively taking opportunities to discuss work-related improvements with others at work).
5.1.2 Size
Finally, we looked at the differences in terms of employee engagement and loyalty to the organisation by number of employees (figure 5.1.2.1). We found that the size of the organisation was a significant predictor of both engagement and employee loyalty, with employees in larger organisations tending to be both less engaged and less loyal to their employer than those in smaller organisations. For example, employees in smaller organisations (fewer than 100 employees) averaged 4.08 out of five in terms of loyalty and 3.66 on the engagement index. Those over 100,000 employees scored 3.75 in terms of loyalty and 3.25 on the engagement index.
Figure 5.3 – Employee Engagement and loyalty by size of organisation from WERS 2011
*Statistical significance at the 95 per cent confidence level, n=1282

26
5.2 Differences by employee characteristic
In addition to looking at differences between employers, we also looked at differences in engagement between employees themselves. A regression analysis was carried out looking at the six protected characteristics identified in the WERS Employee Survey; gender, age, disability status, ethnicity, religion and sexual orientation to look for differences between groups in terms of both the engagement index explained above and levels of organisational commitment.
5.2.1 Gender
There were some significant differences between the genders with female employees appearing far more engaged than their male colleagues. On the engagement index, women averaged 3.59 out of 5 compared to the average for men of 3.43. There was a significant gap too in organisational commitment with women averaging 3.98 compared to men at 3.83.
A similar pattern in terms of gender is found by Van Wanrooy et al (2013) who constructed an index of job-related contentment and job related enthusiasm from WERS 2011. They found that women scored higher than men on both elements (Van Wanrooy et al, November 2013, 130). Alfes at also found similar results. They found that women scored higher than men across each of the elements of engagement they examined; intellectual engagement, affective engagement and social engagement (Alfes et al, 2010, 21).
5.2.2 Age
There were some significant differences in terms of age, as is shown in figure 5.2.2.1 below. The youngest and oldest groups of workers tended to score higher on the engagement index (blue bar) and engagement decreased as age increased with levels progressively falling until the former default retirement age of 65 from where it rose sharply. A similar – though less pronounced – trend is seen with organisational commitment (orange bar), which is highest with under 20s and over 60s.
Again, this pattern is reflected in the index of job related contentment and enthusiasm created by Van Wanrooy et al. It shows that younger (under 20) and older (over 60) workers score higher on this (Van Wanrooy et al, November 2013, 130). However, this contrasts with the findings of Alfes et al who argued that under 25s were less engaged across the three dimensions they looked at (Alfes et al, 2010, 21).
The sharp increase in both engagement and organisational commitment among over 65s could be accounted for by the least engaged employees leaving the workforce. With older employees reaching pension age, many would have the option of giving up work, with those who are less engaged and less loyal perhaps being more likely to do so.

27
Figure 5.4 – Engagement Index and Organisational Commitment by age in WERS 2011
*Statistical significance at the 95 per cent confidence level, n=21526 (Engagement Index) n=21598 (Organisational Commitment)
5.2.3 Disability
Again, there was a sizable and concerning gap in engagement in terms of disability. Those who self-identified as having a disability averaged 3.25 on the engagement index compared to 3.54 for those without a disability. There was a similar gap in terms of organisational commitment; disabled employees scored 3.78, well below their non-disabled colleagues who averaged 3.92. This gap is a serious cause for concern and it warrants further investigation.

28
Figure 5.5: Employee engagement and organisational commitment by disability in WERS 2011
*Statistical significance at the 95 per cent confidence level, n=21510 (Employee Engagement Index), n=21579 (Organisational Commitment)
5.2.4 Ethnicity
Looking at ethnicity, there was no significant differences in terms of engagement between different ethnic groups. There were some small but significant differences when it came to organisational commitment with white employees (3.90) scoring lower than Asian/Asian British (4.08) and Black/Black British (4.06).
5.2.5 Religion
On religion, employees who identified as Jewish (3.62) and Sikh (3.59) scored highest on the engagement index but the differences were not statistically significant given the relatively small sample sizes. The regression analysis did show some small but significant differences between those with no religion (3.46) who scored lower than those identifying themselves as Christians (3.55). A similar pattern is seen with organisational commitment. Employees with no religion (3.79) scored significantly lower than those who identified as Christian (3.98), Hindu (4.02), Muslim (4.05) and Sikh (4.09).

29
5.2.6 Sexual Orientation
In terms of sexual orientation employees who identified as gay or lesbian scored 3.60 in terms of engagement whereas those who identified as heterosexual or straight scored 3.52, but the differences were not significant. Employees who identified as bisexual though did score significantly lower, averaging 3.10.Bisexual employees (3.53) also averaged lower on organisational commitment than heterosexual (3.92) and gay or lesbian employees (3.97) but the difference here was not statistically significant so cannot be said to be lower with any certainty.

30
6. EMPLOYER ACTIONS AND ENGAGEMENT – WHAT WORKS?
6.1 Employer approaches and engagement?
In addition to looking at variations in engagement levels by employer and employee characteristics, we also investigated the effectiveness of different approaches to engaging with employees.
Here we examined the impact of various approaches to engagement on employees’ perceptions of voice, measured by the employee voice index. As explained in section 3.1.3, this includes employees’ rating of manager’s willingness to seek their views, respond to their suggestions, and allow them to influence decision-making. It also includes a measure of employee satisfaction with involvement in decision-making.
6.2.1 Meetings with senior managers
First, we looked at differences between organisations on whether they had meetings between senior managers and employees – either all together or in separate groups. Such meetings take place in 80 per cent of all workplaces in 2011, up from 75 per cent in 2004 (Van Wanrooy et al 2013, 64). Employees in organisations where such meetings did take place tended to have a stronger perception of voice, averaging 3.25 on the index compared to 3.09 at organisations where such meetings did not take place.
Looking at the content of these meetings, there does appear to be a relationship between perceptions of voice and the amount of time allocated to employees to ask questions or give their views. Where there was no time for employee input – with the meetings in effect being one-way communication – employees averaged 2.63 on the voice index. Perceptions of employee voice rose progressively as more time was given over to employees, reaching 3.30 in organisations where at least a quarter of the time is given over to employees. This is show in figure 6.2.1.1 below. Though the incidence of these meetings increased up to 2011, WERS actually recorded a fall in the average proportion of time given over to employees in such meetings (Van Wanrooy, 64). Given the strong positive link between the proportion of time available for employees and their perceptions of voice, this comes as a concern.
Though the amount of time given to employees does seem to matter, the regularity of the meetings does not. There was no relationship between the voice index and the regularity of senior manager/employee meetings.

31
Figure 6.1: Employee voice by proportion of senior manager meeting time allocated to employees
*Statistical significance at the 95 per cent confidence level, n=1577
6.2.2 Line manager meetings
Whereas there was a positive relationship between employee voice and the presence of senior manager/employee meetings, there was no such relationship with line manager meetings. Here, employees that did have line manager meetings had lower perceptions of employee voice (3.20) compared to those that did not (3.40). The differences were statistically significant (p <.01). It is not immediately clear why this is and this potentially warrants further investigation.
6.2.3 Representative forums
There was also a negative and statistically significant (p <.01) correlation found between perceptions of voice and the presence of a Joint Consultative Committee (JCC), works council or representative forum. Where such a collective consultation forum was in place, employees averaged 3.11 on the voice index. Where there was no such body, employees averaged 3.30.
This finding seems counter-intuitive and it contradicts MacLeod and Clarke’s assertion that engaging with collective voice is “an integral part of engagement approaches” (MacLeod, 99). It is not immediately clear why organisations with JCCs seem to have lower levels of voice. It could be that many of these JCCs are not run effectively. Purcell and Hall for example have outlined the six characteristics of ‘active consultation’ that need to be present in JCCs in order to ensure they work effectively and promote employee voice (Purcell et al, 6). The lower levels of voice we found may be due to the fact that many JCCs do not meet this standard.

32
6.2.4 Staff surveys
Again, a negative correlation was found between perceptions of employee voice and the use of a regular staff survey. Where such a survey was administered regularly, employees averaged 3.17 on the voice index but this was significantly higher at 3.31 where no such survey took place. The difference was statistically significant (p <.01). These findings again seem counter-intuitive and warrant further investigation. The lower levels of engagement may be explained by the fact that staff surveys are more common in both larger organisations and the public sector – where voice levels are lower. Although this analysis does not show that staff surveys are associated with high levels of engagement, this needs to be explored further, and in any case they could be a useful tool for managers in enabling them to understand the variations in engagement across their organisation, the factors associated with engagement, and the interventions that might be able to improve engagement.
As WERS looks only at formal methods of consultation with the workforce, it does not allow us to investigate the impact of more informal, one-to-one contact between line managers and individual employees which are often seen as important for employee engagement.
6.3 MacLeod and Clarke’s model – Does WERS back it up?
In developing their model of employee engagement and the enablers, MacLeod and Clarke relied largely on case studies with employers and discussions with practitioners, rather than on statistical analysis. However, as Purcell has shown, their conception of the four enablers of employee engagement – strategic narrative, engaging managers, employee voice and integrity – do seem to be borne out by the academic evidence (Purcell, 2010, p5).
In order to test MacLeod and Clarke’s model, we looked at the relationship between the four enablers of engagement and some commonly used indicators of engagement; organisational commitment, discretionary effort and sense of achievement at work.
Using the 2004 WERS, Purcell examined the factors significantly linked to positive commitment to the organisation. He found that the most powerful predictors of commitment were employee trust in management, satisfaction with the work itself, involvement in decision-making, employee relations climate, satisfaction with pay, job challenge, and sense of achievement from work (Purcell, 2010, p4).
We undertook a similar multivariate regression analysis of the 2011 WERS data to understand the factors related to organisational commitment. We found that organisational commitment has a strong and positive association with both shared values (coefficient .48**, standard error .02) and manager-employee relationship (coefficient .10**, standard error .02), indicating the importance of the ‘strategic narrative’ and ‘engaging managers’ enablers of engagement. There is also a relationship – though a weaker one – between organisational commitment and satisfaction with involvement in decision-making (coefficient .05**, standard error .01) and manager honesty (coefficient .04**, standard error .02). Again, this shows evidence of a correlation between organisational commitment and the

33
other two enablers of engagement – ‘employee voice’ and ‘integrity’. The full results are available in appendix 3.
This analysis supports MacLeod and Clarke’s model of the enablers of engagement, in that each of them – strategic narrative, engaging managers, employee voice and integrity – show a positive relationship with organisational commitment in the 2011 WERS.
We did similar multivariate regression analyses on discretionary effort and sense of achievement at work – two other factors often taken as indicators of engagement. On discretionary effort, having shared values was again the strongest predictor (coefficient .31**, standard error .2), emphasising the importance of ‘strategic narrative’ here.
The analysis of sense of achievement unsurprisingly identified satisfaction with the work itself as the strongest predictor, followed by hard work. But here too, having shared values (coefficient .09**, standard error .02) and satisfaction with involvement in decision-making (coefficient .06**, standard error .01) had a positive correlation.
Having shared values appears to be particularly strongly linked to both organisational commitment, discretionary effort and sense of achievement. This reflects the findings of Alfes et al in their work for the CIPD which identified ‘meaningfulness’ as the most important driver of engagement for all employee groups. As they explained, “having a meaningful job is the most important factor influencing levels of engagement. This is true of all types of worker in all kinds of job” (Alfes et al, 2010, 2).
34
7. ENGAGEMENT AND ORGANISATIONAL PERFORMANCE
7.1 Background
There is a growing body of evidence that demonstrates the importance of employee engagement to organisational performance. A recent summary paper produced by Bruce Rayton for the Engage for Success movement shows that employee engagement is positively linked to organisational productivity and performance, customer satisfaction, innovation, employee wellbeing and low absenteeism, and retention (Rayton, 2012).
In our study we looked to see if there was any link between engagement and performance. Instead of using data from the Financial Performance Questionnaire in WERS which was not yet available, we were able to look at the employer’s perceptions of their organisation’s financial performance and labour productivity compared to other workplaces in the same industry. Employers were asked the following question: “compared with other workplaces in the same industry how would you assess your workplace’s financial performance” and also asked about labour productivity. On both areas, managers were asked to rate it on a five-point Likert scale, ranging from a lot better than average, through to a lot below average.
7.2 Employee engagement and financial performance
There is a clear trend in terms of employee engagement and perceived comparative financial performance. In organisations where managers rated financial performance as much above average, employees scored 3.57 on the employee engagement index. This compares to a score of 3.48 in those where performance was rated as average and just 3.23 in those where financial performance was seen as much below average. This is shown in Figure 7.3.1 below.
7.3 Employee engagement and labour productivity
There is an even steeper gradient in terms of perceived comparative labour productivity. In organisations where managers rated labour productivity as much above average, employees scored 3.62 on the employee engagement index. This fell to 3.46 in those rated as average and just 2.97 for those rated much below average.
This is further evidence of a strong correlation between employee engagement and organisational performance. High levels of employee engagement are strongly associated with both financial performance and labour productivity, two essential elements of overall organisational success.

35
Figure 7.1 – Employee Engagement index by perceived financial performance and labour productivity in WERS 2011
*Statistical significance at the 95 per cent confidence level, n=1739 (Labour productivity) n=1771 (Financial performance)

36
8. CONCLUSION
8.1 How have engagement and its enablers changed over time?
This analysis of the Workplace Employment Relations Study 2011 has shown that, far from shrinking in the face of recession and labour market turmoil, employee engagement seems to have increased over the period since the last study in 2004. Each of the four enablers of engagement – strategic narrative, engaging managers, employee voice and integrity – registered improvements, with a particularly strong surge in the first of these. There were also improvements in other factors commonly seen as indicators of engagement. Compared to 2004, employees displayed a greater organisational commitment, they were more willing to put in discretionary effort and they got a greater sense of achievement from their job.
It is perhaps surprising that engagement has grown over a period characterised b by the challenges of increasing job insecurity, organisational change and wage restraint. However, there are clearly rooms for further development as, for example, only one in three employees say their managers allow them to influence decision-making.
8.2 What factors affect engagement and its enablers?
We found large variations in engagement by industry and by sector. Employees in the public sector tend to be less engaged than those working in the private or third sectors. There is also significant variations by the size of the employer. Employees in large organisations score lower both on the enablers and on organisational commitment than those in smaller organisations.
There were also significant gaps in engagement by employee characteristics. Women were significantly more engaged than men. Older employees tended to be less engaged (at least until retirement age). And perhaps most worryingly, disabled employees were significantly less engaged than their colleagues. It is not immediately apparent why such disparities exist but this warrants further investigation.
MacLeod and Clarke identified the enablers of engagement in their 2009 report Engaging for Success. Our analysis of WERS 2011 seems to back up their model. The enablers were positively associated with some of the key indicators often taken as measures of engagement; discretionary effort, organisational loyalty and satisfaction with work.
It also seems that the employers’ approach to engaging makes a difference. Levels of employee voice are far higher in organisations where there are meetings between employees and senior managers. This is particularly the case where a significant proportion of the meeting is given over to staff. Giving employees a voice clearly matters.

37
8.3 How are engagement and its enablers related to other positive outcomes and to performance?
Finally our findings add further weight to the growing argument that employee engagement matters for organisational success. Organisations with higher levels of employee engagement are also the organisations doing well in terms of labour productivity and financial performance.
8.4 Implications for employers
Our findings offer some clear lessons for employers looking to engage more effectively with their employees.
First, the stark disparities between different groups should raise concerns and act as a warning call. Employers need to make sure that, all groups are equally engaged so that all employees experience a fulfilling workplace and can give of their best at work. As Alfes et al explain, “understanding your workforce engagement profile is the first step to determining how to drive up engagement levels” (Alfes et al, 2010, 2). A robust approach to engagement should aim to identify, understand and then address any significant variations between employee groups.
Our analysis reinforces MacLeod and Clarke’s model of the enablers of the engagement. There are strong links between each of the enablers in WERS and other factors associated with engagement; discretionary effort, organisational loyalty and work satisfaction. Employers should consider how these enablers – strategic narrative, engaging managers, employee voice and integrity – play out in their own workplace.
Out of all of the enablers, the links between having shared values and organisational commitment were the strongest. This appears to demonstrate the importance of having a robust strategic narrative. Employers therefore need to ensure that there is a clear set of organisational aims and values that are understood by employees and with which they can identify. These values should be clearly and consistently communicated, they should be lived out by leaders and managers, and they should inform organisational decision-making.
The research clearly shows the importance of contact between senior managers and frontline employees. We found a clear association between senior manager meetings and employee voice. Employees at organisations where there are meetings with senior managers have far higher perceptions of voice and influence over decision-making than organisations where such meetings don’t take place. This demonstrates the importance of direct contact between employees and senior managers. This finding should act as a wake-up call to the one in five organisations that do not use such meetings.
But beyond just having such meetings, allowing for employee-input seems vital. At organisations where employees were offered a substantial proportion of time in these meetings to raise issues or ask questions, perceptions of voice were far higher than at organisations where no time was allocated to staff (3.30 compared to 2.63). Currently only 46 per cent of employers hold meetings between senior managers and employees where at least a quarter of the time is given over to

38
employees to raise issues and ask questions (Van Wanrooy, 64). This is an obvious area for improvement.
This raises the wider point about employee voice. Having meetings with senior managers is one thing, but if employees can not effectively contribute their impact will be limited – or even negative. Beyond putting in place mechanisms to inform staff, employers need to ensure they treat engagement as a genuine dialogue, rather than a one-way monologue. Employees need to be both given the opportunity and positively encouraged to have their say.
There seems to be some way to go in terms of employee voice. Whereas the majority (52 per cent) of employees say managers are good/very good at seeking their views, just one in three (34 per cent) say they are good at allowing employees to influence decision-making. And there does seem to be a desire for more involvement in decision-making. Those who perceive a lack of influence over decision-making are far less satisfied with their influence.
This implies that many employees see their managers’ efforts to seek their views as merely a cosmetic exercise that will have no consequence. This can be actively disengaging for employees. Leaders and managers therefore need to ensure that efforts to engage are genuine, and that they give employees adequate opportunities to input into decision-making. As well as genuinely involving employees, efforts should also be made to feed back following engagement, in order to show employees how their views and inputs influenced the final decision.
As we showed in our previous research with Tomorrow’s Company into employee voice:
“Voice must be approached in a genuine and authentic way, and treated as more than just a cosmetic exercise. An authentic use of voice means that when the employee is invited to speak up, the company in return will both listen and will respond to what the employee says, even if just to explain why they cannot carry out a request for change. Feedback is vital and action must be seen to follow.” (Dromey et al, 2012, 17)
Finally, if leaders were not already convinced of the importance of employee engagement, hopefully this report will go some way towards addressing that. It adds to the growing evidence that shows engagement is vital to organisational performance. As WERS shows, employee engagement appears strongly linked both to labour productivity and the financial performance of the organisation. This can help make the case for change and demonstrate the significance of employee engagement.

39
APPENDIX 1 - BIBLIOGRAPHY
Adam, D. Purcell, J. Hall, M. (2014) Joint consultative committees under the Information and Consultation of Employees Regulations: A WERS analysis, London: ACAS
Alfes, K. Truss, C. Soane, E. Rees, C, Gatenby, M. (2010) Creating an Engaged Workforce. London: CIPD
Dromey, J. Broadbelt, G. (2012) Releasing Voice for Sustainable Business Success. London: IPA and Tomorrow’s Company
Gallie, D. Felstead, A. Green, F. Inanc, H. (2012) Fear at Work in Britain - First Findings from the Skills and Employment Survey, London: UKCES/ESRC
Gallie, D. Felstead, A. Green, F. Inanc, H. (2012) Job-related Well-being in Britain - First Findings from the Skills and Employment Survey 2012,London:UKCES/ESRC
Hall, M. and Purcell, J. (2012) Consultation at work – Regulation and Practice, Oxford: Oxford University Press
Inanc, H. Gallie, D. Felstead, A. Green, F. (2012) Job Control in Britain – First Findings from the Skills and Employment Survey 2012, London: UKCES/ESRC
MacLeod, D. Clarke N. (2009) Engaging for Success: Enhancing performance through employee engagement. London: BIS
Purcell, J. (2010) Building Employee Engagement. London: ACAS
Rayton B. (2012) The Evidence. London: Engage for Success
van Wanrooy, B. Brewley, H. Bryson, A. Forth, J. Freeth, S. Stokes, L. Wood, S. (2013) Employment Relations in the Shadow of Recession – First Findings from the 2011 Workplace Employment Relations Study. Basingstoke: Palgrave Macmillan Sanders, D. (2012) Placing Trust in Employee Engagement. London: Acas

40
APPENDIX 2 – LIST OF TABLES AND GRAPHS
Table Page Table 3.1 Calculating the WERS employee engagement enabler index
11
Table 3.2 Enablers of engagement in WERS – Questions used from Employee Questionnaire
12
Figure 4.1 GDP and main components from 2004 – 2012 (ONS)
13
Figure 4.2 Unemployment Rate from 2004 - 2012 (ONS)
14
Figure 4.3 Employee engagement index in WERS 2004 and 2011
15
Figure 4.4 Employees sharing the same values as their organisation in WERS 2004 and 2011
16
Figure 4.5 Employee perceptions of the relationship with managers in WERS 2004 and 2011
17
Figure 4.6 Employee perceptions of voice in WERS 2004 – 2011
18
Figure 4.7 Employees’ perceptions of integrity in WERS 2004 and 2011
20
Table 4.1 Enablers of employee engagement in CIPD Employee Outlook, 2012 2013
22
Figure 5.1 Employee engagement index by Industry from WERS 2011
24
Figure 5.2 Employee Engagement index by Employer sector from WERS 2011
24
Figure 5.3 Employee Engagement and loyalty by size of organisation from WERS 2011
25
Figure 5.4 Engagement Index and Organisational Commitment by age in WERS 2011
27
Figure 5.5 Employee engagement and organisational commitment by disability in WERS 2011
28
Figure 6.1 Employee voice by proportion of senior manager meeting time allocated to employees
31
Figure 7.1 Employee Engagement index by perceived financial performance and labour productivity in WERS 2011
35

41
APPENDIX 3 – REGRESSION ANALYSES OF ORGANISATIONAL COMMITMENT, DISCRETIONARY EFFORT AND SENSE OF ACHIEVEMENT
Three multivariate regression analyses using the WERS 2011 employee dataset were carried out to examine factors that may be related to organisational commitment, discretionary effort, and sense of achievement at work. The regression was an OLS regression. The sample size is so large that it is not necessary to run all assumptions for OLS (central limit theorem).
In the following analyses, income was included as a number of dummy variables, with “an income of £60 or less a week” being the comparison group. The results of the regression analyses are presented in the following table:
Variables and Statistic Organisational Commitment Discretionary effort Sense of achievement
Coefficient Stand. Error Coefficient Stand. Error Coefficient Stand. Error Shared values .48** .02 .31** .02 .09** .01 Manager-employee relationship .10** .02 -.05** .02 .02 .01
Sat involvement decision-making .05** .01 .04* .02 .06** .01
Manager honesty .04** .02 -.02 .02 .02 .01 Hard work .06** .01 .04* .02 .11** .01 Not enough time -.03* .01 .07** .01 -.00 .01 Job security .06** .02 .01 .02 .05** .01 Sat sense of achievement .08** .02 .08** .02 n/a n/a
Sat work itself .13** .02 .08** .02 .49** .02 Tense -.00 .01 .00 .01 .00 .01 Depressed -.03* .01 .04** .02 -.08** .01 Worried .05** .01 -.00 .01 -.01 .01 Sat job security .01 .02 -.04 .02 -.03* .02 Training received -.00 .01 -.02* .01 -.01 .01 Sat devpm skills -.02 .01 .00 .01 .14** .01 Sat pay .05** .01 -.04** .01 .01 .01 Income £61-£100 .14* .07 -.05 .11 .04 .08 Income £101-£130 .06 .07 -.12 .12 .03 .08 Income £131-£170 .14 .08 -.08 .11 .03 .08 Income £171-£220 .06 .07 -.19 .10 .10 .08 Income £221-£260 .06 .07 -.17 .11 .03 .08 Income £261-£310 .10 .07 -.22* .10 .09 .08 Income £311-£370 .10 .07 -.13 .10 .06 .07 Income £371-£430 .08 .07 -.16 .10 .12 .08 Income £431-£520 .10 .07 -.11 .10 .11 .08 Income £521-£650 -.01 .07 -.13 .10 .09 .07 Income £651-£820 -.00 .07 -.07 .10 .11 .08 Income £821-£1050 .00 .08 -.09 .11 .02 .08 Income £1051 or more -.14 .08 -.07 .11 .06 .08 Working Hours .00 .00 .00 .00 -.00 .00 Work-life balance .03** .01 .01 .01 .01 .01 Understanding Managers WLB .02 .01 .06** .01 .00 .01
Membership union -.01 .02 -.08** .02 .03 .02 Presence union .00 .02 -.11** .02 -.00 .02 Intercept -.05 .11 1.84** .14 .42** .11
F 168.11** 37.94** 194.23**
R2 .5309 .1735 .5519
N 13049 13012 13069

42
Organisational commitment – the overall model was significant [F(33,1795) = 194.23, p<.01] and explained about 53 per cent of the variance in organisational commitment.
Discretionary effort – the overall model was significant [F(34, 1794) = 37.94, p<.01] and explained about 17 per cent of the variance in discretionary effort.
Sense of achievement – the overall model was significant [F(33,1795) = 194.23, p<.01] and explained about 55 per cent of the variance in sense of achievement.
Coefficients that range from .1-.2 are generally considered small effects, from .2-.3 are medium effects and over .4 are considered large effects (Cohen, 1991).
If the coefficient is positive, this means that it has a positive effect on the dependent variable. For instance, shared values has a strong positive effect on organizational commitment, after controlling for all other variables in the regression (each of the variables that appears in the first column).
If the coefficient refers to a dummy-coded variable, such as income, then each coefficient is compared to the 'omitted category'; in the case of income, the omitted category is "an income of less than 60 pounds a week". So there is a positive effect of having an income of 61-100 pounds on organizational commitment in comparison to those who earn less than 60 pounds.


Published by AcasCopyright © Acas