session 26 panel discussion the aca and risk adjustment ... · the aca and risk adjustment: round...
TRANSCRIPT

Session 26 PD, The ACA and Risk Adjustment: Round Two
Moderator/Presenter: Gregory G. Fann, FSA, FCA, MAAA
Presenter: Hans Leida, FSA, MAAA
Erica Rode, PhD, ASA, MAAA
SOA Antitrust Disclaimer SOA Presentation Disclaimer
The ACA and Risk Adjustment: Round Two Session 26 - SOA Health Meeting
6/12/2017
Presented by: Greg Fann

Risk Adjustment: A Key ACA Element
6/12/2017 Slide 2
1. Only permanent “R” of 3 Rs• Necessary with market rules• Not a “transitional” element
2. Different actuarial perspectives 3. Health Section Council Strategic Initiatives
• One of first two strategic initiatives was “ACA and the Exchanges”• Outcome was web exclusive for The Actuary:
http://www.theactuarymagazine.org/category/web-exclusives/aca-initiative/
• Differing perspective but similar themes: Shortcomings in methodology, suggested improvements
• Unfinished ACA business – new strategic initiative
HHS-HCC Risk Adjustment Ideals
6/12/2017 Slide 3
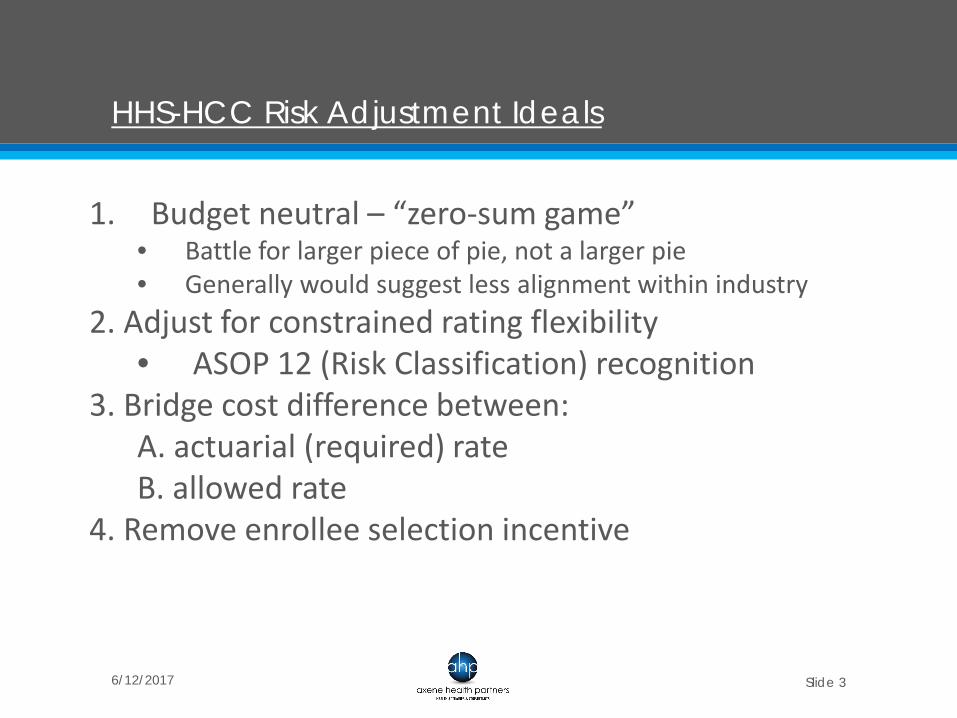
1. Budget neutral – “zero-sum game”• Battle for larger piece of pie, not a larger pie• Generally would suggest less alignment within industry
2. Adjust for constrained rating flexibility• ASOP 12 (Risk Classification) recognition
3. Bridge cost difference between:A. actuarial (required) rateB. allowed rate
4. Remove enrollee selection incentive

Competing Carrier Desires
6/12/2017 Slide 4
1. Budget neutrality and Inequity Equal ($ not plans) share of winners and losers
2. Winners: large established plans3. Losers: new, growing plans4. Reactions/Responses
• States: NY - “protect SG insurers from risk adjustment”
• State Associations/Alliances (i.e. MA)• Coalitions (i.e. Choices)• Regulatory Comments – 2018 NBPP
http://minutemanhealth.org/MinutemanHealth/media/Outreach%20and%20Comms/Oct2016/Comment%20Letter%20Appendix%20I_Part1.pdf
• Litigation - http://khn.org/morning-breakout/maryland-co-op-files-suit-over-cms-outrageous-risk-adjustment-formula/

HHS-HCC Methodology – A Two Step Process
6/12/2017 Slide 5
1. Individual Risk Assessment• Important to get right (equity)• Insurers have ceded risk factor calculations to
government
2. Transfer Formula• Budget neutral• Should reflect actuarial cost differences• Equity also important

HHS-HCC Methodology – Risk Assessment
6/12/2017 Slide 6
1. Scoring should be precise and impartial• Data/Methodology
2. Data Used• Large group experience without large concentration
of short duration members or coding incentives• Scheduled to be replaced w/ ACA market in 2019
3. Methodology: HCC Coefficients• Overstates costs of individuals (20%) with HCCs• Post Risk Adjustment Medical Loss Ratios:
• No HCCs – 126% / HCCs – 72%• “no adjustments at this time”, continued exploration
HHS-HCC Methodology – Risk Assessement
6/12/2017 Slide 7
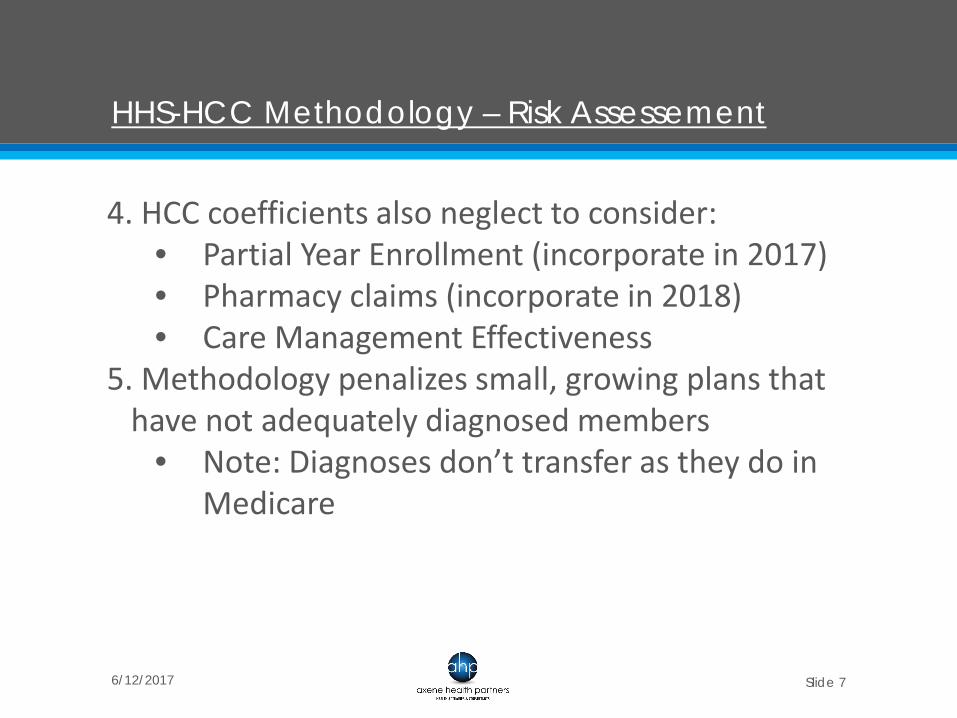
4. HCC coefficients also neglect to consider:• Partial Year Enrollment (incorporate in 2017)• Pharmacy claims (incorporate in 2018)• Care Management Effectiveness
5. Methodology penalizes small, growing plans that have not adequately diagnosed members
• Note: Diagnoses don’t transfer as they do in Medicare

HHS-HCC Methodology – Transfer Formula
6/12/2017 Slide 8
1. Required to be unbiased even if risk assessment is perfect2. Complaints on “Statewide Average Premium” model
• “Budget neutral decision by HHS”• “S” - Statewide nature of formula
• Regional coding can vary• “A” – ‘Average’ inflates transfers for efficient carriers,
limited networks• “P” – ‘Premium’ transfer incorporates transfer of non-
risk administrative expenses (14% in 2018)3. Discourage plans who attract low cost individuals

HHS-HCC Methodology – Transfer Formula
6/12/2017 Slide 9
4. Result: formula with items extraneous to actuarial risk• Individual market enrollment choices• Competitors’ rates and coding patterns• Enrollment shifts in market• Numerical Example in March 2017 Health
Watch• Unpredictability
• Unstable market• New “surprise financial item” (vs. IBNR)• Surprise for regulators as well as health plans
• -> Complicated, unreasonable pricing exercise

Summary and Looking Ahead
6/12/2017 Slide 10
1. Risk adjustment (RA) models require equity, predictability, and removal of selection incentives;• “we don’t care who we enroll” (some exceptions)
2. RA models should be based on actuarial risk.3. RA models should not dampen incentives for cost-
effective operations and innovation.4. Today, there are incentives for high premiums and
enrolling high risk individuals.5. RA challenges will be magnified with legislative
changes to the ACA.

Summary and Looking Ahead
6/12/2017 Slide 11
6. RA relies on ACA provisions: Essential health benefits, uniform age curve, metal levels.• All of these could be disrupted with AHCA state waivers.
7. New mechanics of federal assistance should theoretically impact risk adjustment.
• Could “double-dip” Reinsurance under ACA• State Stability Funds• Invisible High Risk Pools
8. “President Trump's experts will have an even harder job than did President Obama's. As more variation is permitted in insurance policies, and as the disparity in risk levels among insurance buyers increases, risk adjustment becomes more necessary and difficult.” - Seth Chandler, Mercatus Center and University of Houston Law Center

Q&A and Wrap-Up

The ACA and Risk Adjustment: Round TwoHans Leida, PhD, FSA, MAAA
Erica Rode, PhD, ASA, MAAA
June 12, 2017

Limitations
This presentation is intended for informational purposes only. It reflects the opinions of the presenters, and does not represent any formal views held by Milliman, Inc. Milliman makes no representations or warranties regarding the contents of this presentation. Milliman does not intend to benefit or create a legal duty to any recipient of this presentation.
2

Agenda
Lightning review of ACA risk adjustment and program results to date
Sampling of challenges and successes
Coming changes to the model
Potential changes to the program under the new administration
Strategies for success and management
3

ACA changes to individual and small group markets
Creation of Exchanges
Single risk pool
Guaranteed issue
Elimination of underwriting
Limitation of rating variables for carriers
Only plan design/network, age, geography, family size, and tobacco
Prevented charging higher premium for health status
4
ACA risk adjustment program
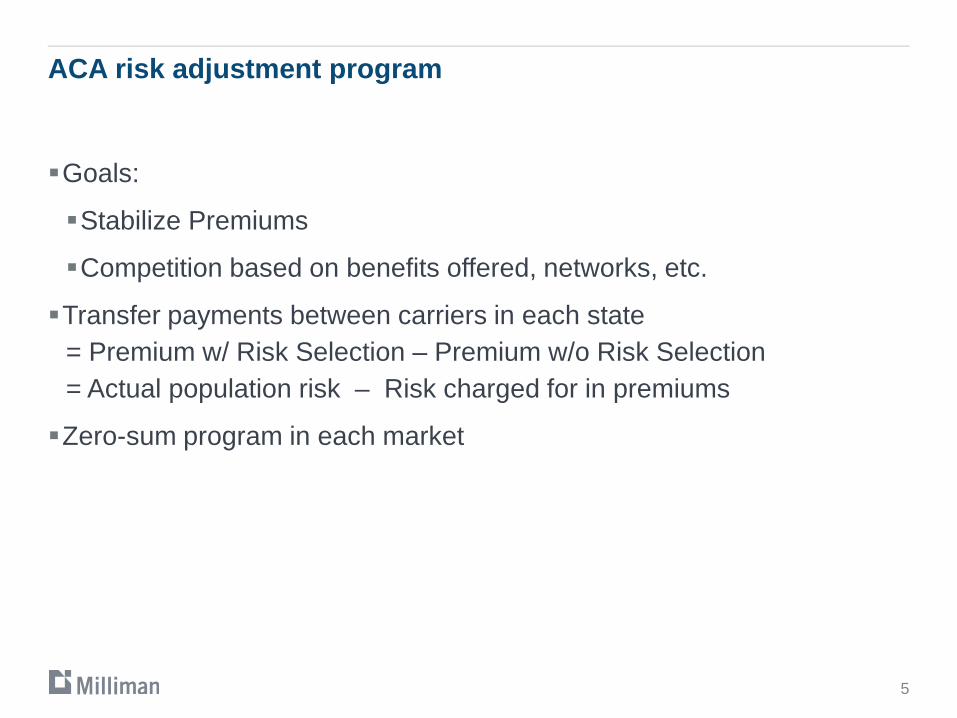
Goals:
Stabilize Premiums
Competition based on benefits offered, networks, etc.
Transfer payments between carriers in each state= Premium w/ Risk Selection – Premium w/o Risk Selection= Actual population risk – Risk charged for in premiums
Zero-sum program in each market
5

Risk score calculationHHS-HCC Model
Scores based on age, gender, and filtered Medical diagnosis dataClaims filtered based on procedure codes and bill type codesDiagnoses grouped into Hierarchical Condition Categories (HCCs)127 HCCs developed by modifying CMS-HCCs for commercial population
Coefficients developed to predict net plan liabilityCoefficients reflect Medical and Rx claimsSeparate model calculated for each metal and age group (adult, child, infant)
Concurrent model
6

7
So, how’s it going?

Results to dateOverview
2014 2015 % ChangeIndividual Market
Total Market Premium $35,359 M $59,261 M 67.6%Total Transfer Payments $3,506 M $5,615 M 60.2%Transfer Payments/Premium 9.9% 9.5% -4.4%
Small Group MarketTotal Market Premium $19,338 M $38,270 M 97.9%Total Transfer Payments $1,131 M $2,159 M 90.9%Transfer Payments/Premium 5.9% 5.6% -3.6%
8
Source: Busch, F., et. al., (August 2016) On second thought: Initial insights from year 2 of the ACA risk adjustment program, from http://us.milliman.com/insight/2016/On-second-thought-Initial-insights-from-year-2-of-the-ACA-risk-adjustment-program/

Consistency of carrier year over year results
9
2014 Transfer Payment Distribution 2015 Transfer Payment DistributionIndividual Market
Receipt ReceiptPayment Payment
Graphs from: Busch, F., et. al., (August 2016) On second thought: Initial insights from year 2 of the ACA risk adjustment program, from http://us.milliman.com/insight/2016/On-second-thought-Initial-insights-from-year-2-of-the-ACA-risk-adjustment-program/

10
“At a broad level, the incentives to focus on risk selection have been attenuated by the risk adjustment program.”
-Paul D. Jacobs et al, Risk Adjustment, Reinsurance Improved Financial Outcomes for Individual Market Insurers with the Highest Claims
“Amount of paid claims is strongly correlated with risk scores.”
-Summary Report on Transitional Reinsurance Payments and Permanent Risk Adjustment Transfers for the 2015 Benefit Year

11
Source: Summary Report on Transitional Reinsurance Payments and Permanent Risk Adjustment Transfers for the 2015 Benefit Year

12
“Risk transfers are inaccurate predictors of claim costs.”
-Alan Vandagriff, et al, Sizing Up ACA Risk Adjustment Volatility
“The current HHS-HCC risk adjustment model established by CMS is known to understate risk scores for relatively healthy individuals and to overstate them for those with significant health conditions.”
- Richard Foster, Method to Address Estimation Bias in the HHS-HCC Risk Adjustment Model

13
CHOICES Coalition white paper: Impact of Risk Adjustment on Carriers’ 2015 Financial Performance in the Individual Market
Risk Adjustment Transfer Relative to Paid Claims
2015 Transfer PMPM
Incu
rred
Cla
ims
Sta
te A
vera
ge
$(150) $(100) $(50) $0 $50 $100 $150 $200
250%
200%
150%
100%
50%

Sampling of challenges and successes
14

Changes to the modelPast and Proposed
15
2014
Initial Model 2015
Minor logic changes
2016
Minor logic changes
Recalibrate
2017
Enrollment duration factors
Recalibrate
2018
Prescription drug data
High-cost enrollee
adjustment
Recalibrate
2019
Recalibrate on ACA
data

Changes to the risk adjustment modelData and Methods
Sample of approximately 200K members enrolled in the individual market in 2016RxC mapping developed based on information in the 2018 Notice with clinician
inputMembers scored under 2016, 2017, and 2018 models, using enrolled metal
level and 2016 data Impact of CSRs removed
16
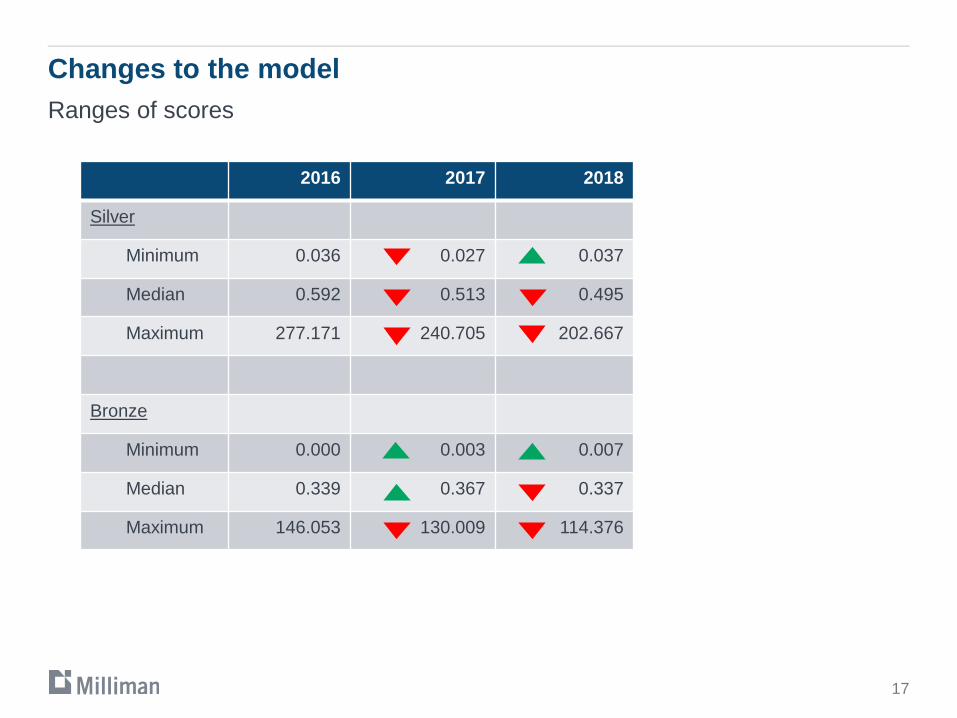
Changes to the modelRanges of scores
2016 2017 2018
Silver
Minimum 0.036 0.027 0.037
Median 0.592 0.513 0.495
Maximum 277.171 240.705 202.667
Bronze
Minimum 0.000 0.003 0.007
Median 0.339 0.367 0.337
Maximum 146.053 130.009 114.376
17

Components of model changesRaw scores
18

Components of model changesNormalized scores
19

Components of normalized risk score changes 2017 to 2018
20

Components of (normalized) risk score change
21
2017 to 2018

Components of normalized risk score changes
22
2017 to 2018

Proposed changes – 2019 recalibration on ACA dataData and Methods
Goal: compare risk adjustment and claim cost curves by age for individual market
ACA Individual Market DataApproximately 1.5 M lives in the 2015 individual market from Milliman’s internal
research database2016 silver HHS-HCC model scores calculated, excluding CSR impactCompared to paid claims for same membersLarge Group DataSample of large group data from Milliman’s Health Cost Guidelines -
Commercial Represent nationwide average billed charge levels for individuals/groups with
little to no underwritingAllowed claims estimated using Milliman benchmark nationwide discounts
applied to billed charges
23

Age curves
24

25
Proposed changes under new administration

Proposed changes under new administrationLoosening issue and rating rules
26
Strictest rating rulesLoosest rating rules
Loosest issue requirements
Strictest issue requirements
Greatest need for risk adjustment
Need for risk adjustment to lessen incentives to avoid high-cost
Least need for risk adjustment
Need for risk adjustment to lessen incentives to avoid high-cost
American Academy of Actuaries Issue Brief: How Changes to Health Insurance Market Rules Would Affect Risk Adjustment

Proposed changes under new administrationHigh-risk pooling
Different ways to structureTraditional – provide coverage in separately run poolInvisible – enrollees remain in the individual market, but a portion of their claims are reimbursed. Typically condition-based.Reinsurance – a portion of costs over some threshold are reimbursed, regardless of condition
Risk adjustment needs to coordinate with pool to avoid over-compensationE.g., use different conditions for invisible pool and risk adjusterMethod finalized in 2018 Notice: Exclude 60% of claims > $1 M from PLRS and fund from nationwide poolSeparate pool for small group and individual
27
American Academy of Actuaries Issue Brief: How Changes to Health Insurance Market Rules Would Affect Risk Adjustment

Proposed changes under new administrationIncreased flexibility in cost-sharing levels/EHB requirements
Current model assumes uniform EHB coverage and narrow AV rangesIf EHBs are still covered, can still use an AV calculatorWould require recalibration of risk adjustment modelCould continue to use ranges of AVs or switch to one model with AV as input
Increases selection risk if <60% AV allowed
28
American Academy of Actuaries Issue Brief: How Changes to Health Insurance Market Rules Would Affect Risk Adjustment

Proposed changes under new administrationAllowing sales across state lines
Challenges revenue-neutral aspect Differences in age curves or other requirementsEnrollees must be part of licensing states risk poolUnclear how to handle geographic factors for out-of-state regions
29
American Academy of Actuaries Issue Brief: How Changes to Health Insurance Market Rules Would Affect Risk Adjustment

Proposed changes under new administrationIncreased state variation
Could introduce different high risk poolsMay need to develop state-specific risk adjustment modelsSome elements of transfer formula could vary easily, but fundamental changes to methodology would make it more difficult for CMS to administerMore administratively complicated, less cost-effective for multi-state insurers
30
American Academy of Actuaries Issue Brief: How Changes to Health Insurance Market Rules Would Affect Risk Adjustment

Proposed changes under new administrationElimination of cost sharing reduction subsidies
CSR subsidies future is very uncertainRisk adjustment currently assumes carriers will be reimbursed for CSRsRisk adjustment currently attempts to spread the induced utilization associated with CSRs across the single risk poolNot yet clear how carriers would be required to implement rate changes for CSR shortfallsRate up silver plans only, spread across the pool, or ???Risk adjustment program will need to be altered to dovetail with rating rulesPolicy question: should risk adjustment be used to spread unfunded CSRs across the single risk pool?
31
Pedro Alcocer, et al, A bridge too far? The most likely fates of ACA CSR payments and impacts on the individual market

Comprehensive Risk Adjustment Management Program (RAMP)
• Timely• Accurate• Complete
• Data and score match
• Make sure it’s right
• Facilitate, document and code it right
Prospective Data
CollectionRetro Data Correction
Data Submission
Risk Score Verification
32
