session 1 kumagai japanese ofdi and the industrialisation in east asia and asean countries
TRANSCRIPT

Japanese OFDI and the Industrialisation in East Asia and ASEAN countries
Satoru KUMAGAI
IDE-JETRO
Japanese outward FDI(OFDI) to East Asia is a source of export-oriented industrialisation in the
region, especially for ASEAN member countries. Japanese OFDI increases significantly after the
Plaza According 1985, then again peaked at the middle of the 1990’s and plunged after the Asian
financial crisis 1997/98, then resurged in the first half of the 2000s. The formation of production
networks through Japanese OFDI helps the export-oriented industrialization in East Asia and
ASEAN countries, as well as it is a driving force of upgrading industrial structure in the region,
a la Flying Geese pattern.
Introduction
East Asia has recorded a high economic growth rate well above the world average for the last
several decades, as described in the East Asian Miracle by the World Bank (1993). The sequential
economic development process in East Asia is often illustrated as ‘Flying Geese’ (Kojima, 2000).
Japan, first, start industrialization after the Meiji Restoration in the late 19th century, and becomes
the only industrialised country in the 1960s despite the disruption by the world war II. Next, four
Asian Newly Industrialised Economies (NIEs) or Asian Tigers, namely, Hong Kong, Singapore,
Taiwan and Korea, had started export-oriented industrialisation in the 1960s. Following the suit
of Asian NIEs, ASEAN 4(Indonesia, Malaysia, Thailand, Philippines) had also started export-
oriented industrialisation in the 1970s, but they are more keen to invite Foreign Direct Investment
(FDI) than their predecessors, and the strategy fit well to the ‘push’ factor in Japan after the Plaza
Accord of 1985, which caused a drastic appreciation of Japanese Yen against US dollar. In the
1990’s, China joined the developing Asia, after Den Xiaoping’s Southern Tour in 1992 and the
depreciation of RMB in 1994, followed by Vietnam, and now the wave of industrialisation
reached to Lao PDR, Cambodia, and Myanmar at last.
The driving force of this system of economic development is the formation of production
networks in the region by represented by a massive increase in intra- regional trade, and the
relocation of the Multi-National Corporations (MNCs) through FDI. They are the other side of
the same coin each other. The intra-regional trade in East Asia is heavily skewed toward

intermediate goods (Kuroiwa and Kumagai 2011), meaning that this region is functioning as
‘Factory Asia.’
In this paper, I try to illustrate the formation of the production networks in East Asia, especially
focusing on the relationship between Japan and the ASEAN member countries from the viewpoint
of international trade and FDI. First in section 1, the history of Japanese outward FDI(OFDI) and
its background are briefly explained. In section 2, the characteristics of Japanese OFDI to East
Asia are investigated country by country. In section 3, the sequential upgrading of East Asian
countries in export structure a la Flying Geese (FG) pattern is overviewed. Then we conclude the
paper with the summary of findings.
1. Japanese FDI, from a historical perspective
There are multiple ‘waves’ in Japanese OFDI to East Asia. Figure 1 shows the historical change
in the number of Japanese manufacturing OFDI and its share by region. It is obvious that the
number of Japanese manufacturing OFDI has surged after the Plaza Accord of 1985, the
agreement among G-7 countries to allow the dramatic depreciation of the US dollar. The first
peak of Japanese OFDI triggered by the Plaza Accord consists of the OFDI to Asian NIEs (Hong
Kong, Taiwan, Korea and Singapore) and ASEAN4 (Indonesia, Malaysia, Thailand, Philippines)
countries.
The second peak of Japanese OFDI appeared at the mid-1990’s and consists of OFDI to China
and ASEAN4. In case of China, the number had increased significantly after the adoption of
export-oriented policy and the devaluation of RMB in 1994. For ASEAN countries, the second
wave appears driven by further appreciation of Japanese Yen against US Dollar peaked at 1995.
The third peak of Japanese manufacturing OFDI is in the first half of the 2000s, mainly to China.
The growing number of Japanese OFDI to China reflects broader FDI both export oriented and
to penetrate in China’s huge domestic market. Almost 70% of Japanese manufacturing OFDI to
East Asia goes to China in this period.
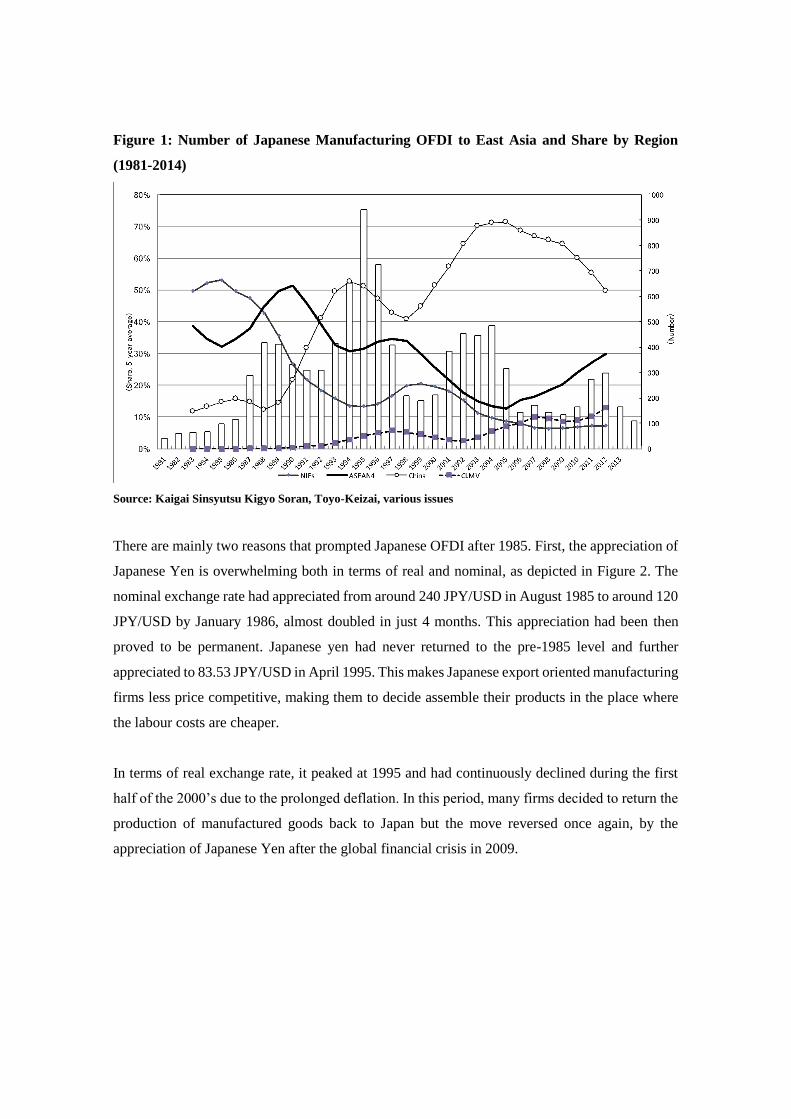
Figure 1: Number of Japanese Manufacturing OFDI to East Asia and Share by Region
(1981-2014)
Source: Kaigai Sinsyutsu Kigyo Soran, Toyo-Keizai, various issues
There are mainly two reasons that prompted Japanese OFDI after 1985. First, the appreciation of
Japanese Yen is overwhelming both in terms of real and nominal, as depicted in Figure 2. The
nominal exchange rate had appreciated from around 240 JPY/USD in August 1985 to around 120
JPY/USD by January 1986, almost doubled in just 4 months. This appreciation had been then
proved to be permanent. Japanese yen had never returned to the pre-1985 level and further
appreciated to 83.53 JPY/USD in April 1995. This makes Japanese export oriented manufacturing
firms less price competitive, making them to decide assemble their products in the place where
the labour costs are cheaper.
In terms of real exchange rate, it peaked at 1995 and had continuously declined during the first
half of the 2000’s due to the prolonged deflation. In this period, many firms decided to return the
production of manufactured goods back to Japan but the move reversed once again, by the
appreciation of Japanese Yen after the global financial crisis in 2009.

Figure 2: Nominal and Real Effective Exchange Rate of Japanese Yen(Jan. 1980-Aug. 2016,
monthly)
Source: Bank of Japan Website.
The second reason of Japan’s massive OFDI to East Asia is the ever-increasing manufacturing
wages in Japan. Japan’s per capita income reached to the high-income stage in the 1960s and the
nominal wages in the manufacturing sector had been almost quadruple in the 1970s (Figure 3).
Higher wages become burden to the export-oriented manufacturing firms. After the Plaza Accord,
Bank of Japan (BOJ) set the interest rate low to boost the domestic economy, to cope with the
sluggish exports by the yen appreciation. This loose financial policy is appropriate at the
beginning, but protracted easing monetary policy leads to the ‘bubble’ economy in the latter half
of the 1980’s (Posen 2003). The booming service sector absorbed labour force, then
manufacturing worker become an unpopular job among young Japanese. This leads to labour
shortage in the manufacturing sector, accelerated the increases in wages further.

Figure 3: Wages in Japanese Manufacturing Sector(1970-2000)
Source: Website of National Tax Agency,Japan
Note: the manufacturing wage is the average of four sectors, namely textile, chemical, steel and machinery, and
other manufacturing.
Combining two factors mentioned above, namely, the drastic appreciation of Japanese Yen and
ever increasing nominal wages in manufacturing sectors, it is obvious that Japanese
manufacturing companies suffered from the increases in the labour costs in US Dollar term. Table
1 shows annual wages in Japanese manufacturing sector in Japanese Yen and US Dollar. The
wages hiked from around 12,504 USD in 1984 to 40,035 USD in 1995. It was natural that a
number of assembly plans shifted from Japan to other East Asian countries.
Another aspect of Japanese OFDI to East Asia is market-oriented FDI. For the last three decades,
East Asian countries has been steadily growing, making their home market large enough to be
attractive for Japanese firms. Figure 4 shows the combined GDP of East Asian countries,
standardized by Japan’s GDP in the same year as 1.0. We found the size of combined East Asian
GDP relative to Japan’s own GDP is almost the same in 1985 and 2000 in USD term, because of
the drastic appreciation of Japanese Yen, making Japan’s GDP larger in USD term. It is the first
time that the combined East Asian GDP surpassed Japan’s GDP after 1961. China’s GDP is 2.25
times of Japan in 2014, while the combined GDP of NIEs and ASEAN4 are 70.6% and 41.7% of
Japan’s GDP in 2014. Thus, it is natural to think the market-seeking OFDI to these countries are
typical after year 2000, although some industries like automotive industry, which started investing

in East Asian countries as early as the 1960’s, to avoid the extremely high tariffs on Completely
Build-up(CBU) cars.
Table 1: Annual Wages in Japanese Manufacturing Sector in JPY and USD(1980-2000)
Source: Author’s calculation.

Figure 4: Combined GDP of East Asian Countries, relative to Japanese GDP(1981-2014)
Source: Calculated by Authors from World Development Indicators.
2. The Characteristics of Japanese OFDI to ASEAN4
In this section, we will investigate the different characteristics of Japanese OFDI to East Asian
and ASEAN 4 countries. Table 2 shows the stock of Japanese OFDI to Asian countries by industry
at the end of 2015. China has the largest stock, 12,986 billion JPY, followed by Thailand (6,033
billion JPY) and Singapore (5,901 billion JPY). In all countries except for Hong Kong and
Singapore, the manufacturing FDI stock dominates the non-manufacturing stock.
Although the main motivation of Japanese OFDI to these countries are mainly to cope with ever
increasing labour costs in Japan, Japanese OFDI stock in East Asian countries have some different
characteristics country by country, according to the characteristics of host countries. Table 3
shows the share of each industry for Japanese OFDI country by country. For Asia in total, the
manufacturing share(57.2%) dominates the non-manufacturing share(42.8%), meaning that
Japanese OFDI in this region is production oriented. The share of manufacturing is even higher
if two countries, Hong Kong and Singapore, which are major location of Regional Headquarters
for Japanese MNCs, are excluded.
Table 2: Japanese OFDI by country and industry (billion JPY, at the end of 2015)

Food Textile Resources Materials Machinery Electronics Transport Eq. Manufacturing Non-Mfg. Total
World 8,914 684 3,812 18,419 8,140 11,185 12,942 65,714 82,086 147,800
Asia 1,754 360 3,231 6,432 3,149 4,420 5,594 24,351 18,188 42,540
China 416 169 847 1,950 1,625 1,640 1,846 8,629 4,338 12,968
Hong Kong 61 19 28 91 126 244 7 656 2,210 2,866
Taiwan 8 0 0 289 107 379 96 928 435 1,363
Korea 15 3 284 1,232 156 344 102 1,950 1,819 3,769
Singapore 794 0 1 438 101 233 187 2,056 3,845 5,901
Thailand 88 60 415 890 446 686 1,250 3,825 2,208 6,033
Indonesia 69 52 134 417 126 100 807 1,813 1,117 2,930
Malaysia 29 21 45 477 143 187 94 1,040 591 1,631
Philippines 214 0 25 247 35 302 127 975 508 1,483
Vietnam 48 12 1,029 265 165 135 182 1,050 524 1,574
India 7 8 45 102 115 149 831 1,280 418 1,698
Source: BOJ Website.
Note: data not disclosed is counted as 0. ‘Resources’ includes Lumber, Rubber and Petroleum sectors. ‘Material’
sector includes Chemicals, Glass and Iro sectors. ‘Machinery’ includes General Machinery and Precision sectors.
Table 3: Share of Industry in Japanese OFDI by country (at the end of 2015)
Food Textile Resources Materials Machinery Electronics Transport Eq. Other Mfg. Non-Mfg.
World 6.0% 0.5% 2.6% 12.5% 5.5% 7.6% 8.8% 44.5% 55.5%
Asia 4.1% 0.8% 7.6% 15.1% 7.4% 10.4% 13.2% 57.2% 42.8%
China 3.2% 1.3% 6.5% 15.0% 12.5% 12.6% 14.2% 66.5% 33.5%
Hong
Kong 2.1% 0.7% 1.0% 3.2% 4.4% 8.5% 0.2% 22.9% 77.1%
Taiwan 0.6% 0.0% 0.0% 21.2% 7.9% 27.8% 7.1% 68.1% 31.9%
Korea 0.4% 0.1% 7.5% 32.7% 4.1% 9.1% 2.7% 51.7% 48.3%
Singapore 13.5% 0.0% 0.0% 7.4% 1.7% 4.0% 3.2% 34.8% 65.2%
Thailand 1.5% 1.0% 6.9% 14.8% 7.4% 11.4% 20.7% 63.4% 36.6%
Indonesia 2.4% 1.8% 4.6% 14.2% 4.3% 3.4% 27.6% 61.9% 38.1%
Malaysia 1.8% 1.3% 2.8% 29.3% 8.8% 11.4% 5.8% 63.8% 36.2%

Philippines 14.4% 0.0% 1.7% 16.7% 2.3% 20.4% 8.6% 65.7% 34.3%
Vietnam 3.1% 0.7% 65.4% 16.8% 10.5% 8.6% 11.6% 66.7% 33.3%
India 0.4% 0.5% 2.7% 6.0% 6.8% 8.8% 48.9% 75.4% 24.6%
Source: Authors calculation on Table 2.
Note: data not disclosed is counted as 0. ‘Resources’ includes Lumber, Rubber and Petroleum sectors. ‘Material’
sector includes Chemicals, Glass and Iron sectors. ‘Machinery’ includes General Machinery and Precision
sectors.
For Thailand, the share of transport equipment sector is the largest (20.7%), followed by material
sector (14.8%) and electronics sector(11,4%). As presented in this number, Thailand is the largest
production base of Japanese automotive firms in ASEAN and now one of the global export centre
for Japanese automotive MNCs, especially after the Asian financial crisis in 1997/1998.
For Indonesia, the share of transport equipment sector is the largest (27.6%), followed by material
sector (14.2%) and resource sector (4.6%). The industrial composition in Indonesia is relatively
similar to Thailand, except for that the share of electronics sector is much lower in Indonesia than
Thailand.
For Malaysia, the composition of industry in Japanese OFDI is different from Thailand and
Indonesia. The share of Material sector is the largest (29.3%), followed by electronics sector
(11.4%) and Machinery sector (8.8%). The higher share of Material sector is because of that
Malaysia is a resource rich country, producing crude oil and natural gas, timber, tin, rubber and
palm oil. The share of transport equipment sector (5.8%) is much lower than two countries
mentioned above, mainly because of the national car maker, Proton and Perodua, has dominated
the domestic market, preventing Japanese firms from investing large in Malaysia.
For Philippines, the share of electronics sector is the largest (20.4%), followed by material sector
(16.7%) and food sector (14.4%). This large presence in food industry seems to reflect the large
investment of Kirin Beverage Co. to San Miguel Brewery Inc., acquired 48.39% share in 2009.
3. Flying Geese of East Asia from the Viewpoint of Export Structure
3.1 FDI and trade in East Asia
Economic development in East Asia is characterized by the sequential “take-off” of member
countries. This multi-tiered economic development in East Asia is often termed the “Flying Geese”

pattern of economic development. Kojima (2000) insists the FDI conducted in East Asia is mainly
so-called pro-trade oriented FDI(PROT-FDI) and PROT-FDI is behind the Flying Geese pattern
of economic development in East Asia. PROT-FDI is the FDI conducted by the industry in one
country that has less comparative advantage in that goods to the country with more comparative
advantage in that goods. The host county can enhance the productivity of the FDI industry and
increase the exports while the home country can also enhance the productivity of own
comparative advantageous industry by the resource released from the FDI industry.
Urata (2001) found FDI has trade enhancing effects and its effects are especially stronger in the
early stage of foreign operation. This is because the newly established foreign firm in a host
country tends to depend on the procurement from the home country, and tendency to export the
goods back to the home market. This empirical analysis generally supports Kojima’s PROT-FDI
hypothesis.
Some authors argue the traditional Flying Geese pattern is not applicable to some industries like
smartphone. But this type of specific product-wise investigation of FG pattern is not proper in
this era of production ‘fragmentation’ (Kimura 2005). The value-added in a final product may
come from different countries that provide high value-added parts and components, not the
country provide assembling process.
Thus, we need to care about the production process in analysing the trade structure of a country.
Actually, this consciousness of production process is already presented in Akamatsu (1935, 1962),
the original paper of the FG pattern. The export structures of East Asian countries gradually
shifted from goods with a lower level of sophistication to goods with higher sophistication. A
country’s exports usually start with consumption goods, followed by parts and components and
capital goods. The net exports of primary commodities tend to be turned into net imports as
economic development progresses.
Here, we investigate three industry with different product sophistication, namely textile, E&E and
automotive, also divide each industry into final product and intermediate product. In case of
textile industry, we further added capital goods for the industry to the analysis, as shown in Table
4.
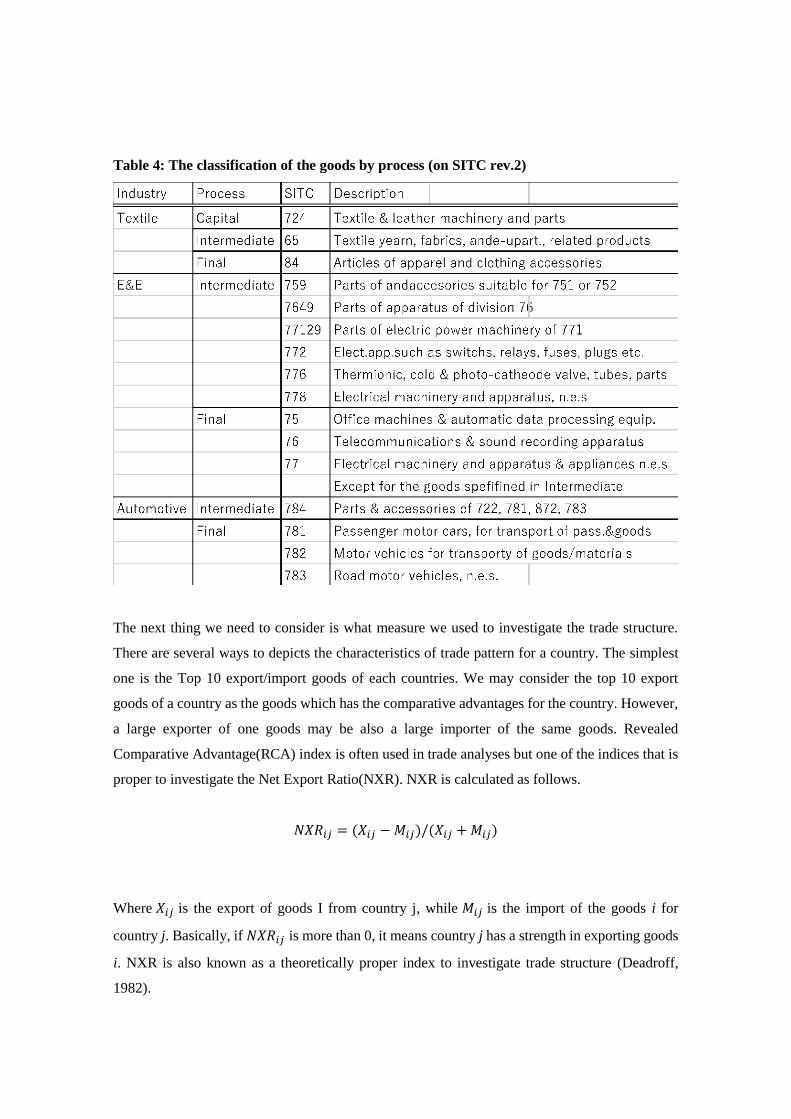
Table 4: The classification of the goods by process (on SITC rev.2)
The next thing we need to consider is what measure we used to investigate the trade structure.
There are several ways to depicts the characteristics of trade pattern for a country. The simplest
one is the Top 10 export/import goods of each countries. We may consider the top 10 export
goods of a country as the goods which has the comparative advantages for the country. However,
a large exporter of one goods may be also a large importer of the same goods. Revealed
Comparative Advantage(RCA) index is often used in trade analyses but one of the indices that is
proper to investigate the Net Export Ratio(NXR). NXR is calculated as follows.
𝑁𝑋𝑅𝑖𝑗 = (𝑋𝑖𝑗 −𝑀𝑖𝑗)/(𝑋𝑖𝑗 +𝑀𝑖𝑗)
Where 𝑋𝑖𝑗 is the export of goods I from country j, while 𝑀𝑖𝑗 is the import of the goods i for
country j. Basically, if 𝑁𝑋𝑅𝑖𝑗 is more than 0, it means country j has a strength in exporting goods
i. NXR is also known as a theoretically proper index to investigate trade structure (Deadroff,
1982).

The trade analysis by industry using NXR for selected East Asian countries is provided in
following subsections. We will investigate the NXRs for textile, electronics and electrical (E&E),
and automotive industry by country. We investigate NXR for Japan, as a leading goose, and
ASEAN4 countries and China, as following geese.
3.3 Textile Industry
First, we investigate the FG pattern in textile industry, which has typical labour intensive
processes for finished goods, while intermediate inputs (yarns and fibre) and capital goods, i.e.,
machinery for production, are more capital intensive. Figure 5 shows the NXRs for textile
industry in Japan, by three types of goods, namely capital, intermediate and final goods. The NXR
for the final goods is already negative in the late 1970’s, and further lowered to almost -1.0. Japan
had already lost the competitiveness in apparels and clothes, highly labour intensive, in the 1970’s.
In case of intermediate goods, Japan had been competitive long time but finally becomes net
importer in 2009. The NXR for the capital goods for textile industry has been always large
positive, meaning that Japan still has strength in the machinery for textile industry.
Figure 5: NXRs for Textile Industry in Japan by type of Goods(1978-2013, 5-year average)
Source: Calculated from UNCOMTRADE database.
Figure 6 shows the NXRs for textile industry in Indonesia. The NXR for the capital goods is
already negative, having no competitiveness. In case of intermediate goods, Indonesia becomes
net exporter since1984 and peaked at 2005, then started declining and becomes net importer again
after 2010. It is not clear that why the competitiveness has been lost but the deceasing NXR is
caused not by the declining exports but increasing imports. Indonesia has always been a net
exporter of apparels and clothes, although it has started declining slightly since the mid-2000’s.

This decline of NXR is also caused not by the declining exports but increasing imports.
Figure 6: NXRs for Textile Industry in Indonesia by type of Goods (1978-2013, 5-year
average)
Source: Calculated from UNCOMTRADE database.
Figure 7 shows the NXRs for textile industry in China. The NXR for capital goods is negative at
the beginning but gradually increasing and in positive area after 2012. In case of intermediate
goods, NXR had been around neutral in the 1990’s but increasing to large positive since the end
of 1990’s. China has been always a net exporter of final goods, staying around 1.0, i.e., huge
exports and negligible imports. Now China has strengths in all three production stages in the
industry.
Figure 7: NXRs for Textile Industry in China by type of Goods(1986-2013, 5-year average)
Source: Calculated from UNCOMTRADE database.
Figures 8, 9 and 10 show the NXRs for three types of the goods in textile industry for Japan,
ASEAN4 and China. Japan’s comparative advantages for apparels and clothes had peaked out
before the mid-1970’s, while ASEAN4 and China have strength until now. Japan’s NXR in

intermediate goods has been declining and overtaken by ASEAN4 and China in the latter half of
the 1990’s. Japan’s capital goods for textile industry keeps its strength until now, while China is
catching up rapidly.
All in all, in textile industry, Japan had lost strength in the final goods along ago, and losing
strength in the intermediate goods, while keeps the strength in the capital goods until now. China
and ASEAN4 has a strength in exporting final goods, and gradually gaining strength in exporting
intermediate and capital goods. Comparing China and ASEAN4, China has more strength in both
intermediate goods and capital goods.
Figure 8: NXRs for Final Goods of Textile Industry for Japan, ASEAN4 and China (1978-
2013, 5-year average)
Source: Calculated from UNCOMTRADE database.
Figure 9: NXRs for Intermediate Goods of Textile Industry for Japan, ASEAN4 and China
(1978-2013, 5-year average)
Source: Calculated from UNCOMTRADE database.
Figure 10: NXRs for Capital Goods of Textile Industry for Japan, ASEAN4 and China
(1978-2013, 5-year average)
Source: Calculated from UNCOMTRADE database.
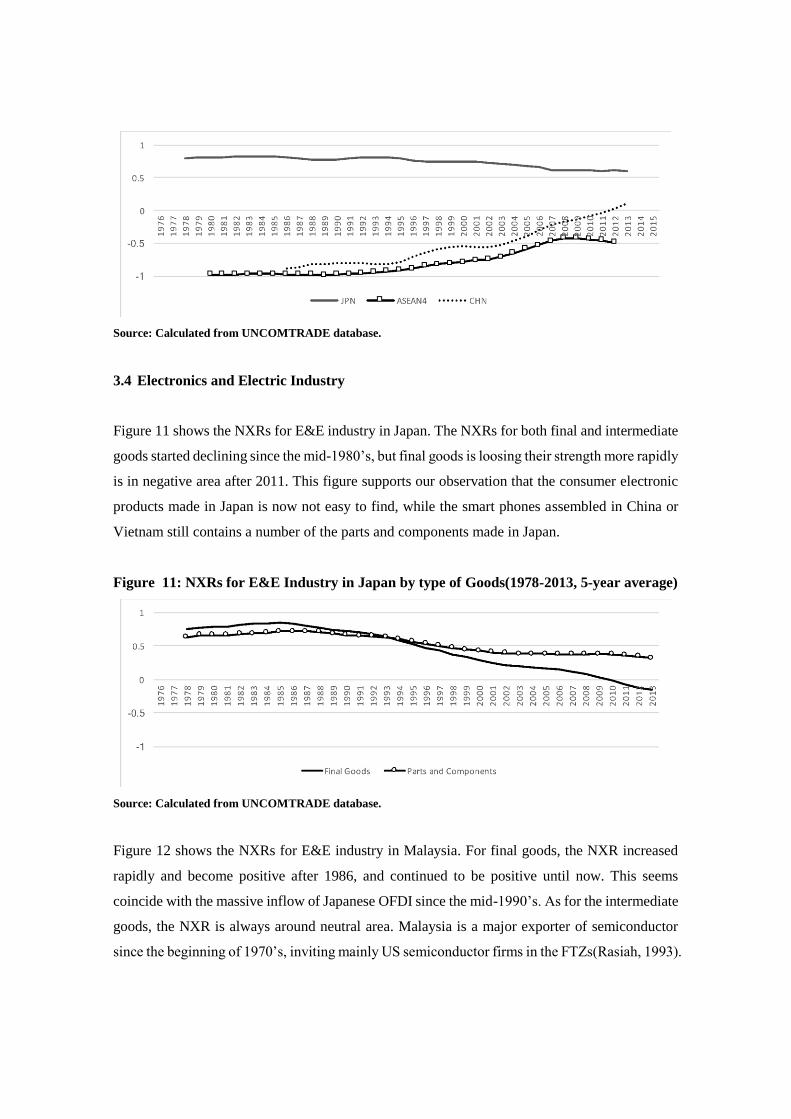
3.4 Electronics and Electric Industry
Figure 11 shows the NXRs for E&E industry in Japan. The NXRs for both final and intermediate
goods started declining since the mid-1980’s, but final goods is loosing their strength more rapidly
is in negative area after 2011. This figure supports our observation that the consumer electronic
products made in Japan is now not easy to find, while the smart phones assembled in China or
Vietnam still contains a number of the parts and components made in Japan.
Figure 11: NXRs for E&E Industry in Japan by type of Goods(1978-2013, 5-year average)
Source: Calculated from UNCOMTRADE database.
Figure 12 shows the NXRs for E&E industry in Malaysia. For final goods, the NXR increased
rapidly and become positive after 1986, and continued to be positive until now. This seems
coincide with the massive inflow of Japanese OFDI since the mid-1990’s. As for the intermediate
goods, the NXR is always around neutral area. Malaysia is a major exporter of semiconductor
since the beginning of 1970’s, inviting mainly US semiconductor firms in the FTZs(Rasiah, 1993).

Figure 12: NXRs for E&E Industry in Malaysia by type of Goods(1980-2012, 5-year
average)
Source: Calculated from UNCOMTRADE database.
Figure 13 shows the NXRs for E&E industry in China. The NXRs for both final goods and
intermediate goods have been increasing but final goods is always higher than intermediate goods.
This coincide with the facts that a number of electronic products are assembled in China, while
the parts and components for that are mainly imported until recently.
Figure 13: NXRs for E&E Industry in China by type of Goods(1986-2013, 5-year average)
Source: Calculated from UNCOMTRADE database.
Figures 14 and 15 show the NXRs for the final goods and intermediate goods of E&E industry
for Japan, ASEAN4 and China. It is clear China and ASEAN overtook Japan at the beginning of
the 2000’s for the final goods, while Japan keeps its strength in the intermediate goods, although
the margin is slimming.
Figure 14: NXRs for Final Goods of E&E Industry for Japan, ASEAN4 and China (1978-
2013, 5-year average)

Source: Calculated from UNCOMTRADE database.
Figure 15: NXRs for Intermediate Goods of E&E Industry for Japan, ASEAN4 and China
(1978-2013, 5-year average)
Source: Calculated from UNCOMTRADE database.
3.5 Automotive Industry
Figure 16 shows the NXRs for automotive industry in Japan. The NXRs for final goods and
intermediate goods are both highly positive. The NXR for intermediate goods seems to be
declining but still in a large positive area.
Figure 17 shows the NXRs for automotive industry in Thailand. The NXRs for both final goods
and intermediate goods are initially negative, around -1.0. The NXR for final product, i.e.,
assembled cars, have started increasing rapidly since mid-1990’s and in positive area after 1998.
This coincides with that fact that Japanese automotive firms start exporting assembled cars from
Thailand to keep the operation ratio of their factory under the plunged domestic demand in
Thailand because of the Asian financial crisis in 1997/1998(Poapongsakorn and Techakanont,
2008). The NXR for intermediate products, i.e., automotive parts and components, started
increasing since mid-1990’s and now almost in neutral area.

Figure 18 shows the NXRs for automotive industry in China. The NXR of intermediate goods
had been negative before 2006 but after that, always around neutral. In case of final goods, the
NXR is always negative although gradually increasing. This means China has a higher
competitiveness in automotive parts rather than assembled cars.
Figure 16: NXRs for Automotive Industry in Japan by type of Goods(1978-2013, 5-year
average)
Source: Calculated from UN COMTRADE database.
Figure 17: NXRs for Automotive Industry in Thailand by type of Goods(1978-2013, 5-year
average)
Source: Calculated from UN COMTRADE database.
Figure 18: NXRs for Automotive Industry in China by type of Goods(1987-2013, 5-year

average)
Source: Calculated from UN COMTRADE database.
Figure 19 and 20 show the NXRs for the final goods of automotive industry for Japan, ASEAN4
and China. It is clear Japan keeps its strength in both assembled cars and automotive parts and
components. ASEAN4 seems to be catching up rapidly since mid-1990’s, mainly by the exports
of assembled cars from Thailand, but the competitiveness of the automotive parts and components
still not strong. China is likely to be a net exporter of automotive parts and components soon but
not for assembled cars.
Figure 19: NXRs for Final Goods of Automotive Industry for Japan, ASEAN4 and China
(1978-2013, 5-year average)
Source: Calculated from UN COMTRADE database.
Figure 20: NXRs for Intermediate Goods of Automotive Industry for Japan, ASEAN4 and

China (1978-2013, 5-year average)
Source: Calculated from UN COMTRADE database.
3.6 Inter-industry Comparison within a Country
In this subsection, we will conduct inter-industry comparison within a country. Akamatsu(ibid.)
predicts the exports of less sophisticated goods start earlier, then shifted to more sophisticated
goods. We will check this predicted pattern is observed in selected East Asian countries.
3.6.1 Japan
Figures 21 and 22 shows the NXRs for textile, E&E and automotive industries in Japan for final
and intermediate goods respectively. For final goods, the NXR for automotive industry is always
the highest, followed by E&E industry, and textile industry is always the weakest. This order is
the same in intermediate goods. This seems coincide with the prediction of the FG model and the
theory of comparative advantages, that an economically advanced country exports more
sophisticated or more capital intensive goods.
Figure 21: NXRs for Final Goods by Industry in Japan (1978-2013, 5-year average)
Source: Calculated from UN COMTRADE database.

Figure 22: NXRs for Intermediate Goods by Industry in Japan (1978-2013, 5-year average)
Source: Calculated from UN COMTRADE database.
3.6.2 ASEAN4
Figures 23 and 24 shows the NXRs for textile, E&E and automotive industries in ASEAN4
countries for final and intermediate goods respectively. For final goods, the NXR for textile
industry is always the highest, followed by E&E industry, and automotive industry is always the
weakest. This order is the same in intermediate goods, although not as obvious as for final goods.
The order in ASEAN4 is completely reverse compared with Japan, i.e., more labour intensive
industry seems to have a higher competitiveness. This also coincides with the prediction of the
FG model and also the theory of comparative advantages, that an economically less advanced
country exports less sophisticated or more labour intensive goods.
Figure 23: NXRs for Final Goods by Industry in ASEAN4(1978-2012, 5-year average)
Source: Calculated from UN COMTRADE database.
Figure 24: NXRs for Intermediate Goods by Industry in ASEAN4(1978-2012, 5-year

average)
Source: Calculated from UN COMTRADE database.
3.6.3 China
Figures 25 and 26 shows NXRs for textile, E&E and automotive in China for final and
intermediate goods respectively. For final goods, the NXR for textile industry is always the
highest, followed by E&E industry, and that for automotive industry is always the weakest. This
order is the same in intermediate goods, although the difference between automotive and E&E
industry is not clear. Still, more labour intensive industry seems to have a higher competitiveness,
again validates the theoretical predictions.
Figure 25: NXRs for Intermediate Goods by Industry in China(1986-2013, 5-year average)
Source: Calculated from UN COMTRADE database.
Figure 26: NXRs for Intermediate Goods by Industry in China(1986-2013, 5-year average)

Source: Calculated from UN COMTRADE database.
By the analyses using NXRs for three industries by production stage, we found the following
facts, namely,
1) The Flying Geese pattern of export structure in East Asia is robust. The NXR for each goods
in each production stage is ‘non-cyclical,’ having clear direction in the long run.
2) Japan, a leading goose, has still a strength in capital/intermediate goods rather than final
goods, and more capital intensive sector like automotive sector than a labour intensive sector
like textile industry.
3) ASEAN4 and China, following geese, has a strength in final goods rather than
capital/intermediate goods and more labour intensive sector than capital intensive sector.
4) It is not clear more advanced in the FG pattern, ASEAN4 or China. ASEAN4 has advantages
in the assembled car against China, while China and ASEAN4 has almost the same NXRs in
automotive parts and components. China has a strength in the final goods of E&E sector over
ASEAN4, while China and ASEAN4 has almost the same NXRs in E&E parts and
components.
3.7 Flying Geese Model and Spatial Economics
Indeed, the observed pattern of international transfer of different industries are generally
consistent with the theoretical prediction of a model based on spacial economics, proposed in the
chapter 15 of Fujita et. al(1999). The model predicts that industries move to one country to another
in following sequence, like 1) labour intensive industries move earlier than capital intensive
industries, 2) the production of consumption goods moves first then the production of
intermediate goods follows, 3) industries with less industrial linkages with other industries move

earlier, 4) upstream industries move earlier than downstream industries. The last prediction is on
the assumption that there is no input linkage in the upstream sector. Generally, the results shown
this paper is consistent with the prediction by this model.
4 Conclusions
In this paper, we first investigated OFDI from Japan to East Asia. We found there are three peaks
of Japanese OFDI, namely, the latter half of 1980’s, mid-1990’s and the first half of 2000’s. These
peaks seem to reflect the export-oriented FDI to ASEAN, the export-oriented FDI to China, and
the market-seeking FDI to China.
Then, we investigated the motivation of OFDI from Japan. We found Japan’s manufacturing
wages in USD term is more than triple during just ten years between 1985-1995. This is the
background of the first two peaks of Japanese OFDI to East Asia. In contrast, the market size of
East Asia compared with Japan’s own market in terms of USD is not increasing between 1981
and 2000. Thus, the market-seeking OFDI to East Asia is only plausible for the third peak of
Japan's OFDI to the region.
Third, we investigated some characteristics of Japan’s OFDI to ASEAN4 by country. Although
the OFDI to ASEAN4 is dominated by manufacturing sector, the composition differs country by
country. For Thailand and Indonesia, automotive sector is the largest share, while material sector
is the largest in Malaysia and E&E sector is the largest in the Philippines.
Fourth, we investigated whether the FG pattern of export structure is still viable for East Asian
region. All in all, the FG pattern in international dimension, i.e., developed countries have a
strength in capital intensive industry against less developed countries, and industrial order within
a country, i.e., developed countries have a strength in capital intensive industry against labour
intensive industry, is robust in East Asia. This is a consequence of the production networks that
growing through the last three decades, by the FDI from more advanced countries to less advanced
countries in the region.

References
Akamatsu, K (1935). Waga kuni yomo kogyohin no boueki susei. Shogyo Keizai Ronso,13: 129-
212.
___________ (1962). Historical pattern of economic growth in developing countries. The
Developing Economies, 1: 3-25.
Deardorff, A V (1982). The general validity of the Heckscher-Ohlin theorem. The American
Economic Review, 72(4):683-694.
Fujita, M., Krugman, P. and Venables (1999), The spatial economy. Cities, Regions and
International Trade. MA: MIT Press, Cambridge.
Kimura, F., & Ando, M. (2005). Two-dimensional fragmentation in East Asia: Conceptual
framework and empirics. International Review of Economics & Finance, 14(3), 317-348.
Kojima, K. (2000). The “flying geese” model of Asian economic development: origin, theoretical
extensions, and regional policy implications. Journal of Asian Economics, 11(4), 375-401.
Kuroiwa, I., and Kumagai, S. (2011). A history of de facto economic integration in East Asia. in
Fujita, M., Kuroiwa, I., and Kumagai, S. (Eds.). The economics of East Asian integration:
a comprehensive introduction to regional issues. Edward Elgar Publishing.
Poapongsakorn, N., & Techakanont, K. (2008). The development of automotive industry clusters
and production networks in Thailand. Production Networks and Industrial Clusters.
Singapore: ISEAS, 196-256.
Posen, A. S. (2003). It takes more than a bubble to become Japan. Institute for International
Economics Working Paper, (03-9).
Rasiah, R. (1993). Free trade zones and industrial development in Malaysia. Industrializing
Malaysia: Policy, Performance, Prospects.
Urata, S. (2001). Emergence of an FDI-trade nexus and economic growth in East Asia. Rethinking
the East Asian Miracle, 409-459.
World Bank(1993). The East Asian miracle: economic growth and public policy. Oxford
University Press.