ses...ses société anonyme château de betzdorf l-6815 betzdorf rcs luxembourg b 81267 consolidated...
TRANSCRIPT
SES
Société Anonyme
Château de Betzdorf
L-6815 Betzdorf
RCS Luxembourg B 81267
Consolidated financial statements as at and for the year ended
31 December 2018 and
Independent auditor’s report

2 | P a g e
Contents Auditor’s report………………………………………………………………………………………………………………………….................3
Consolidated income statement ........................................................................................................................................................ 10
Consolidated statement of comprehensive income ........................................................................................................................... 11
Consolidated statement of financial position ..................................................................................................................................... 12
Consolidated statement of cash flows ............................................................................................................................................... 13
Consolidated statement of changes in shareholders’ equity.............................................................................................................. 14
Consolidated statement of changes in shareholders’ equity.............................................................................................................. 15
Notes to the consolidated financial statements ................................................................................................................................. 16
Note 1 - Corporate information ..................................................................................................................................................... 16
Note 2 - Summary of significant accounting policies .................................................................................................................... 16
Note 3 - Implementation of new International Financial Reporting Standards .............................................................................. 34
Note 4 - Segment information ....................................................................................................................................................... 36
Note 5 - Operating expenses ........................................................................................................................................................ 39
Note 6 - Audit and non-audit fees ................................................................................................................................................. 39
Note 7 - Finance income and costs .............................................................................................................................................. 39
Note 8 - Income taxes................................................................................................................................................................... 40
Note 9 - Deferred income tax ........................................................................................................................................................ 42
Note 10 - Components of other comprehensive income ............................................................................................................... 43
Note 11 - Earnings per share ........................................................................................................................................................ 43
Note 12 - Dividends paid and proposed........................................................................................................................................ 44
Note 13 - Property, plant and equipment ...................................................................................................................................... 45
Note 14 - Assets in the course of construction ............................................................................................................................. 47
Note 15 - Intangible assets ........................................................................................................................................................... 48
Note 16 - Assets and liabilities related to contracts with customers ............................................................................................. 52
Note 17 - Trade and other receivables ......................................................................................................................................... 53
Note 18 - Financial instruments .................................................................................................................................................... 53
Note 19 - Financial risk management objectives and policies ...................................................................................................... 57
Note 20 - Cash and cash equivalents ........................................................................................................................................... 62
Note 21 - Shareholders’ equity ..................................................................................................................................................... 62
Note 22 - Non-controlling interest ................................................................................................................................................. 64
Note 23 - Share-based compensation plans ................................................................................................................................. 65
Note 24 - Interest-bearing borrowings .......................................................................................................................................... 69
Note 25 - Provisions ..................................................................................................................................................................... 72
Note 26 - Trade and other payables ............................................................................................................................................. 72
Note 27 - Other long-term liabilities .............................................................................................................................................. 73
Note 28 - Fixed assets suppliers .................................................................................................................................................. 73
Note 29 - Commitments and contingencies .................................................................................................................................. 74
Note 30 - Leases .......................................................................................................................................................................... 75
Note 31 - Cash flow information ................................................................................................................................................... 76
Note 32 - Related parties .............................................................................................................................................................. 77
Note 33 - Post-Balance Sheet events ........................................................................................................................................... 77
Note 34 - Consolidated subsidiaries, associates .......................................................................................................................... 78
PricewaterhouseCoopers, Société coopérative, 2 rue Gerhard Mercator, B.P. 1443, L-1014 Luxembourg T : +352 494848 1, F : +352 494848 2900, www.pwc.lu Cabinet de révision agréé. Expert-comptable (autorisation gouvernementale n°10028256) R.C.S. Luxembourg B 65 477 - TVA LU25482518
Audit report To the Shareholders of SES S.A.
Report on the audit of the consolidated financial statements Our opinion In our opinion, the accompanying consolidated financial statements give a true and fair view of the consolidated financial position of SES S.A. (the “Company”) and its subsidiaries (the “Group”) as at 31 December 2018, and of its consolidated financial performance and its consolidated cash flows for the year then ended in accordance with International Financial Reporting Standards (IFRSs) as adopted by the European Union. Our opinion is consistent with our additional report to the Audit and Risk Committee. What we have audited The Group’s consolidated financial statements comprise:
the consolidated statement of financial position as at 31 December 2018;
the consolidated income statement for the year then ended;
the consolidated statement of comprehensive income for the year then ended;
the consolidated statement of cash flows for the year then ended;
the consolidated statement of changes in shareholders' equity for the year then ended; and
the notes to the consolidated financial statements, which include a summary of significant accounting policies.
Basis for opinion We conducted our audit in accordance with the EU Regulation No 537/2014, the Law of 23 July 2016 on the audit profession (Law of 23 July 2016) and with International Standards on Auditing (ISAs) as adopted for Luxembourg by the “Commission de Surveillance du Secteur Financier” (CSSF). Our responsibilities under the EU Regulation No 537/2014, the Law of 23 July 2016 and ISAs as adopted for Luxembourg by the CSSF are further described in the “Responsibilities of the “Réviseur d’entreprises agréé” for the audit of the consolidated financial statements” section of our report. We believe that the audit evidence we have obtained is sufficient and appropriate to provide a basis for our opinion.
4
We are independent of the Group in accordance with the International Ethics Standards Board for Accountants’ Code of Ethics for Professional Accountants (IESBA Code) as adopted for Luxembourg by the CSSF together with the ethical requirements that are relevant to our audit of the consolidated financial statements. We have fulfilled our other ethical responsibilities under those ethical requirements. To the best of our knowledge and belief, we declare that we have not provided non-audit services that are prohibited under Article 5(1) of Regulation (EU) No 537/2014. The non-audit services that we have provided to the Company and its controlled undertakings, if applicable, for the year then ended, are disclosed in Note 6 to the consolidated financial statements.
Key audit matters Key audit matters are those matters that, in our professional judgment, were of most significance in our audit of the consolidated financial statements of the current period, and include the most significant assessed risks of material misstatement (whether or not due to fraud). These matters were addressed in the context of our audit of the consolidated financial statements as a whole, and in forming our opinion thereon, and we do not provide a separate opinion on these matters.
Key audit matter How our audit addressed the Key audit matter
Revenue recognition The application of revenue recognition accounting standards is complex and involves a number of key judgements and estimates in the determination of the appropriate accounting treatment (lease vs. service arrangements, identification of the performance obligations, barter transactions, principle versus agent considerations, etc.). We focused on this area due to the inherent complexity and judgement in applying the revenue recognition accounting standards and to the significant focus on the revenue amount (2,010.3 million EUR for the year ended 31 December 2018) by the users of the consolidated financial statements.
We obtained an understanding of the main revenue streams and evaluated the accounting policy for revenue recognition thereof;
We tested the design and implementation of relevant
internal controls;
We held discussions with Management on IFRS accounting analysis of any non-standard revenue contracts, performed testing of significant new revenue contracts and verified that the underlying revenue transactions were accounted in accordance with the substance of the commercial agreement and the relevant IFRS standards;
We performed substantive analytical procedures at year-end on revenue and revenue related accounting in order to identify any unusual variances;
We tested certain unusual and/or significant manual journal entries made to the revenue accounts, both at local and group level;
We evaluated the deferred revenue schedules and their reconciliation with the accounting;
We performed substantive testing of a sample of revenue transactions;
We considered the disclosures in the consolidated financial statements and assessed their appropriateness.
5
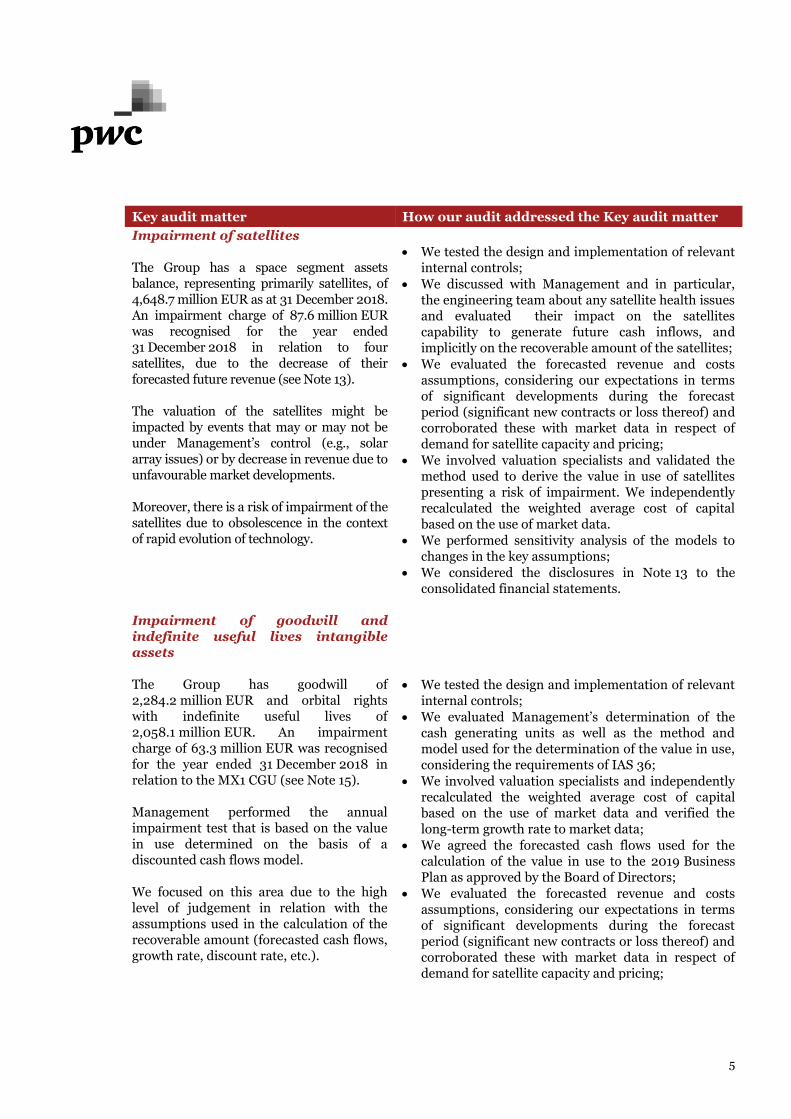
Key audit matter How our audit addressed the Key audit matter
Impairment of satellites The Group has a space segment assets balance, representing primarily satellites, of 4,648.7 million EUR as at 31 December 2018. An impairment charge of 87.6 million EUR was recognised for the year ended 31 December 2018 in relation to four satellites, due to the decrease of their forecasted future revenue (see Note 13). The valuation of the satellites might be impacted by events that may or may not be under Management’s control (e.g., solar array issues) or by decrease in revenue due to unfavourable market developments. Moreover, there is a risk of impairment of the satellites due to obsolescence in the context of rapid evolution of technology.
We tested the design and implementation of relevant internal controls;
We discussed with Management and in particular, the engineering team about any satellite health issues and evaluated their impact on the satellites capability to generate future cash inflows, and implicitly on the recoverable amount of the satellites;
We evaluated the forecasted revenue and costs assumptions, considering our expectations in terms of significant developments during the forecast period (significant new contracts or loss thereof) and corroborated these with market data in respect of demand for satellite capacity and pricing;
We involved valuation specialists and validated the method used to derive the value in use of satellites presenting a risk of impairment. We independently recalculated the weighted average cost of capital based on the use of market data.
We performed sensitivity analysis of the models to changes in the key assumptions;
We considered the disclosures in Note 13 to the consolidated financial statements.
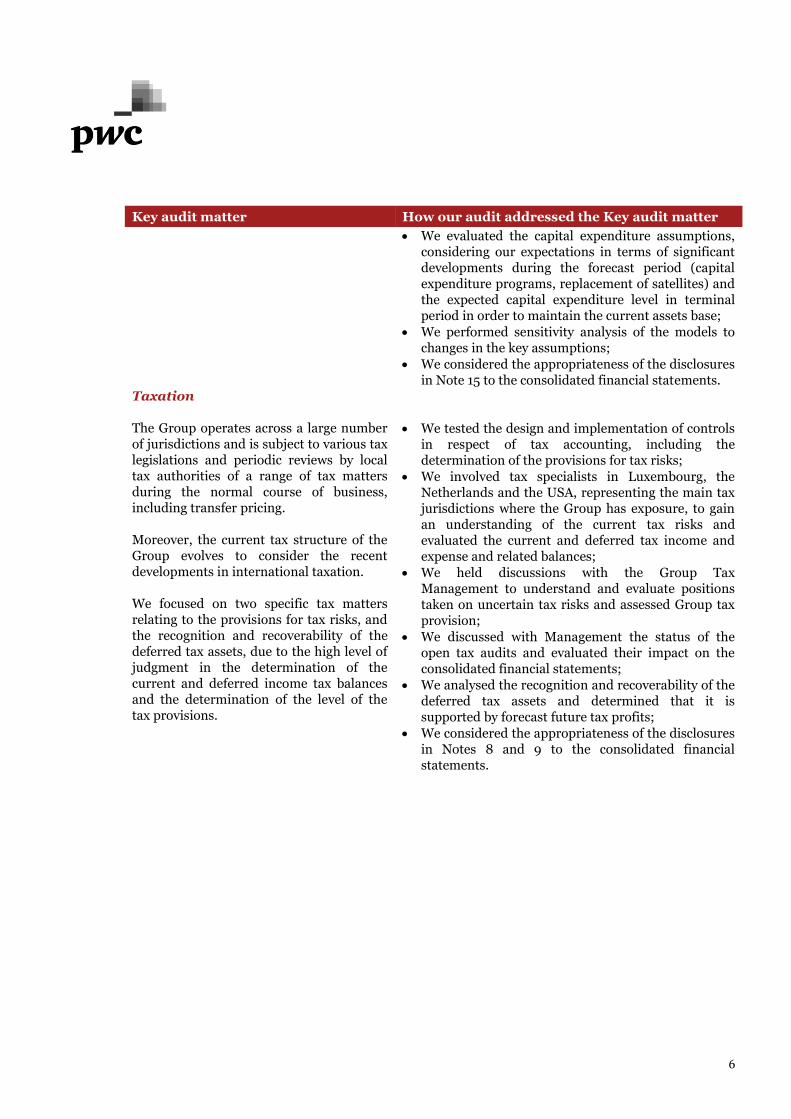
Impairment of goodwill and indefinite useful lives intangible assets The Group has goodwill of 2,284.2 million EUR and orbital rights with indefinite useful lives of 2,058.1 million EUR. An impairment charge of 63.3 million EUR was recognised for the year ended 31 December 2018 in relation to the MX1 CGU (see Note 15). Management performed the annual impairment test that is based on the value in use determined on the basis of a discounted cash flows model. We focused on this area due to the high level of judgement in relation with the assumptions used in the calculation of the recoverable amount (forecasted cash flows, growth rate, discount rate, etc.).
We tested the design and implementation of relevant internal controls;
We evaluated Management’s determination of the cash generating units as well as the method and model used for the determination of the value in use, considering the requirements of IAS 36;
We involved valuation specialists and independently recalculated the weighted average cost of capital based on the use of market data and verified the long-term growth rate to market data;
We agreed the forecasted cash flows used for the calculation of the value in use to the 2019 Business Plan as approved by the Board of Directors;
We evaluated the forecasted revenue and costs assumptions, considering our expectations in terms of significant developments during the forecast period (significant new contracts or loss thereof) and corroborated these with market data in respect of demand for satellite capacity and pricing;
6
Key audit matter How our audit addressed the Key audit matter
We evaluated the capital expenditure assumptions, considering our expectations in terms of significant developments during the forecast period (capital expenditure programs, replacement of satellites) and the expected capital expenditure level in terminal period in order to maintain the current assets base;
We performed sensitivity analysis of the models to changes in the key assumptions;
We considered the appropriateness of the disclosures in Note 15 to the consolidated financial statements.
Taxation The Group operates across a large number of jurisdictions and is subject to various tax legislations and periodic reviews by local tax authorities of a range of tax matters during the normal course of business, including transfer pricing. Moreover, the current tax structure of the Group evolves to consider the recent developments in international taxation. We focused on two specific tax matters relating to the provisions for tax risks, and the recognition and recoverability of the deferred tax assets, due to the high level of judgment in the determination of the current and deferred income tax balances and the determination of the level of the tax provisions.
We tested the design and implementation of controls in respect of tax accounting, including the determination of the provisions for tax risks;
We involved tax specialists in Luxembourg, the Netherlands and the USA, representing the main tax jurisdictions where the Group has exposure, to gain an understanding of the current tax risks and evaluated the current and deferred tax income and expense and related balances;
We held discussions with the Group Tax Management to understand and evaluate positions taken on uncertain tax risks and assessed Group tax provision;
We discussed with Management the status of the open tax audits and evaluated their impact on the consolidated financial statements;
We analysed the recognition and recoverability of the deferred tax assets and determined that it is supported by forecast future tax profits;
We considered the appropriateness of the disclosures in Notes 8 and 9 to the consolidated financial statements.
7
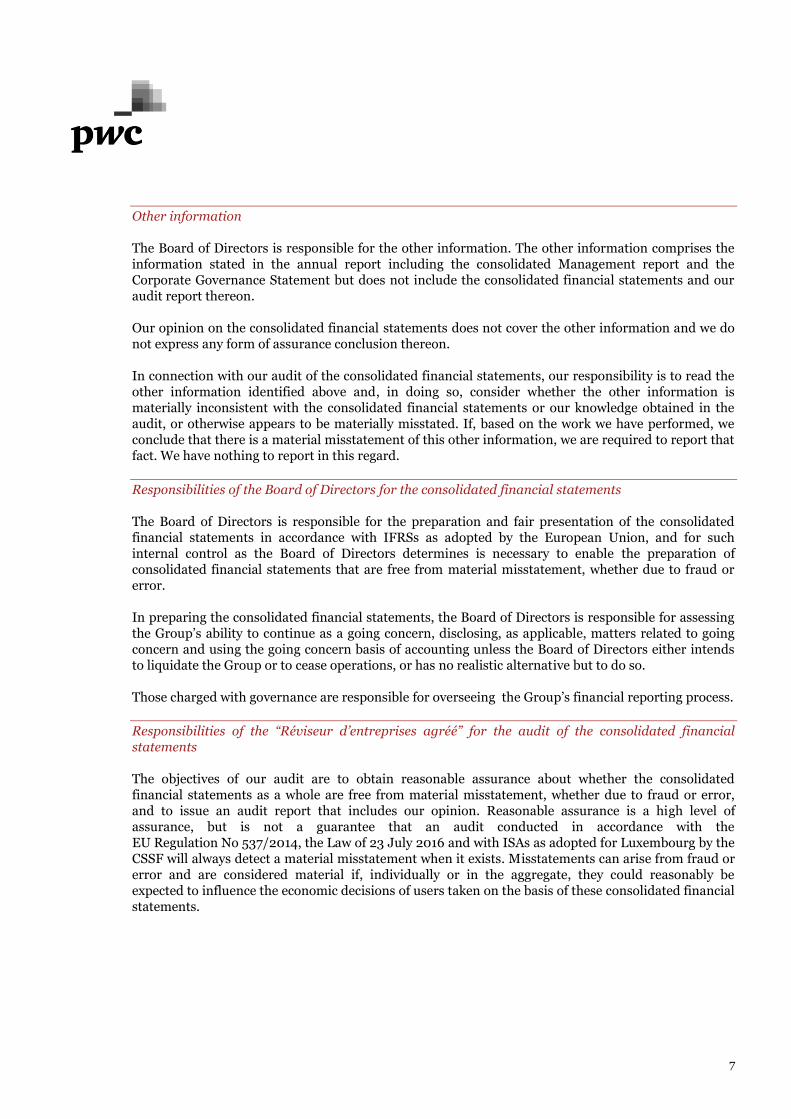
Other information The Board of Directors is responsible for the other information. The other information comprises the information stated in the annual report including the consolidated Management report and the Corporate Governance Statement but does not include the consolidated financial statements and our audit report thereon. Our opinion on the consolidated financial statements does not cover the other information and we do not express any form of assurance conclusion thereon. In connection with our audit of the consolidated financial statements, our responsibility is to read the other information identified above and, in doing so, consider whether the other information is materially inconsistent with the consolidated financial statements or our knowledge obtained in the audit, or otherwise appears to be materially misstated. If, based on the work we have performed, we conclude that there is a material misstatement of this other information, we are required to report that fact. We have nothing to report in this regard.
Responsibilities of the Board of Directors for the consolidated financial statements The Board of Directors is responsible for the preparation and fair presentation of the consolidated financial statements in accordance with IFRSs as adopted by the European Union, and for such internal control as the Board of Directors determines is necessary to enable the preparation of consolidated financial statements that are free from material misstatement, whether due to fraud or error. In preparing the consolidated financial statements, the Board of Directors is responsible for assessing the Group’s ability to continue as a going concern, disclosing, as applicable, matters related to going concern and using the going concern basis of accounting unless the Board of Directors either intends to liquidate the Group or to cease operations, or has no realistic alternative but to do so. Those charged with governance are responsible for overseeing the Group’s financial reporting process.
Responsibilities of the “Réviseur d’entreprises agréé” for the audit of the consolidated financial statements The objectives of our audit are to obtain reasonable assurance about whether the consolidated financial statements as a whole are free from material misstatement, whether due to fraud or error, and to issue an audit report that includes our opinion. Reasonable assurance is a high level of assurance, but is not a guarantee that an audit conducted in accordance with the EU Regulation No 537/2014, the Law of 23 July 2016 and with ISAs as adopted for Luxembourg by the CSSF will always detect a material misstatement when it exists. Misstatements can arise from fraud or error and are considered material if, individually or in the aggregate, they could reasonably be expected to influence the economic decisions of users taken on the basis of these consolidated financial statements.

8
As part of an audit in accordance with the EU Regulation No 537/2014, the Law of 23 July 2016 and with ISAs as adopted for Luxembourg by the CSSF, we exercise professional judgment and maintain professional scepticism throughout the audit. We also:
identify and assess the risks of material misstatement of the consolidated financial statements, whether due to fraud or error, design and perform audit procedures responsive to those risks, and obtain audit evidence that is sufficient and appropriate to provide a basis for our opinion. The risk of not detecting a material misstatement resulting from fraud is higher than for one resulting from error, as fraud may involve collusion, forgery, intentional omissions, misrepresentations, or the override of internal control;
obtain an understanding of internal control relevant to the audit in order to design audit procedures that are appropriate in the circumstances, but not for the purpose of expressing an opinion on the effectiveness of the Group’s internal control;
evaluate the appropriateness of accounting policies used and the reasonableness of accounting estimates and related disclosures made by the Board of Directors;
conclude on the appropriateness of the Board of Directors’ use of the going concern basis of accounting and, based on the audit evidence obtained, whether a material uncertainty exists related to events or conditions that may cast significant doubt on the Group’s ability to continue as a going concern. If we conclude that a material uncertainty exists, we are required to draw attention in our audit report to the related disclosures in the consolidated financial statements or, if such disclosures are inadequate, to modify our opinion. Our conclusions are based on the audit evidence obtained up to the date of our audit report. However, future events or conditions may cause the Group to cease to continue as a going concern;
evaluate the overall presentation, structure and content of the consolidated financial statements, including the disclosures, and whether the consolidated financial statements represent the underlying transactions and events in a manner that achieves fair presentation;
obtain sufficient appropriate audit evidence regarding the financial information of the entities and business activities within the Group to express an opinion on the consolidated financial statements. We are responsible for the direction, supervision and performance of the Group audit. We remain solely responsible for our audit opinion.
We communicate with those charged with governance regarding, among other matters, the planned scope and timing of the audit and significant audit findings, including any significant deficiencies in internal control that we identify during our audit. We also provide those charged with governance with a statement that we have complied with relevant ethical requirements regarding independence, and to communicate with them all relationships and other matters that may reasonably be thought to bear on our independence, and where applicable, related safeguards. From the matters communicated with those charged with governance, we determine those matters that were of most significance in the audit of the consolidated financial statements of the current period and are therefore the key audit matters. We describe these matters in our audit report unless law or regulation precludes public disclosure about the matter.


10 | P a g e
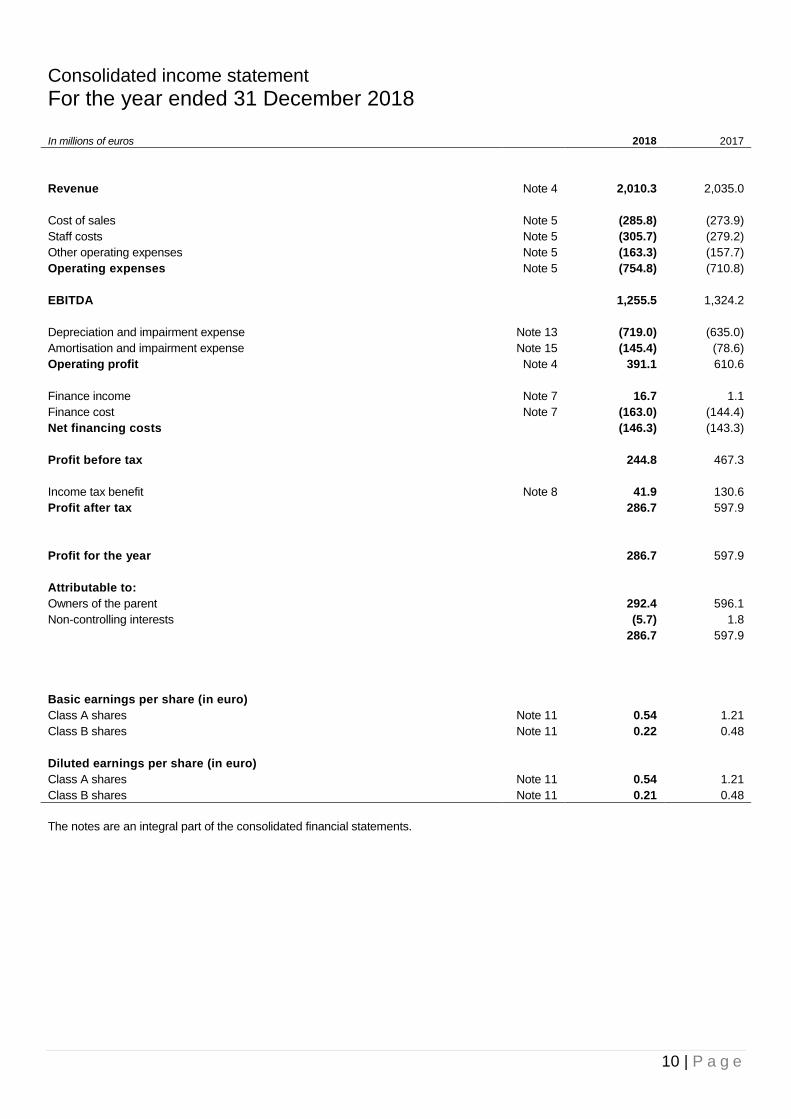
Consolidated income statement
For the year ended 31 December 2018 In millions of euros 2018 2017
Revenue Note 4 2,010.3 2,035.0
Cost of sales Note 5 (285.8) (273.9)
Staff costs Note 5 (305.7) (279.2)
Other operating expenses Note 5 (163.3) (157.7)
Operating expenses Note 5 (754.8) (710.8)
EBITDA 1,255.5 1,324.2
Depreciation and impairment expense Note 13 (719.0) (635.0)
Amortisation and impairment expense Note 15 (145.4) (78.6)
Operating profit Note 4 391.1 610.6
Finance income Note 7 16.7 1.1
Finance cost Note 7 (163.0) (144.4)
Net financing costs (146.3) (143.3)
Profit before tax 244.8 467.3
Income tax benefit Note 8 41.9 130.6
Profit after tax 286.7 597.9
Profit for the year 286.7 597.9
Attributable to:
Owners of the parent 292.4 596.1
Non-controlling interests (5.7) 1.8
286.7 597.9
Basic earnings per share (in euro)
Class A shares Note 11 0.54 1.21
Class B shares Note 11 0.22 0.48
Diluted earnings per share (in euro)
Class A shares Note 11 0.54 1.21
Class B shares Note 11 0.21 0.48
The notes are an integral part of the consolidated financial statements.

11 | P a g e
Consolidated statement of comprehensive income
For the year ended 31 December 2018 In millions of euros 2018 2017
Profit for the year 286.7 597.9
Other comprehensive income
Items that will not be reclassified to profit or loss
Remeasurements of post-employment benefit obligation 0.4 1.0
Income tax effect (0.2) (0.3)
Remeasurements of post-employment benefit obligation, net of tax 0.2 0.7
Income tax relating to treasury shares impairment charge or reversal (6.4) 14.2
Total items that will not be reclassified to profit or loss (6.2) 14.9
Items that may be reclassified subsequently to profit or loss
Impact of currency translation Note 10 345.2 (1,050.9)
Income tax effect Note 10 (20.8) 60.3
Total impact of currency translation, net of tax 324.4 (990.6)
Net investment hedge (79.1) 234.8
Income tax effect 21.2 (65.4)
Total net investment hedge, net of tax (57.9) 169.4
Net movements on cash flow hedges, net of tax 1.2 (1.1)
Total net movements on cash flow hedges, net of tax 1.2 (1.1)
Total items that may be reclassified subsequently to profit or loss 267.7 (822.3)
Total other comprehensive income/ (loss) for the year, net of tax 261.5 (807.4)
Total comprehensive income/ (loss) for the year, net of tax 548.2 (209.5)
Attributable to:
Owners of the parent 550.2 (200.8)
Non-controlling interests (2.0) (8.7)
548.2 (209.5)
The notes are an integral part of the consolidated financial statements.

12 | P a g e
Consolidated statement of financial position
As at 31 December 2018 In millions of euros 2018 2017
Non-current assets
Property, plant and equipment Note 13 5,106.9 4,591.4
Assets in the course of construction Note 14 907.4 1,480.2
Total property, plant and equipment 6,014.3 6,071.6
Intangible assets Note 15 4,720.5 4,630.9
Other financial assets 6.5 5.0
Trade and other receivables Note 17 294.5 317.8
Deferred customer contract costs 10.3 15.2
Deferred tax assets Note 9 162.3 70.4
Total non-current assets 11,208.4 11,110.9
Current assets
Inventories 35.1 30.1
Trade and other receivables Note 17 614.2 648.2
Deferred customer contract costs 17.5 10.4
Prepayments 62.8 43.7
Derivatives Note 18 0.2 2.6
Income tax receivable 12.0 68.9
Cash and cash equivalents Note 20 909.1 269.6
Total current assets 1,650.9 1,073.5
Total assets 12,859.3 12,184.4
Equity
Attributable to the owners of the parent Note 21 6,148.4 5,987.9
Non-controlling interests Note 22 102.2 124.6
Total equity 6,250.6 6,112.5
Non-current liabilities
Borrowings Note 24 3,908.5 3,413.8
Provisions Note 25 16.8 41.2
Deferred income Note 16 370.3 477.3
Deferred tax liabilities Note 9 412.5 438.5
Other long-term liabilities Note 27 133.9 76.1
Lease liabilities Note 30 28.6 -
Fixed assets suppliers Note 28 200.9 53.4
Total non-current liabilities 5,071.5 4,500.3
Current liabilities
Borrowings Note 24 476.4 534.1
Provisions Note 25 48.6 12.7
Deferred income Note 16 476.1 443.2
Trade and other payables Note 26 367.5 385.6
Lease liabilities Note 30 9.5 -
Fixed assets suppliers Note 28 130.8 126.6
Derivatives Note 18 0.1 0.6
Income tax liabilities 28.2 68.8
Total current liabilities 1,537.2 1,571.6
Total liabilities 6,608.7 6,071.9
Total equity and liabilities 12,859.3 12,184.4
The notes are an integral part of the consolidated financial statements.
13 | P a g e
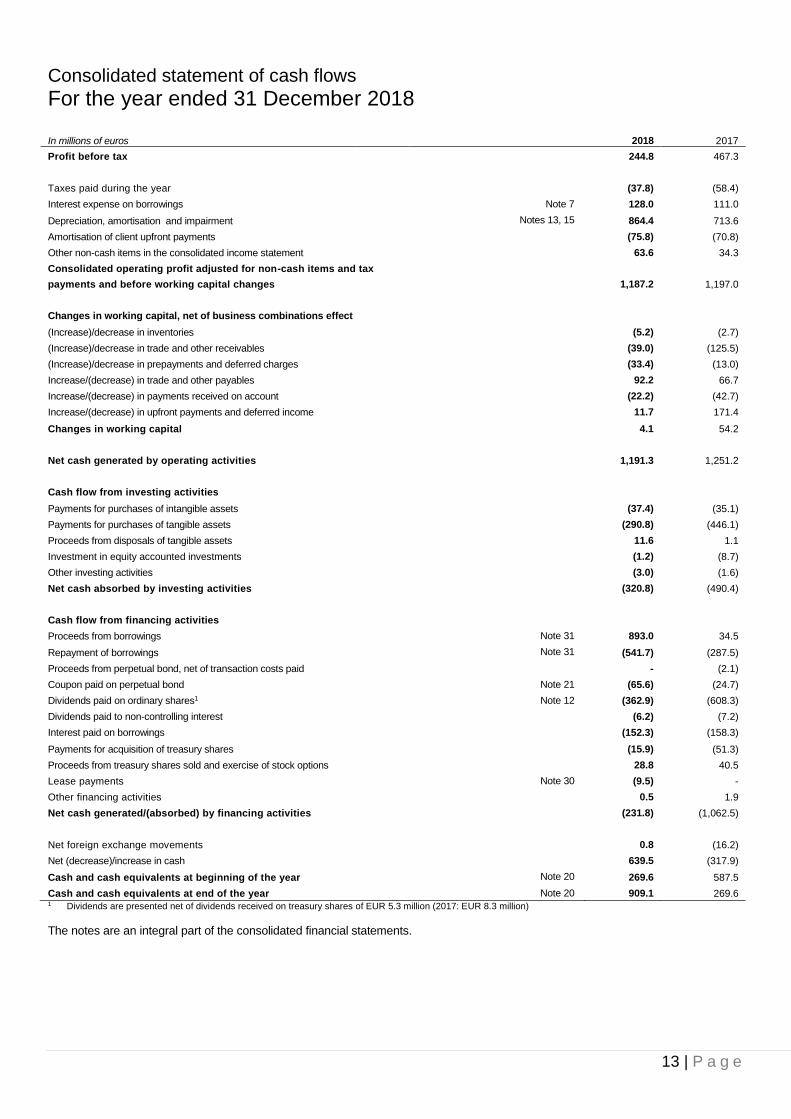
Consolidated statement of cash flows
For the year ended 31 December 2018 In millions of euros 2018 2017
Profit before tax 244.8 467.3
Taxes paid during the year (37.8) (58.4)
Interest expense on borrowings Note 7 128.0 111.0
Depreciation, amortisation and impairment Notes 13, 15 864.4 713.6
Amortisation of client upfront payments (75.8) (70.8)
Other non-cash items in the consolidated income statement 63.6 34.3
Consolidated operating profit adjusted for non-cash items and tax
payments and before working capital changes
1,187.2 1,197.0
Changes in working capital, net of business combinations effect
(Increase)/decrease in inventories (5.2) (2.7)
(Increase)/decrease in trade and other receivables (39.0) (125.5)
(Increase)/decrease in prepayments and deferred charges (33.4) (13.0)
Increase/(decrease) in trade and other payables 92.2 66.7
Increase/(decrease) in payments received on account (22.2) (42.7)
Increase/(decrease) in upfront payments and deferred income 11.7 171.4
Changes in working capital 4.1 54.2
Net cash generated by operating activities 1,191.3 1,251.2
Cash flow from investing activities
Payments for purchases of intangible assets (37.4) (35.1)
Payments for purchases of tangible assets (290.8) (446.1)
Proceeds from disposals of tangible assets 11.6 1.1
Investment in equity accounted investments (1.2) (8.7)
Other investing activities (3.0) (1.6)
Net cash absorbed by investing activities (320.8) (490.4)
Cash flow from financing activities
Proceeds from borrowings Note 31 893.0 34.5
Repayment of borrowings Note 31 (541.7) (287.5)
Proceeds from perpetual bond, net of transaction costs paid - (2.1)
Coupon paid on perpetual bond Note 21 (65.6) (24.7)
Dividends paid on ordinary shares1 Note 12 (362.9) (608.3)
Dividends paid to non-controlling interest (6.2) (7.2)
Interest paid on borrowings (152.3) (158.3)
Payments for acquisition of treasury shares (15.9) (51.3)
Proceeds from treasury shares sold and exercise of stock options 28.8 40.5
Lease payments Note 30 (9.5) -
Other financing activities 0.5 1.9
Net cash generated/(absorbed) by financing activities (231.8) (1,062.5)
Net foreign exchange movements 0.8 (16.2)
Net (decrease)/increase in cash 639.5 (317.9)
Cash and cash equivalents at beginning of the year Note 20 269.6 587.5
Cash and cash equivalents at end of the year Note 20 909.1 269.6 1 Dividends are presented net of dividends received on treasury shares of EUR 5.3 million (2017: EUR 8.3 million)
The notes are an integral part of the consolidated financial statements.
14 | P a g e
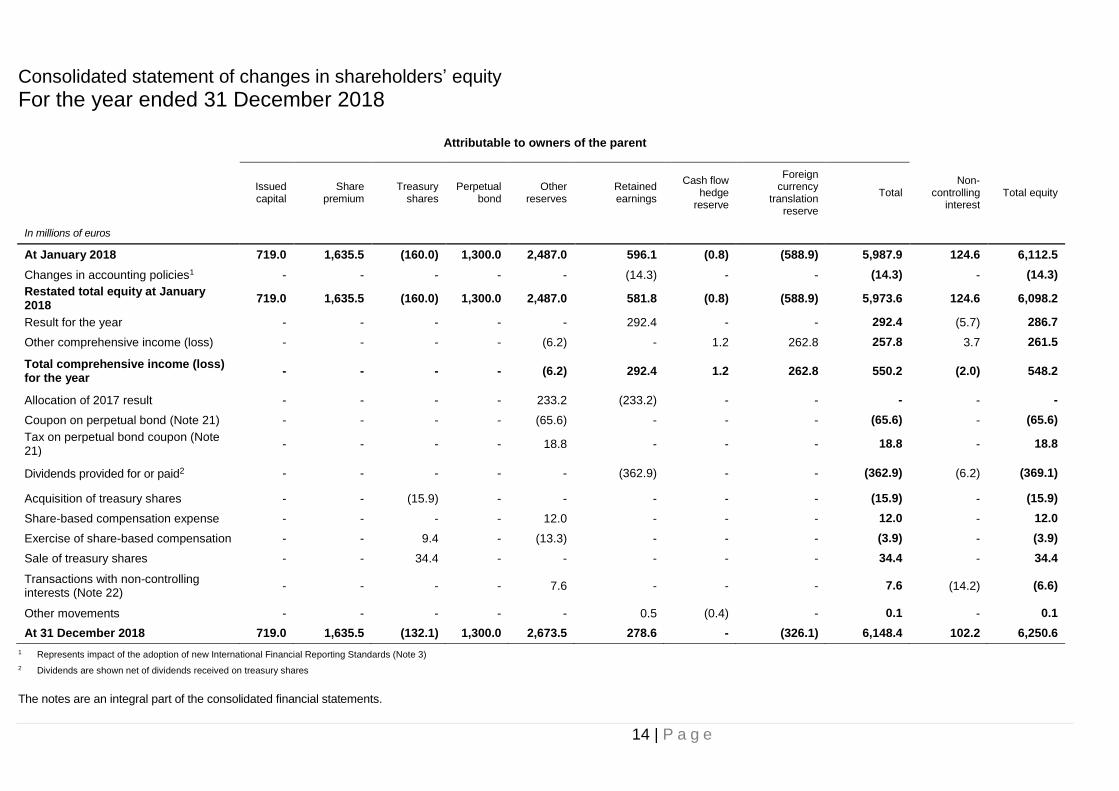
Consolidated statement of changes in shareholders’ equity
For the year ended 31 December 2018
Attributable to owners of the parent
Issued capital
Share premium
Treasury shares
Perpetual bond
Other reserves
Retained earnings
Cash flow hedge
reserve
Foreign currency
translation reserve
Total Non-
controlling interest
Total equity
In millions of euros
At January 2018 719.0 1,635.5 (160.0) 1,300.0 2,487.0 596.1 (0.8) (588.9) 5,987.9 124.6 6,112.5
Changes in accounting policies1 - - - - - (14.3) - - (14.3) - (14.3)
Restated total equity at January 2018
719.0 1,635.5 (160.0) 1,300.0 2,487.0 581.8 (0.8) (588.9) 5,973.6 124.6 6,098.2
Result for the year - - - - - 292.4 - - 292.4 (5.7) 286.7
Other comprehensive income (loss) - - - - (6.2) - 1.2 262.8 257.8 3.7 261.5
Total comprehensive income (loss) for the year
- - - - (6.2) 292.4 1.2 262.8 550.2 (2.0) 548.2
Allocation of 2017 result - - - - 233.2 (233.2) - - - - -
Coupon on perpetual bond (Note 21) - - - - (65.6) - - - (65.6) - (65.6)
Tax on perpetual bond coupon (Note 21)
- - - - 18.8 - - - 18.8 - 18.8
Dividends provided for or paid2 - - - - - (362.9) - - (362.9) (6.2) (369.1)
Acquisition of treasury shares - - (15.9) - - - - - (15.9) - (15.9)
Share-based compensation expense - - - - 12.0 - - - 12.0 - 12.0
Exercise of share-based compensation - - 9.4 - (13.3) - - - (3.9) - (3.9)
Sale of treasury shares - - 34.4 - - - - - 34.4 - 34.4
Transactions with non-controlling interests (Note 22)
- - - - 7.6 - - - 7.6 (14.2) (6.6)
Other movements - - - - - 0.5 (0.4) - 0.1 - 0.1
At 31 December 2018 719.0 1,635.5 (132.1) 1,300.0 2,673.5 278.6 - (326.1) 6,148.4 102.2 6,250.6
1 Represents impact of the adoption of new International Financial Reporting Standards (Note 3)
2 Dividends are shown net of dividends received on treasury shares
The notes are an integral part of the consolidated financial statements.
15 | P a g e
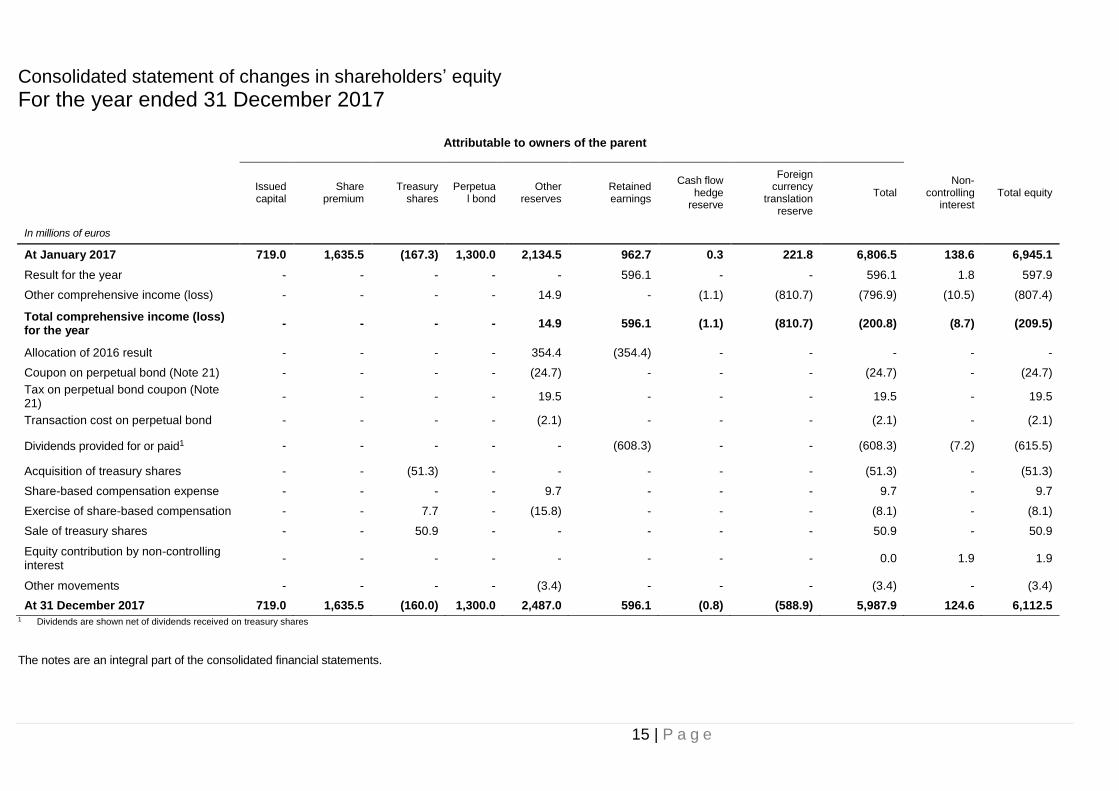
Consolidated statement of changes in shareholders’ equity
For the year ended 31 December 2017
Attributable to owners of the parent
Issued capital
Share premium
Treasury shares
Perpetual bond
Other reserves
Retained earnings
Cash flow hedge
reserve
Foreign currency
translation reserve
Total Non-
controlling interest
Total equity
In millions of euros
At January 2017 719.0 1,635.5 (167.3) 1,300.0 2,134.5 962.7 0.3 221.8 6,806.5 138.6 6,945.1
Result for the year - - - - - 596.1 - - 596.1 1.8 597.9
Other comprehensive income (loss) - - - - 14.9 - (1.1) (810.7) (796.9) (10.5) (807.4)
Total comprehensive income (loss) for the year
- - - - 14.9 596.1 (1.1) (810.7) (200.8) (8.7) (209.5)
Allocation of 2016 result - - - - 354.4 (354.4) - - - - -
Coupon on perpetual bond (Note 21) - - - - (24.7) - - - (24.7) - (24.7)
Tax on perpetual bond coupon (Note 21)
- - - - 19.5 - - - 19.5 - 19.5
Transaction cost on perpetual bond - - - - (2.1) - - - (2.1) - (2.1)
Dividends provided for or paid1 - - - - - (608.3) - - (608.3) (7.2) (615.5)
Acquisition of treasury shares - - (51.3) - - - - - (51.3) - (51.3)
Share-based compensation expense - - - - 9.7 - - - 9.7 - 9.7
Exercise of share-based compensation - - 7.7 - (15.8) - - - (8.1) - (8.1)
Sale of treasury shares - - 50.9 - - - - - 50.9 - 50.9
Equity contribution by non-controlling interest
- - - - - - - - 0.0 1.9 1.9
Other movements - - - - (3.4) - - - (3.4) - (3.4)
At 31 December 2017 719.0 1,635.5 (160.0) 1,300.0 2,487.0 596.1 (0.8) (588.9) 5,987.9 124.6 6,112.5 1 Dividends are shown net of dividends received on treasury shares
The notes are an integral part of the consolidated financial statements.
16 | P a g e
Consolidated financial statements Notes to the consolidated financial statements
31 December 2018
Note 1 - Corporate information
SES S.A. (‘SES’ or ‘the Company’) was incorporated on 16 March 2001 as a limited liability company (Société Anonyme) under
Luxembourg Law. References to ‘the Group’ in the following notes are to the Company and its subsidiaries. SES trades under ‘SESG’
on the Luxembourg Stock Exchange and Euronext, Paris.
The consolidated financial statements of SES as at and for the year ended 31 December 2018 were authorised for issue in
accordance with a resolution of the Board of Directors on 26 February 2019. Under Luxembourg Law, the consolidated financial
statements are approved by the shareholders at the Annual General Meeting of Shareholders.
Note 2 - Summary of significant accounting policies
Basis of preparation
The consolidated financial statements have been prepared in accordance with International Financial Reporting Standards as issued
by the International Accounting Standards Board (‘IASB’) and endorsed by the European Union (‘IFRS’), as at 31 December 2018. The
consolidated financial statements comply with IFRS.
The consolidated financial statements have been prepared on a historical cost basis, except where fair value is required by IFRS as
described below. The carrying values of recognised assets and liabilities that are hedged items in fair value hedges, and are otherwise
carried at cost, are adjusted to record changes in the fair values attributable to the risks that are being hedged.
Changes in accounting policies
A number of new or amended standards became applicable or were early adopted for the current reporting period and the Group had
to change its accounting policies and make retrospective adjustments as a result of adopting the following standards: IFRS 9 ‘Financial
Instruments’, IFRS 15 ‘Revenue from Contracts with Customers’ and IFRS 16 ‘Leases’.
The impact of the adoption of these standards and the new accounting policies are disclosed in Note 3 below.
The following other amended standards did not have any impact on the Group’s accounting policies and did not require retrospective
adjustments.
1) Amendments to IFRS 2, ‘Share based payments’, on clarifying how to account for certain types of share-based payment
transactions
In June 2016, the IASB issued amendments to clarify the measurement basis for cash-settled, share-based payments and the
accounting for modifications that change an award from cash-settled to equity-settled. It also introduces an exception to the
principles in IFRS 2 that will require an award to be treated as if it was wholly equity-settled, where an employer is obliged to
withhold an amount for the employee’s tax obligation associated with a share-based payment and pay that amount to the tax
authority. The effective date of these amendments is 1 January 2018. The adoption of this amendment did not have any impact on
the financial position and performance of the Group.
2) IFRIC 22, Foreign currency transactions and advance consideration
In December 2016, the IASB issued IFRIC 22 which addresses foreign currency transactions or parts of transactions where there
is consideration that is denominated or priced in a foreign currency. The interpretation provides guidance for when a single
payment/receipt is made as well as for situations where multiple payments/receipts are made. The guidance aims to reduce
diversity in practice. This standard is effective for annual periods beginning on or after 1 January 2018. The adoption of this
interpretation did not have any impact on the financial position and performance of the Group.

17 | P a g e
3) Annual improvements 2014-2016 applicable for the annual periods beginning on or after 1 January 2018
Clarifying the scope of IFRS 12, Disclosure of interests in other entities
The amendment clarified that the disclosures requirement of IFRS 12 are applicable to interest in entities classified as held for sale,
except for summarised financial information (para B17 of IFRS 12). These amendments apply retrospectively for annual periods
beginning on or after 1 January 2017. The adoption of this amendment did not have any impact on the financial position and
performance of the Group.
IAS 28 Investments in Associates and Joint Ventures regarding measuring an associate or joint venture at fair value
The amendment clarified that the election to measure at fair value through profit or loss an investment in an associate or a joint
venture that is held by an entity that is a venture capital organisation, or other qualifying entity, is available for each investment
in an associate or joint venture on an investment-by-investment basis, upon initial recognition. The adoption of this amendment
did not have any impact on the financial position and performance of the Group.
Basis of consolidation
The consolidated financial statements comprise the financial statements of the Company and its controlled subsidiaries, after the
elimination of all material inter-company transactions. Subsidiaries are fully consolidated from the date the Company obtains control
until such time as control ceases. Acquisitions of subsidiaries are accounted for using the purchase method of accounting. The
financial statements of subsidiaries are prepared for the same reporting period as the Company, using consistent accounting policies.
Adjustments are made to bring into line any dissimilar accounting policies that may exist. For details regarding the subsidiaries
included in the consolidated financial statements see Note 34.
Total comprehensive income or loss within a subsidiary is attributed to the non-controlling interest even if that results in a deficit
balance.
A change in the ownership interest in a subsidiary, without a loss of control, is accounted for as an equity transaction.
When the Group ceases to have control, any retained interest in the entity is re-measured to its fair value at the date when control is
lost, with the change in carrying amount recognised in profit or loss. The fair value is the initial carrying amount for the purposes of
subsequently accounting for the retained interest as an associate, joint venture or financial asset. In addition, any amounts previously
recognised in other comprehensive income in respect of that entity are accounted for as if the Group had directly disposed of the
related assets or liabilities. This may mean that amounts previously recognised in other comprehensive income are reclassified to profit
or loss.
Non-controlling interests in the results and equity of subsidiaries are presented separately in the consolidated income statement,
statement of comprehensive income, statement of changes in equity and statement of financial position respectively.
Investments in associates
The Group accounts for investments in associates using the equity method of accounting. An associate is an entity in which the
Group has significant influence but not control or joint control.
Under the equity method, the investment in the associate is carried in the statement of financial position at cost plus post-acquisition
changes in the Group’s share of the profit or loss of the associate. Goodwill relating to an associate is included in the carrying amount
of the investment and is not amortised.
The Group determines at each reporting date whether there is any objective evidence that the investment in the associate is impaired.
If this is the case, the Group calculates the amount of impairment as the difference between the recoverable amount of the associate
and its carrying value and recognises the amount within ‘Share of associates’ result’ in the consolidated income statement.
The Group’s share of post-acquisition profit or loss is recognised in the consolidated income statement, and its share of
post-acquisition movements in other comprehensive income is recognised in other comprehensive income with a corresponding
adjustment to the carrying amount of the investment. When the Group’s share of losses in an associate equals or exceeds its interest
in the associate, including any other unsecured receivables, the Group does not recognise further losses, unless it has incurred legal
or constructive obligations or made payments on behalf of the associate. In general, the financial statements of associates are
prepared for the same reporting year as the parent company, using consistent accounting policies. Adjustments are made to bring in
line any dissimilar accounting policies that may exist.
18 | P a g e
Profits and losses resulting from upstream and downstream transactions between the Group and its associate are recognised in the
Group’s financial statements only to the extent of unrelated investor’s interests in the associates. Dilution gains and losses arising in
investments in associates are recognised in the consolidated income statement.
The Group ceases to use the equity method of accounting on the date from which it no longer has significant influence over the
associate, or when the interest becomes classified as an asset held for sale.
Significant accounting judgments and estimates
1) Judgments
In the process of applying the Group’s accounting policies, management has made the following judgments, apart from those
involving estimations, which have the most significant effect on the amounts recognised in the financial statements:
(i) Treatment of orbital slot licence rights
The Group’s operating companies have obtained rights to operate satellites at certain orbital locations and using certain
frequency bands. These licences are obtained through application to the relevant national and international regulatory
authorities and are generally made available for a defined period. Where the Group has obtained such rights through the
acquisition of subsidiaries, the rights have been identified as an asset acquired and recorded at the fair value attributed to the
asset at the time of the acquisition as a result of purchase accounting procedure.
In the cases when, on the expiry of such rights, management believes it will be able to successfully re-apply for their usage at
insignificant incremental cost, such rights are deemed to have an indefinite life. Hence these assets are not amortised, but
rather are subject to regular impairment reviews to confirm that the carrying value in the Group’s financial statements is still
appropriate. More details are given in Note 15.
(ii) Taxation
The Group operates in numerous tax jurisdictions and management is required to assess tax issues and exposures across its
entire operations and to accrue for potential liabilities based on its interpretation of country-specific tax law and best estimates.
In conducting this review management assesses the magnitude of the issue and the likelihood, based on experience and
specialist advice, as to whether it will result in a liability for the Group. If this is deemed to be the case, then a provision is
recognised for the potential taxation charges. More details are given in Notes 8 and 25.
One significant area of management’s judgment is around transfer pricing. Whilst the Group employs dedicated members of
staff to establish and maintain appropriate transfer pricing structures and documentation, judgment still needs to be applied and
hence potential tax exposures can be identified. The Group, as part of its overall assessment of liabilities for taxation, reviews in
detail the transfer pricing structures in place and records provisions where this seems appropriate on a case by case basis.
(iii) Consolidation of entities in which the Group holds 50% or less
Al Maisan Satellite Communication LLC
Management has concluded that the Group controls Al Maisan Satellite Communication LLC (‘Al Maisan’), even though it
holds 35% economic interest in this subsidiary, since it has the majority of the voting rights on the Board of Directors of
Al Maisan and there is no other entity owning potential voting rights that could question SES’ control.
SES has power over relevant activities of Al Maisan, such as budget approval, appointment and removal of the CEO and
senior management team as well as the power to appoint or remove the majority of the members of the Board of Directors.
The entity is therefore consolidated with a 65% non-controlling interest (see Note 22).
LuxGovSat S.A.
In February 2015, SES and the Luxembourg government jointly incorporated the legal entity LuxGovSat S.A. (‘LuxGovSat’)
as a limited liability company (Société Anonyme) under Luxembourg law. The Luxembourg government and SES
subscribed equally in the equity of the new company. Management has concluded that the Group controls LuxGovSat, as
SES has power over the relevant activities of the entity. It is therefore consolidated with a 50% non-controlling interest
(see Note 22).

19 | P a g e
(iv) SES Government Solutions, Inc.
SES Government Solutions, Inc., USA (‘SES GS’) is subject to specific governance rules and is managed through a
Proxy Agreement agreed with the Defense Security Service (‘DSS’) department of the US Department of Defense (‘DOD’). The
DSS is a governmental authority responsible for the protection of information deemed classified or sensitive with respect to the
national security of the United States of America which is being shared with industries. A proxy agreement is an instrument
intended to mitigate the risk of foreign ownership, control or influence when a foreign person acquires or merges with a
US entity that has a facility security clearance. A proxy agreement conveys a foreign owner’s voting rights to proxy holders,
comprising the proxy board. Proxy holders are cleared US citizens approved by the DSS.
The DSS required that SES GS enter into a proxy agreement because it is indirectly owned by SES and SES GS has contracts
with the DOD which contain classified information. The Proxy Agreement enables SES GS to participate in such contracts with
the US Government despite being owned by a non-US corporation.
As a result of the Proxy Agreement, certain limitations are placed on the information which may be shared, and the interaction
which may occur, between SES GS and other Group companies. The Proxy Holders, besides acting as directors of SES GS,
are entitled to vote in the context of a trust relationship with SES on whose basis their activity is performed in the interest of
SES’s shareholders and of US national security.
The Company’s assessment of the allocation of powers over the relevant activities of SES GS encompassed the activities of
operating and capital decision making, the appointment and remuneration of key management, and the exposure to the
variability of financial returns based on the financial performance of SES GS.
Based on this assessment, the Company concluded that, from an IFRS 10 perspective, SES has - and is able to use - powers
over the relevant activities of SES GS and has an exposure to variable returns from its involvement in SES GS, consistent with
an assumption of control.
2) Estimation uncertainty
The key assumptions concerning the future and other key sources of estimation uncertainty at the reporting date, that have a
significant risk of causing a material adjustment to the carrying amounts of assets and liabilities within the next financial year(s), are
described below. The Group based its assumptions and estimates on parameters available when the consolidated financial
statements were prepared. Existing circumstances and assumptions about future developments, however, may change due to
market changes or circumstances arising beyond the control of the Group. Such changes are reflected in the assumptions when
they occur.
(i) Impairment testing for goodwill and other indefinite-life intangible assets
The Group determines whether goodwill and other indefinite-life intangible assets are impaired at least on an annual basis. This
requires an estimation of the value in use of the CGUs to which the goodwill and other indefinite-life intangible assets are
allocated. Establishing the value in use requires the Group to make an estimate of the expected future pre-tax cash flows from
the CGU and also to choose a suitable pre-tax discount rate and terminal growth rate in order to calculate the present value of
those cash flows. More details are given in Note 15.
(ii) Impairment testing for space segment assets
The Group assesses at each reporting date whether there is any indicator that an asset may be impaired. If any such indication
exists, the Group determines an estimate of the recoverable amount, as the higher of the fair value less cost of disposal and its
value in use to ensure that this exceeds the carrying amount included in the consolidated financial statements. As far as this
affects the Group’s satellite assets, the estimation of the value in use requires estimations of the future commercial revenues to
be generated by each satellite, particularly related to new markets or services, and also the impact of past in-orbit anomalies
and their potential impact on the satellite’s ability to provide its expected commercial service.

20 | P a g e
Business combinations
Business combinations are accounted for using the acquisition method. The consideration transferred for the acquisition of the
subsidiary is measured as the aggregate of the:
- fair value of the assets transferred;
- liabilities incurred to the former owners of the acquired business;
- equity interests issued by the Group;
- fair value of any asset or liability resulting from a contingent consideration agreement; and
- fair value of any pre-existing equity interest in the subsidiary.
For each business combination, the Company measures the non-controlling interest in the acquiree either at fair value or at the
proportionate share of the acquiree’s identifiable net assets.
Acquisition costs incurred are expensed and included in other operating expenses.
When the Group acquires a business, it assesses the financial assets acquired and liabilities assumed for appropriate classification
and designation in accordance with the contractual terms, economic circumstances and pertinent conditions as at the acquisition date.
This includes the separation of embedded derivatives in host contracts by the acquiree. Assets acquired, and liabilities assumed, are
recognised at fair value.
The excess of the:
- consideration transferred;
- amount of any non-controlling interest in the acquired entity; and
- acquisition-date fair value of any previous equity interest in the acquired entity;
over the fair value of the net identifiable assets acquired is recorded as goodwill. If those amounts are less than the fair value of the net
identifiable assets of the business acquired, the difference is recognised directly in profit or loss as a bargain purchase.
Where settlement of any part of cash consideration is deferred, the amounts payable in the future are discounted to their present value
as at the date of exchange.
If the business combination is achieved in stages, the acquisition date carrying value of the acquirer’s previously held equity interest in
the acquiree is remeasured to fair value at the acquisition date through profit or loss.
Any contingent consideration to be transferred by the acquirer will be recognised at fair value at the acquisition date. Subsequent
changes to the fair value of the contingent consideration which is deemed to be an asset, or a liability, will be recognised in accordance
with IFRS 9 in profit or loss.
Property, plant and equipment
Property, plant and equipment is initially recorded at historical cost, representing either the acquisition or manufacturing cost. Satellites
cost includes the launcher and launch insurance, less depreciation and impairment losses. Insurance proceeds are set off first against
the base cost of the asset concerned and released against the depreciation over the useful life of the asset. Insurance proceeds above
the cost of the satellite are recognised as income when received. The financial impact of changes resulting from a revision of
management’s estimate of the cost of property, plant and equipment is recognised in the consolidated income statement in the
period concerned.
Right-of-use assets are measured at cost comprising the following:
- the amount of the initial measurement of lease liability;
- any lease payments made at or before the commencement date less any lease incentives received;
- any initial direct costs; and
- restoration costs.
Payments associated with short-term leases and leases of low-value assets are recognised on a straight-line basis as an expense in
profit or loss. Short-term leases are leases with a lease term of 12 months or less. Low-value assets comprise IT-equipment and small
items of office furniture.

21 | P a g e
The financial impact of changes resulting from revisions to management’s estimate of the cost of the property, plant and equipment is
taken to the consolidated income statement of the period concerned.
Costs for the repair and maintenance of these assets are recorded as an expense.
Property, plant and equipment is depreciated using the straight-line method, generally based on the following useful lives:
Buildings 25 years
Space segment assets 10 to 19.5 years
Ground segment assets 3 to 15 years
Other fixtures, fittings, tools and equipment 3 to 15 years
Right-of-use assets 6 to 12 years
An item of property, plant and equipment is derecognised upon disposal or when no future economic benefits are expected from its
use or disposal. Any gain or loss arising on the derecognition of an asset is included in the consolidated income statement in the
period the asset is derecognised.
The residual values, remaining useful lives and methods of depreciation of property, plant and equipment are reviewed at each
financial year end and adjusted where necessary.
Assets in the course of construction
This caption includes satellites under construction. Incremental costs directly attributable to the purchase of satellites, such as launch
costs and other related expenses such as ground equipment and borrowing costs, are capitalised in the statement of financial position.
The cost of satellite construction may include an element of deferred consideration to satellite manufacturers referred to as satellite
performance incentives. SES is contractually obligated to make these payments over the lives of the satellites, provided the satellites
continue to operate in accordance with contractual specifications. Historically, the satellite manufacturers have earned substantially all
of these payments. Therefore, SES accounts for these payments as deferred financing, capitalising the present value of the payments
as part of the cost of the satellites and recording a corresponding liability to the satellite manufacturers. Interest expense is recognised
on the deferred financing and the liability is accreted based on the passage of time and reduced as the payments are made.
Once the asset is subsequently put into service and operates in the manner intended by management, the expenditure is transferred
to assets in use and depreciation commences.
Borrowing costs
Borrowing costs that are directly attributable to the construction or production of a qualifying asset are capitalised during the
construction period as part of the cost of the asset. All other borrowing costs are recognised as an expense in the period in which they
are incurred.
Intangible assets
1) Goodwill
Goodwill is measured as described in accounting policy for business combinations in Note 2.
After initial recognition, goodwill is measured at cost less any accumulated impairment losses. For the purpose of impairment
testing, goodwill, from the acquisition date, is allocated to each of the Group’s CGUs units that are expected to benefit from the
combination, irrespective of whether other assets or liabilities of the acquiree are assigned to those units.
The carrying value of acquisition goodwill is not amortised, but rather is tested for impairment annually, or more frequently if
required to establish whether the value is still recoverable. The recoverable amount is defined as the higher of fair value less costs
to sell and value in use. Impairment charges are recorded in the consolidated income statement. Impairment losses relating to
goodwill cannot be reversed in future periods. The Group estimates value in use based on the estimated discounted cash flows to
be generated by a CGU using five-year business plans approved by the Board of Directors. Beyond a five-year period, cash flows
are generally estimated on the basis of stable rates of growth or decline, although longer periods may be considered where
relevant to accurately calculate the value in use. For example, for the ‘SES MEO’ CGU, cash flows are estimated through to 2033
to properly reflect the timing of the replacement capital expenditures, deriving a value-in-use that best represents the life cycle of
the MEO assets.
22 | P a g e
Where goodwill forms part of a CGU and part of the operation within that unit is disposed of, then the goodwill associated with the
operation disposed of is included in the carrying amount of the operation when determining the gain or loss on its disposal.
Goodwill disposed of in this situation is measured based on the relative values of the operation disposed of and the portion of the
CGU unit retained.
2) Other intangibles
(i) Orbital rights
Intangible assets consist principally of rights of usage of orbital frequencies. The Group is authorised by governments to
operate satellites at certain orbital locations. Governments acquire rights to these orbital locations through filings made with the
International Telecommunication Union (‘ITU’), a sub-organisation of the United Nations. The Group will continue to have rights
to operate at its orbital locations so long as it maintains its authorisations to do so. Those rights are reviewed at acquisition to
establish whether they represent assets with a definite or indefinite life. Those assessed as being definite life assets are
amortised on a straight-line basis over their estimated useful life not exceeding 30 years.
Indefinite-life intangible assets are held at cost in the statement of financial position and are subject to impairment testing in line
with the treatment outlined for goodwill above. The useful life of an intangible asset with an indefinite life is reviewed annually to
determine whether the indefinite life assessment continues to be supportable. If not, the change in the useful life assessment
from indefinite to finite is made on a prospective basis. Orbital rights acquired for a non-cash consideration are initially
measured at the fair value of the consideration given.
(ii) Software and development costs
Costs associated with maintaining computer software programmes are recognised as an expense as incurred. Development
costs that are directly attributable to the design and testing of identifiable and unique software products controlled by the Group
are recognised as intangible assets when the following criteria are met:
- it is technically feasible to complete the software product so that it will be available for use;
- management intends to complete the software product and use or sell it;
- there is an ability to use or sell the software product;
- it can be demonstrated how the software product will generate probable future economic benefits;
- adequate technical, financial and other resources to complete the development and to use or sell the software product are
available; and
- the expenditure attributable to the software product during its development can be reliably measured.
Directly attributable costs that are capitalised as part of the software product include the software development employee costs
and an appropriate portion of relevant overheads.
Other development expenditures that do not meet these criteria are recognised as an expense as incurred. Development costs
previously recognised as an expense are not recognised as an asset in a subsequent period.
Computer software development costs recognised as assets are amortised over their estimated useful life, which does not
exceed seven years.
Impairment of other non-financial assets
The Group assesses at each reporting date whether there is an indication that an asset may be impaired. If any such indication exists,
or when annual impairment testing for an asset is required, the Group makes an estimate of the recoverable amount.
The Group’s long-lived assets and definite-life intangible assets, including its in-service satellite fleet, are reviewed for impairment
whenever events or changes in circumstances indicate that the carrying amount of such assets may not be recoverable. Impairments
can arise from complete or partial failure of a satellite as well as other changes in expected discounted future cash flows. Such
impairment tests are based on a recoverable value determined using estimated future cash flows and an appropriate discount rate.
The estimated cash flows are based on the most recent business plans. If an impairment is identified, the carrying value will be written
down to its recoverable amount.
23 | P a g e
Investments and other financial assets
From 1 January 2018, the Group classifies its financial assets in the following measurement categories:
- those to be measured subsequently at fair value through profit or loss; and
- those to be measured at amortised cost.
At initial recognition, the Group measures a financial asset at its fair value plus, in the case of a financial asset not remeasured to fair
value through the income statement, transaction costs that are directly attributable to the acquisition of the financial asset. Transaction
costs of financial assets carried at fair value and revalued through the income statement are expensed in the period when they were
incurred.
All regular purchases and sales of financial assets are recognised on the trade date, that is to say the date that the Group is committed
to the purchase or sale of the asset.
Financial assets with embedded derivatives are considered in their entirety when determining whether their cash flows are solely
payment of principal and interest.
Debt instruments
Subsequent measurement of debt instruments depends on the Group’s business model for managing the asset and the cash flow
characteristics of the asset. There are two measurement categories into which the Group classifies its debt instruments:
- amortised cost: Assets that are held for collection of contractual cash flows where those cash flows represent solely payments of
principal and interest are measured at amortised cost. Interest income from these financial assets is included in finance income
using the effective interest rate method. Any gain or loss arising on derecognition is recognised directly in profit or loss and
presented in other gains/(losses) together with foreign exchange gains and losses. Impairment losses are presented as separate
line item in the statement of profit or loss;
- fair value through profit or loss: Assets that do not meet the criteria for amortised cost or fair value remeasurement through other
comprehensive income, are remeasured to fair value through the income statement. Any gain or loss on a debt investment that is
subsequently remeasured to fair value is recognised as part of net financing charges in the income statement covering the period
in which it arises.
Equity instruments
The Group subsequently measures all equity investments at fair value. Where the Group’s management has elected to present fair
value gains and losses on equity investments in other comprehensive income, there is no subsequent reclassification of fair value
gains and losses to profit or loss following the derecognition of the investment. Dividends from such investments continue to be
recognised in profit or loss as other income when the Group’s right to receive payments is established.
Changes in the fair value of financial assets at fair value through profit or loss are recognised in other gains/(losses) in the statement of
profit or loss as applicable. Impairment losses (and reversal of impairment losses) on equity investments measured at fair value
remeasurement through other comprehensive income are not reported separately from other changes in fair value.
Impairment of financial assets
From 1 January 2018, the Group assesses, on a forward-looking basis, the expected credit losses associated with its debt instruments
carried at amortised cost. The impairment methodology applied depends on whether there has been a significant increase in credit
risk.
Deferred customer contract costs
Deferred customer contract costs include the following types of deferred costs: cost of equipment provided to customers under the
terms of their service agreements and expensed over the term of those contracts (linked to SES MEO operations) and broadcaster
subscriber costs expensed over the term of the service agreement (linked to HD Plus GmbH services).
24 | P a g e
Inventories
Inventories primarily consist of equipment held for re-sale, work-in-progress, related accessories and network equipment spares and
are stated at the lower of cost or net realisable value, with cost determined on a weighted average-cost method.
Net realisable value is the estimated selling price in the ordinary course of business less the estimated costs of completion and the
estimated costs necessary to make the sale.
Trade receivables
Trade receivables are recognised initially at fair value and subsequently measured at amortised cost using the effective interest
method, less provision for impairment. For impairment of trade receivables, the Group applies the simplified approach permitted by
IFRS 9, which requires expected lifetime losses to be recognised from initial recognition of the receivables. Expected lifetime losses
are estimated using provision metrics which are calculated based on historical financial information as well as forward looking data.
Additional specific provisions are recognised when there is objective evidence that the Group will not be able to recover a specific debt.
The Group evaluates the credit risk of its customers on an ongoing basis, classifying them into three categories: prime, market and
sub-prime.
Trade and other payables
Trade and other payables are initially recognised at fair value, and subsequently carried at amortised cost using the effective interest
method.
Prepayments
Prepayments represent expenditures paid during the financial year but relating to a subsequent financial year. The prepaid expenses
include mainly insurance, rental of third-party satellite capacity, advertising expenses as well as loan origination costs related to loan
facilities which have not been drawn.
Treasury shares
Treasury shares are mostly acquired by the Group in connection with share-based compensation plans and are presented as a set off
to equity in the consolidated statement of financial position. Gains and losses on the purchase, sale, issue or cancellation of treasury
shares are not recognised in the consolidated income statement, but rather in the equity.
Cash and cash equivalents
Cash and cash equivalents comprise cash at banks and on hand, deposits and short-term, highly liquid investments readily convertible
to known amounts of cash and subject to insignificant risk of changes in value. Cash on hand and in banks and short-term deposits
which are held to maturity are carried at fair value.
Revenue recognition
Revenues are generated predominantly from customer service agreements for the provision of satellite capacity over contractually
agreed periods, including short-term occasional use capacity, with the associated uplinking and downlinking services as appropriate.
Other services generating revenue mainly include: platform services; subscription revenue; income received in connection with
satellite interim missions; engineering services and proceeds from the sale of transponders if the revenue recognition criteria for the
transaction are met. In 2018, no revenue (2017: EUR 21.4 million) has been recognised from the sale of transponders.
Revenue from customers under service agreements for satellite capacity is recognised on a straight-line basis at the fair value of the
consideration received or receivable over the duration of the respective contracts - including any free-of-charge periods.
Contract modifications are accounted for either as a separate contract or as part of the existing contract, depending on the nature of
the modification. The Group accounts for a modification as a separate contract if:
- the scope of the contract increases because of the addition of distinct services;
- the price of the contract increases by an amount of consideration that reflects the stand-alone selling prices of the additional
services;
- any appropriate adjustments to that price to reflect the circumstances of the particular contract.

25 | P a g e
A modification that does not meet the above criteria to be accounted for as a separate contract is accounted for as an adjustment to
the existing contract, either prospectively or through a cumulative catch-up adjustment. The determination depends on whether the
remaining services to be provided to the customer under the modified contract are distinct.
Where a contract contains elements of variable consideration, the Group estimates the amount of variable consideration to which it will
be entitled under the contract. Variable consideration can arise, for example, as a result of variable prices, free of use periods,
incentives or other similar items. The standard deals with the uncertainty relating to variable consideration by limiting the amount of
variable consideration that can be recognised. Variable consideration is only included in the transaction price if, and to the extent that,
it is highly probable that its inclusion will not result in a significant revenue reversal in the future when the uncertainty has been
subsequently resolved.
If payment by a customer is not assured (defined as when management determines recoverability of the amounts due under the
contract from the customer is no longer considered probable), then revenue will cease to be recognised on a straight-line basis and will
only be recognised upon receipt of cash.
The subscription revenue from the services provided by HD Plus GmbH and the associated operating costs are recorded on a
linear basis over the 12-month term of the subscription agreement.
The proceeds of transponder sales are recognised in the period of the transaction at the time of transfer of the risks and rewards
associated with the holding of the transponders. Income received in connection with insurance and legal settlements are recognised in
the period when they become receivable by the Group.
Where satellite transponder services are provided in exchange for dissimilar goods and services, the revenue is measured at the fair
value of the goods or services received where these can be reliably measured, otherwise at the fair value of the goods or services
given up, adjusted by the amount of any cash or cash equivalents received.
Concerning revenue recognition in the area of engineering services, the Group applies a percentage of completion analysis to allocate
revenue arising on long-term construction contracts appropriately between the accounting periods concerned assuming the outcome
can be estimated reliably.
Lease income
Lease income from operating leases where the Group is lessor is recognised on a straight-line basis over the lease term. The
respective leased assets are included in the balance sheet based on their nature.
Other income
Other income incurred in connection with settlements under insurance claims, or disputes with satellite manufactures, are recognised
when it is virtually certain that the income will be realised. Other income is presented as part of revenue due to their relative
insignificance.
Contract assets and contract liabilities
Assets and liabilities related to contracts with customers include trade receivables, unbilled accrued revenue, deferred customer
contract costs, and deferred income.
Customer payments received in advance of the provision of service are recorded as contract liabilities and presented as ‘deferred
income’ in the statement of financial position, and for significant advance payments, interest is accrued on the amount received at the
effective interest rate at the time of receipt.
The unbilled portion of recognised revenues is recorded as contract assets and presented as ‘unbilled contract revenue’ within ‘Trade
and other receivables’, allocated between current and non-current as appropriate.
Dividends
The Company declares dividends after the financial statements for the year have been approved. Accordingly, dividends are recorded
in the subsequent year’s financial statements.
26 | P a g e
Provisions
Provisions are recognised when the Group has a present legal or constructive obligation as a result of a past event and it is probable
that an outflow of resources embodying economic benefits will be required to settle the obligation and the amount can be reliably
estimated.
Provisions are measured at the present value of management’s best estimate of the expenditure required to settle the present
obligation at the end of the reporting period.
Borrowings
Borrowings are recognised initially at fair value, net of transaction costs incurred. Borrowings are subsequently carried at amortised
cost; any difference between the proceeds (net of transaction costs) and the redemption value is recognised in the consolidated
income statement over the period of the borrowings using the effective interest method.
Fees paid on the establishment of loan facilities are recognised as transaction costs of the loan to the extent that it is probable that
some or all of the facility will be drawn down. In this case, the fee is deferred until the draw-down occurs.
Current taxes
Current tax assets and liabilities for current and prior periods are measured at the amount expected to be recovered from, or paid to,
the tax authorities. The tax rates and laws used to compute these amounts are those enacted, or substantively enacted, at the
reporting date.
Deferred taxes
Deferred tax is determined using the liability method on temporary differences between the tax bases of assets and liabilities and their
carrying amounts for financial reporting purposes at the reporting date.
Deferred tax liabilities are recognised for all taxable temporary differences, except:
- where the deferred tax liability arises from the initial recognition of goodwill or of an asset or liability in a transaction that is not a
business combination and, at the time of the transaction, affects neither the accounting profit nor taxable profit or loss; and
- in respect of taxable temporary differences associated with investments in subsidiaries where the timing of the reversal of the
temporary differences can be controlled and it is probable that the temporary differences will not reverse in the foreseeable future.
Deferred tax assets are recognised for all deductible temporary differences, carry-forward of unused tax credits and unused tax losses,
to the extent that it is probable that taxable profit will be available against which the deductible temporary differences, and the
carry-forward of unused tax credits and unused tax losses can be utilised except:
- where the deferred tax asset relating to the deductible temporary difference arises from the initial recognition of an asset or liability
in a transaction that is not a business combination and, at the time of the transaction, affects neither the accounting profit nor
taxable profit or loss; and
- in respect of deductible temporary differences associated with investments in subsidiaries, deferred tax assets are recognised only
to the extent that it is probable that the temporary differences will reverse in the foreseeable future and taxable profit will be
available against which the temporary differences can be utilised.
The carrying amount of deferred tax assets is reviewed at each reporting date and reduced to the extent that it is no longer probable
that sufficient taxable profit will be available to allow all or part of the deferred tax asset to be utilised. Unrecognised deferred tax
assets are reassessed at each reporting date and are recognised to the extent that it has become probable that future taxable profit
will allow the deferred tax asset to be recovered.
Deferred tax assets and liabilities are measured at the tax rates that are expected to apply to the year when the asset is realised or the
liability is settled, based on tax rates (and tax laws) that have been enacted or substantively enacted at the reporting date.
Deferred taxes are classified according to the classification of the underlying temporary difference either as an asset or a liability, or in
other comprehensive income or directly in equity.
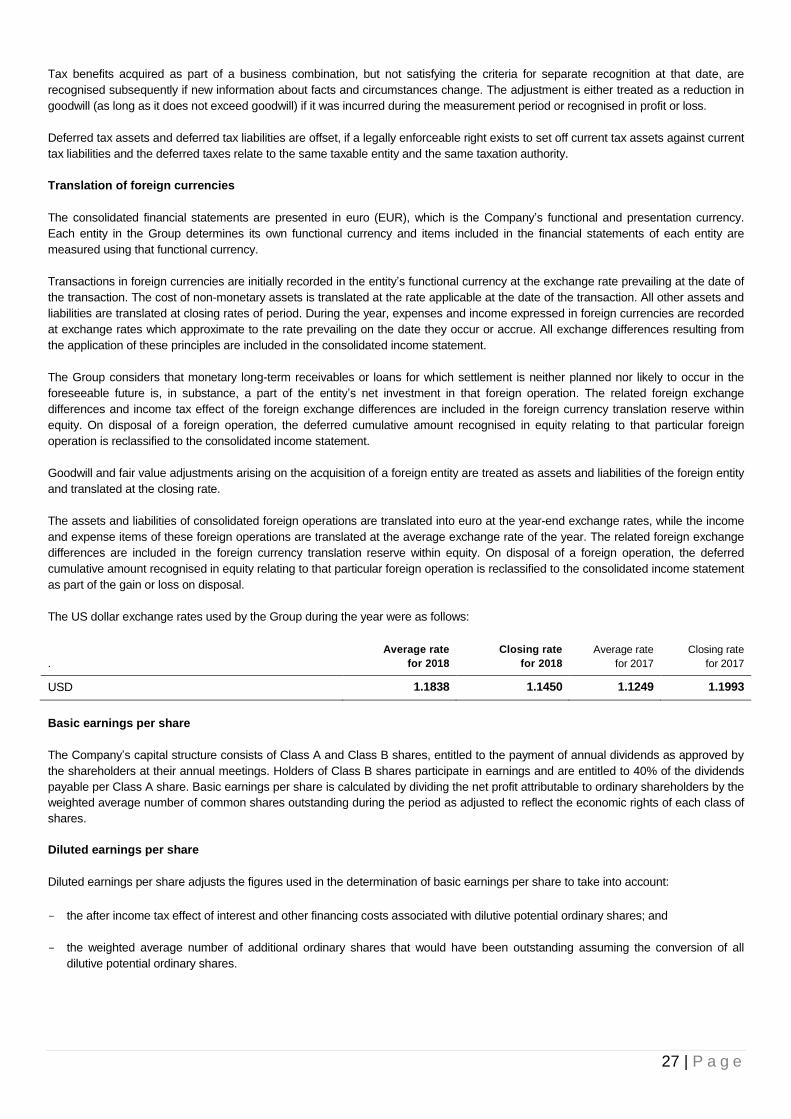
27 | P a g e
Tax benefits acquired as part of a business combination, but not satisfying the criteria for separate recognition at that date, are
recognised subsequently if new information about facts and circumstances change. The adjustment is either treated as a reduction in
goodwill (as long as it does not exceed goodwill) if it was incurred during the measurement period or recognised in profit or loss.
Deferred tax assets and deferred tax liabilities are offset, if a legally enforceable right exists to set off current tax assets against current
tax liabilities and the deferred taxes relate to the same taxable entity and the same taxation authority.
Translation of foreign currencies
The consolidated financial statements are presented in euro (EUR), which is the Company’s functional and presentation currency.
Each entity in the Group determines its own functional currency and items included in the financial statements of each entity are
measured using that functional currency.
Transactions in foreign currencies are initially recorded in the entity’s functional currency at the exchange rate prevailing at the date of
the transaction. The cost of non-monetary assets is translated at the rate applicable at the date of the transaction. All other assets and
liabilities are translated at closing rates of period. During the year, expenses and income expressed in foreign currencies are recorded
at exchange rates which approximate to the rate prevailing on the date they occur or accrue. All exchange differences resulting from
the application of these principles are included in the consolidated income statement.
The Group considers that monetary long-term receivables or loans for which settlement is neither planned nor likely to occur in the
foreseeable future is, in substance, a part of the entity’s net investment in that foreign operation. The related foreign exchange
differences and income tax effect of the foreign exchange differences are included in the foreign currency translation reserve within
equity. On disposal of a foreign operation, the deferred cumulative amount recognised in equity relating to that particular foreign
operation is reclassified to the consolidated income statement.
Goodwill and fair value adjustments arising on the acquisition of a foreign entity are treated as assets and liabilities of the foreign entity
and translated at the closing rate.
The assets and liabilities of consolidated foreign operations are translated into euro at the year-end exchange rates, while the income
and expense items of these foreign operations are translated at the average exchange rate of the year. The related foreign exchange
differences are included in the foreign currency translation reserve within equity. On disposal of a foreign operation, the deferred
cumulative amount recognised in equity relating to that particular foreign operation is reclassified to the consolidated income statement
as part of the gain or loss on disposal.
The US dollar exchange rates used by the Group during the year were as follows:
.
Average rate
for 2018
Closing rate
for 2018
Average rate
for 2017
Closing rate
for 2017
USD 1.1838 1.1450 1.1249 1.1993
Basic earnings per share
The Company’s capital structure consists of Class A and Class B shares, entitled to the payment of annual dividends as approved by
the shareholders at their annual meetings. Holders of Class B shares participate in earnings and are entitled to 40% of the dividends
payable per Class A share. Basic earnings per share is calculated by dividing the net profit attributable to ordinary shareholders by the
weighted average number of common shares outstanding during the period as adjusted to reflect the economic rights of each class of
shares.
Diluted earnings per share
Diluted earnings per share adjusts the figures used in the determination of basic earnings per share to take into account:
- the after income tax effect of interest and other financing costs associated with dilutive potential ordinary shares; and
- the weighted average number of additional ordinary shares that would have been outstanding assuming the conversion of all
dilutive potential ordinary shares.

28 | P a g e
Derivative financial instruments and hedging
The Group recognises all derivatives at fair value in the consolidated statement of financial position. Changes in the fair value of
derivatives are recorded in the consolidated income statement or in accordance with the principles below where hedge accounting is
applied. The Group may use derivative financial instruments such as foreign currency contracts and interest rate swaps to hedge its
risks associated with foreign currency and interest rate fluctuations. On the date a hedging derivative instrument is entered into, the
Group designates the derivative as one of the following:
1) Fair value hedges
Changes in the fair value of derivatives that are designated and qualify as fair value hedges are recorded in the consolidated
income statement, together with any changes in the fair value of the hedged asset or liability that are attributable to the hedged
risk. The Group applies fair value hedge accounting for hedging fixed interest risk on borrowings, and for hedging of foreign
currency risk on firm commitments and highly probable forecast transactions.
2) Cash flow hedges
In relation to cash flow hedges (forward foreign currency contracts and interest rate swaps on floating-rate debt) to hedge firm
commitments or forecasted transactions, the portion of the gain or loss on the hedging instrument that is determined to be an
effective hedge is recognised directly in equity as other comprehensive income, with the ineffective portion being recognised in the
consolidated income statement as finance income or cost. When the hedged commitment results in the recognition of an asset or a
liability, then, at the time the asset or liability is recognised, the associated gains or losses that had previously been recognised in
equity are included in the initial measurement of the acquisition cost or carrying amount of the asset or liability.
3) Hedge of a net investment in a foreign operation
Changes in the fair value of a derivative or non-derivative instrument that is designated as a hedge of a net investment are
recorded in the foreign currency translation reserve within equity to the extent that it is deemed to be an effective hedge. The
ineffective portion is recognised in the consolidated income statement as finance income or cost.
Hedge accounting is discontinued when the hedging instrument expires or is sold, terminated or exercised, the hedge no longer
qualifies for hedge accounting, or the Group revokes the designation. At that point in time, any cumulative gain or loss on the
hedging instrument recognised in equity is kept in equity until the forecasted transaction occurs. If a hedged transaction is no
longer expected to occur, the net cumulative gain or loss recognised in equity is transferred to net profit or loss for the period.
The Group formally documents all relationships between hedging instruments and hedged items, as well as its risk-management
objective and strategy for undertaking various hedge transactions. This process includes allocating all derivatives that are
designated as fair value hedges, cash flow hedges or net investment hedges to specific assets and liabilities in the statement of
financial position or to specific firm commitments or forecasted transactions. The Group also formally assesses both at the
inception of the hedge and on an ongoing basis, whether each derivative is highly effective in offsetting changes in fair values or
cash flows of the hedged item. If it is determined that a derivative is not highly effective as a hedge, or if a derivative ceases to be a
highly effective hedge, the Group will discontinue hedge accounting prospectively. The ineffective portion of hedge is recognised in
profit or loss.
Derecognition of financial assets and liabilities
1) Financial assets
A financial asset is derecognised where:
- the right to receive cash flows from the asset has expired;
- the Group retains the right to receive cash flows from the asset, but has assumed an obligation to pay them in full without
material delay to a third party under a ‘pass-through’ arrangement; or
- the Group has transferred its rights to receive cash flows from the asset and either:
a) has transferred substantially all the risks and rewards of the asset; or
b) has neither transferred nor retained substantially all the risks and rewards of the asset but has transferred control of that
asset.

29 | P a g e
Where the Group has transferred its rights to receive cash flows from an asset and has neither transferred nor retained
substantially all the risks and rewards of the asset nor does transferred control of the asset, the asset continue to be recognised to
the extent of the Group’s continuing involvement in it. Continuing involvement that takes the form of a guarantee over the
transferred asset is measured at the lower of the original carrying amount of the asset and the maximum amount of the
consideration that the Group could be required to repay.
Where continuing involvement takes the form of a written and/or purchased option (including cash-settled options or similar
provision) on the transferred asset, the extent of the Group’s continuing involvement is the amount of the transferred asset that the
Group may repurchase, except that in the case of a written put option (including a cash-settled option or similar provision) on an
asset measured at fair value, the extent of the Group’s continuing involvement is limited to the lower of the fair value of the
transferred asset and the option exercise price.
Offsetting financial instruments
Financial assets and liabilities are offset, and the net amount reported in the balance sheet, when there is a legally enforceable
right to offset the recognised amounts and there is an intention to settle on a net basis or realise the asset and settle the liability
simultaneously. The legally enforceable right must not be contingent on future events and must be enforceable in the normal
course of business and in the event of default, insolvency or bankruptcy of the Company or the counterparty.
2) Financial liabilities
A financial liability is derecognised when the obligation under the liability is discharged, cancelled or expired. Where an existing
financial liability is replaced by another from the same lender on substantially different terms, or the terms of an existing liability are
substantially modified, such an exchange or modification is treated as a derecognition of the original liability and the recognition of
a new liability, and the difference in the respective carrying amount is recognised in profit or loss.
Accounting for pension obligations
The Company and certain subsidiaries operate defined contribution pension plans.
A defined contribution plan is a pension plan under which the Group pays fixed contributions into a separate entity. The Group has no
legal or constructive obligations to pay further contributions if the fund does not hold sufficient assets to pay all employees the benefits
relating to employee service in the current and prior periods.
For defined contribution plans, the Group pays contributions to publicly or privately administered pension insurance plans on a
mandatory, contractual or voluntary basis. The Group has no further payment obligations once the contributions have been paid. The
contributions are recognised as employee benefit expense when they are due. Prepaid contributions are recognised as an asset to the
extent that a cash refund or a reduction in the future payments is available.
Share-based payments
1) Equity-settled share-based compensation plans
Employees (including senior executives) of the Group receive remuneration in the form of share-based compensation transactions,
whereby employees render services as consideration for equity instruments (‘equity-settled transactions’). The cost of
equity-settled transactions is measured by reference to the fair value at the date on which they are granted. The fair value is
determined by an external valuer using a binomial model for the Stock Appreciation Rights Plan (‘STAR Plan’) and Executive
Incentive Compensation Plan (‘EICP Plan’), and a Black Scholes Model for the Long-term Incentive Programme (‘LTI’). Further
details are given in Note 23. In valuing equity-settled transactions, no account is taken of any non-market performance conditions,
the valuation being linked only to the price of the Company’s shares, if applicable.
The cost of equity-settled transactions is recognised, together with a corresponding increase in equity, over the period in which the
performance and/or service conditions are fulfilled, ending on the date on which the relevant employees become fully entitled to the
award (the vesting date). The cumulative expense recognised for equity-settled transactions at each reporting date until the vesting
date reflects the extent to which the vesting period has expired and the Group’s best estimate of the number of equity instruments
that will ultimately vest. The consolidated income statement charge or credit for a period represents the movement in cumulative
expense recognised as at the beginning and end of that period. No expense is recognised for awards that do not ultimately vest.
The dilutive effect of outstanding options is reflected as additional share dilution in the computation of earnings per share (see
Note 11).
30 | P a g e
2) Cash-settled share-based compensation plans
A liability is recognised for the fair value of cash-settled transactions. The fair value is measured initially at each reporting date up
to and including the settlement date, with changes in fair value recognised in employee benefits expense. The fair value is
expensed over the period until the vesting date with recognition of a corresponding liability. The fair value is determined using a
binomial model, further details of which are given in Note 23.
Deeply Subordinated Fixed Rate Resettable Securities (“Perpetual bond”)
The deeply subordinated fixed rate securities issued by the Company are classified as equity since the Company has no contractual
obligation to redeem the securities, and coupon payments may be deferred under certain circumstances (more details are given in
Note 21) and recorded at fair value. Subsequent changes in fair value are not recognised in equity. Coupons become payable
whenever the Company makes dividend payments Coupon accruals are considered in the determination of earnings for calculating
earnings per share (see Note 11).
Leases
The determination of whether an arrangement is, or contains, a lease is based on the substance of the arrangement at inception date,
primarily whether the contract conveys the right to control the use of an identified asset for a period of time in exchange for
consideration. Control is conveyed where the Group has both the right to direct the identified asset’s use and to obtain substantially all
the economic benefits from that use.
Assets and liabilities arising from a lease are initially measured on a present value basis. Lease liabilities include the net present value
of the following lease payments:
- fixed payments (including in-substance fixed payments), less any lease incentives receivable;
- variable lease payment that are based on an index or a rate;
- amounts expected to be payable by the lessee under residual value guarantees;
- the exercise price of a purchase option if the lessee is reasonably certain to exercise that option; and
- payments of penalties for terminating the lease, if the lease term reflects the lessee exercising that option.
The lease payments are discounted using the interest rate implicit in the lease, if that rate can be determined, or the Group’s
incremental borrowing rate. At the commencement of the lease the Group recognises a right-of-use asset and a lease liability. The
lease liability is initially measured at present value of lease payments payable over the lease term, discounted at rate implicit in the
lease. Lease payments are apportioned between the finance charges and reduction of the lease liability to achieve a constant rate of
interest on the remaining balance of the liability. Finance costs are charged directly to expense.
In its accounting policies the Group applies the following practical expedients:
- using a single discount rate to a portfolio of leases with similar characteristics; and
- not accounting for leases ending within 12 months of the date of the initial application, or the underlying asset has a low value.
New standards and interpretations not yet adopted
A number of new standards and amendments to standards and interpretations are relevant for the Group and effective for annual
periods beginning after 1 January 2018, and have not been early adopted in preparing these consolidated financial statements:
1) Amendments to IFRS 9, ‘Financial instruments’ on prepayment features with negative compensation
This amendment confirms that when a financial liability measured at amortised cost is modified without this resulting in
derecognition, a gain or loss should be recognised immediately in profit or loss. The gain or loss is calculated as the difference
between the original contractual cash flows and the modified cash flows discounted at the original effective interest rate. This
means that the difference cannot be spread over the remaining life of the instrument which may be a change in practice from
IAS 39. The effective date of these amendments is 1 January 2019. The Group does not expect any significant impact of these
amendments on its consolidated financial statements.
31 | P a g e
2) Amendments to IAS 19, ‘Employee benefits’ on plan amendment, curtailment or settlement
These amendments require an entity to use updated assumptions to determine current service cost and net interest for the
reminder of the period after a plan amendment, curtailment or settlement; and recognise in profit or loss as part of past service
cost, or a gain or loss on settlement, any reduction in a surplus, even if that surplus was not previously recognised because of the
impact of the asset ceiling. The effective date of these amendments is 1 January 2019. The amendment was not yet endorsed by
EU. The Group does not expect any significant impact of these amendments on its consolidated financial statements.
3) Annual improvements 2015-2017 applicable for periods on or after 1 January 2019 (not yet endorsed by EU)
The annual improvements include minor amendments affecting IFRS 3, ‘Business combinations’, IFRS 11, ‘Joint arrangements’,
IAS 12, ‘Income taxes’, and IAS 23, ‘Borrowing costs’. The adoption of this amendment will not have any impact on the financial
position and performance of the Group. The amendment was not yet endorsed by EU. The Group does not expect any significant
impact of these amendments on its consolidated financial statements.
4) IFRIC 23, Uncertainty over income tax treatments
In June 2017, the IASB issued IFRIC 23 which clarifies how the recognition and measurement requirements of IAS 12 ‘Income
taxes’, are applied where there is uncertainty over income tax treatments. The interpretation explains how to recognise and
measure deferred and current income tax assets and liabilities where there is uncertainty over a tax treatment. This standard is
effective for annual periods beginning on or after 1 January 2019. The Group is currently assessing the impact of IFRIC 23.
5) Amendments to References to the Conceptual Framework in IFRS standards
The International Accounting Standards Board (IASB) has published its revised ‘Conceptual Framework for Financial Reporting’.
Included are revised definitions of an asset and a liability as well as new guidance on measurement and derecognition,
presentation and disclosure. The new Conceptual Framework does not constitute a substantial revision of the document as was
originally intended when the project was first taken up in 2004. The amendment was not yet endorsed by EU. The Group does not
expect any significant impact of these amendments on its consolidated financial statements.
6) Amendment to IFRS 3 - Definition of a Business Combination
The IASB has issued ‘Definition of a Business (Amendments to IFRS 3)’ aimed at resolving the difficulties that arise when an entity
determines whether it has acquired a business or a group of assets.
The amendments are effective for business combinations for which the acquisition date is on or after the beginning of the first
annual reporting period beginning on or after 1 January 2020. The amendment was not yet endorsed by EU.
7) Amendment to IAS 1 and IAS 8 on the definition of material
The International Accounting Standards Board (IASB) has issued ‘Definition of Material (Amendments to IAS 1 and IAS 8)’ to clarify
the definition of ‘material’ and to align the definition used in the Conceptual Framework and the standards themselves.
The amendments are effective for annual reporting periods beginning on or after 1 January 2020 and earlier application is
permitted. The amendment was not yet endorsed by EU.
Alternative performance measures
SES regularly uses alternative performance measures to present the performance of the Group.
These measures may not be comparable to similarly titled measures used by other companies and are not measurements under IFRS
or any other body of generally accepted accounting principles, and thus should not be considered substitutes for the information
contained in the Group’s financial statements.
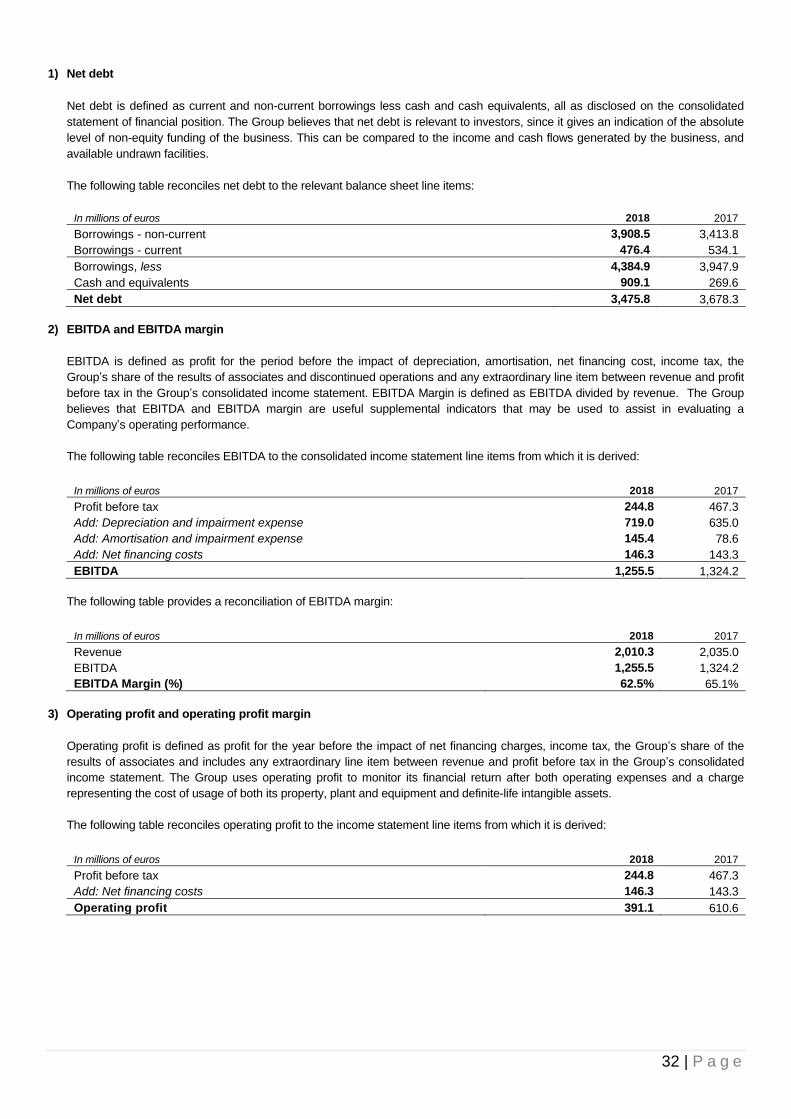
32 | P a g e
1) Net debt
Net debt is defined as current and non-current borrowings less cash and cash equivalents, all as disclosed on the consolidated
statement of financial position. The Group believes that net debt is relevant to investors, since it gives an indication of the absolute
level of non-equity funding of the business. This can be compared to the income and cash flows generated by the business, and
available undrawn facilities.
The following table reconciles net debt to the relevant balance sheet line items:
In millions of euros 2018 2017
Borrowings - non-current 3,908.5 3,413.8
Borrowings - current 476.4 534.1
Borrowings, less 4,384.9 3,947.9
Cash and equivalents 909.1 269.6
Net debt 3,475.8 3,678.3
2) EBITDA and EBITDA margin
EBITDA is defined as profit for the period before the impact of depreciation, amortisation, net financing cost, income tax, the
Group’s share of the results of associates and discontinued operations and any extraordinary line item between revenue and profit
before tax in the Group’s consolidated income statement. EBITDA Margin is defined as EBITDA divided by revenue. The Group
believes that EBITDA and EBITDA margin are useful supplemental indicators that may be used to assist in evaluating a
Company’s operating performance.
The following table reconciles EBITDA to the consolidated income statement line items from which it is derived:
In millions of euros 2018 2017
Profit before tax 244.8 467.3
Add: Depreciation and impairment expense 719.0 635.0
Add: Amortisation and impairment expense 145.4 78.6
Add: Net financing costs 146.3 143.3
EBITDA 1,255.5 1,324.2
The following table provides a reconciliation of EBITDA margin:
In millions of euros 2018 2017
Revenue 2,010.3 2,035.0
EBITDA 1,255.5 1,324.2
EBITDA Margin (%) 62.5% 65.1%
3) Operating profit and operating profit margin
Operating profit is defined as profit for the year before the impact of net financing charges, income tax, the Group’s share of the
results of associates and includes any extraordinary line item between revenue and profit before tax in the Group’s consolidated
income statement. The Group uses operating profit to monitor its financial return after both operating expenses and a charge
representing the cost of usage of both its property, plant and equipment and definite-life intangible assets.
The following table reconciles operating profit to the income statement line items from which it is derived:
In millions of euros 2018 2017
Profit before tax 244.8 467.3
Add: Net financing costs 146.3 143.3
Operating profit 391.1 610.6

33 | P a g e
Operating profit margin is defined as operating profit as a percentage of revenue. SES believes that operating profit margin is a
useful measure to demonstrate the proportion of revenue that has been realised as operating profit, and therefore an indicator of
profitability.
The following table provides a reconciliation of the operating profit margin:
In millions of euros 2018 2017
Revenue 2,010.3 2,035.0
Operating profit 391.1 610.6
Operating profit margin 19.5% 30.0%
4) Net debt to EBITDA ratio
Net debt to EBITDA ratio is defined as net debt divided by EBITDA. The Group believes that net debt to EBITDA ratio is a useful
measure to demonstrate to investors its ability to generate the income needed to be able to settle its loans and borrowings as they
fall due.
The following table reconciles the net debt to EBITDA ratio to net debt and EBITDA:
In millions of euros 2018 2017
Net debt 3,475.8 3,678.3
EBITDA 1,255.5 1,324.2
Net debt to EBITDA ratio 2.77 times 2.78 times
5) Free cash flow before financing activities
Free cash flow before financing activities is defined as net operating cash flow less net cash absorbed by investing activities.
Available free cash flow is used for the payment of dividends, the servicing and repayment of borrowings and other financing
activities, and SES believes it is therefore a useful measure for investors.
The following table reconciles free cash flow before financing activities to the cash flow statement line items from which it is
derived:
In millions of euros 2018 2017
Net cash generated by operating activities 1,191.3 1,251.2
Add: Net cash absorbed by investing activities (320.8) (490.4)
Free cash flow before financing activities 870.5 760.8

34 | P a g e
Note 3 - Implementation of new International Financial Reporting Standards
This note explains the impact of the adoption of IFRS 9 ‘Financial Instruments’, IFRS 15 ‘Revenue from Contracts with Customers’ and
IFRS 16 ‘Leases’ on the Group’s consolidated financial statements, and also discloses those new accounting policies that have been
applied from 1 January 2018, where they are different to those applied in prior periods and are expected to have a material impact.
Summary impact on the consolidated financial statements
As a result of the adoption of the three new standards, opening balances as of 1 January 2018 in the consolidated statement of
financial position had to be restated, consistent with the transitional provisions set out in the three standards. The impact of these
adjustments on the statement of financial position as at 1 January 2018 is set out in the table below:
Statement of Finance Position
(extract)
31 Dec 2017 as
originally
presented
IFRS 9 IFRS 15 IFRS 16 1 January 2018
restated
Non-current assets
Property, plant and equipment 4,591.4 - - 46.8 4,638.2
Trade and other receivables 317.8 0.9 - - 318.7
Deferred tax asset 70.4 0.9 3.4 - 74.7
Current assets
Trade and other receivables 648.2 (7.3) - - 640.9
Deferred customer contract costs 10.4 - 1.8 - 12.2
Total assets 12,184.4 (5.5) 5.2 46.8 12,230.9
Non-current liabilities
Lease liabilities - - - 37.5 37.5
Current liabilities
Deferred income 443.2 - 14.0 - 457.2
Lease liabilities - - - 9.3 9.3
Total liabilities 6,071.9 - 14.0 46.8 6,132.7
Net assets 6,112.5 (5.5) (8.8) - 6,098.2
Retained earnings 596.1 (5.5) (8.8) - 581.8
Total equity 6,112.5 (5.5) (8.8) - 6,098.2
IFRS 9 (‘Financial Instruments’) - Impact of adoption
IFRS 9 replaces IAS 39 relating to the recognition, classification and measurement of financial assets and financial liabilities, the
derecognition of financial instruments, the impairment of financial assets, and hedge accounting.
Classification and measurement
The adoption of IFRS 9 has not affected the classification and measurement of financial assets. Group receivables represent
contractual cash flows and their measurement remains at amortised cost. Similarly, derivative financial instruments used by the
Group continue to be measured at fair value through the income statement. There was also no impact on the Group’s accounting
for financial liabilities, since the new requirements only affect the accounting for those financial liabilities measured at fair value
through the income statement and the Group does not have such liabilities.

35 | P a g e
IFRS 9 was adopted without restating comparative information. The adoption of IFRS 9 resulted in changes in the recognition
principles in the area of impairment and adjustments to the opening balances recognised in the consolidated financial statements.
In accordance with the transitional provisions in IFRS 9, comparative figures have not been restated, but rather have been
recognised in the opening balance sheet on 1 January 2018 as set out in the table above.
All the Group’s hedge relationships in place at the end of 2017 continue to qualify as hedges under IFRS 9 with hedge
documentation in place aligned with the requirements of IFRS 9.
Impairment of financial assets
From 1 January 2018, the Group assesses on a forward-looking basis the expected credit losses associated with its debt
instruments carried at amortised cost. The provisions for trade receivables as at 31 December 2017 reconcile to the opening
provisions on 1 January 2018 as set out in the table above.
IFRS 15 (‘Revenue from Contracts with Customers’)
The adoption of IFRS 15 (‘Revenue from Contracts with Customers’) has resulted in certain changes in revenue recognition
policies and adjustments to the opening balances recognised in the consolidated financial statements. The Group applied the
standard using the modified retrospective approach which means that the cumulative impact of the adoption was recognised in
retained earnings as of 1 January 2018 without the restatement of comparatives from 2017.
The total impact on the Group’s retained earnings as at 1 January 2018 is set out in the table above.
The above impact of IFRS 15 is related only to the allocation of subscription revenue in connection with one of the services
provided by HD Plus GmbH. These were previously recognised on a ‘front-loaded’ basis, matching the timing of the underlying
operating expenses arising during the provision of the service. From 1 January 2018 the Group instead linearises both the
subscription revenue and the associated operating costs over the 12-month term of the subscription agreement.
IFRS 16 (‘Leases’)
The adoption of IFRS 16 has resulted in changes in accounting policies and adjustments to the opening balances as of
1 January 2018 in the consolidated statement of financial position. The Group has applied the simplified transition approach as
allowed by the standard, and therefore has not restated comparative closing 2017 amounts, but rather has adjusted the opening
balance sheet as set out in the table above.
Specifically, the Group has recognised leased assets, and associated lease liabilities, in relation to contracts previously classified
as ‘operating leases’ under the provisions of IAS 17. These assets and liabilities were measured at the present value of the
remaining lease payments, discounted using the Group’s weighted average incremental borrowing rate of 3.66% as at
1 January 2018.
The Group has applied the following practical expedients:
- applying a single discount rate to a portfolio of leases with similar characteristics; and
- not accounting for leases which end within 12 months from the date of the initial application or the underlying asset has a low
value.
As at 31 December 2017, the Group had non-cancellable operating lease commitments of EUR 52.5 million, mainly in relation to
office buildings and ground segment assets. The Group determined that only approximately 1% of these relate to payments for
short-term and low-value leases which will continue to be recognised on a straight-line basis as an expense in the consolidated
income statement over the duration of the agreements.
The amount of right-of-use assets and lease liabilities recorded as an adjustment to the opening balance sheet was
EUR 46.8 million. The difference between the operating lease commitments and the right-of-use assets recognised represents
impact of discounting over the outstanding lease term.

36 | P a g e
Note 4 - Segment information
The Group does business in one operating segment, namely the provision of satellite-based data transmission capacity, and ancillary
services, to customers around the world.
The Senior Leadership Team (‘SLT’), which is the chief operating decision-making committee in the Group’s corporate governance
structure, reviews the Group’s financial reporting and generates those proposals for the allocation of the Group’s resources, which are
submitted for validation to the Board of Directors. The main sources of financial information used by the SLT in assessing the Group’s
performance and allocating resources are:
- analysis of the Group’s revenues by two natural business units SES Video and SES Networks which comprises Fixed Data,
Mobility and Government verticals;
- cost and overall Group’s profitability development at the level of the entire business;
- internal and external analysis of expected future developments in the markets into which capacity is being delivered and of the
commercial landscape applying to those markets.
When analysing the performance of the operating segment, the comparative prior year figures are analysed as reported and at
‘constant FX’ - recomputed using the exchange rates applying for each month in the current period.
The segment’s financial results for 2018 are set out below:
In millions of euros 2018 2017
Change
Favourable +/Adverse
Revenue 2,010.3 2,035.0 -1.2%
Operating expenses (754.8) (710.8) -6.2%
EBITDA 1,255.5 1,324.2 -5.2%
EBITDA margin (%) 62.5% 65.1% -2.6% pts
Depreciation and impairment expense (719.0) (635.0) -13.2%
Amortisation and impairment expense (145.4) (78.6) -85.0%
Operating profit 391.1 610.6 -36.0%
In millions of euros
2018
Constant
FX 2017
Change
Favourable +/Adverse
Revenue 2,010.3 1,977.4 +1.7%
Operating expenses (754.8) (689.0) -9.5%
EBITDA 1,255.5 1,288.4 -2.6%
EBITDA margin (%) 62.5% 65.2% -2.7% pts
Depreciation and impairment expense (719.0) (612.6) -17.4%
Amortisation and impairment expense (145.4) (77.6) -87.4%
Operating profit 391.1 598.2 -34.6%
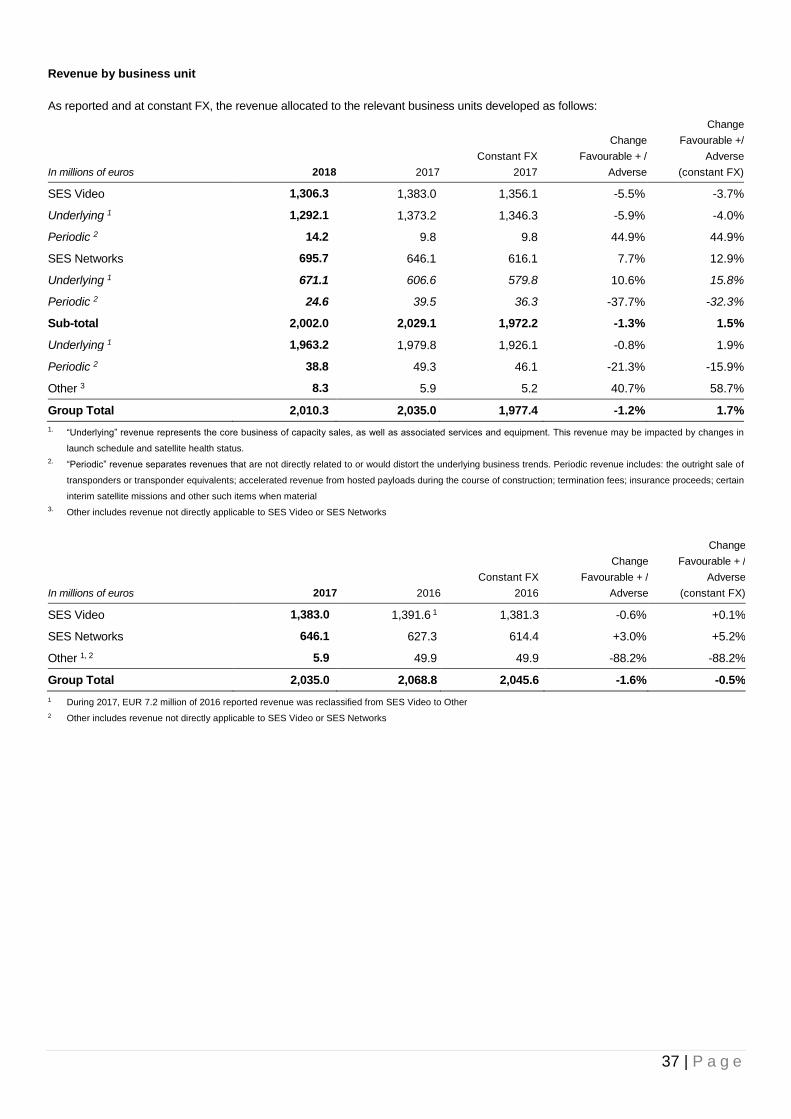
37 | P a g e
Revenue by business unit
As reported and at constant FX, the revenue allocated to the relevant business units developed as follows:
In millions of euros 2018 2017
Constant FX
2017
Change
Favourable + /
Adverse
Change
Favourable +/
Adverse
(constant FX)
SES Video 1,306.3 1,383.0 1,356.1 -5.5% -3.7%
Underlying 1 1,292.1 1,373.2 1,346.3 -5.9% -4.0%
Periodic 2 14.2 9.8 9.8 44.9% 44.9%
SES Networks 695.7 646.1 616.1 7.7% 12.9%
Underlying 1 671.1 606.6 579.8 10.6% 15.8%
Periodic 2 24.6 39.5 36.3 -37.7% -32.3%
Sub-total 2,002.0 2,029.1 1,972.2 -1.3% 1.5%
Underlying 1 1,963.2 1,979.8 1,926.1 -0.8% 1.9%
Periodic 2 38.8 49.3 46.1 -21.3% -15.9%
Other 3 8.3 5.9 5.2 40.7% 58.7%
Group Total 2,010.3 2,035.0 1,977.4 -1.2% 1.7%
1. “Underlying” revenue represents the core business of capacity sales, as well as associated services and equipment. This revenue may be impacted by changes in
launch schedule and satellite health status.
2. “Periodic” revenue separates revenues that are not directly related to or would distort the underlying business trends. Periodic revenue includes: the outright sale of
transponders or transponder equivalents; accelerated revenue from hosted payloads during the course of construction; termination fees; insurance proceeds; certain
interim satellite missions and other such items when material
3. Other includes revenue not directly applicable to SES Video or SES Networks
In millions of euros 2017 2016
Constant FX
2016
Change
Favourable + /
Adverse
Change
Favourable + /
Adverse
(constant FX)
SES Video 1,383.0 1,391.6 1 1,381.3 -0.6% +0.1%
SES Networks 646.1 627.3 614.4 +3.0% +5.2%
Other 1, 2 5.9 49.9 49.9 -88.2% -88.2%
Group Total 2,035.0 2,068.8 2,045.6 -1.6% -0.5%
1 During 2017, EUR 7.2 million of 2016 reported revenue was reclassified from SES Video to Other
2 Other includes revenue not directly applicable to SES Video or SES Networks
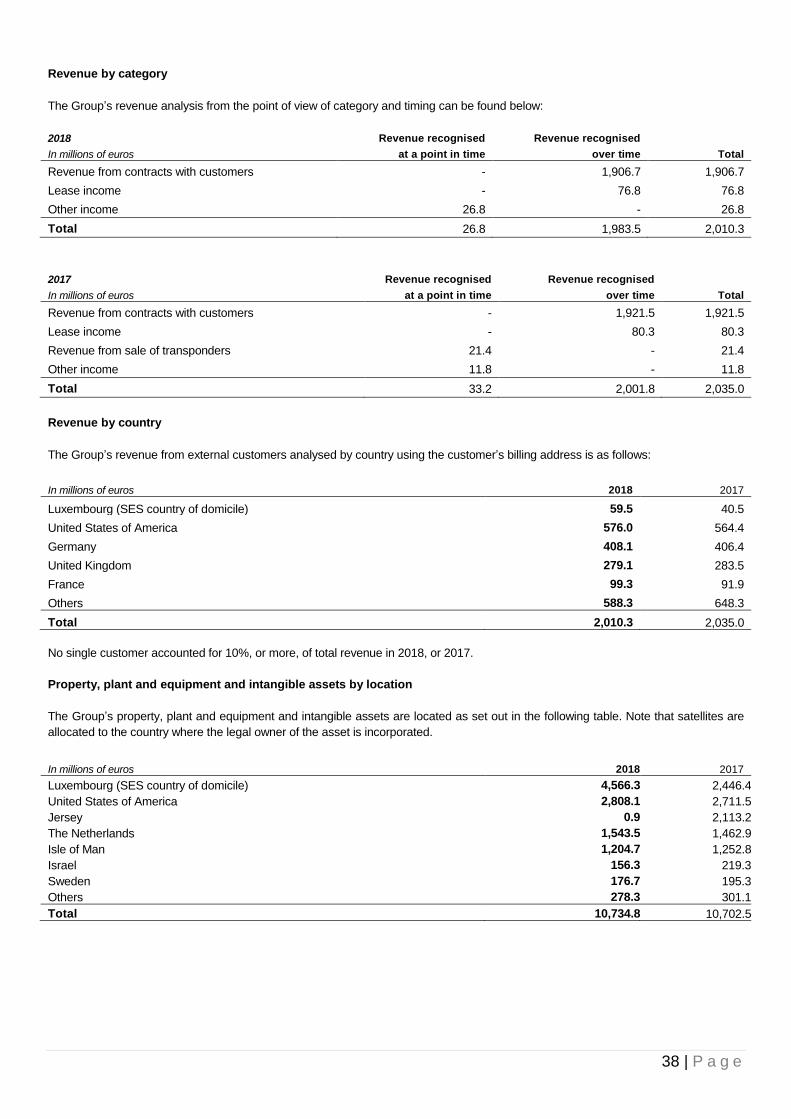
38 | P a g e
Revenue by category
The Group’s revenue analysis from the point of view of category and timing can be found below:
2018
In millions of euros
Revenue recognised
at a point in time
Revenue recognised
over time Total
Revenue from contracts with customers - 1,906.7 1,906.7
Lease income - 76.8 76.8
Other income 26.8 - 26.8
Total 26.8 1,983.5 2,010.3
2017
In millions of euros
Revenue recognised
at a point in time
Revenue recognised
over time Total
Revenue from contracts with customers - 1,921.5 1,921.5
Lease income - 80.3 80.3
Revenue from sale of transponders 21.4 - 21.4
Other income 11.8 - 11.8
Total 33.2 2,001.8 2,035.0
Revenue by country
The Group’s revenue from external customers analysed by country using the customer’s billing address is as follows:
In millions of euros 2018 2017
Luxembourg (SES country of domicile) 59.5 40.5
United States of America 576.0 564.4
Germany 408.1 406.4
United Kingdom 279.1 283.5
France 99.3 91.9
Others 588.3 648.3
Total 2,010.3 2,035.0
No single customer accounted for 10%, or more, of total revenue in 2018, or 2017.
Property, plant and equipment and intangible assets by location
The Group’s property, plant and equipment and intangible assets are located as set out in the following table. Note that satellites are
allocated to the country where the legal owner of the asset is incorporated.
In millions of euros 2018 2017
Luxembourg (SES country of domicile) 4,566.3 2,446.4
United States of America 2,808.1 2,711.5
Jersey 0.9 2,113.2
The Netherlands 1,543.5 1,462.9
Isle of Man 1,204.7 1,252.8
Israel 156.3 219.3
Sweden 176.7 195.3
Others 278.3 301.1
Total 10,734.8 10,702.5

39 | P a g e
Note 5 - Operating expenses
The operating expense categories disclosed include the following types of expenditure:
1) Cost of sales, which excludes staff costs and depreciation, represents cost categories which generally vary directly with
revenue. Such costs include the rental of third-party satellite capacity, customer support costs, such as uplinking and
monitoring, and other costs of sales such as equipment rental, engineering work, commissions, hardware and set-up costs.
In millions of euros 2018 2017
Rental of third-party satellite capacity (89.8) (102.9)
Customer support costs (36.7) (25.1)
Other cost of sales (159.3) (145.9)
Total cost of sales (285.8) (273.9)
2) Staff costs of EUR 305.7 million (2017: EUR 279.2 million) include gross salaries and employer’s social security payments,
payments into pension schemes for employees, and charges arising under share-based payment schemes. At the year-end the
total full-time equivalent members of staff is 2,147 (2017: 2,015).
3) Other operating expenses in the amount of EUR 163.3 million (2017: EUR 157.7 million) are by their nature less variable to
revenue development. Such costs include facility costs, in-orbit insurance costs, marketing expenses, general and administrative
expenditure, consulting charges, travel-related expenditure and movements in provisions for debtors.
Note 6 - Audit and non-audit fees
For 2018 and 2017 the Group has recorded charges, billed and accrued, from its independent auditors and affiliated companies
thereof, as set out below:
In millions of euros 2018 2017
Fees for statutory audit of annual and consolidated accounts 2.4 2.1
Fees charged for other assurance services 0.1 0.2
Fees charged for tax services - -
Fees charged for other non-audit services 0.1 -
Total audit and non-audit fees 2.6 2.3
Other assurance services represent primarily interim dividends reviews and contractual audits.
Tax services represent compliance and advisory services.
Other non-audit services represent primarily of comfort letters in relation to the bond issuances.
Note 7 - Finance income and costs
In millions of euros 2018 2017
Finance income
Interest income 11.6 1.1
Net foreign exchange gains1 5.1 -
Total 16.7 1.1
Finance costs
Interest expenses on borrowings (excluding amounts capitalised) (127.3) (111.0)
Loan fees and origination costs and other (35.0) (32.2)
Interest expense on lease liabilities (0.7) -
Net foreign exchange losses1 - (1.2)
Total (163.0) (144.4) 1 Net foreign exchange gains /losses are mostly related to revaluation of bank accounts, deposits and other monetary items denominated in US dollar.

40 | P a g e
Note 8 - Income taxes
Taxes on income comprise the taxes paid or owed in the individual countries, as well as deferred taxes. Current and deferred taxes
can be analysed as follows:
In millions of euros 2018 2017
Current income tax
Current income tax charge (72.1) (57.7)
Adjustments in respect of prior periods (1.8) 28.7
Foreign withholding taxes (9.9) (3.4)
Total current income tax (83.8) (32.4)
Deferred income tax
Relating to origination and reversal of temporary differences 118.0 51.2
Relating to tax losses brought forward (4.2) 17.5
Changes in tax rate 8.2 95.0
Adjustment of prior years 3.7 (0.7)
Total deferred income tax 125.7 163.0
Income tax benefit per consolidated income statement 41.9 130.6
Consolidated statement of changes in equity
Current and Deferred Income tax related to items (charged) or credited directly in equity
Post-employment benefit obligation (0.2) (0.3)
Impact of currency translation (20.8) 60.3
Net investment hedge - current tax 21.2 (65.4)
Tax impact of the treasury shares impairment recorded in the statutory financial statements (6.4) 14.2
Tax impact on perpetual bond 18.8 19.5
Current and deferred income taxes reported in equity 12.6 28.3
A reconciliation between the income tax benefit and the profit before tax of the Group multiplied by a theoretical tax rate of 26.76%
(2017: 27.83%) which corresponds to the Luxembourg domestic tax rate for the year ended 31 December 2018 is as follows:
In millions of euros 2018 2017
Profit before tax from continuing operations 244.8 467.3
Multiplied by theoretical tax rate 65.5 130.0
Effect of different foreign tax rates 7.6 (15.1)
Investment tax credits (109.6) (15.0)
Tax exempt income (22.7) (4.5)
Non-deductible expenditures 14.9 10.5
Taxes related to prior years 0.8 (7.1)
Effect of changes in tax rate (21.8) (3.4)
Change in deferred tax due to temporary differences related to prior years 12.0 7.7
Group tax provision related to current year 6.0 2.3
Release of Group tax provision (1.1) (17.7)
Extra-Territorial Income exclusion benefit - (56.7)
Impairment on subsidiaries (17.7) (23.8)
Impairment on intangible assets 14.6 -
Remeasurement of deferred taxes due to change in US tax law (2.9) (94.4)
Brazilian withholding tax refund - (51.1)
Foreign withholding taxes 9.9 3.4
Other 2.6 4.3
Income tax reported in the consolidated income statement (41.9) (130.6)
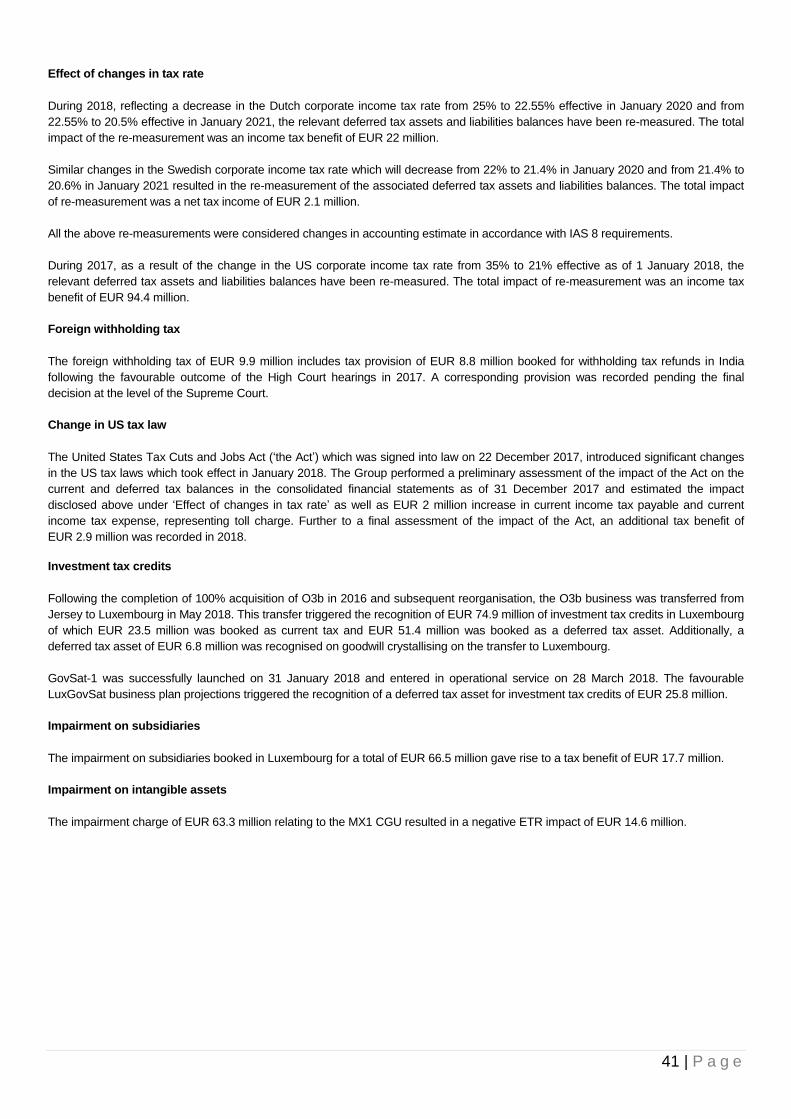
41 | P a g e
Effect of changes in tax rate
During 2018, reflecting a decrease in the Dutch corporate income tax rate from 25% to 22.55% effective in January 2020 and from
22.55% to 20.5% effective in January 2021, the relevant deferred tax assets and liabilities balances have been re-measured. The total
impact of the re-measurement was an income tax benefit of EUR 22 million.
Similar changes in the Swedish corporate income tax rate which will decrease from 22% to 21.4% in January 2020 and from 21.4% to
20.6% in January 2021 resulted in the re-measurement of the associated deferred tax assets and liabilities balances. The total impact
of re-measurement was a net tax income of EUR 2.1 million.
All the above re-measurements were considered changes in accounting estimate in accordance with IAS 8 requirements.
During 2017, as a result of the change in the US corporate income tax rate from 35% to 21% effective as of 1 January 2018, the
relevant deferred tax assets and liabilities balances have been re-measured. The total impact of re-measurement was an income tax
benefit of EUR 94.4 million.
Foreign withholding tax
The foreign withholding tax of EUR 9.9 million includes tax provision of EUR 8.8 million booked for withholding tax refunds in India
following the favourable outcome of the High Court hearings in 2017. A corresponding provision was recorded pending the final
decision at the level of the Supreme Court.
Change in US tax law
The United States Tax Cuts and Jobs Act (‘the Act’) which was signed into law on 22 December 2017, introduced significant changes
in the US tax laws which took effect in January 2018. The Group performed a preliminary assessment of the impact of the Act on the
current and deferred tax balances in the consolidated financial statements as of 31 December 2017 and estimated the impact
disclosed above under ‘Effect of changes in tax rate’ as well as EUR 2 million increase in current income tax payable and current
income tax expense, representing toll charge. Further to a final assessment of the impact of the Act, an additional tax benefit of
EUR 2.9 million was recorded in 2018.
Investment tax credits
Following the completion of 100% acquisition of O3b in 2016 and subsequent reorganisation, the O3b business was transferred from
Jersey to Luxembourg in May 2018. This transfer triggered the recognition of EUR 74.9 million of investment tax credits in Luxembourg
of which EUR 23.5 million was booked as current tax and EUR 51.4 million was booked as a deferred tax asset. Additionally, a
deferred tax asset of EUR 6.8 million was recognised on goodwill crystallising on the transfer to Luxembourg.
GovSat-1 was successfully launched on 31 January 2018 and entered in operational service on 28 March 2018. The favourable
LuxGovSat business plan projections triggered the recognition of a deferred tax asset for investment tax credits of EUR 25.8 million.
Impairment on subsidiaries
The impairment on subsidiaries booked in Luxembourg for a total of EUR 66.5 million gave rise to a tax benefit of EUR 17.7 million.
Impairment on intangible assets
The impairment charge of EUR 63.3 million relating to the MX1 CGU resulted in a negative ETR impact of EUR 14.6 million.

42 | P a g e
Note 9 - Deferred income tax
The deferred taxes positions included in the consolidated financial statements can be analysed as follows:
In millions of euros
Deferred tax
assets
2018
Deferred tax
assets
2017
Deferred tax
liabilities
2018
Deferred tax
liabilities
2017
Losses carried forward 32.3 33.5 - -
Tax credits 96.7 6.0 - -
Intangible assets 38.3 37.7 (215.9) (218.6)
Tangible assets - - (213.4) (244.3)
Employee benefits 7.8 10.0 - -
Receivables 17.8 21.0 - -
Other 0.7 1.1 (14.5) (14.5)
Total deferred tax assets / (liabilities) 193.6 109.3 (443.8) (477.4)
Offset of deferred taxes (31.3) (38.9) 31.3 38.9
Net deferred tax assets/ (liabilities) 162.3 70.4 (412.5) (438.5)
Deferred tax assets have been offset against deferred tax liabilities where they relate to the same taxation authority and the entity
concerned has a legally enforceable right to set off current tax assets against current tax liabilities.
In addition to the recoverable tax losses for which the Group has recognised deferred tax assets, the Group has further tax losses of
EUR 569.9 million as at 31 December 2018 (31 December 2017: EUR 490.8 million) that are available for offset against future taxable
profits of the companies in which the losses arose. EUR 478.0 million (31 December 2017: 450.7 million) of tax losses are triggered by
the change in state apportionment rules in the US. Deferred tax assets have not been recognised in respect of these losses as they
may not be used to offset taxable profits elsewhere in the Group and they have arisen in subsidiaries that are not expected to generate
taxable profits against which these losses could be offset in the foreseeable future.
No deferred income tax liabilities have been recognised for the withholding tax and other taxes which would be payable on the
unremitted earnings of certain subsidiaries. Such amounts are permanently reinvested or not subject to taxation.
The movement in deferred income tax assets and liabilities during the year, without taking into consideration the offsetting of balances
is as follows:
Deferred tax assets
Losses
carried
forward
Tax
credits
Intangible
assets
Employee
benefits
Measurement of
financial assets
and derivatives Receivables Other
Total
At 1 January 2017 40.8 6.5 41.4 15.6 1.1 14.4 1.2 121.0
(Charged)/credited to
the income statement (3.9) (0.5) (3.7) (3.9) (0.8) 8.8 (0.1) (4.1)
Charged directly to
equity - - (0.4) (0.1) - - (0.5)
Exchange difference1 (3.4) - - (1.3) (0.2) (2.2) - (7.1)
At 31 December 2017 33.5 6.0 37.7 10.0 - 21.0 1.1 109.3
Changes in accounting
policies - - - - - 4.3 - 4.3
(Charged)/credited to
the income statement
(2.1)
89.7
0.8
(2.6) 0.1
(8.0)
(0.5)
77.4
Charged directly to
equity - - - (0.2) - - - (0.2)
Exchange difference1 0.9 1.0 (0.2) 0.6 - 0.5 - 2.8
At 31 December 2018 32.3 96.7 38.3 7.8 0.1 17.8 0.6 193.6

43 | P a g e
Deferred tax liabilities
Intangible
assets
Tangible
assets
Tax-free
reserves
Measurement of
financial instruments Other
Total
At 1 January 2017 294.1 401.4 3.9 - 15.3 714.7
Charged/(credited) to the
income statement (46.5) (116.8) (3.4) - (0.4) (167.1)
Exchange difference1 (29.0) (40.3) (0.5) - (0.4) (70.2)
At 31 December 2017 218.6 244.3 - - 14.5 477.4
Charged/(credited) to the
income statement (13.0) (35.3) - - - (48.3)
Exchange difference1 10.3 4.4 - - - 14.7
At 31 December 2018 215.9 213.4 - - 14.5 443.8
1 A foreign exchange impact arises due to the translation of Group’s operations with a different functional currency than euro. This amounts to EUR 11.9 million as at
31 December 2018 (2017: EUR 63.1 million)
Note 10 - Components of other comprehensive income
In millions of euros 2018 2017
Impact of currency translation 345.2 (1,050.9)
Income tax effect (20.8) 60.3
Total impact of currency translation, net of tax 324.4 (990.6)
The impact of currency translation in other comprehensive income relates to exchange gains or losses arising on the translation of the
net assets of foreign operations from their functional currency to euro, which is the Company’s functional and presentation currency.
The assets and liabilities of consolidated foreign operations are translated into euro at the year-end exchange rates, while the income
and expense items of these foreign operations are translated at the average exchange rate of the year.
The unrealised gain in 2018 reflects the impact on the valuation of SES’s net US dollar assets of the strengthening of the US dollar
against the euro from 1.1993 to 1.1450 (compared to significant unrealised loss in 2017 reflecting the impact on the valuation of
SES’s net US dollar assets of the weakening of the US dollar against the euro from 1.0541 to 1.1993). This effect is partially offset by
the impact of the net investment hedge (Note 19).
Note 11 - Earnings per share
Earnings per share is calculated by dividing the net profit for the year attributable to ordinary shareholders of each class of shares by
the weighted average number of shares outstanding during the year as adjusted to reflect the economic rights of each class of share.
The net profit for the year attributable to ordinary shareholders has been adjusted to include an assumed coupon, net of tax, on the
perpetual bond.
For the year 2018, basic earnings per share of EUR 0.54 per Class A share (2017: EUR 1.21), and EUR 0.22 per Class B share
(2017: EUR 0.48) have been calculated on the following basis:
Profit attributable to the owners of the parent for calculating basic earnings per share was as follows:
In millions of euros 2018 2017
Profit attributable to owners of the parent 292.4 596.1
Assumed coupon on perpetual bond (net of tax) (48.1) (47.3)
Total 244.3 548.8
Assumed coupon accruals of EUR 48.1 million (net of tax) for the year ended 31 December 2018 (2017: EUR 47.3 million) related to
the perpetual bonds issued during 2016 have been considered for the calculation of the basic and diluted earnings available for
distribution.
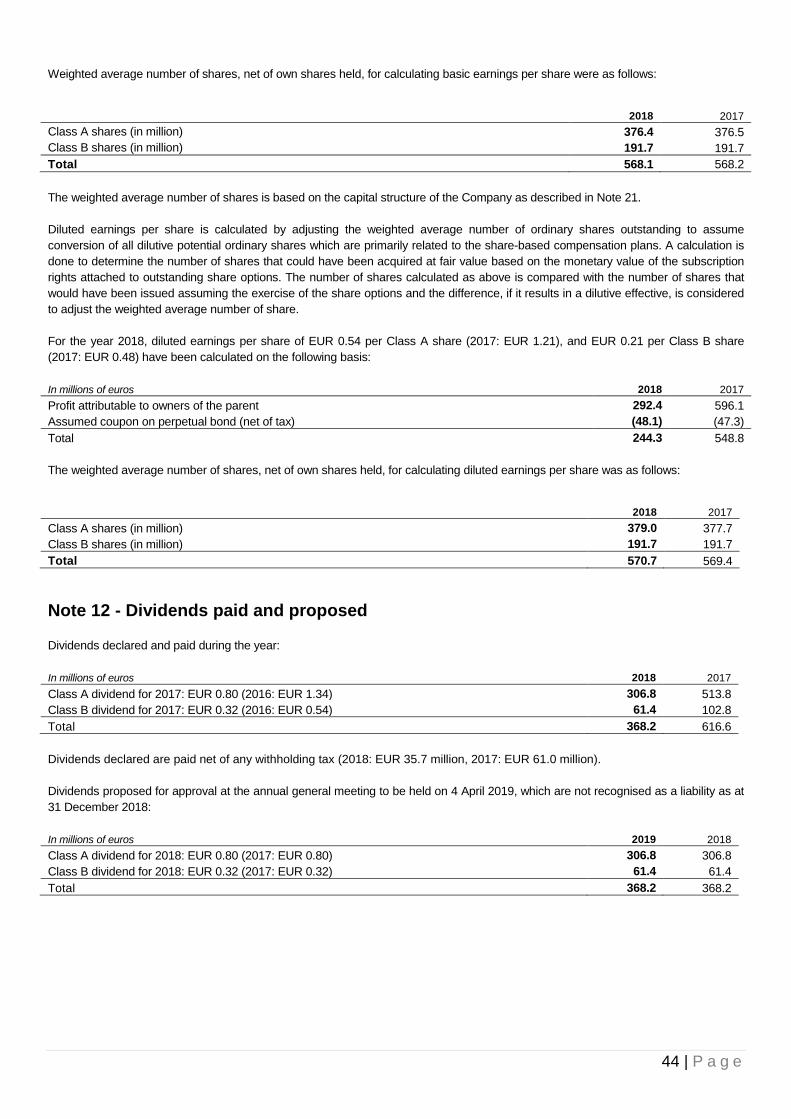
44 | P a g e
Weighted average number of shares, net of own shares held, for calculating basic earnings per share were as follows:
2018 2017
Class A shares (in million) 376.4 376.5
Class B shares (in million) 191.7 191.7
Total 568.1 568.2
The weighted average number of shares is based on the capital structure of the Company as described in Note 21.
Diluted earnings per share is calculated by adjusting the weighted average number of ordinary shares outstanding to assume
conversion of all dilutive potential ordinary shares which are primarily related to the share-based compensation plans. A calculation is
done to determine the number of shares that could have been acquired at fair value based on the monetary value of the subscription
rights attached to outstanding share options. The number of shares calculated as above is compared with the number of shares that
would have been issued assuming the exercise of the share options and the difference, if it results in a dilutive effective, is considered
to adjust the weighted average number of share.
For the year 2018, diluted earnings per share of EUR 0.54 per Class A share (2017: EUR 1.21), and EUR 0.21 per Class B share
(2017: EUR 0.48) have been calculated on the following basis:
In millions of euros 2018 2017
Profit attributable to owners of the parent 292.4 596.1
Assumed coupon on perpetual bond (net of tax) (48.1) (47.3)
Total 244.3 548.8
The weighted average number of shares, net of own shares held, for calculating diluted earnings per share was as follows:
2018 2017
Class A shares (in million) 379.0 377.7
Class B shares (in million) 191.7 191.7
Total 570.7 569.4
Note 12 - Dividends paid and proposed
Dividends declared and paid during the year:
In millions of euros 2018 2017
Class A dividend for 2017: EUR 0.80 (2016: EUR 1.34) 306.8 513.8
Class B dividend for 2017: EUR 0.32 (2016: EUR 0.54) 61.4 102.8
Total 368.2 616.6
Dividends declared are paid net of any withholding tax (2018: EUR 35.7 million, 2017: EUR 61.0 million).
Dividends proposed for approval at the annual general meeting to be held on 4 April 2019, which are not recognised as a liability as at
31 December 2018:
In millions of euros 2019 2018
Class A dividend for 2018: EUR 0.80 (2017: EUR 0.80) 306.8 306.8
Class B dividend for 2018: EUR 0.32 (2017: EUR 0.32) 61.4 61.4
Total 368.2 368.2
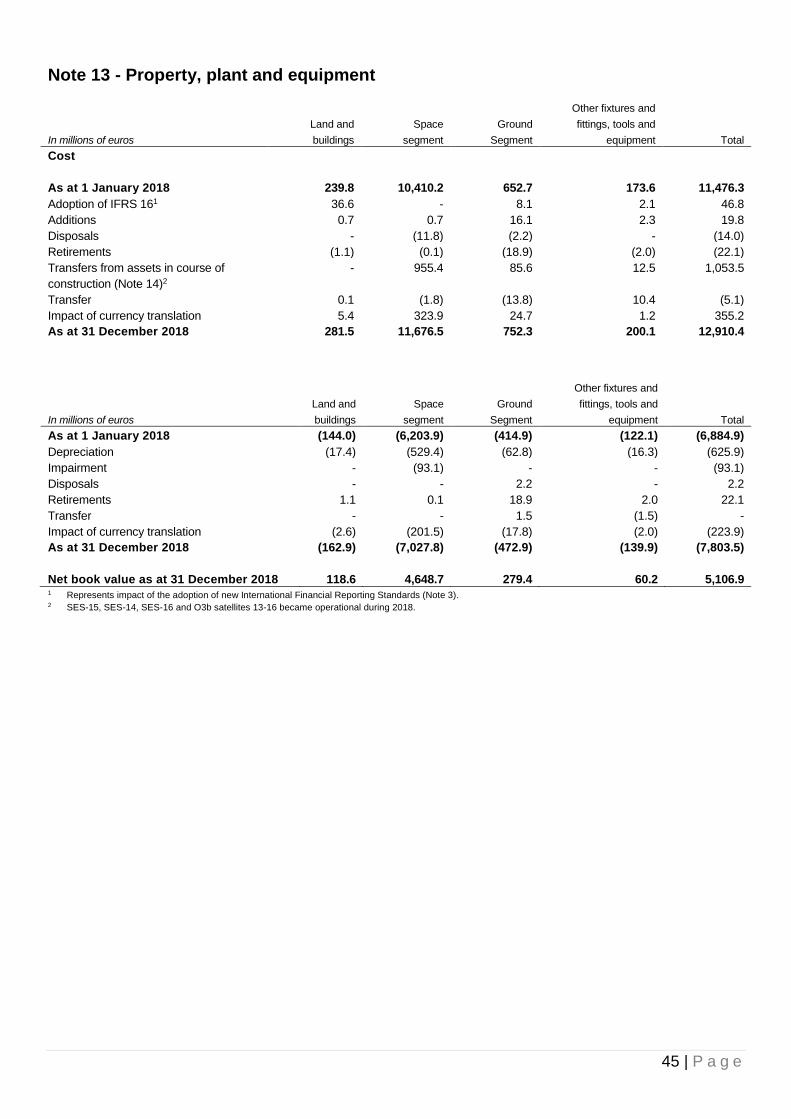
45 | P a g e
Note 13 - Property, plant and equipment
In millions of euros
Land and
buildings
Space
segment
Ground
Segment
Other fixtures and
fittings, tools and
equipment Total
Cost
As at 1 January 2018 239.8 10,410.2 652.7 173.6 11,476.3
Adoption of IFRS 161 36.6 - 8.1 2.1 46.8
Additions 0.7 0.7 16.1 2.3 19.8
Disposals - (11.8) (2.2) - (14.0)
Retirements (1.1) (0.1) (18.9) (2.0) (22.1)
Transfers from assets in course of
construction (Note 14)2
- 955.4 85.6 12.5 1,053.5
Transfer 0.1 (1.8) (13.8) 10.4 (5.1)
Impact of currency translation 5.4 323.9 24.7 1.2 355.2
As at 31 December 2018 281.5 11,676.5 752.3 200.1 12,910.4
In millions of euros
Land and
buildings
Space
segment
Ground
Segment
Other fixtures and
fittings, tools and
equipment Total
As at 1 January 2018 (144.0) (6,203.9) (414.9) (122.1) (6,884.9)
Depreciation (17.4) (529.4) (62.8) (16.3) (625.9)
Impairment - (93.1) - - (93.1)
Disposals - - 2.2 - 2.2
Retirements 1.1 0.1 18.9 2.0 22.1
Transfer - - 1.5 (1.5) -
Impact of currency translation (2.6) (201.5) (17.8) (2.0) (223.9)
As at 31 December 2018 (162.9) (7,027.8) (472.9) (139.9) (7,803.5)
Net book value as at 31 December 2018 118.6 4,648.7 279.4 60.2 5,106.9 1 Represents impact of the adoption of new International Financial Reporting Standards (Note 3). 2 SES-15, SES-14, SES-16 and O3b satellites 13-16 became operational during 2018.
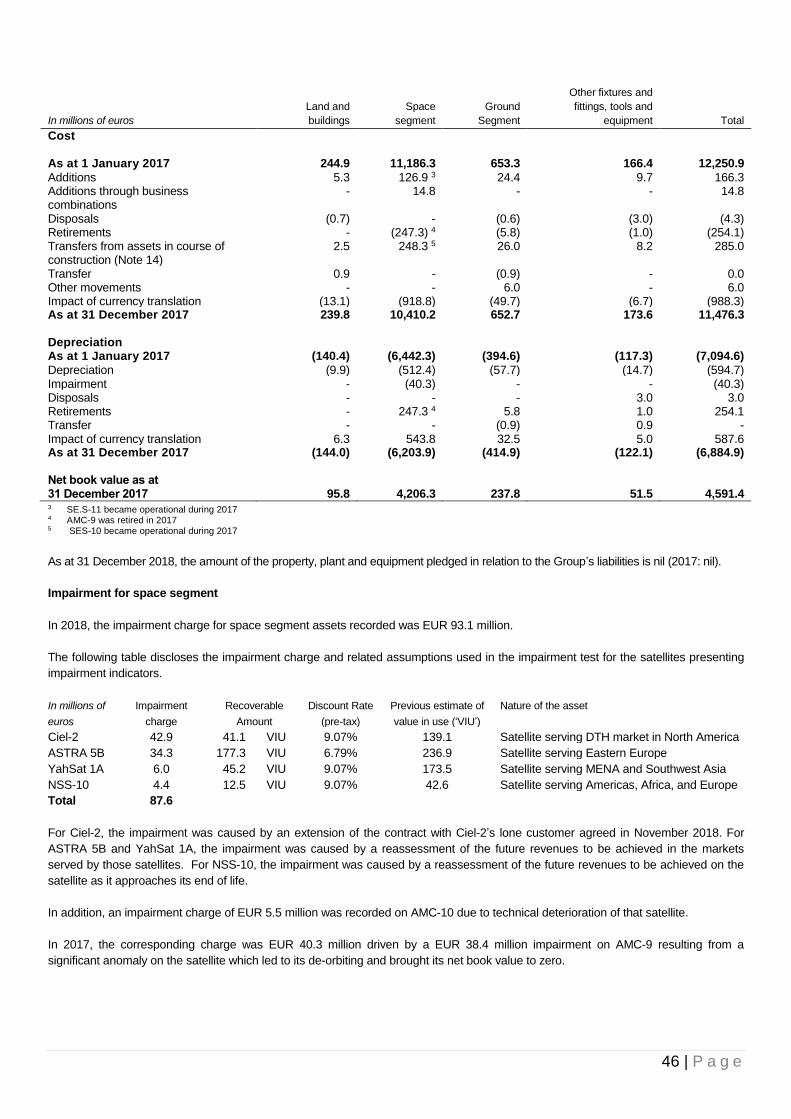
46 | P a g e
In millions of euros
Land and
buildings
Space
segment
Ground
Segment
Other fixtures and
fittings, tools and
equipment Total
Cost As at 1 January 2017 244.9 11,186.3 653.3 166.4 12,250.9
Additions 5.3 126.9 3 24.4 9.7 166.3 Additions through business combinations
- 14.8 - - 14.8
Disposals (0.7) - (0.6) (3.0) (4.3) Retirements - (247.3) 4 (5.8) (1.0) (254.1) Transfers from assets in course of construction (Note 14)
2.5 248.3 5 26.0 8.2 285.0
Transfer 0.9 - (0.9) - 0.0 Other movements - - 6.0 - 6.0 Impact of currency translation (13.1) (918.8) (49.7) (6.7) (988.3) As at 31 December 2017 239.8 10,410.2 652.7 173.6 11,476.3
Depreciation As at 1 January 2017 (140.4) (6,442.3) (394.6) (117.3) (7,094.6)
Depreciation (9.9) (512.4) (57.7) (14.7) (594.7) Impairment - (40.3) - - (40.3) Disposals - - - 3.0 3.0 Retirements - 247.3 4 5.8 1.0 254.1 Transfer - - (0.9) 0.9 - Impact of currency translation 6.3 543.8 32.5 5.0 587.6 As at 31 December 2017 (144.0) (6,203.9) (414.9) (122.1) (6,884.9) Net book value as at 31 December 2017 95.8 4,206.3 237.8 51.5 4,591.4 3 SE.S-11 became operational during 2017 4 AMC-9 was retired in 2017 5 SES-10 became operational during 2017
As at 31 December 2018, the amount of the property, plant and equipment pledged in relation to the Group’s liabilities is nil (2017: nil).
Impairment for space segment
In 2018, the impairment charge for space segment assets recorded was EUR 93.1 million.
The following table discloses the impairment charge and related assumptions used in the impairment test for the satellites presenting
impairment indicators.
In millions of
euros
Impairment
charge
Recoverable
Amount
Discount Rate
(pre-tax)
Previous estimate of
value in use (‘VIU’)
Nature of the asset
Ciel-2 42.9 41.1 VIU 9.07% 139.1 Satellite serving DTH market in North America
ASTRA 5B 34.3 177.3 VIU 6.79% 236.9 Satellite serving Eastern Europe
YahSat 1A 6.0 45.2 VIU 9.07% 173.5 Satellite serving MENA and Southwest Asia
NSS-10 4.4 12.5 VIU 9.07% 42.6 Satellite serving Americas, Africa, and Europe
Total 87.6
For Ciel-2, the impairment was caused by an extension of the contract with Ciel-2’s lone customer agreed in November 2018. For
ASTRA 5B and YahSat 1A, the impairment was caused by a reassessment of the future revenues to be achieved in the markets
served by those satellites. For NSS-10, the impairment was caused by a reassessment of the future revenues to be achieved on the
satellite as it approaches its end of life.
In addition, an impairment charge of EUR 5.5 million was recorded on AMC-10 due to technical deterioration of that satellite.
In 2017, the corresponding charge was EUR 40.3 million driven by a EUR 38.4 million impairment on AMC-9 resulting from a
significant anomaly on the satellite which led to its de-orbiting and brought its net book value to zero.

47 | P a g e
Procurement of SES-11
In connection with the acquisition of the SES-11 satellite, the Group entered into an agreement with an anchor customer on one of the
payloads of the satellite whereby the anchor customer entered into the construction agreement with the manufacturer to construct the
satellite. Some of the payload construction costs were treated as an advance payment for the services to be provided to that customer
over the duration of the customer agreement, with the remainder to be paid by the Group to the anchor customer in cash. As at
31 December 2018, the balance of EUR 101.4 million (2017: EUR 105.5 million) was included in the Group’s deferred revenue.
As a result of this arrangement, the Group recognised EUR 106.2 million (USD 127.4 million) of deferred revenue at the satellite’s
in-service date in November 2017, and paid EUR 66.2 million (USD 79.4) million in cash to the anchor customer in January 2018. For
this reason, both of these amounts are included in the Group’s space segment as at 31 December 2017 and are excluded from
‘Payments for purchases of tangible assets’ within consolidated statement of cash flows. There were no non-cash transactions in
2018.
Note 14 - Assets in the course of construction
In millions of euros
Land and
Buildings
Space
segment
Ground
segment
Fixtures,
tools &
equipment Total
Cost and net book value as at 1 January 2018 0.2 1,388.3 81.5 10.2 1,480.2
Movements in 2018
Additions - 359.5 71.6 9.4 440.5
Transfers to assets in use (Note 13) - (955.4) (85.6) (12.5) (1,053.5)
Impact of currency translation - 38.6 1.3 0.3 40.2
Cost and net book value as at 31 December 2018 0.2 831.0 68.8 7.4 907.4
In millions of euros
Land and
Buildings
Space
segment
Ground
segment
Fixtures,
tools &
equipment Total
Cost and net book value as at 1 January 2017 2.6 1,335.0 47.1 4.9 1,389.6
Movements in 2017
Additions 0.1 415.1 66.3 14.0 495.5
Transfers to assets in use (Note 13) (2.5) (248.3)* (26.0) (8.2) (285.0)
Impact of currency translation - (113.5) (5.9) (0.5) (119.9)
Cost and net book value as at 31 December 2017 0.2 1,388.3 81.5 10.2 1,480.2
* Includes SES-15 that became operational in January 2018
Borrowing costs of EUR 42.3 million (2017: EUR 47.0 million) arising from financing specifically relating to satellite procurements were
capitalised during the year and are included in additions to ‘Space segment’ in the above table.
A weighted average capitalisation rate of 3.90% (2017: 3.97%) was used, representing the Group’s average weighted cost of
borrowing. Excluding the impact of the loan origination costs and commitment fees the average weighted interest rate was 3.62%
(2017: 3.66%).
During 2018 the Group recognised EUR 174.1 million additions in respect of the mPower arrangement described in Note 28. Due to
the nature of the arrangement, this transaction is included in the Group’s assets in the course of construction space segment and is
excluded from ‘Payments for purchases of tangible assets’ within consolidated statement of cash flows.

48 | P a g e
Note 15 - Intangible assets
In millions of euros
Orbital slot
licence rights
(indefinite-life) Goodwill
Orbital slot
licence
rights
(definite life)
Other definite
life intangibles
Internally
generated
development costs Total
Cost
As at 1 January 2018 1,972.1 2,243.9 772.4 387.8 26.5 5,402.7
Additions 0.8 - - 7.7 30.6 39.1
Transfers - - - 3.8 1.3 5.1
Transfers from assets in
course of construction
0.8 - (1.4) 32.6 (32.0) -
Impact of currency translation 84.4 103.6 (1.2) 8.7 0.2 195.7
As at 31 December 2018 2,058.1 2,347.5 769.8 440.6 26.6 5,642.6
Amortisation
As at 1 January 2018 - - (511.4) (260.4) - (771.8)
Amortisation - - (38.0) (44.1) - (82.1)
Impairment (63.3) - - - (63.3)
Transfers - - 0.4 (0.4) - -
Impact of currency translation - - - (4.9) - (4.9)
As at 31 December 2018 - (63.3) (549.0) (309.8) - (922.1)
Book value as at
31 December 2018 2,058.1 2,284.2 220.8 130.8 26.6 4,720.5
In millions of euros
Orbital slot
licence rights
(indefinite-life) Goodwill
Orbital slot
licence
rights
(definite life)
Other definite
life intangibles
Internally
generated
development costs Total
Cost
As at 1 January 2017 2,232.7 2,540.9 770.3 406.5 6.2 5,956.6
Additions 0.3 - - 10.4 25.4 36.1
Additions through business
combinations
- 5.6 - - - 5.6
Transfers (5.5) - 5.5 4.5 (4.5) -
Disposals - - - (1.7) - (1.7)
Other movements - - - (6.0) - (6.0)
Impact of currency translation (255.4) (302.6) (3.4) (25.9) (0.6) (587.9)
As at 31 December 2017 1,972.1 2,243.9 772.4 387.8 26.5 5,402.7
Amortisation
As at 1 January 2017 - - (473.4) (235.5) - (708.9)
Amortisation - - (38.7) (39.9) - (78.6)
Disposals - - - 1.7 - 1.7
Impact of currency translation - - 0.7 13.3 - 14.0
As at 31 December 2017 - - (511.4) (260.4) - (771.8)
Book value as at
31 December 2017 1,972.1 2,243.9 261.0 127.4 26.5 4,630.9

49 | P a g e
Indefinite-life intangible assets
The Group’s indefinite-life intangibles include goodwill and orbital slot licence rights.
Impairment testing procedures are performed at least once a year to assess whether the carrying values of intangible assets are still
appropriate. The annual impairment tests are performed as at 31 October each year. The recoverable amounts are determined based
on a value-in-use calculation (Note 2) using the most recent business plan information approved by the Board of Directors, which
covers a period of five years.
The calculations of value in use are most sensitive to:
1) Movements in the underlying business plan assumptions
Business plans are drawn up annually and provide an assessment of the expected developments for a five-year period beyond the
end of the year when the plan is drawn up. These business plans reflect both the most up-to-date assumptions concerning the
CGU’s markets and also developments and trends in the business of the CGU. For the provision of satellite capacity these will
particularly take into account the following factors:
- the expected developments in transponder fill rates, including the impact of the replacement capacity;
- any changes in the expected capital expenditure cycle - due to technical degradation of a satellite or through the identified need
for replacement capacities; and
- any changes in satellite procurement, launch or cost assumptions, including launch schedule.
2) Changes in discount rates
Discount rates reflect management’s estimate of the risks specific to each CGU. Management uses a pre-tax weighted average
cost of capital as discount rate for each CGU. This reflects market interest rates of twenty-year bonds in the market concerned, the
capital structure of businesses in the Group’s business sector, and other factors, as necessary, applied specifically to the
CGU concerned.
3) Perpetuity growth rates
Growth rate assumptions used to extrapolate cash flows beyond the business planning period are based on the commercial
experience relating to the CGUs concerned and the expectations for developments in the markets which they serve.
Goodwill
Management identified the following CGUs at the level of which goodwill is allocated: SES GEO operations, SES MEO operations,
MX1 and other.
The level of integration of SES GEO operations has lead management to conclude that it represents a single CGU to which the
goodwill is allocated for impairment test purposes. SES MEO operations, representing the O3b Networks business acquired in 2016, is
considered a separate CGU, as the business generates cash inflows that are currently largely independent from SES’s GEO
operations (see Note 2). Similarly, MX1 generates separate cash flows and is considered a separate CGU.
For the MEO CGU, the impairment test period was extended beyond the five-year period, to 2034, reflecting the ramp-up phase of the
business. This extension is necessary to fully capture the contracted capital expenditure and expected growth of the business in
connection with the O3b mPOWER constellation, which is expected to launch in 2021, as well as properly reflect the timing of the
replacement capital expenditure.
The pre-tax discount rates for each CGU are presented below:
2018 2017
SES GEO operations 8.40% 8.10%
SES MEO operations 10.21% 10.37%
MX1 8.66% 7.93%

50 | P a g e
These rates were selected to reflect market interest rates and commercial spreads; the capital structure of businesses in the Group’s
business sector; and the specific risk profile of the businesses concerned. The terminal growth rate used in the valuations is 2%
(2017: 2%), which reflects the most recent long-term planning assumptions approved by the Board of Directors and can be supported
by reference to the trading performance of the companies concerned over a longer period.
As a result of the impairment tests conducted as of 31 December 2018, the Group recorded an impairment charge of EUR 63.3 million
relating to the MX1 CGU. The MX1 CGU represents SES’s media services business, comprised of the legacy SES Platform Services
business in Germany and the legacy RR Media business in Israel, which were brought together following the acquisition of RR Media
in 2016. The impairment reflects business developments over the past year, most notably increased competition for MX1’s services
and the profitability of those services. The recoverable amount, representing the value in use, is EUR 292.4 million, reflecting the
pre-tax discount rate of 8.66%. The previous estimate of value in use was EUR 709.8 million.
There were no impairment charges on goodwill recorded for the year ending 31 December 2017.
The goodwill has a net book value as at 31 December 2018 and 2017 by CGU as presented below:
In millions of euros 2018 2017
SES GEO operations 2,016.4 1,926.9
SES MEO operations 150.1 142.6
MX1 111.8 169.2
Other (SES GS) 5.9 5.2
Total 2,284.2 2,243.9
As part of standard impairment testing procedures, the Group assesses the impact of changes in the discount rates and growth
assumptions of the valuation surplus, or deficit as the case may be. Both discount rates and terminal values are simulated up to 1%
below and above the CGU’s specific rate used in the base valuation. In this way a matrix of valuations is generated which reveals the
potential exposure to impairment charges for each CGU based on movements in the valuation parameters which are within the range
of outcomes foreseeable at the valuation date.
The most recent testing showed that the SES MEO and MX1 CGUs would have an impairment in the least favourable case - a
combination of lower terminal growth rates and higher discount rates. In this least favourable case, the SES MEO CGU would have an
impairment of EUR 192.6 million and the MX1 CGU would have an additional impairment of EUR 67.5 million. There would be no
impairment in the SES GEO CGU. Unfavourable changes in the factors listed above under ‘Movements in the underlying business
plan assumptions’, in combination with unfavourable changes in discount rates and perpetuity growth rates, would increase these
impairments.
Taken separately from changes in discount and perpetuity growth rates, a 5% reduction in EBITDA would not lead to an impairment
charge in the SES GEO or SES MEO CGUs. A 5% reduction in EBITDA would increase the impairment charge in the MX1 CGU by
EUR 27.1 million.
Taken separately from changes in discount rates, perpetuity growth rates and EBITDA, for SES MEO, a delay in the launch of the
mPOWER constellation by one year would not lead to an impairment charge.
Orbital slot licence rights
The rights conveyed by orbital slot licences in different jurisdictions can have varying characteristics that make them separate and
distinct from the orbital slot licence rights in other jurisdictions. For this reason, the Group aggregates the GEO orbital slot licence
rights in Europe, the U.S., Canada, and Mexico into separate CGUs. All other GEO orbital slot licence rights are not separable and do
not generate separate cash flows, and thus are considered a single CGU, “International”. The MEO orbital rights are not separable and
do not generate separate cash flows, and thus are considered a single CGU, which is tested for impairment together with the related
corresponding goodwill and the MEO satellites constellation.
The pre-tax discount rates for each CGU are presented below:
2018 2017
SES MEO operations 10.21% 10.37%
Europe 9.40% 9.10%
U.S., Canada, Mexico, and International 11.10% 10.22%

51 | P a g e
Similar to the pre-tax discount rates used for goodwill testing, these rates were selected to reflect market interest rates and commercial
spreads; the capital structure of businesses in the Group’s business sector; and the specific risk profile of the businesses concerned. The
terminal growth rate used in the valuations is 2% (2017: 2%), which reflects the most recent long-term planning assumptions approved by
the Board of Directors and can be supported by reference to the trading performance of the companies concerned over a longer period.
There were no impairment charges on orbital slot licence rights recorded for the year ending 31 December 2018 or 2017.
The orbital slot license rights have a net book value as at 31 December 2018 and 2017 by CGU as presented below:
In millions of euros 2018 2017
MEO operations 1,113.0 1,062.9
Europe 151.1 154.0
U.S. 315.4 301.2
Canada 6.4 5.4
Mexico 6.8 6.5
International 465.4 442.1
Total 2,058.1 1,972.1
As part of standard impairment testing procedures, as with goodwill, the Group assesses the impact of changes in the discount rates
and growth assumptions of the valuation surplus, or deficit as the case may be. Both discount rates and terminal values are simulated
up to 1% below and above the CGU’s specific rate used in the base valuation. In this way a matrix of valuations is generated which
reveals the potential exposure to impairment charges for each CGU based on movements in the valuation parameters which are within
the range of outcomes foreseeable at the valuation date.
For orbital slot licence rights, the least favourable case - a combination of lower terminal growth rates and higher discount rates - would
lead to impairment charges of EUR 69.2 million in the International CGU and EUR 5.8 million in the U.S. CGU.
Definite life intangible assets
The definite-life intangible assets as at 31 December 2018 have a net book value by CGU as presented below:
In millions of euros 2018
Orbital slot licence rights Other
Luxembourg 204.1 44.6
Israel - 53.8
Brazil 11.5 1.1
Other 5.2 31.3
Total 220.8 130.8
The definite-life intangible assets as at 31 December 2017 have a net book value by CGU presented below:
In millions of euros 2017
Orbital slot licence rights Other
Luxembourg 241.3 34.1
Israel - 61.2
Brazil 13.3 1.3
Other 6.4 30.8
Total 261.0 127.4
The Group’s primary definite life intangible asset is the agreement concluded by SES ASTRA with the Luxembourg government in
relation to the usage of Luxembourg frequencies in the orbital positions of the geostationary arc from 45˚ west to 50˚ east for the period
from 1 January 2001 to 31 December 2021. Given the finite nature of this agreement, these usage rights - valued at EUR 550.0 million
at the date of acquisition - are being amortised on a straight-line basis over the 21-year term of the agreement.
The Group also holds orbital slot licence rights in Brazil, which were awarded to a Group subsidiary at auction in 2014 for a 15-year
term. These rights are being amortised over a 30-year period, reflecting the Group’s ability to renew the rights once in 2029 at a
minimal cost, assuming they are being utilised.
As at 31 December 2018, the amount of the intangible assets pledged in relation to the Group’s liabilities is nil (2017: nil).

52 | P a g e
Note 16 - Assets and liabilities related to contracts with customers
The Group has recognised the following assets and liabilities related to contracts with customers:
In millions of euros 2018 2017
Current contract assets
Trade debtors 509.5 494.6
Provision for trade debtors (66.4) (49.8)
Trade debtors, net of provisions 443.1 444.8
Unbilled accrued revenue 111.9 116.6
Provision for unbilled accrued revenue (13.6) (4.0)
Unbilled accrued revenue, net of provisions 98.3 112.6
Deferred customer contract costs 17.5 10.4
558.9 567.8
Non-current contract assets
Unbilled accrued revenue 306.2 335.8
Provision for unbilled accrued revenue (11.7) (18.0)
Unbilled accrued revenue, net of provisions 294.5 317.8
Deferred customer contract costs 10.3 15.2
304.8 333.0
Current contract liabilities
Deferred income 476.1 443.2
Non-current contract liabilities
Deferred income 370.3 477.3
The following table shows the movement in deferred income recognised by the Group:
In millions of euros Non-current Current
As at 1 January 2018 477.3 443.2
Adoption of IFRS 15 (Note 3) - 14.0
Revenue recognised during the year - (1,377.3)
New billings - 1,285.8
Other movements* (113.7) 101.1
Impact of currency translation 6.7 9.3
As at 31 December 2018 370.3 476.1
* Other movements include reclassifications (between current and non-current, upfront and deferred, as well as against receivable)
In millions of euros Non-current Current
As at 1 January 2017 411.8 510.5
Movement on deferred revenue 79.6 (41.3)
Impact of currency translation (14.1) (26.0)
As at 31 December 2017 477.3 443.2
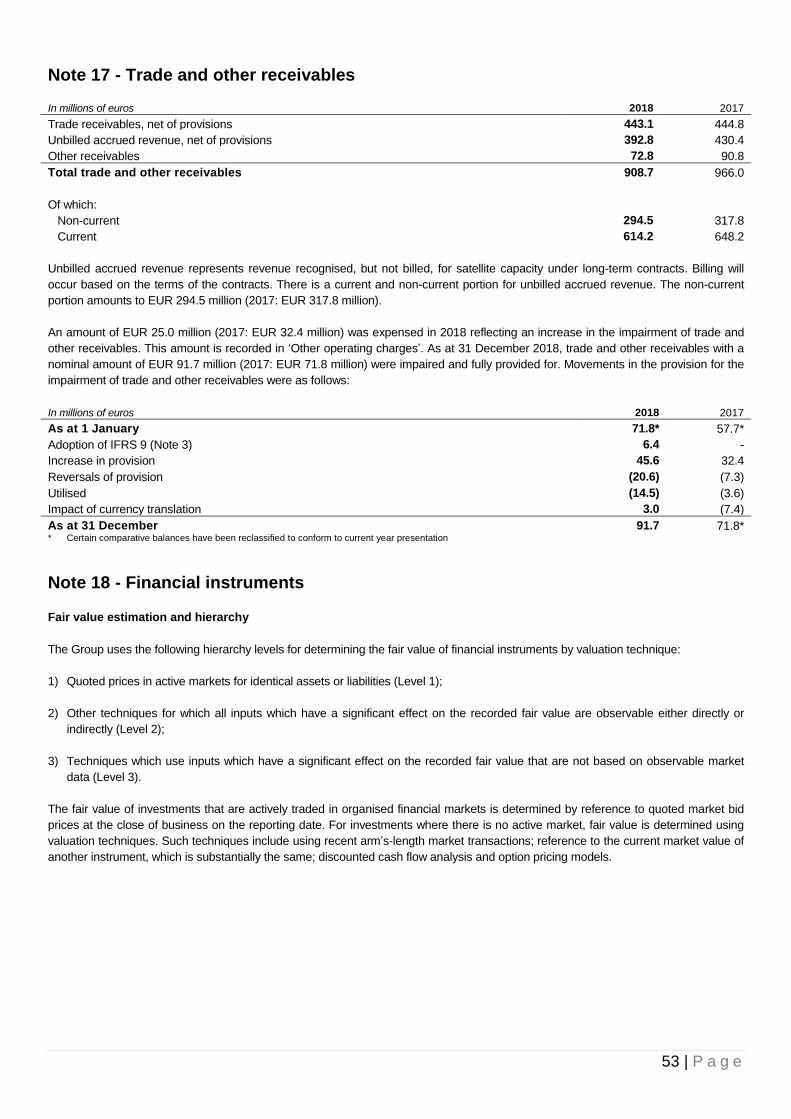
53 | P a g e
Note 17 - Trade and other receivables
In millions of euros 2018 2017
Trade receivables, net of provisions 443.1 444.8
Unbilled accrued revenue, net of provisions 392.8 430.4
Other receivables 72.8 90.8
Total trade and other receivables 908.7 966.0
Of which:
Non-current 294.5 317.8
Current 614.2 648.2
Unbilled accrued revenue represents revenue recognised, but not billed, for satellite capacity under long-term contracts. Billing will
occur based on the terms of the contracts. There is a current and non-current portion for unbilled accrued revenue. The non-current
portion amounts to EUR 294.5 million (2017: EUR 317.8 million).
An amount of EUR 25.0 million (2017: EUR 32.4 million) was expensed in 2018 reflecting an increase in the impairment of trade and
other receivables. This amount is recorded in ‘Other operating charges’. As at 31 December 2018, trade and other receivables with a
nominal amount of EUR 91.7 million (2017: EUR 71.8 million) were impaired and fully provided for. Movements in the provision for the
impairment of trade and other receivables were as follows:
In millions of euros 2018 2017
As at 1 January 71.8* 57.7*
Adoption of IFRS 9 (Note 3) 6.4 -
Increase in provision 45.6 32.4
Reversals of provision (20.6) (7.3)
Utilised (14.5) (3.6)
Impact of currency translation 3.0 (7.4)
As at 31 December 91.7 71.8* * Certain comparative balances have been reclassified to conform to current year presentation
Note 18 - Financial instruments
Fair value estimation and hierarchy
The Group uses the following hierarchy levels for determining the fair value of financial instruments by valuation technique:
1) Quoted prices in active markets for identical assets or liabilities (Level 1);
2) Other techniques for which all inputs which have a significant effect on the recorded fair value are observable either directly or
indirectly (Level 2);
3) Techniques which use inputs which have a significant effect on the recorded fair value that are not based on observable market
data (Level 3).
The fair value of investments that are actively traded in organised financial markets is determined by reference to quoted market bid
prices at the close of business on the reporting date. For investments where there is no active market, fair value is determined using
valuation techniques. Such techniques include using recent arm’s-length market transactions; reference to the current market value of
another instrument, which is substantially the same; discounted cash flow analysis and option pricing models.
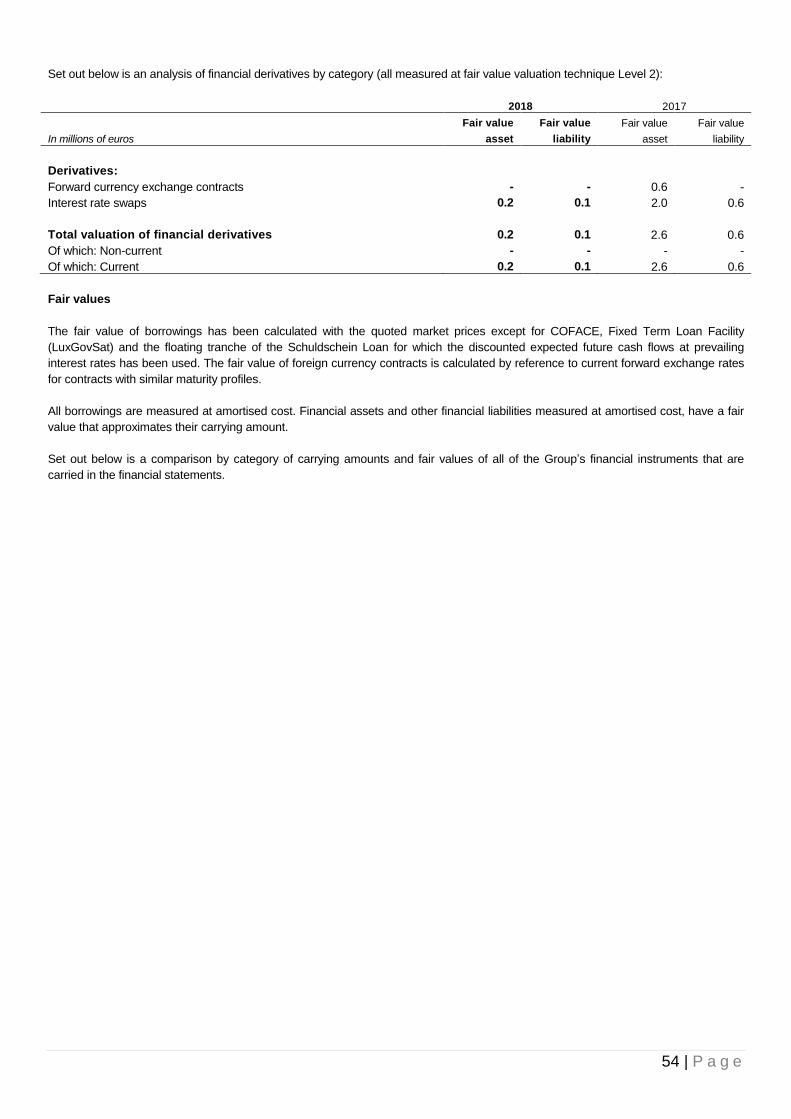
54 | P a g e
Set out below is an analysis of financial derivatives by category (all measured at fair value valuation technique Level 2):
2018 2017
In millions of euros
Fair value
asset
Fair value
liability
Fair value
asset
Fair value
liability
Derivatives:
Forward currency exchange contracts - - 0.6 -
Interest rate swaps 0.2 0.1 2.0 0.6
Total valuation of financial derivatives 0.2 0.1 2.6 0.6
Of which: Non-current - - - -
Of which: Current 0.2 0.1 2.6 0.6
Fair values
The fair value of borrowings has been calculated with the quoted market prices except for COFACE, Fixed Term Loan Facility
(LuxGovSat) and the floating tranche of the Schuldschein Loan for which the discounted expected future cash flows at prevailing
interest rates has been used. The fair value of foreign currency contracts is calculated by reference to current forward exchange rates
for contracts with similar maturity profiles.
All borrowings are measured at amortised cost. Financial assets and other financial liabilities measured at amortised cost, have a fair
value that approximates their carrying amount.
Set out below is a comparison by category of carrying amounts and fair values of all of the Group’s financial instruments that are
carried in the financial statements.
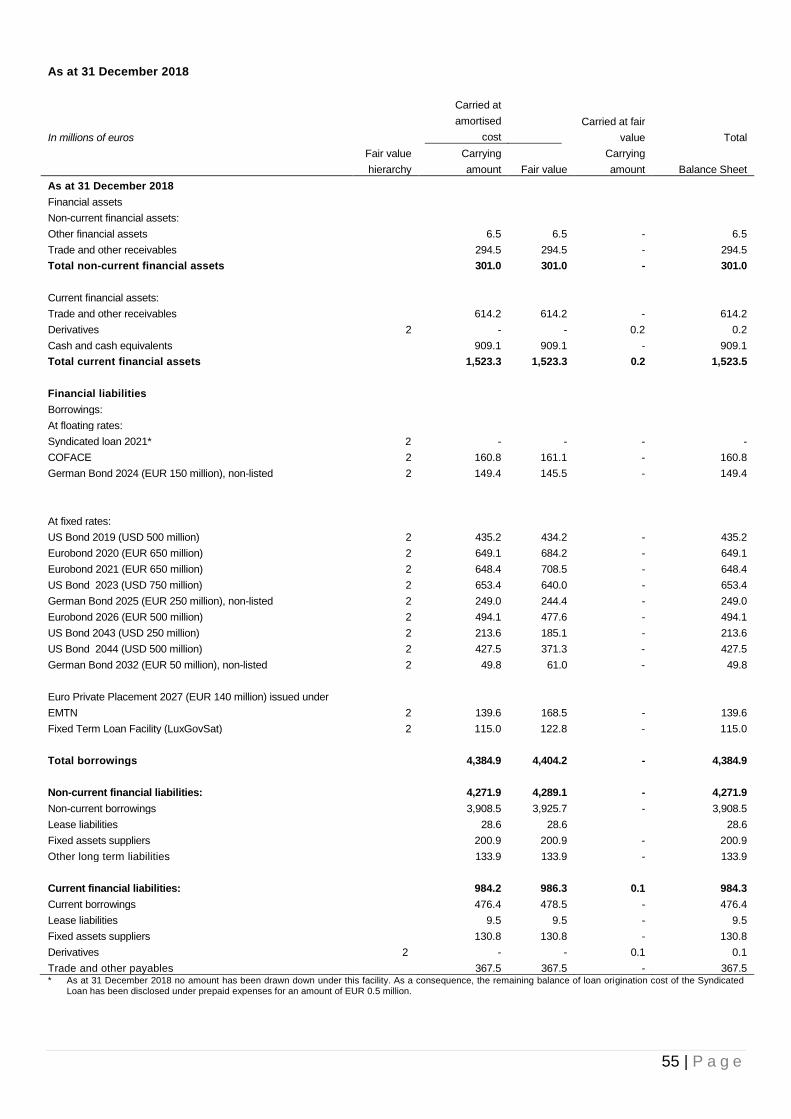
55 | P a g e
As at 31 December 2018
In millions of euros
Carried at
amortised
cost
Carried at fair
value Total
Fair value
hierarchy
Carrying
amount Fair value
Carrying
amount Balance Sheet
As at 31 December 2018
Financial assets
Non-current financial assets:
Other financial assets 6.5 6.5 - 6.5
Trade and other receivables 294.5 294.5 - 294.5
Total non-current financial assets 301.0 301.0 - 301.0
Current financial assets:
Trade and other receivables 614.2 614.2 - 614.2
Derivatives 2 - - 0.2 0.2
Cash and cash equivalents 909.1 909.1 - 909.1
Total current financial assets 1,523.3 1,523.3 0.2 1,523.5
Financial liabilities
Borrowings:
At floating rates:
Syndicated loan 2021* 2 - - - -
COFACE 2 160.8 161.1 - 160.8
German Bond 2024 (EUR 150 million), non-listed 2 149.4 145.5 - 149.4
At fixed rates:
US Bond 2019 (USD 500 million) 2 435.2 434.2 - 435.2
Eurobond 2020 (EUR 650 million) 2 649.1 684.2 - 649.1
Eurobond 2021 (EUR 650 million) 2 648.4 708.5 - 648.4
US Bond 2023 (USD 750 million) 2 653.4 640.0 - 653.4
German Bond 2025 (EUR 250 million), non-listed 2 249.0 244.4 - 249.0
Eurobond 2026 (EUR 500 million) 2 494.1 477.6 - 494.1
US Bond 2043 (USD 250 million) 2 213.6 185.1 - 213.6
US Bond 2044 (USD 500 million) 2 427.5 371.3 - 427.5
German Bond 2032 (EUR 50 million), non-listed 2 49.8 61.0 - 49.8
Euro Private Placement 2027 (EUR 140 million) issued under
EMTN
2 139.6 168.5 - 139.6
Fixed Term Loan Facility (LuxGovSat) 2 115.0 122.8 - 115.0
Total borrowings 4,384.9 4,404.2 - 4,384.9
Non-current financial liabilities: 4,271.9 4,289.1 - 4,271.9
Non-current borrowings 3,908.5 3,925.7 - 3,908.5
Lease liabilities 28.6 28.6 28.6
Fixed assets suppliers 200.9 200.9 - 200.9
Other long term liabilities 133.9 133.9 - 133.9
Current financial liabilities: 984.2 986.3 0.1 984.3
Current borrowings 476.4 478.5 - 476.4
Lease liabilities 9.5 9.5 - 9.5
Fixed assets suppliers 130.8 130.8 - 130.8
Derivatives 2 - - 0.1 0.1
Trade and other payables 367.5 367.5 - 367.5 * As at 31 December 2018 no amount has been drawn down under this facility. As a consequence, the remaining balance of loan origination cost of the Syndicated
Loan has been disclosed under prepaid expenses for an amount of EUR 0.5 million.
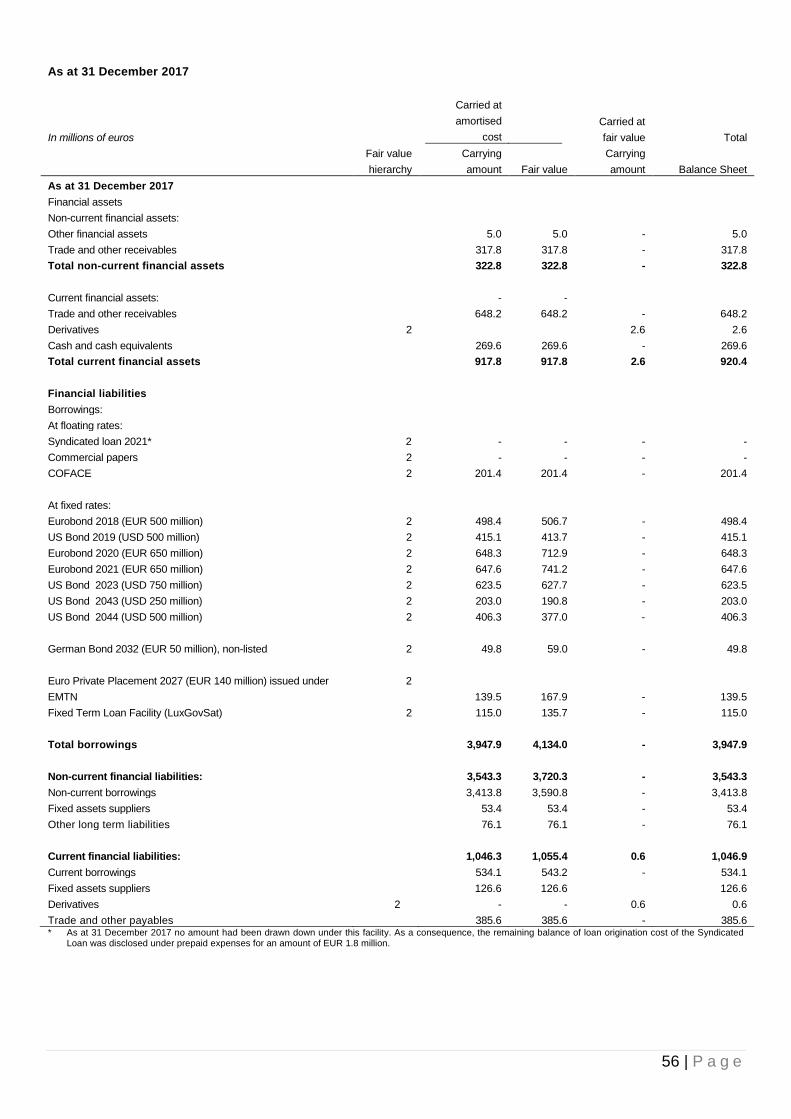
56 | P a g e
As at 31 December 2017
In millions of euros
Carried at
amortised
cost
Carried at
fair value Total
Fair value
hierarchy
Carrying
amount Fair value
Carrying
amount Balance Sheet
As at 31 December 2017
Financial assets
Non-current financial assets:
Other financial assets 5.0 5.0 - 5.0
Trade and other receivables 317.8 317.8 - 317.8
Total non-current financial assets 322.8 322.8 - 322.8
Current financial assets: - -
Trade and other receivables 648.2 648.2 - 648.2
Derivatives 2 2.6 2.6
Cash and cash equivalents 269.6 269.6 - 269.6
Total current financial assets 917.8 917.8 2.6 920.4
Financial liabilities
Borrowings:
At floating rates:
Syndicated loan 2021* 2 - - - -
Commercial papers 2 - - - -
COFACE 2 201.4 201.4 - 201.4
At fixed rates:
Eurobond 2018 (EUR 500 million) 2 498.4 506.7 - 498.4
US Bond 2019 (USD 500 million) 2 415.1 413.7 - 415.1
Eurobond 2020 (EUR 650 million) 2 648.3 712.9 - 648.3
Eurobond 2021 (EUR 650 million) 2 647.6 741.2 - 647.6
US Bond 2023 (USD 750 million) 2 623.5 627.7 - 623.5
US Bond 2043 (USD 250 million) 2 203.0 190.8 - 203.0
US Bond 2044 (USD 500 million) 2 406.3 377.0 - 406.3
German Bond 2032 (EUR 50 million), non-listed 2 49.8 59.0 - 49.8
Euro Private Placement 2027 (EUR 140 million) issued under
EMTN
2
139.5 167.9 - 139.5
Fixed Term Loan Facility (LuxGovSat) 2 115.0 135.7 - 115.0
Total borrowings 3,947.9 4,134.0 - 3,947.9
Non-current financial liabilities: 3,543.3 3,720.3 - 3,543.3
Non-current borrowings 3,413.8 3,590.8 - 3,413.8
Fixed assets suppliers 53.4 53.4 - 53.4
Other long term liabilities 76.1 76.1 - 76.1
Current financial liabilities: 1,046.3 1,055.4 0.6 1,046.9
Current borrowings 534.1 543.2 - 534.1
Fixed assets suppliers 126.6 126.6 126.6
Derivatives 2 - - 0.6 0.6
Trade and other payables 385.6 385.6 - 385.6 * As at 31 December 2017 no amount had been drawn down under this facility. As a consequence, the remaining balance of loan origination cost of the Syndicated
Loan was disclosed under prepaid expenses for an amount of EUR 1.8 million.

57 | P a g e
Note 19 - Financial risk management objectives and policies
The Group’s financial instruments, other than derivatives, comprise: a syndicated loan, Eurobonds, US dollar bonds (144A), a
euro-dominated Private Placement, German Bonds (‘Schuldschein’), drawings under Coface and under a committed credit facility for
specified satellites under construction, cash and short-term deposits. The main purpose of the debt instruments is to raise funds to
finance the Group’s day-to-day operations, as well as for other general business purposes. The Group has various other financial
assets and liabilities such as trade receivables and trade payables, which arise directly from its operations.
The Group also enters into derivative transactions, principally forward currency contracts, in order to manage exchange rate exposure
on the Group’s assets, liabilities and financial operations.
The main risks arising from the Group’s financial instruments are liquidity risks, foreign currency risks, interest rate risks and credit
risks. The general policies are periodically reviewed and approved by the board.
The Group’s accounting policies in relation to derivatives and other financial instruments are set out in Note 2.
Liquidity risk
The Group’s objective is to efficiently use cash generated so as to maintain borrowings at a low level. In case of liquidity needs, the
Group can call on uncommitted loans, commercial paper programs and a committed syndicated loan. In addition, if deemed
appropriate based on prevailing market conditions, the Group can access additional funds through the European Medium-Term Note
programme. The Group’s debt maturity profile is tailored to allow the Company and its subsidiaries to cover repayment obligations as
they fall due.
The Group operates a centralised treasury function which manages, among others, the liquidity of the Group in order to optimise the
funding costs. This is supported by a daily cash pooling mechanism.
Liquidity is monitored on a daily basis through a review of cash balances, the drawn and issued amounts and the availability of
additional funding under committed credit lines, the two commercial paper programmes and the EMTN Programme
(EUR 4,760.0 million as at 31 December 2018 and EUR 4,770.0 million as at 31 December 2017 - more details in Note 24).
The table below summarises the projected contractual undiscounted cash flows (nominal amount plus interest charges) based on the
maturity profile of the Group’s interest-bearing borrowings as at 31 December 2018 and 2017.
In millions of euros Within Between After
Total 1 year 1 and 5 years 5 years
As at 31 December 2018:
Borrowings 477.9 2,126.4 1,810.7 4,415.0
Future interest commitments 151.8 413.0 778.8 1,343.6
Trade and other payables 367.5 - - 367.5
Other long-term liabilities - 133.9 - 133.9
Lease liabilities 10.2 25.7 5.4 41.3
Fixed assets suppliers 130.8 200.9 - 331.7
Total maturity profile 1,138.2 2,899.9 2,594.9 6,633.0
As at 31 December 2017:
Borrowings 541.2 1,913.1 1,522.9 3,977.2
Future interest commitments 151.3 439.4 450.1 1,040.8
Trade and other payables 385.6 - - 385.6
Other long-term liabilities - 76.1 - 76.1
Fixed assets suppliers 126.6 53.4 - 180.0
Total maturity profile 1,204.7 2,482.0 1,973.0 5,659.7
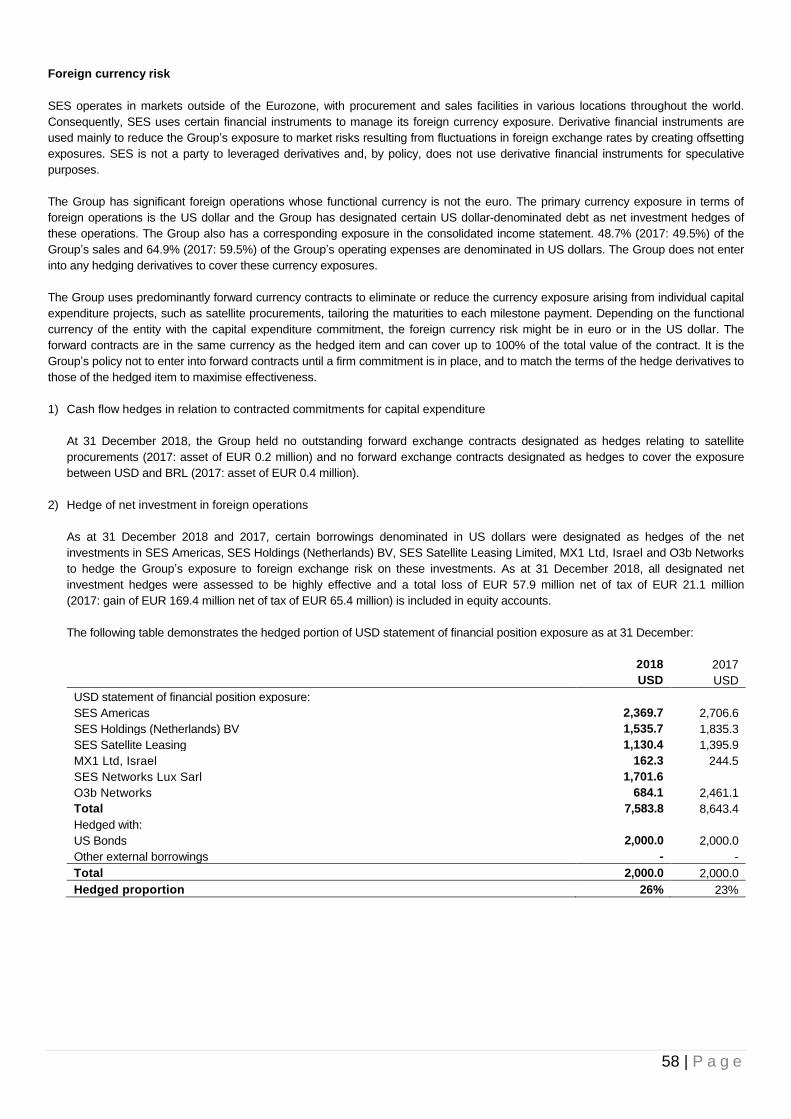
58 | P a g e
Foreign currency risk
SES operates in markets outside of the Eurozone, with procurement and sales facilities in various locations throughout the world.
Consequently, SES uses certain financial instruments to manage its foreign currency exposure. Derivative financial instruments are
used mainly to reduce the Group’s exposure to market risks resulting from fluctuations in foreign exchange rates by creating offsetting
exposures. SES is not a party to leveraged derivatives and, by policy, does not use derivative financial instruments for speculative
purposes.
The Group has significant foreign operations whose functional currency is not the euro. The primary currency exposure in terms of
foreign operations is the US dollar and the Group has designated certain US dollar-denominated debt as net investment hedges of
these operations. The Group also has a corresponding exposure in the consolidated income statement. 48.7% (2017: 49.5%) of the
Group’s sales and 64.9% (2017: 59.5%) of the Group’s operating expenses are denominated in US dollars. The Group does not enter
into any hedging derivatives to cover these currency exposures.
The Group uses predominantly forward currency contracts to eliminate or reduce the currency exposure arising from individual capital
expenditure projects, such as satellite procurements, tailoring the maturities to each milestone payment. Depending on the functional
currency of the entity with the capital expenditure commitment, the foreign currency risk might be in euro or in the US dollar. The
forward contracts are in the same currency as the hedged item and can cover up to 100% of the total value of the contract. It is the
Group’s policy not to enter into forward contracts until a firm commitment is in place, and to match the terms of the hedge derivatives to
those of the hedged item to maximise effectiveness.
1) Cash flow hedges in relation to contracted commitments for capital expenditure
At 31 December 2018, the Group held no outstanding forward exchange contracts designated as hedges relating to satellite
procurements (2017: asset of EUR 0.2 million) and no forward exchange contracts designated as hedges to cover the exposure
between USD and BRL (2017: asset of EUR 0.4 million).
2) Hedge of net investment in foreign operations
As at 31 December 2018 and 2017, certain borrowings denominated in US dollars were designated as hedges of the net
investments in SES Americas, SES Holdings (Netherlands) BV, SES Satellite Leasing Limited, MX1 Ltd, Israel and O3b Networks
to hedge the Group’s exposure to foreign exchange risk on these investments. As at 31 December 2018, all designated net
investment hedges were assessed to be highly effective and a total loss of EUR 57.9 million net of tax of EUR 21.1 million
(2017: gain of EUR 169.4 million net of tax of EUR 65.4 million) is included in equity accounts.
The following table demonstrates the hedged portion of USD statement of financial position exposure as at 31 December:
2018
USD
2017
USD
USD statement of financial position exposure:
SES Americas 2,369.7 2,706.6
SES Holdings (Netherlands) BV 1,535.7 1,835.3
SES Satellite Leasing 1,130.4 1,395.9
MX1 Ltd, Israel 162.3 244.5
SES Networks Lux Sarl 1,701.6
O3b Networks 684.1 2,461.1
Total 7,583.8 8,643.4
Hedged with:
US Bonds 2,000.0 2,000.0
Other external borrowings - -
Total 2,000.0 2,000.0
Hedged proportion 26% 23%
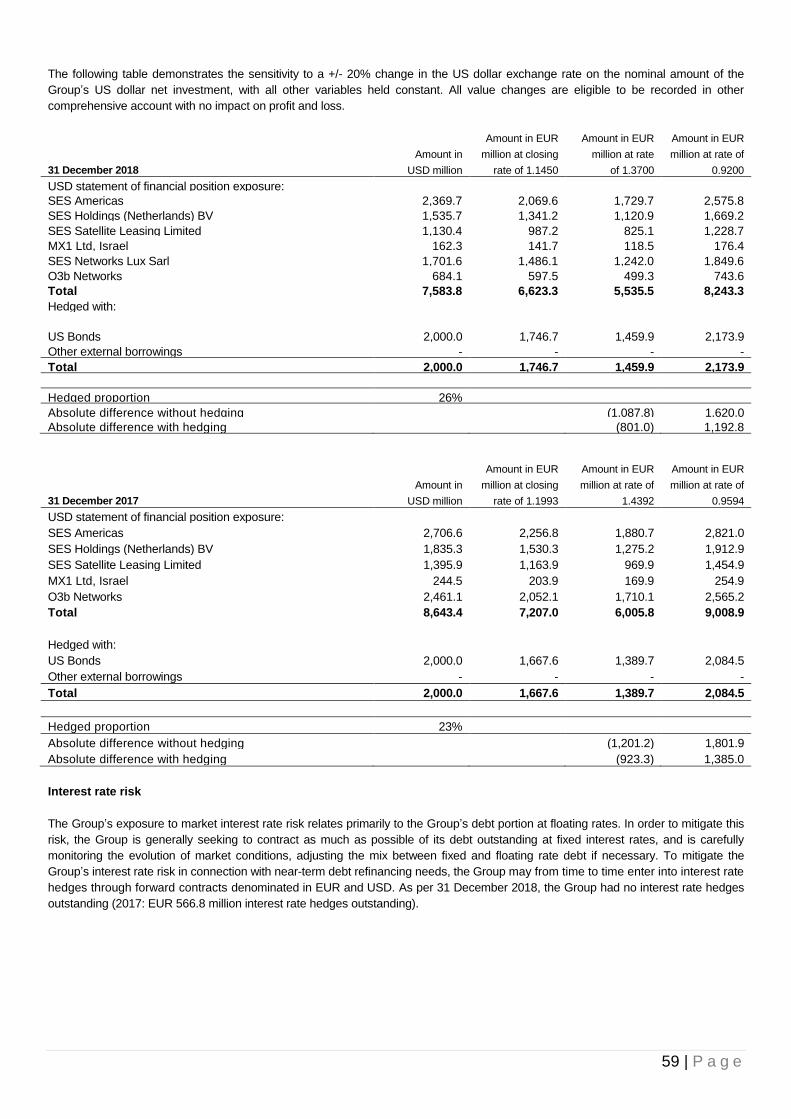
59 | P a g e
The following table demonstrates the sensitivity to a +/- 20% change in the US dollar exchange rate on the nominal amount of the
Group’s US dollar net investment, with all other variables held constant. All value changes are eligible to be recorded in other
comprehensive account with no impact on profit and loss.
31 December 2018
Amount in
USD million
Amount in EUR
million at closing
rate of 1.1450
Amount in EUR
million at rate
of 1.3700
Amount in EUR
million at rate of
0.9200
USD statement of financial position exposure:
SES Americas 2,369.7 2,069.6 1,729.7 2,575.8
SES Holdings (Netherlands) BV 1,535.7 1,341.2 1,120.9 1,669.2
SES Satellite Leasing Limited 1,130.4 987.2 825.1 1,228.7
MX1 Ltd, Israel 162.3 141.7 118.5 176.4
SES Networks Lux Sarl 1,701.6 1,486.1 1,242.0 1,849.6
O3b Networks 684.1 597.5 499.3 743.6
Total 7,583.8 6,623.3 5,535.5 8,243.3
Hedged with:
US Bonds 2,000.0 1,746.7 1,459.9 2,173.9
Other external borrowings - - - -
Total 2,000.0 1,746.7 1,459.9 2,173.9
Hedged proportion 26%
Absolute difference without hedging (1,087.8) 1,620.0
Absolute difference with hedging (801.0) 1,192.8
31 December 2017
Amount in
USD million
Amount in EUR
million at closing
rate of 1.1993
Amount in EUR
million at rate of
1.4392
Amount in EUR
million at rate of
0.9594
USD statement of financial position exposure:
SES Americas 2,706.6 2,256.8 1,880.7 2,821.0
SES Holdings (Netherlands) BV 1,835.3 1,530.3 1,275.2 1,912.9
SES Satellite Leasing Limited 1,395.9 1,163.9 969.9 1,454.9
MX1 Ltd, Israel 244.5 203.9 169.9 254.9
O3b Networks 2,461.1 2,052.1 1,710.1 2,565.2
Total 8,643.4 7,207.0 6,005.8 9,008.9
Hedged with:
US Bonds 2,000.0 1,667.6 1,389.7 2,084.5
Other external borrowings - - - -
Total 2,000.0 1,667.6 1,389.7 2,084.5
Hedged proportion 23%
Absolute difference without hedging (1,201.2) 1,801.9
Absolute difference with hedging (923.3) 1,385.0
Interest rate risk
The Group’s exposure to market interest rate risk relates primarily to the Group’s debt portion at floating rates. In order to mitigate this
risk, the Group is generally seeking to contract as much as possible of its debt outstanding at fixed interest rates, and is carefully
monitoring the evolution of market conditions, adjusting the mix between fixed and floating rate debt if necessary. To mitigate the
Group’s interest rate risk in connection with near-term debt refinancing needs, the Group may from time to time enter into interest rate
hedges through forward contracts denominated in EUR and USD. As per 31 December 2018, the Group had no interest rate hedges
outstanding (2017: EUR 566.8 million interest rate hedges outstanding).
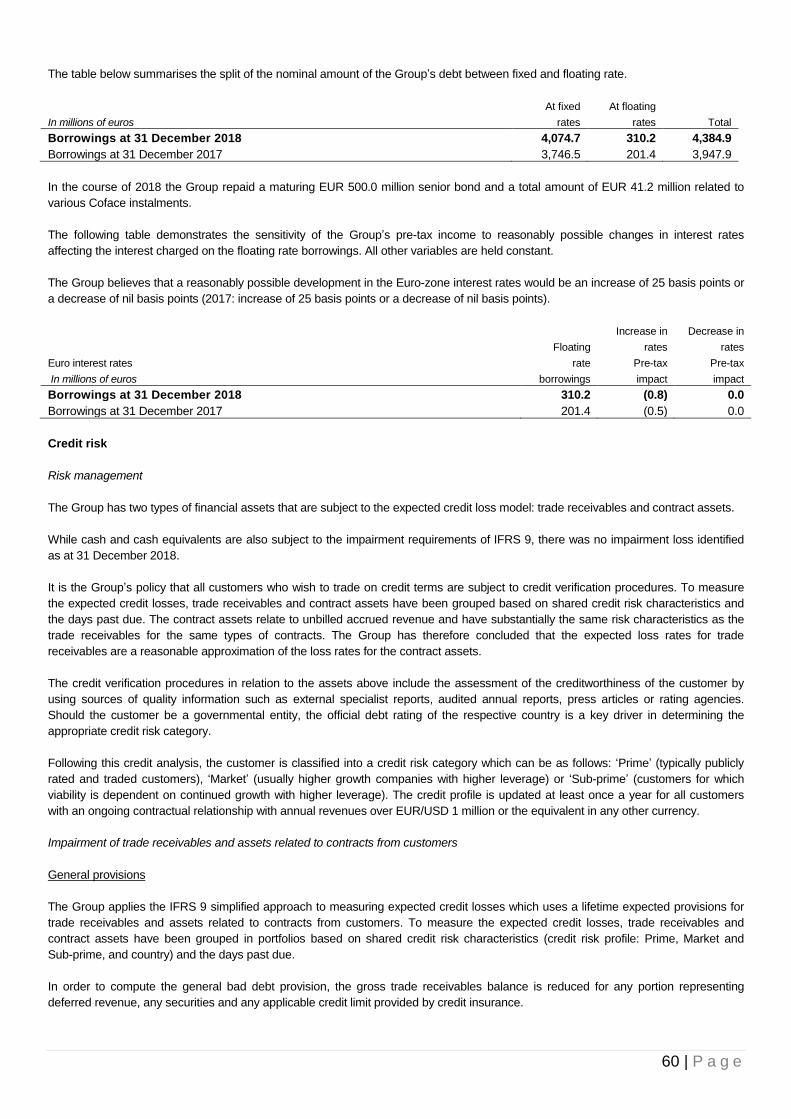
60 | P a g e
The table below summarises the split of the nominal amount of the Group’s debt between fixed and floating rate.
In millions of euros
At fixed
rates
At floating
rates Total
Borrowings at 31 December 2018 4,074.7 310.2 4,384.9
Borrowings at 31 December 2017 3,746.5 201.4 3,947.9
In the course of 2018 the Group repaid a maturing EUR 500.0 million senior bond and a total amount of EUR 41.2 million related to
various Coface instalments.
The following table demonstrates the sensitivity of the Group’s pre-tax income to reasonably possible changes in interest rates
affecting the interest charged on the floating rate borrowings. All other variables are held constant.
The Group believes that a reasonably possible development in the Euro-zone interest rates would be an increase of 25 basis points or
a decrease of nil basis points (2017: increase of 25 basis points or a decrease of nil basis points).
Euro interest rates
In millions of euros
Floating
rate
borrowings
Increase in
rates
Pre-tax
impact
Decrease in
rates
Pre-tax
impact
Borrowings at 31 December 2018 310.2 (0.8) 0.0
Borrowings at 31 December 2017 201.4 (0.5) 0.0
Credit risk
Risk management
The Group has two types of financial assets that are subject to the expected credit loss model: trade receivables and contract assets.
While cash and cash equivalents are also subject to the impairment requirements of IFRS 9, there was no impairment loss identified
as at 31 December 2018.
It is the Group’s policy that all customers who wish to trade on credit terms are subject to credit verification procedures. To measure
the expected credit losses, trade receivables and contract assets have been grouped based on shared credit risk characteristics and
the days past due. The contract assets relate to unbilled accrued revenue and have substantially the same risk characteristics as the
trade receivables for the same types of contracts. The Group has therefore concluded that the expected loss rates for trade
receivables are a reasonable approximation of the loss rates for the contract assets.
The credit verification procedures in relation to the assets above include the assessment of the creditworthiness of the customer by
using sources of quality information such as external specialist reports, audited annual reports, press articles or rating agencies.
Should the customer be a governmental entity, the official debt rating of the respective country is a key driver in determining the
appropriate credit risk category.
Following this credit analysis, the customer is classified into a credit risk category which can be as follows: ‘Prime’ (typically publicly
rated and traded customers), ‘Market’ (usually higher growth companies with higher leverage) or ‘Sub-prime’ (customers for which
viability is dependent on continued growth with higher leverage). The credit profile is updated at least once a year for all customers
with an ongoing contractual relationship with annual revenues over EUR/USD 1 million or the equivalent in any other currency.
Impairment of trade receivables and assets related to contracts from customers
General provisions
The Group applies the IFRS 9 simplified approach to measuring expected credit losses which uses a lifetime expected provisions for
trade receivables and assets related to contracts from customers. To measure the expected credit losses, trade receivables and
contract assets have been grouped in portfolios based on shared credit risk characteristics (credit risk profile: Prime, Market and
Sub-prime, and country) and the days past due.
In order to compute the general bad debt provision, the gross trade receivables balance is reduced for any portion representing
deferred revenue, any securities and any applicable credit limit provided by credit insurance.
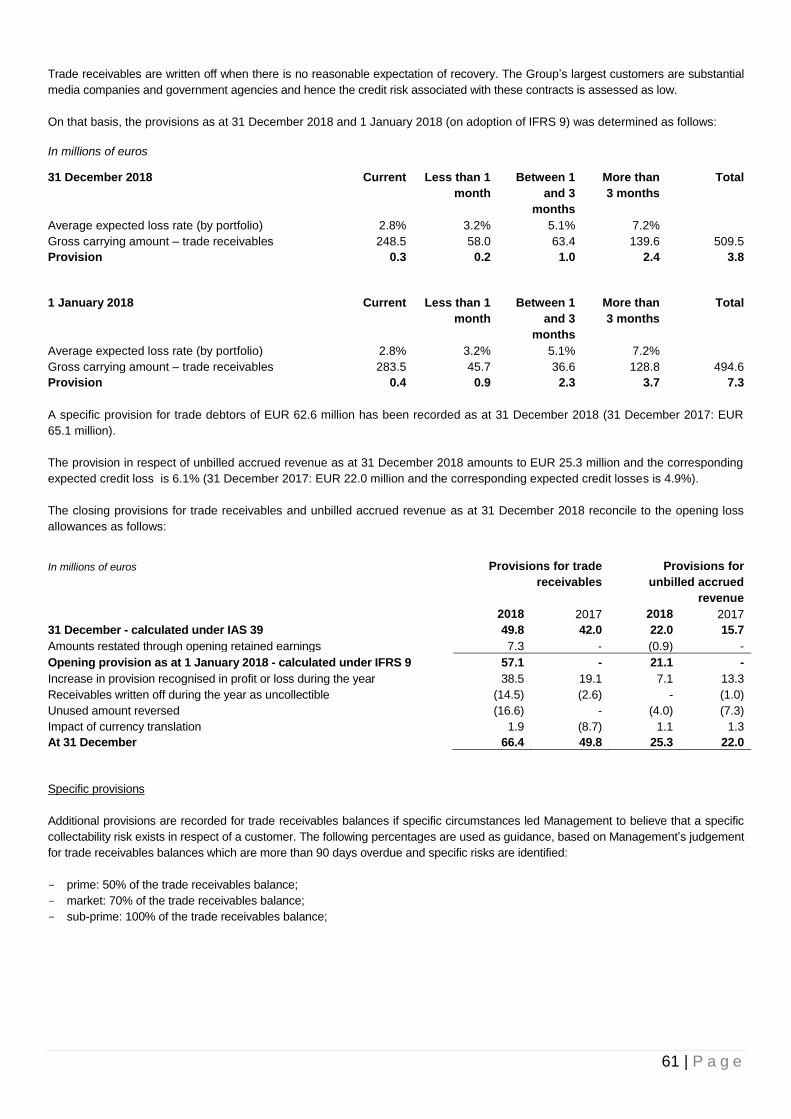
61 | P a g e
Trade receivables are written off when there is no reasonable expectation of recovery. The Group’s largest customers are substantial
media companies and government agencies and hence the credit risk associated with these contracts is assessed as low.
On that basis, the provisions as at 31 December 2018 and 1 January 2018 (on adoption of IFRS 9) was determined as follows:
In millions of euros
31 December 2018 Current Less than 1
month
Between 1
and 3
months
More than
3 months
Total
Average expected loss rate (by portfolio) 2.8% 3.2% 5.1% 7.2%
Gross carrying amount – trade receivables 248.5 58.0 63.4 139.6 509.5
Provision 0.3 0.2 1.0 2.4 3.8
1 January 2018 Current Less than 1
month
Between 1
and 3
months
More than
3 months
Total
Average expected loss rate (by portfolio) 2.8% 3.2% 5.1% 7.2%
Gross carrying amount – trade receivables 283.5 45.7 36.6 128.8 494.6
Provision 0.4 0.9 2.3 3.7 7.3
A specific provision for trade debtors of EUR 62.6 million has been recorded as at 31 December 2018 (31 December 2017: EUR
65.1 million).
The provision in respect of unbilled accrued revenue as at 31 December 2018 amounts to EUR 25.3 million and the corresponding
expected credit loss is 6.1% (31 December 2017: EUR 22.0 million and the corresponding expected credit losses is 4.9%).
The closing provisions for trade receivables and unbilled accrued revenue as at 31 December 2018 reconcile to the opening loss
allowances as follows:
In millions of euros Provisions for trade
receivables
Provisions for
unbilled accrued
revenue
2018 2017 2018 2017
31 December - calculated under IAS 39 49.8 42.0 22.0 15.7
Amounts restated through opening retained earnings 7.3 - (0.9) -
Opening provision as at 1 January 2018 - calculated under IFRS 9 57.1 - 21.1 -
Increase in provision recognised in profit or loss during the year 38.5 19.1 7.1 13.3
Receivables written off during the year as uncollectible (14.5) (2.6) - (1.0)
Unused amount reversed (16.6) - (4.0) (7.3)
Impact of currency translation 1.9 (8.7) 1.1 1.3
At 31 December 66.4 49.8 25.3 22.0
Specific provisions
Additional provisions are recorded for trade receivables balances if specific circumstances led Management to believe that a specific
collectability risk exists in respect of a customer. The following percentages are used as guidance, based on Management’s judgement
for trade receivables balances which are more than 90 days overdue and specific risks are identified:
- prime: 50% of the trade receivables balance;
- market: 70% of the trade receivables balance;
- sub-prime: 100% of the trade receivables balance;
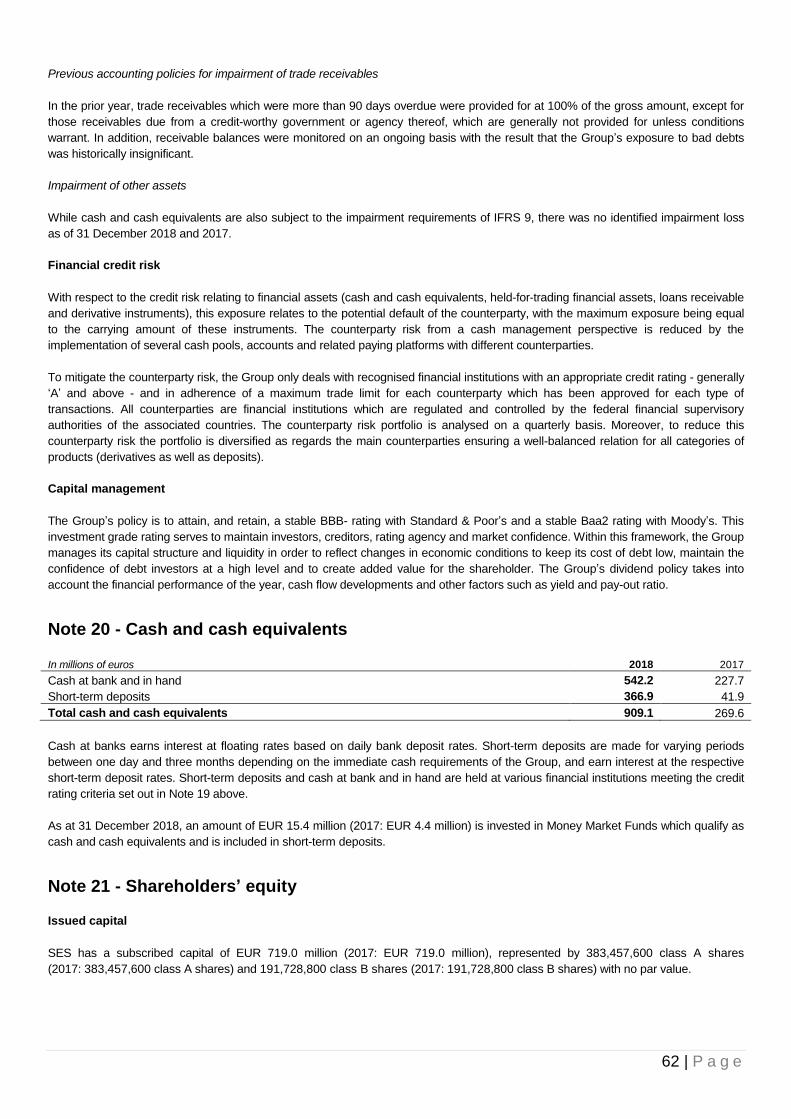
62 | P a g e
Previous accounting policies for impairment of trade receivables
In the prior year, trade receivables which were more than 90 days overdue were provided for at 100% of the gross amount, except for
those receivables due from a credit-worthy government or agency thereof, which are generally not provided for unless conditions
warrant. In addition, receivable balances were monitored on an ongoing basis with the result that the Group’s exposure to bad debts
was historically insignificant.
Impairment of other assets
While cash and cash equivalents are also subject to the impairment requirements of IFRS 9, there was no identified impairment loss
as of 31 December 2018 and 2017.
Financial credit risk
With respect to the credit risk relating to financial assets (cash and cash equivalents, held-for-trading financial assets, loans receivable
and derivative instruments), this exposure relates to the potential default of the counterparty, with the maximum exposure being equal
to the carrying amount of these instruments. The counterparty risk from a cash management perspective is reduced by the
implementation of several cash pools, accounts and related paying platforms with different counterparties.
To mitigate the counterparty risk, the Group only deals with recognised financial institutions with an appropriate credit rating - generally
‘A’ and above - and in adherence of a maximum trade limit for each counterparty which has been approved for each type of
transactions. All counterparties are financial institutions which are regulated and controlled by the federal financial supervisory
authorities of the associated countries. The counterparty risk portfolio is analysed on a quarterly basis. Moreover, to reduce this
counterparty risk the portfolio is diversified as regards the main counterparties ensuring a well-balanced relation for all categories of
products (derivatives as well as deposits).
Capital management
The Group’s policy is to attain, and retain, a stable BBB- rating with Standard & Poor’s and a stable Baa2 rating with Moody’s. This
investment grade rating serves to maintain investors, creditors, rating agency and market confidence. Within this framework, the Group
manages its capital structure and liquidity in order to reflect changes in economic conditions to keep its cost of debt low, maintain the
confidence of debt investors at a high level and to create added value for the shareholder. The Group’s dividend policy takes into
account the financial performance of the year, cash flow developments and other factors such as yield and pay-out ratio.
Note 20 - Cash and cash equivalents
In millions of euros 2018 2017
Cash at bank and in hand 542.2 227.7
Short-term deposits 366.9 41.9
Total cash and cash equivalents 909.1 269.6
Cash at banks earns interest at floating rates based on daily bank deposit rates. Short-term deposits are made for varying periods
between one day and three months depending on the immediate cash requirements of the Group, and earn interest at the respective
short-term deposit rates. Short-term deposits and cash at bank and in hand are held at various financial institutions meeting the credit
rating criteria set out in Note 19 above.
As at 31 December 2018, an amount of EUR 15.4 million (2017: EUR 4.4 million) is invested in Money Market Funds which qualify as
cash and cash equivalents and is included in short-term deposits.
Note 21 - Shareholders’ equity
Issued capital
SES has a subscribed capital of EUR 719.0 million (2017: EUR 719.0 million), represented by 383,457,600 class A shares
(2017: 383,457,600 class A shares) and 191,728,800 class B shares (2017: 191,728,800 class B shares) with no par value.

63 | P a g e
The movement between the opening and closing number of shares issued per class of share can be summarised as follows:
Class A shares Class B shares Total shares
As at 1 January 2018 383,457,600 191,728,800 575,186,400
Shares issued during the year - - -
As at 31 December 2018 383,457,600 191,728,800 575,186,400
Class A shares Class B shares Total shares
As at 1 January 2017 383,457,600 191,728,800 575,186,400
Shares issued during the year - - -
As at 31 December 2017 383,457,600 191,728,800 575,186,400
Fiduciary Deposit Receipts (‘FDRs’) with respect to Class A shares are listed on the Luxembourg Stock Exchange and on Euronext
Paris. They can be traded freely and are convertible into Class A shares at any time and at no cost at the option of the holder under
the conditions applicable in the Company’s articles of association and in accordance with the terms of the FDRs.
All Class B shares are currently held by the State of Luxembourg, or by Luxembourg public institutions. Dividends paid for one share of
Class B equal 40% of the dividend for one share of Class A.
A shareholder, or a potential shareholder, who seeks to acquire, directly or indirectly, more than 20%, 33% or 50% of the shares of the
Company must inform the Chairman of the Board of Directors of the Company of such intention. The Chairman of the Board of
Directors of the Company shall forthwith inform the government of the Grand Duchy of Luxembourg of the envisaged acquisition which
may be opposed by the government within three months from such information should the government determine that such acquisition
would be against the general public interest. In case of no opposition from the government, the Board shall convene an extraordinary
meeting of shareholders which may decide at a majority provided for in article 450-3 of the law of 10 August 1915, as amended,
regarding commercial companies, to authorise the shareholder, or potential shareholder, to acquire more than 20%, 33% or 50% of the
shares. If it is an existing shareholder of the Company, it may attend the general meeting and will be included in the count for the
quorum but may not take part in the vote.
Buy-back of treasury shares
SES has historically, in agreement with the shareholders, purchased FDRs in respect of ‘Class A’ shares in connection with
executives’ and employees’ share-based payments plans as well as for cancellation. At the year-end, the Company held FDRs relating
to the above schemes as set out below. These FDRs are disclosed as treasury shares in the balance sheet and are carried at
acquisition cost as a deduction of equity.
2018 2017
FDRs held as at 31 December 5,589,589 6,535,320
Carrying value of FDRs held (in millions of euros) 132.1 160.0
EUR 750,000,000 Deeply Subordinated Fixed Rate Resettable Securities
On 10 June 2016 SES issued EUR 750,000,000 Deeply Subordinated Fixed Rate Resettable Securities (the ‘EUR 750.0 million
perpetual bond’) at a coupon of 4.625 percent to the first call date, a price of 99.666 and a yield of 4.7 percent. Transaction costs
related to this transaction amounted to EUR 19.8 million and have been deducted from ‘Other reserves’. SES is entitled to call the
EUR 750.0 million perpetual bond on 2 January 2022 and on subsequent coupon payment dates.
EUR 550,000,000 Deeply Subordinated Fixed Rate Resettable Securities
On 29 November 2016 SES issued a second perpetual bond of EUR 550,000,000 (the ‘EUR 550.0 million perpetual bond’) at a
coupon of 5.625 percent to the first call date, a price of 99.304 and a yield of 5.75 percent. Transaction costs related to this transaction
amounted to EUR 7.6 million and have been deducted from ‘Other reserves’. This brought the aggregate perpetual bond issued by
the Group to EUR 1,300 million. SES is entitled to call the EUR 550 million perpetual bond on 29 January 2024 and on subsequent
coupon payment dates.
As the Company has no obligation to redeem either of the bonds, and the coupon payments are discretionary, it classified the net
proceeds from the issuance of the securities (together EUR 1,281.9 million net of transaction costs and tax) as equity. The perpetual
bonds are guaranteed on a subordinated basis by SES Global Americas Holdings GP. SES used the net proceeds from the offerings
for the repayment of O3b debt, the repayment of certain existing indebtedness of the Group, as well as for general corporate purposes.
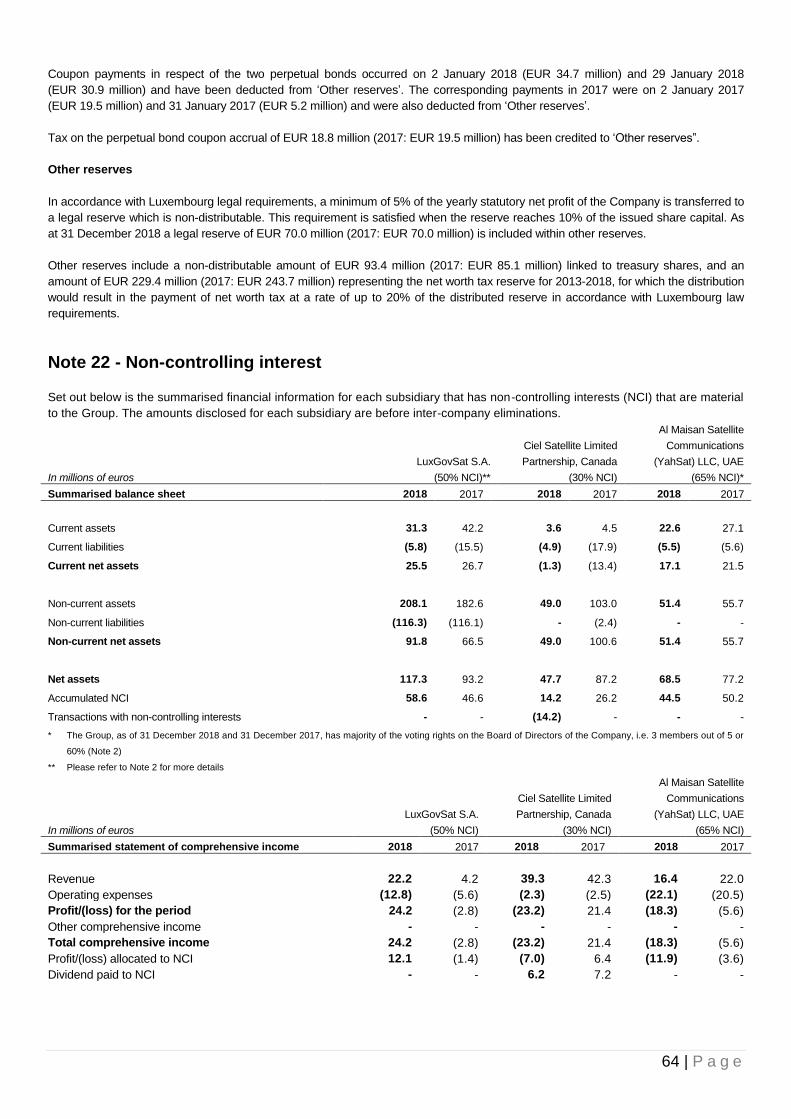
64 | P a g e
Coupon payments in respect of the two perpetual bonds occurred on 2 January 2018 (EUR 34.7 million) and 29 January 2018
(EUR 30.9 million) and have been deducted from ‘Other reserves’. The corresponding payments in 2017 were on 2 January 2017
(EUR 19.5 million) and 31 January 2017 (EUR 5.2 million) and were also deducted from ‘Other reserves’.
Tax on the perpetual bond coupon accrual of EUR 18.8 million (2017: EUR 19.5 million) has been credited to ‘Other reserves”.
Other reserves
In accordance with Luxembourg legal requirements, a minimum of 5% of the yearly statutory net profit of the Company is transferred to
a legal reserve which is non-distributable. This requirement is satisfied when the reserve reaches 10% of the issued share capital. As
at 31 December 2018 a legal reserve of EUR 70.0 million (2017: EUR 70.0 million) is included within other reserves.
Other reserves include a non-distributable amount of EUR 93.4 million (2017: EUR 85.1 million) linked to treasury shares, and an
amount of EUR 229.4 million (2017: EUR 243.7 million) representing the net worth tax reserve for 2013-2018, for which the distribution
would result in the payment of net worth tax at a rate of up to 20% of the distributed reserve in accordance with Luxembourg law
requirements.
Note 22 - Non-controlling interest
Set out below is the summarised financial information for each subsidiary that has non-controlling interests (NCI) that are material
to the Group. The amounts disclosed for each subsidiary are before inter-company eliminations.
In millions of euros
LuxGovSat S.A.
(50% NCI)**
Ciel Satellite Limited
Partnership, Canada
(30% NCI)
Al Maisan Satellite
Communications
(YahSat) LLC, UAE
(65% NCI)*
Summarised balance sheet 2018 2017 2018 2017 2018 2017
Current assets 31.3 42.2 3.6 4.5 22.6 27.1
Current liabilities (5.8) (15.5) (4.9) (17.9) (5.5) (5.6)
Current net assets 25.5 26.7 (1.3) (13.4) 17.1 21.5
Non-current assets 208.1 182.6 49.0 103.0 51.4 55.7
Non-current liabilities (116.3) (116.1) - (2.4) - -
Non-current net assets 91.8 66.5 49.0 100.6 51.4 55.7
Net assets 117.3 93.2 47.7 87.2 68.5 77.2
Accumulated NCI 58.6 46.6 14.2 26.2 44.5 50.2
Transactions with non-controlling interests - - (14.2) - - -
* The Group, as of 31 December 2018 and 31 December 2017, has majority of the voting rights on the Board of Directors of the Company, i.e. 3 members out of 5 or
60% (Note 2)
** Please refer to Note 2 for more details
In millions of euros
LuxGovSat S.A.
(50% NCI)
Ciel Satellite Limited
Partnership, Canada
(30% NCI)
Al Maisan Satellite
Communications
(YahSat) LLC, UAE
(65% NCI)
Summarised statement of comprehensive income 2018 2017 2018 2017 2018 2017
Revenue 22.2 4.2 39.3 42.3 16.4 22.0
Operating expenses (12.8) (5.6) (2.3) (2.5) (22.1) (20.5)
Profit/(loss) for the period 24.2 (2.8) (23.2) 21.4 (18.3) (5.6)
Other comprehensive income - - - - - -
Total comprehensive income 24.2 (2.8) (23.2) 21.4 (18.3) (5.6)
Profit/(loss) allocated to NCI 12.1 (1.4) (7.0) 6.4 (11.9) (3.6)
Dividend paid to NCI - - 6.2 7.2 - -

65 | P a g e
In millions of euros
LuxGovSat S.A.
(50% NCI)
Ciel Satellite Limited
Partnership, Canada
(30% NCI)
Al Maisan Satellite
Communications
(YahSat) LLC, UAE
(65% NCI)
Summarised cash flows 2018 2017 2018 2017 2018 2017
Cash flows from/(absorbed by) operating
activities 8.6 (3.8) 23.4 23.5 (1.4) -
Cash flows from/(absorbed by) investing
activities (17.6) (42.9) (0.7) (0.4) (0.0) 1.0
Cash flows from/(absorbed by) financing
activities 10.4 (0.3) (20.8) (24.2) 0.2 1.9
Net foreign exchange movements - (0.2) - 1.3 0.4 (0.6)
Net increase/(decrease) in cash and cash
equivalents 1.4 (47.2) 1.9 0.2 (0.8) 2.3
Transactions with non-controlling interests
In 2018 SES put in place an agreement with the minority partner holding 30% interest in Ciel Satellite Limited Partnership, according to
which SES will distribute to the minority partner a fixed amount per month over a five-year period. Thus, the variable stream that the
minority partner was previously receiving based on Ciel Satellite Limited Partnership’s business developments, has been replaced with
a fixed stream.
As the minority partner is no longer subject to variable returns and has no interest in the residual assets of Ciel Satellite Limited
Partnership, the non-controlling interest amounting to EUR 14.2 million as at 31 December 2018 has been fully reversed. An amount of
EUR 6.6 million, representing the fair value of the liability towards the minority partner has been reclassified to ‘Other long-term
liabilities’ (EUR 4.8 million) and to ‘Trade and other payables’ (EUR 1.8 million), and the remainder of EUR 7.6 million has been
reversed against ‘Other reserves’.
Note 23 - Share-based compensation plans
The Group has four share-based compensation plans which are detailed below. In the case of plans 1 and 3 the relevant strike price is
defined as the average of the market price of the underlying shares over a period of 15 trading days before the date of the grant.
1) The Stock Appreciation Rights Plan (‘STAR Plan’)
The STAR Plan is an equity-settled plan available to non-executive staff of Group subsidiaries, where share options are granted. In
January 2011, the STAR Plan was amended and, for all options granted 2011 onwards, a third of the share options vest and can
be exercised each year. After being fully vested, the share options have a four-year exercise period.
2018 2017
Outstanding options at the end of the year 2,154,927 2,306,003
Weighted average exercise price in euro 25.01 25.02
Out of 2,154,927 outstanding options as at 31 December 2018 (2017: 2,306,003), 2,154,927 options are exercisable
(2017: 2,092,730). Options exercised in 2018 resulted in 11,914 treasury shares (2017: 15,675) being delivered at a weighted
average price of EUR 17.83 each (2017: EUR 17.90).
On average, the related weighted average share price at the time of exercise was EUR 19.63 (2017: EUR 21.48) per share.
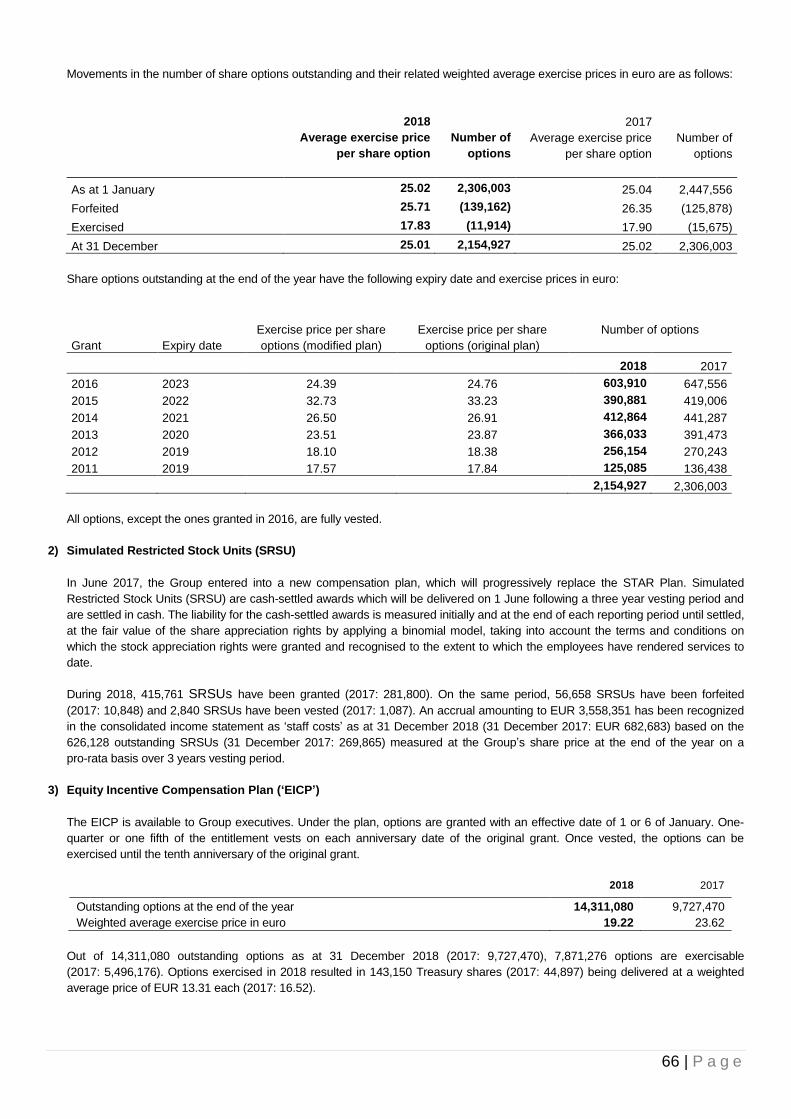
66 | P a g e
Movements in the number of share options outstanding and their related weighted average exercise prices in euro are as follows:
2018
Average exercise price
per share option
Number of
options
2017
Average exercise price
per share option
Number of
options
As at 1 January 25.02 2,306,003 25.04 2,447,556
Forfeited 25.71 (139,162) 26.35 (125,878)
Exercised 17.83 (11,914) 17.90 (15,675)
At 31 December 25.01 2,154,927 25.02 2,306,003
Share options outstanding at the end of the year have the following expiry date and exercise prices in euro:
Grant Expiry date
Exercise price per share
options (modified plan)
Exercise price per share
options (original plan)
Number of options
2018 2017
2016 2023 24.39 24.76 603,910 647,556
2015 2022 32.73 33.23 390,881 419,006
2014 2021 26.50 26.91 412,864 441,287
2013 2020 23.51 23.87 366,033 391,473
2012 2019 18.10 18.38 256,154 270,243
2011 2019 17.57 17.84 125,085 136,438
2,154,927 2,306,003
All options, except the ones granted in 2016, are fully vested.
2) Simulated Restricted Stock Units (SRSU)
In June 2017, the Group entered into a new compensation plan, which will progressively replace the STAR Plan. Simulated
Restricted Stock Units (SRSU) are cash-settled awards which will be delivered on 1 June following a three year vesting period and
are settled in cash. The liability for the cash-settled awards is measured initially and at the end of each reporting period until settled,
at the fair value of the share appreciation rights by applying a binomial model, taking into account the terms and conditions on
which the stock appreciation rights were granted and recognised to the extent to which the employees have rendered services to
date.
During 2018, 415,761 SRSUs have been granted (2017: 281,800). On the same period, 56,658 SRSUs have been forfeited
(2017: 10,848) and 2,840 SRSUs have been vested (2017: 1,087). An accrual amounting to EUR 3,558,351 has been recognized
in the consolidated income statement as ‘staff costs’ as at 31 December 2018 (31 December 2017: EUR 682,683) based on the
626,128 outstanding SRSUs (31 December 2017: 269,865) measured at the Group’s share price at the end of the year on a
pro-rata basis over 3 years vesting period.
3) Equity Incentive Compensation Plan (‘EICP’)
The EICP is available to Group executives. Under the plan, options are granted with an effective date of 1 or 6 of January. One-
quarter or one fifth of the entitlement vests on each anniversary date of the original grant. Once vested, the options can be
exercised until the tenth anniversary of the original grant.
2018 2017
Outstanding options at the end of the year 14,311,080 9,727,470
Weighted average exercise price in euro 19.22 23.62
Out of 14,311,080 outstanding options as at 31 December 2018 (2017: 9,727,470), 7,871,276 options are exercisable
(2017: 5,496,176). Options exercised in 2018 resulted in 143,150 Treasury shares (2017: 44,897) being delivered at a weighted
average price of EUR 13.31 each (2017: 16.52).
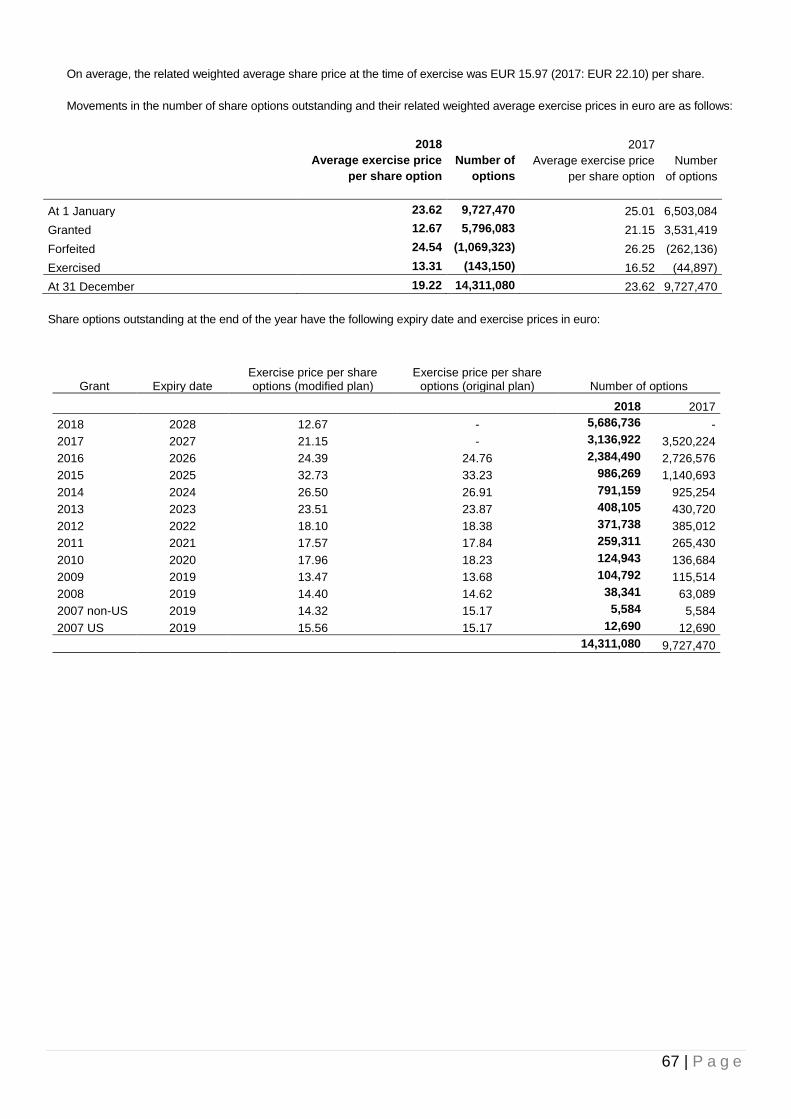
67 | P a g e
On average, the related weighted average share price at the time of exercise was EUR 15.97 (2017: EUR 22.10) per share.
Movements in the number of share options outstanding and their related weighted average exercise prices in euro are as follows:
2018 2017
Average exercise price
per share option
Number of
options
Average exercise price
per share option
Number
of options
At 1 January 23.62 9,727,470 25.01 6,503,084
Granted 12.67 5,796,083 21.15 3,531,419
Forfeited 24.54 (1,069,323) 26.25 (262,136)
Exercised 13.31 (143,150) 16.52 (44,897)
At 31 December 19.22 14,311,080 23.62 9,727,470
Share options outstanding at the end of the year have the following expiry date and exercise prices in euro:
Grant Expiry date Exercise price per share options (modified plan)
Exercise price per share options (original plan) Number of options
2018 2017
2018 2028 12.67 - 5,686,736 -
2017 2027 21.15 - 3,136,922 3,520,224
2016 2026 24.39 24.76 2,384,490 2,726,576
2015 2025 32.73 33.23 986,269 1,140,693
2014 2024 26.50 26.91 791,159 925,254
2013 2023 23.51 23.87 408,105 430,720
2012 2022 18.10 18.38 371,738 385,012
2011 2021 17.57 17.84 259,311 265,430
2010 2020 17.96 18.23 124,943 136,684
2009 2019 13.47 13.68 104,792 115,514
2008 2019 14.40 14.62 38,341 63,089
2007 non-US 2019 14.32 15.17 5,584 5,584
2007 US 2019 15.56 15.17 12,690 12,690
14,311,080 9,727,470
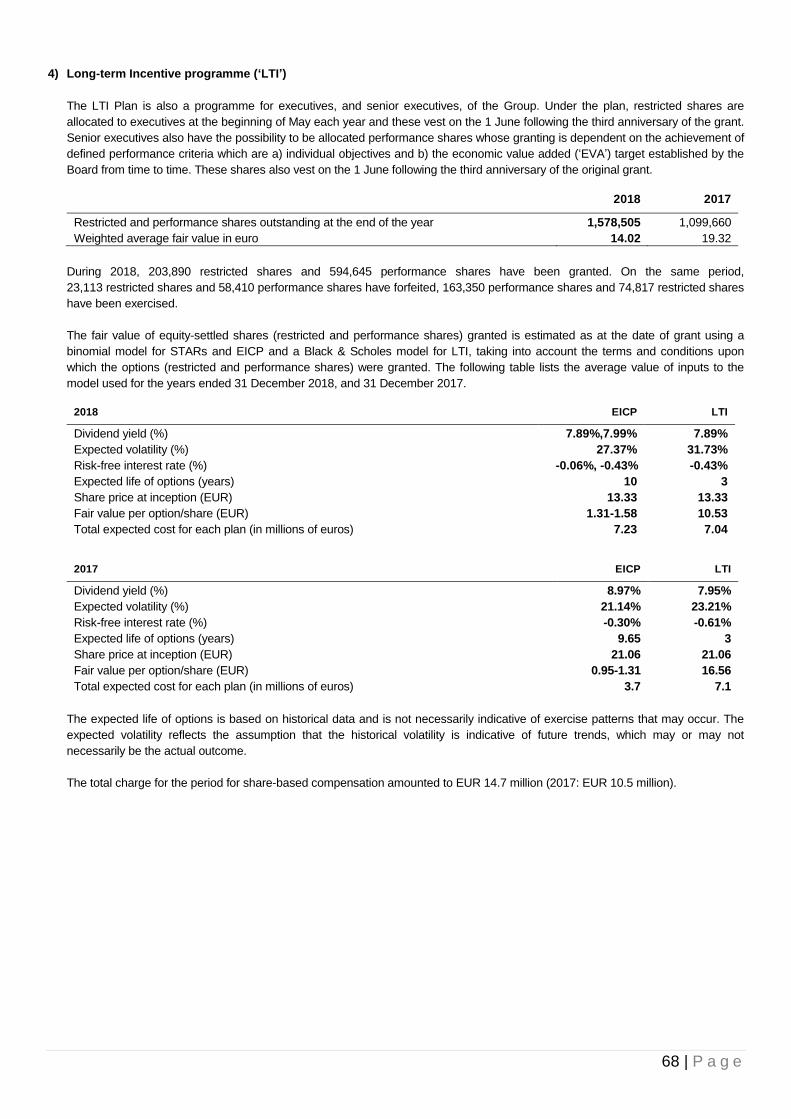
68 | P a g e
4) Long-term Incentive programme (‘LTI’)
The LTI Plan is also a programme for executives, and senior executives, of the Group. Under the plan, restricted shares are
allocated to executives at the beginning of May each year and these vest on the 1 June following the third anniversary of the grant.
Senior executives also have the possibility to be allocated performance shares whose granting is dependent on the achievement of
defined performance criteria which are a) individual objectives and b) the economic value added (‘EVA’) target established by the
Board from time to time. These shares also vest on the 1 June following the third anniversary of the original grant.
2018 2017
Restricted and performance shares outstanding at the end of the year 1,578,505 1,099,660
Weighted average fair value in euro 14.02 19.32
During 2018, 203,890 restricted shares and 594,645 performance shares have been granted. On the same period,
23,113 restricted shares and 58,410 performance shares have forfeited, 163,350 performance shares and 74,817 restricted shares
have been exercised.
The fair value of equity-settled shares (restricted and performance shares) granted is estimated as at the date of grant using a
binomial model for STARs and EICP and a Black & Scholes model for LTI, taking into account the terms and conditions upon
which the options (restricted and performance shares) were granted. The following table lists the average value of inputs to the
model used for the years ended 31 December 2018, and 31 December 2017.
2018 EICP LTI
Dividend yield (%) 7.89%,7.99% 7.89%
Expected volatility (%) 27.37% 31.73%
Risk-free interest rate (%) -0.06%, -0.43% -0.43%
Expected life of options (years) 10 3
Share price at inception (EUR) 13.33 13.33
Fair value per option/share (EUR) 1.31-1.58 10.53
Total expected cost for each plan (in millions of euros) 7.23 7.04
2017 EICP LTI
Dividend yield (%) 8.97% 7.95%
Expected volatility (%) 21.14% 23.21%
Risk-free interest rate (%) -0.30% -0.61%
Expected life of options (years) 9.65 3
Share price at inception (EUR) 21.06 21.06
Fair value per option/share (EUR) 0.95-1.31 16.56
Total expected cost for each plan (in millions of euros) 3.7 7.1
The expected life of options is based on historical data and is not necessarily indicative of exercise patterns that may occur. The
expected volatility reflects the assumption that the historical volatility is indicative of future trends, which may or may not
necessarily be the actual outcome.
The total charge for the period for share-based compensation amounted to EUR 14.7 million (2017: EUR 10.5 million).

69 | P a g e
Note 24 - Interest-bearing borrowings
As at 31 December 2018 and 2017, the Group’s interest-bearing borrowings were:
In millions of euros Effective interest rate Maturity
Amounts outstanding
2018, carried at
amortised cost
Non-current
Eurobond 2020 (EUR 650 million) 4.625% March 2020 649.1
Eurobond 2021 (EUR 650 million) 4.75% March 2021 648.4
COFACE EURIBOR 6M + 1.70% Various 2020 - 2022 119.6
US Bond (USD 750 million) 3.60% April 2023 653.4
German bond (EUR 150 million), non-listed EURIBOR 6M + 0.80% June 2024 149.4
German bond (EUR 250 million), non-listed 1.71% December 2025 249.0
Eurobond 2026 (EUR 500 million) 1.625% March 2026 494.1
Euro Private Placement 2027
(EUR 140 million issued under EMTN) 4.00% May 2027 139.6
Fixed Term Loan (LuxGovSat) 3.30% December 2027 115.0
German bond (EUR 50 million), non-listed 4.00% November 2032 49.8
US Bond (USD 250 million) 5.30% April 2043 213.6
US Bond (USD 500 million) 5.30% March 2044 427.5
Total non-current 3,908.5
Current
COFACE EURIBOR 6M + 1.70% Various in 2019 41.2
US Bond (USD 500 million) 2.50% March 2019 435.2
Total current 476.4
In millions of euros Effective interest rate Maturity
Amounts outstanding
2017, carried at
amortised cost
Non-current
US Bond (USD 500 million) 2.50% March 2019 416.5
Eurobond 2020 (EUR 650 million) 4.625% March 2020 649.1
Eurobond 2021 (EUR 650 million) 4.75% March 2021 648.4
COFACE EURIBOR 6M + 1.70%
Various from 2019 to
2022
161.6
US Bond (USD 750 million) 3.60% April 2023 623.9
Euro Private Placement 2027 (EUR 140
million issued under EMTN) 4.00% May 2027
139.6
Fixed Term Loan (LuxGovSat) 3.30% December 2027 115.0
German bond (EUR 50 million), non-listed 4.00% November 2032 49.8
US Bond (USD 250 million) 5.30% April 2043 203.2
US Bond (USD 500 million) 5.30% March 2044 406.7
Total non-current 3,413.8
Current COFACE EURIBOR 6M + 1.70% Various in 2018 40.3 Eurobond 2018 (EUR 500 million)* 1.875% October 2018 498.4 Loan origination cost (4.6)
Total current 534.1
* The loan origination cost related to the borrowings have been reclassified to short term for the portion that will be amortised in 2018.

70 | P a g e
European Medium-Term Note Programme (‘EMTN’)
On 6 December 2005, SES put in place a EUR 2,000.0 million EMTN enabling SES, or SES Global Americas Holdings GP, to issue as
and when required notes up to a maximum aggregate amount of EUR 2,000.0 million. In May 2007, this programme was increased to
an aggregate amount of EUR 4,000.0 million. On 12 March 2018 this programme has been extended for one further year. As at
December 31, 2018, SES had issued EUR 1,940.0 million (2017: EUR 1,940.0 million) under the EMTN Programme with maturities
ranging from 2020 to 2027.
EUR 500.0 million Eurobond (2018)
On 16 October 2013, SES issued a EUR 500.0 million bond under the Company’s European Medium-Term Note Programme. The
bond had a 5-year maturity and bears interest at a fixed rate of 1.875%. The bond was paid on 24 October 2018.
144A Bond USD 500 million (2019)
On 25 March 2014, SES completed a 144A offering in the US market issuing USD 500 million 5-year bond with a coupon of 2.50%
and a final maturity date of 25 March 2019.
EUR 650.0 million Eurobond (2020)
On 9 March 2010, SES issued a EUR 650.0 million bond under the Company’s European Medium-Term Note Programme. The bond
has a 10-year maturity and bears interest at a fixed rate of 4.625%.
EUR 650.0 million Eurobond (2021)
On 11 March 2011, SES issued a EUR 650.0 million bond under the Company’s European Medium-Term Note Programme. The bond
has a 10-year maturity and bears interest at a fixed rate of 4.75%.
German bond issue of EUR 400.0 million (2024 / 2025)
On 5 December 2018, the Group closed the issuance of an aggregated amount of EUR 400 million in the German bond
(‘Schuldschein’) market. The transaction consists of two individual tranches – a EUR 150 million tranche with a floating
interest rate of a six-month EURIBOR plus a margin of 0.8% and a final maturity date on 18 June 2024 as well as a
EUR 250 million tranche with a fixed interest rate of 1.71% and a final maturity date on 18 December 2025.
EUR 500.0 million Eurobond (2026)
On 22 March 2018, SES issued a EUR 500.0 million 8-year bond under the Company’s European Medium-Term Note Programme.
The bond bears interest at a fixed rate of 1.625% and has a final maturity date on 22 March 2026.
EUR 140.0 million Private Placement (2027)
Between May and July 2012, SES issued three individual tranches of a total EUR 140.0 million Private Placement under the
Company’s European Medium-Term Note Programme with ING Bank N.V. The Private Placement has a 15-year maturity, beginning
31 May 2012, and bears interest at a fixed rate of 4.00%.
German bond issue of EUR 50.0 million (2032)
On 29 October 2012, the Group signed an agreement to issue EUR 50 million in the German bond (‘Schuldschein’) market.
The German bond bears a fixed interest rate of 4.00% and matures on 12 November 2032.
144A Bond USD 750.0 million (2023)
On 4 April 2013, SES completed a 144A offering in the US market issuing USD 750 million 10-year bond with a coupon of 3.60% and
a final maturity date on 4 April 2023.
144A Bond USD 250.0 million (2043)
On 4 April 2013, SES completed a 144A offering in the US market issuing USD 250 million 30-year bond with a coupon of 5.30% and
a final maturity date on 4 April 2043.
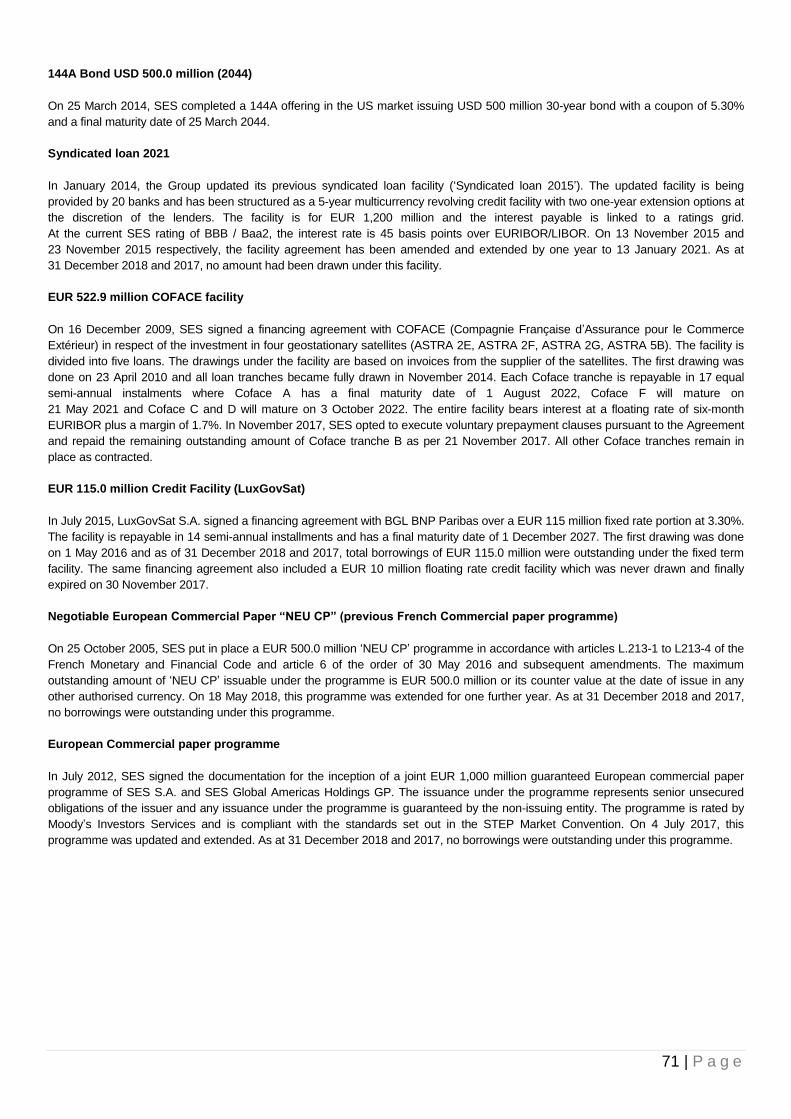
71 | P a g e
144A Bond USD 500.0 million (2044)
On 25 March 2014, SES completed a 144A offering in the US market issuing USD 500 million 30-year bond with a coupon of 5.30%
and a final maturity date of 25 March 2044.
Syndicated loan 2021
In January 2014, the Group updated its previous syndicated loan facility (‘Syndicated loan 2015’). The updated facility is being
provided by 20 banks and has been structured as a 5-year multicurrency revolving credit facility with two one-year extension options at
the discretion of the lenders. The facility is for EUR 1,200 million and the interest payable is linked to a ratings grid.
At the current SES rating of BBB / Baa2, the interest rate is 45 basis points over EURIBOR/LIBOR. On 13 November 2015 and
23 November 2015 respectively, the facility agreement has been amended and extended by one year to 13 January 2021. As at
31 December 2018 and 2017, no amount had been drawn under this facility.
EUR 522.9 million COFACE facility
On 16 December 2009, SES signed a financing agreement with COFACE (Compagnie Française d’Assurance pour le Commerce
Extérieur) in respect of the investment in four geostationary satellites (ASTRA 2E, ASTRA 2F, ASTRA 2G, ASTRA 5B). The facility is
divided into five loans. The drawings under the facility are based on invoices from the supplier of the satellites. The first drawing was
done on 23 April 2010 and all loan tranches became fully drawn in November 2014. Each Coface tranche is repayable in 17 equal
semi-annual instalments where Coface A has a final maturity date of 1 August 2022, Coface F will mature on
21 May 2021 and Coface C and D will mature on 3 October 2022. The entire facility bears interest at a floating rate of six-month
EURIBOR plus a margin of 1.7%. In November 2017, SES opted to execute voluntary prepayment clauses pursuant to the Agreement
and repaid the remaining outstanding amount of Coface tranche B as per 21 November 2017. All other Coface tranches remain in
place as contracted.
EUR 115.0 million Credit Facility (LuxGovSat)
In July 2015, LuxGovSat S.A. signed a financing agreement with BGL BNP Paribas over a EUR 115 million fixed rate portion at 3.30%.
The facility is repayable in 14 semi-annual installments and has a final maturity date of 1 December 2027. The first drawing was done
on 1 May 2016 and as of 31 December 2018 and 2017, total borrowings of EUR 115.0 million were outstanding under the fixed term
facility. The same financing agreement also included a EUR 10 million floating rate credit facility which was never drawn and finally
expired on 30 November 2017.
Negotiable European Commercial Paper “NEU CP” (previous French Commercial paper programme)
On 25 October 2005, SES put in place a EUR 500.0 million ‘NEU CP’ programme in accordance with articles L.213-1 to L213-4 of the
French Monetary and Financial Code and article 6 of the order of 30 May 2016 and subsequent amendments. The maximum
outstanding amount of ‘NEU CP’ issuable under the programme is EUR 500.0 million or its counter value at the date of issue in any
other authorised currency. On 18 May 2018, this programme was extended for one further year. As at 31 December 2018 and 2017,
no borrowings were outstanding under this programme.
European Commercial paper programme
In July 2012, SES signed the documentation for the inception of a joint EUR 1,000 million guaranteed European commercial paper
programme of SES S.A. and SES Global Americas Holdings GP. The issuance under the programme represents senior unsecured
obligations of the issuer and any issuance under the programme is guaranteed by the non-issuing entity. The programme is rated by
Moody’s Investors Services and is compliant with the standards set out in the STEP Market Convention. On 4 July 2017, this
programme was updated and extended. As at 31 December 2018 and 2017, no borrowings were outstanding under this programme.
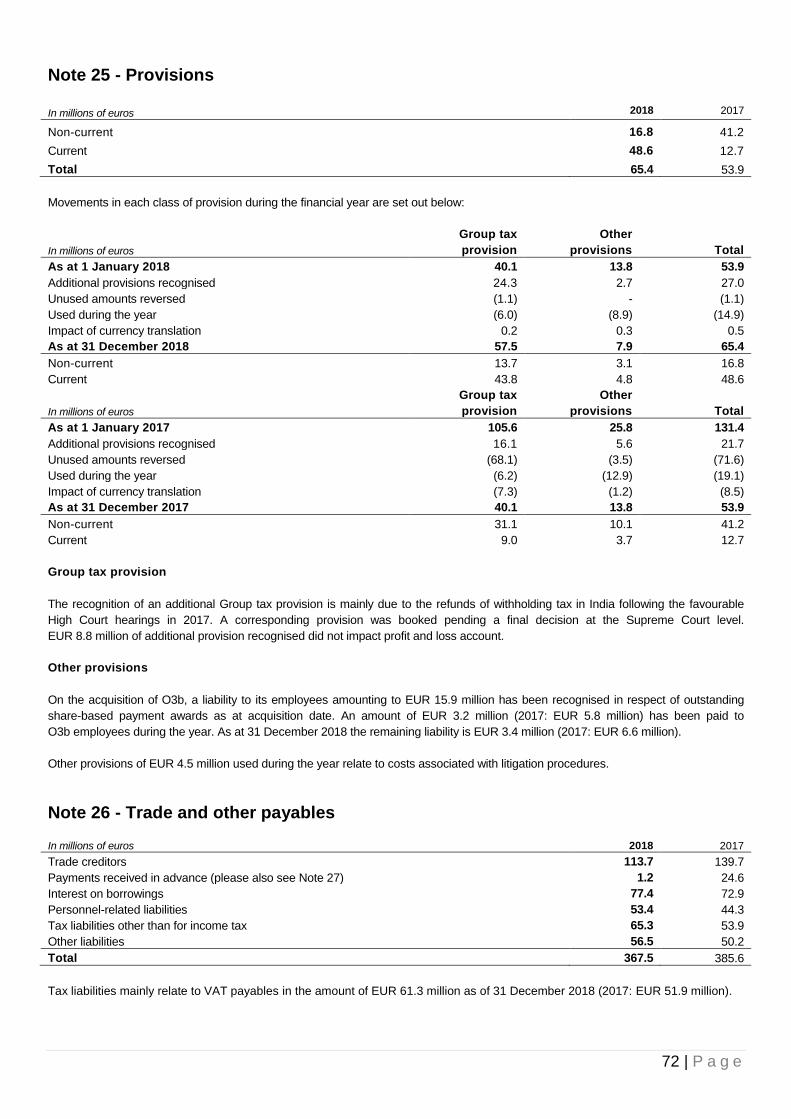
72 | P a g e
Note 25 - Provisions
In millions of euros 2018 2017
Non-current 16.8 41.2
Current 48.6 12.7
Total 65.4 53.9
Movements in each class of provision during the financial year are set out below:
In millions of euros
Group tax
provision
Other
provisions
Total
As at 1 January 2018 40.1 13.8 53.9
Additional provisions recognised 24.3 2.7 27.0
Unused amounts reversed (1.1) - (1.1)
Used during the year (6.0) (8.9) (14.9)
Impact of currency translation 0.2 0.3 0.5
As at 31 December 2018 57.5 7.9 65.4
Non-current 13.7 3.1 16.8
Current 43.8 4.8 48.6
In millions of euros
Group tax
provision
Other
provisions
Total
As at 1 January 2017 105.6 25.8 131.4
Additional provisions recognised 16.1 5.6 21.7
Unused amounts reversed (68.1) (3.5) (71.6)
Used during the year (6.2) (12.9) (19.1)
Impact of currency translation (7.3) (1.2) (8.5)
As at 31 December 2017 40.1 13.8 53.9
Non-current 31.1 10.1 41.2
Current 9.0 3.7 12.7
Group tax provision
The recognition of an additional Group tax provision is mainly due to the refunds of withholding tax in India following the favourable
High Court hearings in 2017. A corresponding provision was booked pending a final decision at the Supreme Court level.
EUR 8.8 million of additional provision recognised did not impact profit and loss account.
Other provisions
On the acquisition of O3b, a liability to its employees amounting to EUR 15.9 million has been recognised in respect of outstanding
share-based payment awards as at acquisition date. An amount of EUR 3.2 million (2017: EUR 5.8 million) has been paid to
O3b employees during the year. As at 31 December 2018 the remaining liability is EUR 3.4 million (2017: EUR 6.6 million).
Other provisions of EUR 4.5 million used during the year relate to costs associated with litigation procedures.
Note 26 - Trade and other payables
In millions of euros 2018 2017
Trade creditors 113.7 139.7
Payments received in advance (please also see Note 27) 1.2 24.6
Interest on borrowings 77.4 72.9
Personnel-related liabilities 53.4 44.3
Tax liabilities other than for income tax 65.3 53.9
Other liabilities 56.5 50.2
Total 367.5 385.6
Tax liabilities mainly relate to VAT payables in the amount of EUR 61.3 million as of 31 December 2018 (2017: EUR 51.9 million).
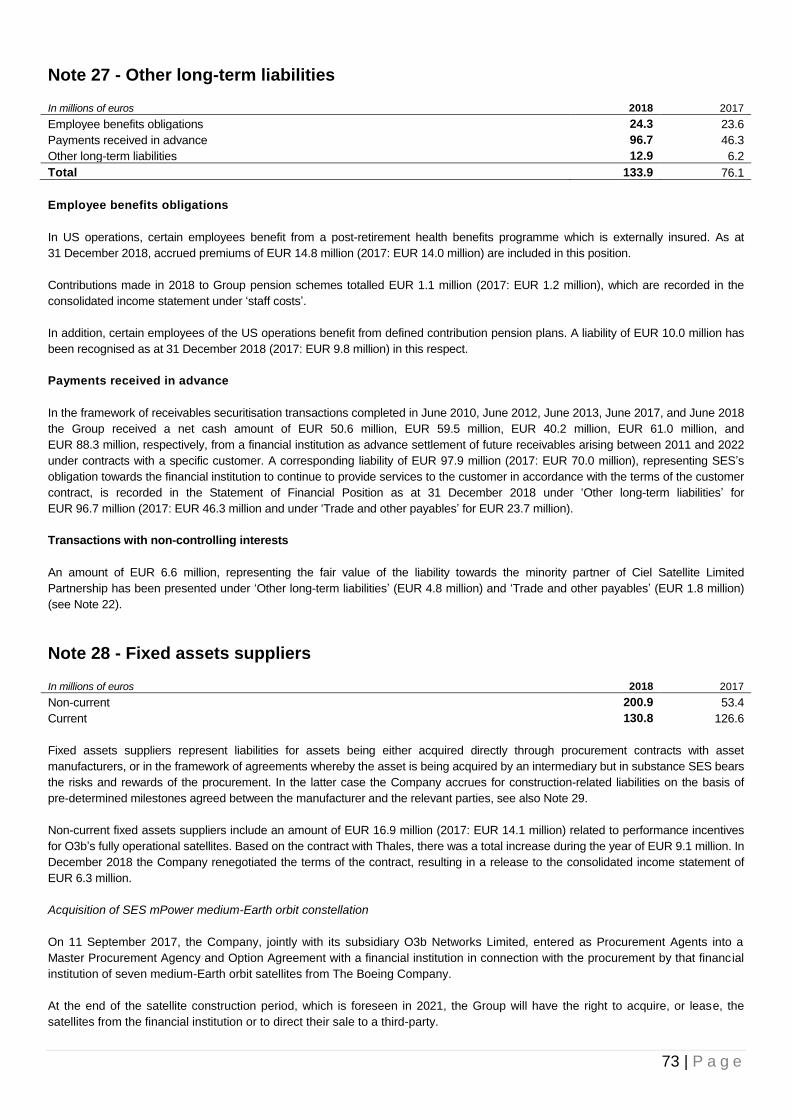
73 | P a g e
Note 27 - Other long-term liabilities
In millions of euros 2018 2017
Employee benefits obligations 24.3 23.6
Payments received in advance 96.7 46.3
Other long-term liabilities 12.9 6.2
Total 133.9 76.1
Employee benefits obligations
In US operations, certain employees benefit from a post-retirement health benefits programme which is externally insured. As at
31 December 2018, accrued premiums of EUR 14.8 million (2017: EUR 14.0 million) are included in this position.
Contributions made in 2018 to Group pension schemes totalled EUR 1.1 million (2017: EUR 1.2 million), which are recorded in the
consolidated income statement under ‘staff costs’.
In addition, certain employees of the US operations benefit from defined contribution pension plans. A liability of EUR 10.0 million has
been recognised as at 31 December 2018 (2017: EUR 9.8 million) in this respect.
Payments received in advance
In the framework of receivables securitisation transactions completed in June 2010, June 2012, June 2013, June 2017, and June 2018
the Group received a net cash amount of EUR 50.6 million, EUR 59.5 million, EUR 40.2 million, EUR 61.0 million, and
EUR 88.3 million, respectively, from a financial institution as advance settlement of future receivables arising between 2011 and 2022
under contracts with a specific customer. A corresponding liability of EUR 97.9 million (2017: EUR 70.0 million), representing SES’s
obligation towards the financial institution to continue to provide services to the customer in accordance with the terms of the customer
contract, is recorded in the Statement of Financial Position as at 31 December 2018 under ‘Other long-term liabilities’ for
EUR 96.7 million (2017: EUR 46.3 million and under ‘Trade and other payables’ for EUR 23.7 million).
Transactions with non-controlling interests
An amount of EUR 6.6 million, representing the fair value of the liability towards the minority partner of Ciel Satellite Limited
Partnership has been presented under ‘Other long-term liabilities’ (EUR 4.8 million) and ‘Trade and other payables’ (EUR 1.8 million)
(see Note 22).
Note 28 - Fixed assets suppliers
In millions of euros 2018 2017
Non-current 200.9 53.4
Current 130.8 126.6
Fixed assets suppliers represent liabilities for assets being either acquired directly through procurement contracts with asset
manufacturers, or in the framework of agreements whereby the asset is being acquired by an intermediary but in substance SES bears
the risks and rewards of the procurement. In the latter case the Company accrues for construction-related liabilities on the basis of
pre-determined milestones agreed between the manufacturer and the relevant parties, see also Note 29.
Non-current fixed assets suppliers include an amount of EUR 16.9 million (2017: EUR 14.1 million) related to performance incentives
for O3b’s fully operational satellites. Based on the contract with Thales, there was a total increase during the year of EUR 9.1 million. In
December 2018 the Company renegotiated the terms of the contract, resulting in a release to the consolidated income statement of
EUR 6.3 million.
Acquisition of SES mPower medium-Earth orbit constellation
On 11 September 2017, the Company, jointly with its subsidiary O3b Networks Limited, entered as Procurement Agents into a
Master Procurement Agency and Option Agreement with a financial institution in connection with the procurement by that financial
institution of seven medium-Earth orbit satellites from The Boeing Company.
At the end of the satellite construction period, which is foreseen in 2021, the Group will have the right to acquire, or lease, the
satellites from the financial institution or to direct their sale to a third-party.

74 | P a g e
Since the underlying Satellite Purchase and Sale Agreement is directly between the financial institution and The Boeing Company
then there is no contractual obligation on the side of the Procurement Agents during the satellite construction process. However,
SES management takes the view that there is a constructive obligation arising over the construction period and hence the
SES Group is accruing for the costs of this programme. SES has the right to nominate the entity within the SES Group which will
acquire or lease those assets shortly before the end of the construction period.
SES management expects that the satellites will be acquired or leased in due course by the company SES mPower S.à r.l. in
Luxembourg.
As at 31 December 2018 an amount of EUR 174.1 million (USD 199.4 million) has been accrued in connection with the constructive
obligation for mPower programme costs described above.
Non-current fixed assets suppliers were initially recognized at fair value and subsequently measured at amortised cost using the
effective interest method.
Note 29 - Commitments and contingencies
Capital commitments
The Group had outstanding commitments in respect of contracted capital expenditure totalling EUR 997.5 million at
31 December 2018 (2017: EUR 1,136.1 million). These commitments largely reflect the procurement of satellites and satellite
launchers and are stated net of liabilities under these programmes which are already disclosed under within “Fixed assets suppliers”,
see Note 28.
The capital commitment arising under these agreements as at 31 December is as follows:
In millions of euros 2018 2017
Within one year 471.7 129.1
After one year but not more than five years 460.6 909.1
After more than five years 65.2 97.9
Total 997.5 1,136.1
Commitments under transponder service agreements
The Group has entered into transponder service agreements for the purchase of satellite capacity from third parties under contracts
with a maximum life of eight years. The commitment arising under these agreements as at 31 December is as follows:
In millions of euros 2018 2017
Within one year 69.2 56.6
After one year but not more than five years 84.5 43.8
After more than five years 15.0 6.4
Total 168.7 106.8
Total expense for transponder service agreements was EUR 92.3 million in 2018 (2017: EUR 102.9 million).
Litigation
There were no significant litigation claims against the Group as at 31 December 2018.
Guarantees
On 31 December 2018 the Group had outstanding bank guarantees for an amount of EUR 118.5 million (2017: EUR 130.2 million)
with respect to performance and warranty guarantees for services of satellite operations.

75 | P a g e
Note 30 - Leases
1) Lessor
During 2018 the Group recognized leasing income of EUR 76.8 million (2017: EUR 80.3 million) related to two lease contracts.
One of the lease contracts matures on 27 January 2019 and the related lease payment will amount to EUR 2.0 million. The other
lease contract matures on 30 November 2021 and the related annual lease payment will amount to EUR 20.3 million in 2019 and
2020, and EUR 18.6 million in 2021. The related carrying amount of property, plant and equipment leased as at 31 December 2018
amounts to EUR 178.8 million.
2) Lessee
The impact of the first-time adoption of IFRS 16 “Leases” is disclosed in Note 3.
i) Amounts recognised in the consolidated statement of financial position
The Group leases office buildings, ground segment assets and other fixtures and fittings, tools and equipment, information
about which is presented below.
In millions of euros Buildings
Ground
segment
Other fixtures
and fittings,
tools and
equipment
31 December
2018
Right-of-use assets
Cost 37.3 8.2 2.1 47.6
Accumulated depreciation (6.5) (2.5) (0.9) (9.9)
Total 30.8 5.7 1.2 37.7
There were no material additions to the right-of-use assets during 2018, depreciation charge for the year was EUR 9.7 million.
Lease liabilities are presented below as at 31 December:
In millions of euros 2018
Maturity analysis – contractual undiscounted cash flows
Within one year 10.2
After one year but not more than five years 25.7
More than five years 5.3
Total 41.2
Lease liabilities included in the statement of financial position at 31 December
Current 9.5
Non-current 28.6
Total 38.1
The leases of office buildings typically run for a period of 2-10 years and leases of ground segment assets for 5 years. Some
leases include an option to renew the lease for an additional period of time after the end of the contract term. The Group
assesses at lease commencement whether it is reasonable certain to exercise the extension option. The Group reassesses
whether it is reasonably certain to exercise the options if there is a significant event or significant change in circumstances
within its control.
ii) Amounts recognised in the consolidated income statement
Depreciation charge of right-of-use assets:
In millions of euros 2018
Buildings 6.4
Ground segment 2.4
Other fixtures and fittings, tools and equipment 0.9
Total 9.7
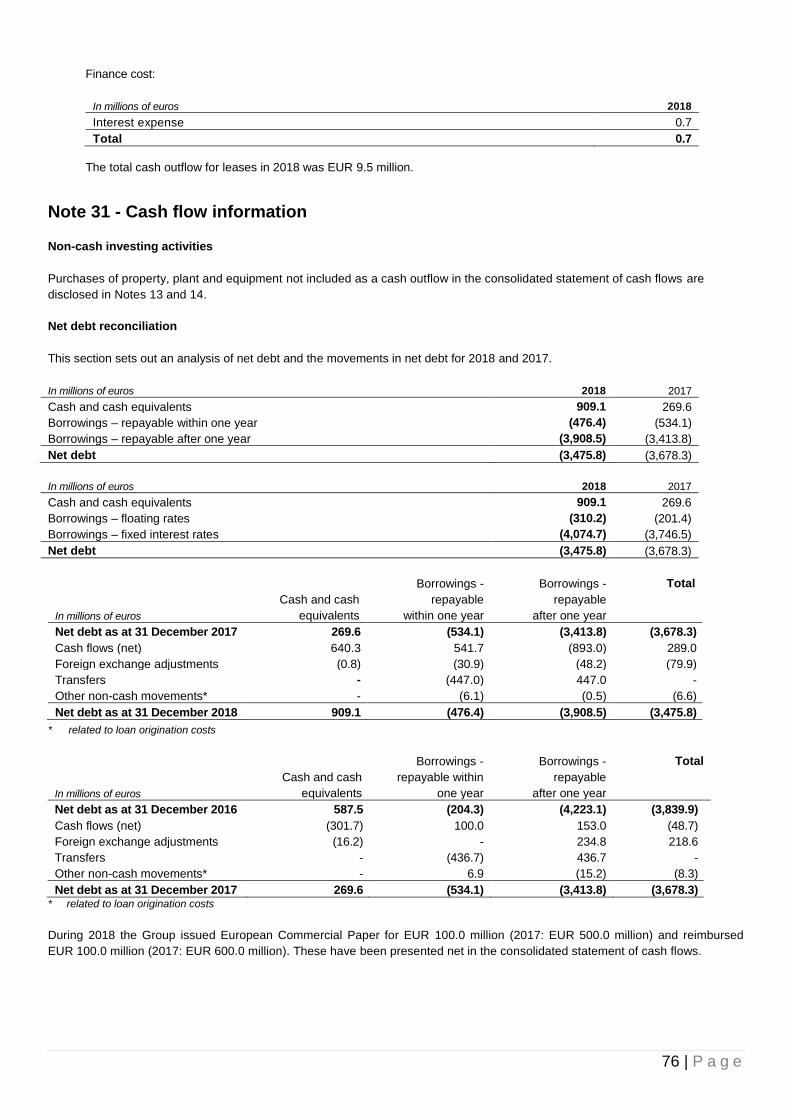
76 | P a g e
Finance cost:
In millions of euros 2018
Interest expense 0.7
Total 0.7
The total cash outflow for leases in 2018 was EUR 9.5 million.
Note 31 - Cash flow information
Non-cash investing activities
Purchases of property, plant and equipment not included as a cash outflow in the consolidated statement of cash flows are
disclosed in Notes 13 and 14.
Net debt reconciliation
This section sets out an analysis of net debt and the movements in net debt for 2018 and 2017.
In millions of euros 2018 2017
Cash and cash equivalents 909.1 269.6
Borrowings – repayable within one year (476.4) (534.1)
Borrowings – repayable after one year (3,908.5) (3,413.8)
Net debt (3,475.8) (3,678.3)
In millions of euros 2018 2017
Cash and cash equivalents 909.1 269.6
Borrowings – floating rates (310.2) (201.4)
Borrowings – fixed interest rates (4,074.7) (3,746.5)
Net debt (3,475.8) (3,678.3)
In millions of euros
Cash and cash
equivalents
Borrowings -
repayable
within one year
Borrowings -
repayable
after one year
Total
Net debt as at 31 December 2017 269.6 (534.1) (3,413.8) (3,678.3)
Cash flows (net) 640.3 541.7 (893.0) 289.0
Foreign exchange adjustments (0.8) (30.9) (48.2) (79.9)
Transfers - (447.0) 447.0 -
Other non-cash movements* - (6.1) (0.5) (6.6)
Net debt as at 31 December 2018 909.1 (476.4) (3,908.5) (3,475.8)
* related to loan origination costs
In millions of euros
Cash and cash
equivalents
Borrowings -
repayable within
one year
Borrowings -
repayable
after one year
Total
Net debt as at 31 December 2016 587.5 (204.3) (4,223.1) (3,839.9)
Cash flows (net) (301.7) 100.0 153.0 (48.7)
Foreign exchange adjustments (16.2) - 234.8 218.6
Transfers - (436.7) 436.7 -
Other non-cash movements* - 6.9 (15.2) (8.3)
Net debt as at 31 December 2017 269.6 (534.1) (3,413.8) (3,678.3) * related to loan origination costs
During 2018 the Group issued European Commercial Paper for EUR 100.0 million (2017: EUR 500.0 million) and reimbursed
EUR 100.0 million (2017: EUR 600.0 million). These have been presented net in the consolidated statement of cash flows.

77 | P a g e
Note 32 - Related parties
The state of Luxembourg holds a direct 11.58% voting interest in the Company and two indirect interests, both of 10.88%, through
two state owned banks, Banque et Caisse d’Epargne de l’Etat and Société Nationale de Crédit et d’Investissement. These shares
constitute the Company’s Class B shares, as described in Note 21.
The total payments to directors for attendance at board and committee meetings in 2018 amounted to EUR 1.3 million (2017:
EUR 1.4 million). These payments are computed on a fixed and variable basis, the variable part being based upon attendance at
board and committee meetings.
The key management of the Group, defined as the Group’s Executive Committee, received compensation as follows:
In millions of euros 2018 2017
Remuneration including bonuses 3.9 5.3
Pension benefits 0.5 0.8
Share-based compensation plans 1.0 1.7
Other benefits 0.9 0.6
Total 6.3 8.4
The remuneration for the existing Executive Committee is complemented by EUR 4.4 million total gross remuneration paid to the
two departing Executive Committee members.
The total outstanding amount in respect of share-based payment instruments allocated to key management as at 31 December 2018
were 3,714,589 (2017: 2,932,673).
Note 33 - Post-Balance Sheet events
There were no other material events occurring between the reporting date and the date when the consolidated financial statements
were authorised by the Board of Directors.

78 | P a g e
Note 34 - Consolidated subsidiaries, associates
The consolidated financial statements include the financial statements of the Group’s subsidiaries and associates listed below:
Economic Economic Method of consolidation
2018
Method of consolidation
2017
interest (%) interest (%)
2018 2017
SES ASTRA S.A., Luxembourg 100 100 Full Full
SES GLOBAL-Americas Inc., U.S.A. 100 100 Full Full
SES GLOBAL Americas Holdings General Partnership, U.S.A. 100 100 Full Full
SES Participations S.A., Luxembourg 100 100 Full Full
SES Finance S.à r.l., Luxembourg 100 100 Full Full
SES Holdings (Netherlands) B.V., Netherlands 100 100 Full Full
SES ASTRA Services Europe S.A., Luxembourg 100 100 Full Full
SES Latin America S.A., Luxembourg 100 100 Full Full
SES Belgium S.p.r.l, Belgium 100 100 Full Full
SES Insurance International S.A., Luxembourg 100 100 Full Full
SES Insurance International Re S.A., Luxembourg 100 100 Full Full
SES Lux Finance S.à r.l., Luxembourg2 100 100 Full Full
SES Networks Lux S.à r.l., Luxembourg3 100 100 Full Full
Ciel Satellite Holdings Inc., Canada 100 100 Full Full
Ciel Satellite Limited Partnership, Canada 100 70 Full Full
Northern Americas Satellite Ventures, Inc., Canada 100 100 Full Full
SES TechCom S.A., Luxembourg 100 100 Full Full
SES-15 S.à r.l., Luxembourg 100 100 Full Full
SES Digital Distribution Services AG, Switzerland2 100 100 Full Full
Redu Operations Services S.A., Belgium 48 48 Equity Equity
Redu Space Services S.A., Belgium 52 52 Full Full
HD Plus GmbH, Germany 100 100 Full Full
SES ASTRA Real Estate (Betzdorf) S.A., Luxembourg 100 100 Full Full
MX1 GmbH, Germany 100 100 Full Full
SES Media Solutions GmbH, Germany 100 100 Full Full
MX1 (Thailand) Ltd, Thailand 100 100 Full Full
PT MX1 Smartcast Indonesia, Indonesia 100 100 Full Full
MX1 Asia Limited, China 2, - 100 Full Full
ASTRA Deutschland GmbH, Germany 100 100 Full Full
SES ASTRA Iberica S.A., Spain 100 100 Full Full
ASTRA France S.A., France 100 100 Full Full
ASTRA (GB) Limited, United Kingdom 100 100 Full Full
SES ASTRA CEE Sp. z o.o, Poland 100 100 Full Full
SES ASTRA (Romania) S.r.l., Romania 100 100 Full Full
SES Satellites Ghana Ltd, Ghana 100 100 Full Full
SES ENGINEERING (Luxembourg) S.à r.l., Luxembourg 100 100 Full Full
SES ASTRA AB, Sweden 100 100 Full Full
Sirius Satellite Services SIA, Latvia 100 100 Full Full
SES SIRIUS Ukraine, Ukraine 100 100 Full Full
SES ASTRA 1KR S.à r.l., Luxembourg 100 100 Full Full
SES ASTRA 1L S.à r.l., Luxembourg 100 100 Full Full
SES ASTRA 1M S.à r.l., Luxembourg 100 100 Full Full
SES ASTRA 3B S.à r.l., Luxembourg 100 100 Full Full
SES ASTRA 5B S.à r.l., Luxembourg 100 100 Full Full
SES ASTRA 1N S.à r.l., Luxembourg 100 100 Full Full
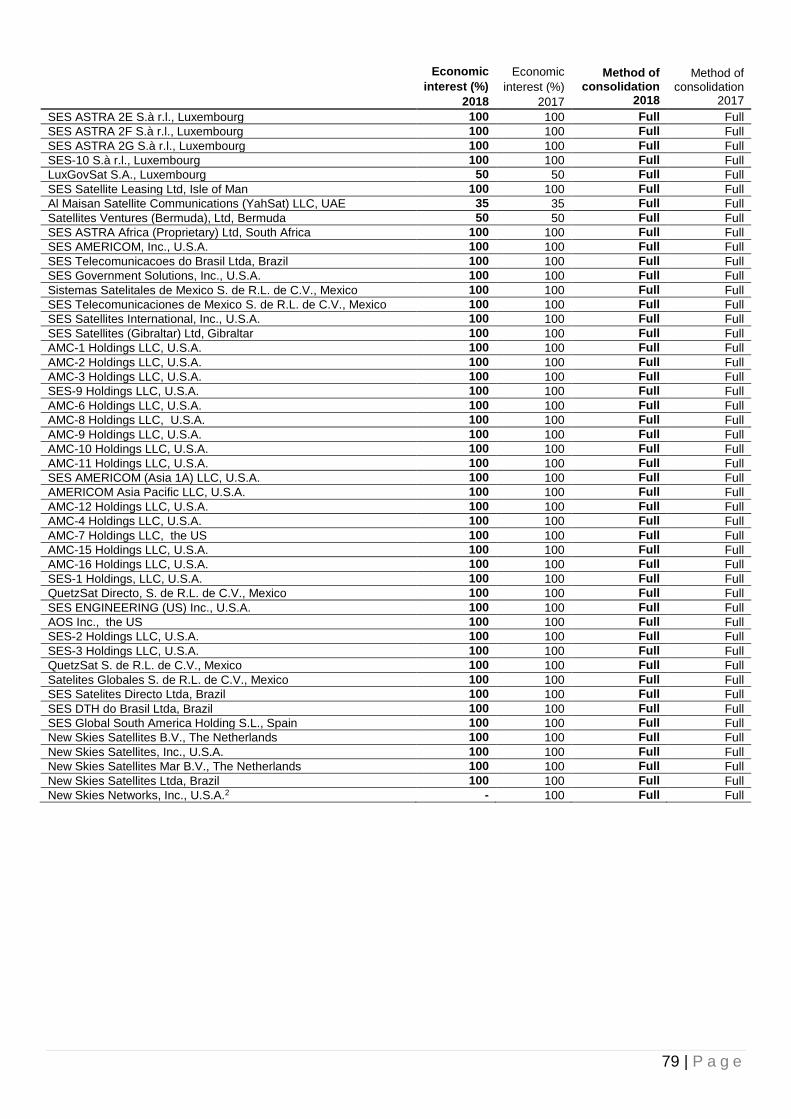
79 | P a g e
Economic Economic Method of consolidation
2018
Method of consolidation
2017
interest (%) interest (%)
2018 2017
SES ASTRA 2E S.à r.l., Luxembourg 100 100 Full Full
SES ASTRA 2F S.à r.l., Luxembourg 100 100 Full Full
SES ASTRA 2G S.à r.l., Luxembourg 100 100 Full Full
SES-10 S.à r.l., Luxembourg 100 100 Full Full
LuxGovSat S.A., Luxembourg 50 50 Full Full
SES Satellite Leasing Ltd, Isle of Man 100 100 Full Full
Al Maisan Satellite Communications (YahSat) LLC, UAE 35 35 Full Full
Satellites Ventures (Bermuda), Ltd, Bermuda 50 50 Full Full
SES ASTRA Africa (Proprietary) Ltd, South Africa 100 100 Full Full
SES AMERICOM, Inc., U.S.A. 100 100 Full Full
SES Telecomunicacoes do Brasil Ltda, Brazil 100 100 Full Full
SES Government Solutions, Inc., U.S.A. 100 100 Full Full
Sistemas Satelitales de Mexico S. de R.L. de C.V., Mexico 100 100 Full Full
SES Telecomunicaciones de Mexico S. de R.L. de C.V., Mexico 100 100 Full Full
SES Satellites International, Inc., U.S.A. 100 100 Full Full
SES Satellites (Gibraltar) Ltd, Gibraltar 100 100 Full Full
AMC-1 Holdings LLC, U.S.A. 100 100 Full Full
AMC-2 Holdings LLC, U.S.A. 100 100 Full Full
AMC-3 Holdings LLC, U.S.A. 100 100 Full Full
SES-9 Holdings LLC, U.S.A. 100 100 Full Full
AMC-6 Holdings LLC, U.S.A. 100 100 Full Full
AMC-8 Holdings LLC, U.S.A. 100 100 Full Full
AMC-9 Holdings LLC, U.S.A. 100 100 Full Full
AMC-10 Holdings LLC, U.S.A. 100 100 Full Full
AMC-11 Holdings LLC, U.S.A. 100 100 Full Full
SES AMERICOM (Asia 1A) LLC, U.S.A. 100 100 Full Full
AMERICOM Asia Pacific LLC, U.S.A. 100 100 Full Full
AMC-12 Holdings LLC, U.S.A. 100 100 Full Full
AMC-4 Holdings LLC, U.S.A. 100 100 Full Full
AMC-7 Holdings LLC, the US 100 100 Full Full
AMC-15 Holdings LLC, U.S.A. 100 100 Full Full
AMC-16 Holdings LLC, U.S.A. 100 100 Full Full
SES-1 Holdings, LLC, U.S.A. 100 100 Full Full
QuetzSat Directo, S. de R.L. de C.V., Mexico 100 100 Full Full
SES ENGINEERING (US) Inc., U.S.A. 100 100 Full Full
AOS Inc., the US 100 100 Full Full
SES-2 Holdings LLC, U.S.A. 100 100 Full Full
SES-3 Holdings LLC, U.S.A. 100 100 Full Full
QuetzSat S. de R.L. de C.V., Mexico 100 100 Full Full
Satelites Globales S. de R.L. de C.V., Mexico 100 100 Full Full
SES Satelites Directo Ltda, Brazil 100 100 Full Full
SES DTH do Brasil Ltda, Brazil 100 100 Full Full
SES Global South America Holding S.L., Spain 100 100 Full Full
New Skies Satellites B.V., The Netherlands 100 100 Full Full
New Skies Satellites, Inc., U.S.A. 100 100 Full Full
New Skies Satellites Mar B.V., The Netherlands 100 100 Full Full
New Skies Satellites Ltda, Brazil 100 100 Full Full
New Skies Networks, Inc., U.S.A.2 - 100 Full Full
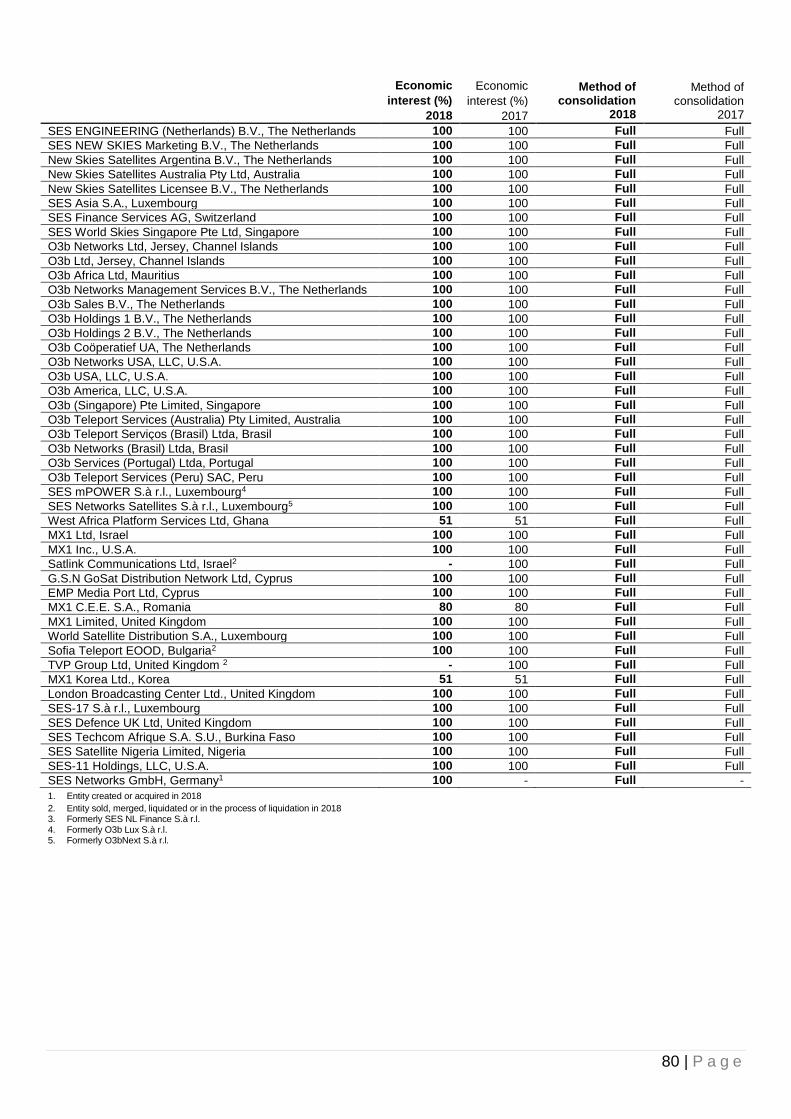
80 | P a g e
Economic Economic Method of consolidation
2018
Method of consolidation
2017
interest (%) interest (%)
2018 2017
SES ENGINEERING (Netherlands) B.V., The Netherlands 100 100 Full Full
SES NEW SKIES Marketing B.V., The Netherlands 100 100 Full Full
New Skies Satellites Argentina B.V., The Netherlands 100 100 Full Full
New Skies Satellites Australia Pty Ltd, Australia 100 100 Full Full
New Skies Satellites Licensee B.V., The Netherlands 100 100 Full Full
SES Asia S.A., Luxembourg 100 100 Full Full
SES Finance Services AG, Switzerland 100 100 Full Full
SES World Skies Singapore Pte Ltd, Singapore 100 100 Full Full
O3b Networks Ltd, Jersey, Channel Islands 100 100 Full Full
O3b Ltd, Jersey, Channel Islands 100 100 Full Full
O3b Africa Ltd, Mauritius 100 100 Full Full
O3b Networks Management Services B.V., The Netherlands 100 100 Full Full
O3b Sales B.V., The Netherlands 100 100 Full Full
O3b Holdings 1 B.V., The Netherlands 100 100 Full Full
O3b Holdings 2 B.V., The Netherlands 100 100 Full Full
O3b Coöperatief UA, The Netherlands 100 100 Full Full
O3b Networks USA, LLC, U.S.A. 100 100 Full Full
O3b USA, LLC, U.S.A. 100 100 Full Full
O3b America, LLC, U.S.A. 100 100 Full Full
O3b (Singapore) Pte Limited, Singapore 100 100 Full Full
O3b Teleport Services (Australia) Pty Limited, Australia 100 100 Full Full
O3b Teleport Serviços (Brasil) Ltda, Brasil 100 100 Full Full
O3b Networks (Brasil) Ltda, Brasil 100 100 Full Full
O3b Services (Portugal) Ltda, Portugal 100 100 Full Full
O3b Teleport Services (Peru) SAC, Peru 100 100 Full Full
SES mPOWER S.à r.l., Luxembourg4 100 100 Full Full
SES Networks Satellites S.à r.l., Luxembourg5 100 100 Full Full
West Africa Platform Services Ltd, Ghana 51 51 Full Full
MX1 Ltd, Israel 100 100 Full Full
MX1 Inc., U.S.A. 100 100 Full Full
Satlink Communications Ltd, Israel2 - 100 Full Full
G.S.N GoSat Distribution Network Ltd, Cyprus 100 100 Full Full
EMP Media Port Ltd, Cyprus 100 100 Full Full
MX1 C.E.E. S.A., Romania 80 80 Full Full
MX1 Limited, United Kingdom 100 100 Full Full
World Satellite Distribution S.A., Luxembourg 100 100 Full Full
Sofia Teleport EOOD, Bulgaria2 100 100 Full Full
TVP Group Ltd, United Kingdom 2 - 100 Full Full
MX1 Korea Ltd., Korea 51 51 Full Full
London Broadcasting Center Ltd., United Kingdom 100 100 Full Full
SES-17 S.à r.l., Luxembourg 100 100 Full Full
SES Defence UK Ltd, United Kingdom 100 100 Full Full
SES Techcom Afrique S.A. S.U., Burkina Faso 100 100 Full Full
SES Satellite Nigeria Limited, Nigeria 100 100 Full Full
SES-11 Holdings, LLC, U.S.A. 100 100 Full Full
SES Networks GmbH, Germany1 100 - Full -
1. Entity created or acquired in 2018
2. Entity sold, merged, liquidated or in the process of liquidation in 2018 3. Formerly SES NL Finance S.à r.l. 4. Formerly O3b Lux S.à r.l. 5. Formerly O3bNext S.à r.l.