serving shoppers a little better every day. · tesco plc annual report and financial statements...
TRANSCRIPT

Tesco PLC Annual Report and Financial Statements 2018
Annual Report and Financial Statements 2018
Serving shoppers a little better every day.

Welcome to our Annual Report.
The screen icon indicates where further information is available online. We have also produced a number of short videos, available at www.tescoplc.com/ar2018.

Contents
Strategic report:Tesco at a glance 1Introduction 2Chairman’s statement 3Group Chief Executive’s statement 4The six strategic drivers 8Our business model and Big 6 KPIs 10Financial review 12Little Helps Plan 16Principal risks and uncertainties 22
Corporate governance:Corporate governance report 26– Chairman’s introduction 26– Board of Directors 28- Executive Committee 30- Governance framework 32- Nominations and Governance Committee 38- Corporate Responsibility Committee 39- Audit Committee 40Directors’ remuneration report 45Directors’ report 65Statement of Directors’ responsibilities 67
Financial statements: Independent auditor’s report to the members of Tesco PLC 68 Group income statement 74 Group statement of comprehensive income/(loss) 75Group balance sheet 76Group statement of changes in equity 77Group cash flow statement 78 Notes to the Group financial statements 79 Tesco PLC – Parent Company balance sheet 132 Tesco PLC – Parent Company statement of changes in equity 133 Notes to the Parent Company financial statements 134 Related undertakings of the Tesco Group 140
Other information:Registered office addresses 146Supplementary information (unaudited) 147Glossary (including APM definitions) 150Five-year record 154Shareholder information 155
As a leading retailer, our 440,000(a) colleagues serve around 80 million customers every week, in more than 6,800(b) stores and online.
£51.0bn∆(c)
Group sales(2016/17: £49.9bn)
+795.2% +62.7% +>100% +21.7%
+2.3% +2.8% +28.4% +80.6%
29.6%down
£1,298m(c)
Statutory profit before tax(2016/17: £145m)
£2,773m∆
Retail operating cash flow(2016/17: £2,278m)
£57.5bn(c)
Statutory revenue (2016/17: £55.9bn)
11.88p∆(c)
Diluted EPS pre-exceptional items, IAS 19 finance costs and IAS 39 fair value remeasurements (2016/17: 7.30p)
3.0pDividend per share(2016/17: 0.0p)
£1,644m∆(c)
Group operating profit before exceptional items (2016/17: £1,280m)
12.08p(c)
Statutory diluted EPS (2016/17: 0.81p)
£1,837m(c)
Operating profit (2016/17: £1,017m)
£(2.6)bn∆(d)
Net debt(2016/17: £(3.7)bn)
∆ Alternative performance measures (APM)Measures with this symbol ∆ are defined in the Glossary section of the Annual Report on pages 150 to 153.(a) Based on an actual year-end headcount.(b) Includes franchise stores.(c) Reported on a continuing operations basis.(d) Excludes the net debt of Tesco Bank.
1Tesco PLC Annual Report and Financial Statements 2018
Strategic report
Tesco at a glance
•73538_Tesco_AR18_Text pages_Bk_180420_HR.indb 1 20/04/2018 15:42

With our turnaround firmly on track, we continue to deliver value for every stakeholder in our business.
We have taken important decisions to help our customers through the year – from reformulating thousands of products to reduce salt, fat and sugar, to launching great value exclusive food brands.
Thanks to these efforts, our offer is more competitive, and more customers are shopping at Tesco as a result.
At the same time, we are also focused on new opportunities for growth. Most significantly, our merger with Booker allows us to become the UK’s leading food business.
This report sets out what we have achieved in the year, and gives an update on our medium-term ambitions – our six strategic drivers.
We are making strong progress, and firmly believe that by serving shoppers a little better every day, the momentum in our business will continue.
Serving shoppers a little better every day.
Tesco PLC Annual Report and Financial Statements 20182
Introduction
•73538_Tesco_AR18_Text pages_Bk_180420_HR.indb 2 20/04/2018 15:42
Following completion of the merger, I am delighted to welcome two new Directors to the Board: Charles Wilson and Stewart Gilliland.
Charles has been appointed to the role of CEO for our retail and wholesale operations in the UK & ROI, while Stewart has joined the Board as a Non-executive Director.
Both Charles and Stewart bring substantial levels of experience and expertise, and I know that our business will benefit greatly from their talents.
I would also like to take the opportunity here to welcome the very many new shareholders in Tesco, who took up our shares as part of the merger. I look forward to meeting many of you over the coming months, and to hearing your views.
Throughout the year, the Board has dedicated significant time to overseeing the merger process, as well as continuing its close involvement in matters of strategy.
The Board has also supported the development of our corporate responsibility strategy for the Group, which culminated in the launch of the Little Helps Plan in October 2017.
The plan sets out how we will make a positive contribution to our colleagues, customers and communities – as a sustainable business that also takes a lead on issues of societal importance, such as health and tackling food waste. More details on the Little Helps Plan, and the commitments we have made, can be found starting on page 16 of the Strategic report.
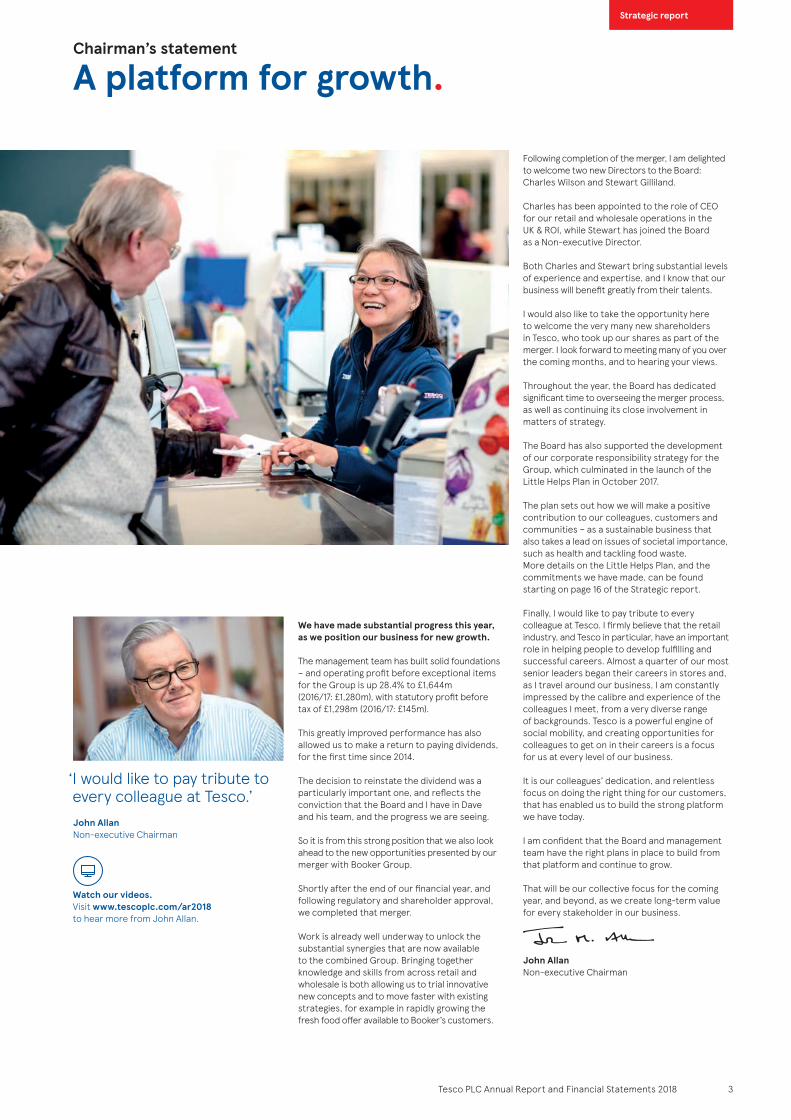
Finally, I would like to pay tribute to every colleague at Tesco. I firmly believe that the retail industry, and Tesco in particular, have an important role in helping people to develop fulfilling and successful careers. Almost a quarter of our most senior leaders began their careers in stores and, as I travel around our business, I am constantly impressed by the calibre and experience of the colleagues I meet, from a very diverse range of backgrounds. Tesco is a powerful engine of social mobility, and creating opportunities for colleagues to get on in their careers is a focus for us at every level of our business.
It is our colleagues’ dedication, and relentless focus on doing the right thing for our customers, that has enabled us to build the strong platform we have today.
I am confident that the Board and management team have the right plans in place to build from that platform and continue to grow.
That will be our collective focus for the coming year, and beyond, as we create long-term value for every stakeholder in our business.
John AllanNon-executive Chairman
We have made substantial progress this year, as we position our business for new growth.
The management team has built solid foundations – and operating profit before exceptional items for the Group is up 28.4% to £1,644m (2016/17: £1,280m), with statutory profit before tax of £1,298m (2016/17: £145m).
This greatly improved performance has also allowed us to make a return to paying dividends, for the first time since 2014.
The decision to reinstate the dividend was a particularly important one, and reflects the conviction that the Board and I have in Dave and his team, and the progress we are seeing.
So it is from this strong position that we also look ahead to the new opportunities presented by our merger with Booker Group.
Shortly after the end of our financial year, and following regulatory and shareholder approval, we completed that merger.
Work is already well underway to unlock the substantial synergies that are now available to the combined Group. Bringing together knowledge and skills from across retail and wholesale is both allowing us to trial innovative new concepts and to move faster with existing strategies, for example in rapidly growing the fresh food offer available to Booker’s customers.
‘ I would like to pay tribute to every colleague at Tesco.’John AllanNon-executive Chairman
A platform for growth.
Watch our videos. Visit www.tescoplc.com/ar2018 to hear more from John Allan.
Strategic report
Tesco PLC Annual Report and Financial Statements 2018 3
Chairman’s statement
•73538_Tesco_AR18_Text pages_Bk_180420_HR.indb 3 20/04/2018 15:42

This has been another significant year for our business.
After three years of turnaround, the results we’ve shared for this year show that we are firmly on track, and delivering on our commitments. I am pleased with the progress we have made, and excited by the opportunities ahead.
We have seen nine consecutive quarters of sales growth in our core UK business, with Group sales up 2.3% for the year. Group operating profit before exceptional items is up 28.4% to £1,644m (2016/17: £1,280m), and we are generating more cash – with Retail operating cash flow up 21.7% to £2.8bn (2016/17: £2.3bn).
We are also making good progress towards the margin ambition we set out in October 2016, with Group operating margin reaching 3.0% in the second half of the year. At the same time, we have strengthened our balance sheet, with Net debt down 29.6% to £2.6bn (2016/17: £3.7bn).
The external environment remains challenging: consumers are feeling the impact of economic uncertainty, and the pressures I described in last year’s Annual Report, such as business rates in the UK and competitive market conditions in Central Europe, have not eased.
However, the journey we are on to simplify and grow our business puts us in a strong position to deal with these challenges. By keeping our focus, we are creating value for our customers, colleagues, suppliers and shareholders.
CustomersWe are helping customers in the areas that matter most to them, and bringing them more sustainable, affordable, healthy food.
As a result, our net promoter score has increased by 5 points as more customers recommend Tesco as a place to shop; loyalty is growing, and in the UK 260,000 more shoppers are shopping at Tesco.
In the first half of the year, we took a strategic decision to protect our customers and hold back the inflationary pressure we were seeing in the rest of the UK market.
We’ve also looked at other ways to add value for our customers, with a series of little helps through the year, including:
– covering the cost of the ‘tampon tax’ on women’s sanitary products in the UK;
– removing barriers to eating healthily with our ‘little helps to healthier living’ campaign in the UK, and taking 4,100 tonnes of sugar out of our Own Brand soft drinks in Central Europe;
– launching our Clubcard app in Thailand, making it easier for customers to manage their points;
– passing on an interest rate increase to savers at Tesco Bank, following the Bank of England’s base rate rise in November; and
– running regular ‘Weekly Little Helps’ in the UK, helping customers save money on everything from fresh food to fuel.
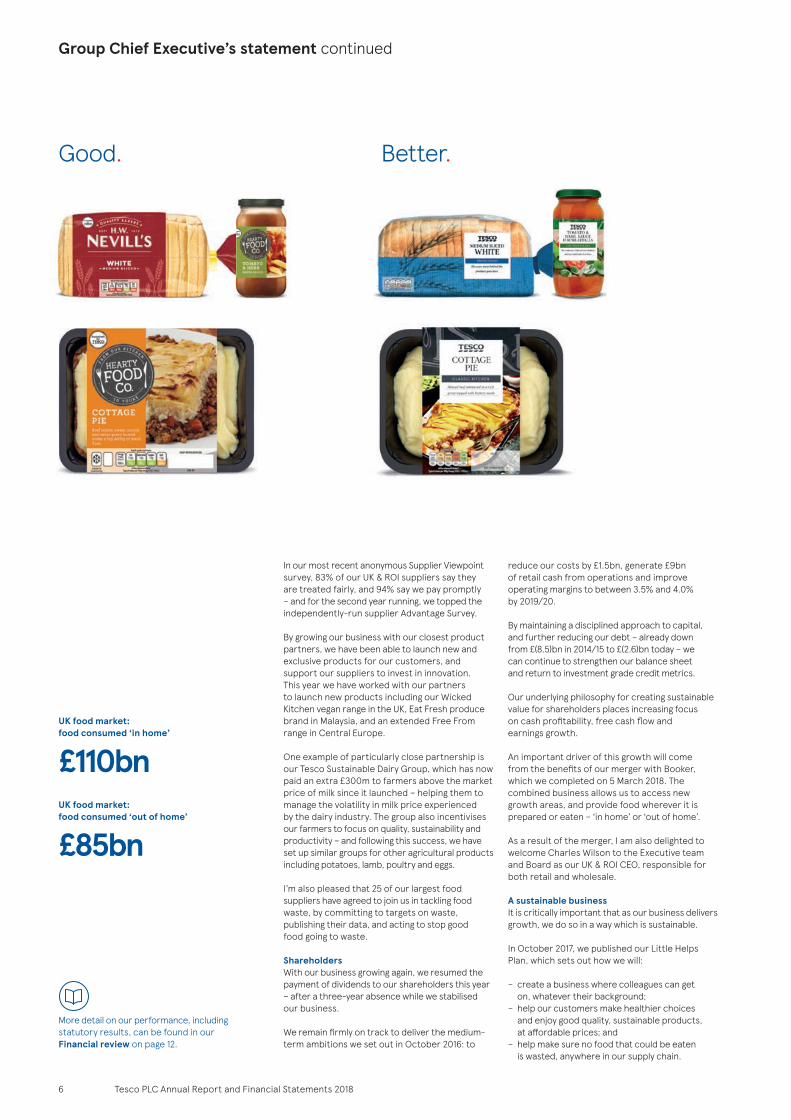
As a business with food at our heart, improving our Own Brand food ranges is a particularly important part of our plans. This year we have relaunched many of these ranges – bringing our customers the best quality products at the very best prices.
We have looked at each of the three tiers of our Own Brand offer – ‘good’, ‘better’ and ‘best’ – and are strengthening some brands, like our Tesco core range, and redesigning others, like Tesco finest*. Where our customers want the best value, without any compromise on quality, we are adding to our range of entry-level brands that are exclusively available at Tesco.
New brands we have launched for Tesco customers include prepared meals, pasta and sauces from the Hearty Food Co. and bakery products from H. W. Nevill’s. As part of this work, we have already relaunched 1,300 products in the year, with thousands more to follow – and our brand perception measures of quality and value have both increased.
ColleaguesThe improvements we are making to our business are driven by our colleagues, as they serve our shoppers a little better every day.
This year, we announced a 10.5% increase in hourly pay for our UK store colleagues over the next two years, and our Colleague Bonus Plan continues to reward colleagues in the UK for their contribution to our turnaround.
‘ I’m pleased with the progress we have made, and excited by the opportunities ahead.’Dave LewisGroup Chief Executive
Delivering on our commitments.
Watch our videos. Visit www.tescoplc.com/ar2018 to hear more from Dave Lewis.
Tesco PLC Annual Report and Financial Statements 20184
Group Chief Executive’s statement
•73538_Tesco_AR18_Text pages_Bk_180420_HR.indb 4 20/04/2018 15:42

Some of the changes we have made to simplify our business have had a significant impact on colleagues, including the closure of our Customer Engagement Centre in Cardiff, and changes to our operational structures in stores, and I am grateful for the professionalism and integrity of our colleagues at these difficult times.
Over the summer, we also began to move to a new service model in our offices in the UK, followed by similar changes in Central Europe, in order to simplify the way we organise ourselves, reduce duplication and cost, and invest in serving shoppers better.
In a simpler business, it’s particularly important that we still do everything we can to help colleagues develop their careers as they wish, and this year we have continued our apprenticeship programme in the UK, as well as running a Career Academy in our Thai business, for around 150 students.
We’re also committed to building a team which is diverse, and reflects the communities we serve. We continue to develop an inclusive culture at every level of our organisation, helping our colleagues with the flexibility, skills and reward they need to get on.
SuppliersWith our suppliers, we are building even closer partnerships, working together to deliver great quality products for our customers and grow our mutual businesses.
Strategic report
Tesco PLC Annual Report and Financial Statements 2018 5
•73538_Tesco_AR18_Text pages_Bk_180420_HR.indb 5 20/04/2018 15:42
In our most recent anonymous Supplier Viewpoint survey, 83% of our UK & ROI suppliers say they are treated fairly, and 94% say we pay promptly – and for the second year running, we topped the independently-run supplier Advantage Survey. By growing our business with our closest product partners, we have been able to launch new and exclusive products for our customers, and support our suppliers to invest in innovation. This year we have worked with our partners to launch new products including our Wicked Kitchen vegan range in the UK, Eat Fresh produce brand in Malaysia, and an extended Free From range in Central Europe. One example of particularly close partnership is our Tesco Sustainable Dairy Group, which has now paid an extra £300m to farmers above the market price of milk since it launched – helping them to manage the volatility in milk price experienced by the dairy industry. The group also incentivises our farmers to focus on quality, sustainability and productivity – and following this success, we have set up similar groups for other agricultural products including potatoes, lamb, poultry and eggs.
I’m also pleased that 25 of our largest food suppliers have agreed to join us in tackling food waste, by committing to targets on waste, publishing their data, and acting to stop good food going to waste.
ShareholdersWith our business growing again, we resumed the payment of dividends to our shareholders this year – after a three-year absence while we stabilised our business.
We remain firmly on track to deliver the medium-term ambitions we set out in October 2016: to
reduce our costs by £1.5bn, generate £9bn of retail cash from operations and improve operating margins to between 3.5% and 4.0% by 2019/20.
By maintaining a disciplined approach to capital, and further reducing our debt – already down from £(8.5)bn in 2014/15 to £(2.6)bn today – we can continue to strengthen our balance sheet and return to investment grade credit metrics.
Our underlying philosophy for creating sustainable value for shareholders places increasing focus on cash profitability, free cash flow and earnings growth.
An important driver of this growth will come from the benefits of our merger with Booker, which we completed on 5 March 2018. The combined business allows us to access new growth areas, and provide food wherever it is prepared or eaten – ‘in home’ or ‘out of home’.
As a result of the merger, I am also delighted to welcome Charles Wilson to the Executive team and Board as our UK & ROI CEO, responsible for both retail and wholesale.
A sustainable businessIt is critically important that as our business delivers growth, we do so in a way which is sustainable.
In October 2017, we published our Little Helps Plan, which sets out how we will:
– create a business where colleagues can get on, whatever their background;
– help our customers make healthier choices and enjoy good quality, sustainable products, at affordable prices; and
– help make sure no food that could be eaten is wasted, anywhere in our supply chain.
More detail on our performance, including statutory results, can be found in our Financial review on page 12.
Good. Better.
UK food market: food consumed ‘in home’
£110bnUK food market: food consumed ‘out of home’
£85bn
Tesco PLC Annual Report and Financial Statements 20186
Group Chief Executive’s statement continued
•73538_Tesco_AR18_Text pages_Bk_180420_HR.indb 6 20/04/2018 15:42

We have made good progress in all of these areas this year, and you can read more on pages 16 to 21 of this report.
I’m particularly proud of our efforts to stop good food going to waste – in the UK we have donated 19 million meals from surplus this year to help feed people in need, with a further 2 million and 25 million meals from our businesses in the Republic of Ireland and Central Europe respectively.
Looking ahead With our business focused on growth, we will continue to deliver on the same plans for Tesco – our six strategic drivers – that have served us well in our turnaround so far.
At the same time, we will begin to deliver the substantial synergies that our merger with Booker unlocks: bringing benefits to consumers and colleagues, creating a wider market opportunity for our suppliers and new career opportunities for our colleagues – as well as accelerating the growth of our combined business for shareholders.
In what has been a very significant year, I am grateful to every colleague in our business for everything they have done to keep serving shoppers better.
It is their dedication and talent which drives all of our plans, and I look forward to continuing our work together as we grow the UK’s leading food business.
Dave LewisGroup Chief Executive
For example, our trial of a new Chef Central format is well underway, with a first store in Bar Hill, Cambridge selling products in bulk to professional caterers and the public alongside our existing Tesco Extra store. And, where it’s right for our customers, we are offering catering-format products in a number of Tesco stores too.
These are just the early stages of the many exciting opportunities in front of us. As we look ahead, our combination of businesses uniquely positions us to better serve the large and growing food market in the UK.
The combined Tesco and Booker business allows us to bring together the retail and wholesale expertise of our two businesses, and access new opportunities for growth.
Together we employ over 310,000 colleagues in the UK, serve 117,000 independent retailers, 441,000 catering businesses, 641,000 small businesses, and work with over 7,000 suppliers.
Through our merger, we will bring benefits to customers, suppliers, colleagues and shareholders:
– We will delight consumers with better availability of quality food at attractive prices across retail and eating out locations, and serve better the faster growing ‘out of home’ food market.
– We will help independent retailers, caterers and small businesses by further improving choice, price and service, with enhanced digital and delivery service options.
– And for our suppliers, we will create a broader market opportunity, with strong growth prospects and a clear opportunity to develop better own brand and fresh ranges.
As our two businesses join forces, we are already beginning to deliver benefits. Importantly, there is no lengthy integration process, as we want to keep the complementary skills of retail and wholesale in our business, and start accessing growth opportunities as quickly as possible.
Best. Tesco and Booker merger.
Strategic report
Tesco PLC Annual Report and Financial Statements 2018 7
•73538_Tesco_AR18_Text pages_Bk_180420_HR.indb 7 20/04/2018 15:42

1.A differentiated brandA strong and differentiated brand creates long-term value for every stakeholder in our business. Our purpose, to serve shoppers a little better every day, is at the heart of what our brand stands for.
Over the last year, we have continued to build trust, and have seen a 5 point improvement in customer recommendations of our brand. We continue to focus on products and services
which make the Tesco offer unique, and this year we have relaunched our core and finest* food ranges, as well as introducing new brands which are exclusive to Tesco, such as our Hearty Food Co. ready meals, and our Fox & Ivy homeware.
Food quality is a particularly powerful driver of supermarket choice, so strengthening customer perceptions of our food is a priority. Our Food Love Stories campaign has continued this year, celebrating the food our customers love to make, for the people they love – and helping increase customer perceptions of quality at Tesco, up 2.7 points year-on-year.
But the way customers feel about our brand is defined by more than just our products: it’s also about how we respond to the issues that matter to them, from healthy eating to reducing plastic packaging – and the value that Tesco creates for society.
In May 2017, we held our first ever health month for colleagues and customers, including helpful ‘little swaps’ with products that are lower in saturated fat, salt and sugar, and recorded our highest ever score for customers saying that Tesco helps them lead healthier lives.
2.Reduce operating costs by £1.5bnWe continue to simplify our business and reduce costs, with in-year savings of £594m – and £820m of savings to date towards our £1.5bn ambition.
We have reviewed every aspect of our operation to identify opportunities for savings – with a particular focus on our store operating model, where we have delivered £541m of savings; logistics and distribution, with £104m of savings; and goods not for resale, where we have made savings of £174m.
We continue to encourage a cost-conscious culture, finding savings so that we can reinvest for the benefit of customers.
We have also simplified the shopping experience for customers, at the same time as reducing costs, for example by increasing availability of our Scan As You Shop self-scan handsets – now in over 500 UK stores and beginning to roll out in Central Europe – and making till receipts optional in our smaller stores, which has generated savings of around £3m.
We have also made strong progress in reducing the costs of procuring goods and services not for resale, finding synergies across the Group. In particular, we have improved our services in facilities management, freight and media services, while also delivering savings of £50m.
3.Generate £9bn cash from operationsOur focus on free cash generation continues, and Retail cash generated from operations increased by £495m to £2,773m this year, driven by improved profitability and strong working capital management.
One example of our work is in reducing stockholding, by improving the way we receive deliveries from our suppliers.
To minimise our environmental impact, and reduce transport costs, we order full trucks of products from suppliers whenever we can – which sometimes means ‘rounding up’ an order.
However, by analysing our orders forensically, we have been able to sort stock between trucks and identify where we can eliminate a truck. This removes unnecessary journeys for our suppliers, and allows us to take out unnecessary ‘rounded’ stock.
Because we are ordering only what’s needed to ensure great availability, our customers can buy what they want, and we can order less.
Our six strategic drivers will create long-term value for all of our stakeholders.
An update on our six strategic drivers.
Tesco PLC Annual Report and Financial Statements 20188
The six strategic drivers
•73538_Tesco_AR18_Text pages_Bk_180420_HR.indb 8 20/04/2018 15:42

4.Maximise the mix to achieve a 3.5% - 4.0% marginTo achieve our 3.5% - 4.0% margin ambition by our 2019/20 financial year, we continue to build sustainable profitability across our businesses, channels and product ranges. By carefully managing the combination of volume, mix and cost-effectiveness in our business, Group operating margin for this year was 2.9% – up 57 basis points.
In Asia, our margin has grown to 6.0%, as we have stepped back from unprofitable bulk selling in Thailand. This was a deliberate decision that we took at the start of the year, allowing us to focus on serving our core retail customers better, and increase profitability.
In our online business, we are improving the economics of our offer, while giving customers greater choice and flexibility. For example, we have extended our delivery saver subscription service, to introduce new monthly plans – offering a great value option to our most loyal customers. We have also extended our Click & Collect options – including same-day collection – with slots at a range of prices so that customers can choose the service most convenient to them.
5.Maximise value from propertyOur property portfolio across the Group is significant, and we are looking at opportunities to better use our space for the benefit of customers, while also releasing value where it’s the right thing to do for our business.
Over the last three years, we have released a cumulative £1.4bn of value from property proceeds, at the same time as increasing our proportion of freehold property in the UK & ROI from 41% to 52%.
In the UK, we are exploring a small number of opportunities to work with a third-party to re-develop our store sites in high-value locations. Our Hackney store in London is one such example, where we have sold the site for a mixed-use development – allowing us to release value, while still retaining a store on the new site and with continuity of trade throughout.
We can also create value for our customers by using space in new ways, as we repurpose space in our larger stores – and this year, we have repurposed 1.1m sq. ft. of space. In Central Europe, we have worked with partners to bring a new offer to customers in a number of our stores – and this year, across the region, we opened ten shop units with H&M, and three with Decathlon.
6.Innovation
To serve our shoppers a little better every day, it’s important we listen and respond to their needs, with innovation across every aspect of our offer, and a strong pipeline of ideas to come to market.
We have innovated in our product ranges – for example, with the launch of our exclusive Wicked Kitchen range of plant-based dishes, including new ingredients and exotic preparations such as carrot ‘pastrami’ and eryngii mushroom ‘bolognese’. The range responds to increasing demand for vegetarian and vegan food, and since its January launch has proved extremely popular with customers.
As customers look for increasingly convenient options to do their shopping, this year we became the first retailer in the UK to offer same-day grocery deliveries nationwide, and in London – through our Tesco Now app – we can deliver within an hour.
And at Tesco Bank, our award-winning Tesco Pay+ digital wallet continues to prove popular with customers, with over 450,000 downloads of the app.
9Tesco PLC Annual Report and Financial Statements 2018
Strategic report
•73538_Tesco_AR18_Text pages_Bk_180420_HR.indb 9 20/04/2018 15:42

CustomersTesco exists to serve customers –
listening to them and acting on what is most important, however they
choose to shop with us.
ProductWe build close and mutually-beneficial
relationships with our supplier partners, to source the best possible
products that meet and anticipate customers’ needs.
ReinvestOur focus is always on making Tesco the best it can be for our customers.
The better a job we do for customers, the more we will improve sales; the
more our sales improve, the more we can reinvest in further improving
the shopping trip.
ChannelsTo bring the best products to
customers we work through a range of channels – from small shops to large shops, and our online business. Booker
gives us access to new channels, including Business Centres and
delivered wholesale.
Our business is organised around the three pillars of Customers, Product and Channels, and we measure our progress with six simple key performance indicators.
Customers, Product, Channels.
Tesco PLC Annual Report and Financial Statements 201810
Our business model and Big 6 KPIs
•73538_Tesco_AR18_Text pages_Bk_180420_HR.indb 10 20/04/2018 15:42

2016/17 2017/18
-1.6pts
2016/17 2017/18
+0pts
2016/17 2017/18
+5pts
2016/17 2017/18
+25.9%
2016/17 2017/18
+0.6%
2016/17 2017/18
+21.7%
Grow sales Customers recommend us and come back time and again
Deliver profit Colleagues recommend us as a great place to work and shop
Improve operating cash flow We build trusted partnerships
Alternative performance measures (APM)Measures with this symbol ∆ are defined in the Glossary section of the Annual Report on pages 150 to 153.
(a) Reported on a continuing operations basis (excludes Turkey). Growth is at constant exchange rates, on a comparable days basis.(b) Reported on a continuing operations basis (excludes Turkey). Growth is at actual exchange rates.(c) Net Promoter Score (NPS) equals ‘fans’ (those scoring 9-10 out of 10) minus ‘critics’ (those scoring 0-6) on an 11 point scale question of 0-10.(d) Based on our internal ‘What Matters To You?’ survey. Chart shows the movement in ‘Great place to work’.(e) Based on the question “Overall, how satisfied are you with your experience of working with Tesco?” in our Supplier Viewpoint survey.
£51.0bn∆(a)
Group sales (2016/17: £49.9bn)
£1,644m∆
Group operating profit before exceptional items(a)
(2016/17: £1,280m)
12ptsGroup net promoter score(c)
(2016/17: 7pts)
£2,773m∆
Retail operating cash flow(b)
(2016/17: £2,278m)
74.9%Group supplier satisfaction(e) (2016/17: 77%)
83%Great place to work(d) (2016/17: 83%)
49ptsGreat place to shop(c)
(2016/17: 48pts)
Group sales continue to grow, with Q4 2017/18 marking our ninth consecutive quarter of like-for-like sales growth for the Group.
Retail operating cash flow increased by £495m in the year, mainly driven by improved Group profitability.
Group operating profit before exceptional items increased by 25.9% at constant exchange rates, with Group operating margin reaching 3.0% in the second half of the year.
Customer feedback continues to improve, reflecting our work to serve shoppers a little better every day.
We are committed to strong partnerships with our suppliers, built on open, fair and transparent relationships. Our supplier feedback score remains at a high level, despite inflationary challenges.
Every day our colleagues go the extra mile to serve our shoppers better, and more colleagues are recommending Tesco as a great place to shop.
11Tesco PLC Annual Report and Financial Statements 2018
Strategic report
•73538_Tesco_AR18_Text pages_Bk_180420_HR.indb 11 20/04/2018 15:42

Group results 2017/18
52 weeks ended 24 February 2018
On a continuing operations basis 2017/18 2016/17
Year-on-year change
(Constant exchange
rates)
Year-on-year change(Actual
exchange rates)
Group sales (exc. VAT, exc. fuel)(a)
£50,991m £49,867m 0.6% 2.3%
Fuel £6,500m £6,050m 7.1% 7.4%Revenue (exc. VAT, inc. fuel)
£57,491m £55,917m 1.3% 2.8%
Group operating profit before exceptional items(b)
£1,644m £1,280m 25.9% 28.4%
UK & ROI £1,053m £803m 30.3% 31.1%Central Europe £119m £58m 89.7% 105.2%Asia £299m £262m 7.6% 14.1%Tesco Bank £173m £157m 10.2% 10.2%Include exceptional items
£193m £(263)m
Group operating profit £1,837m £1,017m 76.6% 80.6%Group profit before tax before exceptional items, IAS 19 finance costs and IAS 39 fair value remeasurements
£1,282m £781m 64.1%
Group statutory profit before tax
£1,298m £145m 795.2%
Diluted EPS before exceptional items, IAS 19 finance costs and IAS 39 fair value remeasurements
11.88p 7.30p
Diluted EPS 12.08p 0.81pBasic EPS 12.12p 0.81pDividend per share 3.0p –Capex(c) £1.1bn £1.2bnNet debt(d)(e) £(2.6)bn £(3.7)bnCash generated from retail operations(d)
£2.8bn £2.3bn
(a) Group sales exclude VAT and fuel. Sales growth shown on a comparable days basis.(b) Excludes exceptional items by virtue of their size and nature in order to reflect
management’s view of the performance of the Group.(c) Capex is shown excluding property buybacks.(d) Net debt and retail operating cash flow exclude the impact of Tesco Bank, in order
to provide further analysis of the retail cash flow statement.(e) Net debt includes both continuing and discontinued operations.
The definition and purpose of the Group’s alternative performance measures, which includes like-for-like sales, are defined on pages 150 to 153. A detailed analysis of discontinued operations can be found in Note 7.
This was another strong performance for Tesco with results ahead of expectations. We grew sales by 0.6%, excluding VAT, excluding fuel, at constant exchange rates and experienced like-for-like sales growth of 0.7%. Group operating profit before exceptional items was £1,644m, up 28.4% on last year as we significantly strengthened our profitability, remaining firmly on track to deliver our medium-term ambitions. Our statutory profit before tax increased to £1,298m including £155m of exceptional items. We generated retail operating cash flow of £2.8bn, up 21.7% on last year, driven by the strong improvement in our operating profit. We reduced net debt (excluding Tesco Bank) by 29.6% to £(2.6)bn.
We are well placed to deliver our ambition of a Group operating margin of 3.5%-4.0% by the 2019/20 financial year. This ambition is underpinned by six strategic drivers, including the £1.5bn operating cost reductions which we are on track to secure, having delivered cumulative savings of £820m to date.
Reflecting our improved performance and confidence in future prospects, the Board has proposed the payment of a 2.0 pence per share final dividend following on from the interim dividend of 1.0 pence per share. We expect dividends to grow towards a target cover of around two times earnings per share over the medium term.
Segmental resultsUK & ROI
On a continuing operations basis 2017/18 2016/17
Year-on-year change
(Constant exchange
rates)
Year-on-year change(Actual
exchange rates)
Sales (exc. VAT, exc. fuel)
£38,650m £37,692m 2.2% 2.5%
Like-for-like sales (exc. VAT, exc. fuel)
2.3% 0.9%
Revenue (exc. VAT, inc. fuel)
£44,908m £43,524m
Revenue includes: fuel £6,258m £5,832mOperating profit before exceptional items
£1,053m £803m 30.3% 31.1%
Operating profit margin before exceptional items
2.34% 1.84% 49bp 50bp
Operating profit £1,199m £519m
In the UK and the Republic of Ireland (ROI), like-for-like sales grew by 2.3%. In the UK, like-for-like sales growth of 2.2% includes our ninth consecutive quarter of positive performance, despite an ongoing drag of (0.4)% from general merchandise as we take action to de-emphasise certain categories. We delivered a consistently strong performance in fresh food, outperforming the market in volume terms. During the fourth quarter we experienced some distribution-related disruption, following the administration of Palmer & Harvey, resulting in lost tobacco sales across December. Despite these challenges, which are now behind us, we continued to deliver positive sales momentum through the fourth quarter.
Market conditions have remained challenging with continued cost price inflation. We have worked hard with our supplier partners throughout the year to mitigate price increases wherever possible, and made a significant investment in the first half to further hold back inflation and protect customers. We have continued to reduce promotional participation over the year, focusing instead on consistently offering the best value for customers on all of our products.
Our own brand ranges have performed very well, with like-for-like sales growing 4.2% year-on-year. We have embarked on a re-launch of over 10,000 own brand products, across our entry, core and finest* ranges, with the initial focus on ready meals and Italian products. Our new, exclusive Hearty Food Co. range of ready meals and improved core Tesco products have proved particularly popular, contributing to an increase in overall own brand participation of nearly one percent. We have continued to refine our general merchandise range, reducing SKUs by 16%, as we focus on categories with more sustainable profitability. We have delivered 2.7% sales growth in our home category, following the launch of our new own brand Go Cook and Fox & Ivy ranges. These new brands have driven a 14% and 20% increase in customers to our cook and homeware ranges, respectively. Clothing performed well during the year with like-for-like sales growth of 2.6%, reflecting the strength of the F&F brand and quality of our range.
All store formats and channels have achieved like-for-like growth, with our large store business growing at 1.9% and our online grocery sales growing 5.1% with both higher order numbers and increased average basket size.
In ROI, like-for-like sales grew by 2.7%, improving steadily throughout the year as customers responded well to an even more competitive price position. The main driver of growth was a 4.2% increase in volume, ahead of market volume growth. Fresh food volumes were particularly strong, growing by 5.2% year-on-year.
Another year of strong progress.
Visit www.tescoplc.com/ar2018 to find PDF and Excel downloads of our financial statements.
‘ This was another strong performance for Tesco, with profits ahead of expectations and a solid improvement in cash generation.’Alan Stewart Chief Financial Officer
Tesco PLC Annual Report and Financial Statements 201812
Financial review
•73538_Tesco_AR18_Text pages_Bk_180420_HR.indb 12 20/04/2018 15:42

Our full-year UK & ROI operating profit before exceptional items was £1,053m, up 31.1% on last year. Our efforts to reduce operating costs and improve efficiencies across our store estate and head office have delivered a significant increase in profitability, particularly during the second half when our operating margin reached 2.5%, up 67 basis points year-on-year. Further progress on maximising the mix within our business and driving volume more selectively, particularly in general merchandise, has aided margin expansion.
Central Europe
On a continuing operations basis 2017/18 2016/17
Year-on-year change
(Constant exchange
rates)
Year-on-year change(Actual
exchange rates)
Sales (exc. VAT, exc. fuel)
£6,343m £5,977m (1.6)% 6.1%
Like-for-like sales (exc. VAT, exc. fuel)
0.3% 0.9%
Revenue (exc. VAT, inc. fuel)
£6,585m £6,195m
Revenue includes: fuel £242m £218mOperating profit before exceptional items
£119m £58m 89.7% 105.2%
Operating profit margin before exceptional items
1.81% 0.94% 86bp 87bp
Operating profit £212m £190m
In Central Europe, like-for-like sales increased by 0.3% despite competitive market conditions. Our focus on improving the quality and breadth of the range in our stores has delivered positive results with fresh food sales growth of 1.2%. However, this growth was held back by declines in general merchandise and clothing. Our convenience formats delivered positive like-for-like growth across all countries. We have continued to exit from unprofitable stores in the region, with 28 store closures contributing to an overall sales reduction of (1.6)% at constant exchange rates. Legislative changes in the region are affecting our business, with Poland phasing in a gradual ban on Sunday trading from March 2018, which takes complete effect by 2020.
Central Europe operating profit before exceptional items was £119m, up £61m year-on-year at actual exchange rates. We have made continued progress towards operating the four markets we serve as one combined region, helping to improve our customer offer. In the first half of the year we opened a new distribution centre in Galánta, Slovakia serving all four countries and benefiting from the best local practices in the region. The resulting benefits of more effective stock management combined with our other efforts on cost savings have more than offset the impact of inflation on the cost base and enabled us to improve profitability.
Asia
On a continuing operations basis 2017/18 2016/17
Year-on-year change
(Constant exchange
rates)
Year-on-year change(Actual
exchange rates)
Sales (exc. VAT, exc. fuel)
£4,947m £5,186m (9.4)% (4.4)%
Like-for-like sales (exc. VAT, exc. fuel)
(10.0)% 1.8%
Revenue (exc. VAT, inc. fuel)
£4,947m £5,186m
Revenue includes: fuel – –Operating profit before exceptional items
£299m £262m 7.6% 14.1%
Operating profit margin before exceptional items
6.04% 5.04% 96bp 99bp
Operating profit £277m £231m
In Asia, our previously announced decision to withdraw from unprofitable bulk selling activities in Thailand and scale back mass couponing contributed to a (10.0)% decline in like-for-like sales. Adjusting for this impact, underlying like-for-like sales in the region were down (1.0)%, largely reflecting the deflationary effect of lowering our fresh food prices for customers.
Asia operating profit before exceptional items was £299m, up 7.6% at constant exchange rates and up 14.1% at actual exchange rates. This improvement has been driven by refocusing on our core retail offer and continuing to reduce our cost base as part of the Group’s overall cost savings programme.
Tesco Bank
2017/18 2016/17Year-on-year
changeRevenue £1,051m £1,012m 3.9%Operating profit before exceptional items
£173m £157m 10.2%
Operating profit £149m £77m 93.5%Lending to customers £11,522m £9,961m 15.7%Customer deposits £9,245m £8,463m 9.2%Net interest margin 3.9% 4.0% (0.1)%Risk asset ratio 19.3% 20.0% (0.7)%
Tesco Bank celebrated twenty years of serving Tesco shoppers this year. Throughout the year, the Bank has continued to strengthen its product and service offering to customers, delivering growth of 4.1% in active customer account numbers across its primary products. During the year, we completed the roll-out of Tesco Pay+, the Group’s digital wallet offering, to every one of our stores in the UK. In July 2017, we celebrated the fifth anniversary of the launch of our mortgage product, which has now reached £3.0bn in balances.
Operating profit before exceptional items increased by 10.2% year-on-year to £173m. Lending growth in the year has been strong, driven by secured mortgage lending which now comprises 26% of the lending portfolio, versus 22% last year. In addition, Money Services products such as our Travel Money offer have performed well overall as the Group continues to enhance the product range and expand the customer base. Exceptional items of £(24)m relating to Tesco Bank include an increase in the provision for customer redress and a credit received following the conclusion of negotiations with a third party in respect of previously recognised customer redress.
The balance sheet remains strong and well-positioned to support future lending growth from both a liquidity and capital perspective with a risk asset ratio of 19.3%.
Exceptional items in operating profit2017/18 2016/17
Net restructuring and redundancy costs £(102)m £(199)mNet impairment reversal/(charge) of non-current assets and onerous lease provisions
£53m £(6)m
Provision for customer redress £(24)m £(45)mInterchange settlement – £57mInvestment disposal £124m –Property transactions £79m £165mDisposal of opticians business £38m –Amounts provided and released in relation to SFO and FCA obligations
£25m £(235)m
Total exceptional items in operating profit £193m £(263)m
Exceptional items are excluded from our headline performance measures by virtue of their size and nature in order to reflect management’s view of the performance of the Group. In the current year, the net effect of exceptional items on operating profit is £193m.
Net restructuring and redundancy charges of £(102)m relate principally to structural changes to our business to simplify our operating model within stores and head office.
The net impairment reversal of non-current assets and onerous lease provisions of £53m includes a net reversal of £185m in property, plant and equipment and investment property, a net £(24)m charge in software and other intangible assets and a net charge of £(108)m of onerous lease provisions.
Provision for customer redress of £(24)m relating to Tesco Bank, includes an increase of £(35)m in the provision for Payment Protection Insurance (PPI), partially offset by a £1m Consumer Credit Act (CCA) provision release and a credit of £10m received following the conclusion of negotiations with a third party in respect of previously recognised customer redress.
The investment disposal profit of £124m reflects the sale of our remaining minority stake in the Lazada e-commerce platform, completed during the first half. The sale of our opticians business in the UK & ROI to Vision Express resulted in a £38m gain on disposal.
13Tesco PLC Annual Report and Financial Statements 2018
Strategic report
•73538_Tesco_AR18_Text pages_Bk_180420_HR.indb 13 20/04/2018 15:42
Two property-related transactions completed in the UK in the first half of the year account for the majority of the £79m property transactions within exceptional items.
In the prior year, we took an exceptional charge of £(235)m in respect of the Deferred Prosecution Agreement (DPA) between Tesco Stores Limited and the UK Serious Fraud Office (SFO) regarding historic accounting practices and an agreement with the UK Financial Conduct Authority (FCA) of a finding of market abuse in relation to the Tesco PLC trading statement announced on 29 August 2014. Included in this charge was £(85)m for the Shareholder Compensation Scheme. With the Compensation Scheme now being closed to new claimants, we have released £25m of the amounts provided. Outstanding claims submitted before the 22 February 2018 deadline are still being processed.
Joint ventures and associates, interest and taxJoint ventures and associates Our share of post-tax losses from joint ventures and associates before exceptional items was £(6)m, an improvement of £24m year-on-year due to reduced losses recognised in Gain Land, our joint venture in China. There were no exceptional items this year relating to our share of post-tax losses from joint ventures and associates.
Finance income and costs2017/18 2016/17
Interest payable on medium term notes, loans and bonds
£(363)m £(434)m
Interest receivable on associated derivatives £31m £6mNet interest on medium term notes, loans and bonds £(332)m £(428)mOther interest receivable and similar income £44m £42mOther finance charges and interest payable £(70)m £(89)mCapitalised interest £2m £6mNet finance cost before exceptional charges, IAS 19 net pension finance costs and IAS 39 fair value remeasurements
£(356)m £(469)m
IAS 39 fair value remeasurements £23m £61mIAS 19 net pension finance costs £(162)m £(113)mExceptional charge – translation of Korea proceeds £(38)m £(244)mNet finance costs £(533)m £(765)m
Net finance costs before exceptional charges, IAS 19 net pension finance costs and IAS 39 fair value remeasurements reduced by £113m year-on-year to £(356)m. This 24.1% decline year-on-year was mainly driven by a net £96m reduction in interest on interest-bearing liabilities. Debt maturities totalled £1.4bn during the year and we also undertook £1.3bn of bond tenders in two separate liability management exercises. These bond tenders during the year contributed to £23m lower interest costs and we expect an associated reduction in interest payable of c.£50m on an annualised basis. In cash interest terms, we were helped by a favourable timing benefit of £55m on our largest sterling-denominated bond, for which no annual coupon payment was made during the year owing to the timing of our year-end date.
Net finance costs, which include non-cash items, were around 30% lower year-on-year. Fair value remeasurements are largely driven by changes in the market assessment of credit risk and various market indices which can fluctuate significantly.
Net pension finance costs increased by £(49)m year-on-year driven by a higher opening pension deficit part offset by a lower opening discount rate. Net pension finance costs are calculated by multiplying the opening deficit by the opening discount rate each year. For 2018/19, they are expected to decrease to c.£(95)m as the impact of a higher opening discount rate is more than offset by the year-on-year reduction in deficit.
The exceptional charge of £(38)m relating to the translation of the remaining proceeds from the sale of our business in Korea will not arise again since the funds have now been moved to a Sterling denominated entity within the Group. The proceeds had been held in GBP money market funds in a non-Sterling denominated subsidiary and the translation effect represents no economic cost to the Group.
Group taxTax on profit before exceptional items was £(286)m, with an effective tax rate on profit before exceptional items for the Group of 25.0%. As previously indicated, this tax rate is higher than the UK statutory rate primarily due to the depreciation of assets that do not qualify for tax relief and the impact of the 8% supplementary tax surcharge on bank profits. We expect the
impact of these items on the effective tax rate to reduce as our overall level of profitability continues to increase, and therefore we expect the effective tax rate to reduce to around 20% in the medium term.
The effective tax rate on profit before exceptional items for the 2018/19 financial year is expected to be around 24%.
Earnings per share (on a continuing operations basis)Diluted earnings per share before exceptional items were 11.88p, nearly 63% higher year-on-year principally due to our stronger profit performance. Statutory basic earnings per share from continuing operations were 12.12p, up from 0.81p last year.
Summary of total indebtedness2017/18 2016/17 Movement
Net debt (excludes Tesco Bank) £(2,625)m £(3,729)m £1,104mDiscounted operating lease commitments £(6,931)m £(7,440)m £509mPension deficit, IAS 19 basis (post-tax) £(2,728)m £(5,504)m £2,776mTotal indebtedness £(12,284)m £(16,673)m £4,389m
Retail net debt reduced by £1.1bn to £(2.6)bn as retail operating cash flow and disposal proceeds were greater than capital expenditure and other charges. Within net debt, we used surplus cash to prepay £1.3bn of the Group’s long-dated bonds as part of an ongoing focus to strengthen the balance sheet.
We have a strong funding and liquidity profile underpinned by £4.2bn committed facilities and our key credit metrics, fixed charge cover and total indebtedness/EBITDAR, have improved to 2.7 times and 3.3 times respectively.
Discounted operating lease commitments have reduced by £509m, including the benefit from the buyback of 17 stores in the UK during the year. We anticipate rental savings of £26m on an annualised basis as a result of these property purchases.
On an IAS 19 basis, the pension deficit measure (net of deferred tax) has reduced from £5.5bn last year to £2.7bn at the end of the current year. The movement during the year was partly driven by an increase in yields on corporate bonds, which drive the discount rate used for accounting purposes and our decision at the half-year stage to update the discount rate model in line with developing market practice and following actuarial advice. In the Group’s view, it now more appropriately reflects expected yields on corporate bonds over the life of the scheme’s liabilities. At the same time, the application of latest industry life expectancy tables and favourable actual scheme experience have also contributed to the reduction.
During the year, the triennial pension review was concluded, with the business and the Trustees agreeing that annual contributions will increase by £15m to £285m per annum from April 2018, with our framework for the long-term funding of the scheme unchanged. As at 31 March 2017, the actuarial deficit was £3.0bn, an increase of c.£0.25bn since the last triennial valuation.
Overall, total indebtedness has reduced by £4.4bn in the year. Net debt has reduced by almost £6bn over the last three years.
Summary retail cash flowRetail operating cash flow increased by £495m to £2,773m in the year. This increase of 21.7% year-on-year, was mainly driven by improved Group profitability. Further improvements in working capital of £499m also contributed to the improvement in cash flow, although this includes £102m of timing benefits principally as a consequence of the failure of a supplier towards the end of the year.
Exceptional cash items increased year-on-year, largely driven by a cash outflow of £149m relating to payment of the SFO fine and initial Shareholder Compensation Scheme payments. We expect a further cash outflow of c.£60m relating to such claims. Other cash exceptional items totalling £169m include a £160m VAT refund from HMRC regarding the treatment of VAT on Clubcard rewards, which HMRC have appealed. This has no net effect in the Group income statement.
Cash capital expenditure of £(1.2)bn was up year-on-year due to the timing of payments relating to commitments made towards the end of the last financial year.
Combined net cash interest and tax of £(428)m was £113m lower than last year largely as a result of debt maturities and bond tenders. We generated £253m of proceeds from property sales and completed the buyback of 17 stores during the year, for a cash consideration of £393m.
Tesco PLC Annual Report and Financial Statements 201814
Financial review continued
•73538_Tesco_AR18_Text pages_Bk_180420_HR.indb 14 20/04/2018 15:42

2017/18 2016/17Operating profit before exceptional items £1,644m £1,280mLess: Tesco Bank operating profit before exceptional items
£(173)m £(157)m
Retail operating profit from continuing operations before exceptional items
£1,471m £1,123m
Less: Retail operating loss (discontinued operations) – £(15)mAdd back: Depreciation and amortisation £1,212m £1,172mOther reconciling items £28m £12mPension deficit contribution £(245)m £(248)mUnderlying (increase)/decrease in working capital £499m £379mRetail cash generated from operations before exceptional items
£2,965m £2,423m
Exceptional cash items: £(192)m £(145)mRelating to prior years:
– SFO Fine and Shareholder Compensation Scheme Payments
£(149)m –
– Utilisation of onerous lease provisions £(92)m £(111)m – Restructuring payments £(53)m £(54)m
Relating to current year: – Restructuring payments(a) £(67)m £(75)m
Other(b) £169m £95mRetail operating cash flow £2,773m £2,278mMemo: Retail operating cash flow on continuing operations basis
£2,773m £2,279m
Cash capex £(1,190)m £(963)mNet interest & tax £(428)m £(541)mProperty proceeds £253m £509mProperty purchases – store buybacks £(393)m £(365)mDisposals and dividends received £362m £369mRetail free cash flow £1,377m £1,287m(a) In addition to cash outflows of £(67)m relating to current year restructuring, exceptional
items charged to profit include a net restructuring provision of £(35)m, resulting in a total exceptional restructuring charge to operating profit of £(102)m.
(b) Other exceptional cash items include VAT recovered in relation to the appeal against HMRC regarding the treatment of VAT on Clubcard rewards of £160m and working capital acquired of £9m from the unwind of the Group’s joint venture with British Land Co PLC (British Land) (2016/17: legal settlement of £57m in respect of interchange fees, development stock disposal of £36m and discontinued operations of £2m).
Finally, cash inflows of £362m relating to disposals and dividends received includes consideration of £196m from the sale of our remaining minority stake in the Lazada online business, a dividend of £50m from Tesco Bank, and proceeds of £45m relating to the disposal of our opticians business in the UK to Vision Express, in addition to a number of smaller transactions.
Retail free cash flow of £1,377m is up 7.0% year-on-year. This is lower than the rate of growth in retail operating cash flow principally due to timing of cash capital expenditure and lower property proceeds.
Capital expenditure2017/18 2016/17
UK & ROI £676m £731mCentral Europe £133m £141mAsia £239m £261mTesco Bank £50m £46mGroup £1,098m £1,179m
On an accrued basis, capital expenditure (excluding buybacks) of £1.1bn was £0.1bn lower than last year reflecting our disciplined approach to capital spending and focus on delivering attractive returns. Our capital expenditure in the UK focused on maintaining and replacing essential assets, alongside programmes to refresh and repurpose the estate, enhancing our store operations. New store capex has mainly been allocated to our new store opening programme in Thailand, with a limited number of Express store openings and a net gain of one new superstore in the UK. Our capital expenditure in Central Europe relates mainly to repurposing of existing stores. We expect capital expenditure to remain within a range of £1.1bn-£1.4bn. There was a net reduction of (1.2)m square feet, including (1.1)m square feet of space repurposed to a range of complementary partners such as Arcadia Group and H&M.
Across the Group, our repurposing programme has focused on improving the ease and relevance of our large-store shopping trip for customers. In the UK & ROI, we have repurposed 75,000 square feet across 20 stores. Within the year, we opened over 50 concessions within our stores including
Arcadia Group, Holland & Barrett, Dixons Carphone and Next. A brand new Booker ‘Chef Central’ concept store was also opened within the Tesco Extra store at Bar Hill, Cambridge in February 2018. The store primarily serves professional caterers but is open to all customers. In Central Europe, we have primarily been partnering with other clothing brands in repurposed store space including H&M and Decathlon. In Asia, we have worked with a range of different partners across a variety of brands including MR. DIY and Major Cineplex.
PropertyThe estimated market value of our fully owned property has increased by £0.8bn to £20.7bn, with a surplus of £2.5bn over the net book value (NBV). Our Group freehold property ownership percentage, by value, has increased to 58% from 57% last year, driven by the UK & ROI. We regained ownership of 17 stores in the UK during the year, increasing our proportion of freehold ownership by value in the UK & ROI to 52%. This repurchase of stores will result in an annualised rental saving of £26m. We continue to seek opportunities to further reduce our exposure to index-linked and fixed-uplift rent inflation where the economics are attractive.
DividendWe propose to pay a final dividend of 2.0 pence per ordinary share. The proposed final dividend was approved by the Board of Directors on 10 April 2018 and is subject to the approval of shareholders at the Annual General Meeting to be held on 15 June 2018. This takes the total dividend for the year to 3.0 pence per ordinary share following the payment of an interim dividend of 1.0 pence per ordinary share in November 2017. We anticipate a split of broadly one-third to two-thirds between next year’s interim and final dividends and intend to reach our targeted cover of around two times earnings in the medium term.
Merger with Booker GroupWe completed our merger with Booker Group on 5 March 2018, after the end of the Tesco financial year. Our ‘Joining Forces’ integration programme is well underway and we are focused on delivering the £200m recurring run-rate synergies identified during the merger process by the end of the third year post-completion.
Booker Q4 results show a continued strong performance, with customer satisfaction up 0.3% to 85.7% and like-for-like sales up 9.9%. While Booker’s full year results are still subject to audit approval, operating profit before exceptional items for the financial year to 30 March 2018 is c.£195m and net cash is c.£120m.
Transaction costs of £(26)m relating to our merger with Booker were included in Tesco’s UK & ROI operating profit before exceptional items in the 2016/17 financial year. Further costs and fees of £(21)m arising in the 2017/18 financial year have been treated in a consistent fashion. A similar amount, consisting of stamp duty costs directly arising from the completion of the merger, will be charged to underlying profit in the 2018/19 financial year. As outlined in our merger prospectus, we anticipate up to £(145)m of integration costs over three years, which will be treated as exceptional.
Looking ahead We remain firmly on track to deliver the medium-term ambitions we set out in October 2016; to reduce our costs by £1.5bn, to generate £9bn of retail cash from operations and to improve operating margins to between 3.5% and 4.0% by 2019/20. In addition, by further reducing debt and maintaining a disciplined approach to capital we can continue to strengthen the balance sheet and generate an increasing level of free cash flow. Our intention remains to return to an investment grade credit rating, with our key metrics being fixed charge cover and total indebtedness/EBITDAR.
The integration of Booker is well underway and we are focused on delivering the identified synergies to create value for all stakeholders. We anticipate a synergy benefit of c.£60m in the first year, growing to a cumulative c.£140m in the second year and reaching a recurring run-rate of c.£200m per year by the end of the third year.
As we look to capitalise on the enhanced opportunities for growth available to the combined Group, we will place increasing focus on growth in earnings and free cash flow generation, in order to deliver strong, sustainable returns for shareholders.
Alan StewartChief Financial Officer
15Tesco PLC Annual Report and Financial Statements 2018
Strategic report
•73538_Tesco_AR18_Text pages_Bk_180420_HR.indb 15 20/04/2018 15:42

The Little Helps Plan outlines how Tesco works in partnership with others, including suppliers, NGOs, governments and other retailers, to make a positive contribution and work towards shared global ambitions.
The plan builds on the progress we have made so far and covers three areas core to the long-term success of our business: people, products and places.
In October 2017, we shared targets and actions under each of these three pillars. More information on these can be found at www.tescoplc.com/littlehelpsplan.
The Little Helps Plan covers our retail businesses in the UK, Republic of Ireland, Central Europe and Asia. However, with the majority of our customers being in the UK, implementation of the plan and reporting will begin with the UK business. We have committed to sharing our progress along the way and will next update in October 2018.
Accountability for the Little Helps Plan is led at an Executive level by Jane Lawrie, Group Communications Director, and at the Board level by Dave Lewis, Group Chief Executive. Our Corporate Responsibility Committee, chaired by Lindsey Pownall, Non-executive Director, governs the plan. More information on the activities of the Corporate Responsibility Committee can be found in the Corporate governance report on page 39.
Our approach
‘Every little help makes a big difference’ is our third value and emphasises our belief that small actions can add up to make a big difference. Our Little Helps Plan identifies the most pressing social and environmental challenges facing the business, our customers and our communities, and outlines our commitments to help tackle these.
PeopleThe 440,000 colleagues who work for us around the world are at the forefront of serving our shoppers better every day. We want to give them a great experience of working at Tesco and be a place where everyone can get on, whatever their ambitions.
To do this, we are investing in training so colleagues are supported to develop their careers and to build skills for their future. We are committed to building an inclusive culture and ensuring these opportunities are available to all colleagues. We are also trialling a number of innovative solutions that will offer colleagues greater flexibility over their own work schedules.
Our target To help our colleagues succeed by providing them with the flexibility, skills and reward they need to get on.
For the full list of our targets and actions see our Little Helps Plan at www.tescoplc.com/littlehelpsplan.
Working together to make a big difference.
Our Three Pillars
People Products Places
Tesco PLC Annual Report and Financial Statements 201816
Little Helps Plan
•73538_Tesco_AR18_Text pages_Bk_180420_HR.indb 16 20/04/2018 15:43

ProductsSourcing Our customers should have peace of mind that the products that they buy at Tesco are sourced with respect for both the environment and the people who make or grow them. Building strong, trusted relationships with our suppliers plays a key role in achieving this. HealthOur customers and colleagues tell us that they want to make healthier choices, but sometimes it can be difficult. We want to make it easier to lead a healthier life and we are focused on offering simple, practical actions that lead to sustainable changes.
PackagingWe know packaging plays an important role in preserving and protecting products but we are taking action to reduce its overall impact on the environment. We are working with the industry to develop a closed loop system which can be applied to all key packaging materials.
Food wasteWe have a responsibility and commitment to lead reduction of food waste from farm to fork. Through our Group Chief Executive’s Chairmanship of the international Champions 12.3 coalition, we are committed to accelerating progress towards the UN Sustainable Development Goal target to halve per capita global food waste by 2030.
Our targetsTo help make sustainable products accessible and affordable for all.
To support all of our colleagues to live healthier lives and help our customers make healthier food choices every time they shop with us.
To ensure we never use more packaging than is needed, and that what we do use is from sustainable sources and goes on to be reused or recycled.
To help halve global food waste, farm to fork, by 2030.
PlacesWe are proud to be a valued part of over 6,000 communities around the world and want to help them thrive. We bring social and economic benefits through the local people we employ, the local businesses we work with and the local projects we support.
We support causes important to colleagues and customers. We deliver this through our community donation programmes, strategic partnerships with charities and support for food banks.
Our targetTo help our local communities thrive by positively contributing both socially and economically.
FoundationsUnderpinning all the pillars of the Little Helps Plan are a number of areas where it is vital to do the right thing. It remains a priority for us to ensure our products are safe, that we have a strong health and safety culture for customers and colleagues, and that we stay on track with our ambitious plan to become a zero-carbon business.
We recognise that these areas and strong corporate governance are equally important to ensuring our business is having a positive impact on society. They are core expectations and are embedded in the way we do business.
17Tesco PLC Annual Report and Financial Statements 2018
Strategic report
•73538_Tesco_AR18_Text pages_Bk_180420_HR.indb 17 20/04/2018 15:43

shopping baskets outside of seasonal changes. For colleagues we have given out free fruit and offered mini health checks throughout our health events. In 2017/18 we also made mental wellbeing training available for all colleagues and brought together a group of colleague Health Heroes to share their stories and inspire others to make healthier choices.
In January 2018, we announced a groundbreaking new five-year strategic partnership with the British Heart
Foundation, Cancer Research UK and Diabetes UK. The aim of the partnership is to help reduce the risk of heart and circulatory disease, cancer and diabetes. The partnership will support colleagues, customers and their families to make sustainable lifestyle changes and adopt healthier habits.
For more information visit www.tescoplc.com/health.
PackagingWe continue to make changes to our packaging to help reduce our impact on the environment. 87% of our Own Brand packaging by weight is currently widely recyclable.
We have made significant changes to the packaging of our wet wipes, resulting in a 20% reduction in the
material used and thereby removing 57 tonnes of plastic. This material saving is enough to make over 10 million more packs.
We recognise that we can do more in partnership with government and industry to help establish a robust, closed loop approach to recover and reuse all key packaging materials. We have three strategic priorities to help reduce packaging waste and boost recycling across the UK:
1. Materials and design: In collaboration with our suppliers we are reducing packaging and restricting the number of materials we accept so that less packaging is used and packaging is easier to recycle.
2. Recovery and recycling: We believe a holistic approach is required to create an integrated national recovery and recycling system. We support developing a cost-effective Deposit Return System (DRS) as one aspect of this approach.
3. Changing customer behaviour: Once consistent recycling infrastructure is in place, we can help customers recycle more with simple, clear information.
For more information visit www.tescoplc.com/packaging.
Tackling food waste Five years ago, we made a commitment to lead on reducing global food waste in our own operation, supply chains, and in our customers’ homes.Food waste is a global challenge and through our international markets and Dave Lewis’s Chairmanship of the international Champions 12.3 coalition, we are committed to driving progress towards the UN Sustainable Development Goal target to halve per capita global food waste by 2030.
ProductsSourcing with careIn our UK supply chains, we are prioritising the environmental and social risks associated with 20 of our most important products and ingredients – from beef and coffee, to wild fish and cotton. To view the full top 20 list and some of the actions we are taking, visit www.tescoplc.com/top20.
Collaboration with suppliers, industry organisations, government bodies and civil society is vital for us to make progress.
For example, we know that soil degradation is a key issue facing agricultural products and the
environment. We analysed the most vulnerable regions we sourced from and in 2017 we started a new project in partnership with the Broads Authority and with the support of the Rivers Trust, National Farmers Union (NFU) and the Environment Agency. To raise awareness of the impact of water run-off with potato growers in East Anglia, we tested new technologies that help retain valuable top soil and reduce the amount of fertiliser entering local waterways. Working with partners, we will share the learnings in other key sourcing regions.
This year, as part of our human rights due diligence approach, we have engaged stakeholders and other businesses to further understand the risks of forced labour in palm oil supply chains. 100% of the palm oil used in our Own Brand products in the UK is certified by the Roundtable on Sustainable Palm Oil but we want to take further action to mitigate the social challenges associated with palm oil production. Our engagement has helped us identify and understand the areas of greatest risk, and we are working collaboratively through the Consumer Goods Forum to tackle this challenge as an industry.
Visit www.tescoplc.com/sourcing for more information and www.tescoplc.com/modernslavery for our latest Modern Slavery Statement.
A healthier place to work and shop For many years we’ve worked hard to help colleagues and customers make healthier food choices. We are also continuing to work with our suppliers to reduce the amount of sugar, fat and salt in thousands of products. In Central Europe in 2017 we reviewed 120 Own Brand soft drinks and introduced a new standard to limit the sugar to less than 1 teaspoon per 100ml. This follows the UK business which, by November 2016, had reduced the sugar in all Own Brand soft drinks to below the threshold for the government levy. We’ve also helped increase consumption of fruit and vegetables by introducing new, great value ranges such as Farm Brands and Perfectly Imperfect. Our Free Fruit for Kids initiative remains popular in the UK and since 2016, we have given out 50 million pieces of free fruit in 800 stores.
In May 2017 we held our first ever in-store health event in the UK. As part of this we reduced the price of 200 healthier products and highlighted in-store and online products which are lower in sugar, fat or salt. As a result, we saw the biggest monthly improvement in the health of our customers’
In 2017/18, the 10 million tonnes of food sold in the UK retail operations generated 73,340 tonnes (0.7%) of
surplus. 53,126 tonnes (0.5%◊) was wasted, which we sent for energy recovery. Of this, just 19,898 tonnes (0.2%) was safe for human consumption. In September 2017 we also shared our 2016/17 food waste data for the Republic of Ireland and Central Europe for the first time. The page opposite gives a breakdown on our food surplus and waste in all these markets for 2017/18.
In 2016, we made the commitment that no food that is safe for human consumption will go to waste from our UK retail operations by the end of 2017/18. We have worked hard to deliver our target through the launch of new industry leading initiatives. Surplus food safe for humans is offered to local charities through Community Food Connection. Food not taken by charities is offered to colleagues through our ‘colleague shops’ which have been rolled out to all stores. We send any suitable remaining surplus to animal feed. We have achieved huge progress in ensuring more good food goes to charity and we are now introducing a further programme of work to ensure no food safe for human consumption goes to waste.
Our other markets share the same ambition and food redistribution programmes are now in all stores in the Republic of Ireland and all hypermarkets in Bangkok and Malaysia. In Central Europe over 600 stores (out of a total 961) are already donating surplus food and all remaining stores will be donating by 2020.
We are also working in partnership with our suppliers to offer customers the food they love with less waste.
In 2017/18, we introduced resealable salad bags across our most popular salad lines and became the first UK
supermarket to start selling perfectly ripe green satsumas and clementines that stay fresher for longer. In Central Europe, we introduced our Perfectly Imperfect range which has helped save over 6,000 tonnes of ‘wonky’ fruit and vegetables from going to waste.
With 25 of our largest suppliers, we have announced a joint commitment to adopt UN Sustainable Development Goal target 12.3, measure and publish food waste data for their own operations and act to reduce food waste farm to fork. We are planning to build on this work over the coming year across more of our supply chains and communicate with customers on how they can reduce food waste in the home.
To view further analysis of all our food waste figures visit www.tescoplc.com/foodwaste.
Tesco PLC Annual Report and Financial Statements 201818
Little Helps Plan continued
•73538_Tesco_AR18_Text pages_Bk_180420_HR.indb 18 20/04/2018 15:43

337 7,975
10,688
19,898
976 3,520
10,639
2,51011,169
Donated
Colleagueshops
Animalfeed
Disposal*Donated
Disposal*
DonatedAnimalfeed
Disposal*
ProduceBeers, Wine and Spirits Grocery Impulse Prepared FoodsMeat, Fish and PoultryDairyBakery
35%
16%15%
11%
10%
6%5% 2%
31%
25%
15%
10%
8%
5%3% 2%
34%
26%
10%
8%
7%
7%5% 2%
2017/18 sales tonnage vs surplus tonnage(Not to scale)
2017/18 food waste by category(a)
(% do not total 100% due to rounding)
2017/18 food surplus safe for human consumption (tonnes)
2017/18 food waste as % of sales
◊ KPMGLLPwereengagedtoprovideindependentlimitedassuranceovertheselectedfoodwastedatahighlightedinthisreportwitha◊usingtheassurancestandardISAE3000. KPMGhasissuedanunqualifiedopinionovertheselecteddata.KPMG’sfullassurancestatementisavailableat:www.tescoplc.com/foodwastefigures.
(a) Totalfoodwasteismadeupofbothfoodsafeforhumanconsumptionandfoodthatisnotsafeforhumanconsumptionwhichhasbeendisposedof.
UKTotal food sales
10,023,559 tonnes
IrelandTotal food sales
557,317 tonnes
Central EuropeTotal food sales
3,227,655 tonnes
0.5%◊ 1.2%◊ 1.2%◊
Total food surplus
73,340tonnesTotal food surplus
51,579tonnesTotal food surplus
7,762tonnes
Food surplus (total of food not sold)
Food waste (food surplus wasted)
53,126tonnes◊(waste)
6,786tonnes◊(waste)
38,054tonnes◊(waste)
* Disposal=energyrecoveryandwastemanagement.
19Tesco PLC Annual Report and Financial Statements 2018
Strategic report

Gender diversity (based on actual year-end headcount) Male FemaleBoard of Directors 10 77% 3 23%Senior managers – Directors 353 75% 117 25%Senior managers – Directors and managers 2,646 63% 1,524 37%All employees 189,097 43% 251,561 57%
‘ Tesco is an important part of the town, with four large and seven convenience stores in and around the area. We’re one of the biggest employers in Oldham and have become an integral part of the community by taking part in many charitable projects.’Marie Toora Store Manager, Oldham Chadderton Superstore
‘ The biggest advantage of ‘You Choose, We Help’ is the close relationship we develop with local communities. Local people decide which of the nominated projects should receive grants.’Urszula WiśniewskaManager of Możesz więcej Poland (beneficiary)
PeopleColleagues have told us how important flexibility and certainty are in order for them to reach their ambitions both inside and outside of work. In 2017/18 we started to trial a new app in the UK that allows colleagues to see their shifts, manage overtime and request holiday. In time the app will also give the option to swap shifts, request shift changes and even take shifts in different stores – providing them with genuine flexibility and control over their hours. We have committed to rolling out this app in all our markets and have already started to introduce a simplified version in our Asian stores.
Our UK apprenticeship programme aims to give over 1,000 colleagues, of all ages and all levels of experience, the
opportunity to continue their education and build skills for their future. With technology transforming society, we are also developing a training programme to ensure that all our colleagues have the digital competence and confidence to succeed.
Inclusivity and creating a culture where everyone has equal opportunity remains integral to our business. In January 2018 we pledged support to the UN standards promoting the rights of Lesbian, Gay, Bisexual, Transgender and Intersex (LGBTI) people. More recently we signed up to the 30% Club, demonstrating our commitment to having strong female representation within our senior leadership team by 2020. The ratio of male to female colleagues at 2017/18 year-end is outlined in the table below. Further analysis of our gender pay gap can also be found in the Corporate governance report on page 47 or online.
For more information visit www.tescoplc.com/people.
PlacesIn 2017/18 we have continued to support communities through our community donation initiatives. We have established programmes in the UK (Bags of Help), Republic of Ireland (Community Fund) and Central Europe (You Choose, We Help). All of these programmes put the power in the hands of our customers to choose the local projects that Tesco supports financially. In Central Europe one in every four customers voted in ‘You Choose, We Help’. Through these programmes we have distributed over £51m and supported more than 24,000 local projects to date.
Wherever we operate we also work closely with food banks and local charities to help feed people in need in local communities. In 2017/18 we donated the equivalent of 46 million meals to help feed people in need across the UK, Republic of Ireland, and Central Europe through our food surplus redistribution programmes. In January 2018, all our stores in Malaysia also participated in a campaign which enabled customers to donate food to 100 local charities supporting vulnerable families and homeless people. In Thailand, customer fundraising meant that underprivileged children were able to have nutritious lunches throughout February 2018.
For more information visit www.tescoplc.com/places.
Tesco PLC Annual Report and Financial Statements 201820
Little Helps Plan continued
•73538_Tesco_AR18_Text pages_Bk_180420_HR.indb 20 20/04/2018 15:43

Global tonnes of CO2e2017/18 2016/17 Base year 2015/16
Scope 1 1,306,985* 1,236,980 1,301,746Scope 2(a)
Market-based method 1,136,325* 1,582,275 2,004,992Location-based method 2,077,528* 2,357,245 2,528,323
Scope 1 and 2 carbon intensity (kg CO2e/sq. ft. of stores and DCs)
21.23* 22.95 26.33
Scope 3 975,312* 1,073,721 1,097,491Total gross emissions 3,418,677* 3,892,977 4,404,230CO2e from renewable energy exported to the grid 1,134* 1,154 1,513Total net emissions 3,417,543* 3,891,822 4,402,717Overall net carbon intensity (total net emissions kg CO2e/sq. ft. of stores and DCs)
29.70* 31.69 35.06
* KPMG LLP were engaged to provide independent limited assurance over the selected greenhouse gas emissions data highlighted in this report with a * using the assurance standards ISAE 3000 and 3410. KPMG has issued an unqualified opinion over the selected data. KPMG’s full assurance statement is available at: www.tescoplc.com/carbonfigures.
(a) Tesco uses the market-based method for calculating Scope 2 emissions for our total emissions to account for our efforts in generating and purchasing low carbon energy. The location-method impact is provided for disclosure only and all intensity, net and gross emissions shown are calculated using the market-based method.
FoundationsClimate changeIn May 2017, we announced the new science-based targets on the right, which are aligned with the Paris Climate Agreement recommendation of a 1.5 degree global warming trajectory. They will also enable us to meet our ambition to become a zero-carbon business by 2050.
Our carbon footprint is calculated according to the Greenhouse Gas Protocol and our net carbon footprint in 2017/18 was 3.4 million tonnes of CO2e. For our own operations absolute carbon emissions we achieved a 13% reduction compared to last year and 26% compared to 2015/16. To help us achieve our new targets, we have committed to source 100% of our electricity from renewable sources by 2030. In 2017/18, 55% of our electricity across the Group was from renewable sources and in the UK we have already switched to 100% renewable purchased electricity, supported by renewable energy certificates. This, in addition
to investments in energy efficiency, has enabled us to reduce our net carbon intensity per sq. ft. of retail and distribution floor space by 6% compared with last year, and 15% since 2015/16.
Our targetsReduce absolute carbon emissions from our operations from 2015/16 levels: 35% by 2020, 60% by 2025 and 100% by 2050.
Source 65% of our electricity from renewable sources by 2020 and 100% by 2030.
Anti-bribery and fraud We are committed to maintaining the highest standards of ethics and integrity in the way we do business around the world. We adopt a zero tolerance approach to bribery and fraud at Tesco and expect our business partners to do the same.
Our Code of Business Conduct outlines our most important legal obligations and the policies that guide the conduct of all our colleagues in areas
including health and safety, information security, bribery and fraud. In February 2018, we refreshed all our communications on the Code and held an internal campaign to encourage colleagues to speak up if they have any concerns the Code is not being followed.
To support this culture, we also provide an independent and confidential whistleblowing service – Protector Line – that enables our colleagues, suppliers and their staff around the world to raise concerns. We use e-learning to support compliance with the Code and anti-bribery and anti-fraud training is included in our annual refresher training for all relevant colleagues. Everyone in the business must comply with the Code and we have implemented annual Code compliance declarations which are reviewed by our Group Risk and Compliance Committee.
For more information visit www.tescoplc.com/foundations.
21Tesco PLC Annual Report and Financial Statements 2018
Strategic report
•73538_Tesco_AR18_Text pages_Bk_180420_HR.indb 21 20/04/2018 15:43

We have an established risk management process to identify, assess and monitor the principal risks that we face as a business. We have performed a robust review of those risks that we believe could seriously affect the Group’s performance, future prospects, reputation or its ability to deliver against its priorities. This review included an assessment of those risks that we believe would threaten the Group’s business model, future performance, solvency or liquidity.
Following the review of the principal risks and our strategic drivers we have included two additional shorter-term risks. These relate to the ongoing uncertainty and approach to Brexit, and the timely synergy realisation and integration of Booker into the wider Group, set out on pages 24 and 25. Additionally, we have reframed our product safety and supply chain risks, currently reflected at the business unit level to form a new principal risk responsible sourcing and supply chain, set out on page 24. This risk relates to the social and environmental challenges facing our business, our customers and our communities. Our approach is outlined in our Little Helps Plan on pages 16 to 21.
The risk management process relies on our assessment of the risk likelihood and impact and on the development and monitoring of appropriate internal controls. Our process for identifying and managing risk is set out in more detail on page 43.
We maintain risk registers for the principal risks faced by the Group and this is an important component of our governance framework and how we manage our business. As part of our risk management process, risks are reviewed as a top down and bottom up activity at the Group and the business unit level. The content of the risk registers are considered and discussed through regular meetings with senior management and reviewed by the Executive Committee. Each principal risk is reviewed at least annually by the Board.
The table opposite sets out our principal risks, their link to our strategic drivers, their movement during the year and a summary of key controls as well as any mitigating factors. The Board considers these to be the most significant risks faced by the Group that may impact the achievement of our six strategic drivers as set out on pages 8 and 9. They do not comprise all of the risks associated with our business and are not set out in priority order. Additional risks not presently known to management, or currently deemed to be less material, may also have an adverse effect on the business.
Indicates a new risk.
OversightBoardOverall responsibility for risk management, engages directly with risk assessment, mitigations and risk appetite.
Audit CommitteeOversight of the risk framework and controls on behalf of the Board.
Group Chief Executive and Executive Committee The Group Chief Executive has overall accountability for control and the management of risk. Individual members, reporting to the Group Chief Executive, are accountable for specific risks.
Group Risk and Compliance CommitteeOversight of key regulatory and compliance risks on behalf of the Executive Committee, reporting biannually to the Audit Committee.
‘ The Board considers these to be the most significant risks faced by the Group that may impact the achievement of our six strategic drivers.’
Risks
Principal risks
Customer
Responsible sourcing and supply chain
Health and Safety
Transformation
Data security and data privacy
Brand,reputationand trust
Technology
Liquidity
People
Booker synergy
realisation and integration
Tesco Bank
Competitionand markets
Brexit
Political, regulatory and
compliance
Strategic drivers A differentiated brand
Reduce operating costs by £1.5bn
Generate £9bn cash from operations
Maximise the mix to achieve a 3.5% - 4.0% margin
Maximise value from property
Innovation
1
2
3
4
5
6
A robust review.
Tesco PLC Annual Report and Financial Statements 201822
Principal risks and uncertainties
•73538_Tesco_AR18_Text pages_Bk_180420_HR.indb 22 20/04/2018 15:43

Key to risk movement
Risk increasing No risk movement Risk decreasing Link to strategic drivers on page 22
Principal risk Risk movement Key controls and mitigating factorsCustomer†
Failure to have a coherent, connected and engaging customer journey and in-store experience will lead us to be less competitive and lose market share.
1 63 4
Ongoing fragmentation of our customer engagement channels exposes us to an increased risk of diluting our customer experience and ability to differentiate our brand.
We now have a more consistent approach to building impactful customer propositions, offering high quality, competitive value, while improving the customer experience. Propositions are now developed across channels and geographies to ensure consistency in the engagement with customers. Group-wide customer insight management is undertaken to understand customer behaviour, expectations and experience, and leverage more consistently across the different parts of the business.We monitor the effectiveness of our processes by regular tracking of our business, and those of our competitors, against measures that customers tell us are important to their shopping experience. We have well established product development and quality management processes, which keep the needs of our customers central to our decision making.
Transformation†
Failure to achieve our transformation objectives due to poor prioritisation, ineffective change management and a failure to understand and deliver the technology required, resulting in an inability to progress sufficiently quickly to maintain or increase operating margin and generate sufficient cash to meet business objectives.
63 4
Achieving our transformation goals continues to demand further effort and investment, especially with regard to technology changes, as both internal and external expectations have increased.
We have multiple transformation programmes underway to simplify our business with clear market strategies and business plans in place. Our service model processes provide a framework for implementing change. We have appropriate executive level oversight for all the transformation activities.Transformation programmes are supported by experienced resources from within the business and externally as required.
Liquidity†
Failure of our business performance to deliver cash as expected; access to funding markets or facilities is restricted; failures in operational liquidity and currency risk management; Tesco Bank cash call; or adverse changes to the pension deficit funding requirement, create calls on cash higher than anticipated, leading to impacts on financial performance, cash liquidity or the ability to continue to fund operations.
53 4
We have a disciplined and policy-based approach to treasury management. We have reduced our debt levels and have improving debt metrics. Liquidity levels and sources of cash are regularly reviewed and the Group maintains access to committed credit facilities.
We maintain an infrastructure of systems, policies and reports to ensure discipline and oversight on liquidity matters, including specific treasury and debt-related issues. Our treasury policies are communicated across the Group and are regularly reviewed by the Board, Executive Committee and management. The Group’s funding strategy is approved annually by the Board and includes maintaining appropriate levels of working capital, undrawn committed facilities and access to the capital markets. The Audit Committee reviews and approves annually the viability and going concern statements and reports into the Board.There is a long-term funding framework in place for the pension deficit and there is ongoing communication and engagement with the Pension Trustees.While recognising that Tesco Bank is financially separate from Tesco PLC, there is ongoing monitoring of the activities of Tesco Bank that could give rise to risks to Tesco PLC.
Competition and markets†
Failure to deliver an effective, coherent and consistent strategy to respond to our competitors and changes in macroeconomic conditions in the operating environment, resulting in a loss of market share and failure to improve profitability.
61 2
We continue to face the ongoing challenge of a changing competitive landscape and price pressure across most of our markets.
Our Board actively develops and regularly challenges the strategic direction of our business and we actively seek to be competitive on price, range and service, as well as developing our online and multiple formats to allow us to compete in different markets.Our Executive Committee and operational management regularly review markets, trading opportunities, competitor strategy and activity and, additionally, we engage in market scanning and competitor analysis to refine our customer proposition.
Brand, reputation and trust†
Failure to create brand reappraisal opportunities to improve quality, value and service perceptions thus failing to rebuild trust in our brand.
1
A broad range of factors impact our brand, reputation and trust in the year and, on balance, the level of risk remains unchanged.
We continue to develop communication and engagement programmes to listen to our customers and stakeholders and reflect their needs in our plans. This includes the supplier viewpoint programme and the integration of local community and local marketing programmes. We continue to maximise the value and impact of our brand with the advice of specialist external agencies and in-house marketing expertise. Maintaining a differentiated brand is one of our strategic priorities and our Group processes, policies and our Code of Business Conduct sets out how we can make the right decisions for our customers, colleagues, suppliers, communities and investors. Our Corporate Responsibility Committee is in place to oversee all corporate responsibility activities and initiatives ensuring alignment with customer priorities and our brand. Further details can be found on page 39.
Technology Failure of our IT infrastructure or key IT systems result in loss of information, inability to operate effectively, financial or regulatory penalties and negatively impacts our reputation.Failure to build resilience capabilities at the time of investing in and implementing new technology.
1 6
Our technology landscape continues to require further investment as external threats increase and the challenges around securing the right capability to deliver change continues.
We continue to assess our technology resilience capabilities and have identified opportunities to make significant enhancements. We are progressing greater adoption of cloud computing technologies to provide further resilience. We have combined governance processes covering both technology disaster recovery and business continuity to ensure alignment. Our technology security programme is designed to continuously strengthen our infrastructure and Information Technology General Controls.
A robust review.
† Indicates that the principal risk has been included as part of the longer term viability scenarios.
23Tesco PLC Annual Report and Financial Statements 2018
Strategic report
•73538_Tesco_AR18_Text pages_Bk_180420_HR.indb 23 20/04/2018 15:43

Principal risk Risk movement Key controls and mitigating factorsData security and data privacy†
Failure to comply with legal or regulatory requirements relating to data security or data privacy in the course of our business activities, results in reputational damage, fines or other adverse consequences, including criminal penalties and consequential litigation, adverse impact on our financial results or unfavourable effects on our ability to do business.
1 6
We continue to enhance our data security to keep pace with increasing threats on a global scale. As a retail organisation we hold a large amount of data and are working to ensure we comply with the General Data Protection Regulations.
Our multi-year data security programme has been driving the enhancement of our security capabilities. We continue to work towards meeting regulatory requirements and regularly report the status of the security programme to governance and oversight committees.We have established a team to detect, report and respond to security incidents in a timely fashion. We have a third-party supplier assurance programme focusing on data security and privacy risks. We are making significant investment across the Group to ensure we comply with the requirements of the General Data Protection Regulation (GDPR) in Europe, and any other relevant legislation globally. We put our customers and our colleagues at the heart of all decisions we make in relation to the processing of personal data. Our privacy compliance programme, driven by the Group Privacy Officer continues to drive compliance throughout our global business.
Political, regulatory and compliance†
Failure to comply with legal and other requirements as the regulatory environment becomes more restrictive, due to changes in the global political landscape, results in fines, criminal penalties for Tesco or colleagues, consequential litigation and an adverse impact on our reputation, financial results, and/or our ability to do business. Long-term changes in the global political environment mean that in some markets there is a push towards greater regulation of foreign investors and a favouring of local companies. 1
We continue to monitor and improve our controls to ensure we comply with legal and regulatory requirements across the Group. Given the ongoing uncertainty around Brexit, we have separated this out as an independent risk for the current year.
Wherever we operate, we aim to ensure that the impact of political and regulatory changes is incorporated in our strategic planning. We manage regulatory risks through the use of our risk management framework and we have implemented compliance programmes to manage our most important risks (e.g. bribery and competition law).Our compliance programmes ensure that sustainable controls are implemented to mitigate the risk and we conduct assurance activities for each risk area.Our Code of Business Conduct is supported by new starter and annual compliance training and other tools such as our whistleblowing hotline. The engagement of leadership and senior management is critical in the successful management of this risk area and leaders provide clear tone from the top for colleagues.
Health and safety Failure to meet safety standards in relation to workplace, resulting in death or injury to our colleagues or third parties.
1
We continue to focus our efforts on controls which ensure colleague and customer safety.
We have a business-wide, risk-based safety framework which defines how we implement safety controls to ensure that colleagues, contractors and customers have a safe place to work and shop. Each business is required to maintain a Safety Improvement Plan to document and track enhancements. Overall governance is provided by the Group Risk and Compliance Committee, with each business unit operating their own Health and Safety Committee.Our annual colleague survey programme allows us to measure safety behaviour improvements Group-wide. The survey results alongside other inputs through the year, informs the delivery of safety initiatives and targeted communications.
People Failure to attract and retain the required capability and continue to evolve our culture could impact delivery of our purpose and strategic drivers.
1 6
We continue to operate in a fast changing and complex legislative environment. Market competitiveness and volatility affects our ability to attract and retain key specialist talent thereby increasing this risk.
We seek to understand and respond to colleagues’ needs by listening to their feedback from open conversations, social media, colleague surveys and performance reviews. Talent planning and people development processes are well established across the Group. Talent and succession planning is discussed annually by the Board and three times a year at the Executive Committee and Nominations and Governance Committee. The Remuneration Committee agrees objectives and remuneration arrangements for senior management, and the current remuneration policy is due for review at this year’s Annual General Meeting. There is a change programme in place, supported by Executive Committee and Audit Committee governance, to deliver technology and processes that are simple, helpful and trusted to all our markets.
Responsible sourcing and supply chain Failure to meet product safety standards resulting in death, injury or illness to customers.Failure to ensure that products are sourced responsibly and sustainably across the supply chain (including fair pay for workers, adhering to human rights, clean and safe working environments and that all social and environmental standards are met), leading to breaches of regulations, illness, injury or death to workers and communities.1 6
New principal risk. We have product standards, policies and guidance covering both food and non-food, as well as goods and services not for resale, ensuring that products are safe, legal and of the required quality, and that the human rights of workers are respected and environmental impacts are managed responsibly. Refer to pages 16 to 21 for specific actions highlighted under our Little Helps Plan.Supplier audit programmes are in place to monitor product safety, traceability and integrity, human rights and environmental standards, including unannounced specification inspections of suppliers and facilities.We run colleague training programmes on food and product safety, responsible sourcing, hygiene controls and provide support for stores. We also provide targeted training for colleagues and suppliers dealing with specific challenges such as modern slavery. Our store audit programme seeks to ensure we comply with safety and legal requirements.
Booker synergy realisation and integration Failure to successfully integrate Booker is dependent upon a number of factors, leading to a risk to our planned synergy commitments and value creation. 1 5 63 4
New principal risk. A detailed synergy realisation and integration plan is being implemented with period-end reporting and tracking of targeted benefits and key performance indicators.For further information on the Tesco and Booker merger see page 7.
† Indicates that the principal risk has been included as part of the longer term viability scenarios.
Tesco PLC Annual Report and Financial Statements 201824
Principal risks and uncertainties continued
•73538_Tesco_AR18_Text pages_Bk_180420_HR.indb 24 20/04/2018 15:43

Longer term viability statement1. The context for assessmentThe aim of the viability statement is for the Directors to report on the assessment of the prospects of the Company meeting its liabilities over the assessment period, taking into account the current financial position, outlook and principal risks.
The Directors have based their assessment of viability on the Group’s current strategic plan, which is updated and approved annually by the Board, delivering the Group’s purpose of ‘serving shoppers a little better every day’ and underpinned by the six strategic drivers (detailed on pages 8 and 9). The strategic plan necessarily makes assumptions relating to: the prevailing economic climate and global economy; the structural challenges facing our sector; competitor actions; market dynamics; changing customer behaviours; and the costs associated with delivering the strategy. Strategic plans also address and respond to the Group’s principal risks.
2. The assessment periodThe Directors have assessed the viability of the Company over a three-year period to February 2021. The Directors have determined that a three-year period is an appropriate timeframe for assessment, given the dynamic nature of the retail sector and product offering, and is in line with the Company’s strategic planning period.
3. Assessment of viabilityThe viability of the Company has been assessed taking into account the Company’s current financial position, including external funding in place over the assessment period, and after modelling the impact of certain scenarios arising from the principal risks which have the greatest potential impact on viability in that period.
Four scenarios have been modelled, considered severe but plausible, that encompass these identified risks. None of these scenarios individually threaten the viability of the Company, therefore the compound impact of these scenarios has been evaluated as the most severe stress scenario.
These scenarios assumed that external debt is repaid as it becomes due and includes consolidation of the Booker business and associated synergies.
ScenarioAssociated principal risks Description
Competitive pressure
– Brand, reputation and trust
– Competition and markets
– Customer
Failure to respond to fierce competition and changes in the retail market drives sustained significant like-for-like volume decline in core food categories with no offsetting price inflation, putting pressure on margins.
Data security or regulatory breach
– Brand, reputation and trust
– Data security and data privacy
– Political, regulatory and compliance
A serious data security or regulatory breach results in a significant monetary penalty and a loss of reputation among customers.
Brexit impact – Competition and markets
– Political, regulatory and compliance
– Brexit
Brexit continues to drive higher UK domestic inflation and increased import costs from a weaker Sterling, compounded by new import duties and tariffs, with a consequential economic impact.
Reduction in cost savings and cash generation
– Transformation – Liquidity
Failure to achieve the Group’s transformation objectives, resulting in an inability to progress sufficiently quickly to maintain or increase operating margin and generate sufficient cash to meet business objectives.
The scenarios above are hypothetical and purposefully severe for the purpose of creating outcomes that have the ability to threaten the viability of the Group. In the case of these scenarios arising, various options are available to the Group in order to maintain liquidity so as to continue in operation such as: accessing new external funding early; more radical short-term cost reduction actions; and reducing capital expenditure. None of these actions are assumed in our current scenario modelling.
4. ConclusionBased on these severe but plausible scenarios, the Directors have a reasonable expectation that the Company will continue to operate and meet its liabilities as they fall due over the three-year period considered.
This Strategic report, which has been prepared in accordance with the requirements of the Companies Act 2006, has been approved and signed on behalf of the Board.
Robert Welch Group Company Secretary10 April 2018
Principal risk Risk movement Key controls and mitigating factorsBrexit†
Failure to prepare for the UK’s departure from the EU causes disruption to and creates uncertainty around our business including: our ability to recruit; as well as impacting our relationships with existing and future customers, suppliers and colleagues. These disruptions and uncertainties could have an adverse effect on our business, financial results and operations.
1
New principal risk. The nature of the UK’s future trading relationship with the EU is still to be determined. We continue to contribute to important public policy discussions and engage with government, regulatory bodies and industry.As further details of the terms of our departure from the EU emerge, we will continue to assess and monitor the potential risks and impacts of these on Tesco customers, colleagues and shareholders and take appropriate measures.
Tesco Bank Tesco Bank is exposed to a number of risks, the most significant of which are operational risk, regulatory risk, credit risk, capital risk, funding and liquidity risk, market risk and business risk.
1
The Bank continues to actively manage the risks to which it is exposed.
The Bank has a defined risk appetite, which is approved and reviewed regularly by both the Bank’s Board and the Tesco PLC Board. The risk appetite defines the type and amount of risk that the Group is prepared to accept to achieve its objectives and forms a key link between the day-to-day risk management of the business and its strategic priorities, long-term plan, capital planning and liquidity management. Adherence to risk appetite is monitored through a series of ratios and limits. The Bank operates a risk management framework that is underpinned by governance, policies, processes and controls, reporting, assurance and stress testing. There is Bank Board risk reporting throughout the year, with updates to the Tesco PLC Audit Committee by the Bank’s Chief Financial Officer, Chief Risk Officer and Audit Committee Chairman. A member of the Tesco PLC Board is also a member of the Bank’s Board.
† Indicates that the principal risk has been included as part of the longer term viability scenarios.
25Tesco PLC Annual Report and Financial Statements 2018
Strategic report
•73538_Tesco_AR18_Text pages_Bk_180420_HR.indb 25 20/04/2018 15:43

Board effectiveness reviewThe Board carries out an annual evaluation of its effectiveness. Having undertaken an external review in 2015/16 and an internal review overseen by me in 2016/17, the 2017/18 review was overseen by Deanna Oppenheimer, our Senior Independent Director, which encompassed the areas recommended for improvements in 2016/17. The results of the review are set out on page 35, together with information about our progress against the 2016/17 review actions.
Succession planningWhile much of the scrutiny of succession plans for the levels of management immediately below Executive Committee has been delegated to the Nominations and Governance Committee, the Board remains focused on ensuring that our talent pipeline is managed to support our long-term strategy. The Board allocates significant time to discuss succession planning and talent development of the Executive Committee. During the year, the Board further increased its engagement with talent development and conducted a comprehensive review of the Executive Committee talent pipeline, focusing on their specific development needs against the future plans and requirements for our business. The Board reviewed assessments of a number of senior leaders and discussed their leadership qualities, strengths and areas for development. From this review, we have developed our medium and long-term succession plans.
RemunerationOur approach to reward aims to establish a framework that is fair and balanced, and provide a clear and demonstrable link between remuneration and delivery of the Group’s key strategic objectives, while delivering long-term and sustainable returns to shareholders. This year, we will be seeking shareholder support for a new remuneration policy, which will formally apply, subject to shareholder approval, from the date of the 2018 AGM.
CultureAt Tesco we recognise that culture plays a fundamental role in the delivery of strategy and the Board is ultimately responsible for ensuring that our activities reflect the culture we wish to instil in our colleagues and other stakeholders to drive the right behaviours. The Board is committed to promoting a strong and positive culture and upholding our well-established core values that underline how we run our business:
– Nobody tries harder for our customers. – We treat people how they want to be treated. – Every little help makes a big difference.
One of my goals as Chairman is to build a culture in which we fully understand our stakeholders – customers, colleagues, suppliers, shareholders and our communities – and what matters to them, and then act by changing and innovating to meet their needs. At the Board, there is a clear emphasis on setting the tone from the top and leading by example.
The Board receives reports throughout the year on stakeholder issues and concerns, including details of our Group-wide employee engagement surveys, which include data on whether colleagues recommend us as a great place to work and shop, results of our supplier satisfaction surveys and statistics on our customers recommending Tesco as a great place to shop and coming back time and again, which are three of the Big 6 KPIs set out in the Strategic report. We engage also with our shareholders through a full calendar of events and meetings, including the AGM and General Meeting on the Booker Group merger, and the Board receives details of our impact on our communities through the Corporate Responsibility Committee. The Board places great importance on these reports, which help inform our decisions, track progress and monitor culture.
Dear ShareholderAt Tesco, we recognise the importance of good corporate governance in supporting the long-term success and sustainability of our business. We strive to maintain a robust and effective governance framework which supports the application and execution of our strategy and remains consistent with our values.
Board role and effectivenessThe core objective of the Board is to create and deliver the long-term success of the Company and long-term returns for shareholders. This requires the Board to set the Company’s strategic aims, ensure that the necessary financial and human resource structures are in place to achieve the Company’s objectives, provide oversight of management’s performance in delivering against strategy on a day-to-day basis and set the Company’s risk appetite. The Board is aware of its obligations to the Company’s shareholders and other stakeholders and responds to their needs by transparent reporting and active engagement.
My role as Chairman is to lead the Board and to ensure that Tesco has a Board which works effectively in all aspects of its role. A key part of that role is to ensure the Board works collaboratively with the executive team, providing support and guidance to complement and enhance the work undertaken, constructively challenge management when necessary and exercise an appropriate level of rigorous enquiry and intellectual debate. This involves having Directors with the right range and balance of skills, experience and attributes, including a broad diversity of perspectives, for the Board and for Tesco. I believe we have this on our Board, enhanced by the appointments of Stewart Gilliland and Charles Wilson in March 2018 following the successful completion of the Booker Group Merger.
GovernanceWe are committed to maintaining high standards of corporate governance within Tesco. Over the last few years, we have worked hard to ensure that good governance is part of our way of thinking and working, and underpins how we conduct ourselves every day. Our governance framework ensures robust, informed and transparent decision-making processes and the Board encourages open discussion and constructive challenge.
There has been much focus on corporate governance recently and the standards continue to change and evolve. To ensure sufficient time is devoted to understanding and discussing governance matters, during the year we enhanced the remit of the Nominations Committee to include the oversight of the Group’s governance framework and renamed it the Nominations and Governance Committee. The Committee has reviewed the FRC’s proposals to revise the UK Corporate Governance Code and we will report further on the changes to Tesco’s governance framework in next year’s Annual Report, in anticipation of the revised Code becoming effective in the 2019/20 financial year.
‘ Your Board firmly believes that a sound governance framework is essential in supporting management in delivery of the Group’s strategy to drive business success.’John Allan Non-executive Chairman
Chairman’s introduction.
Tesco PLC Annual Report and Financial Statements 201826
Corporate governance report
•73538_Tesco_AR18_Text pages_Bk_180420_HR.indb 26 20/04/2018 15:43

Diversity and inclusionThe Board has previously highlighted that it is an advocate of diversity in its broadest sense in the boardroom and a supporter of the Hampton-Alexander report, which aims to raise the proportion of women on UK Boards to at least one-third by the end of 2020, and the Parker report on ethnic diversity on the Board. We have also become a member of the 30% Club, which is an organisation that encourages businesses to achieve 30% female representation on their Boards and also in their senior leadership teams.
Board membership reflects a wide range of skills and business experience drawn from a number of industries, which is critical for bringing both the expertise required, and to enable different perspectives to be brought to Board discussions. The combination of these factors mean that the Board benefits from a diverse range of competencies, perspectives and thoughts, providing an ability to challenge on strategic issues and a dynamic environment for decision-making.
The Board remains of the opinion that appointments to the Board should be made on merit relative to a number of different criteria including diversity of gender, cultural background, independence and personal attributes, alongside the appropriate skill set, experience and expertise. Although we have not established a formal policy, the Board intends to continue with this approach to diversity in all aspects, while maintaining the principle that all future appointments to the Board must also complement the balance of skills that the Board already possesses. The role of succession planning in promoting diversity is acknowledged and the Group has a range of policies to help provide mentoring and development opportunities.
The Board recognises the need to create the conditions that foster talent and encourage all employees to achieve their full career potential in the Group. As part of our overall approach to inclusion we have established an External Advisory Panel to help guide our inclusion agenda and implemented an Inclusion Strategy which aims to ensure that everyone is welcome at Tesco. We also have a number of well-established colleague networks, including Women at Tesco, BAME at Tesco, Armed Forces at Tesco, Disability at Tesco and Out at Tesco, which provide support to allow colleagues to be themselves at work and develop within Tesco.
Further details of the Group’s approach to diversity can be found online at www.tescoplc.com.
ConclusionLooking forward to 2018/19, the Board and I will continue to focus on the effective oversight of the Company and progress against our purpose of serving shoppers a little better every day.
John AllanNon-executive Chairman
Corporate governance
27Tesco PLC Annual Report and Financial Statements 2018

John Allan CBE Non-executive Chairman N R C Appointed 1 March 2015 Tenure 3 years Board meeting attendance 6/6
Skills and experienceJohn has significant board, retail and financial experience gained from both the commercial and financial sectors. He was CEO of Exel PLC and when it was acquired by Deutsche Post in 2005 he joined the board of Deutsche Post, becoming CFO in 2007 until his retirement in 2009. John was Chairman of Dixons Retail plc during its turnaround period, and following its merger with Carphone Warehouse was Deputy Chairman and Senior Independent Director of Dixons Carphone until 2015. He was also previously a non-executive director of Worldpay Group PLC, National Grid plc, the UK Home Office Supervisory Board, 3i plc, PHS Group plc, Connell plc, Royal Mail plc, Wolseley plc and Hamleys plc.
External appointments – Chairman of Barratt Developments PLC; – Chairman of London First; and – Vice President of the Confederation of British Industry.
Mark Armour Independent Non-executive Director A Appointed 2 September 2013 Tenure 4.5 years Board meeting attendance 6/6
Skills and experienceMark has significant strategic planning and financial expertise, as well as experience of executive leadership. He was CFO of Reed Elsevier Group plc (now RELX Group plc) and its two parent companies, Reed Elsevier PLC and Reed Elsevier NV, from 1996 to 2012. This role has provided him with considerable experience of digital business transition and operating in a multi-channel environment. Prior to joining Reed Elsevier, he was a partner at Price Waterhouse in London. He was previously a non-executive director and chair of the audit committee of SABMiller PLC.
External appointments – Non-executive director of the Financial Reporting Council; and
– Member of the Takeover Panel (from 1 May 2018).
Stewart Gilliland Independent Non-executive Director Appointed 5 March 2018
Skills and experienceStewart has significant business and management experience in international markets, specifically those in Europe, having previously held roles with leading consumer-facing companies, including Whitbread and Interbrew. He held the position of Chief Executive of Muller Dairies UK and Ireland until 2010. Prior to joining Tesco, he was Chairman of Booker Group plc.
External appointments – Senior Independent Director of Mitchells & Butlers plc;
– Non-executive director of C&C Group plc; – Non-executive director of Curious Drinks Ltd; and – Director of Nature’s Way Foods Ltd.
Steve Golsby Independent Non-executive Director R C Appointed 1 October 2016 Tenure 1.5 years Board meeting attendance 6/6
Skills and experienceSteve has a wealth of knowledge of operating internationally, specifically significant leadership experience in Asia. He has a strong background in consumer marketing and held senior executive positions with Bristol Myers Squibb and Unilever, before being appointed President of Mead Johnson Nutrition, a leading global infant nutrition company, in 2004. He was President and CEO from 2008 to 2013 and a non-executive director from 2013 to 2017. He was also previously a non-executive director of Beam Inc.
External appointments – Non-executive director of RMA Group; – Advisor to Thai Union Group PLC, a global leader in the seafood industry; and
– Honorary Investment Advisor to the Thailand Board of Investment.
Byron Grote Independent Non-executive Director AN R Appointed 1 May 2015 Tenure 3 years Board meeting attendance 6/6
Skills and experienceByron brings broad financial and international experience to the Board, having worked across BP PLC in a variety of commercial, operational and executive roles covering numerous geographies. Byron’s strategic focus and financial experience complements the balance of skills on the Board and makes him ideal for the role of Chair of the Audit Committee. He served on the BP PLC board from 2000 until 2013 and was BP’s CFO during much of that period. He was previously a non-executive director of Unilever PLC.
External appointments – Vice Chairman of the Supervisory Board of Akzo Nobel NV;
– Non-executive director of Anglo American PLC; and
– Non-executive director of Standard Chartered PLC.
Dave Lewis Group Chief Executive Appointed 1 September 2014 Tenure 3.5 years Board meeting attendance 6/6
Skills and experienceDave has significant experience in brand marketing, customer management and general management. Prior to joining Tesco, he worked for Unilever for nearly 30 years in a variety of different roles across Europe, Asia and the Americas. He has experience across many sectors in the UK and overseas, and has been responsible for a number of business turnarounds. He was previously a non-executive director of Sky PLC.
External appointments – Member of the Governance Committee of the Consumer Goods Forum; and
– Chair of Champions 12.3, a UN programme seeking to add momentum to the achievement of the UN Sustainable Development Target 12.3 by 2030.
Mikael Olsson Independent Non-executive Director R C Appointed 1 November 2014 Tenure 3.5 years Board meeting attendance 6/6
Skills and experienceMikael joined the Tesco Board after an extensive career at IKEA Group, holding a variety of senior roles including being a member of the executive committee from 1995 until 2013 and holding the position of CEO and President from 2009 until 2013. He brings a wealth of retail and value chain experience as well as knowledge of sustainability, people and strategy in an international environment.
Board of Directors.
Tesco PLC Annual Report and Financial Statements 201828
Corporate governance report continued

He was previously a non-executive director and vice chairman of Volvo Cars AB.
External appointments – Non-executive director of Ikano S.A.; – Non-executive director of Lindengruppen AB; – Non-executive director of The Royal Schiphol Group; and
– Member of the Nominations Committee of Volvo Cars AB.
Deanna Oppenheimer Senior Independent Director N R C Appointed 1 March 2012 Tenure 6 years Board meeting attendance 6/6
Skills and experienceDeanna has significant marketing, brand management and consumer knowledge and experience, bringing a broad perspective to the Board. She held several senior roles at Barclays plc, including Chief Executive of UK Retail and Business Banking and Vice Chair of Global Retail Banking. Deanna was appointed as Chair of Hargreaves Lansdown plc in February 2018. She is also currently a non-executive director of the US fresh-prepared food company, Joshua Green Corporation and is the founder of advisory firm, CameoWorks LLC, which provides bespoke support to early stage companies. Deanna was previously a non-executive director of NCR Corporation and Worldpay, Inc. Her extensive board, investor and commercial experience makes her a strong Senior Independent Director and Chair of the Remuneration Committee.
External appointments – Chair of Hargreaves Lansdown plc; – Non-executive director of AXA Group; – Non-executive director of Whitbread PLC; – Non-executive director of Joshua Green Corp; – Founder of consumer-focused boutique advisory firm, CameoWorks LLC; and
– Senior advisor to Bain & Company.
Simon Patterson Independent Non-executive Director A Appointed 1 April 2016 Tenure 2 years Board meeting attendance 6/6
Skills and experienceSimon has extensive knowledge of and years of experience in finance, technology and global operations gained in various management and leadership roles. He was a member of the founding management team of the logistics software company Global Freight Exchange and has worked at the Financial Times and McKinsey & Company. He has previously served on the boards of Skype, MultiPlan, Cegid Group, Intelsat, Gerson Lehrman Group and N Brown Group.
Alan Stewart Chief Financial Officer Appointed 23 September 2014 Tenure 3.5 years Board meeting attendance 6/6
Skills and experienceAlan brings to the Board significant corporate finance and accounting experience from a variety of highly competitive industries, including retail, banking and travel, as well as executive leadership experience within a listed company environment. Prior to joining Tesco, he was UK CEO and CFO of Thomas Cook Holdings, Group Finance Director of WHSmith plc and CFO for AWAS and Marks & Spencer plc. He was previously a non-executive director of Games Workshop Group plc.
External appointments – Non-executive director of Diageo plc; – Non-executive director of Tesco Bank; – Member of the Advisory Board, Chartered Institute of Management Accountants; and
– Member of the Main Committee and Chairman of the Pension Committee of the 100 Group of Finance Directors.
Charles Wilson CEO, UK & ROI Appointed 5 March 2018
Skills and experienceCharles started his career in 1986 with Procter & Gamble following which he was a consultant with OC&C Strategy Consultants and a director of Abberton Associates. In 1998 he became an executive director of Booker Group plc which merged with Iceland plc in 2000. In 2001 he became an executive director of Arcadia Group plc and in 2004 he became an executive director of Marks & Spencer plc. In 2005 he was appointed as Chief Executive of Booker Group plc.
External appointments – Managing Director of Silver Lake Partners, a leading global technology investment firm;
– Board member of Dell and FlixBus; – Trustee of the Natural History Museum; and – Trustee of the Royal Foundation of the Duke and Duchess of Cambridge and Prince Harry.
Alison Platt Independent Non-executive Director R Appointed 1 April 2016 Tenure 2 years Board meeting attendance 6/6
Skills and experienceAlison has extensive experience of the property sector and customer service delivery through her role as Chief Executive of Countrywide plc, which she held until January 2018. She also has significant business-to-business and international commercial experience, having held a number of senior positions at Bupa. Alison’s experience as a CEO enables her to provide challenge and advice to the Board across a range of issues. Alison was previously Chair of Opportunity Now, which seeks to accelerate change for women in the workplace, as well as a non-executive director of the Foreign & Commonwealth Office and Cable & Wireless Communications PLC.
Lindsey Pownall OBE Independent Non-executive Director C Appointed 1 April 2016 Tenure 2 years Board meeting attendance 6/6
Skills and experienceLindsey has substantial experience in food, grocery and retail brand development, having enjoyed a career of over 20 years at Samworth Brothers, the leading UK supplier of premium quality chilled and ambient foods. She joined the Samworth Board in 2001 and served as Chief Executive between 2011 and 2015. Lindsey is a passionate advocate of supplier relationships, customers, colleagues and sustainability which directly support Tesco’s strategy and her role as Chair of the Corporate Responsibility Committee.
External appointments – Non-executive director of Meadow Foods Limited;
– Non-executive director of Story Contracting Limited; and
– Non-executive director of Story Homes Limited.
Committee membership (at 10 April 2018)N Nominations and Governance CommitteeA Audit CommitteeR Remuneration CommitteeC Corporate Responsibility Committee
Chair of Committee
Independent Board member
29Tesco PLC Annual Report and Financial Statements 2018
Corporate governance

Alison Horner Chief People OfficerAlison joined the Executive Committee on 1 March 2011.
ResponsibilitiesAlison is responsible for setting the people strategy and plans at Tesco, including reward, colleague experience and capability.
Skills and experienceAlison joined Tesco in 1999 as a Personnel Manager, and was promoted to Personnel Director for Tesco’s UK stores in 2000. After that she worked running stores and leading change programmes before her promotion to Chief People Officer in 2011. Alison is a Tesco Pension Trustee and a member of the Manchester Business School Advisory Board.
Jane Lawrie Group Communications Director Jane joined the Executive Committee on 10 October 2016.
ResponsibilitiesJane is responsible for rebuilding trust in the Tesco brand and its businesses.
Skills and experienceJane has over 25 years’ experience of corporate, financial, colleague and digital communications. She joined Tesco from Coca-Cola, where she led European public affairs and communications. She has significant experience in advising businesses on trust and corporate reputation through previous roles at Diageo and Boots.
Dave Lewis Group Chief Executive Dave joined the Board and the Executive Committee on 1 September 2014. His full biography appears on page 28.
Alessandra Bellini Chief Customer OfficerAlessandra joined the Executive Committee on 1 March 2017.
ResponsibilitiesAlessandra is responsible for building the Tesco brand globally and putting the customer at the heart of everything that we do.
Skills and experiencePrior to Tesco, Alessandra worked at Unilever for over 21 years, latterly as Vice President for the Food Category in North America and Food General Manager for the USA. Previously, she had a 12-year career in advertising, working both in Italy and the UK. An international executive, Alessandra has held roles in North America, the UK, Italy and Central and Eastern Europe.
Tony Hoggett CEO, Asia Tony joined the Executive Committee on 1 April 2017.
ResponsibilitiesTony is responsible for Tesco’s businesses in Thailand and Malaysia, as well as its joint ventures in India and China. He also leads our business partnerships across the region.
Skills and experienceTony joined Tesco in 1990 and has served in a range of leadership roles in the UK and Asia over the last three decades. Between 2007 and 2011 he held the roles of VP South China, as well as President North China, before moving to Turkey as Chief Operating Officer for Tesco Kipa. In 2011, Tony returned to the UK as Managing Director for Superstores, before becoming Managing Director, Tesco Extra and a board member of Tesco Mobile in 2012. In 2014, he joined the UK Leadership Team as Retail Director and then was appointed Chief Operating Officer UK in 2016. In April 2017, Tony was appointed to his current role of CEO, Asia.
Executive Committee.
Tesco PLC Annual Report and Financial Statements 201830
Corporate governance report continued

Jason Tarry Chief Product OfficerJason joined the Executive Committee on 1 January 2015.
ResponsibilitiesJason is responsible for setting the strategy and policy for the planning, ranging, sourcing and supply of the products we sell across the Group. In addition, he has direct responsibility for managing this for the UK.
Skills and experienceJason joined Tesco in October 1990 on the graduate recruitment programme. He has held a number of positions in the UK and internationally across both food and non-food divisions. Jason became CEO for clothing across the Group in 2012 before being appointed as Chief Product Officer in January 2015.
Charles Wilson CEO, UK & ROICharles joined the Board and the Executive Committee on 5 March 2018. His full biography appears on page 29.
Adrian Morris Group General Counsel Adrian joined the Executive Committee on 6 September 2012.
ResponsibilitiesAdrian is responsible for the legal, company secretarial, government relations, regulatory and compliance functions across Tesco.
Skills and experienceAdrian joined Tesco in September 2012 as Group General Counsel. Prior to Tesco, Adrian worked at BP PLC as Associate General Counsel for Refining and Marketing and prior to that at Centrica PLC, initially as European Group General Counsel and then as General Counsel for British Gas.
Matt Simister CEO, Central EuropeMatt joined the Executive Committee on 1 April 2017.
ResponsibilitiesMatt is responsible for all of Tesco’s businesses in the Czech Republic, Hungary, Poland and Slovakia.
Skills and experienceMatt joined Tesco in 1996 as a marketer. He built on his UK experience with three years as Commercial Director for our Czech and Slovak businesses. Following which, he returned to the UK to set up our Group Food capability, managing our regional fresh food and Tesco Brand sourcing, buying and inbound supply chains for the UK, ROI, Central Europe and Asia. In April 2017, Matt was appointed to his current role of CEO, Central Europe.
Alan StewartChief Financial OfficerAlan joined the Board and the Executive Committee on 23 September 2014. His full biography appears on page 29.
31Tesco PLC Annual Report and Financial Statements 2018
Corporate governance

Governance frameworkThe Board and Executive Committee operate within a wider governance framework at Tesco. This ensures that decisions are taken at the right level of the business by the colleagues best placed to take them. Our framework provides clear direction on decision-making without creating burdensome
processes that could impede progress. We retain the agility to get on with running our business while maintaining high standards of governance. The Governance Framework is designed to safeguard and enhance long-term shareholder value and provide a platform to realise the Group’s strategy. Our system of internal control and risk management arrangements are integral to our Governance Framework.
Matters reserved for the Board’s decision
• Group’s strategic and operating plans.• Risk appetite.
• Long-term plans and budgets.• Financial results, viability statement
and governance.• Material contracts.
• Capital and liquidity matters.• Major acquisitions, mergers and disposals.
Audit Committee Read more on page 40
Remuneration CommitteeRead more on page 45
Nominations and Governance Committee
Read more on page 38
Corporate Responsibility Committee
Read more on page 39
Chairman • Leads the Board and
promotes a culture of open debate between Executive
and Non-executive Directors.• Promotes high standards of
corporate governance.• Ensures the effectiveness
of the Board.• Available to investors.
Senior Independent Director
• Acts as a sounding board for the Chairman and appraises
his performance.• Serves as a trusted intermediary for other Non-executive Directors
and shareholders, as required.• Available to investors.
Non-executive Directors• Provide sound judgement,
objectivity and experience to Board deliberations.
• Contribute to developing strategy.• Scrutinise and constructively challenge the performance of management in the execution
of our strategy.
Chief ExecutiveExecutive leadership and day-to-day management
of Tesco to ensure delivery of the strategy determined
by the Board.
Risk and Compliance Committee
Set and monitor the implementation and effectiveness of risk and compliance standards
across the Group.
Disclosure CommitteeTo verify the integrity of
material information and ensure compliance with regulations.
Executive CommitteeMake and implement operational decisions, while running Tesco’s
day-to-day business.
The Board
Roles and responsibilities
• Setting the Group’s culture, standards and values, and ensuring that its obligations to shareholders and other stakeholders are
understood and met.• Determining strategic direction and
demonstrating leadership.• Focusing on matters that consistently add value
for our shareholders and other stakeholders.• The governance and stewardship of the Group.
• Board and Committee appointments.• Ensuring that management maintains
a system of internal control and risk management arrangements.
Tesco PLC Annual Report and Financial Statements 201832
Corporate governance report continued

20%
Financial performanceand risk
Strategy development and planning
Reviews of our businesses
Other corporate activities, including stakeholders
28% 23% 29%
Board activity in 2017/18
UK Corporate Governance Code complianceThe Board confirms that throughout the year ended 24 February 2018 the Company applied the main principles and complied with the relevant provisions set out in the UK Corporate Governance Code (Code) issued by the Financial Reporting Council (FRC) in April 2016. The Code can be found on the FRC website www.frc.org.uk.
LeadershipOur Board and CommitteesThe Board has a collective responsibility to promote the long-term success of the Company and is accountable to shareholders for ensuring that the Group is appropriately managed and achieves the strategic objectives it sets, in a way that is supported by the right culture, values and behaviours throughout the Group. In this performance of its duties, it has due regard to the interests of other key stakeholders and is aware of the potential impact of the decisions it makes. To support the Board’s role in establishing the strategic objectives and policies of the Group, it has a well-defined Governance Framework as shown on page 32.
Board activityThe Board is the decision-making body for those matters that are considered of significance to the Group owing to their strategic, financial or reputational implications or consequences. To retain control of these key decisions, certain matters have been identified that only the Board may approve and there is a formal schedule of powers reserved to the Board, as shown in the Governance Framework on page 32.
Specific responsibilities have been delegated to the Board Committees, each of which is responsible for reviewing and dealing with matters within its own terms of reference. Each Committee reports to, and has its terms of reference approved by, the Board. The Committee papers and minutes are shared with all Directors.
At Board meetings, we receive and consider papers and presentations from the Executive Directors on relevant topics and senior management are regularly invited to attend meetings for specific items. This enables the Non-executive Directors to engage with colleagues from across the Group. Effective review and decision-making is supported by providing the Board with high quality, accurate, clear and timely information, including input from advisers where necessary. If a Director were to have any material concerns, these would be recorded in minutes of meetings, and on resignation any Non-executive Director having such concerns would provide a written statement to the Chairman and the Board.
Board meetings are structured around the following areas:
– financial performance and risk; – strategy development and planning; – reviews of our businesses; and – other corporate activities, including stakeholders.
Details of the proportion of time spent by the Board in 2017/18 in these areas are set out below.
Division of responsibilitiesThe Board has agreed a clear division of responsibilities between the running of the Board and running the business of the Group. The responsibilities of the Chairman, Group Chief Executive, Senior Independent Director and other Directors are clearly defined, as shown in our Governance Framework on page 32, so that no individual has unrestricted powers of decision.
The Group Chief Executive is supported by the Executive Committee, and the Group’s senior management structure has been designed to support management’s decision-making responsibilities, aligned to personal accountability and delegated authority, while embedding risk and control in business decision-making.
– Risk management – Review of internal controls – Financial results – Annual and half-yearly reports – Dividend – CFO reports
– Strategy day – Portfolio update – Competitors – Maximising property value – Technology update – Brexit – Customer insight
– UK & ROI – Central Europe – Asia – Joint ventures – Tesco Mobile – Tesco Bank – F&F – dunnhumby
– Customers, Colleagues, Suppliers & Shareholders
– Succession planning and talent management
– CEO reports – Litigation reports – Committee reports – Board effectiveness – Health and Safety
33Tesco PLC Annual Report and Financial Statements 2018
Corporate governance
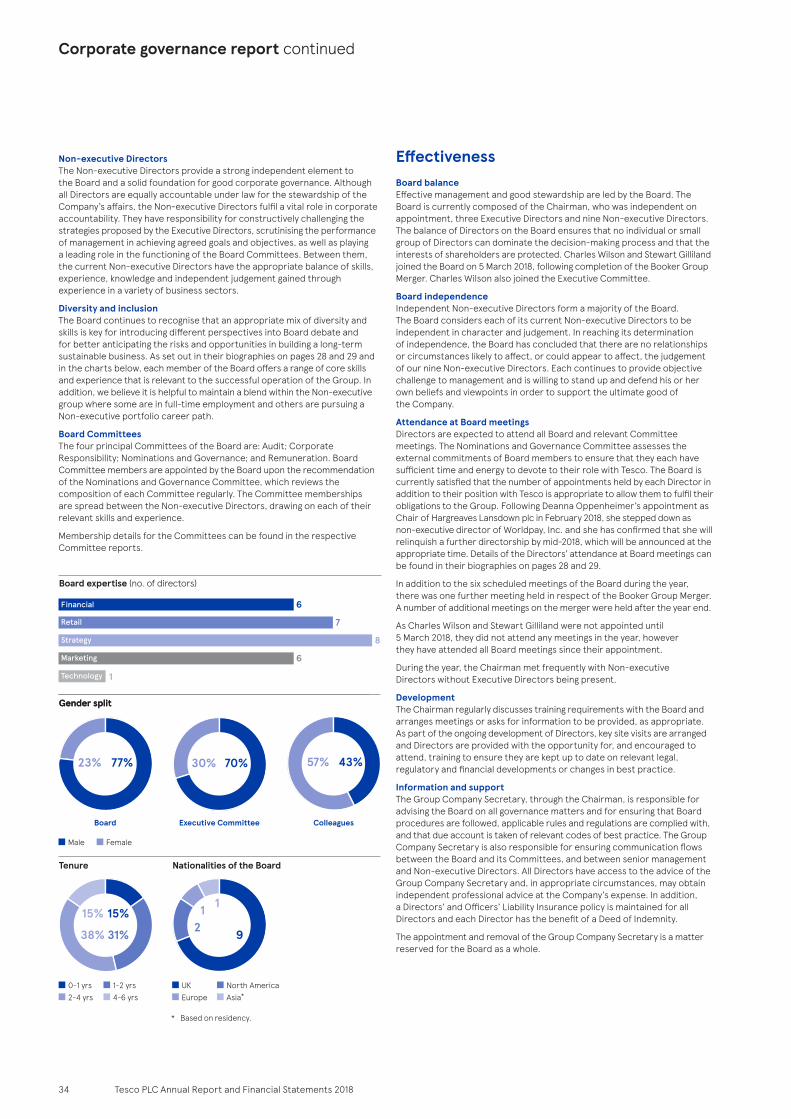
Board expertise (no. of directors)
Board
27% 73%
Executive Committee
30% 70%
Male Female
Colleagues
57% 43%
38%
15% 15%
31%
0-1 yrs2-4 yrs 4-6 yrs
1-2 yrs
1 1
92
UKEurope Asia*
North America
Financial
Retail
Strategy
Marketing
Technology
6
7
8
6
1
Gender split
23% 77%
Gender split
Tenure Nationalities of the Board
Non-executive Directors The Non-executive Directors provide a strong independent element to the Board and a solid foundation for good corporate governance. Although all Directors are equally accountable under law for the stewardship of the Company’s affairs, the Non-executive Directors fulfil a vital role in corporate accountability. They have responsibility for constructively challenging the strategies proposed by the Executive Directors, scrutinising the performance of management in achieving agreed goals and objectives, as well as playing a leading role in the functioning of the Board Committees. Between them, the current Non-executive Directors have the appropriate balance of skills, experience, knowledge and independent judgement gained through experience in a variety of business sectors.
Diversity and inclusionThe Board continues to recognise that an appropriate mix of diversity and skills is key for introducing different perspectives into Board debate and for better anticipating the risks and opportunities in building a long-term sustainable business. As set out in their biographies on pages 28 and 29 and in the charts below, each member of the Board offers a range of core skills and experience that is relevant to the successful operation of the Group. In addition, we believe it is helpful to maintain a blend within the Non-executive group where some are in full-time employment and others are pursuing a Non-executive portfolio career path.
Board CommitteesThe four principal Committees of the Board are: Audit; Corporate Responsibility; Nominations and Governance; and Remuneration. Board Committee members are appointed by the Board upon the recommendation of the Nominations and Governance Committee, which reviews the composition of each Committee regularly. The Committee memberships are spread between the Non-executive Directors, drawing on each of their relevant skills and experience.
Membership details for the Committees can be found in the respective Committee reports.
EffectivenessBoard balanceEffective management and good stewardship are led by the Board. The Board is currently composed of the Chairman, who was independent on appointment, three Executive Directors and nine Non-executive Directors. The balance of Directors on the Board ensures that no individual or small group of Directors can dominate the decision-making process and that the interests of shareholders are protected. Charles Wilson and Stewart Gilliland joined the Board on 5 March 2018, following completion of the Booker Group Merger. Charles Wilson also joined the Executive Committee.
Board independenceIndependent Non-executive Directors form a majority of the Board. The Board considers each of its current Non-executive Directors to be independent in character and judgement. In reaching its determination of independence, the Board has concluded that there are no relationships or circumstances likely to affect, or could appear to affect, the judgement of our nine Non-executive Directors. Each continues to provide objective challenge to management and is willing to stand up and defend his or her own beliefs and viewpoints in order to support the ultimate good of the Company.
Attendance at Board meetingsDirectors are expected to attend all Board and relevant Committee meetings. The Nominations and Governance Committee assesses the external commitments of Board members to ensure that they each have sufficient time and energy to devote to their role with Tesco. The Board is currently satisfied that the number of appointments held by each Director in addition to their position with Tesco is appropriate to allow them to fulfil their obligations to the Group. Following Deanna Oppenheimer’s appointment as Chair of Hargreaves Lansdown plc in February 2018, she stepped down as non-executive director of Worldpay, Inc. and she has confirmed that she will relinquish a further directorship by mid-2018, which will be announced at the appropriate time. Details of the Directors’ attendance at Board meetings can be found in their biographies on pages 28 and 29.
In addition to the six scheduled meetings of the Board during the year, there was one further meeting held in respect of the Booker Group Merger. A number of additional meetings on the merger were held after the year end.
As Charles Wilson and Stewart Gilliland were not appointed until 5 March 2018, they did not attend any meetings in the year, however they have attended all Board meetings since their appointment.
During the year, the Chairman met frequently with Non-executive Directors without Executive Directors being present.
DevelopmentThe Chairman regularly discusses training requirements with the Board and arranges meetings or asks for information to be provided, as appropriate. As part of the ongoing development of Directors, key site visits are arranged and Directors are provided with the opportunity for, and encouraged to attend, training to ensure they are kept up to date on relevant legal, regulatory and financial developments or changes in best practice.
Information and supportThe Group Company Secretary, through the Chairman, is responsible for advising the Board on all governance matters and for ensuring that Board procedures are followed, applicable rules and regulations are complied with, and that due account is taken of relevant codes of best practice. The Group Company Secretary is also responsible for ensuring communication flows between the Board and its Committees, and between senior management and Non-executive Directors. All Directors have access to the advice of the Group Company Secretary and, in appropriate circumstances, may obtain independent professional advice at the Company’s expense. In addition, a Directors’ and Officers’ Liability Insurance policy is maintained for all Directors and each Director has the benefit of a Deed of Indemnity.
The appointment and removal of the Group Company Secretary is a matter reserved for the Board as a whole.
* Based on residency.
Tesco PLC Annual Report and Financial Statements 201834
Corporate governance report continued

Conflicts of interestIn accordance with the Companies Act 2006 and the Company’s Articles of Association, Directors are required to report actual or potential conflicts of interest to the Board for consideration and, if appropriate, authorisation. If such conflicts exist, Directors excuse themselves from consideration of the relevant matter. The Company maintains a register of authorised conflicts of interest which is reviewed annually by the Nominations and Governance Committee.
InductionAll new Directors receive a comprehensive induction programme tailored to their needs. The Chairman and Group Company Secretary are responsible for delivering an effective induction programme for newly appointed Directors. The programme is designed to include briefings from senior managers on key areas of the business, including internal control and risk management processes, the key risks facing the business, financial data, site visits and corporate governance. The programme is designed to facilitate their understanding of Tesco, the six strategic drivers, the Company’s corporate governance practices and procedures, as well as providing them with appropriate training and guidance as to their duties, responsibilities and liabilities as a director of a public limited company.
The Group has put in place tailored induction programmes for Charles Wilson and Stewart Gilliland.
Performance evaluationThe Board undertakes an annual evaluation of its own performance as well as that of its Committees and individual Directors. This provides an opportunity to consider ways of identifying greater efficiencies, maximising strengths and highlighting areas for further development, as well as checking that each Director continues to demonstrate commitment to his or her role and each has sufficient time to meet his or her commitments to the Company. Following an external review in 2015/16 by Independent Board Evaluation, who has no connection to the Group, and an internal review led by the Chairman in 2016/17, the 2017/18 internal review was led by the Senior Independent Director with the support of the Group Company Secretary and Lintstock Ltd. The 2017/18 evaluation was carefully structured but pragmatic, designed to bring about a genuine debate on issues that were relevant, check on progress against matters identified in the previous evaluation and assist in identifying any potential for improvement in the Company’s processes.
The 2017/18 performance evaluation process is set out below.
2017/18 performance evaluation
Stage 1Completion of a detailed questionnaire to assess the effectiveness of the Board, its Committees and individual Directors.
Stage 2Senior Independent Director conducts one-to-one interviews with each Director based on the results of the questionnaire.
Stage 3Preparation of a composite report.
Stage 4Results presented and discussed at Board and Committee meetings.
Stage 5Action plan and key areas of focus approved by the Board.
The results of the 2017/18 evaluation were presented to the Board in February 2018. Having assessed the findings of the evaluation, the Directors were satisfied that the Board and each of its Committees were performing well, with high scores recorded across a range of performance measures.
Details of the outcomes of the 2016/17 and 2017/18 evaluations, as well as the actions taken in 2017/18 to address the 2016/17 outcomes are shown below. Details of the actions taken to address the 2017/18 outcomes will be disclosed in next year’s Annual Report.
2016/17 evaluation outcomes 2017/18 actions 2017/18 evaluation outcomes
Create more opportunities for the testing and development of strategy.
Through the year a number of updates were provided on strategic developments agreed at the Board strategy sessions.
Further improve the oversight of risk.
Further increase the oversight of succession planning.
During the year the Board and Nominations and Governance Committee reviewed succession plans and the talent pipeline for the Board, Executive Committee and the level below the Executive Committee. Regular reviews are incorporated into forward planning agendas.
Ensure the effective monitoring of the integration of Booker Group.
Consider ways to improve the focus of the Corporate Responsibility Committee.
In October 2017, the Corporate Responsibility Committee approved the Little Helps Plan, setting out a number of targets and actions.
Identify ways to further engage on technology issues.
The Senior Independent Director also led the Non-executive Directors in evaluating the performance of the Chairman, with the Chairman continuing to show effectiveness in leadership.
In accordance with the UK Corporate Governance Code, the 2018/19 review will be conducted by an external consultant.
Election and re-election of DirectorsIn accordance with best practice and the UK Corporate Governance Code, all Directors will submit themselves for election or re-election at the forthcoming AGM, including Charles Wilson and Stewart Gilliland. More information is provided in the Notice of Meeting.
Code of Business ConductAll colleagues are required to comply with the Code of Business Conduct, which is intended to help them put Tesco’s principles into practice. This clarifies the basic rules and standards colleagues are expected to follow and the behaviour expected of them. Colleagues must complete mandatory Code of Business Conduct training and annually attest to compliance with the Code. Designated colleagues are required to complete additional mandatory training, including on anti-bribery and corruption laws, data protection laws and supplier legislation.
35Tesco PLC Annual Report and Financial Statements 2018
Corporate governance

Relations with our stakeholdersThe Board recognises its responsibility to take into consideration the needs and concerns of our stakeholders as part of its discussion and decision-making processes. The Board understands that maintaining strong stakeholder relationships is the key to building a sustainable business.
The following provides an insight into the ways in which the Board is engaged with our stakeholders:
Shareholders The Board is committed to maintaining
open and constructive dialogue with our shareholders, whether institutional, private or employee shareholders. The Board takes
ultimate responsibility for ensuring that such engagement takes place.
More information can be found opposite.
Customers The Board is dedicated to ensuring that we
maintain our core purpose to serve shoppers a little better every day. Ensuring that customers recommend us and come back time and again is one of our six key performance measures, which the Board monitors closely through
regular reporting.
Suppliers The Board recognises that building trusted
partnerships with our suppliers is critical and this is one of the six key performance measures
for the whole business. The Board maintains engagement through regular reporting of the results of our supplier viewpoint surveys, to ensure that the progress we have made over
the past three years continues.
Colleagues Our colleagues are the heart of our business and help to communicate the values of our
business to our customers every day. We have various tools to ensure that our Board is fully engaged with our colleagues, including our
Group-wide employee engagement surveys, the results of which are monitored by the
Board, and members of the Board regularly visit our stores to engage
directly with colleagues.
Community The Board is mindful of the impact that our
business has on the communities it operates in. During the year, the Corporate Responsibility
Committee launched our new strategy, the Little Helps Plan, which sets out how Tesco plans to follow our
core value ‘every little help makes a big difference’ in three main areas: our people; our products; and our
places. In addition, members of the Board have undertaken visits to beneficiaries of both the Tesco
Bags of Help scheme and the Tesco Community Food Connection, to see the work being
undertaken as a result of Tesco supporting these initiatives.
The Board’s stakeholder
engagement.
Tesco PLC Annual Report and Financial Statements 201836
Corporate governance report continued

Shareholder engagementDuring the year numerous activities were undertaken to engage with our shareholders:
Debt investors. The Treasury team holds biannual formal review meetings with all of our relationship banks and maintains regular contact with them. In addition, it held calls with the three credit rating agencies following the results announcements and the Chief Financial Officer and Group Treasury Director met with each of the credit rating agencies during the year.
Following the full-year and half-year results, the Chief Financial Officer and Group Treasury Director held conference calls with fixed income investors.
Shareholder meetings. The AGM was held on Friday 16 June 2017 at the ExCeL Centre in London. At the meeting, all shareholders were given an opportunity to question the Board on the business being proposed. The results of voting at the AGM were published on our website www.tescoplc.com.
The AGM for this year will be held at 2.00pm on Friday 15 June 2018 at the ExCeL Centre in London. Full details are included in the Notice of Meeting.
On Wednesday 28 February 2018, we held a General Meeting at etc.venues St Paul’s in London to approve the share and cash merger with Booker Group plc. Shareholders were given the opportunity to question the Board on the merger. The results of voting at the General Meeting were published on our website www.tescoplc.com.
Results and routine announcements. We invited our institutional shareholders and analysts to attend presentations following our full-year and half-year results announcements. The presentation slides and a webcast of the presentations were made available at www.tescoplc.com along with transcripts of all the results presentations and trading statement conference calls.
Consultation and engagement. The Chairman and the Chair of the Remuneration Committee held meetings and calls to consult with major investors on our proposed Remuneration Policy.
Website and shareholder communications. Our website www.tescoplc.com provides information to shareholders on understanding the business, results and financial performance, and shareholder meetings.
Video recordings of the Group Chief Executive and Chief Financial Officer commenting on results statements were uploaded to our website during the year, along with the results presentations and transcripts of analysts’ calls.
Following the announcement of the Booker Group Merger, a dedicated section of our website was made available containing details of the terms of the merger and presentations.
Meetings, roadshows and conferences.The Executive Directors, Chairman and Senior Independent Director held regular meetings with institutional investors throughout the year, to discuss the governance and strategy of the Group. These meetings are in addition to the roadshows organised following our full-year and half-year results.
All Non-executive Directors are able to attend scheduled meetings with major shareholders and do so if requested.
The Investor Relations team held further investor meetings throughout the year and attended a number of store tours and conferences.
The Board receives regular updates from the Investor Relations team on investor sentiment and analyst commentary to ensure that all Non-executive Directors develop an understanding of the views of major shareholders.
In October 2017 we held a stakeholder event to launch our Little Helps Plan.
We also engaged socially responsible investors by holding calls to discuss various issues and responding to queries.
37Tesco PLC Annual Report and Financial Statements 2018
Corporate governance

Nominations and Governance Committee attendance
MemberNumber of scheduled
meetings eligible to attendMeetings attended
John Allan 3 3Deanna Oppenheimer 3 3Byron Grote 3 3
Nominations and Governance Committee responsibilitiesThe responsibilities of the Nominations and Governance Committee include:
Nominating and succession – review of the structure, size and composition (including skills, knowledge, experience and diversity) of the Board and its Committees and make recommendations to the Board regarding any changes;
– identification and nomination of candidates for appointment to the Board; and – review of succession planning and talent management over the longer term for Directors and senior management.
Governance – review and approve changes to the Group’s Governance Framework, including monitoring the Group’s compliance with applicable legal, regulatory and listing requirements;
– make recommendations to the Board on the independence of Non-executive Directors;
– keep under review the time commitment expected from the Chairman and Non-executive Directors; and
– ensure an effectiveness review is conducted annually of the Board, its Committees and Directors.
The Committee’s terms of reference are available at www.tescoplc.com
Dear ShareholderDuring the year the Committee went through a significant transformation in terms of its focus and responsibilities. In light of the increased focus on corporate governance matters, it was agreed to extend the Committee’s remit to include oversight of the Group’s corporate governance framework and rename it the Nominations and Governance Committee. The terms of reference of the Committee were updated to reflect these additional responsibilities.
The Committee held three scheduled meetings during the year, which were attended by all members, primarily focusing on diversity, succession planning, talent management, inclusion and corporate governance.
Our policy for the composition of the Board is to support diversity in its widest sense. We wish to attract Board members with a diverse range of backgrounds who will contribute a wealth of knowledge, understanding and experience of the communities where Tesco operates. The Committee strongly believes that diversity throughout the Group and at Board and senior management level is a driver of business success. Our gender diversity policy for the Board is to aim to have at least 33% female representation on the Board by 2020. During the year we had 27% female representation on the Board, until the appointment of Stewart Gilliland and Charles Wilson in March 2018, when it declined to 23%. We will look to address this in line with our policy. We ensure that diversity is considered as part of any shortlist process drawn up by external search consultants.
Proper planning for Board and senior management succession, and refreshing and selecting the right individuals for the Board and senior management positions from a diverse talent pool are key issues for the Committee. It is essential in ensuring a continuous level of quality in management, in avoiding instability by helping mitigate the risks which may be associated with unforeseen events, such as the departure of a key individual, and in promoting diversity. During the year, the Committee reviewed the status of succession planning for the Non-executive Directors and the Executive Committee, as well as the pipeline of talent below the Executive Committee.
In March 2018, we welcomed Charles Wilson and Stewart Gilliland onto the Board, following the successful completion of the Booker Group Merger. They both bring a wealth of commercial and retail experience to the Board, specifically in the wholesale sector, and will bolster the capabilities and effectiveness of the Board.
The Committee also reviewed the independence of each Non-executive Director, all Directors’ conflicts of interest, the time commitments of each Non-executive Director and the balance of skills, knowledge, experience and diversity on the Board prior to recommending to the Board that each Director stand for election or re-election at the forthcoming AGM.
During the year, the Committee received regular updates on developments in corporate governance reform. The Committee was provided with detailed reports on the revised UK Corporate Governance Code issued by the Financial Reporting Council for consultation in December 2017 and proposals for the Group’s approach to the changes. We will report further on the changes to Tesco’s governance framework in next year’s report, following the anticipated publication of a revised UK Corporate Governance Code in June 2018, which will become effective for the 2019/20 financial year.
Having undertaken an external evaluation of the Board in 2015/16, the Committee agreed that the 2017/18 Board evaluation should be conducted internally. A questionnaire was sent out in December 2017 by the Group Company Secretary. The Senior Independent Director also conducted one-to-one interviews with Directors as well as conducting the annual evaluation of the Chairman. Having assessed the findings at the February 2018 Board meeting, the Directors were satisfied that the Board and each of its Committees continue to operate effectively. More details on the evaluation are set out on page 35 of the Corporate governance report.
John AllanNominations and Governance Committee Chair
Key activitiesDuring 2017/18, the Committee considered, amongst other matters, the following:
– succession planning for the Non-executive Directors and Executive Committee;
– reviewing the time commitments and independence of the Non-executive Directors;
– assessing the Group’s diversity and inclusion strategies; – monitoring developments in corporate governance reform; – the extension of Mikael Olsson’s appointment following three years of service on the Board, in accordance with Non-executive Directors’ letters of appointment;
– making a recommendation to the Board regarding the election and re-election of Directors at the 2018 AGM;
– reviewing the results of the annual performance evaluation of the Committee; and
– reviewing and updating the Committee’s terms of reference.
Nominations and Governance Committee.
‘We recognise the importance of a diverse and inclusive culture to the delivery of the Group’s strategy.’John Allan Non-executive Chairman
Tesco PLC Annual Report and Financial Statements 201838
Corporate governance report continued

Corporate Responsibility Committee.
Corporate Responsibility Committee attendance
MemberNumber of scheduled
meetings eligible to attendMeetings attended
Lindsey Pownall 3 3John Allan 3 3Steve Golsby 3 3Mikael Olsson 3 3Deanna Oppenheimer 3 3
At the invitation of the Committee Chair the Group CEO and the Group Communications Director attended all of the Committee meetings.
Corporate Responsibility Committee responsibilitiesThe responsibilities of the Corporate Responsibility Committee include:
– approving and monitoring a strategy for discharging the Group’s corporate and social responsibilities in such a way as to build trust and command respect and confidence;
– overseeing the Group’s conduct with regard to its corporate and societal obligations as a responsible corporate citizen;
– overseeing the creation of appropriate policies and supporting measures; – identifying and monitoring those external developments that are likely to have a significant influence on the Group’s reputation and/or its ability to conduct its business appropriately as a good corporate citizen and review how best to protect that reputation or that ability; and
– overseeing the Group’s engagement with external stakeholders and other interested parties.
The Committee’s terms of reference are available at www.tescoplc.com
Dear ShareholderI became Committee Chair in July 2017 and I am pleased to report on the significant progress that has been made this year in developing our new corporate responsibility strategy, the Little Helps Plan.
The Little Helps Plan sets out how Tesco plans to follow the philosophy that small actions add up to make a big difference, which is expressed through the Group’s core value ‘every little help makes a big difference’. The Little Helps Plan is made up of three pillars: our people, our products and our places and is underpinned by our foundation commitments on packaging, climate change, health and safety, business ethics, data security and data privacy. These areas are core to our business model and the delivery of the plan is embedded in the day-to-day business operations. We recognise that the Little Helps Plan is interlinked with the principal risks faced by the business and is integral to the long-term success of the Group.
The Committee reviewed an initial draft of the plan in July 2017 and received regular updates on the plan’s progress, prior to approving it in October 2017. I attended an event to launch the Little Helps Plan in October 2017 with some of Tesco’s key stakeholders. It was positive to see so many stakeholders attend and engage with the business on the ideas and ambitions behind the Little Helps Plan.
Throughout the year the Committee has received presentations from subject matter specialists within the business to understand the work that is already being done and will be done on each of the Little Helps Plan pillars and foundations. Due to the diverse background and experience of the Committee members, we have been able to provide a global perspective and insights to discussions on the development and roll-out of the strategy, in particular sharing experiences of different social, political and economic landscapes relevant to our international markets. It is acknowledged that, with the majority of the Group’s customers being in the UK, progress against the plan will begin in the UK and this is reflected in how some of the KPIs have been set with appropriate country-specific plans to be developed as necessary. Nevertheless, we are committed to making progress on all areas of the Little Helps Plan in all of our markets and I look forward to the Committee helping to shape and monitor the business’ progress over the next year.
It is recognised that we need to work together across society to build a truly sustainable future and the business fully supports global efforts to build this future, including the UN Sustainable Development Goals and the Paris Climate Agreement. The leadership that Dave Lewis has shown as Chair of Champions 12.3 demonstrates the commitment by the business to work with stakeholders to reach the UN Sustainable Development Goal target of halving global food waste by 2030. I am proud that in September we announced that 24 of our largest food suppliers had agreed to adopt this goal and to start to publish food waste data for their own operations within the next 12 months. In 2017, the business announced tougher new science-based climate change targets. The new targets ensure that our supply chain and operations support the Paris Climate Agreement to limit global temperature rises to 1.5 degrees Celsius this century, as well as our long-term ambition to become a zero-carbon business.
The Committee has agreed an ongoing programme to regularly review areas of the Little Helps Plan through deep-dive sessions and measuring performance against the plan’s targets. It is also intended that the Committee will experience the work being done by the business through off-site visits and by meeting stakeholders in the future.
More information on the Little Helps Plan is provided on pages 16 to 21 of this report and online at www.tescoplc.com/littlehelpsplan.
Lindsey PownallCorporate Responsibility Committee Chair
Key activitiesA summary of some of the key areas considered at each meeting is set out below:
July 2017 – Little Helps Plan roadmap and KPIs – The Committee gave feedback on the draft Little Helps Plan and the individual targets.
– Health month – The Committee reviewed the initiative launched in May 2017 to encourage helpful little swaps for customers and employees.
– Food waste – The Committee reviewed the business’ progress on delivering the UK food waste target and progress being made in Central Europe, Thailand and Malaysia on food waste.
October 2017 – Packaging – The Committee received information on this foundation area of the Little Helps Plan and the strategy to achieve the packaging targets.
– Responsible sourcing – The Committee reviewed the business’ ambition to lead the industry in addressing the sustainability challenges in our supply chain.
– Local campaigns – The Committee received information on the impact of the Group’s engagement with local communities, in particular on the success of the Bags of Help scheme in the UK and the similar schemes being operated in the ROI and Central Europe.
February 2018 – Climate change – The Committee received information on this foundation of the Little Helps Plan.
– Funding for key projects – The Committee reviewed the use of the funds released by the forfeiture of Tesco PLC shares undertaken in 2017 and designated for corporate responsibility activities.
Terms of referenceIn July 2017, Tesco PLC adopted new terms of reference for the Committee. The number of meetings increased to three per year and the scope of the Committee was expanded to include reviewing:
– progress of the corporate responsibility strategy against agreed performance measures; and
– expenditure and other commitments by the Group on corporate donations, community programmes and charitable support.
Committee effectiveness reviewIt was concluded that the Committee continued to operate effectively.
‘The Little Helps Plan aligns with our core value ‘every little help makes a big difference’ and recognises the unique opportunity that Tesco has through its global reach to make a difference to our customers, colleagues and communities around the world.’Lindsey Pownall Non-executive Director
39Tesco PLC Annual Report and Financial Statements 2018
Corporate governance

Audit Committee membership The Committee comprises Byron Grote, as Chairman, Mark Armour and Simon Patterson. All of the Committee members are independent Non-executive Directors and the Board is satisfied that Byron Grote and Mark Armour have significant, recent and relevant financial experience for the purposes of the Code and are competent in accounting and auditing.
In addition, and as required by the revised Code which was issued in April 2016 and applied to the Company from its 2017/18 financial year, the Board considers that the Committee members as a whole have competence relevant to the Company’s sector, in addition to general management and commercial experience. The expertise and experience of the members of the Committee is set out in each of their biographies on pages 28 and 29.
Robert Welch is appointed as Secretary to the Committee. Other regular attendees at Committee meetings include the Chairman, Group Chief Executive, Chief Financial Officer, Chief Audit and Risk Officer, Group Planning and Reporting Director and representatives of the external auditor.
Audit Committee meetings The Committee met six times in the 2017/18 financial year, with each meeting having a distinct agenda to reflect the annual financial reporting cycle of the Group and particular matters for the Committee’s consideration. The Committee has a forward-looking planner, which is designed to ensure that its responsibilities are discharged in full during the year. This planner is developed with the Group Company Secretary and its content regularly reviewed with management and Deloitte. It is developed to meet the changing needs of the Group as the year progresses.
The Chairman of the Committee reports to the Board following each meeting and Committee meetings are generally scheduled close to Board meetings in order to facilitate an effective and timely reporting process.
Committee members met in private following each Committee meeting and also held separate private sessions with the Chief Audit and Risk Officer and the external auditor, in order to provide additional opportunity for open dialogue and feedback without management present. The Committee Chairman also meets with the Chief Financial Officer on an ad hoc basis and prior to each Committee meeting.
Key activitiesA summary of the key matters considered at each meeting, is set out below:
April 2017 – preliminary results and Annual Report 2016/17, including confirmation of Code compliance and a comprehensive report from the Group’s Disclosure Committee on fair, balanced and understandable reviews
– viability statement and going concern review, including the underlying models, assumptions and scenario testing
– key accounting judgements relating to the 2016/17 financial results – external audit: Deloitte year-end final report and non-audit services – external and internal audit effectiveness reviews – Group compliance and whistleblowing update, including GSCOP update – Tesco Bank update – internal audit update
July 2017 – key accounting matters, including IFRS 9 and exceptional items approach update
– treasury, funding and corporate simplification update – technology: IT and information security controls update – transformation and service model update – privacy compliance update, including privacy transformation plans – insurable risk review – Group Treasury Policy update – external audit: audit plan, approval of audit fee, non-audit services, management letter observations from 2016/17 audit
– internal audit update, including Tesco Bank
Audit Committee.
‘The Committee has continued to play a key role within the Tesco PLC governance framework to support the Board in matters relating to financial reporting, internal control and risk management.’Byron Grote Non-executive Director
Audit Committee attendance
MemberNumber of scheduled
meetings eligible to attendMeetings attended
Byron Grote 6 6Mark Armour 6 6Simon Patterson 6 6
Audit Committee responsibilitiesThe Committee’s terms of reference were updated in April 2018, and its responsibilities include:
– monitoring the Group’s financial reporting processes; – review, and challenge where necessary, of the actions and judgements of management in relation to the interim and annual financial statements before submission to the Board;
– review of the interim and annual financial statements and announcements relating to the financial performance of the Group;
– consideration of the appointment of the external auditor, their reports to the Committee and their independence, including an assessment of their appropriateness to conduct any permitted non-audit work in accordance with the Group’s non-audit services policy, review of policy and appropriateness;
– review and agreement with the external auditor as to the nature and scope of the external audit and approving the audit fee;
– review of the Group’s declaration of any proposed interim and final dividends;
– review and monitoring of the internal controls and risk management processes of the Group, including key financial, operational and compliance controls, and their effectiveness;
– review of the internal audit programme and ensuring that the Internal Audit function is adequately resourced and has appropriate standing within the Group;
– review of the Group’s arrangements by which employees and contractors may, in confidence, raise concerns about possible improprieties in financial reporting or other matters;
– consideration of management’s response to any major external or internal audit recommendations; and
– review of business continuity plans and processes for the prevention of fraud, bribery and corruption.
The Committee’s terms of reference are available at www.tescoplc.com
Dear ShareholderThe Committee has continued to play a key role within the Tesco PLC governance framework to support the Board in matters relating to financial reporting, internal control and risk management. As well as the key activities undertaken or overseen by the Audit Committee during the year through a periodic and structured rolling forward-looking planner, this report shares insights into our discussions. Full details of the matters discussed at Committee meetings is set out later in this report. Looking ahead, these areas will remain a key focus in 2018/19.
Byron Grote Audit Committee Chair
Tesco PLC Annual Report and Financial Statements 201840
Corporate governance report continued

September 2017 – interim results statement and going concern review, including a comprehensive report from the Group’s Disclosure Committee and validation of management’s representations to Deloitte
– dividend proposal – key accounting matters, including key financial controls update and the Group’s preparations for new reporting requirements, i.e. IFRS 9 ‘Financial Instruments’; IFRS 15 ‘Revenue from contracts with customers’; and IFRS 16 ‘Leases’ implementation and basis of adoption as further described in Note 1 to the financial statements
– Group compliance update, including whistleblowing, anti-bribery and fraud, gifts and entertainment, privacy transformation plans, GSCOP compliance and progress towards General Data Protection Regulation compliance by May 2018
– UK and ROI and International Finance Director reports and key financial controls update
– treasury, funding and corporate simplification update, including the review and consideration of the bond buy-back programme
– risk, control and assurance framework, risk appetite and internal control effectiveness, including in-depth review of specific principal risk areas
– external audit: Deloitte interim report and non-audit services – internal audit update
November 2017 – risk, control and assurance update, including principal risk review process and the development of our three new principal risks set out on pages 22 to 25
– IFRS 16 update – pensions review – tax update, disclosures and transparency publication, including country by country reporting and UK tax strategy
– technology: IT and information security controls update – transformation and service model update – viability statement: modelling and assumptions – treasury, funding and corporate simplification update – internal and external audit updates including Deloitte non-audit services – non-audit fees policy update – policy on employment of former auditor employees – internal audit charter and 2018/19 plan – external audit: Deloitte update on audit plan and non-audit services
January 2018 – consideration of the Group’s cash and share merger with the Booker Group, specifically, to review and approve: the profit forecast for the Group and financial expectations for the combined group; risk factors; pro-forma financial information & reconciliation; operations and financial review; and quantified financial benefits statements reports and confirmations
February 2018 – risk, control and assurance framework update, comprising principal risks review, risk roadmap, risk management and controls update, risk appetite statement, Code compliance and internal control effectiveness review, further detail can be found on page 43 of this report
– Group tax update – technology update – finance transformation update – key accounting judgements relating to the 2017/18 financial results – treasury: solvency and liquidity funding plan – corporate simplification update – internal audit update, including Tesco Bank – external audit: Deloitte early warning report and non-audit services – Committee effectiveness review
April 2018 – preliminary results and Annual Report 2017/18, including confirmation of Code compliance and a comprehensive report from the Group’s Disclosure Committee on fair, balanced and understandable reviews
– viability statement and going concern review, including the underlying models, assumptions and scenario testing
– dividend proposal – key accounting judgements relating to the 2017/18 financial results, including IFRS 16 and controls update
– external audit: Deloitte year-end final report and non-audit services – external and internal audit effectiveness reviews – review of the Committee’s terms of reference – Group compliance and whistleblowing update, including GSCOP update – Booker integration update – Tesco Bank update – service model update – property valuation update – internal audit update
The Committee is responsible for assisting the Board’s oversight of the quality and integrity of the Company’s financial reporting and the Company’s accounting policies and practices. During the year, the Committee has continued to receive updates regarding the Group’s ongoing finance transformation programme and the actions taken to address observations raised by Deloitte in its letter to management following completion of the 2016/17 audit. Recommendations have been implemented to further enhance the Group’s financial reporting systems and controls environment. The Committee has also received regular updates, including from Group Audit and Advisory and the UK and ROI and International Finance Directors, on the development and effectiveness of the Group’s key internal financial controls.
The Committee continues to focus on commercial income and inventory controls and receives regular updates from Group Audit and Advisory on the work that is being undertaken to review and strengthen the Group’s processes in these areas.
In relation to the financial statements, the Committee reviewed and recommended approval of the half-year results and these annual financial statements, considered impairment reviews, the viability and going concern statements and their underlying assumptions, reviewed proposed dividend levels, reviewed corporate governance disclosures and monitored the statutory audit. As part of its review of the financial statements, the Committee considered, and challenged as appropriate, the accounting policies and significant judgements and estimates underpinning the financial statements. Details regarding the significant financial reporting matters and how they were addressed by the Committee are set out later in this report.
The Committee also reviewed the disclosures regarding the Company’s alternative performance measures (APMs) having regard, in particular, to the Guidelines on Alternative Performance Measures issued by the European Securities and Markets Authority (ESMA) in October 2015. The Company’s 2017 Annual Report was selected by the Financial Reporting Council (FRC) for a thematic review into the use of APMs in corporate reporting. The FRC raised no issues in relation to the Group’s APM disclosures and extracts of the Company's 2017 Annual Report were selected for inclusion in their November 2017 report as examples of best practice. The Committee reviewed the FRC’s findings and continues to monitor FRC and ESMA guidance on APM disclosure.
The Committee carried out a number of in-depth reviews of specific principal risk areas this year and reported its findings and recommendations to the Board. The Committee received updates from management in relation to the Group’s transformation, technology, information security, data privacy, treasury, tax, pensions, insurance and key compliance risks and the controls and mitigating actions employed in each of these areas. The Committee has assessed the effectiveness of the Group’s whistleblowing arrangements and reviewed compliance with the Groceries Supply Code of Practice (GSCOP).
The Committee received update reports during the year from the Tesco Bank Audit Committee, the Disclosure Committee and the Group Risk and Compliance Committee. Group Audit and Advisory provided regular updates on its work, including findings from its internal audit programme and the status of management actions to address such findings. Reports from Deloitte, as external auditor, were also presented and considered at each Committee meeting.
Reports were also requested on ad hoc matters as they arose. One key matter considered by the Committee this year was the merger with the Booker Group and the inclusion of Booker synergy realisation and integration as one of our principal risks. Further details regarding this risk can be found in the principal risks and uncertainties section on page 24.
41Tesco PLC Annual Report and Financial Statements 2018
Corporate governance

Audit Committee continued
Significant financial statement reporting issues The Committee considered a number of significant issues in the year, taking into account in all instances the views of the Company’s external auditor. The issues and how they were addressed by the Committee are detailed below:
Issue How the issue was addressed by the CommitteeGoing concern basis for the financial statements and viability statement
The Committee reviewed management’s assessment of going concern and long-term viability with consideration of forecast cash flows, including sensitivity to trading and expenditure plans and potential mitigating actions. The Committee also considered the Group’s financing facilities and future funding plans. Based on this, the Committee confirmed that the application of the going concern basis for the preparation of the financial statements continued to be appropriate, and recommended the approval of the viability statement.
Fixed asset impairment and onerous lease provisions
The Committee reviewed and challenged management’s impairment testing of property and technology assets and estimate of onerous lease provisions. The Committee considered the appropriateness of key assumptions and methodologies for both value in use models and fair value measurements. This included challenging projected cash flows, growth rates, discount rates and the use of independent third party valuations and considering any impacts of the uncertainties arising from Brexit. The Group has recognised a £182m net reversal of impaired PPE assets, together with an onerous lease provision net charge of £108m and a £24m net loss for software and other intangible assets. See Note 10 to the financial statements for software and other intangible assets impairment, Note 11 for fixed assets impairment and Note 25 for property provisions.
Goodwill impairment The Committee reviewed management’s process for testing goodwill for potential impairment and ensuring appropriate sensitivity disclosure. This included challenging the key assumptions: principally cash flow projections, growth rates and discount rates. The Group has not recognised any goodwill impairment in the year. See Note 10 to the financial statements.
Valuation of China associate and India joint venture
The Committee reviewed management’s assessment of the valuation of the Group’s China associate, Gain Land, and India joint venture, Trent Hypermarket Limited, covering the methodology and assumptions used by management, including latest market information, in determining the fair value of the investment. This included review of Gain Land’s and Trent’s projected cash flows, growth rates and discount rates used and the external market indicators to include in the valuation. The carrying value was supported by the valuation. See Note 13 to the financial statements.
Pensions The Committee reviewed and challenged the estimates used by management in valuing pension liabilities, principally the discount rate, including the change in methodology for calculation of the discount rate adopted in the year. See Note 27 to the financial statements.
Business and property disposals
The Committee considered the key judgements made by management in accounting for a number of property transactions including the unwind of the joint venture with British Land, the disposal of the Kipa business in Turkey and Opticians business in the UK. See Notes 1, 7 and 31 to the financial statements.
Business combinations The Committee considered the presentation and work performed on documents published as part of the Booker merger, including the profit forecast, working capital report, financial position and prospects report, quantified forecast benefits statement and sections of the prospectus including the pro-forma financial information.
Contingent liabilities The Committee further considered management’s assessment of the status of the ongoing regulatory investigations and litigation relating to prior periods. The Committee concurred with management’s assessment that due to the stage of the remaining matters and the uncertainties regarding the outcomes, no provision was required, and disclosure as contingent liabilities at the year-end was appropriate. See Note 32 to the financial statements.
Issue How the issue was addressed by the CommitteeRecognition and disclosure of commercial income
The Committee reviewed management’s assessment of the controls that exist over the recognition of commercial income. See Notes 1 and 20 to the financial statements.
Exceptional items The Committee considered the presentation of the Group financial statements and, in particular, the appropriateness of the presentation of exceptional items. The Committee reviewed the nature of items identified and concurred with management that the treatment was even-handed and consistently applied across years and appropriately presented. Consideration was also given to the quality of earnings within underlying results. See Note 4 to the financial statements.
New accounting standards
The Committee considered the implementation of IFRS 9 ‘Financial Instruments’, IFRS 15 ‘Revenue from contracts with customers’, and IFRS 16 ‘Leases’, considering project approach and progress, transition approach and impact assessments as known to date.
Tesco PLC Annual Report and Financial Statements 201842
Corporate governance report continued

Internal audit – Group Audit and Advisory (GAA)GAA is an independent assurance function within Tesco as a service to the Board and all levels of management. Its remit is to provide independent and objective advice to facilitate, influence and help the organisation to achieve its priorities. It helps the organisation accomplish its objectives by bringing a systematic, disciplined approach to evaluating and improving the effectiveness of risk management, control and governance processes.
GAA’s responsibilities include supporting management in the assessment and mitigation of risks to protect the business, as well as reporting on the effectiveness of the systems of internal control. Management are responsible for: establishing and maintaining an appropriate system of risk identification and internal control; and for the prevention and detection of irregularities and fraud. GAA facilitate the Group’s risk management processes with the Audit Committee and the Board.
In April 2018, the Committee considered an assessment of the effectiveness of the GAA function in protecting the business. This assessment included consideration of the structure and scope of GAA’s work, their capabilities, independence, the adequacy of the audit plan and their engagement with stakeholders. This assessment was facilitated by Lintstock Ltd, an independent company, who distributed a questionnaire based assessment to key stakeholders, collated the responses and provided the assessment reports. The quality of the audits in providing assurance was also assessed alongside the quality of the audit reports to the Committee and other stakeholders, GAA’s relationships, collaboration with the business and its impact on the organisation was also reviewed.
The Committee discussed the approach and findings of the assessment in which no significant failings or weaknesses were identified. The Committee was satisfied that GAA remains effective and is adequately resourced. There were some suggested areas of improvement highlighted, including a recommendation that GAA enhances its capability in the area of technology going forward to keep pace with technology advances and reduce reliance on third-party assurance. The Committee reviewed and agreed to the planned next steps. The Committee reviewed the GAA Charter in November 2017 and approved its continued use. The Internal Audit Plan for 2018/19 was presented and agreed by the Committee. The Internal Audit Plan will be kept under review to adapt to the changing needs of the business.
Key elements of the risk management process The risk management process facilitates the identification and prioritisation of risks through workshops and discussions with business leaders, facilitated by GAA and assigned business risk roles. During the year the significant risks have been reviewed as a top down and bottom up process at both the business unit and the Group level to ensure awareness, agreement and appropriate prioritisation. A risk that can seriously affect the performance, future prospects or reputation of the Group is termed a principal risk and these risks are aligned to the Group’s strategic drivers set out on pages 8 and 9. Details of the Group’s significant risks are documented and maintained in risk registers by the business.
Risks are assessed to determine the potential impact and likelihood of occurrence, after taking into account key controls and mitigating factors. Additional mitigating actions are identified and agreed with relevant business owners.
The Group Chief Executive has overall accountability for the control and management of the risks Tesco face, with the Board having overall responsibility for risk management. Individual risks are managed at the business unit level on an ongoing basis with follow up through the year by GAA and assigned business risk roles. All risks are assigned to an appropriate risk owner and the Group level principal risks are assigned to an executive owner. Each principal risk is reviewed at least annually by the Board. Our principal risks are detailed on pages 22 to 25, showing the risk movement, a summary of key controls, high level mitigating factors and links to the Group's strategic drivers.
Internal control The Board monitors the key elements of the Group’s internal control framework throughout the year and has conducted a review of the effectiveness of the Group’s risk management and internal control systems. To support the Board’s annual assessment, GAA prepared a report on the Group’s risk and internal control effectiveness, which described the risk management systems and arrangements in place for internal control, as well as work conducted in the year to improve the risk and control environment.
The internal control framework is intended to manage rather than eliminate the risk of failure to achieve business objectives and can only provide reasonable but not absolute assurance against material misstatement or loss.
The Group’s transformation programmes are intended to increase the overall level of control environment maturity and improve consistency across the Group. As part of this, there has been progress on the risk roadmap to mature our risk management. The technology, people and finance transformation programmes remain a challenge, but continue to progress towards delivery of a strengthened control environment.
External auditDeloitte continued as our external auditors with Panos Kakoullis as the lead partner after their initial appointment in the 2015/16 financial year. This is in line with our intention of putting the external audit out to tender every 10 years and to rotate the lead partner every five years. Panos Kakoullis will rotate as the lead partner following the audit of the 2019/20 financial year.
The Committee considers the effectiveness of the external auditor on an ongoing basis during the year, considering its independence, objectivity, appropriate mindset and professional scepticism, through its own observations and interactions with the external auditor, and having regard to the:
– experience and expertise of the external auditor in their direct communication with, and support to, the Committee;
– content, quality of insights and added value of their reports; – fulfilment of the agreed external audit plan; – robustness and perceptiveness of the external auditor in their handling of key accounting and audit judgements;
– the interaction between management and the external auditor, including ensuring that management dedicates sufficient time to the audit process;
– provision of non-audit services, as set out below; and – review and consideration of the results of the evaluation of the effectiveness of the external auditor.
The Committee considered an audit effectiveness review of Deloitte in April 2018, which was facilitated by an independent company, Lintstock Ltd, who distributed a questionnaire based assessment to key stakeholders, collated the responses and provided the assessment reports. The review concluded that the external auditor was effective and the Committee recommended to the Board the reappointment of Deloitte at the 2018 AGM.
The FRC’s Audit Quality Review (AQR) team selected for review the audit of the Group’s financial statements for the year ended 25 February 2017 and Tesco Bank’s standalone financial statements for the period ended 28 February 2017 as part of their 2017/18 annual inspection of audit firms. In relation to the review of the Group’s financial statements, the FRC’s review covers the audit work at the Group level and the audit work of the UK component. The Group report did not identify any significant areas for improvement. In relation to the review of Tesco Bank’s standalone financial statements, this review is in its final stages, and some matters have been identified as requiring improvement. In response, Deloitte developed an action plan to ensure that the matters identified by the AQR had been addressed in the audit of Tesco Bank’s financial statements for the period ended 28 February 2018. The Committee is satisfied that there is nothing within the report which might have a bearing on the audit appointment.
The Committee also considered the findings of the FRC’s 2017 Audit Quality Review of Deloitte as a whole and the actions being taken by Deloitte to address the matters raised.
Deloitte contribute a further independent perspective on certain aspects of the Group’s financial control systems arising from their work, and report both to the Board and the Committee.
The process for approving all non-audit work provided by our external auditor is overseen by the Committee in order to safeguard the objectivity and independence of the auditor. Where Deloitte have been chosen, this is as a result of their demonstrating that they have the relevant skills and experience to make them an appropriate supplier to undertake the work in a cost-effective manner.
Our policy for non-audit services reflects the EU regulations (as of 17 June 2016) that prohibits the provision of certain non-audit services, e.g. payroll services, by the external auditor and introduces a cap on non-audit fees. In line with the regulations, the Group is required to cap the level of non-audit fees paid to its external auditor at 70% of the average audit fees paid in the previous three consecutive financial years. The 70% cap will first apply to the Group for the period ending February 2021. The non-audit fees policy is compliant with new Ethical Standards for Auditors.
43Tesco PLC Annual Report and Financial Statements 2018
Corporate governance

In 2017/18, Deloitte received total fees of £13.5m (2016/17: £11.8m), consisting of £6.8m of audit fees (2016/17: £5.5m), and £6.7m for non-audit and audit-related services (2016/17: £6.3m), which is an increase of £1.7m in total fees versus the previous period. The total of Deloitte’s non-audit and audit-related fees in the year equated to 99% of the audit fees. Fees paid to Deloitte are set out in Note 3 to the financial statements and details of the significant non-audit work undertaken this year are set out in the table below.
In the period, Deloitte was appointed to report under the court approved Deferred Prosecution Agreement with Tesco Stores Limited. Safeguards were put in place to mitigate any threats to Deloitte’s independence by ensuring that work was conducted by individuals not directly involved in the external audit.
The Committee determined that it was appropriate for the external auditor to continue to provide transactional services in respect of our merger with the Booker Group. The appointment was also subject to an ethics review by Deloitte in 2016 and in the current financial year, which concluded that the proposed services were consistent with the FRC’s Revised Ethical Standards 2016 and that there were appropriate safeguards in place to preserve Deloitte’s independence as external auditor.
We continue to take steps to reduce the level of non-audit fees going forward to ensure compliance with the 70% non-audit fee cap rules.
Nature of service
Safeguards to preserve independence
Level of fees in
2017/18 (£m)
Level of fees in
2016/17 (£m)
Provision of transactional services: including quantified financial benefits synergy, working capital and profit forecast reporting, relating to the Group’s merger with the Booker Group
Engagement team separate to the audit team with independent reviews and working with informed management.
1.9 1.9
Retail consultancy: provision of administrative support relating to the Group’s markdown price optimisation process
Engagement team separate to the audit team. The service is limited to the provision of administrative support. Decision-making accountability remained with management.
1.5 1.5
Forensic services: provision of data repository services for information needed by the Group and the SFO
Careful consideration of the scope of services to ensure the advocacy and management threats are mitigated, together with working with informed management. Clear separation of the engagement teams has also been established.
1.8 1.2
SFO Monitor role: Deloitte has been appointed as Monitor by the SFO under the Deferred Prosecution Agreement agreed with Tesco Stores Limited
Under the Deferred Prosecution Agreement Deloitte were appointed to conduct independent reviews by individuals not directly involved in the commercial income audits.
0.8 –
Other non-audit services: tax compliance and advisory projects relating to businesses outside of the EU and other miscellaneous risk and compliance services
Careful consideration of the scope of services to ensure the advocacy and management threats are mitigated, together with working with informed management. Clear separation of the engagement teams has also been established where required.From March 2017, no tax services have been provided to entities within the EU as required by the applicable Ethical Standards.
0.2 1.2
Interim review performed under International Standards of Review Engagements (UK and Ireland) 2410
The interim review is considered a non-audit service under the applicable Ethical Standards, although the objectives of the review are aligned with those of the audit.
0.5 0.5
Total 6.7 6.3
Appointment of auditor statementFollowing a formal tender process, Deloitte were appointed as our external auditor with effect from the 2015 AGM. The Company is in compliance with the requirements of The Statutory Audit Services for Large Companies Market Investigation (Mandatory Use of Competitive Tender Processes and Audit Responsibilities) Order 2014, which relates to the frequency and governance of external audit tenders and the setting of a policy on the provision of non-audit services. The Committee reviews and makes a recommendation to the Board with regard to the reappointment of the external auditor each year. In making this recommendation, the Committee considers auditor effectiveness and independence, partner rotation and any other factors that may impact the Committee’s judgement regarding the external auditor.
Fair, balanced and understandable statement The Committee advised the Board on whether the Annual Report and Financial Statements 2018, taken as a whole, are fair, balanced and understandable and provide the necessary information to assess the Company’s position and performance, business model and strategy. The Committee concluded that the disclosures, and the processes and controls underlying their production, were appropriate and recommended to the Board that the Annual Report and Financial Statements 2018 are fair, balanced and understandable.
Committee effectiveness review The effectiveness of the Committee was evaluated this year as part of the Board evaluation process. Further details can be found on pages 34 and 35. The review found that the Committee was operating effectively and that its broad role and remit remained appropriate for the current needs of the business. In order to identify opportunities for further improvement, members discuss how the Committee is functioning in the private sessions that follow each meeting.
Audit Committee continued
Tesco PLC Annual Report and Financial Statements 201844
Corporate governance report continued

The key features of the new policy are:
Annual bonus – No change to the quantum and the financial metrics remain sales growth and Group operating profit before exceptional items, with a Group operating profit before exceptional items underpin. Having reviewed the weighting applied to each metric, the Committee concluded that while the combined weightings of the two financial metrics should remain at 80% of bonus maximum they should be split evenly, with each representing 40% of bonus maximum (previously sales growth 50% and Group operating profit before exceptional items 30%). The final 20% will be driven by outcomes against strategic objectives, including key stakeholder measures relating to customers, suppliers and colleagues. Half of the bonus awarded will continue to be deferred into Tesco shares for three years.
Performance Share Plan – No change is proposed to the quantum of awards. The Committee has reviewed the PSP performance metrics and simplified them from three to two, providing clear line of sight to the delivery of the strategic plan. The proposed performance metrics are:
– an earnings per share (EPS) metric, representing 50% of an award, which replaces the current total shareholder return (TSR) metric. The EPS measure will ensure management are better aligned with the delivery of the Group’s operating margin target of 3.5% to 4%; and
– a free cash flow metric, representing the remaining 50% of an award, which replaces the current cumulative operating cash flow metric, to help ensure balance sheet discipline is maintained as earnings grow and management are aligned with the targets to generate £9bn of retail cash from operations and reduce operating costs by £1.5bn.
As set out above, stakeholder metrics will in future feature in the annual bonus so they can be tailored to the responsibility of each executive.
During its consultation on the new Remuneration Policy the Committee heard differing views on TSR as a performance metric. What became clear was that no decision on inclusion or exclusion would satisfy everyone. The decision taken by the Committee is therefore the one that it believes is right for Tesco and will be understood and supported by the vast majority of its shareholders.
The reasons for moving away from TSR as a metric are:
– key competitors for Tesco are now either market disruptors for whom retail is a small proportion of their business or not listed companies. In addition, with the completion of the Booker merger, the constituents of the primary part of the TSR peer index group has reduced to four companies which is too concentrated;
– EPS and free cash flow measures are relevant, readily understood metrics aligned directly to Tesco’s strategy. TSR does not provide this clear line of sight; and
– alignment with shareholders, often mentioned as the reason for including TSR, is maintained in the proposed Remuneration Policy through significant shareholding requirements, the newly introduced holding period on PSP vested shares and stretching goals for annual bonus and PSP targets. In addition, the Committee will retain its discretion to make adjustments to vesting levels should there be significant divergence between variable pay outcomes and shareholder experience.
Holding period – From the 2018 grant onwards, PSP awards will be subject to a two-year holding period post vesting. The earliest an executive could sell PSP shares, other than to satisfy tax obligations, would be five years after grant.
Pension – Pension provision will reduce to 15% of base salary (from 25%) for new Executive Directors and Executive Committee members.
Shareholding requirement – Current levels of shareholding requirement will remain in place, see page 52 for further details. However, the way of meeting this requirement will change, so that senior management will need to retain all shares that vest to them, net of any tax liabilities, until the requirement is satisfied. The Committee believes this is a more demanding but fairer approach as it reflects shares earned by senior management.
‘Good leaver’ treatment under the PSP – Tesco’s practice on PSP good leavers will be aligned to wider market practice. From the 2018 grant onwards, any subsisting PSPs will vest based on performance over the relevant performance period and will then be pro-rated for the portion of the performance period worked. Under the current policy, the 2017 PSP award would lapse and the other two ‘in flight’ awards would vest at their usual vesting date, taking into account current performance levels.
Phasing and mitigation – Explicit requirements on phasing and mitigation of notice periods and any non-statutory payments on departure will be introduced for new joiners at the most senior grades (approximately the top 300 executives).
Remuneration Committee attendance
MemberNumber of scheduled
meetings eligible to attendMeetings attended
Deanna Oppenheimer (Chair) 4 4John Allan 4 4Steve Golsby (from 2 October 2017) 2 2Byron Grote 4 4Mikael Olsson 4 4Alison Platt 4 4
Remuneration Committee responsibilitiesThe responsibilities of the Remuneration Committee include:
– determining and recommending to the Board a framework for executive remuneration that is fair and balanced and ensures the most talented leaders are recruited, retained and motivated;
– determining the terms of employment and remuneration for Executive Directors and senior managers, including recruitment and termination arrangements;
– approving the design, targets and outturns of the annual bonus plan for Executive Directors and senior managers; and
– agreeing the design, targets and annual awards for share incentive plans, and the subsequent achievement of targets.
The Committee’s terms of reference are available at www.tescoplc.com
Dear ShareholderI am pleased to present the Directors’ remuneration report for 2017/18. Three years after the current Remuneration Policy was approved by 96.5% of shareholders and following a thorough review, the Committee will be proposing a new Remuneration Policy for the next three years at the 2018 Annual General Meeting. The revised policy has been subject to consultation with major investors and proxy voting advisers.
Strategic remuneration review The underlying principle applied to the review was that remuneration should align with, and incentivise delivery of, Tesco’s strategic plan in a relevant and simple way. Tesco has previously shared its intent to reduce costs by £1.5bn, generate £9bn of retail cash from operations and improve operating margins to between 3.5% and 4.0% by 2019/20. As a result, Tesco will deliver significant free cash flow which will improve shareholder returns, strengthen the balance sheet and allow reinvestment in the business. This will create long-term, sustainable performance and increase shareholder value.
The Committee was satisfied that the current remuneration structure remained appropriate and the review focused on ensuring performance metrics were aligned with the next phase of the strategy. This includes a strengthened focus on profit and cash flow, while continuing to support Tesco’s volume-led recovery and stakeholder focus.
The Committee has also taken account of changes in regulation and shareholder expectations since the last Remuneration Policy was approved. This has led to the introduction of a post-vesting holding period and reduction in pension contribution for new hires. The Committee is also mindful of their responsibility to ensure prudent management of executive remuneration and the need for fair employment practices for the whole workforce.
Annual statement from the Remuneration Committee Chair.
‘Tesco aims to be more competitive for customers, simpler for colleagues and a better partner for its suppliers, while continuing to create long-term value for shareholders. Tesco’s reward principles directly align to these objectives.’Deanna Oppenheimer Remuneration Committee Chair
45Tesco PLC Annual Report and Financial Statements 2018
Corporate governance
Directors’ remuneration report

New appointments to the BoardFollowing the completion of the merger with Booker Group plc on 5 March 2018, Charles Wilson, former CEO of Booker, joined the Tesco Board as an Executive Director and Stewart Gilliland, former Chairman of Booker, joined as a Non-executive Director.
The remuneration arrangements for both of them were approved by the Committee and are in line with the approved Remuneration Policy. The key elements of Charles Wilson’s remuneration package are detailed on page 49. Stewart Gilliland will receive a fee in accordance with his role as a member of the Board, which is set out on page 62.
Overview of performance in 2017/18 During the year, Tesco continued to make strong progress against the six strategic drivers:
– brand health strengthened further and Tesco was voted ‘Britain’s favourite supermarket’ for the third consecutive year;
– cost savings of £594m were achieved in the year generating a total of £820m towards the £1.5bn medium-term target;
– £2.8bn of retail operating cash was generated; – operating margins improved to 2.9%, remaining on track to achieve between 3.5% and 4.0% by 2019/20;
– a further £290m of value was released from properties, with 109 properties sold and 1.1m sq. ft. of space repurposed; and
– innovation continued, with contactless Clubcard, Tesco Pay+, nationwide roll-out of the same-day delivery service and the start of the roll-out of our new Own Brand range of products.
The way in which the current Remuneration Policy aligns with and supports Tesco’s strategy and delivery of the Big 6 KPIs is set out below and further information is available on page 11.
Big 6 KPIs
2017/18 2016/17
Year-on-year
change
Annual bonus
performance measure
PSP performance
measureGroup sales(a)∆ £51.0bn £49.9bn 2.3%Group operating profit before exceptional items(b)∆
£1,644m £1,280m 28.4%
Retail cash generated from operations(b)∆
£2.8bn £2.3bn 21.7%
Customers recommend us and come back time and again
12pts 7pts +5pts
Colleagues recommend us as a:
Great place to work 83% 83% NilGreat place to shop 49pts 48pts +1pt
Supplier satisfaction 75% 77% (2)%∆ These measures and other measures in this section are defined in the alternative
performance measures section of the Annual Report on pages 150 to 152.(a) Reported on a continuing operations basis at actual exchange rates, excluding fuel.(b) Reported on a continuing operations basis at actual exchange rates.
2017/18 incentive outcomes Tesco’s annual bonus and PSP plans reward achievement of Group, stakeholder and personal targets, provided performance is delivered within the Company’s risk framework and appetite. The Committee scrutinises performance targets, which are based on the Board approved Long Term Plan, to ensure they are sufficiently challenging. Stretching performance ranges are then agreed by the Committee at the start of the performance period.
Annual bonus outcomes for 2017/18 have been determined based on Tesco’s performance over the year in sales growth (50% weighting), Group operating profit before exceptional items (30% weighting) and Individual Objectives (20% weighting). For consistency, sales and operating profit are translated at constant exchange rates, resulting in sales of £50.1bn and operating profit of £1,611m.
These outcomes are between the target and stretch performance levels. This was a strong performance in a challenging external environment and was delivered against a background of intense competition. The Committee also reviewed the performance of the Executive Directors against their Individual Objectives. As a result, the Committee determined that 72.8% and 73.9% of the maximum bonus opportunity should be awarded for Dave Lewis and Alan Stewart, respectively. A summary break-down of the targets and performance assessments is provided in At a glance on page 48.
The 2015 PSP was the first award in which Dave Lewis and Alan Stewart participated. The performance period ran to the end of the 2017/18 financial year. Performance was measured against two metrics, with 70% subject to Tesco’s relative TSR performance and the remaining 30% subject to cumulative cash generated from operations. Performance was as follows:
– Tesco’s TSR ranked below median in the bespoke comparator group. This element vested at nil. The Committee noted that the below-median outcome was driven by the inclusion of global FMCG companies, Unilever, Diageo and Reckitt Benckiser, in the peer group and that performance was above median against the retail comparators. However, the Committee did not consider it appropriate to exercise any discretion in this regard; and
– cumulative cash generated from operations over three years of £7.9bn was ahead of stretch performance of £7.3bn. This element vested in full.
The approved vesting level was therefore 30% of the maximum potential for Executive Directors and senior managers.
As reported previously, buyout awards were made to Alan Stewart to compensate him for awards forfeited on leaving his previous employer. The buyout award due to vest in July 2017 lapsed in its entirety as the award it replaced did not vest. The final tranche of Alan Stewart’s buyout awards are due to vest in July 2018.
Implementation of remuneration in 2018/19 For 2018/19, other than the changes to policy described overleaf, the Committee intends to implement remuneration arrangements for the Executive Directors, in line with previous years. In particular:
– no salary increases will be made to Executive Directors in 2018/19; – the maximum annual bonus opportunity will continue to be 250% of base salary for the Group Chief Executive, 225% of base salary for the Chief Financial Officer and 200% of base salary for the CEO, UK & ROI, with 50% of any bonus awarded deferred into shares for three years. From 2018, the sales growth and Group operating profit metrics will each be weighted 40% of bonus maximum. Full details of the targets set by the Committee, and performance against these will be disclosed in next year’s Directors’ remuneration report;
– the maximum annual PSP opportunity will continue to be 275% of base salary for the Group Chief Executive, 250% of base salary for the Chief Financial Officer and 225% of base salary for the CEO, UK & ROI. From 2018, subject to shareholder approval, the new PSP performance measures, EPS (50%) and free cash flow (50%), will apply; and
– malus and clawback will continue to apply to both the annual bonus and PSP awards.
Gender diversityThroughout the year, the Committee considered the Group’s approach to gender pay and the reporting of such information. Details of Tesco’s gender pay report for the year to April 2017 and actions to reduce the gender pay gap are set out opposite.
Shareholder engagementThe Committee is committed to an open and transparent dialogue with shareholders on executive remuneration and considers these engagements vital to ensuring its remuneration strategy remains aligned with the long-term interests of Tesco’s shareholders.
I have appreciated the time major shareholders and proxy voting advisers have given to help the Committee develop the proposed Remuneration Policy. Together with the rest of the Board, I look forward to hearing your views on the proposed policy and would ask for your support at the forthcoming Annual General Meeting.
Deanna OppenheimerRemuneration Committee Chair
Annual statement from the Remuneration Committee Chair continued
Tesco PLC Annual Report and Financial Statements 201846
Directors’ remuneration report continued

The principles of a fair workplaceAt Tesco our purpose is to serve shoppers a little better every day. To live up to that purpose our colleagues need to reflect and represent the communities we serve. Tesco wants to be a place where colleagues can get on, as they wish, no matter what their background. We are proud of our long history of helping people develop their careers from the shop floor to the leadership team.
To continue building an inclusive culture where everyone feels welcome it is important that colleagues feel fairly rewarded. We have clear principles against which we measure ourselves. When we are successful Tesco colleagues can expect:
– a total reward package that provides flexibility and choice, and is competitive in the markets in which Tesco operates and from which it recruits for talent;
– to share in Tesco’s success through variable pay that is transparent and rewards performance;
– the opportunity to plan and save for the future; – to make wellbeing and lifestyle choices, having access to a range of benefits and flexibility over working hours and place of work;
– to have access to career opportunities and accredited training to develop to their potential whatever their age or background; and
– through Tesco’s consultative forums and trade union partnerships to have their voice heard and represented at all levels, and access to information about what is happening in the business.
Rewarding our colleaguesWe provide colleagues across the Group with a competitive reward package. In Tesco’s UK business at Work Levels 1-5 colleagues receive the following reward and benefits package and we want all colleagues to have the potential to earn upper quartile reward against the relevant pay benchmark. Grade Salary Annual
bonusPSP Benefits Pension
Executive CommitteeWork Levels 4-5Work Levels 1-3
Over the last year Tesco has continued to focus on building a fair workplace, providing colleagues with the flexibility, skills and reward to ‘get on’. This has included:
– Investing in pay – In June 2017, Tesco announced its biggest investment in UK store pay for colleagues for a decade. Pay is being increased by 10.5% over two years for hourly paid store colleagues.
– Investing in training – Last year a new apprenticeship scheme was introduced offering UK colleagues across stores, distribution and the office, 2,500 new apprenticeship places in skill areas such as HGV driving, project management and technology.
– Investing in flexibility – As part of our commitment to flexible working, a new app has been trialled in the UK allowing colleagues to see their shifts, manage overtime, request holiday and see how much they will be paid. This app will be rolled out in the UK first before being introduced to all international markets. A start has been made in Asia where a simplified version of the app with similar functionality has been introduced.
– Investing in healthier living – In May last year our first ever health event for colleagues and customers was held. For colleagues, this included making fruit available for free, mental health awareness training and working to help our national charity partners, with over £1m raised. Our investment in healthier lives for colleagues and customers will continue.
Gender payTesco has a long-standing commitment to transparency on gender pay and has monitored the interaction between gender and pay since 2002. Tesco’s gender pay report for the year to April 2017, published in February 2018, showed a median gender pay gap across Tesco’s UK retail business of 8.7% (substantially below the UK median gender pay gap of 18.4%), and a mean gap of 12.0%. A key reason for the gap is the different work pattern choices colleagues are making. Male colleagues are choosing to work premium hours (Sundays, bank holidays and night work), which attract higher rates of pay, more often than female colleagues. If these premium hour payments were to be removed from the calculation, Tesco’s median gender pay gap would reduce to just 2.7%.
Tesco believes in offering colleagues opportunity, choice and flexibility and will continue to support them in choosing work patterns that best suit their personal situation and preferences. At the same time, we will work to identify and remove any gender-related barriers to making those choices.
So more remains to be done, including building more gender-balanced senior teams, where female participation is lower than we would wish.
Further information on what Tesco is doing to address the gender pay gap is set out in the Little Helps Plan on page 20 and online at www.tescoplc.com/people.
Reward principles.
47Tesco PLC Annual Report and Financial Statements 2018
Corporate governance

This part of the report and the Annual report on remuneration, which together form the Annual Report on Remuneration, have been prepared in accordance with Part 3 of The Large and Medium-sized Companies and Groups (Accounts and Reports) (Amendment) Regulations 2013 and Rule 9.8.6 of the Listing Rules. The Annual Report on Remuneration and the Annual statement from the Remuneration Committee Chair will be put to an advisory shareholder vote at the Annual General Meeting on 15 June 2018.
What our Executive Directors earned in 2017/18Single total figure of remuneration – Executive Directors (audited)The following table provides a summary single total figure of remuneration for 2017/18 and 2016/17 for the Executive Directors. Further details are set out in the Annual report on remuneration on pages 56 and 57.
YearBase salary
(£’000)Benefits
(£’000)Pension(£’000)
Short-term annual bonus (£’000)
Long-term Performance Share
Plan (£’000)
Total (£’000)
Dave Lewis 2017/18 1,250 65 313 2,275 971 4,8742016/17 1,250 223 313 2,361 – 4,147
Alan Stewart 2017/18 750 53 188 1,248 530 2,7692016/17 750 46 188 1,252 – 2,236
Annual bonus outcomes (audited)The Committee assessed each discrete element of the annual bonus separately to form a rounded assessment of performance of the Executive Directors at the end of the financial year. This resulted in 72.8% and 73.9% of the maximum bonus opportunity being awarded to Dave Lewis and Alan Stewart, respectively. Performance against each of the objectives for 2017/18 was assessed as follows:
Financial performance in 2017/18 (80% of bonus maximum)
Measures (% maximum)Performance targets Vesting level Actual
performancePayout
(% maximum)Underpin Threshold Target Stretch Threshold Target StretchSales growth(a) (50%) n/a £49,556m £50,057m £50,559m 30% 50% 100% £50,149m 29.6Group operating profit before exceptional items(a) (30%)
£1,280m £1,280m £1,472m £1,663m 0% 50% 100% £1,611m 26.0
(a) Reported on a continuing operations basis at constant exchange rates.
Performance for the financial elements of the annual bonus has been strong, with sales growth and Group operating profit before exceptional items performance being between target and stretch.
Individual performance in 2017/18 (20% of bonus maximum) (audited)The Committee carefully reviewed the performance of the Executive Directors against their Individual Objectives set at the beginning of the financial year. Details of how their performance towards these objectives was assessed is set out in the table below. Further details are provide on page 57.
Individual Objective Weighting Actual achievement PayoutDave Lewis Obtain CMA clearance of the Booker Merger on the best terms 6.67% 6.67% 17.2%
Complete service model process and organisation changes 6.67% 5.00%Accelerate cost reduction programme 6.67% 5.55%
Alan Stewart Obtain CMA clearance of the Booker Merger on the best terms 6.67% 6.67% 18.3%Reduce net interest payable 6.67% 6.67%Delivery of the Finance Transformation Programme and reduce costs of Goods Not For Resale
6.67% 5.00%
PSP vesting (audited)The PSP award granted in 2015 will vest in July 2018 based on performance up to and including the 2017/18 financial year. The performance outcome was as follows:
Performance targets Vesting level Actual Performance
Payout(% maximum)
Number of shares to vest(b)
Measures (% maximum) Threshold Target Stretch Threshold Target Stretch Dave Lewis Alan StewartRelative TSR(a) (70%) Median
performanceUpper
quartile performance
25% Straight-line vesting between
threshold and stretch
100% Below median
0%
Cash generation (30%) £6.6bn £7.0bn £7.3bn 25% 50% 100% £7.9bn 30% 472,621 257,793(a) TSR was assessed against a bespoke group of FTSE 100 consumer business and services companies comprising Associated British Foods, Compass, Diageo, Dixons Carphone, Kingfisher,
M&S, Morrisons, Next, Reckitt Benckiser, J Sainsbury, Unilever and Whitbread.(b) For the equivalent value in cash see the Single total figure of remuneration table above.
Annual report on remuneration – at a glance.
Tesco PLC Annual Report and Financial Statements 201848
Directors’ remuneration report continued
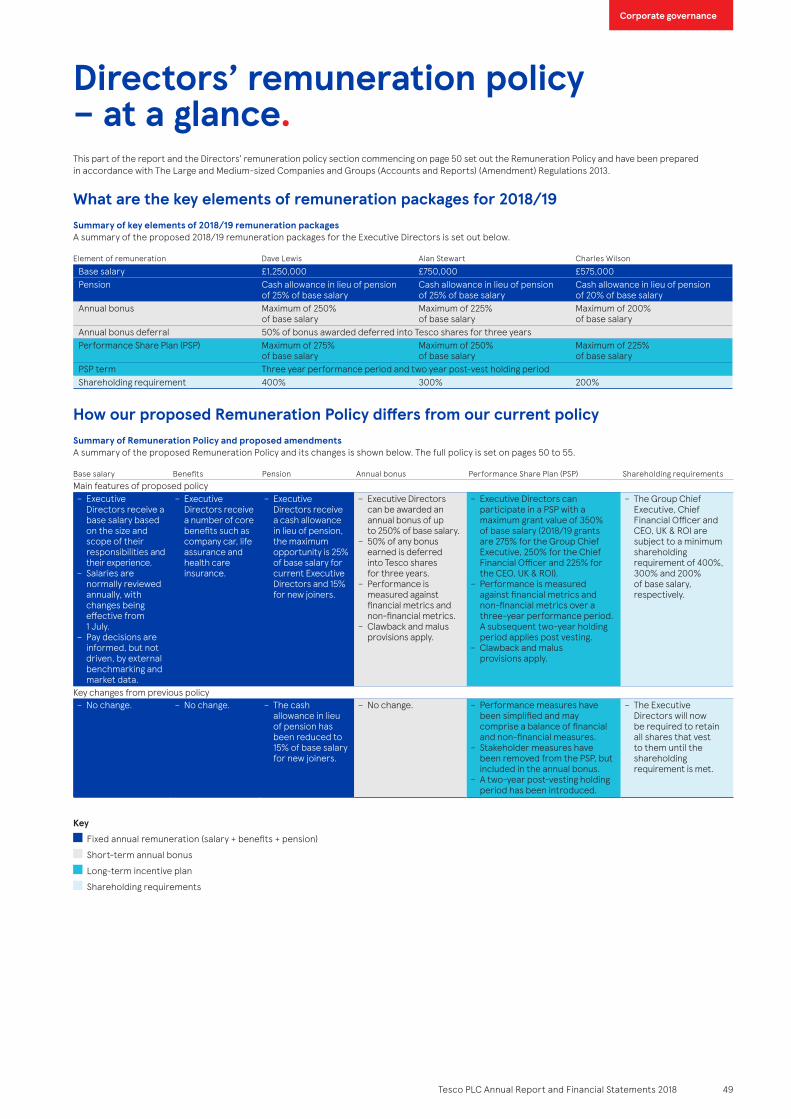
This part of the report and the Directors’ remuneration policy section commencing on page 50 set out the Remuneration Policy and have been prepared in accordance with The Large and Medium-sized Companies and Groups (Accounts and Reports) (Amendment) Regulations 2013.
What are the key elements of remuneration packages for 2018/19Summary of key elements of 2018/19 remuneration packagesA summary of the proposed 2018/19 remuneration packages for the Executive Directors is set out below.
Element of remuneration Dave Lewis Alan Stewart Charles WilsonBase salary £1,250,000 £750,000 £575,000Pension Cash allowance in lieu of pension
of 25% of base salaryCash allowance in lieu of pension of 25% of base salary
Cash allowance in lieu of pension of 20% of base salary
Annual bonus Maximum of 250% of base salary
Maximum of 225% of base salary
Maximum of 200% of base salary
Annual bonus deferral 50% of bonus awarded deferred into Tesco shares for three yearsPerformance Share Plan (PSP) Maximum of 275%
of base salaryMaximum of 250% of base salary
Maximum of 225% of base salary
PSP term Three year performance period and two year post-vest holding periodShareholding requirement 400% 300% 200%
How our proposed Remuneration Policy differs from our current policySummary of Remuneration Policy and proposed amendmentsA summary of the proposed Remuneration Policy and its changes is shown below. The full policy is set on pages 50 to 55.
Base salary Benefits Pension Annual bonus Performance Share Plan (PSP) Shareholding requirementsMain features of proposed policy
– Executive Directors receive a base salary based on the size and scope of their responsibilities and their experience.
– Salaries are normally reviewed annually, with changes being effective from 1 July.
– Pay decisions are informed, but not driven, by external benchmarking and market data.
– Executive Directors receive a number of core benefits such as company car, life assurance and health care insurance.
– Executive Directors receive a cash allowance in lieu of pension, the maximum opportunity is 25% of base salary for current Executive Directors and 15% for new joiners.
– Executive Directors can be awarded an annual bonus of up to 250% of base salary.
– 50% of any bonus earned is deferred into Tesco shares for three years.
– Performance is measured against financial metrics and non-financial metrics.
– Clawback and malus provisions apply.
– Executive Directors can participate in a PSP with a maximum grant value of 350% of base salary (2018/19 grants are 275% for the Group Chief Executive, 250% for the Chief Financial Officer and 225% for the CEO, UK & ROI).
– Performance is measured against financial metrics and non-financial metrics over a three-year performance period. A subsequent two-year holding period applies post vesting.
– Clawback and malus provisions apply.
– The Group Chief Executive, Chief Financial Officer and CEO, UK & ROI are subject to a minimum shareholding requirement of 400%, 300% and 200% of base salary, respectively.
Key changes from previous policy – No change. – No change. – The cash
allowance in lieu of pension has been reduced to 15% of base salary for new joiners.
– No change. – Performance measures have been simplified and may comprise a balance of financial and non-financial measures.
– Stakeholder measures have been removed from the PSP, but included in the annual bonus.
– A two-year post-vesting holding period has been introduced.
– The Executive Directors will now be required to retain all shares that vest to them until the shareholding requirement is met.
Directors’ remuneration policy – at a glance.
Key Fixed annual remuneration (salary + benefits + pension)
Short-term annual bonus
Long-term incentive plan
Shareholding requirements
49Tesco PLC Annual Report and Financial Statements 2018
Corporate governance

Policy reportThe policy has been developed taking account of the principles of the UK Corporate Governance Code in relation to remuneration. The Committee also takes significant account of guidelines issued by the Investment Association, ISS, Glass Lewis and other shareholder bodies when setting the remuneration framework. It also seeks to maintain an active and constructive dialogue with investors on developments in the remuneration aspects of corporate governance generally and any changes to the Company’s executive pay arrangements in particular.
The proposed Remuneration Policy will be put to a binding shareholder vote at the Annual General Meeting on 15 June 2018 and, subject to receiving majority shareholder support, the policy will operate from the date of approval and is intended to remain applicable for the following three years. Information on how the Company intends to implement the proposed Remuneration Policy for the current financial year is set out in the Annual report on remuneration.
Remuneration policy and strategyThe Committee’s underlying principle is that remuneration should align with, and incentivise delivery of, the strategic plan, which aims to create long-term, sustainable performance and increased shareholder value.
The proposed Remuneration Policy aligns to the strategic plan, particularly in terms of the targets chosen to incentivise management in the annual bonus and PSP and the weighting of those targets. It builds on arrangements put in place in 2015 that clearly link to, and have helped to incentivise delivery of, Tesco’s turnaround plan. The limited changes to the current Remuneration Policy now proposed are intended to enhance further the link between strategic delivery and remuneration outcomes.
Tesco needs to pay competitively, allowing it to attract and retain the talent capable of delivering its strategy and providing clear leadership. There is also a strong link between pay and performance, and consideration is given to environmental, social and governance risks when determining Director remuneration. Base salaries are normally set taking into account market median practice, while colleagues have the potential to earn total compensation at a market upper quartile level where sustained business and personal outperformance can be demonstrated. Equally, where performance does not meet business and personal targets then variable pay outcomes will be reduced, ultimately to zero. Further details of our Reward principles are set out on page 47.
Policy tableThe following sets out the proposed Remuneration Policy.
Base salaryPurpose The role of base salary is to support the recruitment and retention of Executive Directors of the calibre required to develop and deliver the strategy.
Base salary provides fixed remuneration for the role, which reflects the size and scope of the Executive Directors’ responsibilities and their experience.Operation The Committee sets base salary taking into account:
– the individual’s skills and experience and their performance; – salary levels at leading FTSE companies and other large consumer business companies in the UK and internationally; and – pay and conditions elsewhere in the Group.
Base salary is normally reviewed annually with changes effective from 1 July, but may be reviewed more frequently if the Committee determines this is appropriate.
Maximum Executive Directors’ salary increases will normally be in line with the typical level of increase awarded to other employees in the Group.Increases may be above this level in certain circumstances such as:
– where a new Executive Director has been appointed to the Board at a lower than typical market salary to allow for growth in the role, then larger increases may be awarded to move salary positioning closer to typical market level as the Executive Director gains experience; or
– where an Executive Director has been promoted or has had a change in responsibilities, salary increases in excess of the above limit may be awarded.Measure n/aChange No change from previous policy.BenefitsPurpose To provide a market-competitive level of benefits for Executive Directors and to assist them in the performance of their roles.Operation The Committee sets benefit provision at an appropriate market-competitive level taking into account the individual’s home jurisdiction, the
jurisdiction in which the individual is based, typical practice and the level of benefits provided for other employees in the Group.Core benefits – Benefits currently include car benefits, security costs, health insurance and life assurance. Other appropriate benefits may be provided from time to time but will not be significant.Executive Directors shall be reimbursed for all reasonable expenses and the Company may settle any tax incurred in relation to these.All-employee share plans – Executive Directors are eligible to participate in the Company’s all-employee share schemes on the same terms as other colleagues.Mobility policy – Where an Executive Director is required to relocate to perform their role, they may be offered appropriate relocation allowances and international transfer-related benefits where required.
Maximum The overall level of benefits will depend on the cost of providing individual items and the individual’s circumstances and therefore there is no maximum level of benefit.
Measure n/aChange No change from previous policy.PensionPurpose To provide an appropriate level of retirement benefits as a part of a holistic benefit package.Operation Executive Directors receive a cash allowance in lieu of pension or a contribution into a Defined Contribution scheme.Maximum Maximum cash in lieu of pension or contribution of 15% of base salary for any newly hired Executive Director.
Maximum cash in lieu of pension or contribution of 25% of base salary for Dave Lewis and Alan Stewart and 20% of base salary for Charles Wilson under previous arrangements.
Measure n/aChange The policy has been amended to reflect the fact that new Executive Directors receive a maximum of 15% of base salary as contribution and/or
cash in lieu of pension.
Directors’ remuneration policy.
Tesco PLC Annual Report and Financial Statements 201850
Directors’ remuneration report continued

Annual bonusPurpose To reward Executive Directors for the delivery of Tesco’s annual financial, operational and strategic goals. Deferral into Tesco PLC shares provides
alignment with shareholders.Operation The annual bonus is normally delivered:
– 50% in cash; and – 50% in shares which are deferred for three years.
Performance is assessed over a financial year.The Committee determines the level of bonus taking into account performance against targets and the underlying performance of the business.
Maximum Maximum annual bonus opportunity of 250% of base salary.For details of award levels for 2017/18 see the Annual report on remuneration on pages 56 and 57.
Measures The annual bonus may be based on a mix of financial, operational, strategic and individual performance measures. At least 70% of the bonus will be based on financial performance.Payment of the annual bonus will be subject to meeting a financial underpin.The Committee determines the exact metrics each year depending on the key goals for the forthcoming year.Normally around 30% of the bonus is paid for threshold performance, around 50% of the bonus is paid if target levels of performance are delivered with the full bonus being paid for delivering stretching levels of performance. These vesting levels may vary each year depending on the stretch of targets set.The Committee sets bonus targets each year to ensure that they are appropriately stretching in the context of the business plan.
Change No change from previous policy.Performance Share PlanPurpose To reward Executive Directors for achieving Tesco’s long-term strategy and creating sustainable shareholder value aligning the economic interests
of Executive Directors and shareholders.Operation Awards normally vest based on performance over a period of not less than three years (unless the Committee determines otherwise).
The Committee has the discretion to amend the final vesting level if it does not consider that it reflects the underlying performance of the Company.All vested shares, net of any tax liabilities, will be subject to a further two-year holding period after the vesting date.
Maximum The maximum annual award that can be granted under the PSP is 350% of base salary.For details of award levels for 2018/19 see the Annual report on remuneration on page 58.
Measures Awards vest based on financial or strategic performance conditions (the satisfaction of which is determined by the Committee). At least 50% of the PSP will be based on financial metrics.The current measures are diluted EPS from continuing operations (50%) and free cash flow (50%) as set out on page 58. Any substantial or significant change to measures will be subject to shareholder consultation.For threshold levels of performance up to 25% of the award vests, increasing to 100% of the award for stretching performance.The Committee sets targets each year so that targets are stretching and represent value creation for shareholders while remaining motivational for management.
Change The policy has been amended to introduce diluted EPS as a performance measure for the PSP instead of relative TSR, free cash flow has been introduced as a performance measure instead of retail cash generated from operations and stakeholder metrics have been removed and incorporated into the annual bonus.The policy has been amended to add a two-year holding period to the PSP post vesting. Executive Directors may sell sufficient shares to satisfy the tax liability on exercise, but must retain the net number of shares until the end of the two-year period.
51Tesco PLC Annual Report and Financial Statements 2018
Corporate governance

Group Chief Executive – Dave Lewis
100%
£1,628k
33% 20%
32%
35%
£4,909k
38%
42%
£8,190k
Minimum On-target Maximum
Fixed pay Annual bonus Long-term incentive
Chief Financial Officer – Alan Stewart
100% 36% 22%
£991k 30%
34%
£2,772k
37%
41%
£4,560k
Minimum On-target Maximum
CEO, UK & ROI – Charles Wilson
100% 38% 23%
£749k 29%33%
£1,971k
36%
41%
£3,193k
Minimum On-target Maximum
Directors’ remuneration policy continued
Information supporting the policy tableShareholding guidelinesTesco operates shareholding guidelines of 400% of base salary for the Group Chief Executive, 300% for the Chief Financial Officer, and 200% for the CEO, UK & ROI and members of the Executive Committee. Executive Directors are required to retain all shares that vest to them, net of any tax liability, whether from the annual bonus or the PSP, until the relevant shareholding guideline is satisfied. The Committee may waive this requirement for certain exceptional personal circumstances.
Dividend equivalentsDividend equivalents are payable on deferred annual bonus and PSP awards that vest.
Clawback and malus provisionsThe Committee has the discretion to scale back deferred share awards and PSP awards prior to the satisfaction of such awards in the event that results are materially misstated or the participant has contributed to serious reputational damage of the Company or one of its business units or their conduct has amounted to serious misconduct or fraud.
Where PSP awards are settled prior to the fifth anniversary of the grant of the award, the Committee shall have the discretion to clawback awards up to the fifth anniversary of the grant of awards in the circumstance described above.
Cash bonus payments can also be ‘clawed back’ in the circumstances described above up to the third anniversary of payment.
Timing of target disclosureTargets for the PSP are disclosed on or before the grant date of the award. Targets and performance against these for the annual bonus are disclosed in the year following the start of the performance period.
Terms of share awardsThe Committee may amend the terms of awards or the rules of share plans within the scope defined in the rules of the plans.
For share awards, in the event of a variation of the Company’s share capital or a demerger, delisting, special dividend, rights issue or other event, which may, in the Committee’s opinion affect the current or future value of awards, the number of shares subject to an award may be adjusted.
The Committee may amend performance targets in accordance with the terms of an award or if a transaction or event occurs which causes the Committee to consider (taking into account the interest of shareholders) that an amended performance condition would be more appropriate and would continue to achieve the original purpose and be no less challenging to achieve.
Payments outside policyThe Committee reserves the right to make any remuneration payments and payments for loss of office (including exercising any discretions available to it in connection with such payments) notwithstanding that they are not in line with the proposed Remuneration Policy set out in this report where the terms of the payment were agreed (i) before the policy came into effect or (ii) at a time when the relevant individual was not a Director of the Company and, in the opinion of the Committee, the payment was not in consideration for the individual becoming a Director of the Company. For these purposes ‘payments’ includes the Committee satisfying awards of variable remuneration, and an award over shares is ‘agreed’ at the time the award is granted.
External appointmentsExecutive Directors are permitted to hold one approved non-executive directorship of another company and to retain the fees earned from such appointment.
Minor changesThe Committee may make minor changes to this policy for regulatory, exchange control, tax or administrative purposes or to take account of a change in legislation without seeking shareholder approval for that amendment.
Remuneration outcomes in different performance scenariosThe total remuneration opportunity for Executive Directors is strongly performance based and weighted to the long term. The charts below illustrate the total remuneration of Executive Directors under three assumed performance scenarios:
Tesco PLC Annual Report and Financial Statements 201852
Directors’ remuneration report continued

Performance scenarios
Group Chief Executive Chief Financial Officer CEO, UK & ROIAnnual bonus (% of base salary) 250 225 200PSP (% of base salary) 275 250 225Minimum No annual bonus payout
No vesting under the Performance Share PlanOn-target performance 50% annual bonus payout
50% Performance Share Plan vestingMaximum performance 100% annual bonus payout
100% Performance Share Plan vesting
No share price growth or the payment of dividend equivalents has been assumed. Potential benefits under all employee share schemes have not been included.
Fixed pay is based on current values as set out in the table below:Base salary Benefits (a) Pension Total fixed pay
Group Chief Executive – Dave Lewis (£’000) 1,250 65 313(b) 1,628Chief Financial Officer – Alan Stewart (£’000) 750 53 188(b) 991CEO, UK & ROI – Charles Wilson (£’000) 575 59 115(c) 749(a) Benefits for Dave Lewis and Alan Stewart are as set out in Single total figure of remuneration on page 48 and for Charles Wilson are an average of Dave Lewis’ and Alan Stewart’s figures. (b) 25% of base salary.(c) 20% of base salary.
Remuneration policy for new hiresWhen hiring a new Executive Director, the Committee would generally seek to align the remuneration package with the Remuneration Policy outlined in this section. The Committee will set base salary taking into account all relevant factors including the experience and calibre of the candidate, the candidate’s current reward opportunity and the jurisdiction the candidate was recruited from. Incentive opportunity will be in line with the policy maximums (i.e. total maximum incentive opportunity of 600% of base salary).
The Committee may make additional awards when appointing an Executive Director to ‘buy out’ remuneration terms forfeited on leaving a previous employer. The Committee will look to do so on a ‘like-for-like’ basis with the awards forfeited, taking account of relevant factors including any performance conditions attached to these awards, the form in which they were granted (e.g. cash or shares) and the time over which they would have vested.
To facilitate buyout awards in the event of recruitment, the Committee may grant awards to a new Executive Director under Listing Rule 9.4.2, which allows for the granting of awards, to facilitate, in unusual circumstances, the recruitment of an Executive Director, or under other relevant company incentive plans.
The Company will pay legal fees incurred by any new Executive Directors in respect of their appointment.
In the event that an internal candidate were to be promoted to the Board, legacy terms and conditions would normally be honoured, including pension entitlements and any outstanding incentive awards.
In the event of the appointment of a new Chair or Non-executive Director, remuneration arrangements will reflect the policy outlined on page 55.
53Tesco PLC Annual Report and Financial Statements 2018
Corporate governance

Directors’ remuneration policy continued
Executive Director service agreements and policy on Executive Directors leaving TescoWhen determining leaving arrangements for an Executive Director, the Committee takes into account any contractual agreements, including the provisions of any incentive arrangements, typical market practice and the performance and conduct of the individual.
The following table summarises Tesco’s policy in relation to Executive Director service agreements and payments in the event of loss of office.
Provision Current service agreementsNotice period Up to 12 months’ notice by the Company and by the Executive Director.
For new appointments, the Committee reserves the right to vary this period to 24 months for the initial period of appointment and for the notice period to then revert to up to 12 months after the initial 12 months of employment.
Expiry date Dave Lewis, Alan Stewart and Charles Wilson entered into service agreements with Tesco PLC on 19 July 2014, 9 July 2014 and 5 March 2018, respectively.These are rolling service agreements with no fixed expiry date.Dave Lewis and Alan Stewart are entitled to 12 months’ notice and Charles Wilson six months’ notice by the Company, and are themselves required to give six months’ notice.
Termination payments (does not apply if notice is provided, as per the service agreement, or for termination by reason of resignation or unacceptable performance or conduct)
If the Company terminates an Executive Director’s agreement without full notice or it is terminated by an Executive Director in response to a serious contractual breach by the Company, then the Executive Director has the right to a termination payment to reflect the unexpired term of the notice.Any termination payment in lieu of notice will be based on base salary and benefits only, plus any statutory rights.Termination payments will normally be subject to mitigation and paid in instalments. The Company’s obligation to continue making phased termination payments will cease when the Executive Director commences alternative employment.
Other information The Committee may require an Executive Director to work during their notice period, or may choose to place him or her on garden leave.The Committee may determine that an Executive Director may remain eligible to receive a pro-rata bonus for the financial year in respect of the period he or she worked. The Committee will determine the level of bonus taking into account time in active employment and performance.The Company may reimburse for reasonable legal expenses in the event the Executive Director leaves by mutual consent.Directors and Officers insurance for a specified period following the Executive Director termination date may be provided.Where an Executive Director has been recruited from overseas, the Company may pay for repatriation.
Service agreements of the Executive Directors are available to shareholders to view at the Company’s registered office.
Share plan rules – leaver provisionsThe treatment of outstanding share awards in the event that an Executive Director leaves is governed by the relevant share plan rules. The following table summarises leaver provisions under the executive share plans for good leavers, all awards will normally lapse except for good leavers. In specific circumstances, the Committee may exercise its discretion to modify the policy outlined to the extent that the rules of the share plan allow such discretion. The Committee will not exercise discretion to allow awards to vest where the participant is dismissed for gross misconduct. Where an Executive Director leaves as a result of summary dismissal, they will forfeit outstanding share incentive awards.
‘Good leavers’ are those who have left the Company due to injury, ill-health or disability, death, redundancy, retirement, the entity which employs the Executive ceasing to be part of the Group or any other reason determined by the Committee taking into account the circumstances of departure and performance.
Share plan Good leavers as determined by the Committee in accordance with the plan rulesExecutive Incentive Plan 2014 (deferred bonus shares)
– Unvested awards vest at cessation. Committee has discretion to defer vesting to the normal vesting date.
Performance Share Plan 2011 – Unvested awards normally vest on the normal date, pro-rated for time, and will take into account performance achieved. – Shares in the holding period will continue to be held until the end of the two-year holding period or the second anniversary of the departure date, whichever is sooner, with the exception of death, in which case shares will be released to the estate.
All-employee share plans – Leaver provisions under all-employee share plans are determined in accordance with HMRC approved provisions.
Other vesting circumstancesAwards may also vest early to the extent determined by the Committee if:
1. A participant is transferred to a country, as a result of which the participant will suffer a tax disadvantage or become subject to restrictions on his or her award (under the PSP and Executive Incentive Plan 2014); or
2. In the event of a takeover, winding-up or other corporate event affecting the Company, which may affect the value of share awards (such as a demerger or dividend in specie).
The number of shares under an award which vest in these circumstances will be determined by the Committee. In the case of the PSP, when determining the level of vesting the Committee will consider performance and the time elapsed since grant. In the case of the deferred bonus shares (under the Executive Incentive Plan 2014) awards will vest in full.
Tesco PLC Annual Report and Financial Statements 201854
Directors’ remuneration report continued

Remuneration policy for Non-executive DirectorsApproach to setting fees Basis of fees Other items
– Fees for the Non-executive Chairman and Non-executive Directors are set at an appropriate level to recruit and retain Directors of a sufficient calibre to guide and influence Board level decision making without paying more than is necessary.
– Fees are set taking into account the following factors: • the time commitment required to fulfil the role; and
• typical practice at other companies of a similar size and complexity to Tesco.
– Non-executive Directors’ fees are set by the Board and the Chairman’s fee is set by the Committee (the Chairman does not take part in any discussion about his fees).
– Fees are reviewed by the Board and the Committee at appropriate intervals.
– Fees paid to the Non-executive Chairman and Non-executive Directors may not exceed the aggregate limit of £2m set out in the Company’s Articles of Association.
– Non-executive Director fees policy is to pay: • a basic fee for membership of the Board; • an additional fee for the Chair of a Committee and the Senior Independent Director to take into account the additional responsibilities and time commitment of the role; and
• an additional fee for membership of a Committee to take into account the additional responsibilities and time commitment of the role.
– Additional fees may be paid to reflect additional Board or Committee responsibilities as appropriate.
– Non-executive Directors may also serve on the board of Tesco Personal Finance Group Limited. Such Non-executive Directors also receive a basic fee for serving on this board and additional fees for Committee membership in line with other members of this board. Fees for membership of the board of Tesco Personal Finance Group Limited are determined by the board of Tesco Personal Finance Group Limited and are reviewed at appropriate intervals.
– The Non-executive Chairman receives an all-inclusive fee for the role.
– Where significant travel is required to attend Board meetings, additional fees may be paid to reflect this additional time commitment.
– The Non-executive Directors are not entitled to participate in the annual bonus or Performance Share Plan.
– The Non-executive Directors have the benefit of Directors’ and Officers’ liability insurance and provision of an indemnity and staff discount on the same basis as other employees. The Board may introduce additional benefits for Non-executive Directors if it is considered appropriate to do so.
– The Non-executive Chairman may have the benefit of a company car and driver, home security, staff discount and healthcare for himself and his partner. The Committee may introduce additional benefits for the Chairman if it is considered appropriate to do so.
– The Company may reimburse the Non-executive Chairman and Non-executive Directors for reasonable expenses in performing their duties and may settle any tax incurred in relation to these.
– The Company will pay reasonable legal fees for advice in relation to terms of engagement.
– If a Non-executive Director is based overseas then the Company would meet travel and accommodation expenditure as required to fulfil non-executive duties and may settle any tax incurred in relation to these.
Non-executive Director letters of appointmentNon-executive Directors have letters of appointment setting out their duties and the time commitment expected. Appointments are for an initial period of three years after which they are reviewed. The unexpired term of Non-executive Directors’ appointments can be found on page 62. In line with the UK Corporate Governance Code, all Non-executive Directors submit themselves for re-election by shareholders every year at the Annual General Meeting. All Non-executive Directors’ appointments can be terminated by either party without notice. Non-executive Directors have no entitlement to compensation on termination. Non-executive Directors’ letters of appointment are available for shareholders to view at the Company’s registered office.
Considering colleagues’ viewsWhile the Committee has not consulted colleagues directly when developing the proposed Remuneration Policy, a significant portion of colleagues are shareholders so are able to express their views in the same way as other shareholders.
The Company undertakes an employee engagement survey, which occurs annually across Tesco’s global operations and semi-annually for colleagues in the UK. This survey asks for feedback and comments on many aspects of employment with Tesco, including employee reward and benefits. This insight, combined with feedback gleaned from social media channels, forms a key part of shaping future plans and taking action to improve.
The Committee reviews information regarding the typical remuneration structure and reward levels for other UK-based employees to provide context when determining the proposed Remuneration Policy.
Considering shareholders’ viewsThe Committee believes that it is very important to maintain an open dialogue with shareholders on remuneration matters. The Committee regularly consults major shareholders regarding potential changes to remuneration arrangements and the views of shareholders are important in determining any final changes. Going forward, the Committee will continue to liaise with shareholders regarding remuneration matters more generally and Tesco arrangements as appropriate. It is the Committee’s intention to consult major shareholders in advance of making any material changes to remuneration arrangements for Executive Directors.
55Tesco PLC Annual Report and Financial Statements 2018
Corporate governance

The following pages and the At a glance section, which together form the Annual Report on Remuneration, have been prepared in accordance with Part 3 of The Large and Medium-sized Companies and Groups (Accounts and Reports) (Amendment) Regulations 2013 and Rule 9.8.6 of the Listing Rules. The Annual Report on Remuneration and the Annual Statement from the Remuneration Committee Chair will be put to an advisory shareholder vote at the Annual General Meeting on 15 June 2018.
Fixed remunerationSalaryThe Committee considered the Group Chief Executive’s and Chief Financial Officer’s base salaries during 2017/18 taking into account pay review budgets across the Group. As a result, the Committee determined that the base salaries for Dave Lewis and Alan Stewart would remain unchanged in 2018/19. The base salaries of Dave Lewis and Alan Stewart have remained unchanged since their dates of appointment in 2014.
Base salaryDave Lewis Alan Stewart
2018/19 2017/18 2018/19 2017/18Increase in year (%) Nil Nil Nil NilAnnual base salary (£’000) 1,250 1,250 750 750Base salary received in year (£’000) 1,250 1,250 750 750
BenefitsEach Executive Director received a car or cash allowance and the benefit of a driver. The Company also provided health insurance and life assurance, and security costs (to Dave Lewis). In 2016/17 Dave Lewis received relocation support of £142,000 (2017/18: nil). Details of benefits paid in 2017/18 are set out in At a glance on page 48.
PensionDave Lewis and Alan Stewart received a cash allowance in lieu of pension of 25% of base salary.
PensionDave Lewis Alan Stewart
2017/18 2016/17 2017/18 2016/17Annual cash allowance in lieu of pension (% of base salary) 25% 25% 25% 25%Annual cash allowance in lieu of pension (£’000) 313 313 188 188
2017/18 variable remuneration2017/18 annual bonus payouts for the Executive DirectorsIn determining the final level of bonus payable, the Committee considered the wider performance of the Group and noted that management were continuing to make fundamental improvements in the way we serve customers, made strong progress against the six strategic drivers, completed the merger with Booker and reinstated the dividend. On this basis, the annual bonus will pay out at 72.8% of the maximum for Dave Lewis and 73.9% of the maximum for Alan Stewart. In accordance with the approved Remuneration Policy, 50% of the payouts will be deferred into Tesco shares for three years, subject to continued employment.
Total annual bonus payout in 2017/18 (audited)Executive Directors
Dave Lewis Alan StewartStretch bonus opportunity (% of base salary) 250% 225%Actual bonus (% of maximum) 72.8% 73.9%Actual bonus (% of base salary) 182% 166%Actual bonus (£’000) 2,275 1,247Deferred into shares (50% of actual bonus) (£’000) 1,137.5 623.5
Annual report on remuneration.
Tesco PLC Annual Report and Financial Statements 201856
Directors’ remuneration report continued

2017/18 achievement of individual objectives
Executive Director Booker Organisation changes CostsDave Lewis In December 2017, the Booker merger
received clearance from the Competition and Markets Authority (CMA). Clearance from the CMA, which was the measure for this element of bonus, was achieved unconditionally. As a result of this performance the maximum payout was achieved of 6.67%.
Action taken this year to simplify the business included moving to a new service model in our offices in the UK followed by similar changes in Central Europe and the successful organisation restructure in stores, engagement centres and Head Office. The completion of these changes was ahead of target of completion by December 2017 but below stretch of completion by September 2017, and led to a payout of 5.00%.
During the year, cost savings of £594m were generated towards the £1.5bn medium-term target. This was above target of £557m but below stretch of £613m, and resulted in a payout of 5.55%.
Executive Director Booker Balance sheet FinancialsAlan Stewart As above, maximum payout of 6.67%. During the year, an annual interest saving
of £50.5m was generated primarily through the early repayment of bonds. This was ahead of target of £30m and stretch of £50m, and resulted in a maximum payout of 6.67%.
The Finance Transformation programme remains on track, with costs below budget. This element resulted in performance between target and stretch.Cost savings generated from Goods Not For Resale of £136m were slightly below stretch of £141m, but above target of £120m.Payout between target and stretch was achieved of 5.00%.
(a) Details of the outturn of the financial performance metrics for the 2017/18 annual bonus are set out in At a glance on page 48.
2017 PSP award grant (audited)The following summarises the PSP awards made to Dave Lewis and Alan Stewart in 2017/18.
Type of award Date of awardGross number
of sharesFace value
(% of base salary)Face value(a)
(£)
Threshold vesting
(% of face value)
Stretch vesting (% of face
value)End of
vesting periodDave Lewis Nil cost options subject to
performance conditions and continued employment
11/05/17 1,909,722 275% 3,437,500 20% 100% 11/05/20
Alan Stewart Nil cost options subject to performance conditions and continued employment
11/05/17 1,041,666 250% 1,874,999 20% 100% 11/05/20
(a) The face value has been calculated using the closing price on grant of 180p (11 May 2017). The range of the Company’s share price for the year was 166p to 214p.(b) The table shows the maximum number of shares that could be released if awards were to vest in full.(c) Details of the performance measures and targets applying to the awards were set out in last year’s annual report.
Implementation of policy in 2018/192018/19 salaryThe base salaries of Dave Lewis, Alan Stewart and Charles Wilson will remain unchanged in 2018/19 at £1,250,000, £750,000 and £575,000, respectively.
2018/19 annual bonus awardsThe maximum annual bonus opportunity and performance measures for each of the Executive Directors for 2018/19 are as follows:
Executive Director Maximum opportunityDave Lewis 250%Alan Stewart 225%Charles Wilson 200%
Measures WeightingSales growth 40%Group operating profit before exceptional items 40%Strategic Objectives, including stakeholder measures 20%Group operating profit before exceptional items Underpin
The strategic objectives for Dave Lewis, Alan Stewart and Charles Wilson include stakeholder measures relating to colleagues, customers and suppliers. Bonus targets are considered by the Board to be commercially sensitive as they could inform Tesco’s competitors of its budgeting. Therefore, we do not publish details of the targets on a prospective basis. However, we will provide full and transparent disclosure of the targets and the performance against these targets on a retrospective basis in next year’s Annual Report at the same time that the bonus outcome is reported.
In relation to exchange rates, the 2018/19 targets were set based on 2017/18 average actual foreign exchange rates. Performance against these targets will be measured based on the same rates in order to ensure consistent treatment of foreign exchange in both targets and actual performance. To ensure that Executive Directors are not incentivised to grow sales at the expense of satisfactory profitability, a Group operating profit underpin will continue to be applied to the annual bonus below which no portion of the bonus will be paid. The impact of the merger with Booker Group on the Group’s performance has been incorporated into the 2018/19 annual bonus targets.
57Tesco PLC Annual Report and Financial Statements 2018
Corporate governance

Annual report on remuneration continued
2018 PSP award grantAs set out in the proposed Remuneration Policy commencing on page 50, the value of the PSP awards to be granted to each Executive Director in 2018 and corresponding performance measures are as follows:
Executive Director Maximum opportunityDave Lewis 275%Alan Stewart 250%Charles Wilson 225%
Performance measure Definition of measure
EPS Diluted earnings per share from continuing operations before exceptional items, net pension finance costs and fair value remeasurements on financial instruments.
Free cash flow Free cash flow includes all cash flows from operating and investing activities, and the market purchase of shares in relation to share schemes. The following items are excluded: investing cash flows that increase/decrease items within Group net debt, and cash flows from major corporate acquisitions and disposals. This measure reflects the cash available to shareholders.
Both financial measures are defined in the same manner as the reported alternative performance measures as set out on pages 150 to 152.
The corresponding incentive targets over the three-year performance period are:
Performance measure Weighting
Threshold Target Stretch
Vesting levelPerformance
required Vesting levelPerformance
requiredVesting
levelPerformance
requiredEPS 50% 25% 18.0p 50% 21.2p 100% 24.4pFree cash flow 50% 25% £3.7bn 50% £4.6bn 100% £5.5bn
Performance targets are set taking into account internal budget forecasts, the Long Term Plan, external expectations and the need to ensure that targets remain motivational. The impact of the merger with Booker Group on the Group’s performance has been incorporated into the 2018 PSP targets.
2018 PSP award grantAwards made to Dave Lewis, Alan Stewart and Charles Wilson in 2018 will be reported in next year’s Annual Report.
Dividend equivalentsAwards will incorporate the right (in cash or shares) to receive the value of dividends between grant and exercise in respect of the number of shares that vest. The calculation of dividend equivalents will assume reinvestment of those dividends in Company shares on a cumulative basis.
Outstanding PSP awardsFollowing completion of the merger with Booker Group on 5 March 2018, the Committee will consider amendments to the targets of outstanding PSP awards to reflect the impact of the merger on the Tesco business going forward and to ensure targets remain suitably stretching.
Tesco PLC Annual Report and Financial Statements 201858
Directors’ remuneration report continued

Performance graphThe following chart illustrates the performance of Tesco measured by Total Shareholder Return (share price growth plus dividends paid) against the FTSE 100, which is a broad market index of which Tesco is a constituent, over a period of nine years. An additional line to illustrate the Company’s performance compared with the FTSE 350 Food and Drug Retailers index over the previous nine years is also included.
0
50
100
150
200
250
300
Source: Datastream
02/2009 02/2010
145
100130 130
168
129125 130121
9369 72 78
106
111
172
131
191
135
214
107
225
91
205
100
254
110
264
02/2011 02/2012 02/2013 02/2014 02/2015 02/2016 02/201802/2017
Tesco FTSE 100
TSR performance graph(Value of hypothetical £100 investment)
FTSE 350 Food & Drug
While Total Shareholder Returns have been increasing for Tesco in recent years, the period covered by the chart reflects a period of significant corporate change, including the decision to make a significant reinvestment in our customer offer and withdraw the dividend in 2015, in order to focus on improving the competitiveness of the core UK business and protecting and strengthening the balance sheet. The sector more broadly has faced a number of challenges in recent years, including consumer uncertainty, significant price competition and cost inflation. Tesco is in a strong position to deal with these challenges and, reflecting improving performance and confidence in the future prospects for the Company, the Board reinstated the dividend during the current financial year.
Managing executive pay Tesco focuses on executive pay in the context of the overall spend on remuneration across the Group. The table below sets out a key trend since the current Executive Directors joined the business in 2014, reflecting both a reduction in the numbers of those serving on the Executive Committee and a focus on costs.
60
80
100
120
01/07/2014 28/02/2015 28/02/2016
Executive remuneration and all colleague costs(Indexed change over time)
28/02/2017 28/02/2018
Average cost of total reward – all colleagues Executive Committee base salaries as a % of total Group wage costs
The table shows that over the period from July 2014 to the end of February 2018:
– Executive Committee base salary costs as a proportion of the total Group spend on remuneration fell by a third from 0.18% to 0.12%; and – the average total reward package for each colleague across the Group, inclusive of variable pay outcomes, rose by around 1.5%.
Tesco will continue to focus on the relationship between executive pay and the wider workforce in the period ahead and we intend to develop further our disclosure on this topic.
59Tesco PLC Annual Report and Financial Statements 2018
Corporate governance

Annual report on remuneration continued
Executive Directors’ interests in shares and shareholding guidelines (audited)The table below sets out shares held by the Executive Directors and their connected persons (including beneficial interests) and a summary of outstanding share awards.
Executive Director
Ordinary shares
beneficially owned
at 25/02/17
Ordinary shares
beneficially owned
at 24/02/18
Unvested deferred
annual bonus options
subject to continued
employment
Unvested PSP awards
subject to performance
conditions
Vested but unexercised
nil cost options, not
subject to performance
conditions
Unvested nil cost options
not subject to performance
conditions
Current shareholding
(% of base salary)
Shareholding requirement
(% of base salary)
Dave Lewis 101,870 103,346 1,604,104 5,668,394 2,151,647 – 344% 400%Alan Stewart 51,813 53,033 859,948 3,091,849 838,158 57,255 269% 300%(a) Value of Executive Directors’ shareholdings based on the three-month average share price to 24 February 2018 of 205p.(b) Vested and unvested options include dividend equivalents added since the date of grant.(c) Shares used to determine the shareholding guideline are shares beneficially owned and shares held in plans which are not subject to performance conditions on a net of tax basis.(d) Between 25 February and 10 April 2018, Dave Lewis and Alan Stewart both acquired 68 partnership shares under the all-employee Share Incentive Plan. No other changes in Executive
Director share interests occurred in the period.
In accordance with the approved shareholding guidelines, Dave Lewis and Alan Stewart have five years to meet the guidelines (i.e. until 1 September and 23 September 2019, respectively). Since appointment, Dave Lewis and Alan Stewart have made material progress towards meeting the guidelines and are expected to meet them within the allotted time period. Under the proposed Remuneration Policy, Executive Directors will be required to retain all shares that vest, net of any tax liabilities, until the requirement is met.
Executive Committee members are required to build up a shareholding of 200% of base salary in Tesco shares within five years of appointment to the Executive Committee. As at the date of this report, this had been met by all Executive Committee members, except Jane Lawrie, Alessandra Bellini and Matt Simister who were appointed on 10 October 2016, 1 March 2017 and 1 April 2017, respectively. In line with the Executive Directors, under the proposed Remuneration Policy, Executive Committee members will be required to retain all shares that vest until the requirement is met.
As at 10 April 2018, Charles Wilson held 113,675,542 Tesco shares significantly exceeding his shareholding guideline of 200% of base salary. In accordance with the terms of his Lock-up Agreement these shares will be held by him for five years from 5 March 2018.
Executive Directors’ interests in share awards
Financial year awards vesting in 2014/15 2015/16 2016/17 2017/18 2018/19 2019/20 2020/21Dave LewisVested awards 454,694 611,205 613,365 472,383 – – –Options subject to service – – – – – 939,720 655,815Options subject to performance and service (PSP) – – – – 1,566,987 2,161,405 1,909,722SAYE options (exercise price £1.51) – – – – 11,920 – –Alan StewartVested awards – 254,231 328,841 255,086 – – –Options subject to service – – – – 56,950 507,449 347,906Options subject to performance and service (PSP) – – – – 854,720 1,178,948 1,041,666SAYE options (exercise price £1.51) – – – – 11,920 – –(a) No options lapsed or were exercised by Dave Lewis in 2017/18.(b) 308,543 nil cost options granted to Alan Stewart on 24 October 2014 as part of a buy out agreement for share options forfeited on leaving his previous employer lapsed in 2017/18.
No options were exercised by him in 2017/18.(c) All options lapse 10 years after grant.(d) Vested awards include dividend equivalents added since the date of grant.
Change in Group Chief Executive remuneration compared with changes in colleague remunerationIn the UK, the total reward package for a typical customer assistant is ahead of the voluntary Living Wage on a national basis and the same hourly rate is paid to all colleagues regardless of age. The Company is committed to rewarding colleagues with a total reward package that provides them with choice and that they really value.
The table below shows the percentage change in remuneration for the Group Chief Executive and the average UK colleague from 2016/17 to 2017/18. The Committee decided to use UK colleagues as the appropriate comparator group as pay changes across the Group depending on local market conditions, UK colleagues constitute the majority of Tesco’s colleagues and the Group Chief Executive is predominantly based in the UK, albeit with a global role and responsibilities.
Salary (% change from
2016/17 to 2017/18)
Benefits (% change from
2016/17 to 2017/18)
Bonus (% change from
2016/17 to 2017/18)Group Chief Executive 0% (71)% (3.6)%Average UK colleague 5.25% 0% (13)%
Bonuses for 2017/18 for UK eligible colleagues paid out on average at 69% of the maximum bonus opportunity (2016/17: 82%).
Tesco PLC Annual Report and Financial Statements 201860
Directors’ remuneration report continued

Group Chief Executive remuneration history
2009/10 2010/11 2011/12 2012/13 2013/14 2014/15 2015/16 2016/17 2017/18Sir Terry
Leahy Sir Terry
Leahy Philip
Clarke Philip
Clarke Philip
Clarke Philip
ClarkeDave
Lewis(b)Dave
LewisDave
LewisDave
LewisGroup Chief Executive single figure of remuneration (£’000)
7,100 7,150 4,595 1,280 1,634 764 4,133 4,632 4,147 4,874
Annual bonus outturn (% of maximum award)
89% 75% 0%(a) 0% 0% 0% n/a 96% 76% 73%
PSP vest (% of maximum award) 83% 75% 46.5% 0% 0% 0% n/a n/a n/a 30%Share option vesting (% of maximum award)
100% 100% 100% 0% n/a n/a n/a n/a n/a n/a
(a) Philip Clarke elected not to take a bonus for 2011/12 and left the Board on 1 September 2014.(b) The single figure total for 2014/15 includes one-off buyout awards made to Dave Lewis to compensate him for awards forfeited from his previous employer. The awards were made
based on the expected value of the awards forfeited, taking into account performance at his previous employer and delivered in restricted shares which vest subject to continued employment by Tesco. Since these were awards related to previous employment, and not subject to Tesco performance conditions, there is no direct alignment with Tesco’s performance in 2014/15. The awards had no impact on the single figure for 2015/16 or any future years.
Relative importance of spend on payThe chart shows total colleague pay compared with distributions to shareholders and for further context, Group operating profit before exceptional items. Tesco’s colleagues are essential to how the Company does business and meets the needs of its customers. In 2017/18, Tesco employed, on average, 448,988 colleagues across the Group (2016/17: 464,520).
(£m)
2016/17
Totalemployee pay
Distributionsto shareholders
Group operating profitbefore exceptional items
2017/18 2016/17 2017/18 2016/17 2017/18
7,362 7,233
1,2801,644
0 82
Total employee pay includes wages and salaries, social security, pension and share-based costs at actual exchange rates (£7,233m in 2017/18 and £7,362m in 2016/17 – see Note 3 of the financial statements). Distributions to shareholders include interim and final dividends paid in respect of each financial year (£nil in 2016/17 and £82m in 2017/18) (see Note 8 of the financial statements). There were no share buy-backs in 2016/17 or 2017/18.
Further information on remuneration in 2017/18Payments to former Directors and for loss of office (audited)There were no payments made to former Directors that exceeded the de minimis threshold of £10,000 set by the Company. There were no payments for loss of office made to Directors in the year.
Risk managementWhen developing the remuneration structures, the Committee considered whether any aspect of these might encourage risk taking or inappropriate behaviours that are incompatible with Tesco’s values and the long-term interests of shareholders. If necessary, the Committee would take appropriate steps to address this. The Committee also has the discretion to apply malus and clawback in certain circumstances.
Outside appointmentsIn 2017/18, Alan Stewart received £92,000 (2016/17: £92,000) in fees and a product allowance of £1,250 as a non-executive director of Diageo plc. He does not receive any fees as a Director of Tesco Personal Finance Group Limited (Tesco Bank).
Funding of equity awardsExecutive Director incentive arrangements are funded by a mix of newly issued shares and shares purchased in the market. Where shares are newly issued, the Company complies with Investment Association dilution guidelines on their issue. The current dilution usage of discretionary plans is 2.6% of shares in issue. Where shares are purchased in the market, these may be held by Tesco Employees’ Share Scheme Trustees Limited or Tesco International Employee Benefit Trust in which case the voting rights relating to the shares are exercisable by the Trustees in accordance with their fiduciary duties. At 24 February 2018, the Trusts held 13,311,503 shares.
61Tesco PLC Annual Report and Financial Statements 2018
Corporate governance

Annual report on remuneration continued
Implementation of remuneration policy for Non-executive Directors in 2017/18Non-executive Directors’ dates of appointment
Director Date of appointment Notice periodAppointment end date in accordance with letter of appointment
John Allan 1 March 2015 None AGM 2018Mark Armour 2 September 2013 None AGM 2018Stewart Gilliland 5 March 2018 None AGM 2018Steve Golsby 1 October 2016 None AGM 2018Byron Grote 1 May 2015 None AGM 2018Mikael Olsson 1 November 2014 None AGM 2018Deanna Oppenheimer 1 March 2012 None AGM 2018Simon Patterson 1 April 2016 None AGM 2018Alison Platt 1 April 2016 None AGM 2018Lindsey Pownall 1 April 2016 None AGM 2018
Non-executive Director feesNon-executive Director fees are reviewed periodically by the Board, with the last increase taking effect from 1 March 2017. Non-executive Director fees will be reviewed in 2018/19, with any changes taking effect from 1 March 2019. The structure of fees paid to Non-executive Directors in 2018/19 will remain unchanged from the prior year as set out below.
Basic fee £72,000 p.a.Additional fees:Senior Independent Director £27,000 p.a.Chairs of the Audit, Corporate Responsibility or Remuneration Committees £31,000 p.a.Membership of Audit, Corporate Responsibility, Nominations and Governance or Remuneration Committees £12,500 p.a. for each Committee
The Company reimburses the Directors for reasonable expenses in performing their duties and may settle any tax incurred in relation to these. The Company will pay reasonable legal fees for advice in relation to terms of engagement. For Non-executive Directors based overseas the Company meets travel and accommodation expenditure as required to fulfil their duties.
Chairman’s feeJohn Allan was appointed as Non-executive Chairman with effect from 1 March 2015. He receives a fee of £650,000 p.a. inclusive of all Board fees, which was fixed for a period of three years and will be reviewed in 2018/19. He may have the benefit of home security, colleague discount and healthcare for himself and his partner.
Fees paid during 2017/18 (audited)The following table sets out the fees paid to the Non-executive Directors for the year ended 24 February 2018. Non-executive Directors are not paid a pension and do not participate in any of the Company’s variable incentive schemes.
Director DateFees
(£’000)Taxable expenses
(£’000)Total
(£’000)John Allan 2017/18 650 10 660
2016/17 650 13 663Mark Armour 2017/18 84 – 84
2016/17 82 – 82Steve Golsby 2017/18 89 9 98
2016/17 28 6 34Byron Grote 2017/18 128 – 128
2016/17 124 – 124Mikael Olsson 2017/18 97 4 101
2016/17 94 5 99Deanna Oppenheimer 2017/18 155 14 169
2016/17 127 13 140Simon Patterson 2017/18 84 – 84
2016/17 71 – 71Alison Platt 2017/18 84 2 86
2016/17 71 3 74Lindsey Pownall 2017/18 95 6 101
2016/17 71 15 86(a) John Allan also received benefits of £3,000 (2016/17: £3,000) made up of security costs and healthcare insurance. The Non-executive Directors’ taxable expenses comprised travel,
hotel and subsistence expenses related to their role and have been grossed up for tax, where applicable.(b) Steve Golsby joined the Board on 1 October 2016.
Tesco PLC Annual Report and Financial Statements 201862
Directors’ remuneration report continued

Beneficial share ownership (audited)The table below outlines the current share interests of the Non-executive Directors. Shareholdings include shares held by connected persons. Non-executive Directors are subject to the same share dealing policy as Executive Directors and there were no changes to their share interests between 25 February and 10 April 2018.
Non-executive Director Ordinary shares held at 24 February 2018 Ordinary shares held at 25 February 2017John Allan(a) 284,082 224,349Mark Armour 50,000 25,000 Steve Golsby 42,296 –Byron Grote(b) 243,000 173,700Mikael Olsson 20,101 5,000 Deanna Oppenheimer(b) 109,041 103,500Simon Patterson 100,000 –Alison Platt 11,242 –Lindsey Pownall 20,000 –(a) John Allan also held 398,000 bonds in the Company at 24 February 2018 (298,000 bonds at 25 February 2017).(b) Byron Grote and Deanna Oppenheimer held their shares in the form of American Depositary Receipts. Each ADR is equivalent to three Ordinary shares of 5p each in the Company.(c) On his appointment to the Board on 5 March 2018, Stewart Gilliland held 43,050 Ordinary shares.
The Remuneration Committee in 2017/18Operation of the Remuneration CommitteeThe Committee schedules meetings two years in advance. During the year, it held four scheduled meetings and three ad hoc meetings. Ad hoc meetings were convened to consider matters in relation to the Booker merger and the Remuneration Policy. The Directors’ biographies can be found on pages 28 and 29. No member of the Committee has any personal financial interest in the matters being decided, other than as a shareholder, nor any day-to-day involvement in running the business of Tesco. Steve Golsby joined the Committee on 2 October 2017. Steve has attended all scheduled meetings subsequent to his appointment.
Robert Welch, Group Company Secretary, is Secretary to the Committee and the Group Chief Executive attends meetings at the invitation of the Committee. The Group Chief Executive is not present when his own remuneration is being discussed. The Committee is supported by Alison Horner (Chief People Officer) as well as the Reward, Corporate Secretariat and Finance functions.
Relations with Tesco BankAs required by the Financial Conduct Authority, Tesco Bank has a separate, independent remuneration committee. The Committee is consulted on, and makes recommendations in relation to, the remuneration arrangements for Tesco Bank colleagues, with the aim of encouraging consistency with Group remuneration policy, but it does not make decisions in relation to, or direct, how remuneration is managed within Tesco Bank.
Remuneration Committee activities 2017/18The following provides a summary of the key areas of focus of the Committee during the year:
Strategy and policy Assessed the external environment in respect of the Company’s current remuneration arrangements.Reviewed remuneration arrangements below Board level.Reviewed external market developments and best practice in remuneration.
Appointments and cessations Approved the remuneration of Charles Wilson, CEO, UK & ROI.Approved cessation terms for Matt Davies.
Pay Reviewed Executive Directors’ and senior managers’ base salaries.Short-term incentives Reviewed performance against targets and determined annual bonus outturn.
Considered the design, metrics and approach to targets for the 2017/18 annual bonus.Long-term incentives Reviewed performance against targets and determined 2014 PSP outturn.
Considered the approach to be taken for the 2018 PSP award.Monitored performance of outstanding PSP awards against targets.
Governance and other matters Consulted with leading shareholders and representative bodies on the proposed Remuneration Policy.Reviewed shareholder feedback on 2017 Annual Report.Considered institutional investors’ guidelines on executive remuneration.Reviewed shareholding guidelines and progress of Executive Directors and Executive Committee members.Approved the 2016/17 Directors’ remuneration report.Received report from Tesco Bank remuneration committee.Reviewed the Committee’s performance and terms of reference.
63Tesco PLC Annual Report and Financial Statements 2018
Corporate governance
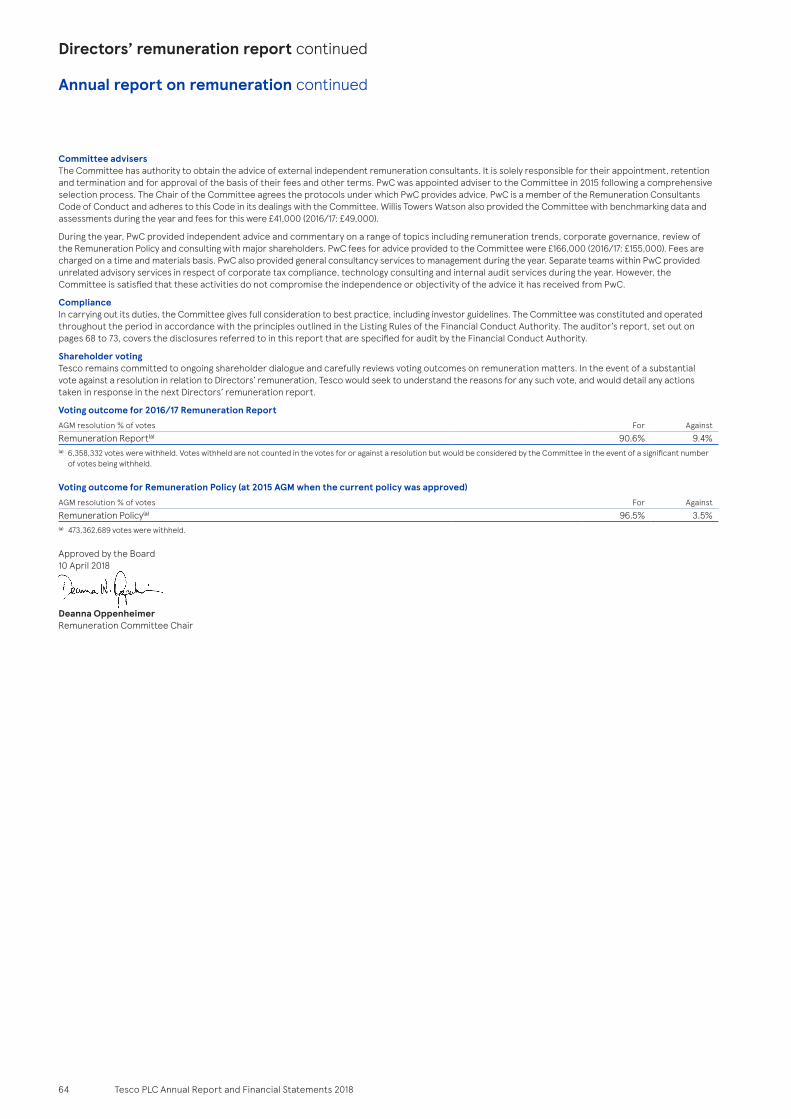
Annual report on remuneration continued
Committee advisersThe Committee has authority to obtain the advice of external independent remuneration consultants. It is solely responsible for their appointment, retention and termination and for approval of the basis of their fees and other terms. PwC was appointed adviser to the Committee in 2015 following a comprehensive selection process. The Chair of the Committee agrees the protocols under which PwC provides advice. PwC is a member of the Remuneration Consultants Code of Conduct and adheres to this Code in its dealings with the Committee. Willis Towers Watson also provided the Committee with benchmarking data and assessments during the year and fees for this were £41,000 (2016/17: £49,000).
During the year, PwC provided independent advice and commentary on a range of topics including remuneration trends, corporate governance, review of the Remuneration Policy and consulting with major shareholders. PwC fees for advice provided to the Committee were £166,000 (2016/17: £155,000). Fees are charged on a time and materials basis. PwC also provided general consultancy services to management during the year. Separate teams within PwC provided unrelated advisory services in respect of corporate tax compliance, technology consulting and internal audit services during the year. However, the Committee is satisfied that these activities do not compromise the independence or objectivity of the advice it has received from PwC.
ComplianceIn carrying out its duties, the Committee gives full consideration to best practice, including investor guidelines. The Committee was constituted and operated throughout the period in accordance with the principles outlined in the Listing Rules of the Financial Conduct Authority. The auditor’s report, set out on pages 68 to 73, covers the disclosures referred to in this report that are specified for audit by the Financial Conduct Authority.
Shareholder votingTesco remains committed to ongoing shareholder dialogue and carefully reviews voting outcomes on remuneration matters. In the event of a substantial vote against a resolution in relation to Directors’ remuneration, Tesco would seek to understand the reasons for any such vote, and would detail any actions taken in response in the next Directors’ remuneration report.
Voting outcome for 2016/17 Remuneration Report AGM resolution % of votes For AgainstRemuneration Report(a) 90.6% 9.4%(a) 6,358,332 votes were withheld. Votes withheld are not counted in the votes for or against a resolution but would be considered by the Committee in the event of a significant number
of votes being withheld.
Voting outcome for Remuneration Policy (at 2015 AGM when the current policy was approved)AGM resolution % of votes For AgainstRemuneration Policy(a) 96.5% 3.5%(a) 473,362,689 votes were withheld.
Approved by the Board10 April 2018
Deanna OppenheimerRemuneration Committee Chair
Tesco PLC Annual Report and Financial Statements 201864
Directors’ remuneration report continued

The Directors present their report, together with the audited accounts for the 52 weeks ended 24 February 2018.
DividendsReflecting Tesco’s improved performance and the Board’s confidence in its future prospects, on 4 October 2017 the Company announced the restoration of its dividend and on 24 November 2017 paid an interim dividend of 1.0p per ordinary share (this follows payment of no dividend in the 52 weeks ended 25 February 2017 and 27 February 2016 and payment of a dividend of 1.16p per ordinary share in the 53 weeks ended 28 February 2015). The Board expects a broadly one-third, two-thirds split between the interim and final dividend and is intending to pay a final dividend for the 52 weeks ending 24 February 2018 of 2.0p per ordinary share (subject to shareholder approval), with dividends expected to grow from 2017, with the aim of achieving a target cover of approximately two times earnings per share over the medium term.
Certain nominee companies representing our employee benefit trusts hold shares in the Company in connection with the operation of the Company’s share plans and evergreen dividend waivers remain in place on shares held by them that have not been allocated to employees.
Share capital and control of the Company and significant agreementsDetails of the Company’s share capital, including changes during the year in the issued share capital and details of the rights attaching to the Company’s ordinary shares are set out in Note 28 on page 126. In accordance with the terms of the cash and share merger with Booker Group plc approved by shareholders on 28 February 2018 (the Merger), Tesco PLC issued 1,547,854,846 ordinary shares on 5 March 2018 to holders of Booker Group plc ordinary shares.
No shareholder holds securities carrying special rights with regards to control of the Company. Except for the Lock Up Agreement (described further below), which the Company has entered into with Charles Wilson, CEO UK & ROI, there are no other restrictions on voting rights or the transfer of securities in the Company and the Company is not aware of any agreements between holders of securities that result in such restrictions.
On 27 January 2017, Charles Wilson entered into a Lock up Agreement as part of the Merger under which he agreed not to (subject to certain customary carve-outs) dispose of his holding of 24,533 ordinary shares in the Company. In an extension to the Lock up Agreement, Charles Wilson recorded his intention not to dispose of the entire 113,675,542 ordinary shares in the Company he received as a Booker shareholder pursuant to the Merger without Tesco’s consent during the lock-up period of five years from 5 March 2018.
The Company was authorised by shareholders at the 2017 AGM to purchase its own shares in the market up to a maximum of approximately 10% of its issued share capital. No shares were purchased under that authority during the financial year. The Company is seeking to renew the authority at the forthcoming AGM, within the limits set out in the notice of that meeting and in line with the recommendations of the Pre-emption Group.
Shares held by the Company’s Share Incentive Plan Trust, International Employee Benefit Trust, Employees’ Share Scheme Trust and Tesco Ireland Share Bonus Scheme Trust rank pari passu with the shares in issue and have no special rights. Voting rights and rights of acceptance of any offer relating to the shares held in these trusts rests with the trustees, who may take account of any recommendation from the Company. Voting rights are not exercisable by the employees on whose behalf the shares are held in trust.
The Company is not party to any significant agreements that would take effect, alter or terminate following a change of control of the Company. The Company does not have agreements with any Director or officer that would provide compensation for loss of office or employment resulting from a takeover, except that provisions of the Company’s share plans may cause options and awards granted under such plans to vest on a takeover.
Share forfeitureThe Company implemented a share forfeiture programme following the completion of a tracing and notification exercise to any shareholders who had not had contact with the Company over the past 12 years, in accordance with the provisions set out in the Company’s Articles. Under the share forfeiture programme the shares and dividends associated with shares of untraced members were forfeited, with the resulting proceeds transferred to the Company to use for good causes in line with the Group’s corporate responsibility strategy. During the period, the Company received £3m proceeds from sale of untraced shares and £2m write-back of unclaimed dividends, which were reflected in share premium and retained earnings.
Major shareholdersInformation provided to the Company by major shareholders pursuant to the FCA’s Disclosure Guidance and Transparency Rules (DTR) are published via a Regulatory Information Service and are available on the Company’s website. The Company had been notified under Rule 5 of the DTR of the following interests in voting rights in its shares as at 24 February 2018 and as at the date of this report:
% of total votingrights as at
24 February 2018
% of total votingrights as at the
date of this reportBlackRock, Inc 6.63 6.64GIC Private Limited 3.08 < 3Norges Bank 5.96 4.99Schroders plc 4.99 4.99
Articles of AssociationThe Company’s Articles of Association may only be amended by special resolution at a general meeting of the shareholders.
Directors and their interestsThe biographical details of the current serving Directors are set out on pages 28 and 29. The Directors who served during the year were: John Allan; Mark Armour; Steve Golsby; Byron Grote; Dave Lewis; Mikael Olsson; Deanna Oppenheimer; Simon Patterson; Alison Platt; Lindsey Pownall and Alan Stewart. The interests of Directors and their immediate families in the shares of Tesco PLC, along with details of Directors’ share options, are contained in the Directors’ remuneration report set out on pages 45 to 64.
On 5 March 2018 Stewart Gilliland and Charles Wilson were appointed to the Tesco PLC Board.
At no time during the year did any of the Directors have a material interest in any significant contract with the Company or any of its subsidiaries. A qualifying third party indemnity provision as defined in Section 234 of the Companies Act 2006 is in force for the benefit of each of the Directors and the Company Secretary (who is also a Director of certain subsidiaries of the Company) in respect of liabilities incurred as a result of their office, to the extent permitted by law. In respect of those liabilities for which Directors may not be indemnified, the Company maintained a Directors’ and Officers’ liability insurance policy throughout the financial year.
Employment policiesOur employment policies are regularly reviewed to ensure they are simple, helpful and trusted to enable an honest and transparent employment culture. We are continuously focused upon strengthening our policy position in order to maintain this vision and culture. Much of our focus over the past year, has been placed upon removing complexity and hierarchy from our policies to create more clarity and fairness for our colleagues. As we continue to transition towards more enabling technology, our focus remains on how we can make our policies and the processes that sit within these more accessible to our colleagues. This enables self-service, and provides our colleagues with direct access to the information they need to help and support them at work.
We recognise that in order to drive our business forward we must respond to colleague feedback. Therefore, we continue to work towards improving our communication to colleagues to ensure they are engaged with the decisions we make, and so we can respond to their feedback. We also continue to work together with our recognised trade union in the UK, Usdaw, to ensure our policies are right for our business and that they support the employment needs of all our colleagues.
Our Equal Opportunities, Diversity and Inclusion policies support managers and colleagues in creating a diverse and inclusive culture where everyone is welcome. Our policies demonstrate our commitment to providing equal opportunities to all colleagues, irrespective of age, disability, gender, marriage and civil partnership, pregnancy or maternity, race, religion or belief, sex, or sexual orientation. We offer a range of colleague networks to maintain a culture of inclusivity, including: ‘Out at Tesco’; ‘Women at Tesco’; ‘Black Asian Minority Ethnic Network’; ‘Armed Forces Network’; and ‘Disability Network’. We are proud to be a Disability Confident Employer as part of the UK Government’s Disability Confident scheme, a Global Diversity champion with Stonewall and a gold member of the UK Government’s Armed Forces Covenant. This demonstrates Tesco’s commitment to ensuring we create an environment where all colleagues have the opportunity to get on.
65Tesco PLC Annual Report and Financial Statements 2018
Corporate governance
Directors’ report

We actively encourage colleagues to become involved in the financial performance of our business through a variety of share and bonus schemes.
All of these components are intrinsically linked to our Little Helps Plan, more information on this can be found on pages 16 to 21 or on www.tescoplc.com/people.
Political donationsThe Group did not make any political donations (2016/17: £nil) or incur any political expenditure during the year (2016/17: £nil).
Compliance with the Groceries (Supply Chain Practices) Market Investigation Order 2009 and the Groceries Supply Code of Practice (the Code)The Code regulates aspects of the commercial relationship between the largest 10 grocery retailers in the UK and their suppliers of grocery products, establishing an overarching principle that retailers must deal with their suppliers fairly and lawfully. Specific supplier protections under the Code include the obligation for agreements to be in writing and copies retained, reasonable notice to be given of changes to the supply chain or reduction in the volume of purchases, and a number of provisions relating to payments by suppliers, including obligations for retailers to pay suppliers without delay and a prohibition on certain types of payments, such as those for shrinkage.
Retailer compliance with the Code is overseen by the Groceries Code Adjudicator (GCA), Christine Tacon. We continue to engage constructively and positively with the GCA and her office and are working together, in particular on her Top 5 Priorities.
Our Product Change Programme began in 2015, and we continue to transform our commercial model. Code compliance is at the heart of this to ensure compliance is built into our teams’ mindset and ways of working. We are implementing simpler, fairer and more transparent operations, systems and processes, making compliance with the Code easier and enabling all parties to focus on the customer.
Our management are chosen for ‘how’ they perform their roles and are committed to ensuring Code compliance. We train colleagues across our Product and other functions in the UK and in Tesco Bengaluru on their obligations under the Code. In this financial year, we trained 212 new starters and 1,622 colleagues received updated e-learning which is supplemented where required with face-to-face training sessions. In addition, 5,264 office colleagues have completed their annual Code of Compliance Declaration, and those colleagues who work with grocery suppliers have also completed a declaration to confirm they have complied with GSCOP during 2017/18.
These changes are having a positive effect on our relationships with suppliers. In the GCA’s annual supplier survey in 2017, Tesco remained the most improved retailer, with 53% of suppliers reporting an improvement in how we operate and 92% of our suppliers recognising that we comply ‘consistently well’ or ‘mostly well’ with the Code. The results of our own supplier survey, conducted twice each year, also reflect this marked improvement in how our suppliers view their relationship with Tesco. Despite inflationary challenges, suppliers to our UK grocery business once again rated their ‘overall satisfaction’ with Tesco very highly (78.2% in February 2018).
This year, 14 Code-related complaints were raised by suppliers. As at 24 February 2018, we had resolved 11 of the concerns following further discussion between the buying team and the relevant supplier, and in five of the cases, between the Code Compliance Officer and the supplier. Of the three remaining complaints to be resolved, two were resolved shortly after the year end, and a formal dispute has been raised in one matter.
Going concern and longer term viability statementThe Directors consider that the Group and the Company have adequate resources to remain in operation for the foreseeable future and have therefore continued to adopt the going concern basis in preparing the financial statements. The UK Corporate Governance Code requires the Directors to assess and report on the prospects of the Group over a longer period. This longer term viability statement is set out on page 25.
Events after the balance sheet dateOn 5 March 2018 the recommended share and cash merger with Booker Group plc completed, following shareholder approval on 28 February 2018 (the Merger). The proposed Merger was announced by the Company on 27 January 2017 and received regulatory approval from the Competition and Markets Authority on 20 December 2017. More information on the Merger can be found on pages 7, 15 and in Note 35 on page 131.
Directors’ statement of disclosure of information to the auditorHaving made the requisite enquiries, the Directors in office at the date of this Annual Report and Financial Statements have each confirmed that, so far as they are aware, there is no relevant audit information (as defined by Section 418 of the Companies Act 2006) of which the Group’s auditor is unaware, and each of the Directors has taken all the steps he/she ought to have taken as a Director to make himself/herself aware of any relevant audit information and to establish that the Group’s auditor is aware of that information. This confirmation is given and should be interpreted in accordance with the provisions of Section 418 of the Companies Act 2006.
Cautionary statement regarding forward-looking informationWhere this document contains forward-looking statements, these are made by the Directors in good faith based on the information available to them at the time of their approval of this report. These statements should be treated with caution due to the inherent risks and uncertainties underlying any such forward-looking information. The Group cautions investors that a number of factors, including matters referred to in this document, could cause actual results to differ materially from those contained in any forward-looking statement. Such factors include, but are not limited to, those discussed under Principal risks and uncertainties on pages 22 to 25.
Neither the Group, nor any of the Directors, provides any representation, assurance or guarantee that the occurrence of the events expressed or implied in any forward-looking statements in this document will actually occur. Undue reliance should not be placed on these forward-looking statements. The Group undertakes no obligation to publicly update or revise any forward-looking statement, whether as a result of new information, future events or otherwise.
Additional disclosuresOther information that is relevant to the Directors’ report, and which is incorporated by reference into this report, can be located as follows:
PagesFuture developments 1 to 25Research and development 9Greenhouse gas emissions 21Financial instruments and financial risk management 110 to 117Corporate governance report 26 to 44
Disclosures required pursuant to Listing Rule 9.8.4R can be found on the following pages:
PagesStatement of capitalised interest 94 and 101Allotment for cash of equity securities 126Waiver of dividends 65
The Company has chosen, in accordance with Section 414 C(11) of the Companies Act 2006, and as noted in this Directors’ report, to include certain matters in its Strategic report that would otherwise be required to be disclosed in this Directors’ report. The Strategic report can be found on pages 1 to 25.
By order of the Board
Robert Welch Group Company Secretary10 April 2018
Tesco PLC Annual Report and Financial Statements 201866
Directors’ report continued

The Directors are required by the Companies Act 2006 to prepare financial statements for each financial year that give a true and fair view of the state of affairs of the Group and the Company as at the end of the financial year, and of the profit or loss of the Group for the financial year. Under that law, the Directors are required to prepare the Group financial statements in accordance with International Financial Reporting Standards (IFRS) as adopted by the European Union (EU) and have elected to prepare the Parent Company financial statements in accordance with United Kingdom Generally Accepted Accounting Practice, including FRS 101 ‘Reduced Disclosure Framework’ (UK Accounting Standards and applicable law).
In preparing these financial statements, the Directors are required to:
– select suitable accounting policies and then apply them consistently; – make judgements and accounting estimates that are reasonable and prudent;
– state whether IFRSs as adopted by the EU and applicable UK Accounting Standards have been followed, subject to any material departures disclosed and explained in the Group and Parent Company financial statements respectively;
– present information, including accounting policies, in a manner that provides relevant, reliable, comparable and understandable information;
– provide additional disclosures when compliance with the specific requirements in IFRS are insufficient to enable users to understand the impact of particular transactions, other events and conditions on the entity’s financial position and financial performance; and
– prepare the financial statements on the going concern basis, unless it is inappropriate to presume that the Group and the Company will continue in business.
The Directors are responsible for keeping adequate accounting records that are sufficient to show and explain the Group’s transactions and disclose with reasonable accuracy at any time the financial position of the Group and the Company, and which enable them to ensure that the financial statements and the Directors’ remuneration report comply with the Companies Act 2006 and, as regards the Group financial statements, Article 4 of the IAS Regulation. They also have general responsibility for taking such steps as are reasonably open to them to safeguard the assets of the Group and the Company, and to prevent and detect fraud and other irregularities. The Directors are responsible for the maintenance and integrity of the Company’s website. Legislation in the United Kingdom governing the preparation and dissemination of financial statements may differ from legislation in other jurisdictions. The Directors consider that the Annual Report and Financial Statements, taken as a whole, is fair, balanced and understandable and provides the information necessary for shareholders to assess the Group’s and the Company’s performance, business model and priorities. Each of the Directors, whose names and functions are set out on pages 28 and 29 confirm that, to the best of their knowledge:
– the financial statements, which have been prepared in accordance with the relevant financial reporting framework, give a true and fair view of the assets, liabilities, financial position and profit or loss of the Group and the undertakings included in the consolidation taken as a whole; and
– the Strategic report contained within this document includes a fair review of the development and performance of the business and the position of the Group and the undertakings included in the consolidation taken as a whole, together with a description of the principal risks and uncertainties that the Group faces.
67Tesco PLC Annual Report and Financial Statements 2018
Corporate governance
Statement of Directors’ responsibilities

Report on the audit of the financial statementsOpinionIn our opinion:
– the financial statements give a true and fair view of the state of the Group’s and of the Parent Company’s affairs as at 24 February 2018 and of the Group’s profit for the year then ended;
– the Group financial statements have been properly prepared in accordance with International Financial Reporting Standards (IFRSs) as adopted by the European Union;
– the Parent Company financial statements have been properly prepared in accordance with United Kingdom Generally Accepted Accounting Practice including FRS 101 ‘Reduced Disclosure Framework’; and
– the financial statements have been prepared in accordance with the requirements of the Companies Act 2006 and, as regards the Group financial statements, Article 4 of the IAS Regulation.
We have audited the financial statements of Tesco PLC (the Parent Company) and its subsidiaries (the Group) which comprise:
– the Group income statement; – the Group statement of comprehensive income/(loss); – the Group and Parent Company balance sheets; – the Group and Parent Company statements of changes in equity; – the Group cash flow statement; and – the related Notes 1 to 35 of the Group financial statements and Notes 1 to 17 of the Parent Company financial statements.
The financial reporting framework that has been applied in the preparation of the Group financial statements is applicable law and IFRSs as adopted by the European Union. The financial reporting framework that has been applied in the preparation of the Parent Company financial statements is applicable law and United Kingdom Accounting Standards, including FRS 101 ‘Reduced Disclosure Framework’ (United Kingdom Generally Accepted Accounting Practice).
Basis for opinionWe conducted our audit in accordance with International Standards on Auditing (UK) (ISAs (UK)) and applicable law. Our responsibilities under those standards are further described in the auditor’s responsibilities for the audit of the financial statements section of our report.
We are independent of the Group and the Parent Company in accordance with the ethical requirements that are relevant to our audit of the financial statements in the UK, including the FRC’s Ethical Standard as applied to listed public interest entities, and we have fulfilled our other ethical responsibilities in accordance with these requirements. We confirm that the non-audit services prohibited by the FRC’s Ethical Standard were not provided to the Group or the Parent Company.
We believe that the audit evidence we have obtained is sufficient and appropriate to provide a basis for our opinion.
Summary of our audit approachKey audit mattersThe key audit matters that we identified in the current year were:
– store impairment review; – recognition of commercial income; – inventory valuation; – pension obligation valuation; – contingent liabilities; – presentation of the Group’s income statement; and – retail technology environment, including IT security.
No new key audit matters have been included in this report compared to the prior year report. Key audit matters have been updated for the current year where required.
MaterialityWe have considered a number of benchmarks and determined that it is appropriate to base materiality on profit before tax. The materiality that we used for the Group financial statements was £50m (2016/17: £50m) which equates to 4.4% of profit before tax before exceptional items. Refer to page 72 for further details.
ScopingOur audit scoping provides full scope audit coverage of 96% (2016/17: 97%) of revenue and 92% (2016/17: 91%) of net assets.
Significant changes in our approachIn our 2017/18 report the following change to the key audit matters identified has been made, compared with our 2016/17 report:
– the Tesco Bank payment fraud is no longer considered to be a key audit matter following our conclusion in 2016/17 that the Group had appropriately accounted for liabilities associated with the incident.
Conclusions relating to going concern, principal risks and viability statementGoing concernWe have reviewed the Directors’ statement on page 66 to the financial statements about whether they considered it appropriate to adopt the going concern basis of accounting in preparing them and their identification of any material uncertainties to the Group’s and Parent Company’s ability to continue to do so over a period of at least twelve months from the date of approval of the financial statements.
We are required to state whether we have anything material to add or draw attention to in relation to that statement required by Listing Rule 9.8.6R(3) and report if the statement is materially inconsistent with our knowledge obtained in the audit.
We confirm that we have nothing material to report, add or draw attention to in respect of these matters.
Principal risks and viability statementBased solely on reading the Directors’ statements and considering whether they were consistent with the knowledge we obtained in the course of the audit, including the knowledge obtained in the evaluation of the Directors’ assessment of the Group’s and the Parent Company’s ability to continue as a going concern, we are required to state whether we have anything material to add or draw attention to in relation to:
– the disclosures on pages 22 to 25 that describe the principal risks and explain how they are being managed or mitigated;
– the Directors’ confirmation on page 22 that they have carried out a robust assessment of the principal risks facing the Group, including those that would threaten its business model, future performance, solvency or liquidity; or
– the Directors’ explanation on page 25 as to how they have assessed the prospects of the Group, over what period they have done so and why they consider that period to be appropriate, and their statement as to whether they have a reasonable expectation that the Group will be able to continue in operation and meet its liabilities as they fall due over the period of their assessment, including any related disclosures drawing attention to any necessary qualifications or assumptions.
We are also required to report whether the Directors’ statement relating to the prospects of the Group required by Listing Rule 9.8.6R(3) is materially inconsistent with our knowledge obtained in the audit.
We confirm that we have nothing material to report, add or draw attention to in respect of these matters.
Key audit mattersKey audit matters are those matters that, in our professional judgement, were of most significance in our audit of the financial statements of the current period and include the most significant assessed risks of material misstatement (whether or not due to fraud) that we identified. These matters included those which had the greatest effect on: the overall audit strategy, the allocation of resources in the audit; and directing the efforts of the engagement team. We have determined that there was a potential for fraud through possible manipulation of commercial income due to the level of judgement involved.
These matters were addressed in the context of our audit of the financial statements as a whole, and in forming our opinion thereon, and we do not provide a separate opinion on these matters.
Tesco PLC Annual Report and Financial Statements 201868
Independent auditor’s report to the members of Tesco PLC

Key audit matter description How the scope of our audit responded to the key audit matter Key observationsStore impairment reviewAs described in Note 1 (Accounting policies, judgements and estimates) and Note 11 (Property, plant and equipment), the Group held £18,521m (2016/17: £18,108m) of property, plant and equipment at 24 February 2018.
Under IFRS, the Group is required to complete an impairment review of its store portfolio where there are indicators of impairment or impairment reversal.
Judgement is required in identifying indicators of impairment and estimation is required in determining the recoverable amount of the Group’s store portfolio. Additionally, there is judgement in relation to triggering the reversals of impairments recognised in previous periods.
There is a risk that the carrying value of stores and related fixed assets may be higher than the recoverable amount. Where a review for impairment, or reversal of impairment, is conducted, the recoverable amount is determined based on the higher of ‘value-in-use’ and ‘fair value less costs of disposal’.
The three areas which are key to management’s impairment review are as follows:
– value-in-use is derived from cash flow projections which rely upon Directors’ assumptions and estimates of future trading performance, including the Group’s ability to realise forecast cost savings;
– value-in-use is calculated by a number of complex models. There is a risk the models are not calculating the value-in-use accurately; and
– in certain circumstances the fair value of properties supports the carrying value of store assets. There is an estimation required in determining the fair value of properties in each of the Group’s territories.
As a result of the Group’s store impairment review completed during the year, a net impairment reversal of £187m (2016/17: net impairment reversal of £6m) was recognised.
The Audit Committee’s discussion of this key audit matter is set out on page 42.
Our audit procedures included assessing the design and implementation of key controls around the impairment review processes.
In relation to the Directors’ value-in-use assessment our procedures have included:
– challenging the key assumptions utilised in the cash flow forecasts with reference to historical trading performance, market expectations and our understanding of the Group’s strategic initiatives;
– reviewing and challenging the adequacy of management’s sensitivity analysis in relation to key assumptions to consider the extent of change in those assumptions that either individually or collectively would be required for the assets to be impaired, in particular forecast cash flows and property fair values; and
– assessing the accuracy of the ‘value-in-use’ modelling by the Group by assessing the methodology applied in determining the value-in-use compared with the requirements of IAS 36 ‘Impairment of Assets’ and checking the integrity of the value-in-use models utilised by the Group.
In relation to the Group’s ‘fair value less costs of disposal’, we have challenged the assumptions used by the Group in determining the fair market value of the assets, including those completed by external valuers, using internal property valuation specialists and assessing whether appropriate valuation methodologies have been applied.
While we note actions are required by the Group to achieve these forecasts over the medium term, we concluded that the assumptions in the impairment models, specifically in the value-in-use calculations, were within an acceptable range, and that the overall level of net reversal of impairment was reasonable.
Recognition of commercial incomeAs described in Note 1 (Accounting policies, judgements and estimates) and Note 20 (Commercial income), the Group has agreements with suppliers whereby volume-related allowances, promotional and marketing allowances and various other fees and discounts are received in connection with the purchase of goods for resale from those suppliers. As such, the Group recognises a reduction in cost of sales as a result of amounts receivable from suppliers.
In accordance with IFRS, commercial income should only be recognised as income within the income statement when the performance conditions associated with it have been met, for example where the marketing campaign has been held.
The variety and number of the buying arrangements with suppliers can make it complex to determine the performance conditions associated with the income, giving rise to a requirement for management judgement and scope for error in accounting for such income. As such we have identified this as a key audit matter.
The Audit Committee’s discussion of this key audit matter is set out on page 42.
We obtained a detailed understanding and evaluated the design and implementation of controls that the Group has established in relation to commercial income.
In addition, our substantive audit procedures across the Group’s retail operations included a combination of the following:
– testing whether amounts recognised were accurate and recorded in the correct period based on the contractual performance obligations by agreeing a sample of individual supplier agreements;
– testing commercial income balances included within inventories and trade and other receivables, or netted against trade and other payables via balance sheet reconciliation procedures;
– circularising a sample of suppliers to test whether the arrangements recorded were complete and held discussions with a sample of buyers to further understand the buying processes, where required. Where responses from suppliers were not received, we completed alternative procedures such as agreement to underlying contractual arrangements;
– using data analytics to profile commercial income, identifying deals which exhibited characteristics of audit interest upon which we completed detailed testing;
– reviewing the Group’s ongoing compliance with the Groceries Supplier Code of Practice (GSCOP). Additionally, reviewing the reporting and correspondence to the Group’s supplier hotline in order to identify any areas where further investigation was required; and
– also considering the adequacy of the commercial income related disclosure within the Group’s financial statements.
The results of our testing were satisfactory.
We consider the disclosure given around supplier rebates to provide an appropriate understanding of the types of rebate income received and the impact on the Group’s balance sheet as at 24 February 2018.
69Tesco PLC Annual Report and Financial Statements 2018
Financial statements

Key audit matter description How the scope of our audit responded to the key audit matter Key observationsInventory valuation As described in Note 1 (Accounting policies, judgements and estimates) and Note 15 (Inventories), the Group carries inventory at the lower of cost and fair value less costs to sell using the weighted average cost basis. As at 24 February 2018, the Group held inventories of £2,263m (2016/17: £2,301m).
The Group provides for obsolescence based on forecast inventory usage. This methodology relies upon assumptions made in determining appropriate provisioning percentages to apply to inventory balances.
We obtained a detailed understanding and evaluated the design and implementation of controls that the Group has established in relation to inventory valuation.
We obtained assurance over the appropriateness of management’s assumptions applied in calculating the value of inventory provisions by:
– critically assessing the Group’s inventory provisioning policy, with specific consideration given to aged inventory (in particular for non-food and general merchandising products) as well as stock turn calculations, including the impact of seasonality;
– verifying the value of a sample of inventory items to confirm whether they are held at the lower of cost and net realisable value, through comparison to vendor invoices and sales prices;
– using data analytics to identify unusual inventory usage characteristics, completing assumption tolerance testing and recalculating the provision in totality based on the Group’s policy; and
– reviewing historical accuracy of inventory provisioning with reference to inventory write-offs during the year in relation to stock loss or other inventory adjustments.
We concur that the total level of provision is within an acceptable range.
Pension obligation valuation As described in Note 1 (Accounting policies, judgements and estimates) and Note 27 (Post-employment benefits), the Group has a defined benefit pension plan in the UK. At 24 February 2018, the Group recorded a net retirement obligation before deferred tax of £3,282m (2016/17: £6,621m), comprising scheme assets of £13,235m (2016/17: £13,196m) and scheme liabilities of £16,517m (2016/17: £19,817m).
The Group has, after taking actuarial advice, decided to change the methodology used for deriving the discount rate for valuing the Group’s pension liabilities under IAS 19 ‘Employee Benefits’. Details of the change and its impact in the period are disclosed in Note 27.
The pension valuation is dependent on market conditions and assumptions made. The key audit matter specifically relates to the following key assumptions: discount rate, inflation expectations and life expectancy assumptions. The setting of these assumptions is complex and requires the exercise of significant management judgement with the support of third party actuaries.
The Audit Committee’s discussion of this key audit matter is set out on page 42.
We obtained a detailed understanding and evaluated the design and implementation of controls that the Group has established in relation to the pension obligation valuation process.
In testing the pension valuation, we have utilised internal pension actuarial specialists to review the key actuarial assumptions used, both financial and demographic, and considered the methodology utilised to derive these assumptions. Furthermore, we have benchmarked and performed a sensitivity analysis on the key assumptions determined by the Directors.
We have challenged the Group’s decision to change the discount rate methodology with reference to developing market practice, the age of the pension scheme and advice from our actuarial specialists.
We are satisfied that the methodology and assumptions applied in relation to determining the pension valuation are within an acceptable range.
We consider the change in methodology for establishing the discount rate to be acceptable and compliant with accounting standards. The actual discount rate applied of 2.9% is within our benchmark range. We note that the methodology used by the Group applies a different approach to the observable yields on high quality corporate bonds compared with our benchmark approach, which results in a discount rate which is towards the optimistic end of our acceptable range.
Contingent liabilitiesIn 2016/17 UK shareholder actions were initiated against the Group linked to the overstatement of expected profits in 2014 which may result in legal exposures.
Additionally, the Group has other ongoing legal matters relating to previous corporate transactions which require management judgement to be applied in order to determine the likely outcome.
Judgement is required in assessing the nature of these exposures and their accounting and disclosure requirements.
The Audit Committee’s discussion of this key audit matter is set out on page 42.
In assessing the potential exposures to the Group, we have completed a range of procedures including:
– assessing the design and implementation of controls in relation to the monitoring of known exposures;
– reading Board and other meeting minutes to identify areas subject to Group consideration;
– meeting with the Group’s internal legal advisors in understanding ongoing and potential legal matters impacting the Group;
– reviewing third party correspondence and reports; and – reviewing the proposed accounting and disclosure of actual and potential legal liabilities, drawing on third party assessment of open matters.
We concur that the accounting and disclosures in relation to the ongoing UK shareholder actions are appropriate.
In relation to other ongoing legal matters in respect of previous corporate transactions, we are satisfied no specific disclosure is required.
Tesco PLC Annual Report and Financial Statements 201870
Independent auditor’s report to the members of Tesco PLC continued

Key audit matter description How the scope of our audit responded to the key audit matter Key observationsPresentation of the Group’s income statementOne of the Group’s key performance indicators is ‘Group operating profit before exceptional items’. The key audit matter is that Group management may override the Group’s accounting policy application guidance to manipulate this key performance indicator.
Management judgement is required when applying this accounting policy and when determining classification within the Group’s income statement and assessing the Group’s overall quality of earnings.
The Audit Committee’s discussion of this key audit matter is set out on page 42.
In order to address this key audit matter we have completed audit procedures including:
– assessing the design and implementation of controls which address the risk of inappropriate presentation of the Group’s income statement, such as the ‘entity level’ controls which underpin the overall control environment for the Group and specific controls over determining the presentation of exceptional items;
– auditing key areas of management estimate and judgement, including consideration of exceptional items disclosed by the Group and the existence of any further potential exceptional items included within the Group’s underlying profit measures; and
– assessing transactions completed outside of the normal course of business.
We note that consistent with other businesses of a similar scale to the Group, there are non-recurring income and expense items included within profit before exceptional items which do not meet the Group’s definition of exceptional items and which largely offset. We concur that these have been appropriately included within profit before exceptional items.
Retail technology environment, including IT securityThe Group’s retail operations utilise a range of information systems. In 2015/16 and 2016/17 we reported deficiencies in certain IT controls. These deficiencies could have an adverse impact on the Group’s controls and financial reporting systems.
As described on page 41 within the Audit Committee report, the Group is continuing the replacement of a number of the Group’s key systems and making changes to key elements of the Group’s IT infrastructure to address the identified deficiencies.
We continued to challenge and assess changes to the IT environments through the testing of remediated controls and concluding on the sufficiency and appropriateness of management’s changes.
During the year we have assessed the design and implementation of the Group’s controls over the information systems that are important to financial reporting, including the changes made as part of the Group’s replacement programme.
Consistent with 2016/17, in 2017/18 we were not able to take a control reliant audit approach due to the ongoing weaknesses in the IT environment.
Where we noted deficiencies which affected applications and databases within the scope of our audit, we extended the scope of our substantive audit procedures.
Although management’s remediation plan is designed to address our concerns, given the complexity of the underlying systems the plan is a multi-year programme and not yet complete, and therefore weaknesses remain in the control environment.
We note that management’s actions have reduced the number of deficiencies in the year relating to user access and change management controls linked to the Group’s financial reporting.
71Tesco PLC Annual Report and Financial Statements 2018
Financial statements

Our application of materialityWe define materiality as the magnitude of misstatement in the financial statements that makes it probable that the economic decisions of a reasonably knowledgeable person would be changed or influenced. We use materiality both in planning the scope of our audit work and in evaluating the results of our work.
Based on our professional judgement, we determined materiality for the financial statements as a whole as follows:
Group financial statements
Parent company financial statements
Materiality £50m (2016/17: £50m) £35m (2016/17: £25m)Basis for determining materiality
In determining our materiality, we have considered the 2016/17 materiality, profit based measures and other measures.
Materiality has been determined to be the same value as the 2016/17 materiality. The materiality of £50m equates to 4.4% of profit before tax before exceptional items (£1,143m).
Component materiality has been determined with reference to the component’s contribution to the Group’s overall result. The materiality applied by the component auditors was £20m, except for UK Retail (2017/18: £35m, 2016/17: £25m) and Thailand (2017/18: £25m, 2016/17: £25m).
Materiality represents less than 1% (2016/17: less than 1%) of net assets.
Rationale for the benchmark applied
The decision to maintain the same level of materiality as that used in 2016/17 is reflective of the fact the Group continues to execute its turnaround plan and normalise profitability.
The selected materiality is 4.4% of profit before tax before exceptional items, which falls within a reasonable range, and supports the quantum of materiality.
Profit before tax before exceptional items is an appropriate metric since it is a key performance indicator and is not impacted by any potential volatility which may be caused by exceptional items.
The materiality selected represents 0.5% (2016/17: 0.8%) of the Group’s net assets.
As this is the Parent Company of the Group it does not generate significant revenues but instead incurs costs and as such net assets are an appropriate base to use to determine materiality.
2017/18 profit before tax and exceptional items £1,143m
Reporting threshold £2.5m
Group materiality £50m
Component materiality (UK) £35m
Component materiality (Thailand) £25mComponent materiality (Other) £20m
We agreed with the Audit Committee that we would report to the Audit Committee all audit differences in excess of £2.5m (2016/17: £2.5m) for the Group and the Parent Company, as well as differences below that threshold that, in our view, warranted reporting on qualitative grounds. We also report to the Audit Committee on disclosure matters that we identified when assessing the overall presentation of the financial statements.
An overview of the scope of our auditOur Group audit was scoped by obtaining an understanding of the Group and its environment, including Group-wide controls, and assessing the risks of material misstatement at the Group level. The Group has subsidiary grocery retail operations in eight countries, together with interests in a number of other businesses both in the UK and internationally.
The Group’s accounting process is structured around local finance functions and is further supported by a shared service centre in Bengaluru, India which provides accounting and administrative support for the Group’s core retail operations. Each local finance function reports into the central Group finance function based at the Group’s head office. Based on our assessment of the Group, we focused our Group audit scope primarily on the audit work
on 7 significant retail locations (UK, Republic of Ireland, Czech Republic, Hungary, Poland, Slovakia and Thailand) and Tesco Bank. The operations in Czech Republic, Hungary, Poland and Slovakia are managed as one combined business. All of these were subject to a full audit and represent 96% (2016/17: 97%) of the Group’s revenue and 92% (2016/17: 91%) of net assets.
In addition, 4 other businesses (Malaysia, OneStop, dunnhumby and Tesco Mobile) were subject to specific audit procedures on material account balances, where the extent of our testing was based on our assessment of the risks of material misstatement and of the materiality of the Group’s operations at those locations. The four locations accounted for 4% (2016/17: 2%) of the Group’s revenue and 7% (2016/17: 6%) of net assets.
In 2016/17, Malaysia was a full scope audit, however in the current year is subject to specific audit procedures, as a result of only certain financial statement lines being considered to be significant in the context of the Group. Additionally, in 2016/17 Turkey was subject to specific audit procedures, however is no longer in scope following the Group disposing of the business on 1 March 2017. At the Parent entity level we also tested the consolidation process and carried out analytical procedures to confirm our conclusion that there were no significant risks of material misstatement of the aggregated financial information of the remaining components not subject to audit or audit of specified account balances.
The most significant component of the Group is its retail business in the UK. As such, there is extensive interaction between the Group and UK audit team to ensure an appropriate level of involvement in this audit work. During the course of our audit, the UK audit team visited 50 (2016/17: 50) retail stores in the UK to attend either inventory counts or in order to complete store control visits, and 4 (2016/17: 6) distribution centre inventory counts.
We visited 7 (2016/17: 7) of the 8 (2016/17: 9) significant locations set out above, in addition to the Group’s shared service centre in Bengaluru, with the Group Audit Partner visiting 4 (2016/17: 4) of these locations. We also had a dedicated audit partner focused on overseeing the role of the component audit teams located outside of the UK and the Republic of Ireland, ensuring that we applied a consistent audit approach to the operations in the Group’s international business.
The audit visits by the Group audit team were timed to enable us to be involved during the planning and risk assessment process in addition to during the completion of detailed audit procedures. During our visits, we attended key meetings with component management and auditors, and reviewed detailed component auditor work papers.
In addition, all key component audit teams were represented during a centralised two-day planning meeting held in the UK prior to the commencement of our detailed audit work. The purpose of this planning meeting was to ensure a good level of understanding of the Group’s businesses, its core strategy and a discussion of the significant risks and workshops on our planned audit approach. Group management also attended part of the meeting to support these planning activities.
Other informationThe Directors are responsible for the other information. The other information comprises the information included in the annual report, other than the financial statements and our auditor’s report thereon.
Our opinion on the financial statements does not cover the other information and, except to the extent otherwise explicitly stated in our report, we do not express any form of assurance conclusion thereon.
In connection with our audit of the financial statements, our responsibility is to read the other information and, in doing so, consider whether the other information is materially inconsistent with the financial statements or our knowledge obtained in the audit or otherwise appears to be materially misstated.
If we identify such material inconsistencies or apparent material misstatements, we are required to determine whether there is a material misstatement in the financial statements or a material misstatement of the other information. If, based on the work we have performed, we conclude that there is a material misstatement of this other information, we are required to report that fact.
Tesco PLC Annual Report and Financial Statements 201872
Independent auditor’s report to the members of Tesco PLC continued

In this context, matters that we are specifically required to report to you as uncorrected material misstatements of the other information include where we conclude that:
– Fair, balanced and understandable – the statement given by the Directors that they consider the annual report and financial statements taken as a whole is fair, balanced and understandable and provides the information necessary for shareholders to assess the Group’s position and performance, business model and strategy, is materially inconsistent with our knowledge obtained in the audit; or
– Audit Committee reporting – the section describing the work of the Audit Committee does not appropriately address matters communicated by us to the Audit Committee; or
– Directors’ statement of compliance with the UK Corporate Governance Code – the parts of the Directors’ statement required under the Listing Rules relating to the Company’s compliance with the UK Corporate Governance Code containing provisions specified for review by the auditor in accordance with Listing Rule 9.8.10R(2) do not properly disclose a departure from a relevant provision of the UK Corporate Governance Code.
We have nothing to report in respect of these matters.
Responsibilities of DirectorsAs explained more fully in the Directors’ responsibilities statement, the Directors are responsible for the preparation of the financial statements and for being satisfied that they give a true and fair view, and for such internal control as the Directors determine is necessary to enable the preparation of financial statements that are free from material misstatement, whether due to fraud or error. In preparing the financial statements, the Directors are responsible for assessing the Group’s and the Parent Company’s ability to continue as a going concern, disclosing as applicable, matters related to going concern and using the going concern basis of accounting unless the Directors either intend to liquidate the Group or the Parent Company or to cease operations, or have no realistic alternative but to do so.
Auditor’s responsibilities for the audit of the financial statementsOur objectives are to obtain reasonable assurance about whether the financial statements as a whole are free from material misstatement, whether due to fraud or error, and to issue an auditor’s report that includes our opinion. Reasonable assurance is a high level of assurance, but is not a guarantee that an audit conducted in accordance with ISAs (UK) will always detect a material misstatement when it exists. Misstatements can arise from fraud or error and are considered material if, individually or in the aggregate, they could reasonably be expected to influence the economic decisions of users taken on the basis of these financial statements.
A further description of our responsibilities for the audit of the financial statements is located on the Financial Reporting Council’s website at: www.frc.org.uk/auditorsresponsibilities. This description forms part of our auditor’s report.
Use of our reportThis report is made solely to the Company’s members, as a body, in accordance with Chapter 3 of Part 16 of the Companies Act 2006. Our audit work has been undertaken so that we might state to the Company’s members those matters we are required to state to them in an auditor’s report and for no other purpose. To the fullest extent permitted by law, we do not accept or assume responsibility to anyone other than the Company and the Company’s members as a body, for our audit work, for this report, or for the opinions we have formed.
Report on other legal and regulatory requirementsOpinions on other matters prescribed by the Companies Act 2006In our opinion the part of the Directors’ remuneration report to be audited has been properly prepared in accordance with the Companies Act 2006.
In our opinion, based on the work undertaken in the course of the audit:
– the information given in the Strategic report and the Directors’ report for the financial year for which the financial statements are prepared is consistent with the financial statements; and
– the Strategic report and the Directors’ report have been prepared in accordance with applicable legal requirements.
In the light of the knowledge and understanding of the Group and of the Parent Company and their environment obtained in the course of the audit, we have not identified any material misstatements in the Strategic report or the Directors’ report.
Matters on which we are required to report by exceptionAdequacy of explanations received and accounting recordsUnder the Companies Act 2006 we are required to report to you if, in our opinion:
– we have not received all the information and explanations we require for our audit; or
– adequate accounting records have not been kept by the Parent Company, or returns adequate for our audit have not been received from branches not visited by us; or
– the Parent Company financial statements are not in agreement with the accounting records and returns.
We have nothing to report in respect of these matters.
Directors’ remunerationUnder the Companies Act 2006 we are also required to report if in our opinion certain disclosures of directors’ remuneration have not been made or the part of the Directors’ remuneration report to be audited is not in agreement with the accounting records and returns.
We have nothing to report in respect of these matters.
Other mattersAuditor tenureFollowing the recommendation of the Audit Committee, we were appointed by the Group’s shareholders on 26 June 2015 to audit the financial statements for the year ended 27 February 2016 and subsequent financial periods. The period of total uninterrupted engagement including previous renewals and reappointments of the firm is 3 years, covering financial years ending 27 February 2016 to 24 February 2018.
Consistency of the audit report with the additional report to the audit committeeOur audit opinion is consistent with the additional report to the Audit Committee we are required to provide in accordance with ISAs (UK).
Panos Kakoullis (Senior statutory auditor) for and on behalf of Deloitte LLP Statutory Auditor London, United Kingdom 10 April, 2018
73Tesco PLC Annual Report and Financial Statements 2018
Financial statements

52 weeks ended 24 February 2018
52 weeks ended 25 February 2017
Notes
Before exceptional
items £m
Exceptional items
(Note 4) £m
Total£m
Before exceptional
items £m
Exceptional items
(Note 4) £m
Total£m
Continuing operationsRevenue 2 57,491 – 57,491 55,917 – 55,917Cost of sales (54,092) (49) (54,141) (52,899) (116) (53,015)Gross profit/(loss) 3,399 (49) 3,350 3,018 (116) 2,902
Administrative expenses (1,786) 153 (1,633) (1,734) (261) (1,995)Profits/(losses) arising on property-related items 31 89 120 (4) 114 110Operating profit/(loss) 1,644 193 1,837 1,280 (263) 1,017
Share of post-tax profits/(losses) of joint ventures and associates 13 (6) – (6) (30) (77) (107)Finance income 5 98 – 98 109 – 109Finance costs 5 (593) (38) (631) (630) (244) (874)Profit/(loss) before tax 1,143 155 1,298 729 (584) 145
Taxation 6 (286) (20) (306) (185) 98 (87)Profit/(loss) for the year from continuing operations 857 135 992 544 (486) 58
Discontinued operationsProfit/(loss) for the year from discontinued operations 7 – 216 216 (37) (75) (112)
Profit/(loss) for the year 857 351 1,208 507 (561) (54)
Attributable to:Owners of the parent 857 349 1,206 515 (555) (40)Non-controlling interests – 2 2 (8) (6) (14)
857 351 1,208 507 (561) (54)
Earnings/(losses) per share from continuing and discontinued operationsBasic 9 14.77p (0.49)pDiluted 9 14.72p (0.49)p
Earnings/(losses) per share from continuing operationsBasic 9 12.12p 0.81pDiluted 9 12.08p 0.81p
The notes on pages 79 to 131 form part of these financial statements.
Tesco PLC Annual Report and Financial Statements 201874
Group income statement

Notes
52 weeks 2018
£m
52 weeks 2017
£mItems that will not be reclassified to income statementRemeasurements on defined benefit pension schemes 27 3,265 (3,567)Tax on items that will not be reclassified 6 (554) 579
2,711 (2,988)Items that may subsequently be reclassified to income statementChange in fair value of available-for-sale financial assets and investments (62) 80Currency translation differences:
Retranslation of net assets of overseas subsidiaries, joint ventures and associates 179 764Movements in foreign exchange reserve and net investment hedging on subsidiary disposed, reclassified and reported in the Group income statement
7 140 –
Gains/(losses) on cash flow hedges:Net fair value gains/(losses) (146) 385Reclassified and reported in the Group income statement (52) (384)
Tax on items that may be reclassified 6 22 (23)81 822
Total other comprehensive income/(loss) for the year 2,792 (2,166)Profit/(loss) for the year 1,208 (54)Total comprehensive income/(loss) for the year 4,000 (2,220)
Attributable to:Owners of the parent 3,993 (2,206)Non-controlling interests 7 (14)Total comprehensive income/(loss) for the year 4,000 (2,220)
Total comprehensive income/(loss) attributable to owners of the parent arising from:Continuing operations 3,637 (2,096)Discontinued operations 356 (110)
3,993 (2,206)
The notes on pages 79 to 131 form part of these financial statements.
75Tesco PLC Annual Report and Financial Statements 2018
Financial statements
Group statement of comprehensive income/(loss)

Notes
24 February 2018
£m
25 February 2017
£mNon-current assetsGoodwill, software and other intangible assets 10 2,661 2,717Property, plant and equipment 11 18,521 18,108Investment property 12 100 64Investments in joint ventures and associates 13 689 739Other investments 14 860 823Trade and other receivables 16 186 180 Loans and advances to customers 17 6,885 5,795Derivative financial instruments 22 1,117 1,303Deferred tax assets 6 117 707
31,136 30,436Current assetsOther investments 14 68 284Inventories 15 2,263 2,301Trade and other receivables 16 1,482 1,475Loans and advances to customers 17 4,637 4,166Derivative financial instruments 22 27 286Current tax assets 12 13Short-term investments 18 1,029 2,727Cash and cash equivalents 18 4,059 3,821 13,577 15,073Assets of the disposal group and non-current assets classified as held for sale 7 149 344 13,726 15,417Current liabilitiesTrade and other payables 19 (8,996) (8,875)Borrowings 21 (1,479) (2,560)Derivative financial instruments 22 (69) (61)Customer deposits and deposits from banks 24 (7,812) (6,687)Current tax liabilities 6 (335) (613)Provisions 25 (547) (438)
(19,238) (19,234)Liabilities of the disposal group classified as held for sale 7 – (171)Net current liabilities (5,512) (3,988)Non-current liabilitiesTrade and other payables 19 (364) (324)Borrowings 21 (7,142) (9,433)Derivative financial instruments 22 (594) (607)Customer deposits and deposits from banks 24 (2,972) (2,276)Post-employment benefit obligations 27 (3,282) (6,621)Deferred tax liabilities 6 (91) (88)Provisions 25 (721) (685) (15,166) (20,034)Net assets 10,458 6,414EquityShare capital 28 410 409Share premium 5,107 5,096All other reserves 735 601Retained earnings 4,228 332Equity attributable to owners of the parent 10,480 6,438Non-controlling interests (22) (24)Total equity 10,458 6,414
The notes on pages 79 to 131 form part of these financial statements.
Dave LewisAlan Stewart
DirectorsThe financial statements on pages 74 to 131 were authorised for issue by the Directors on 10 April 2018 and are subject to the approval of the shareholders at the AGM on 15 June 2018.
Tesco PLC Annual Report and Financial Statements 201876
Group balance sheet

All other reserves
Share capital
£m
Share premium
£m
Other reserves
£m
Capital redemption
reserve £m
Hedging reserve
£m
Translation reserve
£m
Treasury shares
£m
Retained earnings
£mTotal
£m
Non-controlling
interests £m
Total equity
£mAt 25 February 2017 409 5,096 40 16 217 350 (22) 332 6,438 (24) 6,414Profit/(loss) for the year – – – – – – – 1,206 1,206 2 1,208Other comprehensive income/(loss)Change in fair value of available-for-sale financial assets and investments
– – – – – – – (62) (62) – (62)
Currency translation differences – – – – – 314 – – 314 5 319Remeasurements of defined benefit pension schemes
– – – – – – – 3,265 3,265 – 3,265
Gains/(losses) on cash flow hedges
– – – – (198) – – – (198) – (198)
Tax relating to components of other comprehensive income
– – – – 21 (9) – (544) (532) – (532)
Total other comprehensive income/(loss)
– – – – (177) 305 – 2,659 2,787 5 2,792
Total comprehensive income/(loss)
– – – – (177) 305 – 3,865 3,993 7 4,000
Transactions with ownersPurchase of treasury shares – – – – – – (14) – (14) – (14)Share-based payments – – – – – – 20 105 125 – 125Issue of shares 1 11 – – – – – – 12 – 12Dividends – – – – – – – (80) (80) – (80)Changes in non-controlling interests
– – – – – – – – – (5) (5)
Tax on items charged to equity – – – – – – – 6 6 – 6Total transactions with owners 1 11 – – – – 6 31 49 (5) 44At 24 February 2018 410 5,107 40 16 40 655 (16) 4,228 10,480 (22) 10,458
All other reserves
Share capital
£m
Share premium
£m
Other reserves
£m
Capital redemption
reserve £m
Hedging reserve
£m
Translation reserve
£m
Treasury shares
£m
Retained earnings
£mTotal
£m
Non-controlling
interests £m
Total equity
£mAt 27 February 2016 407 5,095 40 16 211 (401) (7) 3,265 8,626 (10) 8,616Profit/(loss) for the year – – – – – – – (40) (40) (14) (54)Other comprehensive income/(loss)Change in fair value of available-for-sale financial assets and investments
– – – – – – – 80 80 – 80
Currency translation differences – – – – – 764 – – 764 – 764Remeasurements of defined benefit pension schemes
– – – – – – – (3,567) (3,567) – (3,567)
Gains/(losses) on cash flow hedges
– – – – 1 – – – 1 – 1
Tax relating to components of other comprehensive income
– – – – 5 (13) – 564 556 – 556
Total other comprehensive income/(loss)
– – – – 6 751 – (2,923) (2,166) – (2,166)
Total comprehensive income/(loss)
– – – – 6 751 – (2,963) (2,206) (14) (2,220)
Transactions with ownersPurchase of treasury shares – – – – – – (24) – (24) – (24)Share-based payments – – – – – – 9 28 37 – 37Issue of shares 2 1 – – – – – – 3 – 3Dividends – – – – – – – – – – –Tax on items charged to equity – – – – – – – 2 2 – 2Total transactions with owners 2 1 – – – – (15) 30 18 – 18At 25 February 2017 409 5,096 40 16 217 350 (22) 332 6,438 (24) 6,414
The notes on pages 79 to 131 form part of these financial statements.
77Tesco PLC Annual Report and Financial Statements 2018
Financial statements
Group statement of changes in equity

Notes
52 weeks 2018
£m
52 weeks 2017
£mCash flows generated from/(used in) operating activitiesOperating profit/(loss) of continuing operations 1,837 1,017Operating profit/(loss) of discontinued operations – (117)Depreciation and amortisation 1,295 1,304(Profit)/loss arising on sale of property, plant and equipment and intangible assets (66) (78)(Profit)/loss arising on sale of subsidiaries and other investments (165) 3(Profit)/loss arising on sale of joint ventures and associates (23) (5)Impairment loss on goodwill – 46Net impairment loss/(reversal) on other investments (22) (12)Net impairment loss/(reversal) on property, plant and equipment, intangible assets and investment property (167) (5)Adjustment for non-cash element of pensions charge 27 4 7Additional contribution into pension schemes 27 (245) (248)Share-based payments 113 15Tesco Bank fair value movements included in operating profit 156 98
Retail (increase)/decrease in inventories 55 124Retail (increase)/decrease in development stock 21 16Retail (increase)/decrease in trade and other receivables (1) (74)Retail increase/(decrease) in trade and other payables 278 510Retail increase/(decrease) in provisions 132 11
Retail (increase)/decrease in working capital 485 587Tesco Bank (increase)/decrease in loans and advances to customers (1,738) (1,529)Tesco Bank (increase)/decrease in trade and other receivables 30 (24)Tesco Bank increase/(decrease) in customer and bank deposits, trade and other payables 1,821 1,474Tesco Bank increase/(decrease) in provisions (6) 25
Tesco Bank (increase)/decrease in working capital 107 (54)Cash generated from/(used in) operations 3,309 2,558Interest paid (351) (522)Corporation tax (paid)/received (176) (47)Net cash generated from/(used in) operating activities 2,782 1,989Cash flows generated from/(used in) investing activities Proceeds from sale of property, plant and equipment, investment property, intangible assets and non-current assets classified as held for sale
253 512
Purchase of property, plant and equipment, investment property and non-current assets classified as held for sale (1,440) (1,205)Purchase of intangible assets (197) (169)Disposal of subsidiaries, net of cash disposed 66 205Acquisition of subsidiaries, net of cash acquired 31 (27) (25)Proceeds from sale of joint ventures and associates 23 –Net (increase)/decrease in loans to joint ventures and associates – 15Investments in joint ventures and associates (21) –Net (investments in)/proceeds from sale of short-term investments 1,697 736Net (investments in)/proceeds from sale of other investments 236 141Dividends received from joint ventures and associates 26 28Interest received 50 41Net cash generated from/(used in) investing activities 666 279Cash flows generated from/(used in) financing activities Proceeds from issue of ordinary share capital 28 11 1Increase in borrowings 313 185Repayment of borrowings (3,721) (2,036)Net cash flows from derivative financial instruments 253 475Repayments of obligations under finance leases (10) (12)Dividends paid to equity owners 8 (82) –Net cash generated from/(used in) financing activities (3,236) (1,387)Net increase/(decrease) in cash and cash equivalents 212 881Cash and cash equivalents at the beginning of the year 3,832 3,082Effect of foreign exchange rate changes 15 (131)Cash and cash equivalents including cash held in disposal group at the end of the year 4,059 3,832Cash held in disposal group 7 – (11)Cash and cash equivalents at the end of the year 18 4,059 3,821
The notes on pages 79 to 131 form part of these financial statements.
Tesco PLC Annual Report and Financial Statements 201878
Group cash flow statement

Note 1 Accounting policies, judgements and estimatesGeneral informationTesco PLC (the Company) is a public limited company incorporated and domiciled in the United Kingdom (UK) under the Companies Act 2006 (Registration number 445790). The address of the registered office is Tesco House, Shire Park, Kestrel Way, Welwyn Garden City AL7 1GA, UK.
The main activities of the Company and its subsidiaries (together, the Group) are those of retailing and retail banking.
Basis of preparationThe consolidated Group financial statements have been prepared in accordance with International Financial Reporting Standards (IFRS) as endorsed by the European Union (EU), and those parts of the Companies Act 2006 applicable to companies reporting under IFRS. The consolidated Group financial statements are presented in Pounds Sterling, generally rounded to the nearest million. They are prepared on the historical cost basis, except for certain financial instruments, share-based payments, customer loyalty programmes and pension assets that have been measured at fair value.
The Directors have, at the time of approving the financial statements, a reasonable expectation that the Company and the Group have adequate resources to continue in operational existence for the foreseeable future. Thus they continue to adopt the going concern basis of accounting in preparing the financial statements. Further detail is contained within the going concern statement included in the Directors’ report on page 66.
The accounting policies set out below have been applied consistently to all periods presented in these consolidated financial statements.
Basis of consolidationThe consolidated Group financial statements consist of the financial statements of the ultimate Parent Company (Tesco PLC), all entities controlled by the Company (its subsidiaries) and the Group’s share of its interests in joint ventures and associates.
The financial year represents the 52 weeks ended 24 February 2018 (prior financial year 52 weeks ended 25 February 2017). For the UK and the Republic of Ireland (UK & ROI), the results are for the 52 weeks ended 24 February 2018 (prior financial year 52 weeks ended 25 February 2017). For all other operations, the results are for the calendar year ended 28 February 2018 (prior calendar year ended 28 February 2017).
SubsidiariesSubsidiaries are consolidated in the Group’s financial statements from the date that control commences until the date that control ceases.
Intragroup balances and any unrealised gains and losses or income and expenses arising from intragroup transactions are eliminated in preparing the consolidated financial statements.
Joint ventures and associatesThe Group’s share of the results of joint ventures and associates is included in the Group income statement and Group statement of comprehensive income/(loss) using the equity method of accounting. Investments in joint ventures and associates are carried in the Group balance sheet at cost plus post-acquisition changes in the Group’s share of the net assets of the entity, less any impairment in value. The carrying values of investments in joint ventures and associates include acquired goodwill.
If the Group’s share of losses in a joint venture or associate equals or exceeds its investment in the joint venture or associate, the Group does not recognise further losses, unless it has incurred obligations to do so or made payments on behalf of the joint venture or associate. Dividends received from joint ventures or associates with nil carrying value are recognised in the income statement as part of the Group’s share of post-tax profits/(losses) of joint ventures and associates.
Unrealised gains arising from transactions with joint ventures and associates are eliminated to the extent of the Group’s interest in the entity.
RevenueRevenue comprises the fair value of consideration received or receivable for the sale of goods and services in the ordinary course of the Group’s activities.
Sale of goodsRevenue is recognised when the significant risks and rewards of ownership of the goods have transferred to the buyer and the amount of revenue can be measured reliably. Revenue is recorded net of returns, discounts/offers and value added taxes.
Provision of servicesRevenue from the provision of services is recognised when the service is provided and the revenue can be measured reliably, based on the terms of the contract.
Where the Group acts as an agent selling goods or services, only the commission income is included within revenue.
Financial servicesRevenue consists of interest, fees and income from the provision of retail banking and insurance.
Interest income on financial assets that are classified as loans and receivables is determined using the effective interest rate method.
Calculation of the effective interest rate takes into account fees receivable that are an integral part of the instrument’s yield, premiums or discounts on acquisition or issue, early redemption fees and transaction costs.
Fees in respect of services (credit card interchange fees, late payment and ATM revenue) are recognised as the right to consideration accrues through the provision of the service to the customer. The arrangements are generally contractual and the cost of providing the service is incurred as the service is rendered.
The Group generates commission from the sale and service of motor and home insurance policies underwritten by Tesco Underwriting Limited, or in a minority of cases by a third-party underwriter. This is based on commission rates, which are independent of the profitability of underlying insurance policies. Similar commission income is also generated from the sale of white label insurance products underwritten by other third-party providers.
Clubcard, loyalty and other initiativesThe cost of Clubcard and loyalty initiatives is part of the fair value of the consideration received and is deferred and subsequently recognised over the period that the awards are redeemed. The deferral is treated as a deduction from revenue.
The fair value of the points awarded is determined with reference to the fair value to the customer and considers factors such as redemption via Clubcard deals versus money-off-in-store and redemption rates.
Rental incomeRental income is recognised in the period in which it is earned, in accordance with the terms of the lease.
Commercial incomeConsistent with standard industry practice, the Group has agreements with suppliers whereby volume-related allowances, promotional and marketing allowances and various other fees and discounts are received in connection with the purchase of goods for resale from those suppliers. Most of the income received from suppliers relates to adjustments to a core cost price of a product, and as such is considered part of the purchase price for that product. Sometimes receipt of the income is conditional on the Group performing specified actions or satisfying certain performance conditions associated with the purchase of the product. These include achieving agreed purchases or sales volume targets and providing promotional or marketing materials and activities or promotional product positioning. While there is no standard industry definition, these amounts receivable from suppliers in connection with the purchase of goods for resale are generally termed commercial income.
Commercial income is recognised when earned by the Group, which occurs when all obligations conditional for earning income have been discharged, and the income can be measured reliably based on the terms of the contract. The income is recognised as a credit within cost of sales. Where the income earned relates to inventories which are held by the Group at period ends, the income is included within the cost of those inventories, and recognised in cost of sales upon sale of those inventories.
Amounts due relating to commercial income are recognised within trade and other receivables, except in cases where the Group currently has a legally enforceable right of set-off and intends to offset amounts due from suppliers against amounts owed to those suppliers, in which case only the net amount receivable or payable is recognised. Accrued commercial income is recognised within accrued income when commercial income earned has not been invoiced at the balance sheet date.
79Tesco PLC Annual Report and Financial Statements 2018
Financial statements
Notes to the Group financial statements

Note 1 Accounting policies, judgements and estimates continued Finance incomeFinance income, excluding income arising from financial services, is recognised in the period to which it relates using the effective interest rate method.
Finance costsFinance costs directly attributable to the acquisition or construction of qualifying assets are capitalised. Qualifying assets are those that necessarily take a substantial period of time to prepare for their intended use. All other borrowing costs are recognised in the Group income statement in finance costs, excluding those arising from financial services, in the period in which they occur. For Tesco Bank, finance cost on financial liabilities is determined using the effective interest rate method and is recognised in cost of sales.
Business combinations and goodwillThe Group accounts for all business combinations by applying the acquisition method. All acquisition-related costs are expensed.
On acquisition, the assets (including intangible assets), liabilities and contingent liabilities of an acquired entity are measured at their fair values. Non-controlling interests are stated at the non-controlling interests’ proportion of the fair values of the assets and liabilities recognised.
Goodwill arising on consolidation represents the excess of the consideration transferred over the net fair value of the Group’s share of the net assets, liabilities and contingent liabilities of the acquired subsidiary, joint venture or associate and the fair value of the non-controlling interest in the acquiree. If the consideration is less than the fair value of the Group’s share of the net assets, liabilities and contingent liabilities of the acquired entity (i.e. a bargain purchase), the difference is credited to the Group income statement in the period of acquisition.
At the acquisition date of a subsidiary, goodwill acquired is recognised as an asset and is allocated to each of the cash-generating units expected to benefit from the business combination’s synergies and to the lowest level at which management monitors the goodwill. Goodwill arising on the acquisition of joint ventures and associates is included within the carrying value of the investment. On disposal of a subsidiary, joint venture or associate, the attributable amount of goodwill is included in the determination of the profit or loss on disposal.
Where the Group obtains control of a joint venture or associate, the Group’s previously held interests in the acquired entity is remeasured to its acquisition date fair value and the resulting gain or loss, if any, is recognised in the Group income statement.
Cloud software licence agreementsLicence agreements to use cloud software are treated as service contracts and expensed in the Group income statement, unless the Group has both a contractual right to take possession of the software at any time without significant penalty, and the ability to run the software independently of the host vendor. In such cases the licence agreement is capitalised as software within intangible assets.
Intangible assetsIntangible assets, such as software and pharmacy licences, are measured initially at acquisition cost or costs incurred to develop the asset. Intangible assets acquired in a business combination are recognised at fair value at the acquisition date.
Following initial recognition, intangible assets with finite useful lives are carried at cost less accumulated amortisation and accumulated impairment losses. They are amortised on a straight-line basis over their estimated useful lives, at 10%–25% of cost per annum.
Research costs are expensed as incurred. Development expenditure incurred on an individual project is capitalised only if specific criteria are met.
Property, plant and equipmentProperty, plant and equipment is carried at cost less accumulated depreciation and any recognised impairment in value. Property, plant and equipment is depreciated on a straight-line basis to its residual value over its anticipated useful economic life.
The following depreciation rates are applied for the Group:
– freehold and leasehold buildings with greater than 40 years unexpired – at 2.5% of cost;
– leasehold properties with less than 40 years unexpired are depreciated by equal annual instalments over the unexpired period of the lease; and
– fixtures and fittings, office equipment and motor vehicles – at rates varying from 10% to 33%.
Assets held under finance leases are depreciated over their expected useful lives on the same basis as owned assets or, when shorter, over the term of the relevant lease.
Impairment of non-financial assetsGoodwill is reviewed for impairment at least annually by assessing the recoverable amount of each cash-generating unit to which the goodwill relates. The recoverable amount is the higher of fair value less costs of disposal, and value in use. When the recoverable amount of the cash-generating unit is less than the carrying amount, an impairment loss is recognised. Any impairment is recognised immediately in the Group income statement and is not subsequently reversed.
For all other non-financial assets (including intangible assets and property, plant and equipment) the Group performs impairment testing where there are indicators of impairment. If such an indicator exists, the recoverable amount of the asset is estimated in order to determine the extent of the impairment loss (if any). Where the asset does not generate cash flows that are independent from other assets, the Group estimates the recoverable amount of the cash-generating unit to which the asset belongs.
The recoverable amount is the higher of value in use and fair value less costs of disposal. If the recoverable amount of an asset (or cash-generating unit) is estimated to be less than its carrying amount, the carrying amount of the asset (or cash-generating unit) is reduced to its recoverable amount. An impairment loss is recognised immediately in the Group income statement.
Where an impairment loss subsequently reverses, the carrying amount of the asset (or cash-generating unit) is increased to the revised estimate of the recoverable amount, but so that the increased carrying amount does not exceed the carrying amount that would have been determined if no impairment loss had been recognised for the asset (or cash-generating unit) in prior years. A reversal of an impairment loss is recognised immediately as a credit to the Group income statement.
Investment propertyInvestment property assets are carried at cost less accumulated depreciation and any recognised impairment in value. The depreciation policies for investment property are consistent with those described for property, plant and equipment.
Short-term and other investmentsShort-term and other investments in the Group balance sheet comprise receivables, loan receivables and available-for-sale financial assets.
Receivables and loan receivables are recognised at amortised cost. Available-for-sale financial assets are recognised at fair value.
Refer to the financial instruments accounting policy for further detail.
InventoriesInventories comprise goods and development properties held for resale. Inventories are valued at the lower of cost and fair value less costs to sell using the weighted average cost basis. Directly attributable costs and incomes (including applicable commercial income) are included in the cost of inventories.
Cash and cash equivalentsCash and cash equivalents in the Group balance sheet consist of cash at bank, in hand, demand deposits with banks, loans and advances to banks, certificates of deposits and other receivables together with short-term deposits with an original maturity of three months or less.
Tesco PLC Annual Report and Financial Statements 201880
Notes to the Group financial statements continued

Note 1 Accounting policies, judgements and estimates continuedNon-current assets held for sale and discontinued operations Non-current assets (or disposal groups) are classified as assets held for sale when their carrying amount is to be recovered principally through a sale transaction and a sale is considered highly probable. They are stated at the lower of carrying amount and fair value less costs to sell.
Discontinued operationsIn accordance with IFRS 5 ‘Non-current Assets Held for Sale and Discontinued Operations’, the net results of discontinued operations are presented separately in the Group income statement (and the comparatives restated) and the assets and liabilities of these operations are presented separately in the Group balance sheet. Refer to Note 7 for further details.
LeasesLeases are classified as finance leases whenever the terms of the lease transfer substantially all the risks and rewards of ownership to the lessee. All other leases are classified as operating leases.
The Group as a lessorAmounts due from lessees under finance leases are recorded as receivables at the amount of the Group’s net investment in the leases. Finance lease income is allocated to accounting periods so as to reflect a constant periodic rate of return on the Group’s net investment in the lease. Rental income from operating leases is recognised on a straight-line basis over the term of the lease.
The Group as a lesseeAssets held under finance leases are recognised as assets of the Group at their fair value or, if lower, at the present value of the minimum lease payments, each determined at the inception of the lease. The corresponding liability is included in the Group balance sheet as a finance lease obligation. Lease payments are apportioned between finance charges and a reduction of the lease obligations so as to achieve a constant rate of interest on the remaining balance of the liability. Finance charges are charged to the Group income statement. Rentals payable under operating leases are charged to the Group income statement on a straight-line basis over the term of the lease.
Sale and leasebackA sale and leaseback transaction is one where the Group sells an asset and immediately reacquires the use of the asset by entering into a lease with the buyer.
For sale and finance leasebacks, any profit from the sale is deferred and amortised over the lease term. For sale and operating leasebacks, generally the assets are sold at fair value, and accordingly the profit or loss from the sale is recognised immediately in the Group income statement.
Post-employment obligationsFor defined benefit plans, obligations are measured at discounted present value (using the projected unit credit method) while plan assets are recorded at fair value.
The operating and financing costs of such plans are recognised separately in the Group income statement; service costs are spread systematically over the expected service lives of employees and financing costs are recognised in the periods in which they arise. Actuarial gains and losses are recognised immediately in the Group statement of comprehensive income/(loss).
Payments to defined contribution schemes are recognised as an expense as they fall due.
Share-based paymentsThe fair value of employee share option plans is calculated at the grant date using the Black-Scholes or Monte Carlo model. The resulting cost is charged to the Group income statement over the vesting period. The value of the charge is adjusted to reflect expected and actual levels of vesting.
TaxationThe tax expense included in the Group income statement consists of current and deferred tax.
Current tax is the expected tax payable on the taxable income for the financial year, using tax rates enacted or substantively enacted by the balance sheet date. Tax expense is recognised in the Group income statement except to the extent that it relates to items recognised in the Group statement of comprehensive income/(loss) or directly in the Group statement of changes in equity, in which case it is recognised in the Group statement of comprehensive income/(loss) or directly in the Group statement of changes in equity, respectively.
Deferred tax is provided using the balance sheet liability method, providing for temporary differences between the carrying amounts of assets and liabilities for financial reporting purposes and the amounts used for taxation purposes.
Deferred tax is calculated at the tax rates that are expected to apply in the period when the liability is settled or the asset realised based on the tax rates that have been enacted or substantively enacted by the balance sheet date. Deferred tax is charged or credited in the Group income statement, except when it relates to items charged or credited directly to the Group statement of changes in equity or the Group statement of comprehensive income/(loss), in which case the deferred tax is also recognised in equity, or other comprehensive income, respectively.
Deferred tax assets are recognised to the extent that it is probable that taxable profits will be available against which deductible temporary differences can be utilised.
The carrying amount of deferred tax assets is reviewed at each balance sheet date and reduced to the extent that it is no longer probable that sufficient taxable profits will be available to allow all or part of the assets to be recovered.
Deferred tax assets and liabilities are offset against each other when there is a legally enforceable right to set off current taxation assets against current taxation liabilities and it is the intention to settle these on a net basis.
Tax provisions are recognised for uncertain tax positions where a risk of an additional tax liability has been identified and it is probable that the Group will be required to settle that tax. Measurement is dependent on management’s expectation of the outcome of decisions by tax authorities in the various tax jurisdictions in which the Group operates. This is assessed on a case by case basis using in-house tax experts, professional firms and previous experience. Refer to Note 6.
Foreign currenciesThe consolidated financial statements are presented in Pounds Sterling, which is the ultimate Parent Company’s functional currency.
Transactions in foreign currencies are translated to the functional currency at the exchange rate on the date of the transaction. At each balance sheet date, monetary assets and liabilities that are denominated in foreign currencies are retranslated to the functional currency at the rates prevailing on the balance sheet date. Exchange differences are recognised in the Group income statement in the period in which they arise, apart from exchange differences on transactions entered into to hedge certain foreign currency risks, and exchange differences on monetary items forming part of the net investment in a foreign operation.
The assets and liabilities of the Group’s foreign operations are translated into Pounds Sterling at exchange rates prevailing at the balance sheet date. Profits and losses are translated at average exchange rates for the relevant accounting periods. Exchange differences arising are recognised in the Group statement of comprehensive income/(loss) and are included in the Group’s translation reserve. Such translation differences are recognised as income or expenses in the period in which the operation is disposed of.
Goodwill and fair value adjustments arising on the acquisition of a foreign entity are treated as assets and liabilities of the foreign entity and translated at the closing rate.
81Tesco PLC Annual Report and Financial Statements 2018
Financial statements

Note 1 Accounting policies, judgements and estimates continuedFinancial instrumentsFinancial assets and financial liabilities are recognised in the Group balance sheet when the Group becomes a party to the contractual provisions of the instrument.
Trade receivablesTrade receivables are non interest-bearing and are recognised initially at fair value, and subsequently at amortised cost using the effective interest rate method, less provision for impairment.
InvestmentsInvestments are recognised at trade date. Investments are classified as either held for trading or available-for-sale, and are recognised at fair value. For available-for-sale investments, gains and losses arising from changes in fair value are recognised directly in other comprehensive income, until the security is disposed of or is determined to be impaired, at which time the cumulative gain or loss previously recognised in other comprehensive income is included in the Group income statement for the period. Interest calculated using the effective interest rate method is recognised in the Group income statement. Dividends on an available-for-sale equity instrument are recognised in the Group income statement when the entity’s right to receive payment is established.
Loans and advances to customersLoans and advances are initially recognised at fair value plus directly related transaction costs. Subsequent to initial recognition, these assets are carried at amortised cost using the effective interest method less any impairment losses. Income from these financial assets is calculated on an effective yield basis and is recognised in the Group income statement.
Impairment of loans and advances to customersThe Group’s loan impairment provisions are established to recognise incurred impairment losses in its portfolio of loans classified as loans and receivables and carried at amortised cost. At each balance sheet date, management reviews the carrying amounts of its loans and advances to determine whether there is any indication that those assets have suffered an impairment loss.
If there is objective evidence that an impairment loss on a financial asset or group of financial assets classified as loans and advances has been incurred, management measures the amount of the loss as the difference between the carrying amount of the asset or group of assets and the present value of estimated future cash flows from the asset or group of assets discounted at the effective interest rate of the instrument at initial recognition. Impairment losses are assessed individually for financial assets that are individually significant and collectively for assets that are not individually significant. In making collective assessments of impairment, financial assets are grouped into portfolios on the basis of similar risk characteristics.
Loan impairment provisions are established on a portfolio basis using statistical methodology taking into account the level of arrears, security, past loss experience, credit quality and defaults based on portfolio trends.
The portfolios include mortgages, credit card receivables, personal current accounts and personal loans. The future credit quality of these portfolios is subject to uncertainties that could cause actual credit losses to differ materially from reported loan impairment provisions. These uncertainties include the economic environment, notably interest rates and their effect on customer spending, the unemployment level, payment behaviour and bankruptcy trends.
Impairment losses are recognised in the Group income statement and the carrying amount of the financial asset or group of financial assets is reduced by establishing an allowance for impairment losses. If in a subsequent period the amount of the impairment loss reduces and the reduction can be ascribed to an event after the impairment was recognised, the previously recognised loss is reversed by adjusting the allowance. Once an impairment loss has been recognised on a financial asset or group of financial assets, interest income is recognised on the carrying amount using the rate of interest at which estimated future cash flows were discounted in measuring impairment.
Interest-bearing borrowingsInterest-bearing bank loans and overdrafts are initially recorded at fair value, net of attributable transaction costs. Subsequent to initial recognition, interest-bearing borrowings are stated at amortised cost with any difference between proceeds and redemption value being recognised in the Group income statement over the period of the borrowings on an effective interest basis.
Trade payablesTrade payables are non interest-bearing and are recognised initially at fair value and subsequently measured at amortised cost using the effective interest method.
Equity instrumentsEquity instruments issued by the Group are recorded at the proceeds received, net of direct issue costs.
Derivative financial instruments and hedge accountingThe Group uses derivative financial instruments to hedge its exposure to foreign exchange, interest rate and commodity risks arising from operating, financing and investing activities. The Group does not hold or issue derivative financial instruments for trading purposes; however, if derivatives do not qualify for hedge accounting they are accounted for as such.
Derivative financial instruments are recognised and stated at fair value. Where derivatives do not qualify for hedge accounting, any gains or losses on remeasurement are immediately recognised in the Group income statement. Where derivatives qualify for hedge accounting, recognition of any resultant gain or loss depends on the nature of the hedge relationship and the item being hedged. In order to qualify for hedge accounting, the Group is required to document from inception the relationship between the item being hedged and the hedging instrument.
The Group is also required to document and demonstrate an assessment of the relationship between the hedged item and the hedging instrument, which shows that the hedge will be highly effective on an ongoing basis. This effectiveness testing is performed at each reporting period to assess whether the hedge remains highly effective.
Derivative financial instruments with maturity dates of more than one year from the balance sheet date are disclosed as non-current.
Fair value hedgingDerivative financial instruments are classified as fair value hedges when they hedge the Group’s exposure to changes in the fair value of a recognised asset or liability. Changes in the fair value of derivatives that are designated and qualify as fair value hedges are recorded in the Group income statement together with any changes in the fair value of the hedged item that is attributable to the hedged risk.
Cash flow hedgingDerivative financial instruments are classified as cash flow hedges when they hedge the Group’s exposure to variability in cash flows that are either attributable to a particular risk associated with a recognised asset or liability, or a highly probable forecasted transaction. The effective element of any gain or loss from remeasuring the derivative instrument is recognised directly in the Group statement of comprehensive income/(loss).
The associated cumulative gain or loss is reclassified from other comprehensive income and recognised in the Group income statement in the same period or periods during which the hedged transaction affects the Group income statement. The classification of the effective portion when recognised in the Group income statement is the same as the classification of the hedged transaction. Any element of the remeasurement of the derivative instrument that does not meet the criteria for an effective hedge is recognised immediately in the Group income statement within finance income or costs.
Hedge accounting is discontinued when the hedging instrument expires or is sold, terminated or exercised, or if a voluntary de-designation takes place or it no longer qualifies for hedge accounting. At that point in time, any cumulative gain or loss on the hedging instrument recognised in equity is retained in the Group statement of changes in equity until the forecast transaction occurs or the original hedged item affects the Group income statement. If a forecast hedged transaction is no longer expected to occur, the net cumulative gain or loss recognised in the Group statement of changes in equity is reclassified to the Group income statement.
Tesco PLC Annual Report and Financial Statements 201882
Notes to the Group financial statements continued

Note 1 Accounting policies, judgements and estimates continuedFinancial instruments continuedNet investment hedgingDerivative financial instruments are classified as net investment hedges when they hedge the Group’s net investment in an overseas operation. The effective element of any foreign exchange gain or loss from remeasuring the derivative instrument is recognised directly in other comprehensive income. Any ineffective element is recognised immediately in the Group income statement. Gains and losses accumulated in other comprehensive income are included in the Group income statement when the foreign operation is disposed of.
Offsetting financial instrumentsFinancial assets and liabilities are offset and the net amount reported in the Group balance sheet when there is a current legally enforceable right to offset the recognised amounts and there is an intention to settle on a net basis or realise the asset and settle the liability simultaneously.
ProvisionsProvisions are measured at the present value of the expenditures expected to be required to settle the obligation using a pre-tax discount rate that reflects current market assessments of the time value of money and the risks specific to the obligation. The increase in the provision due to passage of time is recognised as interest expense.
Provisions for onerous leases are recognised when the Group believes that the unavoidable costs of meeting or exiting the lease obligations exceed the economic benefits expected to be received under the lease.
Judgements and sources of estimation uncertaintyThe preparation of the consolidated Group financial statements requires management to make judgements, estimates and assumptions in applying the Group’s accounting policies to determine the reported amounts of assets, liabilities, income and expenses. The estimates and associated assumptions are based on historical experience and various other factors that are believed to be reasonable under the circumstances. Actual results may differ from these estimates. The estimates and underlying assumptions are reviewed on an ongoing basis, with revisions to accounting estimates applied prospectively.
Critical accounting judgementsCritical judgements, apart from those involving estimations, that are applied in the preparation of the consolidated financial statements are discussed below:
Joint ventures and associatesThe Group has assessed the nature of its joint arrangements under IFRS 11 ‘Joint arrangements’ and determined them to be joint ventures. This assessment required the exercise of judgement as set out in Note 13.
Management has applied judgement in determining that Gain Land Limited (Gain Land) is an associate of the Group. The Group has significant influence by virtue of holding a 20% equity interest which presumes significant influence per IAS 28, together with having a contractual right to appoint two out of 10 Directors, while taking into account that the remaining 80% interest is held by one other party.
Equity transactions with joint venture partnersDuring the year the Group unwound its joint venture with British Land Co PLC (British Land). As part of the unwind, the Group obtained sole control of BLT Properties Ltd and seven stores, while British Land obtained sole control of BLT Holdings (2010) Ltd and two stores.
The Group is an equity partner in several joint ventures. Where the Group acquires the other partner’s interests in the joint venture, management applies judgement in determining whether the transaction is accounted for as a business combination or as an asset acquisition. Factors considered in making this determination include whether the property management services in the joint venture are significant processes, and whether substantially all of the consideration paid relates to the fair value of purchased properties. For transactions accounted for as business combinations where the Group leases properties in the joint venture, management further considers whether increases in valuation of the properties above vacant possession value are attributable to the value of the lease contract or reflect residual goodwill.
Management exercised judgement in accounting for the Group’s acquisition of BLT Properties Ltd as an asset acquisition, since substantially all of the purchase price related to the fair value of the seven stores purchased. The sale of shares in BLT Holdings (2010) Ltd was accounted for as a sale of an investment. Refer to Note 4.
Structured entitiesManagement has applied judgement in determining whether the Group has control over any structured entities involved in the Group’s credit card securitisations and retail property transactions. Refer to Note 13 for additional disclosures.
LeasesManagement exercises judgement in determining the classification of leases as finance or operating leases at inception of the lease. Management considers the likelihood of exercising break clauses or extension options in determining the lease term. Where the lease term constitutes substantially all of the economic life of the asset, or where the present value of minimum lease payments amount to substantially all of the fair value of the property, the lease is classified as a finance lease. All other leases are classified as operating leases.
Management further applies judgement in determining the accounting treatment of the sale and leaseback transactions. Factors considered include the substance of the transaction (by applying the lease classification principles described above) whether or not the sale was made at the asset’s fair value and the relationship with the buyer, which is based on levels of control and influence (the buyer may be an associate, joint venture or an unrelated party).
Refer to Note 34 for additional disclosures on judgements made relating to operating leases including those arising from sale and leasebacks.
Classification of mall propertiesManagement exercises judgement in determining the appropriate classification of shopping malls as investment properties or property, plant and equipment. Factors considered in making this determination include the level of services provided to tenants, who manages the mall and any shared facilities, the proportion of sublet space to own-use space and the variability of earnings from the property.
Determination of cash-generating unitsThe Group has determined each store as a separate cash-generating unit for impairment testing. Refer to Note 11.
Operating segmentsManagement has assessed the retail operations in different countries and determined that they share similar economic characteristics, products, customers and supply chain operations. The retail operations have therefore been aggregated in the UK & ROI, Central Europe and Asia segments, in line with the way they are managed below the Chief Operating Decision Maker (CODM).
Tesco Bank operates in a different industry and reports separately hence is a separate segment.
Discontinued operationsManagement has applied judgement in presenting the Group’s retail operations in Turkey as a discontinued operation. Management consider the retail operations in Turkey as an operating segment, one level below the reportable Retail Central Europe segment. Management further considered previous treatment of similar disposals in China and Korea as discontinued operations. Refer to Note 7.
Alternative performance measures (APMs) – Exceptional items Management exercises judgement in determining the adjustments to apply to IFRS measurements in order to derive APMs which provide additional useful information on the underlying trends, performance and position of the Group. This assessment covers the nature of the item, cause of occurrence and the scale of impact of that item on reported performance. Reversals of previous exceptional items are assessed based on the same criteria. A breakdown of the exceptional items included in the Group income statement, together with the impact of these items on the Group cash flow statement, is disclosed in Note 4 to the consolidated financial statements.
Refer to pages 150 to 153 for further details on the Group’s APMs.
83Tesco PLC Annual Report and Financial Statements 2018
Financial statements

Note 1 Accounting policies, judgements and estimates continuedKey sources of estimation uncertaintyThe key assumptions about the future, and other key sources of estimation uncertainty at the reporting period end that may have a significant risk of causing a material adjustment to the carrying amount of assets and liabilities within the next financial year are discussed below:
Change in estimate – Post-employment benefit obligationsThe present value of the post-employment benefit obligations depends on a number of factors that are determined on an actuarial basis using a number of assumptions. The assumptions used in determining the net cost/(income) for pensions include the discount rate. Any changes in these assumptions will impact the carrying amount of post-employment benefit obligations.
During the financial year, the Group has taken actuarial advice and decided to change the model used for deriving the discount rate assumption for valuing the Tesco PLC Pension Scheme’s liabilities under IAS 19 ‘Employee Benefits’.
Key assumptions and sensitivities for post-employment benefit obligations are disclosed in Note 27.
Impairmenta) Impairment of investmentsWhere there are indicators of impairment or reversals of previous impairment for investments in joint ventures and associates or other investments, management performs an impairment test for the investment based on the higher of value in use and fair value less costs of disposal. Key estimates and sensitivities for impairment of investments are disclosed in Note 13.
b) Impairment of property, plant and equipment, software, other intangible assets and investment property
Where there are indicators of impairment, management performs an impairment test. Recoverable amounts for cash-generating units are the higher of fair value less costs of disposal, and value in use. Value in use is calculated from cash flow projections based on the Group’s three year internal forecasts. The forecasts are extrapolated to five years based on management’s expectations, and beyond five years based on estimated long-term growth rates. Key estimates and sensitivities for impairment of assets are disclosed in Note 11. Fair value is determined with the assistance of independent, professional valuers where appropriate.
Commercial incomeManagement is required to make estimates in determining the amount and timing of recognition of commercial income (as defined on page 79) for some transactions with suppliers. In determining the amount of volume-related allowances recognised in any period, management estimate the probability that the Group will meet contractual target volumes, based on historical and forecast performance. There is limited estimation involved in recognising income for promotional and other allowances.
Management assesses its performance against the obligations conditional on earning the income, with the income recognised either over time as the obligations are met, or recognised at the point when all obligations are met, dependent on the contractual requirements. Commercial income is recognised as a credit within cost of sales. Where the income earned relates to inventories which are held by the Group at period ends, the income is included within the cost of those inventories, and recognised in cost of sales upon sale of those inventories. Management views that the cost of inventories sold (which is inclusive of commercial income) provides a consistent and complete measure of the income statement impact of the overall supplier relationships.
Management considers the best indicator of the estimation undertaken is by reference to commercial income balances not settled at the balance sheet date and has therefore provided additional disclosures of commercial income amounts reflected in the balance sheet. Refer to Note 20 for commercial income disclosures.
Property provisionsProperty provisions comprise onerous lease provisions, including leases on unprofitable stores and vacant properties, and other onerous contracts related to property. These provisions are based on the least net cost of fulfilling or exiting the contract.
Key estimates and sensitivities for property provisions are disclosed in Note 25.
Uncertain tax provisions The Group was previously exposed to variability in the resolution of tax exposures relating to Korea. Since these exposures have been resolved in the current year, the risk of material adjustment relating to uncertain tax provisions is viewed as not significant.
InventoriesAn inventory provision is booked for cases where the realisable value from sale of the inventory is estimated to be lower than the inventory carrying value. Management has estimated the inventory provisioning percentage for different product categories based on various factors, including the expected sales profiles of the items, the prevailing sales prices, the item’s seasonality pattern and expected losses associated with slow-moving inventory items.
Contingent liabilitiesContingent liabilities are possible obligations whose existence will be confirmed only on the occurrence or non-occurrence of uncertain future events outside the Group’s control, or present obligations that are not recognised because it is not probable that a settlement will be required or the value of such a payment cannot be reliably estimated. The Group does not recognise contingent liabilities but discloses them. Refer to Note 32 for the disclosures.
Amendments to accounting standards effective for the current yearThe following amendments were adopted in the current year:
– Amendments to IAS 7 ‘Statement of Cash Flows’ – Disclosure Initiative – Amendments to IAS 12 ‘Income Taxes’ – Recognition of Deferred Tax Assets for Unrealised Losses
The adoption of these amendments does not have a material impact on the Group financial statements. Additional disclosures have been given where relevant.
Standards issued but not yet effectiveAt the date of authorisation of these financial statements, the Group has not applied the following standards that have been issued but are not yet effective. The Group has not adopted any new or amended standards early.
IFRS 9 ‘Financial Instruments’IFRS 9 ‘Financial Instruments’ replaces IAS 39 ‘Financial Instruments: Recognition and Measurement’ with the exception of macro hedge accounting. The standard will be effective in the Group financial statements for the 52 weeks ending 23 February 2019. The Group intends to apply the classification and measurement and impairment requirements of the standard retrospectively at the transition date of 25 February 2018 by adjusting the opening balance sheet, with no restatement of comparative periods. Hedge accounting relationships within the scope of IFRS 9 will transition prospectively.
The standard covers three elements:
– Classification and measurement: Changes to a more principle based approach to classify financial assets as either held at amortised cost, fair value through other comprehensive income (FVOCI) or fair value through profit or loss, dependent on the business model and cash flow characteristics of the financial asset;
– Impairment: Moves to an impairment model based on expected credit losses based on a three stage approach; and
– Hedge accounting: The IFRS 9 hedge accounting requirements are designed to allow hedge accounting to be more closely aligned with the Group’s underlying risk management. A new International Accounting Standards Board (IASB) project is in progress to develop an approach to better reflect dynamic risk management in entities’ financial statements.
Classification and measurement:From a review of the Group balance sheet as at 24 February 2018, the Group expects the following classification changes to take place:
– All financial instruments classified as loans and receivables under IAS 39 will be classified and measured at amortised cost under IFRS 9; and
– All financial instruments classified as available-for-sale under IAS 39 will be classified and measured at FVOCI under IFRS 9.
Tesco PLC Annual Report and Financial Statements 201884
Notes to the Group financial statements continued

Note 1 Accounting policies, judgements and estimates continuedStandards issued but not yet effective continuedIFRS 9 ‘Financial Instruments’ continuedImpairment:IFRS 9 requires the Group to recognise expected credit losses (ECL) at all times, and to update the amount of ECL recognised at each reporting date to reflect changes in the credit risk of financial assets. The ECL will be measured under the simplified approach, with the exception of loans and advances to customers, other investments and joint venture loans, where the three-stage approach will be applied.
The assessment of credit risk and the estimation of ECL are required to be unbiased, forward-looking and probability-weighted, determined by evaluating at the reporting date for each financial asset a range of possible outcomes using reasonable and supportable information about past events, current conditions and forecasts of future events and economic conditions. The estimation of ECL also takes into account the time value of money.
As a result of applying IFRS 9, the impact on opening retained earnings for the year ended 28 February 2019 for Tesco Bank is expected to be a reduction of £166m. This reflects the increase in impairment allowance under the new ECL model, net of deferred tax. The impact of the new impairment requirements on the Retail business is not material.
Hedge accounting:The IFRS 9 hedge accounting requirements are designed to allow hedge accounting to be more closely aligned with financial risk management. A new IFRS is under development to account for dynamic risk management. As permitted under IFRS 9, the Group will elect to continue to apply the existing hedge accounting requirements of IAS 39 for its portfolio hedge accounting until this new standard is implemented. All other existing hedge relationships will transition to IFRS 9 on adoption.
IFRS 15 ‘Revenues from Contracts with Customers’IFRS 15 ‘Revenues from Contracts with Customers’ will be effective in the Group financial statements for the 52 weeks ending 23 February 2019. The Group intends to adopt the standard retrospectively, with comparatives restated from a transition date of 26 February 2017.
IFRS 15 introduces a five-step approach to the timing of revenue recognition based on performance obligations in customer contracts. The core principle of IFRS 15 is that an entity should recognise revenue to depict the transfer of promised goods and services to customers in an amount that reflects the consideration to which the entity expects to be entitled in exchange for those goods or services.
The Group recognises revenue from the principal activities of retailing and associated activities and retail banking and insurance services through Tesco Bank. For the majority of revenue streams, there is a low level of judgement applied in determining the consideration or the timing of transfer of control. As a result, revenue recognition under IFRS 15 will be largely consistent with current practice.
Revenue streams that will be impacted include Clubcard loyalty points, for which the fair value of consideration will change, and certain telecommunication contracts and bespoke contracts fulfilled by dunnhumby, for which the timing of revenue recognition will change.
IFRS 15 is not expected to result in a material impact to the Retail business. The impact for Tesco Bank is still under assessment.
IFRS 16 ‘Leases’IFRS 16 ‘Leases’ will be effective in the Group financial statements for the 53 weeks ending 29 February 2020. The Group intends to adopt the standard retrospectively, with comparatives restated from a transition date of 25 February 2018.
IFRS 16 provides a single lessee accounting model, requiring lessees to recognise right-of-use assets and lease liabilities for all applicable leases.
Under IFRS 16, lessees will be required to remeasure the lease liability upon the occurrence of certain events, such as a change in future lease payments resulting from a change in an index or rate used to determine those payments. The lessee will generally recognise the amount of the remeasurement of the lease liability as an adjustment to the right-of-use asset.
IFRS 16 is expected to have a significant impact on reported assets, liabilities and income statement of the Group, as well as the classification of cash flows relating to lease contracts. The standard will impact a number of key measures such as operating profit and cash generated from operations, as well as a number of alternative performance measures used by the Group.
The Group’s IFRS 16 Project is governed by a Steering Committee, which regularly reports progress to the Group Audit Committee. During the current reporting period, progress has been made in the collation of the additional lease data required to support IFRS 16 calculations, establishing systems and processes required for accounting and reporting under IFRS 16 and in determining the appropriate discount rates to apply to lease payments.
During the next financial year, the Group will finalise this work and set out accounting policies and procedures for leases. The Group will also establish a process of parallel reporting for the comparative period. Until the impact assessment is completed, it is not practical to provide a reasonable estimate of the financial effect of IFRS 16.
Other standards and amendmentsThe impacts of the following standards and amendments are still under assessment:
– Amendments to IFRS 4 – Applying IFRS 9 Financial Instruments with IFRS 4 Insurance Contracts
– IFRS 17 – Insurance Contracts
Other changes to standards and amendments issued but not yet effective are not expected to have a material impact on the Group financial statements.
Alternative performance measures (APMs)In the reporting of financial information, the Directors have adopted various APMs.
These measures are not defined by International Financial Reporting Standards (IFRS) and therefore may not be directly comparable with other companies’ APMs, including those in the Group’s industry.
APMs should be considered in addition to, and are not intended to be a substitute for, or superior to, IFRS measurements.
PurposeThe Directors believe that these APMs assist in providing additional useful information on the underlying trends, performance and position of the Group.
APMs are also used to enhance the comparability of information between reporting periods and geographical units (such as like-for-like sales), by adjusting for non-recurring or uncontrollable factors which affect IFRS measures, to aid users in understanding the Group’s performance.
Consequently, APMs are used by the Directors and management for performance analysis, planning, reporting and incentive-setting purposes.
The key APMs that the Group has focused on in the financial year are as follows:
– Group sales: This is the headline measure of revenue for the Group. It excludes the impact of sales made at petrol filling stations due to the significant volatility of fuel prices. This volatility is outside the control of management and can mask underlying changes in performance.
– Like-for-like sales: This is a widely used indicator of a retailer’s current trading performance. It is a measure of growth in Group online sales and sales from stores that have been open for at least a year (but excludes prior year sales of stores closed during the year) at constant foreign exchange rates.
– Operating profit before exceptional items: This is the headline measure of the Group’s performance, and is based on operating profit before the impact of exceptional items. Exceptional items relate to certain costs or incomes that derive from events or transactions that fall within the normal activities of the Group but which, individually or, if of a similar type, in aggregate, are excluded by virtue of their size and nature in order to reflect management’s view of the performance of the Group.
– Retail operating cash flow: This is the operating cash flow of continuing operations, excluding the effects of Tesco Bank’s cash flows.
– Retail free cash flow: Retail free cash flow includes all cash flows from operating and investing activities for the Retail business, and the market purchase of shares in relation to share schemes. The following items are excluded: investing cash flows that increase/decrease items within Net debt, and cash flows from major corporate acquisitions and disposals.
85Tesco PLC Annual Report and Financial Statements 2018
Financial statements

Note 1 Accounting policies, judgements and estimates continuedAlternative performance measures (APMs) continuedPurpose continued
– Net debt: This excludes the net debt of Tesco Bank but includes that of the discontinued operations to reflect the net debt obligations of the Retail business.
– Diluted earnings per share from continuing operations before exceptional items, net pension finance costs and fair value remeasurements on financial instruments: This relates to profit after tax before exceptional items from continuing operations, net pension finance costs and fair value remeasurements on financial instruments attributable to owners of the parent divided by the weighted average number of ordinary shares in issue during the financial year adjusted for the effects of potentially dilutive share options.
Some of the Group’s IFRS measures are translated at constant exchange rates. Constant exchange rates are the average actual periodic exchange rates for the previous financial year and are used to eliminate the effects of exchange rate fluctuations in assessing performance. Actual exchange rates are the average actual periodic exchange rates for the financial year.
Changes to APMsDuring the financial year, the following changes have been applied to the Group’s APMs:
– Free cash flow has been redefined to include all cash flows from operating and investing activities, and the market purchase of shares in relation to share schemes. The following items are excluded: investing cash flows that increase/decrease items within Group net debt, and cash flows from major corporate acquisitions and disposals. This measure reflects the cash available to shareholders. Previously, free cash flow only included capital expenditure cash flows within investing activities. Retail free cash flow is now considered a key APM.
– Diluted earnings per share from continuing operations before exceptional items and net pension finance costs has been replaced with diluted earnings per share from continuing operations before exceptional items, net pension finance costs and fair value remeasurements on financial instruments. Fair value remeasurements are now excluded as they are impacted by changes to credit risk and various market indices, which can fluctuate significantly. Also included in these items are fair value remeasurements on financial instruments resulting from liability management exercises. Other earnings per share measures before exceptional items are no longer considered APMs and have been removed.
– Total indebtedness ratio and Fixed charge cover have been included as new APMs during the year. Earnings before exceptional items, interest, tax, depreciation, amortisation and rent expense (EBITDAR) has also been included as it is used to calculate these debt metrics. Total indebtedness ratio and Fixed charge cover are measures of the Group’s ability to meet its payment obligations and are widely used by analysts and credit rating agencies.
Refer to the Glossary (pages 150 to 153) for a full list and comprehensive descriptions and purpose of the Group’s APMs.
Tesco PLC Annual Report and Financial Statements 201886
Notes to the Group financial statements continued

Note 2 Segmental reportingThe Group’s operating segments are determined based on the Group’s internal reporting to the Chief Operating Decision Maker (CODM). The CODM has been determined to be the Group Chief Executive, with support from the Executive Committee, as the function primarily responsible for the allocation of resources to segments and assessment of performance of the segments.
In line with changes in management structure reporting to the CODM, the Group has reassessed its reportable segments and determined that the retailing and associated activities previously disclosed within the International segment should be segregated between the Central Europe and Asia segments.
The principal activities of the Group are therefore presented in the following segments:
• Retailing and associated activities (Retail) in: – UK & ROI – the United Kingdom and Republic of Ireland; – Central Europe – Czech Republic, Hungary, Poland, Slovakia; and – Asia – Malaysia and Thailand.
• Retail banking and insurance services through Tesco Bank in the UK (Tesco Bank).
This presentation reflects how the Group’s operating performance is reviewed internally by management. Segmental information for the 52 weeks ended 25 February 2017 has been amended accordingly. The amounts disclosed within the Central Europe and Asia segments total the amounts previously disclosed within the International segment.
Excluded from the segmental information below are the Retail activities of Turkey which have been classified as discontinued operations. Refer to Note 7 for further details.
The CODM uses operating profit before exceptional items, as reviewed at monthly Executive Committee meetings, as the key measure of the segments’ results as it reflects the segments’ underlying performance for the financial year under evaluation. Operating profit before exceptional items is a consistent measure within the Group as defined within Note 1. Refer to Note 4 for exceptional items. Inter-segment revenue between the operating segments is not material.
Income statement The segment results and the reconciliation of the segment measures to the respective statutory items included in the Group income statement are as follows:
52 weeks ended 24 February 2018 At constant exchange rates
UK & ROI£m
Central Europe
£mAsia £m
TescoBank
£m
Total atconstantexchange
£m
Foreignexchange
£m
Totalat actual
exchange£m
Continuing operationsGroup sales 38,522 5,884 4,692 1,051 50,149 842 50,991Revenue 44,775 6,109 4,692 1,051 56,627 864 57,491Operating profit/(loss) before exceptional items* 1,046 110 282 173 1,611 33 1,644Exceptional items 141 88 (20) (24) 185 8 193Operating profit/(loss) 1,187 198 262 149 1,796 41 1,837Operating margin 2.3% 1.8% 6.0% 16.5% 2.8% 2.9%
52 weeks ended 24 February 2018 At actual exchange rates
UK & ROI£m
Central Europe
£mAsia £m
TescoBank
£m
Totalat actual
exchange£m
Continuing operationsGroup sales 38,650 6,343 4,947 1,051 50,991Revenue 44,908 6,585 4,947 1,051 57,491Operating profit/(loss) before exceptional items* 1,053 119 299 173 1,644Exceptional items 146 93 (22) (24) 193Operating profit/(loss) 1,199 212 277 149 1,837Operating margin 2.3% 1.8% 6.0% 16.5% 2.9%Share of post-tax profits/(losses) of joint ventures and associates (6)Finance income 98Finance costs (631)Profit/(loss) before tax 1,298
52 weeks ended 25 February 2017 At actual exchange rates
UK & ROI£m
Central Europe
£mAsia £m
TescoBank
£m
Totalat actual
exchange£m
Continuing operationsGroup sales 37,692 5,977 5,186 1,012 49,867Revenue 43,524 6,195 5,186 1,012 55,917Operating profit/(loss) before exceptional items* 803 58 262 157 1,280Exceptional items (284) 132 (31) (80) (263)Operating profit/(loss) 519 190 231 77 1,017Operating margin 1.8% 0.9% 5.1% 15.5% 2.3%Share of post-tax profits/(losses) of joint ventures and associates (107)Finance income 109Finance costs (874)Profit/(loss) before tax 145* Intercompany recharges totalling £nil (2017: £2m) between continuing operations and the Turkey discontinued operations have been eliminated.
87Tesco PLC Annual Report and Financial Statements 2018
Financial statements

Note 2 Segmental reporting continued Balance sheetThe following tables showing segment assets and liabilities exclude those balances that make up net debt (cash and cash equivalents, short-term investments, joint venture loans and other receivables, bank and other borrowings, finance lease payables, derivative financial instruments and net debt of the disposal group). Net debt balances have been included within the unallocated segment to reflect how the Group manages these balances. Intercompany transactions have been eliminated other than intercompany transactions with Tesco Bank in net debt.
At 24 February 2018UK & ROI
£m
Central Europe
£mAsia £m
TescoBank
£mUnallocated
£mTotal
£mGoodwill, software and other intangible assets 1,281 36 271 1,073 – 2,661Property, plant and equipment and investment property 13,190 2,799 2,564 68 – 18,621Investments in joint ventures and associates 12 1 586 90 – 689Non-current other investments 3 – – 857 – 860Non-current trade and other receivables(a) 30 6 12 – – 48Non-current loans and advances to customers – – – 6,885 – 6,885Deferred tax assets 19 33 65 – – 117Non-current assets(b) 14,535 2,875 3,498 8,973 – 29,881
Inventories and current trade and other receivables(c) 2,428 610 398 308 – 3,744Current loans and advances to customers – – – 4,637 – 4,637Current other investments – – – 68 – 68Total trade and other payables (7,241) (853) (1,028) (238) – (9,360)Total customer deposits and deposits from banks – – – (10,784) – (10,784)Total provisions (1,034) (110) (47) (77) – (1,268)Deferred tax liabilities (20) (35) (32) (4) – (91)Net current tax (263) (9) (16) (35) – (323)Post-employment benefits (3,261) – (21) – – (3,282)Assets of the disposal group and classified as held for sale(d) 95 54 – – – 149Liabilities of the disposal group(d) – – – – – –Net debt (including Tesco Bank)(e) – – – (288) (2,625) (2,913)Net assets 5,239 2,532 2,752 2,560 (2,625) 10,458(a) Excludes loans to joint ventures of £138m (2017: £137m) which form part of net debt.(b) Excludes derivative financial instrument non-current assets of £1,117m (2017: £1,303m).(c) Excludes net interest and other receivables of £1m (2017: £1m) which form part of net debt. (d) Excludes net debt of the disposal group of £nil (2017: £(65)m). Refer to Note 7.(e) Refer to Note 30.
At 25 February 2017UK & ROI
£m
Central Europe
£mAsia £m
TescoBank
£mUnallocated
£mTotal
£mGoodwill, software and other intangible assets 1,293 44 278 1,102 – 2,717Property, plant and equipment and investment property 12,893 2,613 2,593 73 – 18,172Investments in joint ventures and associates 11 1 656 71 – 739Non-current other investments – – – 810 13 823Non-current trade and other receivables(a) 23 7 13 – – 43Non-current loans and advances to customers – – – 5,795 – 5,795Deferred tax assets 601 23 83 – – 707Non-current assets(b) 14,821 2,688 3,623 7,851 13 28,996
Inventories and current trade and other receivables(c) 2,389 654 394 338 – 3,775Current loans and advances to customers – – – 4,166 – 4,166Current other investments – – – 156 128 284Total trade and other payables (7,006) (799) (1,152) (242) – (9,199)Total customer deposits and deposits from banks – – – (8,963) – (8,963)Total provisions (914) (80) (45) (84) – (1,123)Deferred tax liabilities (7) (26) (41) (14) – (88)Net current tax (579) (1) (12) (8) – (600)Post-employment benefits (6,600) – (21) – – (6,621)Assets of the disposal group and classified as held for sale(d) 100 46 – – 187 333Liabilities of the disposal group(d) – – – – (95) (95)Net debt (including Tesco Bank)(e) – – – (722) (3,729) (4,451)Net assets 2,204 2,482 2,746 2,478 (3,496) 6,414(a)–(e) Refer to previous table for footnotes.
Tesco PLC Annual Report and Financial Statements 201888
Notes to the Group financial statements continued

Note 2 Segmental reporting continuedOther segment information
52 weeks ended 24 February 2018UK & ROI
£m
Central Europe
£mAsia £m
TescoBank
£m
Total continuing operations
£m
Discontinued operations
£mTotal
£mCapital expenditure (including acquisitions through business combinations):
Property, plant and equipment 940 117 236 7 1,300 – 1,300Investment property 1 – – – 1 – 1Goodwill, software and other intangible assets* 141 16 3 43 203 – 203
Depreciation and amortisation:Property, plant and equipment (686) (147) (230) (12) (1,075) – (1,075)Investment property (1) – – – (1) – (1)Software and other intangible assets (121) (18) (9) (71) (219) – (219)
Impairment:Property, plant and equipment loss (50) (6) (32) – (88) – (88)Property, plant and equipment reversal 154 112 9 – 275 – 275Investment property loss – (1) – – (1) – (1)Investment property reversal 3 2 – – 5 – 5Goodwill, software and other intangible assets loss (20) (8) – – (28) – (28)Software and other intangible assets reversal 4 – – – 4 – 4
* Includes £8m (2017: £nil) of goodwill, software and other intangible assets acquired through business combinations.
52 weeks ended 25 February 2017UK & ROI
£m
Central Europe
£mAsia £m
TescoBank
£m
Total continuing operations
£m
Discontinuedoperations*
£mTotal
£mCapital expenditure:
Property, plant and equipment 995 127 259 12 1,393 2 1,395 Investment property – – – – – – – Goodwill, software and other intangible assets 111 13 3 34 161 – 161
Depreciation and amortisation:Property, plant and equipment (687) (141) (208) (17) (1,053) (5) (1,058)Investment property (1) – – – (1) – (1)Software and other intangible assets (117) (16) (10) (101) (244) (1) (245)
Impairment:Property, plant and equipment loss (12) (121) (34) – (167) (106) (273)Property, plant and equipment reversal 118 158 3 – 279 – 279Investment property loss (2) (1) – – (3) – (3)Investment property reversal 3 1 – – 4 – 4Goodwill, software and other intangible assets loss (54) – – – (54) – (54) Software and other intangible assets reversal – 1 – – 1 – 1
* Discontinued operations in this table represents amounts up until the point a disposal group is classified as such. This comprises those of Turkey in the first four months of the 52 weeks ended 25 February 2017.
89Tesco PLC Annual Report and Financial Statements 2018
Financial statements

Note 2 Segmental reporting continuedCash flow statement The following tables provide further analysis of the Group cash flow statement, including a split of cash flows between Retail and Tesco Bank. The current year’s presentation includes additional details on the line items impacted by exceptional items, while removing the analysis between Retail continuing and discontinued operations. Comparatives for the prior year have been amended accordingly.
Retail Tesco Bank Tesco Group
52 weeks ended 24 February 2018
Before exceptional
items£m
Exceptional items
£m
RetailTotal
£m
Before exceptional
items£m
Exceptional items
£m
Tesco BankTotal
£mTotal
£mOperating profit/(loss) of continuing operations 1,471 217 1,688 173 (24) 149 1,837Operating profit/(loss) of discontinued operations – – – – – – –Depreciation and amortisation 1,212 – 1,212 83 – 83 1,295ATM net income (37) – (37) 37 – 37 –(Profit)/loss arising on sale of property, plant and equipment and intangible assets
(8) (58) (66) – – – (66)
(Profit)/loss arising on sale of subsidiaries and other investments (3) (162) (165) – – – (165)(Profit)/loss arising on sale of joint ventures and associates (7) (16) (23) – – – (23)Net impairment loss/(reversal) on other investments (22) – (22) – – – (22)Net impairment loss/(reversal) on property, plant and equipment, software and other intangible assets and investment property
(8) (159) (167) – – – (167)
Adjustment for non-cash element of pensions charge 4 – 4 – – – 4Additional contribution into pension schemes (245) – (245) – – – (245)Share-based payments 109 – 109 4 – 4 113Tesco Bank fair value movements included in operating profit – – – 156 – 156 156Cash flows generated from operations excluding working capital 2,466 (178) 2,288 453 (24) 429 2,717(Increase)/decrease in working capital 499 (14) 485 110 (3) 107 592Cash generated from/(used in) operations* 2,965 (192) 2,773 563 (27) 536 3,309Interest paid (347) – (347) (4) – (4) (351)Corporation tax (paid)/received (131) – (131) (45) – (45) (176)Net cash generated from/(used in) operating activities 2,487 (192) 2,295 514 (27) 487 2,782
Proceeds from sale of property, plant and equipment, investment property, intangible assets and non-current assets classified as held for sale
175 78 253 – – – 253
Purchase of property, plant and equipment, investment property and non-current assets classified as held for sale – store buy backs
(204) (189) (393) – – – (393)
Purchase of property, plant and equipment, investment property and non-current assets classified as held for sale – other capital expenditure
(1,038) – (1,038) (9) – (9) (1,047)
Purchase of intangible assets (152) – (152) (45) – (45) (197)Disposal of subsidiaries, net of cash disposed – 66 66 – – – 66Acquisition of subsidiaries, net of cash acquired (27) – (27) – – – (27)Proceeds from sale of joint ventures and associates 4 19 23 – – – 23Investments in joint ventures and associates (6) – (6) (15) – (15) (21)Net (investments in)/proceeds from sale of other investments 34 196 230 6 – 6 236Dividends received from joint ventures and associates 26 – 26 – – – 26Dividends received from Tesco Bank 50 – 50 (50) – (50) –Interest received 50 – 50 – – – 50APM: Free cash flow 1,399 (22) 1,377 401 (27) 374 1,751Net (increase)/decrease in loans to joint ventures and associates – – – – – – –Net (investments in)/proceeds from sale of short-term investments 1,697 – 1,697 – – – 1,697Net cash generated from/(used in) investing activities 609 170 779 (113) – (113) 666
Proceeds from issue of ordinary share capital 11 – 11 – – – 11Increase in borrowings 13 – 13 300 – 300 313Repayment of borrowings (3,571) – (3,571) (150) – (150) (3,721)Net cash flows from derivative financial instruments 253 – 253 – – – 253Repayment of obligations under finance leases (10) – (10) – – – (10)Dividends paid to equity holders (82) – (82) – – – (82)Net cash generated from/(used in) financing activities (3,386) – (3,386) 150 – 150 (3,236)
Intra-Group funding and intercompany transactions 9 – 9 (9) – (9) –
Net increase/(decrease) in cash and cash equivalents (281) (22) (303) 542 (27) 515 212Cash and cash equivalents at the beginning of the year 3,043 789 3,832Effect of foreign exchange rate changes 15 – 15Cash and cash equivalents including cash held in disposal group at the end of the year
2,755 1,304 4,059
Cash held in disposal group – – –Cash and cash equivalents at the end of the year 2,755 1,304 4,059* APM: ‘Retail operating cash flow’ of £2,773m (2017: £2,279m) is the cash generated from operations of the continuing Retail business. Included in Retail cash generated from/(used in)
operations of £2,773m (2017: £2,278m) is £nil (2017: £(1)m) relating to discontinued operations.
Tesco PLC Annual Report and Financial Statements 201890
Notes to the Group financial statements continued

Note 2 Segmental reporting continuedCash flow statement continued
Retail Tesco Bank Tesco Group
52 weeks ended 25 February 2017
Before exceptional
items£m
Exceptional items
£m
RetailTotal
£m
Before exceptional
items£m
Exceptional items
£m
Tesco BankTotal
£mTotal
£mOperating profit/(loss) of continuing operations 1,123 (183) 940 157 (80) 77 1,017Operating profit/(loss) of discontinued operations (15) (102) (117) – – – (117)Depreciation and amortisation 1,172 14 1,186 95 23 118 1,304ATM net income (43) – (43) 43 – 43 –(Profit)/loss arising on sale of property, plant and equipment and intangible assets
54 (134) (80) 2 – 2 (78)
(Profit)/loss arising on sale of subsidiaries and other investments 7 – 7 (4) – (4) 3(Profit)/loss arising on sale of joint ventures and associates (5) – (5) – – – (5)Impairment loss on goodwill – 46 46 – – – 46Net impairment loss/(reversal) on other investments (12) – (12) – – – (12)Net impairment loss/(reversal) on property, plant and equipment, software and other intangible assets and investment property
(10) 5 (5) – – – (5)
Adjustment for non-cash element of pensions charge 7 – 7 – – – 7Additional contribution into pension schemes (248) – (248) – – – (248)Share-based payments 14 – 14 1 – 1 15Tesco Bank fair value movements included in operating profit – – – 96 2 98 98Cash flows generated from operations excluding working capital 2,044 (354) 1,690 390 (55) 335 2,025(Increase)/decrease in working capital 379 209 588 (77) 22 (55) 533Cash generated from/(used in) operations* 2,423 (145) 2,278 313 (33) 280 2,558Interest paid (518) – (518) (4) – (4) (522)Corporation tax (paid)/received (64) – (64) 17 – 17 (47)Net cash generated from/(used in) operating activities 1,841 (145) 1,696 326 (33) 293 1,989
Proceeds from sale of property, plant and equipment, investment property, intangible assets and non-current assets classified as held for sale
19 490 509 3 – 3 512
Purchase of property, plant and equipment, investment property and non-current assets classified as held for sale – store buy backs
(365) – (365) – – – (365)
Purchase of property, plant and equipment, investment property and non-current assets classified as held for sale – other capital expenditure
(834) – (834) (6) – (6) (840)
Purchase of intangible assets (129) – (129) (40) – (40) (169)Disposal of subsidiaries, net of cash disposed 205 – 205 – – – 205Acquisition of subsidiaries, net of cash acquired (25) – (25) – – – (25)Proceeds from sale of joint ventures and associates – – – – – – –Investments in joint ventures and associates – – – – – – –Net (investments in)/proceeds from sale of other investments 111 – 111 30 – 30 141Dividends received from joint ventures and associates 28 – 28 – – – 28Dividends received from Tesco Bank 50 – 50 (50) – (50) –Interest received 41 – 41 – – – 41APM: Free cash flow 942 345 1,287 263 (33) 230 1,517Net (increase)/decrease in loans to joint ventures and associates 15 – 15 – – – 15Net (investments in)/proceeds from sale of short-term investments 736 – 736 – – – 736Net cash generated from/(used in) investing activities (148) 490 342 (63) – (63) 279
Proceeds from issue of ordinary share capital 1 – 1 – – – 1Increase in borrowings 185 – 185 – – – 185Repayment of borrowings (2,036) – (2,036) – – – (2,036)Net cash flows from derivative financial instruments 475 – 475 – – – 475Repayment of obligations under finance leases (12) – (12) – – – (12)Dividends paid to equity owners – – – – – – –Net cash generated from/(used in) financing activities (1,387) – (1,387) – – – (1,387)
Intra-Group funding and intercompany transactions (5) – (5) 5 – 5 –
Net increase/(decrease) in cash and cash equivalents 301 345 646 268 (33) 235 881Cash and cash equivalents at the beginning of the year 2,528 554 3,082Effect of foreign exchange rate changes (131) – (131)Cash and cash equivalents including cash held in disposal group at the end of the year
3,043 789 3,832
Cash held in disposal group (11) – (11)Cash and cash equivalents at the end of the year 3,032 789 3,821* APM: ‘Retail operating cash flow’ of £2,773m (2017: £2,279m) is the cash generated from operations of the continuing Retail business. Included in Retail cash generated from/(used in)
operations of £2,773m (2017: £2,278m) is £nil (2017: £(1)m) relating to discontinued operations.
91Tesco PLC Annual Report and Financial Statements 2018
Financial statements

Note 3 Income and expenses
Continuing operations
52 weeks 2018
£m
52 weeks 2017
£mProfit/(loss) before tax is stated after charging/(crediting) the following:
Property rental income, of which £(34)m (2017: £(38)m) relates to investment properties (372) (358)Other rental income (55) (50)Direct operating expenses arising on rental earning investment properties 17 20Costs of inventories recognised as an expense 42,297 41,140Inventory losses and provisions 1,373 1,337Depreciation and amortisation 1,295 1,298Operating lease expenses, of which £70m (2017: £84m) relates to hire of plant and machinery 1,018 1,043Net impairment loss/(reversal) on property, plant and equipment and investment property (191) (113)Net impairment loss/(reversal) of goodwill, software and other intangible assets 24 53
Auditor’s remuneration52 weeks
2018 £m
52 weeks 2017
£mFees payable to the Company’s auditor and its associates for the audit of the Company and Group financial statements 1.5 1.5 The audit of the accounts of the Company’s subsidiaries 5.3 4.0Total audit services 6.8 5.5Audit-related assurance services 0.5 0.5Total audit and audit-related services 7.3 6.0Fees payable to the Company’s auditor and its associates for other services:
Transaction services 1.9 1.9Taxation advisory services – 0.3All other non-audit services 4.3 3.6
Total non-audit services 6.2 5.8Total auditor’s remuneration 13.5 11.8
Other non-audit services of £4.3m (2017: £3.6m) represents: retail consultancy services £1.5m (2017: £1.5m), provision of data repository services for information needed by the Group and Serious Fraud Office (SFO) £1.8m (2017: £1.2m), SFO Monitor role £0.8m (2017: £nil), and other £0.2m (2017: £0.9m). In addition to the amounts shown above, the auditor received fees of £0.2m (2017: £0.2m) for the audit of the main Group pension scheme. Additional information on the non-audit services provided by the auditor is provided in the Corporate governance report on page 44, including how objectivity and independence is safeguarded.
Employment costs, including Directors’ remuneration
Continuing operations Notes
52 weeks2018
£m
52 weeks 2017
£mWages and salaries 6,026 6,051Social security costs 486 473Post-employment defined benefits 27 38 35Post-employment defined contributions 27 316 341Share-based payments expense 26 252 294Termination benefits* 115 168Total 7,233 7,362* Includes £99m (2017: £146m) of exceptional redundancy costs. Refer to Note 4.
Post-employment defined contribution charges include £108m (2017: £135m) of salaries paid as pension contributions.
The table below shows the average number of employees by operating segment during the financial year. Segmental information has been amended for the 52 weeks ended 25 February 2017. Refer to Note 2 for further details.
Average number of employees
Average number of full-time equivalents
Continuing operations 2018 2017 2018 2017UK & ROI 324,117 327,601 210,312 218,522Central Europe 61,623 70,004 59,110 62,657Asia 59,300 63,037 54,857 58,035Tesco Bank 3,948 3,878 3,637 3,556Total 448,988 464,520 327,916 342,770
Tesco PLC Annual Report and Financial Statements 201892
Notes to the Group financial statements continued

Note 4 Exceptional items Income statement52 weeks ended 24 February 2018Profit/(loss) for the year included the following exceptional items:
Exceptional items included in:
Cost of sales
£m
Admin- istrative
expenses £m
Property- related
items £m
Total exceptional
items included within
operating profit
£m
Share of JV and associates profits/(losses)
£m
Finance costs
£mTaxation
£m
Exceptional items within
discontinued operations
£mNet restructuring and redundancy costs(a) (75) (34) 7 (102) – – 19 –Net impairment reversal of non-current assets and onerous lease provisions(b)
50 – 3 53 – – 28 –
Provision for customer redress(c) (24) – – (24) – – (3) –Investment disposal(d) – 124 – 124 – – (25) –Disposal of opticians business(e) – 38 – 38 – – (7) –Release of amounts provided in relation to DPA and FCA obligations(f)
– 25 – 25 – – – –
Property transactions(g) – – 79 79 – – (32) –Foreign exchange losses on GBP short-term investments held in overseas entities(h)
– – – – – (38) – –
Exceptional items relating to discontinued operations(i)
– – – – – – – 216
Total (49) 153 89 193 – (38) (20) 216(a) This includes £(68)m relating to UK & ROI changes to store and call centre colleague structures and working practices and £(34)m relating to head office restructuring costs.(b) Net impairment reversal of non-current assets includes a net reversal of £185m in property, plant and equipment and investment property, a net charge of £(24)m in goodwill, software
and other intangible assets and a net charge of £(108)m of onerous lease provisions. Refer to Notes 10, 11, 12 and 25 for further details on impairment and onerous lease provisions.(c) The net charge of £(24)m reflects an additional charge of £(35)m relating to an update to the Payment Protection Insurance (PPI) provision ruling during the year, which resulted in the
inclusion of items that had previously been out of scope for redress. This was partially offset by a £1m release of the Consumer Credit Act (CCA) provision and a £10m credit received following the conclusion of negotiations with a third party in respect of previously recognised customer redress.
(d) The Group disposed of its remaining 8.8% investment stake in Lazada Group S.A. (Lazada) for net cash consideration of $254m (£196m), generating a profit of £124m. The tax charge of £25m arises due to a capital gain on the disposal.
(e) £38m relates to the gain from disposal of the Group’s opticians business to Vision Express (UK) Ltd in UK & ROI.(f) The Group had taken a total exceptional charge of £(235)m in respect of the Deferred Prosecution Agreement (DPA) and Financial Conduct Authority (FCA) obligations, including £(85)m
for the compensation scheme in the 52 weeks to 25 February 2017. With the compensation scheme now being closed to new claimants, £25m relating to the compensation scheme was released in the 52 weeks to 24 February 2018.
(g) As part of the Group’s strategy to maximise value from property, the Group disposed of surplus properties which generated a profit of £58m. The Group also recognised a net gain of £21m from the unwind of its joint venture with British Land, whereby the Group purchased seven stores from the joint venture and disposed of its remaining equity interest in the joint venture.
(h) The Group was holding proceeds from the sale of the Korea operations in GBP money market funds in an intermediate entity with a Euro functional currency. £(38)m loss represents the foreign exchange losses arising on the revaluation of these Sterling-denominated funds into Euros until the repatriation of funds during the 52 weeks to 24 February 2018. The loss does not represent an economic loss to the Group since there is an offset within other comprehensive income.
(i) Income from discontinued operations primarily relates to the release of a £340m provision relating to capital gains tax in respect of the disposal of the Group’s Korean operations, following completion of the tax assessment by Korean Tax Authorities. The Group also recognised a £6m gain from the revaluation of the potential capital gains tax liability in the discontinued operations in China. These gains were partially offset by a £(128)m net loss relating to the disposal of the Group’s Turkish operations and a £(2)m loss relating to costs associated with the disposal of the Korean business.
52 weeks ended 25 February 2017Profit/(loss) for the year included the following exceptional items:
Exceptional items included in:
Cost of sales
£m
Admin- istrative
expenses £m
Property- related
items £m
Total exceptional
items included within
operating profit
£m
Share of JV and associates profits/(losses)
£m
Finance costs
£mTaxation
£m
Exceptional items within
discontinued operations
£mNet restructuring and redundancy costs (153) (26) (20) (199) – – 39 –Net impairment (loss)/reversal of non-current assets and onerous lease provisions
25 – (31) (6) (54) – 20 –
Provision for customer redress (45) – – (45) – – – –Interchange settlement 57 – – 57 – – (11) –Amounts provided in relation to DPA and FCA obligations
– (235) – (235) – – – –
Property transactions – – 165 165 – – 50 –Insurance reserve adjustment – – – – (23) – – –Foreign exchange losses on GBP short-term investments held in overseas entities
– – – – – (244) – –
Exceptional items related to discontinued operations
– – – – – – – (75)
Total (116) (261) 114 (263) (77) (244) 98 (75)
93Tesco PLC Annual Report and Financial Statements 2018
Financial statements

Note 4 Exceptional items continuedCash flow statementThe table below shows the impact of exceptional items on the Group cash flow statement:
Cash flows from operating activities
Cash flows frominvesting activities
52 weeks 2018
£m
52 weeks 2017
£m
52 weeks 2018
£m
52 weeks 2017
£mPrior year restructuring costs and other exceptional costs including trading store redundancies(a) (56) (54) – –Current year restructuring costs and other exceptional costs including trading store redundancies(a) (67) (78) – –Utilisation of onerous lease provisions (93) (113) – –Property transactions(b) 9 36 (111) 490Property transactions – sale of investment in joint venture – – 19 –Provision for customer redress(c) (23) (28) – –Legal settlement – 57 – –DPA/compensation scheme payments (149) – – –VAT refund – HMRC court case(d) 160 – – –Proceeds from sale of investments – Lazada – – 196 –Proceeds from sale of opticians business – – 45 –Proceeds from sale of subsidiaries treated as discontinued(e) – – 26 –Exceptional cash flows from discontinued operations – 2 (5) –Total (219) (178) 170 490(a) Cash outflows on settlement of restructuring and redundancy costs.(b) Property transactions is made up of £78m proceeds from disposal of properties and £(180)m from property buy backs from the BLT Properties Limited joint venture, comprising £189m
paid for the properties acquired and £9m relating to working capital and cash acquired. Refer to footnote (g) on the previous page.(c) Settlement of claims for customer redress in Tesco Bank.(d) VAT recovered in relation to the appeal against HMRC regarding the treatment of VAT on Clubcard rewards. Refer to Note 25 for further details.(e) This relates to the disposal of the Group’s Turkish operations comprising £37m proceeds received and £11m cash disposed. Refer to Note 7 for further details.
Note 5 Finance income and costs
Continuing operations Notes
52 weeks 2018
£m
52 weeks2017
£mFinance incomeInterest receivable and similar income 75 48Financial instruments – fair value remeasurements 23 61Total finance income 98 109Finance costsGBP MTNs and Loans (207) (227)EUR MTNs (84) (114)USD Bonds (72) (93)Finance charges payable under finance leases and hire purchase contracts (8) (8)Other interest payable (62) (81)Capitalised interest 11 2 6Total finance costs before exceptional items and net pension finance costs (431) (517)Net pension finance costs 27 (162) (113)Foreign exchange losses on GBP short-term investments held in overseas entities 4 (38) (244)Total finance costs (631) (874)Net finance cost (533) (765)
Note 6 TaxationRecognised in the Group income statement
Continuing operations
52 weeks 2018
£m
52 weeks2017
£mCurrent tax (credit)/chargeUK corporation tax 143 70Overseas tax 118 111Adjustments in respect of prior years (29) 19 232 200Deferred tax (credit)/chargeOrigination and reversal of temporary differences 25 (43)Adjustments in respect of prior years* 49 (36)Change in tax rate – (34)
74 (113)Total income tax (credit)/charge 306 87* Adjustments in respect of prior years include a tax charge of £25m in relation to an adjustment to capital losses on property disposals classified as exceptional.
Tesco PLC Annual Report and Financial Statements 201894
Notes to the Group financial statements continued

Note 6 Taxation continued Recognised in the Group income statement continuedThe Finance Act 2016 included legislation to reduce the main rate of UK corporation tax from 20% to 19% from 1 April 2017 and to 17% from 1 April 2020. These rate reductions were substantively enacted by the balance sheet date and therefore included in these consolidated financial statements. Temporary differences have been remeasured using the enacted tax rates that are expected to apply when the liability is settled or the asset realised.
Reconciliation of effective tax charge52 weeks
2018 £m
52 weeks2017
£mProfit/(loss) before tax 1,298 145Tax credit/(charge) at 19.1% (2017: 20.0%) (248) (29)Effect of:
Non-qualifying depreciation (31) (33)Other non-taxable/(non-deductible) items(a) 10 (82)Unrecognised tax losses (27) (48)Property items taxed on a different basis to accounting entries(b) 25 77Banking surcharge tax (19) (17)Differences in overseas taxation rates 5 15Adjustments in respect of prior years (20) 17Share of losses of joint ventures and associates (1) (21)Change in tax rate – 34
Total income tax credit/(charge) (306) (87)Effective tax rate 23.6% 60.0%(a) This includes impairment reversals on assets not qualifying for tax relief as well as current year movements on uncertain tax positions and expenses not qualifying for tax relief. The prior year
included impairment and Deferred Prosecution Agreement (DPA) provisions not qualifying for tax relief.(b) This includes property items where the carrying values differ from their valuation for tax purposes and recognition of capital losses on property asset disposals.
Reconciliation of effective tax charge on APMs52 weeks
2018 £m
52 weeks2017
£mProfit/(loss) before tax before exceptional items 1,143 729Tax credit/(charge) at 19.1% (2017: 20.0%) (218) (146)Effect of:
Non-qualifying depreciation (31) (33)Other non-taxable/(non-deductible) items(a) (27) (50)Unrecognised tax losses (18) (14)Property items taxed on a different basis to accounting entries(b) 18 (1)Banking surcharge tax (19) (17)Differences in overseas taxation rates 5 (7)Adjustments in respect of prior years 5 39Share of losses of joint ventures and associates (1) (5)Change in tax rate – 49
Total income tax credit/(charge) before exceptional items (286) (185)Effective tax rate before exceptional items 25.0% 25.4%Net pension finance costs and fair value remeasurements 139 52Tax charge at 19.1% (2017: 20.0%) (26) (10)Change in tax rate 3 3Total income tax credit/(charge) before exceptional items, net pension finance costs and fair value remeasurements (309) (192)Effective tax rate before exceptional items, net pension finance costs and fair value remeasurements(c) 24.1% 24.6%(a) This includes current year movements on uncertain tax positions and expenses not qualifying for tax relief. The prior year also included impairment provisions not qualifying for tax relief.(b) This includes property items where the carrying values differ from their valuation for tax purposes and recognition of capital losses on property asset disposals.(c) The APM has been amended during the year to exclude the impact of fair value remeasurements on financial instruments. The information for the 52 weeks ended 25 February 2017 has
been amended accordingly. Refer to pages 150 to 153 for further details on the Group’s APMs.
Tax on items credited directly to the Group statement of changes in equity52 weeks
2018 £m
52 weeks2017
£mDeferred tax credit/(charge) on:
Share-based payments 6 2Total tax on items credited/(charged) to the Group statement of changes in equity 6 2
95Tesco PLC Annual Report and Financial Statements 2018
Financial statements

Note 6 Taxation continuedTax relating to components of the Group statement of comprehensive income/(loss)
52 weeks 2018
£m
52 weeks2017
£mCurrent tax credit/(charge) on:
Foreign exchange movements (9) (13)Deferred tax credit/(charge) on:
Pensions (554) 579 Fair value of movement on available-for-sale investments 10 (15)Fair value movements on cash flow hedges 21 5
Total tax on items credited/(charged) to Group statement of comprehensive income/(loss) (532) 556
Deferred taxThe following are the major deferred tax (liabilities)/assets recognised by the Group and movements thereon during the current and prior financial years measured using the tax rates that are expected to apply when the liability is settled or the asset realised based on the tax rates that have been enacted or substantively enacted by the balance sheet date:
Property- related
items(a)
£m
Retirementbenefit
obligation(c)
£m
Share-based payments
£m
Short-termtiming
differences £m
Tax losses£m
Financial instruments
£mTotal
£mAt 27 February 2016 (816) 563 6 143 50 (32) (86)(Charge)/credit to the Group income statement 162 (20) 14 (6) (41) 4 113(Charge)/credit to the Group statement of changes in equity – – 2 – – – 2(Charge)/credit to the Group statement of comprehensive income/(loss)
– 579 – – – (10) 569
Discontinued operations 18 – – – – – 18Business combinations – – – 1 – – 1Foreign exchange and other movements(b) (8) – 1 10 (1) – 2At 25 February 2017 (644) 1,122 23 148 8 (38) 619(Charge)/credit to the Group income statement (65) (14) 14 (1) (7) (1) (74)(Charge)/credit to the Group statement of changes in equity – – 6 – – – 6(Charge)/credit to the Group statement of comprehensive income/(loss)
– (554) – – – 31 (523)
Foreign exchange and other movements(b) (4) – – 2 – – (2)At 24 February 2018 (713) 554 43 149 1 (8) 26(a) Property-related items include a deferred tax liability on rolled over gains of £281m (2017: £277m) and deferred tax assets on capital losses of £119m (2017: £185m). The remaining balance
relates to accelerated tax depreciation. The Group does not expect a material reversal in the next financial year.(b) The deferred tax charge for foreign exchange and other movements is a £(2)m charge (2017: £2m credit) relating to the retranslation of deferred tax balances at the balance sheet date
and is included within currency translation differences in the Group statement of comprehensive income/(loss).(c) The deferred tax asset on retirement benefits is expected to reverse as additional funding contributions are made to the closed defined benefit scheme. Refer to Note 27.
Deferred tax assets and liabilities are offset when the Group has a legally enforceable right to do so. The following is the analysis of the deferred tax balances after offset:
2018 £m
2017 £m
Deferred tax assets 117 707Deferred tax liabilities (91) (88)
26 619
No deferred tax liability is recognised on temporary differences of £3.7bn (2017: £3.2bn) relating to the unremitted earnings of overseas subsidiaries and joint ventures as the Group is able to control the timing of the reversal of these temporary differences and it is probable that they will not reverse in the foreseeable future. The deferred tax on unremitted earnings at 24 February 2018 is estimated to be £216m (2017: £192m) which relates to taxes payable on repatriation and dividend withholding taxes levied by overseas tax jurisdictions. UK tax legislation relating to company distributions provides for exemption from tax for most repatriated profits, subject to certain exceptions.
Unrecognised deferred tax assetsDeferred tax assets in relation to continuing operations have not been recognised in respect of the following items because it is not probable that future taxable profits will be available against which the Group can utilise the benefits:
2018 £m
2017 £m
Deductible temporary differences 93 108Tax losses 217 202
310 310
As at 24 February 2018, the Group has unused trading tax losses from continuing operations of £913m (2017: £859m) available for offset against future profits. A deferred tax asset has been recognised in respect of £2m (2017: £45m) of such losses. No deferred tax asset has been recognised in respect of the remaining £911m (2017: £814m) due to the unpredictability of future profit streams. Included in unrecognised tax losses are losses of £13m that will expire by 2022 (2017: £18m in 2021) and £175m that will expire between 2023 and 2038 (2017: £92m between 2022 and 2037). Other losses will be carried forward indefinitely.
Tesco PLC Annual Report and Financial Statements 201896
Notes to the Group financial statements continued

Note 6 Taxation continuedCurrent taxWithin the Group current tax liability of £335m is £48m of capital gains tax liabilities that may arise in respect of the contribution of the Group’s China operations into a venture with China Resource Enterprises Limited in 2014. There are no other individually material provisions for uncertain tax positions.
Changes in tax law or its interpretation The Group operates in a number of territories which leads to the Group’s profits being subject to tax in many jurisdictions. We monitor income tax developments in these territories (which include the OECD Base Erosion and Profit Shifting (BEPS) initiative and European Union’s state aid investigations) which could affect the Group’s tax liabilities.
Note 7 Discontinued operations and non-current assets classified as held for sale Assets and liabilities of the disposal group and non-current assets classified as held for sale
24 February 2018
£m
25 February 2017
£mAssets of the disposal group – 198Non-current assets classified as held for sale 149 146Total assets of the disposal group and non-current assets classified as held for sale 149 344Total liabilities of the disposal group – (171)Total net assets of the disposal group and non-current assets classified as held for sale 149 173
The non-current assets classified as held for sale consist mainly of properties in the UK and Central Europe due to be sold within one year.
Discontinued operations On 10 June 2016, the Group announced the proposed sale of its 95.5% controlling interest in Tesco Kipa Kitle Pazarlama Ticaret Lojistik ve Gıda Sanayi A.Ş. (referred to as Turkish operations or Turkey) to Migros Ticaret A.Ş. (Migros). Local regulatory approval was granted on 9 February 2017 and the sale completed on 1 March 2017. In accordance with IFRS 5 ‘Non-current Assets Held for Sale and Discontinued Operations’, the Turkish operations for the period up to 1 March 2017 have been classified as a disposal group.
The tables below show the results of the discontinued operations which are included in the Group income statement and Group cash flow statement respectively.
Income statement52 weeks
2018(a)
£m
52 weeks2017
£mRevenue – 543Expenses(b) – (580)Profit/(loss) before tax before exceptional items – (37)Taxation – –Profit/(loss) after tax before exceptional items – (37)Net impairment (loss)/reversal of non-current assets – (99)Costs to sell and other provisions – Turkey – (3)Loss after tax on disposal of Turkish operations (128) –Net adjustments to profit/(loss) of past disposals(c) 344 27Total profit/(loss) after tax of discontinued operations(d) 216 (112)(a) These figures represent the income statement of Turkey for the current year and the net adjustments to profit/(loss) of past disposals of £344m. Refer to Note 4 for further details.(b) Intercompany recharges totalling £nil (2017: £2m) between continuing operations and the Turkey discontinued operation have been eliminated.(c) At 25 February 2017, the Group held a provision of £329m for potential additional capital gains tax relating to the disposal of the Group’s Korean operations. During the financial year, the
final tax assessment was received from the Korean Tax Authorities, confirming that no further capital gains tax is payable. As a result, the provision of £340m, after the impact of foreign exchange movements, has been released. The Group also recognised a £6m gain from the revaluation of the potential capital gains tax liability in the discontinued operations in China and a £(2)m loss relating to costs associated with the disposal of the Korean business. These amounts have been classified as exceptional items within ‘Exceptional items relating to discontinued operations’.
(d) Total profit/(loss) after tax of discontinued operations includes a loss of £nil attributable to non-controlling interests (2017: £(6)m).
97Tesco PLC Annual Report and Financial Statements 2018
Financial statements

Note 7 Discontinued operations and non-current assets classified as held for sale continuedIncome statement continuedThe loss after tax on disposal of the Group’s Turkish operations is made up as follows:
£mGross proceeds 37Deferred and contingent consideration 2Net proceeds 39Net book value of assets disposed:
Goodwill, software and other intangible assets (9)Property, plant and equipment (121)Inventories (43)Trade and other receivables (14)Cash and cash equivalents (11)Trade and other payables 88Borrowings 76Provisions 2Post-employment benefit obligation 5
Currency translation reserve recycled to the Group income statement (140)Taxation –Loss after tax of disposal of Turkish operations (128)
Earnings/(losses) per share impact from discontinued operations52 weeks
2018Pence/share
52 weeks2017
Pence/shareBasic 2.65 (1.30)Diluted 2.64 (1.30)
Cash flow statement52 weeks
2018£m
52 weeks2017
£mNet cash flows from operating activities – (20)Net cash flows from investing activities – 13Net cash flows from financing activities – 21Net cash flows from discontinued operations – 14Intra-Group funding and intercompany transactions – (2)Net cash flows from discontinued operations, net of intercompany – 12Net cash flows from disposal of subsidiary (11) –Net cash flows from discontinued operations, net of intercompany and disposal of subsidiary (11) 12
Note 8 Dividends2018 2017
Pence/share £m Pence/share £mAmounts recognised as distributions to owners in the financial year:Current financial year interim dividend 1.00 82 – –Dividends paid to equity owners in the financial year 1.00 82 – –
Current financial year proposed final dividend 2.00 195 – –
The proposed final dividend was approved by the Board of Directors on 10 April 2018 and is subject to the approval of shareholders at the Annual General Meeting. The proposed dividend has not been included as a liability as at 24 February 2018, in accordance with IAS 10 ‘Events after the reporting period’. It will be paid on 22 June 2018 to shareholders who are on the Register of members at close of business on 18 May 2018.
The Group has implemented a share forfeiture programme following the completion of a tracing and notification exercise to any shareholders who have not had contact with Tesco PLC (the Company) over the past 12 years, in accordance with the provisions set out in the Company’s Articles. £2m of unclaimed dividends in relation to these shares have been adjusted for in retained earnings. Refer to Note 28 for further details.
Tesco PLC Annual Report and Financial Statements 201898
Notes to the Group financial statements continued

Note 9 Earnings/(losses) per share and diluted earnings/(losses) per shareBasic earnings/(losses) per share amounts are calculated by dividing the profit/(loss) attributable to owners of the parent by the weighted average number of ordinary shares in issue during the financial year.
Diluted earnings/(losses) per share amounts are calculated by dividing the profit/(loss) attributable to owners of the parent by the weighted average number of ordinary shares in issue during the financial year adjusted for the effects of potentially dilutive share options. The dilutive effect is calculated on the full exercise of all potentially dilutive ordinary share options granted by the Group, including performance-based options which the Group considers to have been earned.
For the 52 weeks ended 24 February 2018 there were 27 million (2017: 20 million) potentially dilutive share options. As the Group has recognised a profit for the year from its continuing operations dilutive effects have been considered in calculating diluted earnings per share.
2018 2017
Basic
Potentially dilutive share
options Diluted Basic
Potentially dilutive share
options DilutedProfit/(loss) (£m)Continuing operations(a) 990 – 990 66 – 66Discontinued operations(b) 216 – 216 (106) – (106)Total 1,206 – 1,206 (40) – (40)Weighted average number of shares (millions) 8,165 27 8,192 8,148 20 8,168Earnings/(losses) per share (pence)Continuing operations 12.12 (0.04) 12.08 0.81 – 0.81Discontinued operations 2.65 (0.01) 2.64 (1.30) – (1.30)Total 14.77 (0.05) 14.72 (0.49) – (0.49)(a) Excludes profits/(losses) from non-controlling interests of £2m (2017: £(8)m).(b) Excludes profits/(losses) from non-controlling interests of £nil (2017: £(6)m).
APM: Earnings/(losses) per share from continuing operations before exceptional items, net pension finance costs and fair value remeasurements on financial instruments
Notes52 weeks
201852 weeks
2017Profit before tax from continuing operations before exceptional items (£m) 1,143 729Add: Net pension finance costs (£m) 5 162 113Less: Fair value remeasurements on financial instruments (£m) 5 (23) (61)Profit before tax from continuing operations before exceptional items, net pension finance costs and fair value remeasurements (£m)
1,282 781
Profit before tax from continuing operations before exceptional items, net pension finance costs and fair value remeasurements attributable to the owners of the parent (£m)
1,282 784
Taxation on profit from continuing operations before exceptional items, net pension finance costs and fair value remeasurements attributable to the owners of the parent (£m)
(309) (188)
Profit after tax from continuing operations before exceptional items, net pension finance costs and fair value remeasurements attributable to the owners of the parent (£m)
973 596
Basic weighted average number of shares (millions) 8,165 8,148Basic earnings per share from continuing operations before exceptional items, net pension finance costs and fair value remeasurements (pence)
11.92 7.31
Diluted weighted average number of shares (millions) 8,192 8,168Diluted earnings per share from continuing operations before exceptional items, net pension finance costs and fair value remeasurements (pence)
11.88 7.30
Diluted earnings per share from continuing operations before exceptional items, net pension finance costs and fair value remeasurements on financial instruments is a new APM. Refer to pages 150 to 153 for further details on the Group’s APMs.
99Tesco PLC Annual Report and Financial Statements 2018
Financial statements

Note 10 Goodwill, software and other intangible assets
Goodwill £m
Software(a)
£m
Other intangible
assets£m
Total£m
CostAt 25 February 2017 2,426 2,971 363 5,760Foreign currency translation 28 21 2 51Additions – 180 15 195Acquired through business combinations 4 2 2 8Reclassification – 10 13 23Disposals – (18) (3) (21)At 24 February 2018 2,458 3,166 392 6,016Accumulated amortisation and impairment lossesAt 25 February 2017 634 2,092 317 3,043Foreign currency translation 28 17 1 46Charge for the year – 208 11 219Impairment losses – 28 – 28Reversal of impairment losses – – (4) (4)Reclassification(b) – 47 (8) 39Disposals – (14) (2) (16)At 24 February 2018 662 2,378 315 3,355
Net carrying valueAt 24 February 2018 1,796 788 77 2,661At 25 February 2017 1,792 879 46 2,717
Goodwill £m
Software(a)
£m
Other intangible
assets£m
Total£m
CostAt 27 February 2016 2,517 2,861 372 5,750Foreign currency translation 71 28 5 104Additions – 156 5 161Reclassification – (15) 2 (13)Disposals (123) (43) (10) (176)Transfer to disposal group classified as held for sale (39) (16) (11) (66)At 25 February 2017 2,426 2,971 363 5,760Accumulated amortisation and impairment lossesAt 27 February 2016 690 1,886 300 2,876Foreign currency translation 36 21 2 59Charge for the year – 216 29 245Impairment losses 46 5 3 54Reversal of impairment losses – (1) – (1)Reclassification – 12 (12) –Disposals (99) (34) (1) (134)Transfer to disposal group classified as held for sale (39) (13) (4) (56)At 25 February 2017 634 2,092 317 3,043(a) Software includes £395m of internally generated development costs (2017: £422m).(b) Reclassification includes amounts related to impairment losses and reversals booked in the year, comprising a £34m reduction to the impairment loss in Software and a £1m increase
to the impairment reversal in Other intangible assets. The offsetting £(35)m has been reclassified to property, plant and equipment as per Note 11.
Impairment of goodwillThe goodwill balances, discount rates and long-term growth rates for each group of cash-generating units are shown below:
Balances £mPre-tax
discount ratesPost-tax
discount ratesLong-term
growth rates2018 2017 2018 2017 2018 2017 2018 2017
Tesco Bank 802 802 10.6% 12.0% 8.0% 9.1% 2.5% 3.0%UK 735 735 8.9% 9.3% 7.2% 7.5% 2.1% 2.0%Thailand 180 181 9.3% 10.0% 7.5% 8.0% 2.2% 2.7%Malaysia 75 74 11.6% 12.4% 8.8% 9.4% 3.2% 2.3%ROI 4 – 8.3% – 7.3% – 1.8% –
1,796 1,792
Goodwill arising on business combinations is not amortised but is reviewed for impairment on an annual basis, or more frequently if there are indications that goodwill may be impaired. Goodwill acquired in a business combination is allocated to groups of cash-generating units according to the level at which management monitor that goodwill.
Tesco PLC Annual Report and Financial Statements 2018100
Notes to the Group financial statements continued

Note 10 Goodwill, software and other intangible assets continuedImpairment of goodwill continuedImpairment reviews were performed by comparing the carrying value of goodwill with the recoverable amount of the cash-generating units to which goodwill has been allocated. Recoverable amounts for cash-generating units are the higher of fair value less costs of disposal, and value in use. The key estimates for the value in use calculations are those regarding discount rates and expected changes to future cash flows.
Management estimates discount rates using pre-tax rates that reflect the current market assessment of the time value of money and the risks specific to the cash-generating units. The pre-tax discount rates used to calculate value in use are derived from the Group’s post-tax weighted average cost of capital, as adjusted for the specific risks relating to each cash-generating unit.
Cash flow projections are based on the Group’s three year internal forecasts, the results of which are reviewed by the Board. Estimates of selling prices and direct costs are based on past experience and expectations of future changes in the market. The forecasts are extrapolated to five years based on management’s expectations, and beyond five years based on estimated long-term average growth rates as shown above. These long-term growth rates for the Retail business are based on inflation forecasts by recognised bodies. The long-term growth rate for Tesco Bank is based on inflation and GDP growth forecasts by recognised bodies.
The Group has carried out a sensitivity analysis on the impairment tests of each group of cash-generating units to which goodwill has been allocated, using various reasonably possible scenarios based on recent market movements. Neither a one percentage point increase in discount rates nor a one percentage point decrease in year one sales growth would indicate impairment in any group of cash-generating units. This outcome includes Malaysia, which was disclosed as sensitive in the prior year.
Impairment of software and other intangible assetsA net impairment loss of £24m (£28m losses offset by £4m reversal) has been recognised against software and other intangible assets as part of the impairment review discussed in Note 11. The net loss of £24m has been included within exceptional items, classified as ‘Net impairment reversal of non-current assets and onerous lease provisions’ within cost of sales.
Note 11 Property, plant and equipmentLand and buildings
£mOther(a)
£mTotal
£mCostAt 25 February 2017 22,690 10,681 33,371Foreign currency translation 312 116 428Additions(b)(c) 819 481 1,300Reclassification (83) (49) (132)Classified as held for sale (146) (21) (167) Disposals (139) (299) (438)At 24 February 2018 23,453 10,909 34,362Accumulated depreciation and impairment lossesAt 25 February 2017 7,095 8,168 15,263Foreign currency translation 121 97 218Charge for the year 470 605 1,075Impairment losses 44 44 88Reversal of impairment losses (268) (7) (275)Reclassification(d) (147) 100 (47)Classified as held for sale (92) (11) (103)Disposals (107) (271) (378)At 24 February 2018 7,116 8,725 15,841
Net carrying value(e)
At 24 February 2018 16,337 2,184 18,521At 25 February 2017 15,595 2,513 18,108
Construction in progress included above(f)
At 24 February 2018 68 57 125At 25 February 2017 57 66 123(a) Other assets consist of fixtures and fittings with a net carrying value of £1,752m (2017: £2,023m), office equipment with a net carrying value of £116m (2017: £161m) and motor vehicles
with a net carrying value of £316m (2017: £329m).(b) Includes £2m (2017: £6m) in respect of interest capitalised, principally relating to land and building assets. The capitalisation rate used to determine the amount of finance costs
capitalised during the financial year was 4.5% (2017: 4.9%). Interest capitalised is deducted in determining taxable profit in the financial year in which it is incurred.(c) Includes £189m net payment relating to the purchase of seven stores from a joint venture with British Land, which is a related party transaction. Refer to Note 4 for further details
of the unwind of the joint venture with British Land.(d) Reclassification includes amounts related to impairment losses and reversals booked in the year, comprising a £(199)m reduction to the net impairment reversal in Land and Buildings
and a £164m reduction to the net impairment losses in Other assets. The offsetting £35m has been reclassified to Software and Other intangible assets as per Note 10.(e) Includes £786m (2017: £788m) of assets pledged as security for secured bonds and £509m (2017: £411m) of property held as security in favour of the Tesco PLC Pension Scheme.
Refer to Notes 21 and 27.(f) Construction in progress does not include land.
Assets held under finance leasesNet carrying value includes assets held under finance leases, which are analysed below. These assets are pledged as security for the finance lease liabilities.
2018 2017Land and buildings
£mOther
£m
Land and buildings
£mOther
£mNet carrying value 75 32 66 27
101Tesco PLC Annual Report and Financial Statements 2018
Financial statements

Note 11 Property, plant and equipment continued Land and buildingsThe net carrying value of land and buildings comprises:
2018£m
2017£m
Freehold 13,779 13,175Long leasehold – 50 years or more 412 404Short leasehold – less than 50 years 2,146 2,016Net carrying value 16,337 15,595
Land and buildings
£mOther(a)
£mTotal
£mCostAt 27 February 2016 22,557 10,468 33,025Foreign currency translation 727 327 1,054Additions(b) 816 579 1,395Reclassification (103) 58 (45)Classified as held for sale (316) (6) (322)Disposals (674) (594) (1,268)Transfer to disposal group classified as held for sale (317) (151) (468)At 25 February 2017 22,690 10,681 33,371Accumulated depreciation and impairment lossesAt 27 February 2016 7,198 7,927 15,125 Foreign currency translation 258 239 497Charge for the year 419 639 1,058Impairment losses 246 27 273Reversal of impairment losses (246) (33) (279)Reclassification (58) 11 (47)Classified as held for sale (137) (1) (138)Disposals (353) (539) (892)Transfer to disposal group classified as held for sale (232) (102) (334)At 25 February 2017 7,095 8,168 15,263(a)–(b) Refer to previous page for footnotes.
Impairment of property, plant and equipment The Group has determined that for the purposes of impairment testing each store is a cash-generating unit. Cash-generating units are tested for impairment if there are indicators of impairment at the balance sheet date. Recoverable amounts for cash-generating units are the higher of fair value less costs of disposal, and value in use.
The key estimates for the value in use calculations are those regarding discount rates and expected changes to future cash flows.
Management estimates discount rates using pre-tax rates that reflect the current market assessment of the time value of money and the risks specific to the cash-generating units. The discount rates are derived from the Group’s post-tax weighted average cost of capital, as adjusted for the specific risks relating to each geographical region and range from 7% to 12% (2017: 9% to 13%). On a post-tax basis, the discount rates range from 5% to 9% (2017: 7% to 10%).
Cash flow projections are based on the Group’s three year internal forecasts, the results of which are reviewed by the Board. Estimates of selling prices and direct costs are based on past experience and expectations of future changes in the market. The forecasts are extrapolated to five years based on management’s expectations, and beyond five years based on long-term average growth rates, which are derived from inflation forecasts by recognised bodies. These long-term average growth rates range from 1% to 4% (2017: 1% to 3%).
Fair values are determined with regard to the market rent for the stores or for alternative uses with investment yields appropriate to reflect the physical characteristics of the property, location, infrastructure, redevelopment potential and other factors. In some cases, fair values include residual valuations where stores may be viable for redevelopment. The key inputs to the valuation are the potential market rents and yields, both of which are largely based on rentals and yields for similar properties in that location. Fair values for the Group’s properties were determined with the assistance of independent, professional valuers where appropriate.
The net carrying value of £18,521m (2017: £18,108m) on the previous page comprises £14,056m (2017: £13,338m) of unimpaired assets and £4,465m (2017: £4,770m) of impaired assets. Of the impaired assets, £1,795m (2017: £2,196m) carrying value was supported by value in use and £2,670m (2017: £2,574m) was supported by fair value. Due to the individual nature of each property, these fair values are classified as Level 3 within the fair value hierarchy.
The total net impairment reversal of £187m (£275m reversal offset by £88m losses) largely reflects normal fluctuations expected from store level performance, property fair values and changes in discount rates. These losses and reversals have been largely presented net at a country level to reflect the underlying trends in the businesses. The impairment reversal of £275m (2017: £279m) relates to properties in the UK & ROI of £154m (2017: £118m), Central Europe of £112m (2017: £158m) and Asia of £9m (2017: £3m), while the impairment losses of £88m (2017: £167m) relate to properties in the UK & ROI of £50m (2017: £12m), Central Europe of £6m (2017: £121m) and Asia of £32m (2017: £34m).
Of the £187m net reversal, a £183m reversal within exceptional items related to trading stores has been classified as ‘Net impairment reversal of non-current assets and onerous lease provisions’ within cost of sales. In addition, a £1m loss within exceptional items related to closed stores has been classified as ‘Net impairment reversal of non-current assets and onerous lease provisions’ within profits/(losses) arising on property-related items. A further £3m loss within exceptional items related to the unwind of the Group’s joint venture with British Land has been classified as ‘Property transactions’ within profits/(losses) arising on property-related items. The remaining £8m reversal was not included within exceptional items as it relates to the Group’s day to day management of the property portfolio.
Tesco PLC Annual Report and Financial Statements 2018102
Notes to the Group financial statements continued

Note 11 Property, plant and equipment continued Impairment of property, plant and equipment continuedThe prior year net impairment reversal of £6m included an impairment loss of £106m relating to the Group’s decision to sell its Turkish operations, which was classified as an exceptional item relating to discontinued operations. Of the £112m net reversal relating to continuing operations, a £134m reversal was included within exceptional items, which related to trading stores and was classified as ‘Net impairment of non-current assets and onerous lease provisions’ within cost of sales. In addition, a £30m charge within exceptional items related to construction in progress and closed stores, which was classified as ‘Net impairment of non-current assets and onerous lease provisions’ within profits/(losses) arising on property-related items. The remaining £8m reversal was not included within exceptional items as it related to the Group’s day to day management of the property portfolio.
The Group has carried out a sensitivity analysis on the impairment tests for its trading stores portfolio using various reasonably possible scenarios based on recent market movements. An increase of one percentage point in the discount rates for each geographic region would increase impairment by £232m. A decrease of one percentage point would decrease impairment by £239m. Neither a one percentage point increase nor decrease in year one sales growth would result in a material change to impairment.
Note 12 Investment property2018
£m2017
£mCostAt the beginning of the year 171 170Foreign currency translation 5 7Additions 1 –Reclassification 123 56Classified as held for sale (58) (25)Disposals (34) (37)At the end of the year 208 171Accumulated depreciation and impairment lossesAt the beginning of the year 107 92Foreign currency translation 4 6Charge for the year 1 1Impairment losses for the year 1 3Reversal of impairment losses for the year (5) (4)Reclassification 23 45Classified as held for sale (3) (12)Disposals (20) (24)At the end of the year 108 107Net carrying value at the end of the year 100 64
The estimated fair value of the Group’s investment property is £0.2bn (2017: £0.2bn). This fair value has been determined by applying an appropriate rental yield to the rentals earned by the investment property. A valuation has not been performed by an independent valuer.
Of the £4m net reversal, a £3m reversal within exceptional items has been classified as ‘Net impairment of non-current assets and onerous lease provisions’ included within profits/(losses) arising on property-related items.
Note 13 Group entitiesThe Group consists of the ultimate Parent Company, Tesco PLC, and a number of subsidiaries, joint ventures and associates held directly or indirectly by Tesco PLC. See pages 140 to 145 for a complete list of Group entities.
SubsidiariesThe accounting year ends of the subsidiaries consolidated in these financial statements are on or around 24 February 2018.
Consolidated structured entitiesThe Group has a number of securitisation structured entities established in connection with Tesco Bank’s credit card securitisation transactions. Although none of the equity of these entities is owned by the Group, the Group has rights to variable returns from its involvement with these entities and has the ability to affect those returns through its power over them under contractual agreements. As such these entities are effectively controlled by the Group, and are therefore accounted for as subsidiaries of the Group.
These entities have financial year ends of 31 December. The management accounts of these entities are used to consolidate the results to 24 February 2018 within these financial statements.
Unconsolidated structured entitiesIn prior years, the Group sponsored a number of structured entities. The Group led the formation of the entities and its name appears in the name of the entities and/or on the debt issued by the entities. The structured entities were set up to finance property purchases by some of the UK property joint ventures in which the Group typically holds a 50% equity interest. The structured entities obtain debt financing from third party investors and lend the funds to these joint ventures, who use the funds to purchase the properties.
The liabilities of the UK property joint ventures include the loans from these structured entities. The Group’s exposure to the structured entities is limited to the extent of the Group’s interests in the joint ventures. The liabilities of the structured entities are non-recourse to the Group.
The Group concluded that it does not control, and therefore should not consolidate, these structured entities since it does not have power over the relevant activities of the structured entities, or exposure to variable returns from these entities.
103Tesco PLC Annual Report and Financial Statements 2018
Financial statements

Note 13 Group entities continuedInterests in joint ventures and associatesPrincipal joint ventures and associatesThe Group’s principal joint ventures and associates are:
Nature of relationship Business activity
Share of issued share capital,
loan capital and debt securities
Country of incorporation Principal area of operation
Gain Land Limited Associate Retail 20% British Virgin Islands People’s Republic of China/Hong Kong
Included in ‘UK property joint ventures’:The Tesco Coral Limited Partnership Joint venture Property investment 50% England United KingdomThe Tesco Blue Limited Partnership Joint venture Property investment 50% England United KingdomThe Tesco Atrato Limited Partnership Joint venture Property investment 50% England United KingdomThe Tesco Passaic Limited Partnership Joint venture Property investment 50% England United KingdomThe Tesco Navona Limited Partnership Joint venture Property investment 50% England United KingdomThe Tesco Sarum Limited Partnership Joint venture Property investment 50% England United KingdomThe Tesco Dorney Limited Partnership Joint venture Property investment 50% England United KingdomThe Tesco Property (No. 2) Limited Partnership Joint venture Property investment 50% Jersey United Kingdom
Included in ‘Other joint ventures and associates’:Tesco Mobile Limited Joint venture Telecommunications 50% England United KingdomTesco Underwriting Limited Joint venture Insurance 49.9% England United KingdomTrent Hypermarket Limited Joint venture Retail 50% India IndiaTesco Lotus Retail Growth Freehold and Leasehold Property Fund
Associate Property investment 25% Thailand Thailand
The accounting period end dates of the joint ventures and associates consolidated in these financial statements range from 31 December 2017 to 28 February 2018. The accounting period end dates for joint ventures differ from those of the Group for commercial reasons and depend upon the requirements of the joint venture partner as well as those of the Group. The accounting period end dates of the associates are different from those of the Group as they depend upon the requirements of the parent companies of those entities.
There are no significant restrictions on the ability of joint ventures and associates to transfer funds to the parent, other than those imposed by the Companies Act 2006, and for Tesco Underwriting Limited, regulatory capital requirements.
The UK property joint ventures involve the Group partnering with third parties in carrying out some property investments in order to enhance returns from property and access funding, while reducing risks associated with sole ownership. These property investments generally cover shopping centres and standalone stores. The Group enters into operating leases for some or all of the properties held in the joint ventures. These leases provide the Group with some rights over alterations and adjacent land developments. Some leases also provide the Group with options to purchase the other joint venturers’ equity stakes at a future point in time. In some cases the Group has the ability to substitute properties in the joint ventures with alternative properties of similar value, subject to strict eligibility criteria. In other cases, the Group carries out property management activities for third party rentals of shopping centre units.
The property investment activities are carried out in separate entities, usually partnerships or limited liability companies. The Group has assessed its ability to direct the relevant activities of these entities and impact Group returns and concluded that the entities qualify as joint ventures since decisions regarding them require the unanimous consent of both equity holders. This assessment included not only rights within the joint venture agreements, but also any rights within other contractual arrangements between the Group and the entities.
The Group made a number of judgements in arriving at this determination, the key ones being:
– since the provisions of the joint venture agreements require the relevant decisions impacting investor returns to be either unanimously agreed by both joint venturers at the same time, or in some cases to be agreed sequentially by each venturer at different stages, there is joint decision making within the joint venture;
– since the Group’s leases are priced at fair value, and any rights embedded in the leases are consistent with market practice, they do not provide the Group with additional control over the joint ventures or infer an obligation by the Group to fund the settlement of liabilities of the joint ventures;
– any options to purchase the other joint venturers’ equity stakes are priced at market value, and only exercisable at future dates, hence they do not provide control to the Group at the current time;
– where the Group has a right to substitute properties in the joint ventures, the rights are strictly limited and are at fair value, hence do not provide control to the Group; and
– where the Group carries out property management activities for third party rentals in shopping centres, these additional activities are controlled through joint venture agreements or lease agreements, and do not provide the Group with additional powers over the joint venture.
Tesco PLC Annual Report and Financial Statements 2018104
Notes to the Group financial statements continued

Note 13 Group entities continued Summarised financial information for joint ventures and associates The summarised financial information below reflects the amounts presented in the financial statements of the relevant joint ventures and associates, and not the Group’s share of those amounts. These amounts have been adjusted to conform to the Group’s accounting policies where required. The summarised financial information for UK property joint ventures has been aggregated in order to provide useful information to users without excessive detail since these entities have similar characteristics and risk profiles largely based on their nature of activities and geographic market.
UK property joint ventures Gain Land Limited
2018£m
2017£m
12 months to Dec 2017
£m
12 months to Dec 2016
£mSummarised balance sheetNon-current assets(a) 3,851 4,060 3,924 4,172Current assets (excluding cash and cash equivalents) 92 99 1,801 2,231Cash and cash equivalents 37 48 414 631Current liabilities(b) (304) (301) (5,318) (6,232)Non-current liabilities(b) (4,561) (4,831) (409) (169)Net assets/(liabilities)(c) (885) (925) 412 633
Summarised income statementRevenue 280 292 9,097 9,081Profit/(loss) after tax – – (230) (626)
Reconciliation to carrying amounts: Opening balance – – 433 511Additions/(disposals) – – – – Foreign currency translation – – (21) 47Share of profits/(losses)(d) 12 14 (46) (125)Dividends received from joint ventures and associates (12) (14) – – Deferred profits offset against carrying amounts(e) – – – – Closing balance – – 366 433
Group’s share in ownership 50% 50% 20% 20%Group’s share of net assets/(liabilities) (443) (463) 82 127Goodwill(c) – – 284 306Deferred property profits offset against carrying amounts(e) (61) (63) – – Cumulative unrecognised losses(d)(f) 168 175 – – Cumulative unrecognised hedge reserves(d)(f) 336 351 – – Carrying amount – – 366 433(a) The non-current asset balances of UK property joint ventures are reflected at historic depreciated cost to conform to the Group’s accounting policies. The aggregate fair values
in the financial statements of the UK property joint ventures are £4,983m (2017: £5,242m).(b) The current and non-current liabilities of UK property joint ventures largely comprise loan balances of £3,892m (2017: £4,121m) and derivative swap balances of £672m (2017: £703m)
entered into to hedge the cash flow variability exposures of the joint ventures. (c) The December 2016 comparative summarised balance sheet for Gain Land Limited (Gain Land) has been updated to reflect £353m impairment of net assets within Gain Land. Tesco’s
20% share of this impairment was previously recorded as an impairment of the goodwill inherent within Tesco’s investment in Gain Land.(d) The share of profit for the year for UK property joint ventures related to £12m dividends received from joint ventures with £nil carrying amounts. £5m of losses and £7m of increases in
the fair values of derivatives arising from these entities have been included in cumulative unrecognised losses and cumulative unrecognised hedge reserves respectively.(e) Deferred profits that arose from the transfer of properties into the UK property joint ventures have been offset against the carrying amounts of the related joint ventures. £2m relating
to BLT Properties Limited has been released during the year as a result of the joint venture being wound up on 6 April 2017.(f) Cumulative unrecognised losses of £24m and cumulative unrecognised hedge reserves of £8m were disposed of relating to BLT Properties Limited.
At 24 February 2018, the Group has £104m (2017: £103m) loans to UK property joint ventures and £nil (2017: £nil) to Gain Land.
Other joint ventures and associatesThe Group also has interests in a number of other joint ventures and associates, excluding UK property joint ventures and Gain Land. These are not considered to be individually material to the Group.
Joint ventures Associates2018
£m2017
£m2018
£m2017
£mAggregate carrying amount of other joint ventures and associates 262 245 61 61Group’s share of profits/(losses) for the year 17 (7) 11 11
105Tesco PLC Annual Report and Financial Statements 2018
Financial statements

Note 13 Group entities continued ImpairmentManagement has performed impairment tests and sensitivity analysis on its investments in Gain Land, Trent Hypermarket Limited and Tesco Underwriting Limited. The carrying values of Trent Hypermarket Limited of £98m (2017: £112m) and Tesco Underwriting Limited of £90m (2017: £71m) are included within ‘Other joint ventures and associates’ as discussed on the previous page.
The recoverable values of these investments were estimated taking into account forecast cash flows, equity valuations of comparable entities and/or recent transactions for comparable businesses. No impairment was recognised in the year for these investments. The Group has performed sensitivity analysis on the impairment tests for these investments. A reasonably possible increase of one percentage point in the discount rate, based on recent market movements, would not indicate impairment in Gain Land or Tesco Underwriting Limited. An increase in the discount rate by one percentage point would not result in a material impairment to the carrying value of Trent Hypermarket Limited.
Future changes in estimated cash flows, discount rates, competitive landscape, retail market conditions and other factors may result in impairment losses or reversals of impairment in future periods.
Note 14 Other investments2018
£m2017
£mLoans receivable – 13Available-for-sale financial assets 928 1,094Total other investments 928 1,107Of which:Current 68 284Non-current 860 823
928 1,107
On 30 June 2017, the Group disposed of its 8.8% shareholding in Lazada for net cash consideration of $254m (£196m). Refer to Note 31 for further details.
Note 15 Inventories2018
£m2017
£mGoods held for resale 2,259 2,276Development properties 4 25
2,263 2,301
Goods held for resale are net of commercial income. Refer to Note 20.
Note 16 Trade and other receivables2018
£m2017
£mTrade receivables 466 490Prepayments 317 322Accrued income 261 207Other receivables 459 483Amounts owed by joint ventures and associates (Note 29) 165 153Total trade and other receivables 1,668 1,655Of which:Current 1,482 1,475Non-current 186 180
1,668 1,655
Trade and other receivables include commercial income. Refer to Note 20.
Trade and other receivables are generally non interest-bearing. Credit terms vary by country and the nature of the debt, ranging from 7 to 60 days.
At 24 February 2018, trade and other receivables of £13m (2017: £16m) were past due and impaired. The gross amount of trade and other receivables was £56m (2017: £68m) with a provision of £43m (2017: £52m).
The ageing analysis of these receivables is as follows: 2018
£m2017
£mUp to three months past due – –Three to six months past due 2 3Over six months past due 11 13
13 16
Tesco PLC Annual Report and Financial Statements 2018106
Notes to the Group financial statements continued

Note 16 Trade and other receivables continuedAt 24 February 2018, trade and other receivables of £95m (2017: £130m) were past due but not impaired. The ageing analysis of these receivables is as follows:
2018 £m
2017 £m
Up to three months past due 83 119Three to six months past due 9 10Over six months past due 3 1
95 130
No receivables have been renegotiated in the current or prior financial years.
Note 17 Loans and advances to customersTesco Bank has loans and advances to customers, as follows:
2018 £m
2017 £m
Current 4,637 4,166Non-current 6,885 5,795
11,522 9,961
The maturity of these loans and advances is as follows:
2018 £m
2017 £m
Repayable on demand or at short notice 4 3Within three months 4,604 4,107Greater than three months but less than one year 147 155Greater than one year but less than five years 2,633 2,419After five years 4,372 3,471
11,760 10,155Provision for impairment of loans and advances (238) (194)
11,522 9,961
At 28 February 2018, £3.5bn (2017: £2.5bn) of the credit card portfolio had its beneficial interest assigned to a securitisation structured entity, Delamare Cards Receivables Trustee Limited, for use as collateral in securitisation transactions. The total encumbered portion of this portfolio is £1.6bn (2017: £1.9bn).
At 28 February 2018, Delamare Cards MTN Issuer plc had £2.4bn (2017: £1.8bn) notes in issue in relation to securitisation transactions, of which £1.0bn (2017: £0.8bn) was externally issued. The Group owned £1.1bn (2017: £0.8bn) class A Credit Card backed notes and £0.3bn (2017: £0.2bn) class D Credit Card backed notes.
Of the total £1.1bn (2017: £0.8bn) class A notes, £0.3bn (2017: £0.6bn) is held in a distinct pool for the purposes of collateralising the Bank of England’s Term Funding Scheme drawings. All other prepositioned assets with the Bank of England are held within their single collateral pool.
Provision for impairment of loans and advances£m
At 27 February 2016 (154)Increase in allowance, net of recoveries, charged to the Group income statement (103)Amounts written off 60Unwinding of discount 3At 25 February 2017 (194)Increase in allowance, net of recoveries, charged to the Group income statement (134)Amounts written off 87Unwinding of discount 3At 24 February 2018 (238)
Note 18 Cash and cash equivalents and short-term investmentsCash and cash equivalents
2018 £m
2017 £m
Cash at bank and in hand 3,580 3,498Short-term deposits 479 323
4,059 3,821
Short-term investments2018
£m2017
£mMoney market funds 1,029 2,727
Included in cash and cash equivalents is an amount of £777m (2017: £777m) that was set aside at the balance sheet date for completion of the merger with Booker Group PLC. This cash was invested at a floating rate of interest, held in ring-fenced accounts and was not available to the Group. The merger was completed on 5 March 2018, with £766m being paid on completion. Refer to Note 35 for further details on the Booker Group merger.
107Tesco PLC Annual Report and Financial Statements 2018
Financial statements

Note 19 Trade and other payables2018
£m2017
£mTrade payables 5,416 4,914Other taxation and social security 334 310Other payables 1,947 2,422Amounts payable to joint ventures and associates (Note 29) 20 17Accruals and deferred income 1,643 1,536Total trade and other payables 9,360 9,199Of which: Current 8,996 8,875Non-current 364 324
9,360 9,199
Trade and other payables are net of commercial income. Refer to Note 20.
Note 20 Commercial incomeBelow are the commercial income balances included within inventories and trade and other receivables, or netted against trade and other payables. Amounts received in advance of income being earned are included in accruals and deferred income.
2018 £m
2017 £m
Current assetsInventories (69) (75)Trade and other receivables
Trade/other receivables 169 215Accrued income 186 150
Current liabilitiesTrade and other payables
Trade payables 199 213Accruals and deferred income (7) (22)
Note 21 BorrowingsCurrent
Par value Maturity2018
£m2017
£mBank loans and overdrafts – – 351 912Loans from joint ventures (Note 29) – – 6 6LIBOR + 0.5% Term Loan £488m Oct 2017 – 4841.250% MTN €500m Nov 2017 – 4235.5% USD Bond $850m Nov 2017 – 7095.2% Tesco Bank Retail Bond £125m Aug 2018 126 –3.375% MTN €750m Nov 2018 667 –LIBOR + 0.65% Tesco Bank Bond(a) £300m Apr 2020 300 –5.5457% Secured Bond(b)(c) £350m Feb 2029 17 15Finance leases (Note 34) – – 12 11
1,479 2,560
Tesco PLC Annual Report and Financial Statements 2018108
Notes to the Group financial statements continued
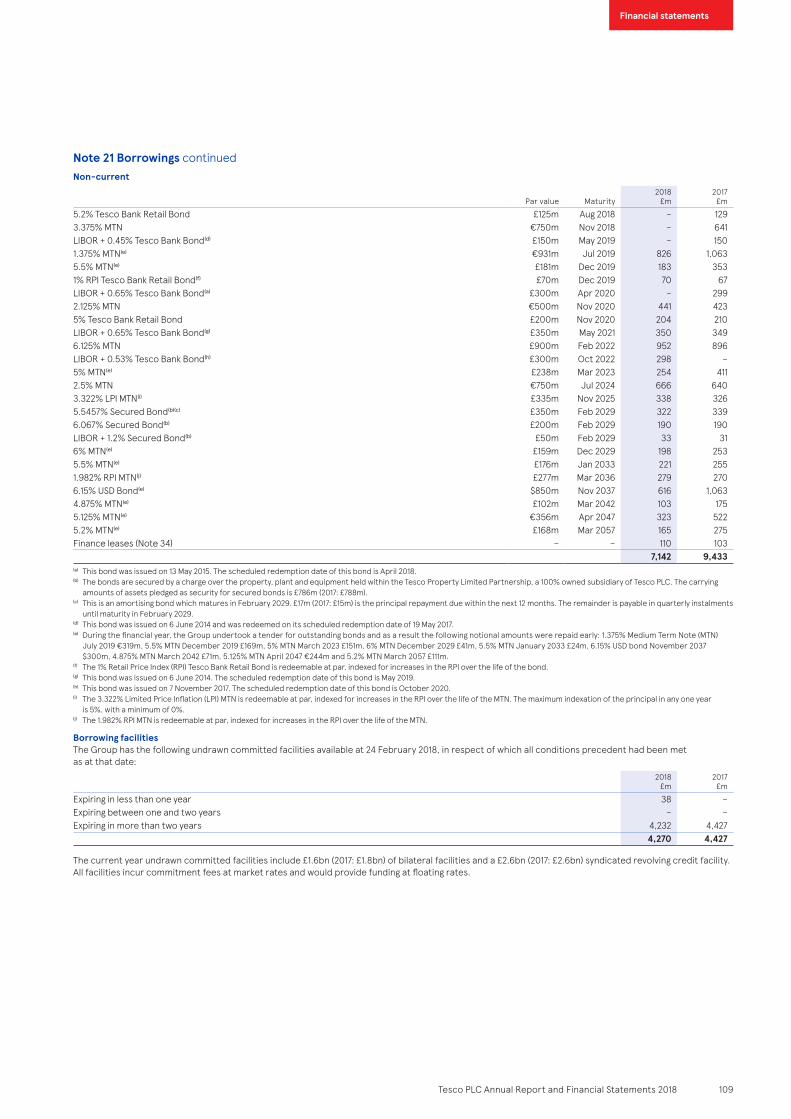
Note 21 Borrowings continued Non-current
Par value Maturity2018
£m2017
£m5.2% Tesco Bank Retail Bond £125m Aug 2018 – 1293.375% MTN €750m Nov 2018 – 641LIBOR + 0.45% Tesco Bank Bond(d) £150m May 2019 – 1501.375% MTN(e) €931m Jul 2019 826 1,0635.5% MTN(e) £181m Dec 2019 183 3531% RPI Tesco Bank Retail Bond(f) £70m Dec 2019 70 67LIBOR + 0.65% Tesco Bank Bond(a) £300m Apr 2020 – 2992.125% MTN €500m Nov 2020 441 4235% Tesco Bank Retail Bond £200m Nov 2020 204 210LIBOR + 0.65% Tesco Bank Bond(g) £350m May 2021 350 3496.125% MTN £900m Feb 2022 952 896LIBOR + 0.53% Tesco Bank Bond(h) £300m Oct 2022 298 –5% MTN(e) £238m Mar 2023 254 4112.5% MTN €750m Jul 2024 666 6403.322% LPI MTN(i) £335m Nov 2025 338 3265.5457% Secured Bond(b)(c) £350m Feb 2029 322 3396.067% Secured Bond(b) £200m Feb 2029 190 190LIBOR + 1.2% Secured Bond(b) £50m Feb 2029 33 316% MTN(e) £159m Dec 2029 198 2535.5% MTN(e) £176m Jan 2033 221 2551.982% RPI MTN(j) £277m Mar 2036 279 2706.15% USD Bond(e) $850m Nov 2037 616 1,0634.875% MTN(e) £102m Mar 2042 103 1755.125% MTN(e) €356m Apr 2047 323 5225.2% MTN(e) £168m Mar 2057 165 275Finance leases (Note 34) – – 110 103
7,142 9,433(a) This bond was issued on 13 May 2015. The scheduled redemption date of this bond is April 2018.(b) The bonds are secured by a charge over the property, plant and equipment held within the Tesco Property Limited Partnership, a 100% owned subsidiary of Tesco PLC. The carrying
amounts of assets pledged as security for secured bonds is £786m (2017: £788m).(c) This is an amortising bond which matures in February 2029. £17m (2017: £15m) is the principal repayment due within the next 12 months. The remainder is payable in quarterly instalments
until maturity in February 2029. (d) This bond was issued on 6 June 2014 and was redeemed on its scheduled redemption date of 19 May 2017.(e) During the financial year, the Group undertook a tender for outstanding bonds and as a result the following notional amounts were repaid early: 1.375% Medium Term Note (MTN)
July 2019 €319m, 5.5% MTN December 2019 £169m, 5% MTN March 2023 £151m, 6% MTN December 2029 £41m, 5.5% MTN January 2033 £24m, 6.15% USD bond November 2037 $300m, 4.875% MTN March 2042 £71m, 5.125% MTN April 2047 €244m and 5.2% MTN March 2057 £111m.
(f) The 1% Retail Price Index (RPI) Tesco Bank Retail Bond is redeemable at par, indexed for increases in the RPI over the life of the bond. (g) This bond was issued on 6 June 2014. The scheduled redemption date of this bond is May 2019. (h) This bond was issued on 7 November 2017. The scheduled redemption date of this bond is October 2020. (i) The 3.322% Limited Price Inflation (LPI) MTN is redeemable at par, indexed for increases in the RPI over the life of the MTN. The maximum indexation of the principal in any one year
is 5%, with a minimum of 0%.(j) The 1.982% RPI MTN is redeemable at par, indexed for increases in the RPI over the life of the MTN.
Borrowing facilitiesThe Group has the following undrawn committed facilities available at 24 February 2018, in respect of which all conditions precedent had been met as at that date:
2018£m
2017£m
Expiring in less than one year 38 –Expiring between one and two years – –Expiring in more than two years 4,232 4,427
4,270 4,427
The current year undrawn committed facilities include £1.6bn (2017: £1.8bn) of bilateral facilities and a £2.6bn (2017: £2.6bn) syndicated revolving credit facility. All facilities incur commitment fees at market rates and would provide funding at floating rates.
109Tesco PLC Annual Report and Financial Statements 2018
Financial statements

Note 22 Financial instrumentsDerivatives are used to hedge exposure to market risks and those that are held as hedging instruments are formally designated as hedges as defined in IAS 39 ‘Financial Instruments: Recognition and Measurement’. Derivatives may qualify as hedges for accounting purposes and the Group’s hedging policies are further described below.
Net finance income of £27m (2017: £43m) resulted from hedge ineffectiveness.
Fair value hedgesThe Group maintains interest rate and cross-currency swap contracts as fair value hedges of the interest rate and currency risk on fixed rate debt issued by the Group. Changes in the fair value of derivatives that are designated and qualify as fair value hedges are recorded in the Group income statement, together with any changes in the fair value of the hedged asset or liability that are attributable to the hedged risk. The gain or loss on the hedging instrument and hedged item is recognised in the Group income statement within finance income or costs. If the hedge no longer meets the criteria for hedge accounting, the adjustment to the carrying value of the hedged item is amortised to the Group income statement on an effective interest rate basis.
A loss of £245m on hedging instruments was recognised during the year, offset by a gain of £261m on hedged items (2017: a gain of £126m on hedging instruments, offset by a loss of £26m on hedged items).
Cash flow hedgesThe Group uses forward contracts to mainly hedge the foreign currency cost of future purchases of goods for resale, where those purchases are denominated in a currency other than the functional currency of the purchasing company. Where these contracts qualify for hedge accounting, fair value gains and losses are deferred in equity. These hedging instruments are primarily used to hedge purchases in Euros and US Dollars. The cash flows hedged will occur and will affect the Group income statement within one year of the balance sheet date.
The Group also uses index-linked swaps to hedge cash flows on index-linked debt, interest rate swaps to hedge interest cash flows on debt and cross-currency swaps to hedge cash flows on fixed rate debt denominated in foreign currencies.
The Group also uses forward contracts to hedge the future purchase of diesel for own use.
Cash flow hedging ineffectiveness resulted in a gain of £11m during the year (2017: a loss of £57m).
Net investment hedges The Group uses currency denominated borrowings to hedge the exposure of a portion of its net investment in overseas operations (with non-Sterling functional currency) against changes in value due to changes in foreign exchange rates. There was £nil (2017: £nil) that was recorded as resulting from net investment hedge ineffectiveness.
Gains and losses accumulated in equity are recycled to the Group income statement on disposal of overseas operations.
Financial instruments not qualifying for hedge accountingThe Group’s policy does not permit use of derivatives for trading purposes. However, some derivatives do not qualify for hedge accounting, or are specifically not designated as a hedge where gains and losses on the hedging instrument and the hedged item naturally offset in the Group income statement.
These instruments include index-linked swaps and forward foreign currency contracts. Changes in the fair value of any derivative instruments that do not qualify for hedge accounting are recognised immediately in the Group income statement within finance income or costs.
The fair values of derivative financial instruments have been disclosed in the Group balance sheet as follows:
2018 2017Asset
£mLiability
£mAsset
£mLiability
£mCurrent 27 (69) 286 (61)Non-current 1,117 (594) 1,303 (607)
1,144 (663) 1,589 (668)
The fair value and notional amounts of derivatives analysed by hedge type are as follows:
2018 2017Asset Liability Asset Liability
Fair value£m
Notional£m
Fair value£m
Notional£m
Fair value£m
Notional£m
Fair value£m
Notional£m
Fair value hedgesInterest rate swaps and similar instruments 43 2,424 (87) 1,728 29 543 (116) 3,050Cross-currency swaps 129 401 (48) 207 386 791 (26) 408Cash flow hedgesInterest rate swaps and similar instruments – – (17) 110 – – (38) 598Cross-currency swaps 216 1,413 – – 334 2,384 – –Index-linked swaps 160 672 – – 152 651 – –Forward contracts 23 736 (53) 1,491 75 1,174 (1) 947Derivatives not in a formal hedge relationshipInterest rate swaps and similar instruments 4 436 (1) 528 3 71 (6) 1,156Cross-currency swaps – – – – 1 27 (9) 44Index-linked swaps 564 3,590 (443) 3,590 592 3,589 (446) 3,589Forward contracts 5 795 (14) 1,896 17 1,126 (26) 741Total 1,144 10,467 (663) 9,550 1,589 10,356 (668) 10,533
Tesco PLC Annual Report and Financial Statements 2018110
Notes to the Group financial statements continued
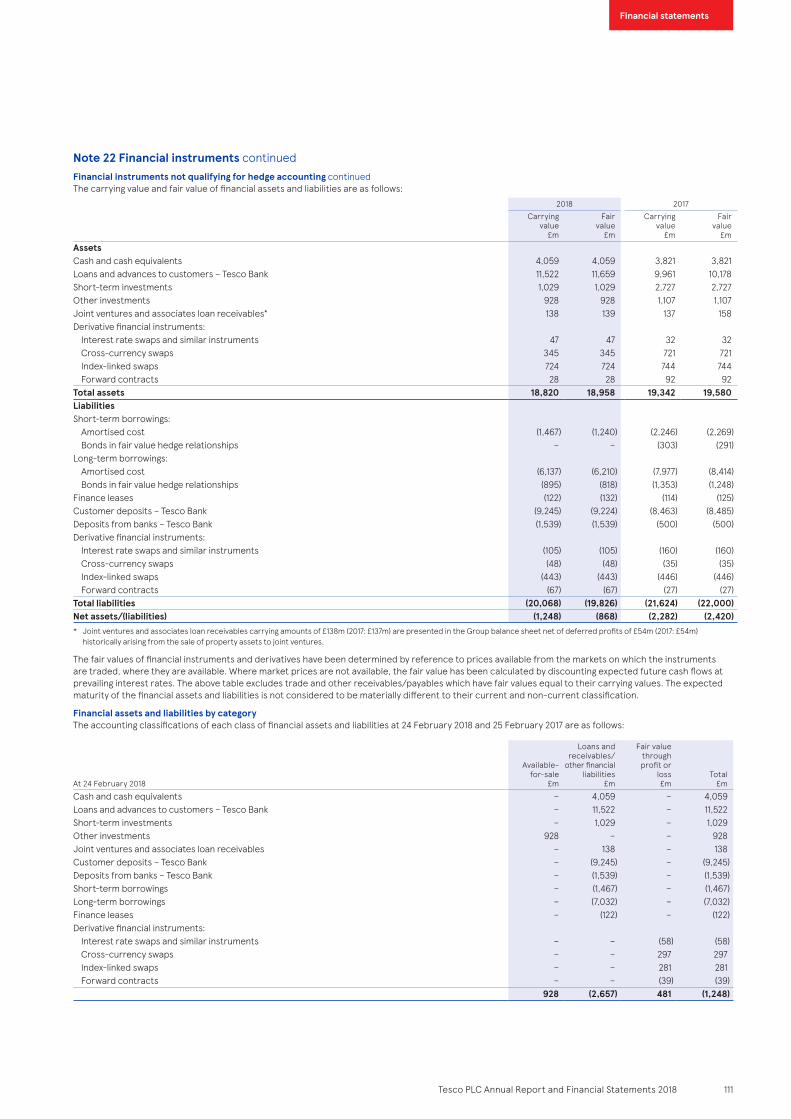
Note 22 Financial instruments continuedFinancial instruments not qualifying for hedge accounting continuedThe carrying value and fair value of financial assets and liabilities are as follows:
2018 2017Carrying
value£m
Fair value
£m
Carrying value
£m
Fair value
£mAssetsCash and cash equivalents 4,059 4,059 3,821 3,821Loans and advances to customers – Tesco Bank 11,522 11,659 9,961 10,178Short-term investments 1,029 1,029 2,727 2,727Other investments 928 928 1,107 1,107Joint ventures and associates loan receivables* 138 139 137 158Derivative financial instruments:
Interest rate swaps and similar instruments 47 47 32 32Cross-currency swaps 345 345 721 721Index-linked swaps 724 724 744 744Forward contracts 28 28 92 92
Total assets 18,820 18,958 19,342 19,580LiabilitiesShort-term borrowings:
Amortised cost (1,467) (1,240) (2,246) (2,269)Bonds in fair value hedge relationships – – (303) (291)
Long-term borrowings:Amortised cost (6,137) (6,210) (7,977) (8,414)Bonds in fair value hedge relationships (895) (818) (1,353) (1,248)
Finance leases (122) (132) (114) (125)Customer deposits – Tesco Bank (9,245) (9,224) (8,463) (8,485)Deposits from banks – Tesco Bank (1,539) (1,539) (500) (500)Derivative financial instruments:
Interest rate swaps and similar instruments (105) (105) (160) (160)Cross-currency swaps (48) (48) (35) (35)Index-linked swaps (443) (443) (446) (446)Forward contracts (67) (67) (27) (27)
Total liabilities (20,068) (19,826) (21,624) (22,000)Net assets/(liabilities) (1,248) (868) (2,282) (2,420)* Joint ventures and associates loan receivables carrying amounts of £138m (2017: £137m) are presented in the Group balance sheet net of deferred profits of £54m (2017: £54m)
historically arising from the sale of property assets to joint ventures.
The fair values of financial instruments and derivatives have been determined by reference to prices available from the markets on which the instruments are traded, where they are available. Where market prices are not available, the fair value has been calculated by discounting expected future cash flows at prevailing interest rates. The above table excludes trade and other receivables/payables which have fair values equal to their carrying values. The expected maturity of the financial assets and liabilities is not considered to be materially different to their current and non-current classification.
Financial assets and liabilities by categoryThe accounting classifications of each class of financial assets and liabilities at 24 February 2018 and 25 February 2017 are as follows:
At 24 February 2018
Available- for-sale
£m
Loans and receivables/
other financialliabilities
£m
Fair value throughprofit or
loss£m
Total£m
Cash and cash equivalents – 4,059 – 4,059Loans and advances to customers – Tesco Bank – 11,522 – 11,522Short-term investments – 1,029 – 1,029Other investments 928 – – 928Joint ventures and associates loan receivables – 138 – 138Customer deposits – Tesco Bank – (9,245) – (9,245)Deposits from banks – Tesco Bank – (1,539) – (1,539)Short-term borrowings – (1,467) – (1,467)Long-term borrowings – (7,032) – (7,032)Finance leases – (122) – (122)Derivative financial instruments:
Interest rate swaps and similar instruments – – (58) (58)Cross-currency swaps – – 297 297Index-linked swaps – – 281 281Forward contracts – – (39) (39)
928 (2,657) 481 (1,248)
111Tesco PLC Annual Report and Financial Statements 2018
Financial statements

Note 22 Financial instruments continued Financial assets and liabilities by category continued
At 25 February 2017
Available- for-sale
£m
Loans and receivables/
other financialliabilities
£m
Fair value throughprofit or
loss£m
Total£m
Cash and cash equivalents – 3,821 – 3,821Loans and advances to customers – Tesco Bank – 9,961 – 9,961Short-term investments – 2,727 – 2,727Other investments 1,094 13 – 1,107Joint ventures and associates loan receivables – 137 – 137Customer deposits – Tesco Bank – (8,463) – (8,463)Deposits from banks – Tesco Bank – (500) – (500)Short-term borrowings – (2,549) – (2,549)Long-term borrowings – (9,330) – (9,330)Finance leases – (114) – (114)Derivative financial instruments:
Interest rate swaps and similar instruments – – (128) (128)Cross-currency swaps – – 686 686Index-linked swaps – – 298 298Forward contracts – – 65 65
1,094 (4,297) 921 (2,282)
The above tables exclude trade and other receivables/payables that are classified under loans and receivables/other financial liabilities.
Fair value measurementThe following table presents the Group’s financial assets and liabilities that are measured at fair value at 24 February 2018 and 25 February 2017, by level of fair value hierarchy:
– quoted prices (unadjusted) in active markets for identical assets or liabilities (Level 1); – inputs other than quoted prices included within Level 1 that are observable for the asset or liability, either directly (that is, as prices) or indirectly (that is, derived from prices) (Level 2); and
– inputs for the asset or liability that are not based on observable market data (that is, unobservable inputs) (Level 3).
At 24 February 2018Level 1
£mLevel 2
£mLevel 3
£mTotal
£mAssetsAvailable-for-sale financial assets 923 – 5 928Derivative financial instruments:
Interest rate swaps and similar instruments – 47 – 47Cross-currency swaps – 345 – 345Index-linked swaps – 724 – 724Forward contracts – 28 – 28
Total assets 923 1,144 5 2,072LiabilitiesDerivative financial instruments:
Interest rate swaps and similar instruments – (105) – (105)Cross-currency swaps – (48) – (48)Index-linked swaps – (443) – (443)Forward contracts – (67) – (67)
Total liabilities – (663) – (663)Net assets/(liabilities) 923 481 5 1,409
At 25 February 2017Level 1
£mLevel 2
£mLevel 3
£mTotal
£mAssetsAvailable-for-sale financial assets 964 – 130 1,094Derivative financial instruments:
Interest rate swaps and similar instruments – 32 – 32Cross-currency swaps – 721 – 721Index-linked swaps – 744 – 744Forward contracts – 92 – 92
Total assets 964 1,589 130 2,683LiabilitiesDerivative financial instruments:
Interest rate swaps and similar instruments – (160) – (160)Cross-currency swaps – (35) – (35)Index-linked swaps – (446) – (446)Forward contracts – (27) – (27)
Total liabilities – (668) – (668)Net assets/(liabilities) 964 921 130 2,015
Tesco PLC Annual Report and Financial Statements 2018112
Notes to the Group financial statements continued

Note 22 Financial instruments continuedFair value measurement continuedThe following table presents the changes in Level 3 instruments for the 52 weeks ended 24 February 2018 and 52 weeks ended 25 February 2017:
2018£m
2017£m
At the beginning of the year 130 125Gains/(losses) recognised in finance costs in the Group income statement – (4)Gains/(losses) recognised in the Group statement of comprehensive income/(loss) 68 90Disposal of available-for-sale financial asset (196) (81)Addition of available-for-sale financial asset 3 –At the end of the year 5 130
During the financial year, there were no transfers (2017: £nil) between Level 1 and Level 2 fair value measurements, and no transfers into and out of Level 3 fair value measurements (2017: £nil). During the financial year, the Group fully disposed of its remaining investment in Lazada, an investment in an unlisted entity, resulting in a £70m revaluation gain offset by £2m foreign exchange loss. Refer to Note 31 for further details.
Offsetting of financial assets and liabilitiesThe following tables show those financial assets and liabilities subject to offsetting, enforceable master netting arrangements and similar agreements.
At 24 February 2018
Gross amounts
of recognised financial assets/
(liabilities)£m
Gross amounts of financial
assets/(liabilities)
offset in the Group
balance sheet £m
Net amounts presented in
the Group balance sheet
£m
Net amount
£m
Related amounts not offset in the Group balance sheet
Financial instruments
£mCollateral
£mFinancial assetsCash and cash equivalents 4,187 (128) 4,059 – – 4,059Derivative financial instruments 1,144 – 1,144 (217) (18) 909Total trade and other receivables(a) 1,887 (219) 1,668 – – 1,668Total assets 7,218 (347) 6,871 (217) (18) 6,636Financial liabilitiesBank loans and overdrafts (479) 128 (351) – – (351)Repurchases, securities lending and similar agreements(b) (200) – (200) 380 – 180Derivative financial instruments (663) – (663) 217 55 (391)Total trade and other payables(c) (9,579) 219 (9,360) – – (9,360)Total liabilities (10,921) 347 (10,574) 597 55 (9,922)
At 25 February 2017
Gross amounts
of recognised financial assets/
(liabilities)£m
Gross amounts of financial
assets/(liabilities)
offset in the Group
balance sheet £m
Net amounts presented in
the Group balance sheet
£m
Net amount
£m
Related amounts not offset in the Group balance sheet
Financial instruments
£mCollateral
£mFinancial assetsCash and cash equivalents 4,085 (264) 3,821 – – 3,821Derivative financial instruments 1,589 – 1,589 (308) (11) 1,270Total trade and other receivables(a) 1,894 (239) 1,655 – – 1,655Total assets 7,568 (503) 7,065 (308) (11) 6,746Financial liabilitiesBank loans and overdrafts (1,176) 264 (912) – – (912)Repurchases, securities lending and similar agreements(b) (100) – (100) 100 – –Derivative financial instruments (668) – (668) 308 115 (245)Total trade and other payables(c) (9,438) 239 (9,199) – – (9,199)Total liabilities (11,382) 503 (10,879) 408 115 (10,356)(a) Total trade and other receivables includes £317m (2017: £322m) of prepayments.(b) Repurchases, securities lending and similar agreements are included within the deposits from banks balance of £1,539m (2017: £500m) in the Group balance sheet. Refer to Note 24.(c) Total trade and other payables includes £264m (2017: £268m) of deferred income.
For the financial assets and liabilities subject to enforceable master netting arrangements above, each agreement between the Group and the counterparty allows for net settlement of the relevant financial assets and liabilities when both elect to settle on a net basis. In the absence of such an election, financial assets and liabilities will be settled on a gross basis. However, each party to the master netting agreement or similar agreement will have the option to settle all such amounts on a net basis in the event of default of the other party.
113Tesco PLC Annual Report and Financial Statements 2018
Financial statements
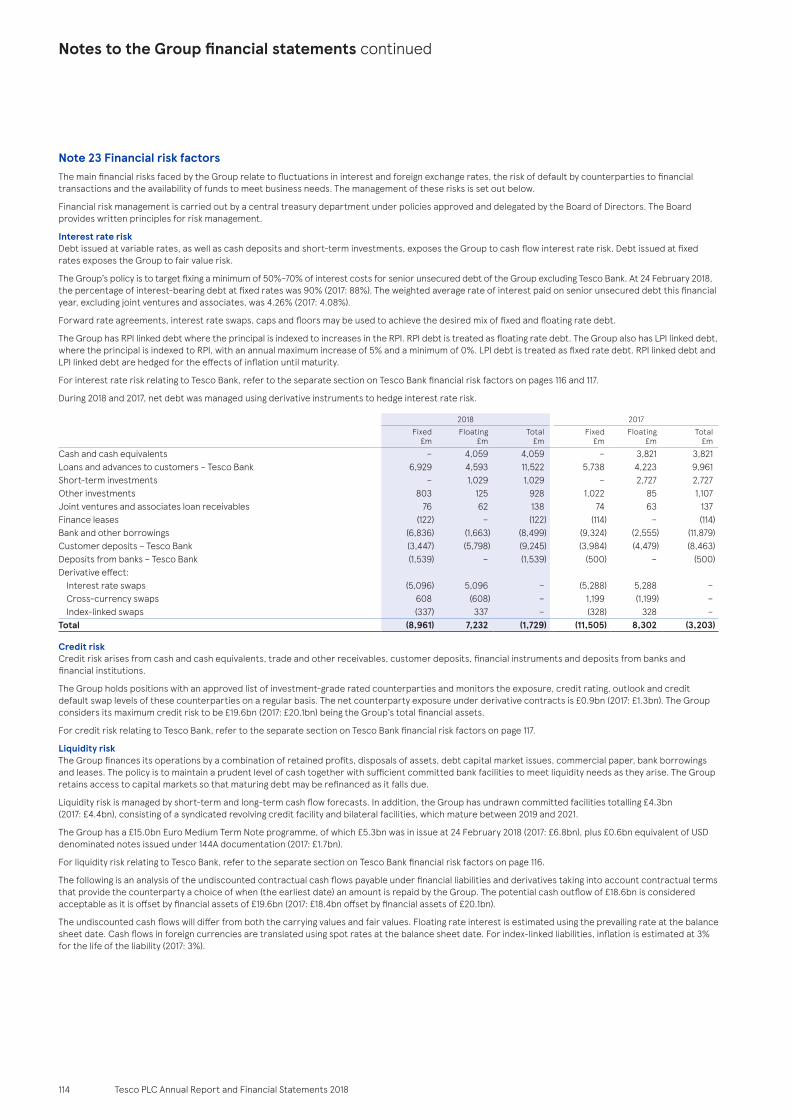
Note 23 Financial risk factorsThe main financial risks faced by the Group relate to fluctuations in interest and foreign exchange rates, the risk of default by counterparties to financial transactions and the availability of funds to meet business needs. The management of these risks is set out below.
Financial risk management is carried out by a central treasury department under policies approved and delegated by the Board of Directors. The Board provides written principles for risk management.
Interest rate riskDebt issued at variable rates, as well as cash deposits and short-term investments, exposes the Group to cash flow interest rate risk. Debt issued at fixed rates exposes the Group to fair value risk.
The Group’s policy is to target fixing a minimum of 50%–70% of interest costs for senior unsecured debt of the Group excluding Tesco Bank. At 24 February 2018, the percentage of interest-bearing debt at fixed rates was 90% (2017: 88%). The weighted average rate of interest paid on senior unsecured debt this financial year, excluding joint ventures and associates, was 4.26% (2017: 4.08%).
Forward rate agreements, interest rate swaps, caps and floors may be used to achieve the desired mix of fixed and floating rate debt.
The Group has RPI linked debt where the principal is indexed to increases in the RPI. RPI debt is treated as floating rate debt. The Group also has LPI linked debt, where the principal is indexed to RPI, with an annual maximum increase of 5% and a minimum of 0%. LPI debt is treated as fixed rate debt. RPI linked debt and LPI linked debt are hedged for the effects of inflation until maturity.
For interest rate risk relating to Tesco Bank, refer to the separate section on Tesco Bank financial risk factors on pages 116 and 117.
During 2018 and 2017, net debt was managed using derivative instruments to hedge interest rate risk.
2018 2017Fixed
£mFloating
£mTotal
£mFixed
£mFloating
£mTotal
£mCash and cash equivalents – 4,059 4,059 – 3,821 3,821Loans and advances to customers – Tesco Bank 6,929 4,593 11,522 5,738 4,223 9,961Short-term investments – 1,029 1,029 – 2,727 2,727Other investments 803 125 928 1,022 85 1,107Joint ventures and associates loan receivables 76 62 138 74 63 137Finance leases (122) – (122) (114) – (114)Bank and other borrowings (6,836) (1,663) (8,499) (9,324) (2,555) (11,879)Customer deposits – Tesco Bank (3,447) (5,798) (9,245) (3,984) (4,479) (8,463)Deposits from banks – Tesco Bank (1,539) – (1,539) (500) – (500)Derivative effect:
Interest rate swaps (5,096) 5,096 – (5,288) 5,288 –Cross-currency swaps 608 (608) – 1,199 (1,199) –Index-linked swaps (337) 337 – (328) 328 –
Total (8,961) 7,232 (1,729) (11,505) 8,302 (3,203)
Credit risk Credit risk arises from cash and cash equivalents, trade and other receivables, customer deposits, financial instruments and deposits from banks and financial institutions.
The Group holds positions with an approved list of investment-grade rated counterparties and monitors the exposure, credit rating, outlook and credit default swap levels of these counterparties on a regular basis. The net counterparty exposure under derivative contracts is £0.9bn (2017: £1.3bn). The Group considers its maximum credit risk to be £19.6bn (2017: £20.1bn) being the Group’s total financial assets.
For credit risk relating to Tesco Bank, refer to the separate section on Tesco Bank financial risk factors on page 117.
Liquidity risk The Group finances its operations by a combination of retained profits, disposals of assets, debt capital market issues, commercial paper, bank borrowings and leases. The policy is to maintain a prudent level of cash together with sufficient committed bank facilities to meet liquidity needs as they arise. The Group retains access to capital markets so that maturing debt may be refinanced as it falls due.
Liquidity risk is managed by short-term and long-term cash flow forecasts. In addition, the Group has undrawn committed facilities totalling £4.3bn (2017: £4.4bn), consisting of a syndicated revolving credit facility and bilateral facilities, which mature between 2019 and 2021.
The Group has a £15.0bn Euro Medium Term Note programme, of which £5.3bn was in issue at 24 February 2018 (2017: £6.8bn), plus £0.6bn equivalent of USD denominated notes issued under 144A documentation (2017: £1.7bn).
For liquidity risk relating to Tesco Bank, refer to the separate section on Tesco Bank financial risk factors on page 116.
The following is an analysis of the undiscounted contractual cash flows payable under financial liabilities and derivatives taking into account contractual terms that provide the counterparty a choice of when (the earliest date) an amount is repaid by the Group. The potential cash outflow of £18.6bn is considered acceptable as it is offset by financial assets of £19.6bn (2017: £18.4bn offset by financial assets of £20.1bn).
The undiscounted cash flows will differ from both the carrying values and fair values. Floating rate interest is estimated using the prevailing rate at the balance sheet date. Cash flows in foreign currencies are translated using spot rates at the balance sheet date. For index-linked liabilities, inflation is estimated at 3% for the life of the liability (2017: 3%).
Tesco PLC Annual Report and Financial Statements 2018114
Notes to the Group financial statements continued

Note 23 Financial risk factors continuedLiquidity risk continued
At 24 February 2018
Due within 1 year
£m
Due between
1 and 2 years
£m
Due between
2 and 3 years
£m
Due between
3 and 4 years
£m
Due between
4 and 5 years
£m
Due beyond 5 years
£mNon-derivative financial liabilitiesBank and other borrowings (1,401) (1,445) (963) (926) (28) (3,860)Interest payments on borrowings (298) (323) (243) (219) (163) (1,852)Customer deposits – Tesco Bank (7,655) (874) (500) (179) (105) –Deposits from banks – Tesco Bank (209) (12) (412) (947) – –Finance leases (20) (34) (11) (11) (11) (120)Trade and other payables* (8,996) (34) (34) (25) (24) (247)Derivative and other financial liabilitiesNet settled derivative contracts – receipts 27 16 11 9 7 1,379Net settled derivative contracts – payments (57) (221) (367) (69) (87) (151)Gross settled derivative contracts – receipts 97 79 519 70 57 2,178Gross settled derivative contracts – payments (134) (72) (493) (121) (51) (1,751)Total (18,646) (2,920) (2,493) (2,418) (405) (4,424)
At 25 February 2017
Due within 1 year
£m
Due between
1 and 2 years
£m
Due between
2 and 3 years
£m
Due between
3 and 4 years
£m
Due between
4 and 5 years
£m
Due beyond 5 years
£mNon-derivative financial liabilitiesBank and other borrowings (2,634) (1,076) (1,850) (645) (926) (4,771)Interest payments on borrowings (349) (352) (379) (288) (268) (2,906)Customer deposits – Tesco Bank (6,658) (1,147) (423) (167) (174) –Deposits from banks – Tesco Bank (100) (301) (1) (100) – –Finance leases (19) (16) (23) (9) (9) (126)Trade and other payables* (8,875) (27) (17) (11) (11) (258)Derivative and other financial liabilitiesNet settled derivative contracts – receipts 34 23 19 14 10 1,430Net settled derivative contracts – payments (96) (59) (251) (414) (86) (197)Gross settled derivative contracts – receipts 1,402 105 105 528 96 2,878Gross settled derivative contracts – payments (1,118) (83) (85) (506) (130) (2,248)Total (18,413) (2,933) (2,905) (1,598) (1,498) (6,198)* Trade and other payables includes £264m (2017: £268m) of deferred income.
Foreign exchange riskThe Group is exposed to foreign exchange risk principally via:
– transactional exposure that arises from the cost of future purchases of goods, where those purchases are denominated in a currency other than the functional currency of the purchasing company. Transactional currency exposures that could significantly impact the Group income statement are hedged. These exposures are hedged via forward foreign currency contracts or purchased currency options, which are designated as cash flow hedges. At 24 February 2018, forward foreign currency transactions, designated as cash flow hedges, equivalent to £2.2bn were outstanding (2017: £2.1bn). The notional and fair values of these contracts is shown in Note 22;
– net investment exposure arises from changes in the value of net investments denominated in currencies other than Pounds Sterling. The Group hedges a part of its investments in its international subsidiaries via foreign currency derivatives and borrowings in matching currencies, which are formally designated as net investment hedges. During the financial year, currency movements increased the net value, after the effects of hedging, of the Group’s overseas assets by £318m (2017: increase by £751m). The Group also ensures that each subsidiary is appropriately hedged in respect of its non-functional currency assets; and
– loans to non-UK subsidiaries. These are hedged via foreign currency derivatives and borrowings in matching currencies. These are not formally designated as hedges as gains and losses on hedges and hedged loans will naturally offset.
The impact on the Group financial statements from foreign currency volatility is shown in the sensitivity analysis below.
Sensitivity analysisThe analysis excludes the impact of movements in market variables on the carrying value of pension and other post-employment obligations and on the retranslation of overseas net assets as required by IAS 21 ‘The Effects of Changes in Foreign Exchange Rates’. However, it does include the foreign exchange sensitivity resulting from local entity non-functional currency financial instruments.
The sensitivity analysis has been prepared on the basis that the amount of net debt, the ratio of fixed to floating interest rates of the debt and derivatives portfolio, and the proportion of financial instruments in foreign currencies are all constant and on the basis of the hedge designations in place at 24 February 2018. It should be noted that the sensitivity analysis reflects the impact on income and equity due to financial instruments held at the balance sheet date. It does not reflect any change in sales or costs that may result from changing interest or exchange rates.
115Tesco PLC Annual Report and Financial Statements 2018
Financial statements

Note 23 Financial risk factors continued Sensitivity analysis continuedThe following assumptions were made in calculating the sensitivity analysis:
– the sensitivity of interest payable to movements in interest rates is calculated on net floating rate exposures on debt, deposits and derivative instruments with no sensitivity assumed for RPI-linked debt, which has been swapped to fixed rates;
– changes in the carrying value of derivative financial instruments designated as fair value hedges from movements in interest rates or foreign exchange rates have an immaterial effect on the Group income statement and equity due to compensating adjustments in the carrying value of debt;
– changes in the carrying value of derivative financial instruments designated as net investment hedges from movements in foreign exchange rates are recorded directly in the Group statement of comprehensive income/(loss);
– changes in the carrying value of derivative financial instruments not designated as hedging instruments only affect the Group income statement; – all other changes in the carrying value of derivative financial instruments designated as hedging instruments are fully effective with no impact on the Group income statement; and
– the floating leg of any swap or any floating rate debt is treated as not having any interest rate already set, therefore a change in interest rates affects a full 12-month period for the interest payable portion of the sensitivity calculations.
Using the above assumptions, the following table shows the illustrative effect on the Group income statement and equity that would result, at the balance sheet date, from changes in interest rates and currency exchange rates that are reasonably possible for major currencies where there have recently been significant movements:
2018 2017Income
gain/(loss)£m
Equity gain/(loss)
£m
Income gain/(loss)
£m
Equity gain/(loss)
£m1% increase in interest rates (2017: 1%) 69 (30) 80 (39)10% appreciation of the Euro (2017: 10%) 4 (143) (83) (108)10% appreciation of the US Dollar (2017: 10%) 6 129 6 170
A decrease in interest rates and a depreciation of foreign currencies would have the opposite effect to the impact in the table above.
The impact on the Group statement of comprehensive income/(loss) from changing exchange rates results from the revaluation of financial liabilities used as net investment hedges. The impact on the Group statement of comprehensive income/(loss) will largely be offset by the revaluation in equity of the hedged assets.
Capital riskThe Group’s objectives when managing capital (defined as net debt plus equity) are to safeguard the Group’s ability to continue as a going concern in order to provide returns to shareholders and benefits for other stakeholders, while protecting and strengthening the Group balance sheet through the appropriate balance of debt and equity funding. The Group manages its capital structure and makes adjustments to it, in light of changes to economic conditions and the strategic objectives of the Group.
To maintain or adjust the capital structure, the Group may adjust the dividend payment to shareholders, buy back shares and cancel them, or issue new shares.
The Group raises finance in the public debt markets and borrows from financial institutions. The policy for debt is to smooth the debt maturity profile with the objective of ensuring continuity of funding. This policy continued during the financial year, with debt redeemed of £2.7bn (2017: £1.9bn). No new bonds were issued in either the current or previous financial year. The Group borrows centrally and locally, using a variety of capital market instruments and borrowing facilities to meet the Group’s business requirements of each local business.
Refer to Note 30 for the value of the Group’s net debt (£2.6bn; 2017: £3.7bn), and the Group statement of changes in equity for the value of the Group’s equity (£10.5bn; 2017: £6.4bn).
Insurance riskThe Group is exposed to the risk of being inadequately protected from liabilities arising from unforeseen events. The Group purchased assets, earnings and combined liability protection from the open insurance market for higher value losses only.
The risk not transferred to the insurance market is retained within the Group with some cover being provided by the Group’s captive insurance companies, ELH Insurance Limited in Guernsey and Valiant Insurance Company DAC (formerly Valiant Insurance Company Limited) in the Republic of Ireland. ELH Insurance Limited covers Assets, Earnings and Combined Liability, while Valiant Insurance Company DAC covers Combined Liability only.
Tesco BankInterest rate riskInterest rate risk arises mainly where assets and liabilities in Tesco Bank’s banking activities have different repricing dates and from unexpected changes to the yield curve. Tesco Bank is exposed to interest rate risk through dealings with retail customers as well as through lending to and borrowing from the wholesale market. Tesco Bank has established limits for risk appetite and stress tests are performed using sensitivity to fluctuations in underlying interest rates in order to monitor this risk. Tesco Bank also use the Capital at Risk (CaR) approach which assesses the sensitivity (value change) of a reduction in the Bank’s capital to movements in interest rates. The scenarios considered include both parallel and non-parallel movements of the yield curve and have been designed to assess impacts across a suitable range of severe but plausible movements in interest rates. Interest rate risk is primarily managed using interest rate swaps as the main hedging instrument.
Liquidity and funding risk Liquidity risk is the risk that Tesco Bank has insufficient liquidity resources to meet its obligations as they fall due. Funding risk is the risk that Tesco Bank does not have sufficiently stable and diverse sources of funding.
Tesco Bank operates within a Liquidity Risk Management Policy Framework (LRMP) to ensure that sufficient funds are available at all times to meet demands from depositors, to fund agreed advances, to meet other commitments as and when they fall due, and to ensure the Board’s risk appetite is met.
Liquidity and funding risks are assessed through the Individual Liquidity Adequacy Assessment Process (ILAAP) on at least an annual basis. Formal limits are set within the LRMP to maintain liquidity risk exposures within the Liquidity Risk Appetite set by the Board and key liquidity measures are monitored on a regular basis. Tesco Bank maintains a conservative liquidity and funding profile to confirm that it is able to meet its financial obligations under normal, and stressed, market conditions.
Tesco PLC Annual Report and Financial Statements 2018116
Notes to the Group financial statements continued

Note 23 Financial risk factors continued Tesco Bank continuedCredit riskCredit risk is the risk that a bank borrower or counterparty will fail to meet its obligations in accordance with contractually agreed terms and Tesco Bank will incur losses as a result. Credit risk principally arises from the Bank’s retail lending activities but also from the placement of surplus funds with other banks and money market funds, investments in transferable securities and interest rate and foreign exchange derivatives. In addition, credit risk arises from contractual arrangements with third parties where payments and commissions are due to the Bank for short periods of time.
Retail credit policy is managed through the credit risk policy framework with minimum requirements for management of credit activities defined across the customer life cycle. Customer lending decisions are managed principally through the deployment of appropriate credit scoring and associated rules, which exclude specific areas of lending, and an affordability assessment which determines a customer’s ability to repay the advances they are seeking. Wholesale credit risk is managed using a limit-based framework, with limits determined by counterparty credit worthiness, instrument type and remaining tenor. A limits framework is also in place for the management of third-party credit risk exposures.
Ineffective management and controls over the emerging asset quality of the Group’s lending portfolios could expose the Group to unacceptable levels of bad debt. The Group’s asset quality is reflected through the level of its impairment by lending type. Asset quality profiles are regularly monitored and reported to the appropriate senior management team and risk committees.
The table below presents an analysis of credit exposure by impairment status across the different exposure classes. The table predominantly relates to banking assets; the retail instalment lending applies to credit agreements in the insurance business. The amounts below are presented gross of impairment and exclude fair value hedge adjustments of £(16)m (2017: £23m). Prior year balances have been re-presented to reflect this change.
Credit quality of loans and advances
At 24 February 2018
Retail unsecured
lending£m
Retail mortgage
lending£m
Retailinstalment
lending£m
Total£m
Past due and impairedLess than 90 days past due 44 – – 4490-179 days past due 59 – – 59180 days plus past due 109 – – 109Past due but not impairedLess than 29 days past due 55 1 – 5630-59 days past due 20 – – 2060-119 days past due 13 – – 13Neither past due nor impairedLow risk(a) 8,010 2,983 129 11,122High risk(b) 327 26 – 353Total 8,637 3,010 129 11,776
At 25 February 2017
Retail unsecured
lending£m
Retail mortgage
lending£m
Retailinstalment
lending£m
Total£m
Past due and impairedLess than 90 days past due 32 – – 3290-179 days past due 48 – – 48180 days plus past due 99 – – 99Past due but not impairedLess than 29 days past due 48 1 – 4930-59 days past due 16 – – 1660-119 days past due 10 – – 10Neither past due nor impairedLow risk(a) 7,426 2,144 140 9,710High risk(b) 152 16 – 168Total 7,831 2,161 140 10,132(a) Low risk is defined as an asset with a probability of default of less than 10%.(b) High risk is defined as an asset with a probability of default of 10% or more.
The credit risk exposure from off balance sheet items in 2018, mainly undrawn contractual lending commitments, was £12.4bn (2017: £12.1bn).
Insurance riskTesco Bank is indirectly exposed to insurance risks through its ownership of 49.9% of Tesco Underwriting Limited (TU), an authorised insurance company. Insurance risk is defined as the risk accepted through the provision of insurance products in return for a premium. The timing and quantum of the risks are uncertain and determined by events outside the control of Tesco Bank. The key insurance risks within TU relate to underwriting risk and reserving risk. TU operates a separate framework to ensure that the TU insurance portfolio operates within agreed risk appetite. The Bank closely monitors performance of the portfolio against specific thresholds and limits
117Tesco PLC Annual Report and Financial Statements 2018
Financial statements

Note 24 Customer deposits and deposits from banks2018
£m2017
£mCustomer deposits 9,245 8,463Deposits from banks 1,539 500
10,784 8,963Of which:Current 7,812 6,687Non-current 2,972 2,276
10,784 8,963
Deposits from banks include liabilities of £200m (2017: £100m) that have been sold under sale and repurchase agreements.
Note 25 ProvisionsProperty
provisions£m
Restructuring provisions
£m
Other provisions
£mTotal
£mAt 27 February 2016 875 83 66 1,024Foreign currency translation 12 4 – 16Amount released in the year (38) (18) – (56)Amount provided in the year 99 196 136 431Amount utilised in the year (141) (162) (28) (331)Transfer to disposal group classified as held for sale – (5) – (5)Unwinding of discount 44 – – 44At 25 February 2017 851 98 174 1,123Foreign currency translation 5 1 – 6Amount released in the year (33) (32) (14) (79)Amount provided in the year 153 157 211 521Amount utilised in the year (120) (146) (50) (316)Unwinding of discount 13 – – 13At 24 February 2018 869 78 321 1,268
The balances are analysed as follows:2018
£m2017
£mCurrent 547 438Non-current 721 685
1,268 1,123
Property provisionsProperty provisions comprise onerous lease provisions, including leases on unprofitable stores and vacant properties, dilapidations provisions and asset retirement obligation provisions. These provisions are based on the least net cost of fulfilling or exiting the contract.
The calculation of the value in use of the leased properties to the Group is based on the same assumptions for growth rates and expected changes to future cash flows as those for Group owned properties, as discussed in detail in Note 11, discounted at the appropriate risk free rate. The cost of exiting lease contracts is estimated as the present value of expected surrender premiums or deficits from subletting at market rents, assuming that the Group can sublet properties at market rents, based on discounting at the appropriate risk adjusted rate. For some leases, termination of the lease at the break clause requires the Group to either purchase the property or buy out the equity ownership of the property at fair value. No value is attributed to the purchase conditions since they are at fair value. It is also assumed that the Group is indifferent to purchasing the properties.
Based on the factors set out above, the Group has recognised a net onerous property provision charge in the year of £120m (2017: £61m), largely relating to onerous lease contracts for fully impaired properties and other onerous contracts relating to properties. The Group has performed sensitivity analysis on the onerous lease provisions using reasonably possible scenarios based on recent market movements. Neither a half a percentage point increase nor decrease in the risk-free rate would result in a material change to the onerous lease provisions.
Of the £120m net onerous property provision charge (£153m charge, £33m release) recognised in the year, a £105m charge has been recognised as an exceptional item; a £116m charge in cost of sales and £11m release in property-related items. This is made up of a £108m charge classified as ‘Net impairment reversal of non-current assets and onerous lease provisions’, a £2m charge classified as ‘Net restructuring and redundancy costs’, and a £5m release classified as ‘Property transactions’.
Onerous lease provisions will be utilised over the relevant lease terms, predominantly within the next 25 years.
Restructuring provisionsOf the £125m net charge (£157m charge, £32m release) recognised in the year, a £68m charge relating to UK & ROI changes to store and call centre colleague structures and working practices and a £34m charge relating to head office restructuring have been classified as exceptional items. The exceptional provisions are expected to be utilised in the next financial year.
Tesco PLC Annual Report and Financial Statements 2018118
Notes to the Group financial statements continued

Note 25 Provisions continuedOther provisionsOther provisions relate primarily to an ongoing court case with Her Majesty’s Revenue & Customs (HMRC). Tesco PLC and Tesco Freetime Limited, a wholly-owned subsidiary undertaking of the Group, initiated an appeal against HMRC regarding the treatment of VAT on Clubcard rewards. In August 2017, the Group’s appeal was upheld in the First Tier Tribunal. As a result of the Tribunal’s decision, the Group recovered VAT and interest of £160m for periods up to 25 February 2017, which have been included within exceptional cash flows in Note 4. A further £12m is recoverable in relation to the 52 weeks ended 24 February 2018. HMRC have appealed the Tribunal’s decision and as a result, the Group has recognised a provision of £176m for these amounts plus penalty interest, which would be due if HMRC were to be successful in their appeal.
Included in other provisions is a provision of £61m (2017: £91m) to cover the cost of the compensation scheme and related costs, as agreed with the UK Financial Conduct Authority (FCA). In the previous financial year, the Group agreed with the FCA (under its statutory powers) to establish a compensation scheme to compensate certain net purchasers of Tesco ordinary shares and listed bonds between 29 August 2014 and 19 September 2014 inclusive. This charge was classified as an exceptional item in administrative expenses. With the compensation scheme now closed to new claimants, £13m of the provision and £12m of related accruals were released to the Group income statement within exceptional items, classified as ‘Release of amounts provided in relation to DPA and FCA obligations’ within administrative expenses. Refer to Note 4 for further details.
Other provisions also include provisions for Tesco Bank customer redress in respect of potential complaints arising from the historic sales of PPI, and in respect of customer redress relating to instances where certain of the requirements of the CCA for post-contract documentation have not been fully complied with. In each instance, management have exercised judgement as to both the timescale for implementing the redress campaigns and the final scope of any amounts payable. During the year, an additional charge of £35m and a release of £1m was recognised in the Group income statement within exceptional items, classified as ‘Provision for customer redress’ within cost of sales. Refer to Note 4 for further details.
Other provisions are expected to be utilised in the next financial year when the outcome of the aforementioned matters have been reliably determined.
Note 26 Share-based paymentsFor continuing operations, the Group income statement charge for the financial year recognised in respect of share-based payments is £252m (2017: £294m), which is made up of share option schemes and share bonus payments. Of this amount, £128m (2017: £36m) will be settled in equity and £124m (2017: £258m) in cash. The movement between cash and equity settled charge with reference to the prior year is predominantly due to a reclassification from equity to cash which took place in the prior financial year as a result of employees being offered the choice of cash settlement on a one-off award.
Share option schemesThe Company had eight share option schemes in operation during the financial year, all of which are equity settled schemes:
i) The Savings-related Share Option Scheme (1981) permits the grant to colleagues of options in respect of ordinary shares linked to a building society/bank save-as-you-earn contract for a term of three or five years with contributions from colleagues of an amount between £5 and £500 per four-weekly period. Options are capable of being exercised at the end of the three or five year period at a subscription price of not less than 80% of the average of the middle-market quotations of an ordinary share over the three dealing days immediately preceding the offer date.
ii) The Irish Savings-related Share Option Scheme (2000) permits the grant to ROI colleagues of options in respect of ordinary shares linked to a building society/bank save-as-you-earn contract for a term of three or five years with contributions from colleagues of an amount between €12 and €500 per four-weekly period. Options are capable of being exercised at the end of the three or five year period at a subscription price of not less than 80% of the average of the middle-market quotations of an ordinary share over the three dealing days immediately preceding the offer date.
iii) The Executive Incentive Plan (2004) permitted the grant of options in respect of ordinary shares to selected senior executives. Options are normally exercisable between three and 10 years from the date of grant for nil consideration. No further options will be granted under this scheme.
iv) The Executive Incentive Plan (2014) permits the grant of options in respect of ordinary shares to selected senior executives as a proportion of annual bonus following the completion of a required service period and is dependent on the achievement of corporate performance and individual targets. Options are normally exercisable between three and 10 years from the date of grant for nil consideration. Full details of this plan can be found in the Directors’ remuneration report.
v) The Performance Share Plan (2011) permits the grant of options in respect of ordinary shares to selected executives. Options are normally exercisable between the vesting date(s) set at grant and 10 years from the date of grant for nil consideration. The vesting of options will normally be conditional upon the achievement of specified performance targets over a three year period and/or continuous employment.
vi) The Discretionary Share Option Plan (2004) permitted the grant of approved, unapproved and international options in respect of ordinary shares to selected executives. Options are normally exercisable between three and 10 years from the date of grant at a price not less than the middle-market quotation or average middle-market quotations of an ordinary share for the dealing day or three dealing days preceding the date of grant. The vesting of options will normally be conditional upon the achievement of a specified performance target related to the annual percentage growth in earnings per share over a sthree year period. There were no discounted options granted under this scheme.
vii) The Group Bonus Plan permits the grant of options in respect of ordinary shares to selected senior executives as a proportion of annual bonus following the completion of a required service period and is dependent on the achievement of corporate performance and individual targets. Options are normally exercisable between three and 10 years from the date of grant for nil consideration.
viii) The Long Term Incentive Plan (2015) permits the grant of options in respect of ordinary shares to selected executives. Options are normally exercisable between the vesting date(s) set at grant and 10 years from the date of grant for nil consideration. The vesting of options will normally be conditional upon the achievement of specified performance targets over a three year period and/or continuous employment.
119Tesco PLC Annual Report and Financial Statements 2018
Financial statements

Note 26 Share-based payments continuedShare option schemes continuedThe following tables reconcile the number of share options outstanding and the weighted average exercise price (WAEP):
For the 52 weeks ended 24 February 2018
Savings-related Share Option Scheme
Irish Savings-related Share Option Scheme
Approved Share Option Scheme
Unapproved Share Option Scheme
International Executive Share Option Scheme
Nil cost Share Option Schemes
Options WAEP Options WAEP Options WAEP Options WAEP Options WAEP Options WAEPOutstanding at 25 February 2017
256,862,881 168.91 6,339,307 179.46 5,019,454 420.87 24,450,586 395.84 18,495,050 397.17 27,640,320 –
Granted 40,314,086 168.00 2,078,500 168.00 – – – – – – 10,838,726 –Forfeited (47,125,400) 204.95 (1,471,619) 218.17 (2,216,356) 458.33 (7,131,313) 446.01 (6,240,281) 439.33 (1,740,742) –Exercised (5,164,858) 150.29 (19,208) 150.02 – – – – – – (722,792) –Outstanding at 24 February 2018
244,886,709 162.21 6,926,980 167.88 2,803,098 391.25 17,319,273 375.18 12,254,769 375.69 36,015,512 –
Exercise price range (pence)
150.00 to 322.00
150.00 to 322.00
338.40 to 427.00
338.40 to 427.00
338.40 to 427.00
–
Weighted average remaining contractual life (years)
2.48 2.62 0.61 0.79 0.78 8.16
Exercisable at24 February 2018
4,482,116 282.00 118,702 282.00 2,803,098 391.25 17,319,273 375.18 12,254,769 375.69 4,597,668 –
Exercise price range (pence)
282.00 282.00 338.40 to 427.00
338.40 to 427.00
338.40 to 427.00
–
Weighted average remaining contractual life (years)
0.43 0.43 0.61 0.79 0.78 6.93
For the 52 weeks ended 25 February 2017
Savings-related Share Option Scheme
Irish Savings-related Share Option Scheme
Approved Share Option Scheme
Unapproved Share Option Scheme
International Executive Share Option Scheme
Nil cost Share Option Schemes
Options WAEP Options WAEP Options WAEP Options WAEP Options WAEP Options WAEPOutstanding at 27 February 2016
278,367,865 173.32 8,263,111 189.46 6,514,959 407.19 32,459,966 387.09 24,534,811 386.76 20,802,806 –
Granted 32,923,969 190.00 1,681,721 190.00 – – – – – – 14,449,336 – Forfeited (53,597,182) 205.10 (3,587,857) 207.57 (1,495,505) 361.29 (8,009,380) 360.37 (6,039,761) 354.89 (6,880,744) – Exercised (831,771) 150.11 (17,668) 150.03 – – – – – – (731,078) – Outstanding at 25 February 2017
256,862,881 168.91 6,339,307 179.46 5,019,454 420.87 24,450,586 395.84 18,495,050 397.17 27,640,320 –
Exercise price range (pence)
150.00 to 364.00
150.00 to 364.00
338.40 to 473.75
338.40 to 473.75
338.40 to 473.75
–
Weighted average remaining contractual life (years)
3.06 2.88 1.10 1.45 1.43 8.70
Exercisable at25 February 2017
10,596,827 339.47 443,702 330.95 5,019,454 420.87 24,450,586 395.84 18,495,050 397.17 3,517,971 –
Exercise price range (pence)
282.00 to 364.00
322.00 to 364.00
338.40 to 473.75
338.40 to 473.75
338.40 to 473.75
–
Weighted average remaining contractual life (years)
0.43 0.43 1.10 1.45 1.43 7.70
Share options were exercised on a regular basis throughout the financial year. The average share price during the 52 weeks ended 24 February 2018 was 187.68p (2017: 184.26p).
The fair value of share options is estimated at the date of grant using the Black-Scholes or Monte Carlo option pricing model. The following table gives the assumptions applied to the options granted in the respective periods shown. No assumption has been made to incorporate the effects of expected early exercise.
2018 2017SAYE Nil cost SAYE Nil cost
Expected dividend yield (%) 2.2-3.6% – 1.4% –Expected volatility (%) 29-32% 33% 29-32% 29-36%Risk-free interest rate (%) 0.9-1.0% 0.1-0.2% 0.4-0.7% 0.2-0.5%Expected life of option (years) 3 or 5 3-6 3 or 5 3-6Weighted average fair value of options granted (pence) 41.86 68.04-180.35 53.14 61.00-159.64Probability of forfeiture (%) 7-11% – 10-11% –Share price (pence) 187.00 180.35 211.00 159.04-196.84Weighted average exercise price (pence) 168.00 – 190.00 –
Tesco PLC Annual Report and Financial Statements 2018120
Notes to the Group financial statements continued
Note 26 Share-based payments continuedShare option schemes continued Volatility is a measure of the amount by which a price is expected to fluctuate during a period. The measure of volatility used in the Group’s option pricing models is the annualised standard deviation of the continuously compounded rates of return on the share over a period of time. In estimating the future volatility of the Company’s share price, the Board considers the historical volatility of the share price over the most recent period that is generally commensurate with the expected term of the option, taking into account the remaining contractual life of the option.
Share bonus and incentive schemesSelected executives participate in the Group Bonus Plan, a performance-related bonus scheme. The amount paid to colleagues is based on a percentage of salary and is paid partly in cash and partly in shares. Bonuses are awarded to selected executives who have completed a required service period and depend on the achievement of corporate and individual performance targets.
Selected executives participate in the Performance Share Plan (2011) and the Long Term Incentive Plan (2015). Awards made under these plans will normally vest on the vesting date(s) set on the date of the award for nil consideration. Vesting will normally be conditional on the achievement of specified performance targets over a three year performance period and/or continuous employment.
Eligible ROI colleagues are able to participate in a Share Bonus Scheme, an all-employee profit-sharing scheme. Each year, colleagues may receive an award of either cash or shares based on a percentage of their earnings. Shares awarded to colleagues through the Share Bonus Scheme are held in trust on behalf of employees for a period of at least two years and for a maximum period of three years.
The Executive Directors participate in short-term bonus and long-term incentive schemes designed to align their interests with those of shareholders. Full details of these schemes can be found in the Directors’ remuneration report.
The fair value of shares awarded under these schemes is their market value on the date of award. Expected dividends are not incorporated into the fair value.
The number and weighted average fair value (WAFV) of share bonuses awarded during the financial year were:
2018 2017Number of
shares WAFV pence
Number of shares
WAFV pence
Irish Share Bonus Scheme – – – –Group Bonus Plan 21,898,988 180.35 33,293,571 159.04Performance Share Plan 24,638,938 180.94 61,533,740 161.82
Note 27 Post-employment benefitsPensionsThe Group operates a variety of post-employment benefit arrangements, covering both funded and unfunded defined benefit schemes and funded defined contribution schemes.
Defined contribution plansA defined contribution scheme, Tesco Retirement Savings Plan, is open to all Tesco employees in the UK.
A defined contribution pension scheme is one under which members pay contributions to an independently administered fund, into which the Group also pays contributions based upon a fixed percentage of the members’ contributions. The Group has no legal or constructive obligation to pay further contributions to this fund once its initial contributions have been paid. Members’ benefits upon retirement are then determined by the amount of contributions paid into the fund, together with the performance of the investments into which those contributions have been invested. Members are able to choose the investments into which their contributions are invested, as well as how they wish to receive benefits upon retirement. As a result, any risks associated with either the future value of benefits or the performance of the assets invested lie with the member.
The contributions payable for defined contribution schemes of £316m (2017: £341m) have been recognised in the Group income statement. This includes £108m (2017: £135m) of salaries paid as pension contributions.
Defined benefit plansThe most significant defined benefit plans are those for the Group’s employees in the UK (closed to future accrual) and ROI. The UK defined benefit deficit represents 96% of the Group deficit (2017: 98%).
United KingdomThe principal plan within the Group is the Tesco PLC Pension Scheme (the Scheme), which is a funded defined benefit pension scheme in the UK, the assets of which are held as a segregated fund and administered by the Trustee.
The Scheme is established under trust law and has a corporate trustee that is required to run the Scheme in accordance with the Scheme’s Trust Deed and Rules and to comply with all relevant legislation. Responsibility for governance of the Scheme lies with the Trustee. The Trustee is a company whose directors comprise:
i) representatives of the Group; andii) representatives of the Scheme participants, in accordance with its articles of association and UK pension law.
The Group considers two measures of the Scheme deficit. The accounting position is shown on the Group balance sheet. The funding position, calculated at the triennial actuarial assessment, is used to agree contributions made to the Scheme. The two measures will vary because they are for different purposes, and are calculated at different dates and in different ways. The key calculation difference is that the funding position considers the expected returns of Scheme assets when calculating the Scheme liability, whereas the accounting position calculated under IAS 19 discounts liabilities based on corporate bond yields.
During the financial year an independent actuary carried out the latest triennial actuarial assessment of the Scheme as at 31 March 2017 using the projected unit credit method. At 31 March 2017, the funding position was a deficit of £3,016m. The market value of the Scheme’s assets was £13,141m and these assets represented 81% of the benefits that had accrued to members, after allowing for expected increases in pensions in payment.
Following this assessment, an update to the plan to fund the UK pension deficit and to meet the expenses of the Scheme was agreed with the Trustee. Annual contributions will increase from £270m to £285m commencing April 2018. The annual contribution will be paid for 10 years, with contributions being assessed at the next Triennial review. The expenses for the year, which include the Pension Protection Fund levy, were £25m (2017: £22m). In the event that the Pension Protection Fund levy for the Scheme exceeds £75m over three years, the Group has agreed to pay this excess amount to the Scheme over the following three years. In addition, the market value of assets held as security in favour of the Scheme has increased from £500m to £575m.
121Tesco PLC Annual Report and Financial Statements 2018
Financial statements
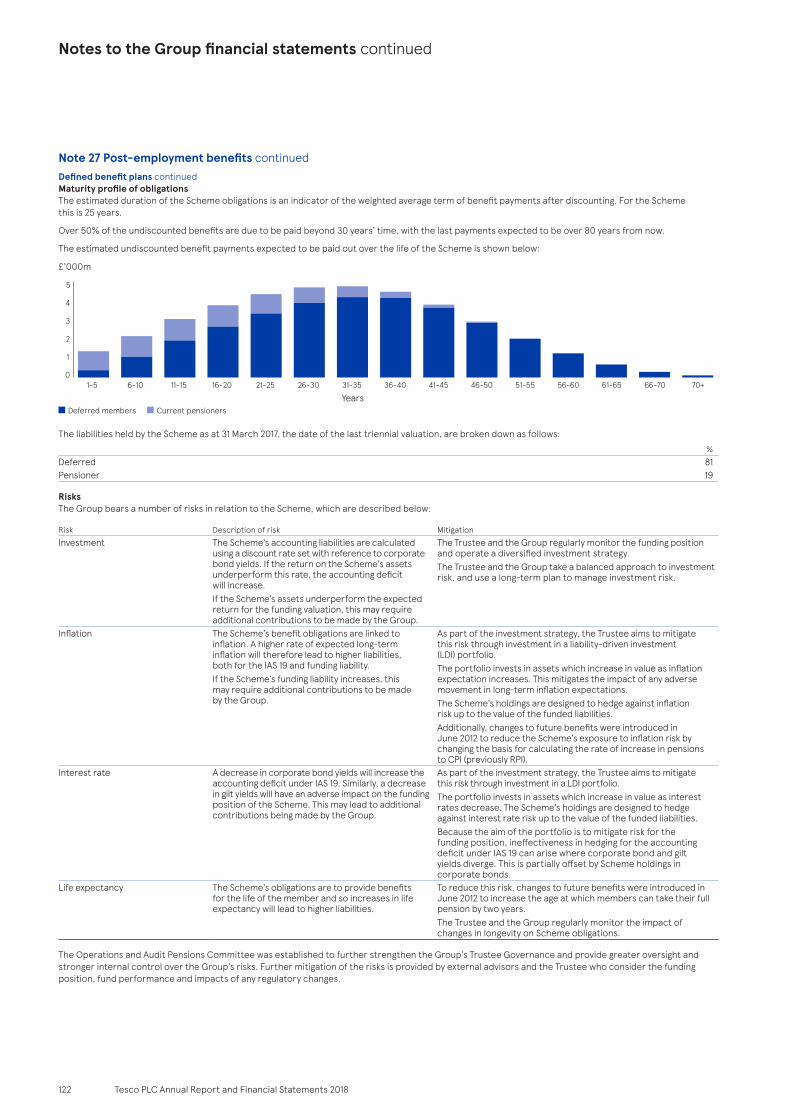
Note 27 Post-employment benefits continued Defined benefit plans continuedMaturity profile of obligationsThe estimated duration of the Scheme obligations is an indicator of the weighted average term of benefit payments after discounting. For the Scheme this is 25 years.
Over 50% of the undiscounted benefits are due to be paid beyond 30 years’ time, with the last payments expected to be over 80 years from now.
The estimated undiscounted benefit payments expected to be paid out over the life of the Scheme is shown below:
1-5 6-10 11-15 16-20 21-25 46-5026-30 31-35 41-4536-40 56-6051-55 61-65 66-70 70+
£’000m
Deferred members Current pensionersYears
0
3
2
1
4
5
The liabilities held by the Scheme as at 31 March 2017, the date of the last triennial valuation, are broken down as follows: %
Deferred 81Pensioner 19
RisksThe Group bears a number of risks in relation to the Scheme, which are described below:
Risk Description of risk MitigationInvestment The Scheme’s accounting liabilities are calculated
using a discount rate set with reference to corporate bond yields. If the return on the Scheme’s assets underperform this rate, the accounting deficit will increase.If the Scheme’s assets underperform the expected return for the funding valuation, this may require additional contributions to be made by the Group.
The Trustee and the Group regularly monitor the funding position and operate a diversified investment strategy.The Trustee and the Group take a balanced approach to investment risk, and use a long-term plan to manage investment risk.
Inflation The Scheme’s benefit obligations are linked to inflation. A higher rate of expected long-term inflation will therefore lead to higher liabilities, both for the IAS 19 and funding liability.If the Scheme’s funding liability increases, this may require additional contributions to be made by the Group.
As part of the investment strategy, the Trustee aims to mitigate this risk through investment in a liability-driven investment (LDI) portfolio.The portfolio invests in assets which increase in value as inflation expectation increases. This mitigates the impact of any adverse movement in long-term inflation expectations.The Scheme’s holdings are designed to hedge against inflation risk up to the value of the funded liabilities.Additionally, changes to future benefits were introduced in June 2012 to reduce the Scheme’s exposure to inflation risk by changing the basis for calculating the rate of increase in pensions to CPI (previously RPI).
Interest rate A decrease in corporate bond yields will increase the accounting deficit under IAS 19. Similarly, a decrease in gilt yields will have an adverse impact on the funding position of the Scheme. This may lead to additional contributions being made by the Group.
As part of the investment strategy, the Trustee aims to mitigate this risk through investment in a LDI portfolio.The portfolio invests in assets which increase in value as interest rates decrease. The Scheme’s holdings are designed to hedge against interest rate risk up to the value of the funded liabilities.Because the aim of the portfolio is to mitigate risk for the funding position, ineffectiveness in hedging for the accounting deficit under IAS 19 can arise where corporate bond and gilt yields diverge. This is partially offset by Scheme holdings in corporate bonds.
Life expectancy The Scheme’s obligations are to provide benefits for the life of the member and so increases in life expectancy will lead to higher liabilities.
To reduce this risk, changes to future benefits were introduced in June 2012 to increase the age at which members can take their full pension by two years. The Trustee and the Group regularly monitor the impact of changes in longevity on Scheme obligations.
The Operations and Audit Pensions Committee was established to further strengthen the Group’s Trustee Governance and provide greater oversight and stronger internal control over the Group’s risks. Further mitigation of the risks is provided by external advisors and the Trustee who consider the funding position, fund performance and impacts of any regulatory changes.
Tesco PLC Annual Report and Financial Statements 2018122
Notes to the Group financial statements continued

Note 27 Post-employment benefits continued Defined benefit plans continuedUK principal assumptions Financial assumptionsDuring the financial year, the Group has taken actuarial advice and decided to change the model used for deriving the discount rate assumption for valuing the Scheme’s liabilities under IAS 19.
The standard requires the discount rate to be determined by reference to market yields of high quality corporate bonds of suitable currency and term to the Scheme cash flows. The standard does not specify the approach that should be taken to extrapolate current market rates along the yield curve when there are no suitable corporate bonds of sufficient duration. As the term of the Scheme’s liabilities is particularly long, the Group balance sheet is sensitive to the extrapolation approach adopted. Under the previous model, the extrapolation was in line with the movement in the gilt yield curve. The model now adopted by the Group extrapolates based on the trend observable in corporate bond yields. In the Group’s view, this more appropriately reflects long-dated corporate bond yields for the cash flow profile of the Scheme’s liabilities.
The impact of the change in discount rate model was to give a £2.0bn gain on change of financial assumptions at the point of the transition. If the transition had occurred at the balance sheet date, the gain would have been £1.3bn.
The major assumptions, on a weighted average basis, used by the actuaries to value the defined benefit obligation were as follows:
2018%
2017%
Discount rate 2.9 2.5Price inflation 3.1 3.2Rate of increase in deferred pensions* 2.1 2.2Rate of increase in pensions in payment*
Benefits accrued before 1 June 2012 2.9 3.0Benefits accrued after 1 June 2012 2.2 2.2
* In excess of any Guaranteed Minimum Pension (GMP) element.
Mortality assumptionsThe Group, in consultation with an independent actuary, conducted a mortality analysis under the Scheme as part of the triennial actuarial valuation process. Subsequent to this analysis, the Group adopted the best estimate assumptions for the calculation of the IAS 19 pension liability for the main UK scheme.
The mortality assumptions used are based on tables that have been projected to 2017 with CMI 2016 improvements. In addition, the allowance for future mortality improvements from 2017 is in line with CMI 2016 improvements, with a long-term improvement rate of 1.25% per annum.
The following table illustrates the expectation of life of an average member retiring at age 65 at the reporting date and a member reaching age 65 at reporting date +25 years. A comparison between the two retiree dates illustrates the expected improvements in mortality over the time period.
2018Years
2017Years
Retiring at reporting date at age 65: Male 22.3 23.2Female 24.0 24.5
Retiring at reporting date +25 years at age 65: Male 23.8 25.5Female 26.0 26.9
The base tables used in calculating the mortality assumptions are different for various categories of members, as shown below:
Pensioner Non-PensionerMale Staff 100% of SAPS S2 Normal 105% of SAPS S2 Normal
Senior Manager 85% of SAPS S2 Normal Light 87% of SAPS S2 Normal LightFemale Staff 100% of SAPS S2 All 98% of SAPS S2 All
Senior Manager 85% of SAPS S2 All 86% of SAPS S2 All
Sensitivity analysis of significant actuarial assumptionsThe sensitivity of significant assumptions upon the UK defined benefit obligations are detailed below:
2018 2017
Financial assumptions – Increase/(decrease) in UK defined benefit obligationDiscount rate
£mInflation rate
£mDiscount rate
£mInflation rate
£mImpact of 0.1% increase of the assumption (388) 339 (526) 448Impact of 0.1% decrease of the assumption 404 (323) 545 (409)Impact of 1.0% increase of the assumption (3,377) 3,651 (4,536) 4,984Impact of 1.0% decrease of the assumption 4,718 (2,876) 6,541 (3,835)
Mortality assumptions – Increase/(decrease) in UK defined benefit obligation2018
£m2017
£mImpact of 1 year increase in longevity 630 818Impact of 1 year decrease in longevity (630) (818)
Sensitivities are calculated by changing the relevant assumption while holding all other assumptions constant. The sensitivities reflect the range of recent assumption movements, and illustrate that the financial assumption sensitivities do not move in a linear fashion. Movements in the defined benefit obligation from discount rate and inflation rate changes may be partially offset by movements in assets.
123Tesco PLC Annual Report and Financial Statements 2018
Financial statements

Note 27 Post-employment benefits continued Defined benefit plans continuedOverseasThe most significant overseas scheme is the funded defined benefit scheme which operates in ROI. An independent actuary, using the projected unit credit method, carried out the latest actuarial assessment of the ROI scheme as at 24 February 2018. At the financial year end, the accounting deficit relating to ROI was £104m (2017: £107m).
The accounting valuation has been based on the most recent actuarial valuation and updated by independent actuaries to take account of the requirements of the applicable accounting standard in order to assess the liabilities of the scheme as at 24 February 2018. The scheme’s assets are stated at their market values as at 24 February 2018. The liabilities relating to retirement healthcare benefits have also been determined in accordance with the applicable accounting standard.
Post-employment benefits other than pensionsThe Group operates a scheme offering post-retirement healthcare benefits. The cost of providing these benefits has been accounted for on a similar basis to that used for defined benefit pension schemes.
The liability as at 24 February 2018 of £11m (2017: £13m) was determined in accordance with the advice of independent actuaries. During the financial year, £nil (2017: £nil) has been charged to the Group income statement and £1m (2017: £1m) of benefits were paid.
Plan assetsThe Group’s pension schemes hold assets that both provide returns and mitigate risk, including the volatility of future pension payments.
The table below shows a breakdown of the combined investments held by the Group’s schemes:
2018 2017Quoted
£mUnquoted
£mTotal
£m %Quoted
£mUnquoted
£mTotal
£m %EquitiesUK 284 – 284 2% 365 – 365 3%Europe 823 – 823 6% 628 – 628 5%Rest of the world 3,828 – 3,828 29% 3,894 – 3,894 29%
4,935 – 4,935 37% 4,887 – 4,887 37%BondsGovernment 1,029 – 1,029 8% 1,008 – 1,008 7%Corporates – investment grade 487 – 487 3% 501 – 501 4%Corporates – non-investment grade 7 – 7 0% – – – –
1,523 – 1,523 11% 1,509 – 1,509 11%PropertyUK – 917 917 7% – 787 787 6%Rest of the world – 381 381 3% – 373 373 3%
– 1,298 1,298 10% – 1,160 1,160 9%Alternative assetsHedge funds – 405 405 3% – 489 489 4%Private equity – 694 694 5% – 707 707 5%Other 14 740 754 6% 13 540 553 4%
14 1,839 1,853 14% 13 1,736 1,749 13%Liability Driven Investment (LDI) portfolios 3,301 (24) 3,277 25% 3,321 428 3,749 29%Cash 349 – 349 3% 142 – 142 1%Total market value of assets 10,122 3,113 13,235 100% 9,872 3,324 13,196 100%
Quoted assets are those with a quoted price in an active market.
The LDI category, previously disclosed within Government bonds, consists of assets, including gilts and index-linked gilts, of the value of £5,912m (2017: £5,586m) and associated repurchase agreements and swaps of £(2,635)m (2017: £(1,837)m).
The plan assets include £185m (2017: £176m) relating to property used by the Group. Group property with net carrying value of £509m (2017: £411m) (Note 11) and a value to the Scheme of £575m (2017: £500m) is held as security in favour of the Scheme.
Tesco PLC Annual Report and Financial Statements 2018124
Notes to the Group financial statements continued

Note 27 Post-employment benefits continued Defined benefit plans continuedMovement in the Group pension deficit during the financial year Changes in the fair value of defined benefit pension assets, including all movements of discontinued operations up to classification as held for sale, are as follows:
2018£m
2017£m
Opening fair value of defined benefit pension assets 13,196 10,302Interest income 326 385Return on plan assets (less)/greater than discount rate (57) 2,689Contributions by employer 34 28Additional contributions by employer 245 248Actual member contributions 2 2Foreign currency translation 8 13Benefits paid (519) (471)Closing fair value of defined benefit pension assets 13,235 13,196
Changes in the present value of defined benefit pension obligations, including all movements of discontinued operations up to classification as held for sale, are as follows:
2018£m
2017£m
Opening defined benefit pension obligations (19,817) (13,477)Current service cost (38) (35)Interest cost (488) (498)Gains/(losses) on change of financial assumptions 2,190 (6,455)Experience gains 452 199Gains on changes of demographic assumptions 680 –Foreign currency translation (13) (25)Benefits paid 519 471Actual member contributions (2) (2)Transfer to disposal group classified as held for sale – 5Closing defined benefit pension obligations (16,517) (19,817)
A summary of changes in the Group deficit, including movements of discontinued operations up to classification as held for sale, is set out below:
2018£m
2017£m
Deficit in schemes at the beginning of the year (6,621) (3,175)Current service cost (38) (35)Net pension finance cost (162) (113)Contributions by employer 34 28Additional contributions by employer 245 248Foreign currency translation (5) (12)Remeasurements 3,265 (3,567)Transfer to disposal group classified as held for sale – 5Deficit in schemes at the end of the year (3,282) (6,621)Deferred tax asset (Note 6) 554 1,122Deficit in schemes at the end of the year, net of deferred tax (2,728) (5,499)
The amounts that have been charged to the Group income statement and Group statement of comprehensive income/(loss), excluding discontinued operations, are as follows:
2018£m
2017£m
Analysis of the amount charged to operating profit:Current service cost (38) (35)Total charge to operating profit (38) (35)
Analysis of the amount credited/(charged) to finance income/(cost):Interest on defined benefit pension assets 326 385Interest on defined benefit pension obligations (488) (498)Net pension finance cost (Note 5) (162) (113)Total charge to the Group income statement (200) (148)
Analysis of the amount recognised in other comprehensive income: Return on plan assets (less)/greater than discount rate (57) 2,689Experience gains on defined benefit pension obligations 452 199Demographic assumption gains on defined benefit pension obligations 680 –Financial assumption gains/(losses) on defined benefit pension obligations 2,190 (6,455)Foreign currency translation (5) (12)Total gains/(losses) recognised in other comprehensive income 3,260 (3,579)
125Tesco PLC Annual Report and Financial Statements 2018
Financial statements

Note 27 Post-employment benefits continuedIFRIC 14 IFRIC 14 ‘The Limit on a Defined Benefit Asset, Minimum Funding Requirements and their Interaction’ is a supplement to IAS 19 which can, in some instances, require companies to limit pension surpluses where they exist, or recognise additional liabilities relating to minimum funding requirements.
The Group is not required to recognise any additional liabilities, as any future economic benefits will be available to the Group by way of future refunds or reductions to future contributions.
Note 28 Called up share capital2018
Ordinary shares of 5 pence each2017
Ordinary shares of 5 pence eachNumber £m Number £m
Allotted, called up and fully paid:At the beginning of the year 8,174,932,553 409 8,141,083,114 407Share options exercised 5,184,066 – 849,439 –Share bonus awards issued 12,000,000 1 33,000,000 2At the end of the year 8,192,116,619 410 8,174,932,553 409
During the financial year, 5.2 million (2017: 0.8 million) ordinary shares of 5 pence each were issued in relation to share options for an aggregate consideration of £8m (2017: £1m) and 12.0 million (2017: 33.0 million) ordinary shares of 5 pence each were issued in relation to share bonus awards.
The Group has implemented a share forfeiture programme following the completion of a tracing and notification exercise to any shareholders who have not had contact with the Company over the past 12 years, in accordance with the provisions set out in the Company’s Articles of Association. Under the share forfeiture programme the shares and dividends associated with shares of untraced members have been forfeited, with the resulting proceeds transferred to the Group to use for good causes in line with the Group’s corporate responsibility strategy. During the financial year, the Group received £3m proceeds from sale of untraced shares and £2m write-back of unclaimed dividends, which are reflected in share premium and retained earnings respectively.
As at 24 February 2018, the Directors were authorised to purchase up to a maximum in aggregate of 817.5 million (2017: 814.1 million) ordinary shares.
The holders of ordinary shares are entitled to receive dividends as declared from time to time and are entitled to one vote per share at general meetings of the Company.
On 5 March 2018, the Group completed a merger with the Booker Group. A total of 1,548 million new ordinary shares of the Company have been issued as a result of the transaction. See Note 35 for further details.
Note 29 Related party transactionsTransactions between the Company and its subsidiaries, which are related parties, have been eliminated on consolidation and are not disclosed in this note. Transactions between the Group and its joint ventures and associates are disclosed below:
TransactionsJoint ventures Associates
2018£m
2017£m
2018£m
2017£m
Sales to related parties 474 418 – –Purchases from related parties 396 416 18 16Dividends received 15 17 11 11Injection of equity funding 21 – – –
Sales to related parties consist of services/management fees and loan interest.
Purchases from related parties include £275m (2017: £286m) of rentals payable to the Group’s joint ventures (including those joint ventures formed as part of the sale and leaseback programme).
Transactions between the Group and the Group’s pension plans are disclosed in Note 27.
BalancesJoint ventures Associates
2018£m
2017£m
2018£m
2017£m
Amounts owed to related parties 20 17 – –Amounts owed by related parties 27 16 – –Loans to related parties (net of deferred profits)* 138 137 – –Loans from related parties (Note 21) 6 6 – –* Loans to related parties of £138m (2017: £137m) are presented net of deferred profits of £54m (2017: £54m) historically arising from the sale of property assets to joint ventures.
A number of the Group’s subsidiaries are members of one or more partnerships to whom the provisions of the Partnerships (Accounts) Regulations 2008 (Regulations) apply. The financial statements for those partnerships have been consolidated into these financial statements pursuant to Regulation 7 of the Regulations.
Tesco PLC Annual Report and Financial Statements 2018126
Notes to the Group financial statements continued

Note 29 Related party transactions continued Transactions with key management personnelMembers of the Board of Directors and Executive Committee of Tesco PLC are deemed to be key management personnel.
Key management personnel compensation for the financial year was as follows:
2018£m
2017£m
Salaries and short-term benefits 17 13Pensions and cash in lieu of pensions 2 2Share-based payments 19 17Joining costs and loss of office costs 4 1
42 33Attributable to:The Board of Directors (including Non-executive Directors) 12 12Executive Committee (members not on the Board of Directors) 30 21
42 33
Of the key management personnel who had transactions with Tesco Bank during the financial year, the following are the balances at the financial year end:
Credit card, mortgage and personal loan balances
Current and saving deposit accounts
Number of key management
personnel £m
Number of key management
personnel £mAt 24 February 2018 7 1 5 –At 25 February 2017 6 1 4 –
Note 30 Analysis of changes in net debt
At 25 February
2017£m
Cash flow£m
Fair value movements
£m
Foreign exchange
movements£m
Interest income/ (charge)
£m
Other non-cash
movements £m
Non-cash movements
– Turkey disposal
£m
Re- classifications of movements in net debt of
the disposal group
£m
At 24 February
2018£m
Total GroupBank and other borrowings (11,712) 3,408 91 (49) (56) – 73 (73) (8,318)Finance lease payables (114) 10 – (2) – (16) – – (122)Net derivative financial instruments 893 (253) (195) – 20 – – – 465Arising from financing activities (10,933) 3,165 (104) (51) (36) (16) 73 (73) (7,975)Cash and cash equivalents 3,821 212 – 15 – – – 11 4,059Short-term investments 2,727 (1,697) – (1) – – – – 1,029Joint venture loans 137 – – – – 1 – – 138Interest and other receivables 1 (27) – – 27 – – – 1Interest payables (167) 351 – (3) (362) – 3 (3) (181)Net derivative interest 28 (23) – – 11 – – – 16Net debt of the disposal group (65) – – – – – – 65 –Total Group (4,451) 1,981 (104) (40) (360) (15) 76 – (2,913)Tesco BankBank and other borrowings (1,440) (150) 6 – – – – – (1,584)Net derivative financial instruments (105) – 63 – – – – – (42)Arising from financing activities (1,545) (150) 69 – – – – – (1,626)Cash and cash equivalents 789 515 – – – – – – 1,304Joint venture loans 34 – – – – – – – 34Interest payables – 4 – – (4) – – – –Tesco Bank (722) 369 69 – (4) – – – (288)RetailBank and other borrowings (10,272) 3,558 85 (49) (56) – 73 (73) (6,734)Finance lease payables (114) 10 – (2) – (16) – – (122)Net derivative financial instruments 998 (253) (258) – 20 – – – 507Arising from financing activities (9,388) 3,315 (173) (51) (36) (16) 73 (73) (6,349)Cash and cash equivalents 3,032 (303) – 15 – – – 11 2,755Short-term investments 2,727 (1,697) – (1) – – – – 1,029Joint venture loans 103 – – – – 1 – – 104Interest and other receivables 1 (27) – – 27 – – – 1Interest payables (167) 347 – (3) (358) – 3 (3) (181)Net derivative interest 28 (23) – – 11 – – – 16Net debt of the disposal group (65) – – – – – – 65 –Net debt (3,729) 1,612 (173) (40) (356) (15) 76 – (2,625)
Net debt excludes the net debt of Tesco Bank but includes that of discontinued operations. Balances and movements in respect of the total Group and Tesco Bank are presented to allow reconciliation between the Group balance sheet and the Group cash flow statement.
127Tesco PLC Annual Report and Financial Statements 2018
Financial statements

Note 30 Analysis of changes in net debt continuedReconciliation of net cash flow to movement in Net debt
2018£m
2017£m
Net increase/(decrease) in cash and cash equivalents 212 881Elimination of Tesco Bank movement in cash and cash equivalents (515) (235)Retail cash movement in other Net debt items:
Net increase/(decrease) in short-term investments (1,697) (736)Net increase/(decrease) in joint venture loans – (15)Net (increase)/decrease in borrowings and lease financing 3,568 1,863Net cash flows from derivative financial instruments (253) (475)Net interest paid on components of Net debt 297 477
Change in Net debt resulting from cash flow 1,612 1,760Retail net interest charge on components of Net debt (356) (472)Retail fair value and foreign exchange movements (213) 111Debt disposed on disposal of Turkish operations 76 –Retail other non-cash movements (15) (18)(Increase)/decrease in Net debt 1,104 1,381Opening Net debt (3,729) (5,110)Closing Net debt (2,625) (3,729)
Note 31 Business combinations and disposalsBusiness combinationsThe Group has paid a further £25m of deferred consideration in the financial year, related to its obligations under the purchase agreement for the acquisition of Sociomantic Labs from prior years.
On 26 October 2017, the Group obtained sole control of Tesco Mobile Ireland Limited (TMI), previously accounted for as a joint venture, through acquisition of Three Ireland Limited’s (Three) 50% interest in TMI. The Group paid £2m to Three for their 50% interest and recognised a gain of £3m. The TMI acquisition generated goodwill of £4m.
DisposalsOn 1 March 2017, the Group announced the completion of the disposal of its 95.5% controlling stake in the Kipa business in Turkey following the receipt of all local regulatory approvals. See Note 7 for further details.
On 30 June 2017, the Group disposed of its 8.8% shareholding in Lazada to Alibaba Group Holding Limited (Alibaba) for net cash consideration of $254m (£196m). The Group’s investment in Lazada was recognised as an available-for-sale financial asset and classified as Level 3 in the fair value hierarchy. At the time of the disposal, the investment was revalued resulting in a gain of £70m recognised in the Group statement of comprehensive income/(loss). The available-for-sale reserve, including £54m recorded prior to the current year, was reclassified to the Group income statement resulting in a pre-tax profit on disposal of £124m. The disposal was subject to capital gains tax of £25m, which has been recognised as a reduction in the Group’s deferred tax asset. The transaction has been included within exceptional items, classified as ‘Investment disposal’ within administrative expenses. See Note 4.
On 4 December 2017, the Group disposed of the trade and assets of its opticians business to Vision Express (UK) Ltd for net cash consideration of £45m, resulting in a pre-tax profit of £38m included within exceptional items, which was classified as ‘Disposal of opticians business’ within administrative expenses. Included in the pre-tax profit is £3m contingent consideration. See Note 4.
Note 32 Commitments and contingenciesCapital commitmentsAt 24 February 2018, there were commitments for capital expenditure contracted for, but not incurred, of £116m (2017: £115m), principally relating to store development.
Contingent liabilitiesThere are a number of contingent liabilities that arise in the normal course of business, which if realised, are not expected to result in a material liability to the Group. The Group recognises provisions for liabilities when it is more likely than not that a settlement will be required and the value of such a payment can be reliably estimated.
For details of assets held under finance leases, which are pledged as security for the finance lease liabilities, see Note 11.
As previously reported, law firms in the UK have announced the intention of forming claimant groups to commence litigation against the Group for matters arising out of or in connection with its overstatement of expected profits in 2014, and purport to have secured third party funding for such litigation. In this regard, the Group has received two High Court claims against Tesco PLC. The first was received on 31 October 2016 from a group of 112 investors (now reduced to 78 investors) and the second was received on 5 December 2016 from an investment company and a trust company. The merit, likely outcome and potential impact on the Group of any such litigation that either has been or might potentially be brought against the Group is subject to a number of significant uncertainties and therefore, the Group cannot make any assessment of the likely outcome or quantum of any such litigation as at the date of this disclosure.
Prior to the disposal of its Korean operations (Homeplus), Tesco PLC provided guarantees in respect of 13 Homeplus lease agreements in Korea in the event of termination of the relevant lease agreement by the landlord due to Homeplus’ default. Entities controlled by MBK and CPPIB, as the purchasers of Homeplus, undertook to procure Tesco PLC’s release from these guarantees following the disposal of Homeplus. Eight currently remain outstanding. This liability decreases over time with all relevant leases expiring in the period between 2026 and 2033. Tesco PLC has the benefit of an indemnity from the purchasers of Homeplus for any claims made under such guarantees. The maximum potential liability under the lease guarantees is between KRW366bn (£243m) and KRW517bn (£344m).
Tesco Stores Limited has received claims from current and former Tesco store colleagues alleging that their work is of equal value to that of colleagues working in Tesco’s distribution centres and that differences in terms and conditions relating to pay are not objectively justifiable. The claimants are seeking the differential between the pay terms looking back, and equivalence of pay terms moving forward. At present, the likely number of claims that may be received and the merit, likely outcome and potential impact on the Group of any such litigation is subject to a number of significant uncertainties and therefore, the Group cannot make any assessment of the likely outcome or quantum of any such litigation as at the date of this disclosure. There are substantial factual and legal defences to these claims and the Group intends to defend them.
Tesco PLC Annual Report and Financial Statements 2018128
Notes to the Group financial statements continued

Note 32 Commitments and contingencies continuedSubsidiary audit exemptionsThe following UK subsidiary undertakings are exempt from the requirements of the Companies Act 2006 (Act) relating to the audit of individual accounts by virtue of section 479A of that Act.
Name Company
numberTesco International Internet Retailing Limited
00041420
Dillons Newsagents Limited 00140624One Stop Community Stores Limited
00198980
Paper Chain (East Anglia) Limited 00256555Cullen’s Stores Limited 00279206Stewarts Supermarkets Limited 00299400Europa Foods Limited 00658774Verulam Properties Limited 00726573Gibbs News Limited 00744680T&S Stores Limited 01228935Day and Nite Stores Limited 01746058Adminstore Limited 01882853
Name Company
numberSpen Hill Management Limited 02460426One Stop Convenience Stores Limited
02467178
Nutricentre Limited 02602894Harts the Grocers (Russel Square) Limited
03044236
Tesco (Overseas) Limited 01611684Tesco Mobile Communications Limited 04780729Tesco Mobile Services Limited 04780734Spen Hill Developments Limited 04827219Tapesilver Limited 05205362Launchgrain Limited 05260856Buttoncable Limited 05294246Buttoncase Limited 05298861
Name Company
numberTesco Aqua (FinCo1) Limited 05888959Armitage Finance ULC 05966324Spen Hill Regeneration Limited 06418300Halesworth SPV Limited 06479506Tesco PENL Limited 06479938Cheshunt Finance Unlimited 06807552Tesco FFC Limited 08859202Tesco Aqua (3LP) Limited 09947521Tesco Red (3LP) Limited 10127765The Tesco Aqua Limited Partnership LP011520The Tesco Red Limited Partnership LP011522Faraday Properties Limited SC119496WM. Low Supermarkets Limited SC119497
Tesco PLC will guarantee all outstanding liabilities that these subsidiaries are subject to as at the financial year ended 24 February 2018 in accordance with section 479C of the Act, as amended by the Companies and Limited Liability Partnerships (Accounts and Audit Exemptions and Change of Accounting Framework) Regulations 2012.
Tesco PLC has irrevocably guaranteed the liabilities and commitments of the following Irish subsidiary undertakings, which undertakings have been exempted pursuant to Section 357 of the Companies Act, 2014 of Ireland from the provisions of Section 347 & 348 of that Act: Monread Developments Limited; Edson Properties Limited; Edson Investments Limited; Cirrus Finance (2009) Limited; Commercial Investments Limited; Chirac Limited; Clondalkin Properties Limited; Tesco Ireland Pension Trustees Limited; Orpingford; Tesco Trustee Company of Ireland Limited; WSC Properties Limited; Thundridge; Pharaway Properties Limited; R.J.D. Holdings; Nabola Development Limited; PEJ Property Investments Limited; Cirrus Finance Limited; Tesco Ireland Limited; Wanze Properties (Dundalk) Limited; Tesco Ireland Holdings Limited; Marine Coffee Company Nominees Limited; Marine Coffee Company Holdings Limited; and Tesco Mobile Ireland Limited.
Tesco BankAt 28 February 2018, Tesco Bank had contractual lending commitments totalling £12.4bn (2017: £12.1bn). The contractual amounts represent the amounts that would be at risk should the available facilities be fully drawn upon and not the amounts at risk at the reporting date.
Note 33 Tesco Bank capital resourcesThe following tables analyse the regulatory capital resources of Tesco Personal Finance PLC (TPF), being the regulated entity at the balance sheet date:
2018£m
2017£m
Common equity tier 1 capital: Shareholders’ funds and non-controlling interests, net of tier 1 regulatory adjustments 1,491 1,381Tier 2 capital: Qualifying subordinated debt 235 235Other interests 99 63Total tier 2 regulatory adjustments (34) (31)Total regulatory capital 1,791 1,648
On 27 June 2013, the final CRD IV rules were published in the Official Journal of the European Union. Following the publication of the CRD IV rules, the Prudential Regulation Authority (PRA) issued a policy statement on 19 December 2013 detailing how the rules will be enacted within the UK with corresponding timeframes for implementation. The CRD IV rules are currently being phased in. The following tables analyse the regulatory capital resources of TPF (being the regulated entity) applicable as at the financial year end.
The movement of common equity tier 1 capital during the financial year is analysed as follows:2018
£m2017
£mAt the beginning of the year 1,381 1,218Share capital and share premium – –Profit attributable to shareholders 130 153Other reserves 6 5Ordinary dividends (50) (50)Movement in material holdings 3 3Increase in intangible assets 29 64Other – Tier 1 – 1At the end of the year, excluding CRD IV adjustments 1,499 1,394CRD IV adjustments – deferred tax (assets)/liabilities related to intangible assets (8) (13)At the end of the year, including CRD IV adjustments 1,491 1,381
It is the Group’s policy to maintain a strong capital base, to expand it as appropriate and to utilise it efficiently throughout its activities to optimise the return to shareholders while maintaining a prudent relationship between the capital base and the underlying risks of the business. In carrying out this policy, the Group has regard to the supervisory requirements of the PRA.
129Tesco PLC Annual Report and Financial Statements 2018
Financial statements

Note 34 Lease commitmentsFinance lease commitments – Group as lesseeThe Group has finance leases for various items of plant, equipment, fixtures and fittings. There are also a small number of buildings that are held under finance leases. The fair value of the Group’s lease obligations approximate their carrying value.
Future minimum lease commitments under finance leases and hire purchase contracts, together with the present value of the net minimum lease commitments, are as follows:
Minimum lease commitments 2018
£m2017
£mWithin one year 20 19Greater than one year but less than five years 67 57After five years 120 126Total minimum lease commitments 207 202Less future finance charges (85) (88)Present value of minimum lease commitments 122 114
Present value of net minimum lease commitments
2018£m
2017£m
Within one year 12 11Greater than one year but less than five years 40 30After five years 70 73Total minimum lease commitments 122 114Analysed as:Current 12 11Non-current 110 103 122 114
Operating lease commitments – Group as lesseeFuture minimum lease commitments under non-cancellable operating leases are as follows:
2018£m
2017£m
Within one year 1,077 1,199Greater than one year but less than five years 3,552 3,767After five years 6,788 7,395Total minimum lease commitments 11,417 12,361
Future minimum lease commitments under non-cancellable operating leases after five years are analysed further as follows:2018
£m2017
£mGreater than five years but less than ten years 3,035 3,161Greater than ten years but less than fifteen years 2,008 2,225After fifteen years 1,745 2,009Total minimum lease commitments – after five years 6,788 7,395
The Group has used operating lease commitments discounted at 7% (2017: 7%) of £6,931m (2017: £7,440m) in its calculation of total indebtedness. The discounted operating lease commitment included in total indebtedness is not an appropriate proxy for the expected impact of recognising a lease liability under IFRS 16 ‘Leases’, primarily due to differences in the discount rates used and the treatment of additional lease rentals arising from contracts that contain extend or buy conditions, amongst other differences.
Operating lease commitments represent rentals payable by the Group for certain of its retail, distribution and office properties and other assets such as motor vehicles. The leases have varying terms, purchase options, escalation clauses and renewal rights. Purchase options and renewal rights, where they occur, are at market value. Escalation clauses are in line with market practices and include inflation linked, fixed rates, resets to market rents and hybrids of these.
Tesco PLC Annual Report and Financial Statements 2018130
Notes to the Group financial statements continued

Note 34 Lease commitments continuedOperating lease commitments – Group as lessee continuedThe Group has lease-break options on certain sale and leaseback transactions. These options are exercisable if the Group exercises an existing option to buy back, at market value and at a specified date, either the leased asset or the equity of the other joint venture partner. No commitment has been included in respect of the buy-back option as the option is at the Group’s discretion. The Group is not obliged to pay lease rentals after that date, therefore minimum lease commitments exclude those falling after the buy-back date. The current market value of these properties is £2.8bn (2017: £2.9bn) and the total undiscounted lease rentals, if they were to be incurred following the option exercise date, would be £2.6bn (2017: £2.6bn) using current rent values, as shown below.
The additional lease rentals, if incurred, following the option exercise date would be as follows:2018
£m2017
£mWithin one year 2 23Greater than one year but less than five years 265 170Greater than five years but less than ten years 738 709Greater than ten years but less than fifteen years 659 670After fifteen years 935 1,019Total undiscounted contingent additional lease rentals 2,599 2,591Total discounted contingent additional lease rentals at 7% 1,159 1,107
The lease break options are exercisable between 2018 and 2023.
Operating lease commitments with joint ventures and associates In prior years, the Group entered into several joint ventures and associates, and sold and leased back properties to and from these joint ventures and associates. The terms of these sale and leasebacks varied. However, common factors included: the sale of the properties to the joint venture or associate at market value; options within the lease for the Group to repurchase the properties at market value; market rent reviews; and 20 to 30 full-year lease terms. The Group reviews the substance as well as the form of the arrangements when determining the classification of leases as operating or finance. All of the leases under these arrangements are operating leases.
Operating lease receivables – Group as lessorThe Group both rents out its properties and also sublets various leased buildings under operating leases. At the balance sheet date, the following future minimum lease amounts are contractually receivable from tenants:
2018£m
2017£m
Within one year 202 194Greater than one year but less than five years 291 298After five years 222 229Total minimum lease receivables 715 721
Note 35 Events after the reporting periodBooker Group PLCOn 27 January 2017, the Group announced that it had reached an agreement on the terms of a recommended share and cash merger with Booker Group PLC, the UK’s leading food wholesaler, subject to shareholder and regulatory approvals. Following an in-depth ‘Phase 2’ investigation by the Competition and Markets Authority (CMA), regulatory approval was granted on 20 December 2017. Shareholder approval was obtained on 28 February 2018 and the transaction completed on 5 March 2018. The transaction will be treated as an acquisition, with the merger meeting the definition of a business combination per IFRS 3.
The merger builds on the Group’s core expertise of sourcing, distributing and selling food in the UK market and will enable the Group to enter the faster growing out of home food consumption market. The Directors expect the merger to deliver financial synergies of at least £200m per annum by the end of the third year following completion.
The consideration of £3,893m was satisfied by cash of £766m and shares of £3,127m, with Booker Group PLC shareholders receiving 0.861 Tesco PLC ordinary shares and 42.6 pence in cash per Booker Group PLC share held. A total of 1,548 million new ordinary shares of the Company have been issued as a result of the transaction, with the new shares carrying equal voting and distribution rights as the existing ordinary shares. The fair value of the shares is based on the published share price on 2 March 2018 of 202.0 pence.
Given the proximity of the transaction to the announcement of the Group’s financial statements, a full purchase price allocation exercise has not yet been completed and the valuation of the assets acquired is subject to amendment on finalisation of the fair value exercise. Acquired net assets have a provisional value of £543m prior to fair value adjustments. This reflects the net assets of Booker Group PLC as at 8 September 2017, as disclosed in their most recent published financial information. The remaining £3,350m will be allocated between intangible assets, including goodwill, software and other intangible assets, with the majority expected to be allocated to goodwill representing the synergies expected from the merger. None of the goodwill is expected to be deductible for tax purposes.
131Tesco PLC Annual Report and Financial Statements 2018
Financial statements

Notes
24 February 2018
£m
25 February 2017
£mNon-current assetsInvestments 6 13,093 13,082Receivables 7 20 18Derivative financial instruments 12 952 1,274 14,065 14,374Current assetsDerivative financial instruments 12 – 155Receivables 7 6,625 7,469Short-term investments 8 369 1,398Cash and cash equivalents 9 793 790 7,787 9,812Current liabilitiesBorrowings 11 (693) (840)Payables 10 (4,767) (4,978) (5,460) (5,818)Net current assets 2,327 3,994
Non-current liabilitiesBorrowings 11 (3,632) (5,440)Derivative financial instruments 12 (488) (466) (4,120) (5,906)Net assets 12,272 12,462EquityShare capital 15 410 409Share premium 5,107 5,096All other reserves 62 162Retained earnings (including profit/(loss) for the financial year of £(136)m (2017: £(247)m)) 6,693 6,795Total equity 12,272 12,462
The notes on pages 134 to 139 form part of these financial statements.
Dave LewisAlan Stewart
DirectorsThe Parent Company financial statements on pages 132 to 139 were authorised for issue by the Directors on 10 April 2018 and are subject to the approval of the shareholders at the AGM on 15 June 2018.
Tesco PLC Registered number 00445790
Tesco PLC Annual Report and Financial Statements 2018132
Tesco PLC – Parent Company balance sheet

All other reserves
Share capital
£m
Share premium
£m
Capital redemption
reserves £m
Hedging reserves
£m
Treasury shares
£m
Retained earnings
£m
Total equity
£mAt 25 February 2017 409 5,096 16 168 (22) 6,795 12,462Loss for the year – – – – – (136) (136)Other comprehensive income/(loss)Net fair value gains/(losses) on cash flow hedges – – – (5) – – (5)Reclassified and reported in the Company income statement – – – (127) – – (127)Tax relating to components of other comprehensive income – – – 26 – – 26Total other comprehensive income/(loss) – – – (106) – – (106)Total comprehensive income/(loss) – – – (106) – (136) (242)Transactions with ownersPurchase of treasury shares – – – – (14) – (14)Share-based payments – – – – 20 114 134Issue of shares 1 11 – – – – 12Dividends – – – – – (80) (80)Total transactions with owners 1 11 – – 6 34 52At 24 February 2018 410 5,107 16 62 (16) 6,693 12,272
All other reserves
Share capital
£m
Share premium
£m
Capital redemption
reserves £m
Hedging reserves
£m
Treasury shares
£m
Retained earnings
£m
Total equity
£mAt 27 February 2016 407 5,095 16 178 (7) 6,993 12,682Loss for the year – – – – – (247) (247)Other comprehensive income/(loss)Net fair value gains/(losses) on cash flow hedges – – – 166 – – 166Reclassified and reported in the Company income statement – – – (162) – – (162)Tax relating to components of other comprehensive income – – – (14) – – (14)Total other comprehensive income/(loss) – – – (10) – – (10)Total comprehensive income/(loss) – – – (10) – (247) (257)Transactions with ownersPurchase of treasury shares – – – – (24) – (24)Share-based payments – – – – 9 49 58Issue of shares 2 1 – – – – 3Dividends – – – – – – –Total transactions with owners 2 1 – – (15) 49 37At 25 February 2017 409 5,096 16 168 (22) 6,795 12,462
The notes on pages 134 to 139 form part of these financial statements.
133Tesco PLC Annual Report and Financial Statements 2018
Financial statements
Tesco PLC – Parent Company statement of changes in equity

Note 1 Authorisation of financial statements and statement of compliance with FRS 101The Parent Company financial statements for the 52 weeks ended 24 February 2018 were approved by the Board of Directors on 10 April 2018 and the Company balance sheet was signed on the Board’s behalf by Dave Lewis and Alan Stewart.
These financial statements were prepared in accordance with Financial Reporting Standard 101, ‘Reduced Disclosure Framework’ (FRS 101). The Company meets the definition of a qualifying entity under FRS 100, ‘Application of Financial Reporting Requirements’ as issued by the Financial Reporting Council.
The Company’s financial statements are presented in Pounds Sterling, its functional currency, generally rounded to the nearest million.
The principal accounting policies adopted by the Company are set out in Note 2. The financial statements have been prepared under the historical cost convention, except for certain financial instruments and share-based payments that have been measured at fair value.
Note 2 Accounting policiesBasis of preparation of financial statementsThe Parent Company financial statements have been prepared in accordance with FRS 101 and the Companies Act 2006 (the Act).
FRS 101 sets out a reduced disclosure framework for a ‘qualifying entity’ as defined in the standard which addresses the financial reporting requirements and disclosure exemptions in the individual financial statements of qualifying entities that otherwise apply the recognition, measurement and disclosure requirements of EU-adopted IFRS.
The financial year represents the 52 weeks to 24 February 2018 (prior financial year 52 weeks to 25 February 2017).
As permitted by FRS 101, the Company has taken advantage of the disclosure exemptions available under that standard in relation to business combinations, financial instruments, capital management, presentation of comparative information in respect of certain assets, presentation of a cash flow statement, impairment of assets, share-based payments and related party transactions. Where required, equivalent disclosures are given in the consolidated financial statements of Tesco PLC.
The Parent Company financial statements are prepared on a going concern basis as set out in Note 1 of the consolidated financial statements of Tesco PLC.
The Directors have taken advantage of the exemption available under Section 408 of the Companies Act 2006 and not presented an income statement or a statement of comprehensive income for the Company alone.
A summary of the Company’s significant accounting policies is set out below.
Short-term investmentsShort-term investments are recognised initially at fair value, and subsequently at amortised cost. All income from these investments is included in the income statement as interest receivable and similar income.
Investments in subsidiaries and joint venturesInvestments in subsidiaries and joint ventures are stated at cost less, where appropriate, provisions for impairment.
Foreign currenciesTransactions in foreign currencies are translated to the functional currency at the exchange rate on the date of the transaction. At each balance sheet date, monetary assets and liabilities that are denominated in foreign currencies are retranslated to the functional currency at the rates prevailing on the balance sheet date.
Share-based paymentsThe fair value of employee share option plans is calculated at the grant date using the Black-Scholes or Monte Carlo model. The resulting cost is charged to the income statement over the vesting period. The value of the charge is adjusted to reflect expected and actual levels of vesting. Where the Company awards shares or options to employees of subsidiary entities, this is treated as a capital contribution.
Financial instrumentsFinancial assets and financial liabilities are recognised in the Company balance sheet when the Company becomes party to the contractual provisions of the instrument.
ReceivablesReceivables are recognised initially at fair value, and subsequently at amortised cost using the effective interest rate method, less provision for impairment.
Financial liabilities and equity instruments Financial liabilities and equity instruments are classified according to the substance of the contractual arrangements entered into. An equity instrument is any contract that gives a residual interest in the assets of the Company after deducting all of its liabilities. Equity instruments issued by the Company are recorded as the proceeds received, net of direct issue costs.
Interest-bearing borrowingsInterest-bearing bank loans and overdrafts are initially recognised at fair value, net of attributable transaction costs. Subsequent to initial recognition, interest-bearing borrowings are stated at amortised cost with any differences between proceeds and redemption value being recognised in the Company income statement over the period of the borrowings on an effective interest basis.
PayablesPayables are recognised initially at fair value, and subsequently at amortised cost using the effective interest rate method.
Derivative financial instruments and hedge accountingThe Company uses derivative financial instruments to hedge its exposure to foreign exchange and interest rate risks arising from operating, financing and investing activities. The Company does not hold or issue derivative financial instruments for trading purposes; however if derivatives do not qualify for hedge accounting they are accounted for as such.
Derivative financial instruments are recognised and stated at fair value. Where derivatives do not qualify for hedge accounting, any gains or losses on remeasurement are immediately recognised in the Company income statement. Where derivatives qualify for hedge accounting, recognition of any resultant gain or loss depends on the nature of the hedge relationship and the item being hedged. In order to qualify for hedge accounting, the Company is required to document from inception, the relationship between the item being hedged and the hedging instrument.
The Company is also required to document and demonstrate an assessment of the relationship between the hedged item and the hedging instrument, which shows that the hedge will be highly effective on an ongoing basis. This effectiveness testing is performed at each reporting date to ensure that the hedge remains highly effective.
Derivative financial instruments with maturity dates of more than one year from the balance sheet date are disclosed as non-current.
Fair value hedgingDerivative financial instruments are classified as fair value hedges when they hedge the Company’s exposure to changes in the fair value of a recognised asset or liability. Changes in the fair value of derivatives that are designated and qualify as fair value hedges are recorded in the Company income statement, together with any changes in the fair value of the hedged item that is attributable to the hedged risk.
Cash flow hedgingDerivative financial instruments are classified as cash flow hedges when they hedge the Company’s exposure to variability in cash flows that are either attributable to a particular risk associated with a recognised asset or liability, or a highly probable forecasted transaction. The effective element of any gain or loss from remeasuring the derivative instrument is recognised directly in the Company statement of comprehensive income.
The associated cumulative gain or loss is reclassified from other comprehensive income and recognised in the Company income statement in the same period or periods during which the hedged transaction affects the Company income statement. The classification of the effective portion when recognised in the Company income statement is the same as the classification of the hedged transaction. Any element of the remeasurement criteria of the derivative instrument which does not meet the criteria for an effective hedge is recognised immediately in the Company income statement within finance income or costs.
Tesco PLC Annual Report and Financial Statements 2018134
Notes to the Parent Company financial statements

Note 2 Accounting policies continuedCash flow hedging continuedHedge accounting is discontinued when the hedging instrument expires or is sold, terminated or exercised, or if a voluntary de-designation takes place or no longer qualifies for hedge accounting. At that point in time, any cumulative gain or loss on the hedging instrument recognised in equity is retained in the Company statement of changes in equity until the forecasted transaction occurs or the original hedged item affects the Company income statement. If a forecast hedged transaction is no longer expected to occur, the net cumulative gain or loss recognised in the Company statement of changes in equity is reclassified to the Company income statement.
PensionsThe Company participates in defined benefit pension schemes. There are no formal policies or contractual agreements for recharging within the Group and the Company cannot identify its share of the underlying assets and liabilities of the schemes. Accordingly, as permitted by IAS 19 ‘Employee Benefits’, the Company has accounted for the schemes as defined contribution schemes, and the charge for the financial year is based upon the cash contributions payable.
The Company also participates in a defined contribution scheme open to all UK employees. Payments to this scheme are recognised as an expense as they fall due.
TaxationThe tax expense included in the Company income statement consists of current and deferred tax.
Current tax is the expected tax payable on the taxable income for the financial year, using tax rates enacted or substantively enacted by the balance sheet date. Tax expense is recognised in the Company income statement except to the extent that it relates to items recognised in the Company statement of comprehensive income or directly in the Company statement of changes in equity, in which case it is recognised in the Company statement of comprehensive income or directly in the Company statement of changes in equity, respectively.
Deferred tax is provided using the balance sheet liability method, providing for temporary differences between the carrying amounts of assets and liabilities for financial reporting purposes and the amounts used for taxation purposes.
Deferred tax is calculated at the tax rates that are expected to apply in the period when the liability is settled or the asset realised based on the tax rates that have been enacted or substantively enacted by the balance sheet date. Deferred tax is charged or credited in the Company income statement, except when it relates to items charged or credited directly to equity or other comprehensive income, in which case the deferred tax is also recognised in equity, or other comprehensive income, respectively.
Deferred tax assets are recognised to the extent that it is probable that taxable profits will be available against which deductible temporary differences can be utilised.
The carrying amount of deferred tax assets is reviewed at each balance sheet date and reduced to the extent that it is no longer probable that sufficient taxable profits will be available to allow all or part of the assets to be recovered.
Deferred tax assets and liabilities are offset against each other when there is a legally enforceable right to set off current taxation assets against current taxation liabilities and it is the intention to settle these on a net basis.
Judgements and sources of estimation uncertaintyThe preparation of the Company financial statements requires management to make judgements, estimates and assumptions in applying the Company’s accounting policies to determine the reported amounts of assets, liabilities, income and expenses. The estimates and associated assumptions are based on historical experience and various other factors that are believed to be reasonable under the circumstances. Actual results may differ from these estimates. The estimates and underlying assumptions are reviewed on an ongoing basis, with revisions to accounting estimates applied prospectively.
The preparation of the Company financial statements for the financial year did not require the exercise of any critical accounting judgements or significant estimates. The risk of material adjustment in the next financial year relating to impairment of investments, previously disclosed as a key source of estimation uncertainty, is no longer viewed as significant.
Standards issued but not yet effectiveAt the date of authorisation of these financial statements, the Company has not applied the following standards that have been issued but are not yet effective. The Company has not adopted any new or amended standards early.
IFRS 9 ‘Financial Instruments’IFRS 9 ‘Financial Instruments’ replaces IAS 39 ‘Financial Instruments: Recognition and Measurement’ with the exception of macro hedge accounting. The standard is effective for accounting periods beginning on or after 1 January 2018.
The Company expects the following changes arising from IFRS 9:
– Classification and measurement: All financial instruments classified as loans and receivables under IAS 39 will be classified and measured at amortised cost under IFRS 9.
– Impairment: The new impairment requirements of IFRS 9 require expected credit losses to be applied to amounts owed by related undertakings and by joint ventures and associates. The Company’s assessment of the impact of impairment is still ongoing.
– Hedge accounting: All existing hedge relationships for the company will transition to IFRS 9 on adoption.
IFRS 15 ‘Revenues from Contracts with Customers’This standard is not expected to have a material impact on the Company.
IFRS 16 ‘Leases’This standard is not expected to have a material impact on the Company.
Other standards and amendmentsRefer to Note 1 to the Group financial statements.
Note 3 Auditor remuneration Fees payable to the Company’s auditor for the audit of the Company and Group financial statements are disclosed in Note 3 to the Group financial statements.
Note 4 DividendsFor details of dividends see Note 8 to the Group financial statements.
135Tesco PLC Annual Report and Financial Statements 2018
Financial statements

Note 5 Employment costs, including Directors’ remuneration
Notes2018
£m2017
£mWages and salaries 14 15Social security costs 2 2Pension costs 14 4 3Share-based payment expense 7 6
27 26
The amounts above include recharges from other Group companies for Tesco PLC related activities.
The average number of employees (all Directors of the Company) during the financial year was 11 (2017: 11).
The Schedule 5 requirements of SI 2008/410 for Directors’ remuneration are included within the Directors’ remuneration report on pages 45 to 64.
Note 6 InvestmentsShares
in Group undertakings
£m
Shares in joint
ventures£m
Total £m
CostAt 25 February 2017 16,426 9 16,435Additions 222 – 222Disposals (16) (9) (25)At 24 February 2018 16,632 – 16,632ImpairmentAt 25 February 2017 (3,353) – (3,353)Charge for the year (186) – (186)At 24 February 2018 (3,539) – (3,539)
Net carrying valueAt 24 February 2018 13,093 – 13,093At 25 February 2017 13,073 9 13,082
During the financial year the Company restructured its investments in various dormant subsidiaries. As part of this exercise, £167m of amounts owed to various Group undertakings were waived, £14m of dividends were received and the related investments balances were impaired by £152m, resulting in a net £29m income.
The list of the Company’s subsidiary undertakings and joint ventures is shown on pages 140 to 145.
Note 7 Receivables 2018
£m2017
£mAmounts owed by Group undertakings* 6,598 7,428Amounts owed by joint ventures and associates 20 18Other receivables 27 41
6,645 7,487Of which:Current 6,625 7,469Non-current 20 18
6,645 7,487* Amounts owed by Group undertakings are either interest-bearing or non interest-bearing depending on the type and duration of the receivable relationship, with interest rates ranging
from 0% to 3%, with maturities up to and including March 2025.
Note 8 Short-term investments2018
£m2017
£mMoney market funds 369 1,398
Note 9 Cash and cash equivalentsIncluded in cash and cash equivalents of £793m (2017: £790m) is an amount of £777m (2017: £777m) that was set aside at the balance sheet date for completion of the merger with Booker Group PLC. This cash was invested at a floating rate of interest, held in ring-fenced accounts and was not available to the Group. The merger was completed on 5 March 2018, with £766m being paid on completion. Refer to Note 35 to the Group financial statements for further details on the Booker merger.
Tesco PLC Annual Report and Financial Statements 2018136
Notes to the Parent Company financial statements continued

Note 10 Payables2018
£m2017
£mAmounts owed to Group undertakings(a) 4,707 4,889Other payables 43 50Taxation and social security 3 1Accruals and deferred income 6 6Deferred tax liability(b) 8 32 4,767 4,978(a) Amounts owed to Group undertakings are either interest-bearing or non interest-bearing depending on the type and duration of the creditor relationship, with interest rates ranging
from 0% to 3%, with maturities up to and including February 2051.(b) The deferred tax asset/(liability) recognised by the Company, and the movements thereon, during the financial year are as follows:
Financial instruments
£m
Other timing
differences £m
Total £m
At 25 February 2017 (38) 6 (32)Charge to the income statement for prior years – (2) (2)Movement in other comprehensive income for the year 26 – 26At 24 February 2018 (12) 4 (8)
During the financial year, the Company restructured its investments in various dormant subsidiaries. As part of this exercise, £167m of amounts owed to various Group undertakings were waived, £14m of dividends were received and the related investments balances were impaired by £152m, resulting in a net £29m income.
Note 11 BorrowingsCurrent
Par value Maturity2018
£m2017
£mBank loans and overdrafts – – 26 1315.5% USD Bond $850m Nov 2017 – 7093.375% MTN €750m Nov 2018 667 –
693 840
Non-current
Par value Maturity2018
£m2017
£m3.375% MTN €750m Nov 2018 – 6415.5% MTN(a) £181m Dec 2019 183 3536.125% MTN £900m Feb 2022 952 8965% MTN(a) £238m Mar 2023 254 4113.322% LPI MTN(b) £335m Nov 2025 338 3266% MTN(a) £159m Dec 2029 198 2535.5% MTN(a) £176m Jan 2033 221 2551.982% RPI MTN(c) £277m Mar 2036 279 2706.15% USD Bond(a) $850m Nov 2037 616 1,0634.875% MTN(a) £102m Mar 2042 103 1755.125% MTN(a) €356m Apr 2047 323 5225.2% MTN(a) £168m Mar 2057 165 275 3,632 5,440(a) During the financial year, the Group undertook a tender for outstanding bonds and as a result the following notional amounts were repaid early: 5.5% MTN Dec 2019 £169m,
5% MTN Mar 2023 £151m, 6% MTN Dec 2029 £41m, 5.5% MTN Jan 2033 £24m, 6.15% USD Bond Nov 2037 $300m, 4.875% MTN Mar 2042 £71m, 5.125% MTN Apr 2047 €244m and 5.2% MTN Mar 2057 £111m.
(b) The 3.322% Limited Price Inflation (LPI) MTN is redeemable at par, indexed for increases in the RPI over the life of the MTN. The maximum indexation of the principal in any one year is 5%, with a minimum of 0%.
(c) The 1.982% RPI MTN is redeemable at par, indexed for increases in the RPI over the life of the MTN.
Note 12 Derivative financial instrumentsThe fair value of derivative financial instruments has been disclosed in the Company balance sheet as:
2018 2017Asset
£mLiability
£mAsset
£mLiability
£mCurrent – – 155 –Non-current 952 (488) 1,274 (466)
952 (488) 1,429 (466)
137Tesco PLC Annual Report and Financial Statements 2018
Financial statements

Note 12 Derivative financial instruments continued
2018 2017Asset Liability Asset Liability
Fair value£m
Notional£m
Fair value£m
Notional£m
Fair value£m
Notional£m
Fair value£m
Notional£m
Fair value hedgesInterest rate swaps and similar instruments 12 65 – – 16 65 – –Cross-currency swaps 128 401 (52) 207 386 791 (26) 408Cash flow hedgesCross-currency swaps 129 313 – – 296 907 – –Index-linked swaps 140 612 – – 162 591 – –Derivatives not in a formal hedge relationshipIndex-linked swaps 543 3,339 (436) 3,339 569 3,339 (440) 3,339Total 952 4,730 (488) 3,546 1,429 5,693 (466) 3,747
Note 13 Share-based paymentsThe Company’s equity-settled share-based payment schemes comprise various share schemes designed to reward Executive Directors. For further information on these schemes, including the valuation models and assumptions used, see Note 26 to the Group financial statements.
Share option schemes The number of options and weighted average exercise price (WAEP) of share option schemes relating to the Company employees are:
For the 52 weeks ended 24 February 2018Savings-related
Share Option SchemeNil cost
share optionsOptions WAEP Options WAEP
Outstanding at 25 February 2017 23,840 151.00 10,548,558 –Granted – – 4,031,340 –Forfeited – – (308,543) –Exercised – – – –Outstanding at 24 February 2018 23,840 151.00 14,271,355 –Exercise price range (pence) 151.00 –Weighted average remaining contractual life (years) 1.44 8.00Exercisable at 24 February 2018 – – 2,989,805 –Exercise price range (pence) – –Weighted average remaining contractual life (years) – 7.06
For the 52 weeks ended 25 February 2017Savings-related
Share Option SchemeNil cost
share options Options WAEP Options WAEP
Outstanding at 27 February 2016 23,840 151.00 5,079,088 –Granted – – 5,511,106 –Forfeited – – – –Exercised – – (41,636) –Outstanding at 25 February 2017 23,840 151.00 10,548,558 –Exercise price range (pence) 151.00 –Weighted average remaining contractual life (years) 2.43 8.50Exercisable at 25 February 2017 – – 2,250,252 –Exercise price range (pence) – –Weighted average remaining contractual life (years) – 7.68
Tesco PLC Annual Report and Financial Statements 2018138
Notes to the Parent Company financial statements continued

Note 14 PensionsThe total cost of participation in the Tesco Retirement Savings Plan (a defined contribution scheme) to the Company was £4.4m (2017: £2.9m). Further disclosure relating to all schemes can be found in Note 27 to the Group financial statements.
Note 15 Called up share capital2018
Ordinary shares of 5p each2017
Ordinary shares of 5p eachNumber £m Number £m
Allotted, called up and fully paid:At the beginning of the year 8,174,932,553 409 8,141,083,114 407Share options exercised 5,184,066 – 849,439 –Share bonus awards issued 12,000,000 1 33,000,000 2At the end of the year 8,192,116,619 410 8,174,932,553 409
During the financial year, 5.2 million (2017: 0.8 million) ordinary shares of 5p each were issued in relation to share options for an aggregate consideration of £8m (2017: £1m) and 12.0 million (2017: 33.0 million) ordinary shares of 5p each were issued in relation to share bonus awards.
The Group has implemented a share forfeiture programme following the completion of a tracing and notification exercise to any shareholders who have not had contact with the Company over the past 12 years, in accordance with the provisions set out in the Company’s Articles. Under the share forfeiture programme the shares and dividends associated with shares of untraced members have been forfeited, with the resulting proceeds transferred to the Group to use for good causes in line with the Group’s corporate responsibility strategy. During the financial year, the Group received £3m proceeds from sale of untraced shares and £2m write-back of unclaimed dividends, which are reflected in share premium and retained earnings respectively.
As at 24 February 2018, the Directors were authorised to purchase up to a maximum in aggregate of 817.5 million (2017: 814.1 million) ordinary shares.
The holders of ordinary shares are entitled to receive dividends as declared from time to time and are entitled to one vote per share at general meetings of the Company.
On 5 March 2018, the Group completed a merger with Booker Group PLC. A total of 1,548 million new ordinary shares of the Company have been issued as a result of the transaction. Refer to Note 35 to the Group financial statements for further details.
Note 16 Contingent liabilitiesIn addition to the contingent liabilities shown in Note 32 to the Group financial statements, the Company has entered into financial guarantee contracts to guarantee the indebtedness of Group undertakings amounting to £2,201m (2017: £2,534m). It has also guaranteed derivative agreements of Group undertakings with a gross liability of £217m (2017: £180m) at the balance sheet date. These guarantees are treated as contingent liabilities until it becomes probable they will be called upon.
In addition, the Company has guaranteed the rental payments of certain Group undertakings relating to a portfolio of retail stores, distribution centres and mixed use retail developments.
The likelihood of the above items being called upon is considered remote.
Note 17 Events after the reporting periodOn 5 March 2018, the Group completed a merger with Booker Group PLC. Refer to Note 35 to the Group financial statements for further details.
139Tesco PLC Annual Report and Financial Statements 2018
Financial statements

In accordance with Section 409 of the Companies Act 2006 and Schedule 4 of The Large and Medium-sized Companies and Groups (Accounts and Reports) Regulations 2008, a full list of related undertakings, registered office address and the percentage of share class owned as at 24 February 2018 are disclosed below. Changes to the list of related undertakings since the year-end date are detailed in the footnotes below. All undertakings are indirectly owned by Tesco PLC unless otherwise stated.
Subsidiary undertakings incorporated in the United Kingdom
Name of undertakingRegistered
address Class of share held% held
by GroupAcklam Management Company Limited
1 Limited by Guarantee –
Adminstore Limited 1 £0.01 A Ordinary 100£0.01 B Ordinary 100£0.01 C Ordinary 100
Adsega Limited† 1 £1.00 Ordinary 100Alfred Preedy & Sons Limited 2 £1.00 Deferred 100
£1.00 Ordinary 100Armitage Finance Unlimited 1 £0.90 Ordinary 100Bath Upper Bristol Road Management Company Limited
1 Limited by Guarantee –
Berry Lane Management Company Limited
1 Limited by Guarantee –
BF Limited(l) 38 £1.00 Ordinary 100Bishop’s Group Limited(l) 38 £0.01 Ordinary 100Booker Cash & Carry Limited(l) 38 £1.00 Ordinary 100Booker Direct Limited(l) 38 £0.01 Ordinary 100Booker EBT Limited(l) 38 £1.00 Ordinary 100Booker Group plc(l) 38 £0.01 Ordinary 100Booker Limited(l) 38 £1.00 Ordinary 100Booker Retail Partners (GB) Limited(l)
38 £1.00 Ordinary 100
Booker Retail Limited(l) 38 £0.10 Ordinary 100Booker Wholesale Holdings Limited(l)
38 £0.01 Ordinary 100
Broughton Retail Nominee 1 Limited
1 £1.00 Ordinary 100
Broughton Retail Nominee 2 Limited
1 £1.00 Ordinary 100
Broughton Retail Nominee 3 Limited
1 £1.00 Ordinary 100
Broughton Retail Nominee 4 Limited
1 £1.00 Ordinary 100
Budgen Holdings Limited(l) 38 £1.00 Ordinary 100Budgens Pension Trustees No.2 Limited(l)
38 £1.00 Ordinary 100
Budgens Property Investments Limited(l)
38 £1.00 Ordinary 100
Budgens Stores Limited(l) 38 £1.00 Ordinary 100Buttoncable Limited 1 £1.00 Ordinary 100Buttoncase Limited† 1 £1.00 Cumulative
Redeemable Preference
100
£1.00 Ordinary 100Canterbury Road Management Limited
1 Limited by Guarantee –
Cardiff Cathays Terrace Management Company Limited
1 Limited by Guarantee –
Cheshunt Finance Unlimited 1 £0.01053258724 Ordinary
100
Comar Limited† 1 £1.00 Ordinary 100Cullen’s Holdings Limited 1 £0.10 Ordinary 100Cullen’s Stores Limited 1 £1.00 Ordinary 100Day and Nite Stores Limited 2 £1.00 Cumulative
Convertible Participating Preferred Ordinary
100
£1.00 Cumulative Redeemable Preference
100
£1.00 Ordinary 100Dillons Newsagents Limited 2 £0.25 Non-Voting
Ordinary100
dunnhumby Holding Limited 5 £1.00 Ordinary 100dunnhumby International Limited
5 £1.00 Ordinary 100
Name of undertakingRegistered
address Class of share held% held
by Groupdunnhumby Limited 5 £3.59 Ordinary 100dunnhumby Overseas Limited 5 £1.00 Ordinary 100dunnhumby Trustees Limited 5 £1.00 Ordinary 100Europa Foods Limited 1 £1.00 Ordinary 100Faraday Properties Limited 6 £1.00 Ordinary 100Giant Bidco Limited(l) 38 £1.00 Ordinary 100Giant Booker Limited(l) 38 £0.25 Ordinary 100Giant Midco Limited(l) 38 £1.00 Ordinary 100Gibbs News Limited 2 £1.00 Ordinary 100Halesworth SPV Limited 1 £1.00 Ordinary 100Harts the Grocers (Russell Square) Limited
1 £1.00 Ordinary 100
Highams Green Management Company Limited
1 Limited by Guarantee –
IRTH (15) Limited(l) 38 £1.00 Ordinary 100IRTH (19) Limited(l) 38 $1.00 Ordinary 100J.E. Cohen & Company Limited 1 £1.00 Ordinary 100KSS Retail Limited 5 £0.001 Ordinary 100Launchgrain Limited† 1 £1.00 Ordinary 100Linebush III Limited 2 £1.00 Ordinary A 100
£1.00 Ordinary B 100Linebush IV Limited 2 £0.01 Ordinary A 100
£1.20 Ordinary B 100£0.01 Ordinary C 100
Linebush Limited 2 £0.01 A Ordinary 100£1.00 B Ordinary 100£0.01 C Ordinary 100
Linebush V Limited 2 £1.20 Ordinary A 100£1.20 Ordinary B 100
Linnco Limited(l) 38 £1.00 Ordinary 100Londis (Holdings) Limited(l) 38 £50.00 Ordinary 100Londis Pension Trustees Limited(l)
38 £1.00 Ordinary 100
London and Home Counties Superstores Limited
1 £1.00 Ordinary A 100£1.00 Ordinary B 100£1.00 Redeemable Cumulative Preference
100
M & W Limited 2 £0.10 Ordinary 100Makro Holding Limited(l) 38 £1.00 Ordinary 100Makro Properties Limited(l) 38 £1.00 Ordinary 100Makro Self Service Wholesalers Limited(l)
38 £1.00 Ordinary A£1.00 Ordinary B
100100
Mills (East Midlands) Limited 2 £1.00 Ordinary 100Mills Group Limited 2 £1.00 Ordinary 100Morgam News Limited 2 £1.00 Ordinary 100Motorcause Limited 1 £1.00 Ordinary 100Murdoch Norton Limited(l) 38 £0.05 Ordinary 100NutriCentre Limited 1 £0.10 Ordinary 100Oakwood Distribution Limited 1 £1.00 Ordinary 100One Stop Community Stores Limited
2 £1.00 Ordinary 100
One Stop Convenience Stores Limited
2 £1.00 Ordinary 100
One Stop Stores Limited†(a) 2 £1.00 Ordinary 100One Stop Stores Trustee Services Limited
2 £1.00 Ordinary 100
Orpington (Station Road) Limited 1 £1.00 Ordinary 100Oxford Fox and Hounds Management Company Limited
1 Limited by Guarantee –
Paper Chain (East Anglia) Limited
2 £1.00 Deferred 100US$0.001 Ordinary 100
PTLL Limited 1 £1.00 Ordinary 100Ritter-Courivaud Limited(l) 38 £0.10 Ordinary 100
Tesco PLC Annual Report and Financial Statements 2018140
Related undertakings of the Tesco Group

Name of undertakingRegistered
address Class of share held% held
by GroupSeacroft Green Nominee 1 Limited
1 £1.00 Ordinary 100
Seacroft Green Nominee 2 Limited
1 £1.00 Ordinary 100
Snowman Retail 1 Limited 2 £1.00 Ordinary 100Snowman Retail 2 Limited 2 £1.00 Ordinary 100Sociomantic Labs Limited 8 £1.00 Ordinary 100Spen Hill Developments Limited 1 £1.00 Ordinary 100Spen Hill Management Limited†(b) 1 £1.00 Ordinary 100Spen Hill Properties (Holdings) plc† 1 £1.00 Ordinary 100Spen Hill Regeneration Limited 1 £1.00 Ordinary 100Spen Hill Residential No 1 Limited 1 £1.00 Ordinary 100Spen Hill Residential No 2 Limited 1 £1.00 Ordinary 100Station House Welling Management Limited
1 Limited by Guarantee –
Statusfloat Limited 1 £1.00 Ordinary 100Stewarts Supermarkets Limited† 1 £1.00 Ordinary 100T & S Properties Limited 2 £1.00 Ordinary 100T & S Stores Limited† 2 £0.05 Ordinary 100Tapesilver Limited† 1 £1.00 Ordinary 100Teesport (GP) Limited 1 £1.00 Ordinary 100Tesco (Overseas) Limited† 1 £1.00 Ordinary 100Tesco Aqua (3LP) Limited 1 £1.00 Ordinary 100Tesco Aqua (FinCo1) Limited 1 £1.00 Ordinary 100Tesco Aqua (FinCo2) Limited 1 £1.00 Ordinary 100Tesco Aqua (GP) Limited 1 £1.00 A Ordinary 100
£1.00 B Ordinary 100Tesco Aqua (Nominee 1) Limited 1 £1.00 Ordinary 100Tesco Aqua (Nominee 2) Limited 1 £1.00 Ordinary 100Tesco Aqua (Nominee Holdco) Limited
1 £1.00 Ordinary 100
Tesco Atrato (1LP) Limited 1 £1.00 Ordinary 100Tesco Blue (3LP) Limited 1 £1.00 Ordinary 100Tesco Blue (FinCo2) Limited 1 £1.00 Ordinary 100Tesco Blue (GP) Limited 1 £1.00 A Ordinary 100
£1.00 B Ordinary(c) 100Tesco Blue (Nominee 1) Limited 1 £1.00 Ordinary 100Tesco Blue (Nominee 2) Limited 1 £1.00 Ordinary 100Tesco Blue (Nominee Holdco) Limited
1 £1.00 Ordinary 100
Tesco Corporate Treasury Services PLC†
1 £1.00 Ordinary 100
Tesco Depot Propco Limited 1 £1.00 Ordinary 100Tesco Distribution Holdings Limited
1 £1.00 Ordinary 100
Tesco Distribution Limited 1 £1.00 Ordinary 100Tesco Dorney (1LP) Limited 1 £1.00 Ordinary 100Tesco Employees’ Share Scheme Trustees Limited†(d)
1 £1.00 Ordinary 100
Tesco Family Dining Limited 1 £1.00 Ordinary 100Tesco FFC Limited 1 £0.01 Ordinary 100Tesco Food Sourcing Limited 1 £1.00 Ordinary 100Tesco Freetime Limited 1 £1.00 Ordinary 100Tesco Fuchsia (3LP) Limited 1 £1.00 Ordinary 100Tesco Gateshead Property Limited
1 £1.00 Ordinary 100
Tesco Holdings Limited† 1 £0.10 Ordinary 100£1.00 Preference 100
Tesco International Internet Retailing Limited†
1 £1.00 Ordinary 100
Tesco International Services Limited†
1 £1.00 Ordinary 100
Tesco Kirkby (General Partner) Limited
1 £1.00 Ordinary 100
Tesco Kirkby (LP) Limited 1 £1.00 Ordinary 100Tesco Kirkby (Unitholder1) Limited
1 £1.00 Ordinary 100
Tesco Kirkby (Unitholder2) Limited
1 £1.00 Ordinary 100
Name of undertakingRegistered
address Class of share held% held
by GroupTesco Lagoon GP Limited 6 £1.00 Ordinary 100Tesco Maintenance Limited 1 £1.00 Ordinary 100Tesco Mobile Communications Limited†
1 £1.00 Ordinary 100
Tesco Mobile Services Limited 1 £1.00 Ordinary 100Tesco Navona (1LP) Limited 1 £1.00 Ordinary 100Tesco Navona (GP) Limited 1 £1.00 Ordinary A 100
£1.00 Ordinary B(c) 100Tesco Navona (Nominee 1) Limited
1 £1.00 Ordinary 100
Tesco Navona (Nominee 2) Limited
1 £1.00 Ordinary 100
Tesco Navona (Nominee Holdco) Limited
1 £1.00 Ordinary 100
Tesco Navona PL Propco Limited
1 £1.00 Ordinary 100
Tesco Overseas Investments Limited†
1 £1.00 Ordinary 100
Tesco Overseas ULC 1 £0.00000025 A Ordinary
100
£0.00000025 B Ordinary
100
£0.00000025 C Ordinary
100
£0.00000025 D Ordinary
100
£0.00000025 E Ordinary
100
£0.00000025 F Ordinary
100
£0.00000025 G Ordinary
100
£0.00000025 H Ordinary
100
£0.00000025 J Ordinary
100
£0.00000025 K Ordinary
100
£0.00000025 L Ordinary
100
£0.00000025 M Ordinary
100
£0.00000025 N Ordinary
100
£0.00000025 O Ordinary
100
£0.00000025 P Ordinary
100
Tesco Passaic (1LP) Limited 1 £1.00 Ordinary 100Tesco Passaic (GP) Limited 1 £1.00 Ordinary A 100
£1.00 Ordinary B(c) 100Tesco Passaic (Nominee 1) Limited
1 £1.00 Ordinary 100
Tesco Passaic (Nominee 2) Limited
1 £1.00 Ordinary 100
Tesco Passaic (Nominee Holdco) Limited
1 £1.00 Ordinary 100
Tesco Passaic PL Propco Limited 1 £1.00 Ordinary 100Tesco PEG Limited 1 £0.01 Ordinary 100Tesco PENL Limited 1 £1.00 Ordinary 100Tesco Pension Investment Limited(c)
1 £1.00 Ordinary 100
Tesco Pension Trustees Limited†(e)
1 £1.00 Ordinary 100
Tesco Personal Finance Group Limited†
10 £0.10 A Ordinary 100£0.10 B Ordinary 100£0.10 C Ordinary 100
Tesco Personal Finance PLC 10 £0.10 Ordinary 100Tesco Property (Nominees) (No.1) Limited
11 £1.00 Ordinary 100
Tesco Property (Nominees) (No.2) Limited
11 £1.00 Ordinary100
141Tesco PLC Annual Report and Financial Statements 2018
Financial statements
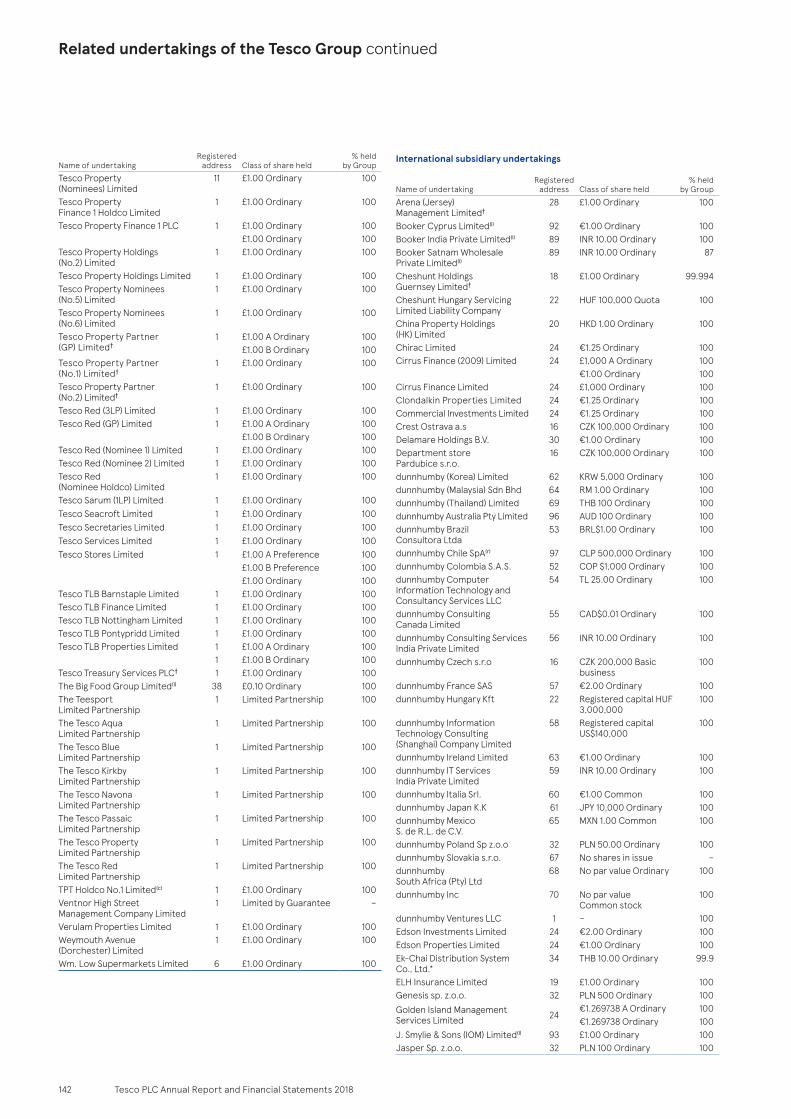
Name of undertakingRegistered
address Class of share held% held
by GroupTesco Property (Nominees) Limited
11 £1.00 Ordinary 100
Tesco Property Finance 1 Holdco Limited
1 £1.00 Ordinary 100
Tesco Property Finance 1 PLC 1 £1.00 Ordinary 100£1.00 Ordinary 100
Tesco Property Holdings (No.2) Limited
1 £1.00 Ordinary 100
Tesco Property Holdings Limited 1 £1.00 Ordinary 100Tesco Property Nominees (No.5) Limited
1 £1.00 Ordinary 100
Tesco Property Nominees (No.6) Limited
1 £1.00 Ordinary 100
Tesco Property Partner (GP) Limited†
1 £1.00 A Ordinary 100£1.00 B Ordinary 100
Tesco Property Partner (No.1) Limited†
1 £1.00 Ordinary 100
Tesco Property Partner (No.2) Limited†
1 £1.00 Ordinary 100
Tesco Red (3LP) Limited 1 £1.00 Ordinary 100Tesco Red (GP) Limited 1 £1.00 A Ordinary 100
£1.00 B Ordinary 100Tesco Red (Nominee 1) Limited 1 £1.00 Ordinary 100Tesco Red (Nominee 2) Limited 1 £1.00 Ordinary 100Tesco Red (Nominee Holdco) Limited
1 £1.00 Ordinary 100
Tesco Sarum (1LP) Limited 1 £1.00 Ordinary 100Tesco Seacroft Limited 1 £1.00 Ordinary 100Tesco Secretaries Limited 1 £1.00 Ordinary 100Tesco Services Limited 1 £1.00 Ordinary 100Tesco Stores Limited 1 £1.00 A Preference 100
£1.00 B Preference 100£1.00 Ordinary 100
Tesco TLB Barnstaple Limited 1 £1.00 Ordinary 100Tesco TLB Finance Limited 1 £1.00 Ordinary 100Tesco TLB Nottingham Limited 1 £1.00 Ordinary 100Tesco TLB Pontypridd Limited 1 £1.00 Ordinary 100Tesco TLB Properties Limited 1 £1.00 A Ordinary 100
1 £1.00 B Ordinary 100Tesco Treasury Services PLC† 1 £1.00 Ordinary 100The Big Food Group Limited(l) 38 £0.10 Ordinary 100The Teesport Limited Partnership
1 Limited Partnership 100
The Tesco Aqua Limited Partnership
1 Limited Partnership 100
The Tesco Blue Limited Partnership
1 Limited Partnership 100
The Tesco Kirkby Limited Partnership
1 Limited Partnership 100
The Tesco Navona Limited Partnership
1 Limited Partnership 100
The Tesco Passaic Limited Partnership
1 Limited Partnership 100
The Tesco Property Limited Partnership
1 Limited Partnership 100
The Tesco Red Limited Partnership
1 Limited Partnership 100
TPT Holdco No.1 Limited(c) 1 £1.00 Ordinary 100Ventnor High Street Management Company Limited
1 Limited by Guarantee –
Verulam Properties Limited 1 £1.00 Ordinary 100Weymouth Avenue (Dorchester) Limited
1 £1.00 Ordinary 100
Wm. Low Supermarkets Limited 6 £1.00 Ordinary 100
International subsidiary undertakings
Name of undertakingRegistered
address Class of share held% held
by GroupArena (Jersey) Management Limited†
28 £1.00 Ordinary 100
Booker Cyprus Limited(l) 92 €1.00 Ordinary 100Booker India Private Limited(l) 89 INR 10.00 Ordinary 100Booker Satnam Wholesale Private Limited(l)
89 INR 10.00 Ordinary 87
Cheshunt Holdings Guernsey Limited†
18 £1.00 Ordinary 99.994
Cheshunt Hungary Servicing Limited Liability Company
22 HUF 100,000 Quota 100
China Property Holdings (HK) Limited
20 HKD 1.00 Ordinary 100
Chirac Limited 24 €1.25 Ordinary 100Cirrus Finance (2009) Limited 24 £1,000 A Ordinary 100
€1.00 Ordinary 100Cirrus Finance Limited 24 £1,000 Ordinary 100Clondalkin Properties Limited 24 €1.25 Ordinary 100Commercial Investments Limited 24 €1.25 Ordinary 100Crest Ostrava a.s 16 CZK 100,000 Ordinary 100Delamare Holdings B.V. 30 €1.00 Ordinary 100Department store Pardubice s.r.o.
16 CZK 100,000 Ordinary 100
dunnhumby (Korea) Limited 62 KRW 5,000 Ordinary 100dunnhumby (Malaysia) Sdn Bhd 64 RM 1.00 Ordinary 100dunnhumby (Thailand) Limited 69 THB 100 Ordinary 100dunnhumby Australia Pty Limited 96 AUD 100 Ordinary 100dunnhumby Brazil Consultora Ltda
53 BRL$1.00 Ordinary 100
dunnhumby Chile SpA(r) 97 CLP 500,000 Ordinary 100dunnhumby Colombia S.A.S. 52 COP $1,000 Ordinary 100dunnhumby Computer Information Technology and Consultancy Services LLC
54 TL 25.00 Ordinary 100
dunnhumby Consulting Canada Limited
55 CAD$0.01 Ordinary 100
dunnhumby Consulting Services India Private Limited
56 INR 10.00 Ordinary 100
dunnhumby Czech s.r.o 16 CZK 200,000 Basic business
100
dunnhumby France SAS 57 €2.00 Ordinary 100dunnhumby Hungary Kft 22 Registered capital HUF
3,000,000100
dunnhumby Information Technology Consulting (Shanghai) Company Limited
58 Registered capital US$140,000
100
dunnhumby Ireland Limited 63 €1.00 Ordinary 100dunnhumby IT Services India Private Limited
59 INR 10.00 Ordinary 100
dunnhumby Italia Srl. 60 €1.00 Common 100dunnhumby Japan K.K 61 JPY 10,000 Ordinary 100dunnhumby Mexico S. de R.L. de C.V.
65 MXN 1.00 Common 100
dunnhumby Poland Sp z.o.o 32 PLN 50.00 Ordinary 100dunnhumby Slovakia s.r.o. 67 No shares in issue –dunnhumby South Africa (Pty) Ltd
68 No par value Ordinary 100
dunnhumby Inc 70 No par value Common stock
100
dunnhumby Ventures LLC 1 – 100Edson Investments Limited 24 €2.00 Ordinary 100Edson Properties Limited 24 €1.00 Ordinary 100Ek-Chai Distribution System Co., Ltd.*
34 THB 10.00 Ordinary 99.9
ELH Insurance Limited 19 £1.00 Ordinary 100Genesis sp. z.o.o. 32 PLN 500 Ordinary 100Golden Island Management Services Limited 24
€1.269738 A Ordinary 100€1.269738 Ordinary 100
J. Smylie & Sons (IOM) Limited(l) 93 £1.00 Ordinary 100Jasper Sp. z.o.o. 32 PLN 100 Ordinary 100
Tesco PLC Annual Report and Financial Statements 2018142
Related undertakings of the Tesco Group continued

Name of undertakingRegistered
address Class of share held% held
by GroupKabaty Investments Tesco (Polska) Sp. z.o.o. Sp.k
32 PLN Partnership Interests
100
Lekáreň Tesco Dunajská Streda, k.s.
51 Limited Partnership 100
Lekáreň Tesco Petržalka, k.s. 51 Limited Partnership 100Lekáreň Tesco Piešt’any, k.s. 51 Limited Partnership 100Lekáreň Tesco Prešov Vukov, k.s. 51 Limited Partnership 100Lekáreň Tesco Senec, k.s. 51 Limited Partnership 100Lekáreň Tesco Trenčín, s.r.o. 51 Limited Partnership 100Lekáreň Tesco Banská Bystrica, k.s.
51 Limited Partnership 100
Lekáreň Tesco Košice, k.s. 51 Limited Partnership 100Lekáreň Tesco Lamač, k.s. 51 Limited Partnership 100Lekáreň Tesco Nitra, k.s. 51 Limited Partnership 100Lekáreň Tesco Spišská Nová Ves, k.s.
51 Limited Partnership 100
Lekáreň Tesco Trnava, k.s. 51 Limited Partnership 100Lekáreň Tesco Zlaté Piesky, k.s. 51 Limited Partnership 100Lekáreň Tesco Zvolen, k.s. 51 Limited Partnership 100Letňany Development land 1 s.r.o.
16 CZK 100,000 Ordinary 100
Letňany Development land 2 s.r.o. 16 CZK 100,000 Ordinary 100Marine Coffee Company Holdings Limited
25 €1.00 Ordinary 100
Marine Coffee Company Nominees Limited
25 €1.00 Ordinary 100
Monread Developments Limited 24 €0.001 Ordinary 100Nabola Development Limited 24 €1.25 A Ordinary 100
€1.25 B Ordinary 100Obchodný dom Bratislava, s.r.o 51 €1.00 Registered
capital 100
Old FEHC Inc.(p) 35 US$0.01 Common Stock 100Old FENM Inc.†(p) 35 US$0.01 Ordinary 100Orpingford 24 €1.00 Ordinary 100PEJ Property Developments Limited
24 €1.00 Ordinary 100
Pharaway Properties Limited 24 €1.00 Ordinary 100R.J.D. Holdings 24 €1.269738 Ordinary 100Saneyia Limited(l) 92 €1.00 Ordinary 100Seberov site s.r.o. 16 CZK 100,000 Ordinary 100Shuke Advertising (Shanghai) Co., Ltd
84 €130,000 Registered Capital
100
Sociomantic Labs B.V. 77 €100 Ordinary 100Sociomantic labs GmbH 72 €1.00 Ordinary 100Sociomantic Labs Inc 83 US$50.00 Common
Stock100
Sociomantic Labs Internet Hizmetleri Limited Şireketi
82 TRY 25.00 Ordinary 100
Sociomantic Labs LLC 79 RUR 1.00 Ordinary 100Sociomantic Labs Private Limited
76 INR 10.00 Ordinary 100
Sociomantic Labs Pte Ltd 80 S$1.00 Ordinary 100Sociomantic Labs s.r.o.(q) 74 KC 1.00 Ordinary 100Sociomantic Labs SARL 75 €100 Ordinary 100Sociomantic Labs Servicos Web Ltda
73 R$1.00 Ordinary 100
Sociomantic Labs Sp. z.o.o. 78 PLN 50.00 Ordinary 100Sociomantic S.L.U. 81 €1.00 Ordinary 100Tesco (Polska) Sp. z.o.o. 32 PLN 500 Ordinary 100Tesco Akadémia Képzési és Fejlesztési Korátolt Felelősségű Társaság
22 HUF 100,000 Quotas 100
Tesco Bengaluru Private Limited 23 INR 10.00 Ordinary 100Tesco Capital No. 1 Limited† 28 £0.50 A Ordinary 100
£0.50 B Ordinary 100£0.01 Preference – Guaranteed fixed rate cumulative preference
100
£0.01 Preferred Ordinary 100
Name of undertakingRegistered
address Class of share held% held
by GroupTesco Capital No. 2 Limited 28 £0.01 Floating Rate
Redeemable Preference†
100
£1.00 Ordinary 100Tesco Chile Sourcing Limitada 13 CLP 1.00 Ordinary 100
US$ 1.00 Ordinary 100Tesco Digital Ventures Pte Ltd 33 SGD 1.00 Ordinary 100Tesco Dystrybucja Sp. z.o.o 32 PLN 50.00 Ordinary 100Tesco EU IT Services s.r.o. 16 CZK 1.00 Ordinary 100Tesco Europe B.V. 31 €1.00 Ordinary 100Tesco Food Sourcing Brazil Consultoria De Negoçios Ltda.
12 BRL 1.00 Ordinary 100
Tesco Foundation (Nadacia Tesco)
51 No par value basic capital
100
Tesco Franchise Stores ČR s.r.o. 16 CZK 2,000,000 Ordinary
100
Tesco-Global Stores Privately Held Company Limited
22 HUF 10.00 Common 99.9
Tesco Global Employment Company Limited
34 THB 100 Ordinary 100
Tesco Guangdong (HK) Co. Limited
20 US$ 1.00 Ordinary 100
Tesco Holdings B.V. 30 €1.00 Ordinary 100Tesco International Clothing Brand s.r.o.
51 €1.00 Ordinary 100
Tesco International Franchising s.r.o.
51 €1.00 Ordinary 100
Tesco International Sourcing Limited
20 HKD 10.00 Ordinary 100
Tesco Ireland Holdings Limited†(f)
24 €1.25 Ordinary 100
Tesco Ireland Limited 24 €1.25 Ordinary 100Tesco Ireland Pension Trustees Limited
24 €1.25 Ordinary 100
Tesco Joint Buying Service (Shanghai) Co Limited
14 US$ 1.00 Ordinary 100
Tesco Mobile (Thailand) Co. Limited
34 THB 100 Ordinary 100
Tesco Mobile Ireland Limited 24 €1.00 Ordinary 100Tesco Mobile Polska Sp. z.o.o. 32 PLN 50.00 Ordinary 100Tesco Property (No. 1) Limited 28 £1.00 Ordinary 100Tesco Property Limited 15 US$ 1.00 Registered
Capital100
Tesco Sourcing India Private Limited
85 INR 10.00 Ordinary 100
Tesco Stores (Malaysia) Sdn Bhd*(g) 42 RM 1.00 A Ordinary 100RM 10.00 Non-Convertible Non-Cumulative Irredeemable Preference Shares
100
Tesco Stores (Thailand) Limited* 34 THB 10.00 A Ordinary 100THB 10.00 B Preference <0.001THB 10.00 C Preference 100
Tesco Stores ČR a.s. 16 CZK 1,000 Ordinary 100Tesco Stores SR, a.s. 51 €33,193.92 Ordinary 100Tesco Technology Services HK Limited
21 HKD 1,000 Ordinary 100
Tesco Trustee Company of Ireland Limited†
24 €1.25 Ordinary 100
Thundridge 24 €1.00 Ordinary 100Valiant Insurance Company DAC 26 £1.00 Ordinary 100Victoria BB Sp. z.o.o. 32 PLN 800 Ordinary 100Wanze Properties (Dundalk) Limited
24 €1.00 Ordinary 100
WSC Properties Limited 24 €1.00 Ordinary 100
143Tesco PLC Annual Report and Financial Statements 2018
Financial statements

Subsidiary undertakings in liquidationThe following subsidiary undertakings in liquidation were incorporated in the United Kingdom.
Name of undertakingRegistered
address Class of share held% held
by GroupAlfred Preedy & Sons (Trustees) Limited
90 £1.00 Ordinary 100
Anthony Heagney Limited 90 £1.00 Ordinary 100Beehythe Estates Limited 90 £1.00 Ordinary 100Bedminster Estates Limited 3 £1.00 Ordinary 100Blinkbox Books Limited 3 £0.001 Ordinary 100Brian Ford’s Discount Store Limited(o)
3 £1.00 Ordinary 100
Budgen Limited(k) 90 £1.00 Ordinary 100Careneed News Limited 90 £0.001 Non-Cumulative
Preference100
£0.001 Ordinary 100£0.001 Ordinary A 100
Cheshunt Overseas LLP 3 Limited Liability Partnership
100
Country Market Limited (The) 90 £1.00 Ordinary 100Crazy Prices† 87 £1.00 Ordinary 100Daily Wrap Produce Limited† 87 £1.00 Ordinary 100Delamare One Limited† 90 £0.001 A Ordinary 100Food & Wine Lovers Limited 90 £1.00 Ordinary 100Gibbs Newsagents Limited 90 £1.00 A Ordinary 100Honiton Wholesale Supplies Limited(m)
3 £1.00 A Ordinary 100
Harts the Grocers (TCR) Limited 90 £1.00 Ordinary 100J E Properties Holdings Limited 90 £1.00 Ordinary 100Kingsway Fresh Foods Limited(m) 87 £1.00 Ordinary 100
Launchtable Limited†(h) 90 £1.00 Ordinary 100Laws Stores Limited(k) 90 £1.00 Ordinary 100 Lee (Southern) Limited 90 £1.00 Ordinary 99.975
Leovic Limited(l) 39 £0.05 Ordinary 97.1
Linebush III Holdings Limited(k) 90 £1.00 Ordinary 100Lowfoods Limited 91 £1.00 2% Non-
Cumulative Preference100
£1.00 Ordinary 100Mills (West Midlands) Limited 90 £1.00 Ordinary 100Mills Group Holdings Limited(k) 90 £1.00 Ordinary 100Morgam Holdings Limited 90 £1.00 Ordinary 100NPL (Hardgate) Limited(n) 9 £1.00 Ordinary 100Power Supermarkets Limited(j) 90 £1.00 Ordinary 100Premier Garage (Worthing) Limited(o)
3 £1.00 Ordinary 100
Pulford Foods Limited(o) 3 £1.00 Ordinary 100Sanders Supermarkets Limited(h) 90 £1.00 Non-voting
Ordinary100
£0.50 Ordinary 100£1.00 Preference 100
Sarcon (No. 239) Limited 88 £1.00 Ordinary 100Spen Hill Developments (Holdings) Limited(k)
90 £1.00 Ordinary 100
Spen Hill Developments (Portishead) Limited
90 £1.00 Ordinary 100
Spen Hill Developments (Tonbridge) Limited(h)
90 £1.00 Ordinary 100
Spen Hill Properties (Southend) Limited(h)
90 £1.00 Ordinary100
T & S Management Services Limited(k)
90 £1.00 Ordinary 100
Teesport (Nominee) Limited(k) 90 £1.00 Ordinary 100Telegraph Properties (Kirkby) Limited
3 £1.00 Ordinary 100
Tesco.Com Limited†(h) 90 £1.00 Ordinary 100Tesco (Foxtrot 1) Limited 90 £1.00 Ordinary 100Tesco (Foxtrot 2) Limited 90 £1.00 Ordinary 100Tesco Card Services Limited† 90 £1.00 Ordinary 100Tesco Estates Limited† 90 £1.00 Ordinary 100Tesco FTO Limited 90 £1.00 Ordinary 100
Name of undertakingRegistered
address Class of share held% held
by GroupTesco Home Shopping Limited† 90 £1.00 A Ordinary 100
£1.00 B Ordinary 100Tesco Hungary (Holdings) Limited†
90 £1.00 Ordinary 100
Tesco Kirkby (Nominee 1) Limited(h) 90 £1.00 Ordinary 100Tesco Kirkby (Nominee 2) Limited(h) 90 £1.00 Ordinary 100Tesco Kirkby (Nominee Holdco) Limited(h)
90 £1.00 Ordinary 100
Tesco Overseas (Holdings) Limited†(h)
90 £1.00 Ordinary 100
Tesco PEIP Limited 90 £1.00 Ordinary 100Tesco PEL Limited 90 £1.00 Ordinary 100Tesco Worldwide Limited†(k) 90 £1.00 Ordinary 100Trigger Retail Limited 90 £1.00 Ordinary 100Value House Properties Limited(o) 3 £1.00 Ordinary 100Verulam Properties (2001) Limited
90 £1.00 Ordinary 100
Whitecastle Properties Limited(n) 9 £1.00 Ordinary 100Worple Road PLC 90 £1.00 Ordinary 100
The following subsidiary undertakings in liquidation were incorporated outside of the United Kingdom.
Name of undertakingRegistered
address Class of share held% held
by Groupdunnhumby Netherlands BV 66 €1.00 Ordinary 100Tesco (Jersey) Limited† 28 £1.00 Ordinary 100Tesco Mauritius Holdings Limited 29 £1.00 Ordinary 100Tesco Vin Plus S.A. 17 €1.60 Ordinary 100
Associated undertakingsThe following associated undertakings were incorporated in the United Kingdom.
Name of undertakingRegistered
address Class of share held% held
by GroupBroadfields Management Limited 47 £0.10 Ordinary 35.3Clarepharm Limited 48 £0.10 Ordinary 22.7Fresh Food Trader Limited(l) 7 £1.00 Ordinary
£1.00 Preference50
Shire Park Limited 49 £1.00 Ordinary 54.5Tesco Atrato (GP) Limited* 1 £1.00 A Ordinary 100Tesco Coral (GP) Limited* 1 £1.00 A Ordinary 100Tesco Dorney (GP) Limited* 1 £1.00 A Ordinary 100Tesco Jade (GP) Limited 98 £1.00 A Ordinary 30
£1.00 B Ordinary 30Tesco Mobile Limited* 1 £0.10 A Ordinary 100
£0.90 B Ordinary 100Tesco Property Partner (GP No.2) Limited*
1 £1.00 A Ordinary 100
Tesco Sarum (GP) Limited* 1 £1.00 A Ordinary 100Tesco Underwriting Limited 50 £1.00 Ordinary 49.9The Tesco Atrato Limited Partnership
1 Limited Partnership50
The Tesco Coral Limited Partnership
1 Limited Partnership 50
The Tesco Dorney Limited Partnership
1 Limited Partnership 50
The Tesco Property (No.2) Limited Partnership
27 Limited Partnership 50
The Tesco Sarum Limited Partnership
1 Limited Partnership 50
Tesco PLC Annual Report and Financial Statements 2018144
Related undertakings of the Tesco Group continued

The following associated undertakings were incorporated outside of the United Kingdom.
Name of undertakingRegistered
address Class of share held% held
by GroupChina Wisdom dunnhumby Limited
95 HKD 246,000.00 Ordinary
50
dunnhumby Canada Limited 37 CA$ 1.00 Ordinary 50dunnhumby Norge A.S. 43 NOK 1,000 Ordinary 50Gain Land Limited 36 $1.00 Ordinary 20Koxka Hungary Refridgeration LLC(s)
40 HUF 1.00 Quota 40
Merrion Shopping Centre Limited 24 €0.012697 Ordinary 51.9Retail Property Co., Limited* 44 THB 100 Ordinary A 100Synergistic Property Development Co. Limited
94 THB 100 Ordinary 50
Tesco Card Services Limited* 45 THB 100 Ordinary A 100Tesco for Thais Foundation 34 Foundation –Tesco Lotus Retail Growth Freehold and Leasehold Property Fund
46 THB Listed 25
Tesco Mobile ČR s.r.o. 16 CZK 100,000 Ordinary 50Tesco Mobile Slovakia s.r.o. 51 €1.00 Ordinary 50Trent Hypermarket Private Limited
41 INR 10.00 Equity 50
Consolidated Structured Entities
Name of UndertakingRegistered
address Nature of businessDelamare Cards Holdco Limited 86 Securitisation entityDelamare Cards MTN Issuer plc 86 Securitisation entityDelamare Cards Receivables Trustee Limited
86 Securitisation entity
Delamare Cards Funding 1 Limited 86 Securitisation entityDelamare Cards Funding 2 Limited 86 Securitisation entityDelamare Finance PLC 11 Securitisation entityDelamare Group Holdings Limited 11 Securitisation entity* Undertaking where other share classes are held by a third party.† Interest held directly by Tesco PLC.
(a) 95% held by Tesco PLC.(b) 66.6% held by Tesco PLC.(c) Shares held by Tesco Pension Trustees Limited (TPTL), the corporate trustee of the
Tesco PLC Pension Scheme (the Scheme). On behalf of the Scheme, TPTL holds a 50% shareholding in three property joint ventures with Tesco, and is the sole shareholder of TPT Holdco No. 1 Limited and Tesco Pension Investment Limited.
(d) 50% held by Tesco PLC.(e) This company is the corporate trustee of the Tesco PLC Pension Scheme.(f) 12.705% held by Tesco PLC.(g) A third share class of £1.00 Ordinary B shares. A third party holds 100% of the Ordinary B
shares in issue. The Group holds 70% of the voting rights of the entity.(h) Company dissolved on 27 February 2018.(j) Company dissolved on 28 February 2018.(k) Company dissolved on 4/5 April 2018.(l) The Booker group of subsidiaries became indirectly wholly-owned by Tesco PLC with
effect from 5 March 2018 unless otherwise stated.(m) Company dissolved on 15 March 2018.(n) Company dissolved on 22 March 2018.(o) Company dissolved on 7 March 2018.(p) Company entered liquidation on 28 February 2018.(q) Company name changed to Sociomantic Labs s.r.o. v likvidaci and entered liquidation
on 1 March 2018.(r) Company incorporated on 29 March 2018. (s) This entity is in liquidation.
145Tesco PLC Annual Report and Financial Statements 2018
Financial statements

1 Tesco House, Shire Park, Kestrel Way, Welwyn Garden City AL7 1GA, United Kingdom
2 Apex Road, Brownhills, Walsall, West Midlands WS8 7TS, United Kingdom3 KPMG LLP, 15 Canada Square, London E14 5GL, United Kingdom4 Local Support Office, Abbey Retail Park, 1st Floor, Newtownabbey,
Northern Ireland, BT36 7GU5 184 Shepherd’s Bush Road, London W6 7NL, United Kingdom6 c/o Morton Fraser LLP, 5th Floor, Quartermile Two, 2 Lister Square,
Edinburgh, Scotland EH3 9GL, United Kingdom7 7-10 Chandos Street, London W1G 9DQ8 5th Floor, 10-12 Alie Street, London E1 8DE, United Kingdom9 KPMG LLP, Saltire Court, 20 Castle Terrace, Edinburgh, Midlothian
EH1 2EG, United Kingdom10 2 South Gyle Crescent, Edinburgh, United Kingdom, EH12 9FQ 11 35 Great St Helen’s, London EC3A 6AP, United Kingdom12 Av. Paulista, 37-4º Andar, São Paulo, 01311-902, Brazil13 Officina No 102, Oficinas Los Andes, San Patricio 4099, Vitacura,
Santiago, Chile14 Units 01, 02, 06, 07, 08, 09, Floor 17, No. 610 Xujiahui Road, Huangpu
District, Shanghai, PRC, China15 R1108 Level 11, Bld No.1, China Central Place, No. 81 Jianguo Road,
Chaoyang District, Beijing, China16 Praha 10 – Vršovice, Vršovická 1527/68b, PSČ 10000, Prague, Czech Republic17 Centre de Commerces et de Loisirs, Cité Europe, 62231 Coquelles, France18 PO Box 25, Regency Court, Glategny Esplanade, St. Peter Port,
GY1 3AP, Guernsey19 Maison Trinity, Trinity Square, St Peter Port, GY1 4AT, Guernsey20 31st Floor, AIA Kowloon Tower, Landmark East, 100 How Ming Street,
Kowloon, Hong Kong21 Level 54, Hopewell Centre, 183 Queens Road East, Hong Kong22 H-2040 Budaörs, Kinizsi, ÚT 1-3, Hungary23 81 & 82, EPIP Area, Whitefield, Bangalore, 560066, India24 Gresham House, Marine Road, Dun Laoghaire, Co. Dublin, Ireland25 25-28 North Wall Quay, International Financial Services Centre,
Dublin 1, Ireland26 38/39 Fitzwilliam Square, Dublin 2, Ireland27 PO Box 87, 22 Grenville Street, St Helier, JE4 8PX, Jersey28 Lime Grove House, Green Street, St Helier, JE1 2ST, Jersey29 c/o CIM Corporate Services Ltd, Les Cascades Building, Edith Cavell
Street, Port Louis, Mauritius30 Willemsparkweg 150 house, 1071 HS, Amsterdam, Netherlands31 De Lairessestraat 137, 1075 HJ, Amsterdam, Netherlands32 56 Kapelenka St, 30-347, Krakow, Poland33 163 Tras Street, #03-01, Lian Huat Building, Singapore, 079024, Singapore34 629/1 Nawamintr Road, Nuanchan, Buengkoom, Bangkok, 10230, Thailand35 The Corporation Trust Company, 1209 Orange Street, Delaware, USA, 1980136 Vistra Corporate Services Centre, Wickhams Cay II, Road Town, Tortola,
VG1110, British Virgin Islands37 Place Carillion, 7151 Jean-Talon East, Montreal Québec, H1M 3N, Canada38 Equity House, Irthlingborough Road, Wellingborough,
Northamptonshire NN8 1LT, United Kingdom39 BDO LLP, Two Snowhill, Birmingham, B4 6GA, United Kingdom40 1148 Budapest, Kerepesi, út 76/D.3. em. 3, Hungary41 Taj Building, 2nd Floor, 210, Dr D.N. Road Fort, Mumbai, 400001, India42 Level 8, Symphony House, Pusat Dagangan Dana 1, Jalan PJU 1A/46, 47301
Petaling Jaya, Selangor Darul Ehsan, Malaysia43 Rosenkrantzgate 16, Oslo, O160, Norway44 313 CP Tower, Silom Road, Khwaeng Silom, Khet Bangrak, Bangkok, Thailand45 Capital Tower, All Seasons Place, Fl.1-6, 87/1 Wireless Road, Lumpini,
Pathumwan, Bangkok 10330, Thailand46 1 Empire Tower, 32nd Floor, South Sathorn Road, Yannawa, Sathorn
Bangkok, 10120, Thailand47 2 Paris Parklands, Railton Road, Guildford, Surrey GU2 9JX, United Kingdom48 Thompson Jenner, 28 Alexandra Terrace, Exmouth, Devon EX8 1BD,
United Kingdom49 c/o Lamburn & Turner, Riverside House, 1 Place Farm, Wheathamstead
St Albans, Hertfordshire AL4 8SB, United Kingdom
50 Ageas House, Hampshire Corporate Park, Templars Way, EastleighHampshire SO53 3YA, United Kingdom
51 Kamenné nám. 1/A 815 61 Bratislava, Slovakia52 Calle 32 b sur #48-100, Envigado, Antioquia, Colombia53 Avenida Brigadeiro Luiz Antonio, No. 3142, 6th Fl Jardim Paulista
Sao Paulo, Brazil, 01402-90154 Yeni Havaalani Caddesi, No. 40 Cigli, Izmir, 35610 Turkey55 Davis LLP, 2800 Park Place, 666 Burrand Street, Vancouver, BC, Canada56 4th Fl, Tower B, Paras Twin Towers, DLF Golf Course Road, Sector 54,
Gurgaon, Haryana-HR, 122002, India57 48 rue Cambon, 75001, Paris, France58 Room 1001, Enterprise Development Tower, No. 398, Jiangsu Road
Changning District, Shanghai 200050, China59 S-22 Greater Kailash, Part 1, Lower Ground Floor, New Delhi 110048, India60 Via Savonarola 217, 35137 Padova, Italy61 Tokyo Club Buolding 11F, 2-6 Kasumigaseki 3-chrime, Chiyoda-ku,
Tokyo, Japan62 37th Floor, ASEM Tower, 517 Yeongdong-daero, Gangnam-gu, Seoul
135-798, Korea63 Floor 3, 2 Harbour Square, Crofton Road, Dun Laoghaire, Dublin, Ireland64 10th Floor, Menara Hap Seng, No. 1 & 3 Jalan P Ramlee, Kuala Lumpur
50250, Malaysia65 Av President Masarik No. 111, Piso 1, Colina Polance V Seccion
Delegacion Miguel Hidalgo, C.P. 11560, Mexico66 Herikerberweg 238, Luna Arena 1101CM, Amsterdam, Zuidoost, Netherlands67 Cesta na Senec 2, Bratislava, 821 04, Slovakia68 B4 Century Square, Heron Crescent, Century City, Cape Town 7441
South Africa69 No. 319 Chamchuri Square Building, 16th Fl, Unit 01, Phayathi Road
Pathumwan sub District, Bangkok 10330, Thailand70 424 Walnut Street, Suite 1800, Cincinnati, Ohio 45202, United States71 One East Fourth Street, Suite 1400, Cincinnati, Ohio 45202, United States72 Paul-Lincke-Ufer 39/40, 10999 Berlin, Germany73 Rua Sansão Alves dos Santos, 76, 12° andar, conj. 121 e 122, EdifÍcio Uchôa
Borges, CEP 04571-090, Pinheiros, São Paulo, Brazil74 Stefanikova 18/25, Smichov 150 00, Prague 5, Czech Republic75 18 rue de la Pépinière, Paris (75008), France76 801, 8th Floor, El Tara Building, off Orchard Avenue, Hiranandani Gardens,
Powai, Mumbai-400076, India77 Danzigerkade 13H 2hg, 1013AP Amsterdam, Netherlands78 ul. Puławska 2, 02-566 Warszawa, Poland79 Russian Federation, 121099, Moscow, Spasopeskovsky lane, 7/1, b.1. Russia80 30 A Tanjong Pagar Road, Singapore 088453, Singapore81 Paseo de General Martinez Campos nº 9 1º izquierda, 28010 Madrid, Spain82 Istiklal Caddesi Beyoglu Is Merkezi No: 187/5 Galatasaray, Istanbul, Turkey83 c/o United Corporate Services, Inc., 874 Walker Road, Suite C, Dover,
DE 19904, United States84 Room 886S, 8/F, 1111, Changshou Road, Jing’an District, Shanghai,
People’s Republic of China85 5th Floor, Unit 401, Tower B, The Millenia, No. 1&2 Murphy Road
Ulsoor, Bangalore, 560 008, India86 Asticus Building, 2nd Floor, 21 Palmer Street, London SW1H 0AD,
United Kingdom87 Ernst & Young Llp, 16 Bedford Street, Belfast, BT2 7DT, Northern Ireland88 KPMG LLP, Stokes House, 17-25 College Square East, Belfast BT1 6DH
Northern Ireland89 Unit 607, 6th floor, Trade Centre, Bandra Kurla Complex, Bandra East,
Mumbai, 400 051, Maharashtra, India90 Ernst & Young Llp, 1 More London Place, London, SE1 2AF, United Kingdom91 Ernst & Young Llp, 10 George Street, Edinburgh, EH2 2DZ, Scotland,
United Kingdom92 5 Esperidon Street, 4th floor, 2001 Strovolos, Nicosia, Cyprus93 PO Box 237, Peregrine House, Peel Road, Douglas, Isle of Man, IM99 1SU94 999/9, 31st Floor, Rama 1 Road, Pathumwan District, Bangkok, 10330, Thailand95 Suite 1106-8, 11/F Tai Yau Building, No. 181 Johnston Road, Hong Kong96 Av. El Golf 40, 7th floor, Las Condes, Santiago de Chile, Chile97 Level 21, 55 Collins Street, Melbourne, VIC 3000, Australia98 State Street Global Advisors Limited, 20 Churchill Place, Canary Wharf,
London E14 5HJ, United Kingdom
Tesco PLC Annual Report and Financial Statements 2018146
Registered office addresses

Total sales performance at actual rates (exc. VAT, exc. fuel)1Q
2017/182Q
2017/183Q
2017/184Q
2017/181H
2017/182H
2017/18FY
2017/18UK & ROI 2.0% 2.5% 2.7% 2.9% 2.2% 2.8% 2.5%
UK 1.6% 2.1% 2.5% 2.3% 1.8% 2.4% 2.1%ROI 9.2% 10.0% 7.1% 13.3% 9.6% 10.2% 9.9%
Central Europe 8.4% 8.8% 3.1% 4.5% 8.6% 3.8% 6.1%Asia 8.5% (4.0)% (8.9)% (11.5)% 2.0% (10.3)% (4.4)%Tesco Bank 4.8% 4.8% 4.9% 1.1% 4.8% 3.0% 3.9%Group 3.4% 2.7% 1.6% 1.5% 3.0% 1.6% 2.3%
Total sales performance at constant rates (exc. VAT, exc. fuel)1Q
2017/182Q
2017/183Q
2017/184Q
2017/181H
2017/182H
2017/18FY
2017/18UK & ROI 1.4% 2.1% 2.5% 2.7% 1.8% 2.6% 2.2%
UK 1.6% 2.1% 2.5% 2.4% 1.8% 2.4% 2.1%ROI 0.0% 2.1% 3.8% 9.4% 1.1% 6.6% 3.9%
Central Europe (1.7)% (1.2)% (1.3)% (2.0)% (1.4)% (1.7)% (1.6)%Asia (4.8)% (10.8)% (9.6)% (12.4)% (7.7)% (11.1)% (9.4)%Tesco Bank 4.8% 4.8% 4.9% 1.1% 4.8% 3.0% 3.9%Group 0.5% 0.4% 0.9% 0.5% 0.5% 0.7% 0.6%
NotesAs part of a routine review of revenue streams, the Group has identified a number of small sales sub-categories, in Asia and Central Europe, where Tesco is viewed as acting more as a selling agent than as a retailer principal. A change was therefore made in the current year to reflect the net commission on these sales, instead of the previous presentation of the gross revenue and cost of sales separately. While this change was adopted in the fourth quarter, the total sales growth performance measures for each prior quarter in the tables above have been adjusted to reflect this change with an impact of c.(0.2)% at Group level.
Like-for-like sales performance (exc. VAT, exc. fuel)1Q
2017/182Q
2017/183Q
2017/184Q
2017/181H
2017/182H
2017/18FY
2017/18UK & ROI 2.2% 2.1% 2.3% 2.4% 2.1% 2.4% 2.3%
UK 2.3% 2.1% 2.3% 2.3% 2.2% 2.3% 2.2%ROI 0.2% 2.0% 3.3% 5.3% 1.1% 4.3% 2.7%
Central Europe (0.4)% 0.6% 0.8% 0.4% 0.1% 0.6% 0.3%Asia (6.0)% (10.7)% (9.6)% (14.0)% (8.3)% (11.8)% (10.0)%Tesco Bank n/a n/a n/a n/a n/a n/a n/aGroup 1.0% 0.6% 0.9% 0.4% 0.8% 0.6% 0.7%
NotesThese results have been reported on a continuing operations basis and exclude the results from the Group’s operations in Turkey. Like-for-like sales growth is reported at constant exchange rates. Growth rates are all based on comparable days.
Country detail – RetailRevenue (exc. VAT, inc. fuel)*
Local currency
(m) £m
Average exchange
rate
Closing exchange
rate UK 42,644 42,644 1.0 1.0ROI 2,572 2,264 1.1 1.1Czech Republic 43,680 1,474 29.6 28.8Hungary 577,204 1,641 351.7 355.5Poland 10,580 2,202 4.8 4.7Slovakia 1,404 1,236 1.1 1.1Malaysia 4,370 791 5.5 5.5Thailand 181,754 4,156 43.7 43.9* Excludes franchising revenue within Central Europe of £32m, which is not allocated to individual countries.
UK sales area by size of storeFebruary 2018 February 2017
Store size (sq. ft.) No. of stores Million sq. ft.% of total
sq. ft. No. of stores Million sq. ft.% of total
sq. ft.0-3,000 2,512 5.2 13.1 2,507 5.2 13.13,001-20,000 284 3.4 8.5 288 3.4 8.620,001-40,000 284 8.2 20.6 283 8.2 20.540,001-60,000 182 9.4 23.6 182 9.4 23.560,001-80,000 120 8.5 21.4 120 8.6 21.580,001-100,000 45 4.2 10.6 45 4.2 10.6Over 100,000 8 0.9 2.2 8 0.9 2.2Total* 3,435 39.8 100.0 3,433 39.9 100.0* Excludes franchise stores.
Other information
147Tesco PLC Annual Report and Financial Statements 2018
Supplementary information (unaudited)

Group space summaryActual Group space – store numbers(a)
2016/17 year-end Openings
Closures/disposals
Net gain/ (reduction)(b)
2017/18 year-end
Repurposing/ extensions
Extra 252 – – – 252 20Superstore 479 2 (1) 1 480 –Metro 176 – (4) (4) 172 –Express 1,740 11 (2) 9 1,749 –Dotcom only 6 – – – 6 –Total Tesco 2,653 13 (7) 6 2,659 20One Stop(c) 780 11 (15) (4) 776 –UK(c) 3,433 24 (22) 2 3,435 20ROI 148 2 – 2 150 –
UK & ROI(c) 3,581 26 (22) 4 3,585 20Czech Republic(c) 198 2 (11) (9) 189 6Hungary 206 – – – 206 4Poland 429 – (14) (14) 415 4Slovakia 154 – (3) (3) 151 1Central Europe(c) 987 2 (28) (26) 961 15Malaysia 71 2 (1) 1 72 4Thailand 1,914 67 (30) 37 1,951 30Asia 1,985 69 (31) 38 2,023 34
Group(c) 6,553 97 (81) 16 6,569 69UK (One Stop) 158 19 (8) 11 169 –Czech Republic 98 2 (3) (1) 97 –
Franchise stores 256 21 (11) 10 266 –(a) Continuing operations.(b) The net gain/(reduction) reflects the number of store openings less the number of store closures/disposals.(c) Excludes franchise stores.
Actual Group space – ’000 sq. ft.(a)
2016/17 year-end Openings
Closures/disposals
Repurposing/ extensions(c)
Net gain/ (reduction)
2017/18 year-end
Extra 17,748 – – (76) (76) 17,672Superstore 14,075 37 (15) – 22 14,097Metro 1,993 – (32) – (32) 1,961Express 4,054 24 (4) – 20 4,074Dotcom only 716 – – – – 716Total Tesco 38,586 61 (51) (76) (66) 38,520One Stop(b) 1,269 21 (24) – (3) 1,266UK(b) 39,855 82 (75) (76) (69) 39,786ROI 3,543 22 – 1 23 3,566
UK & ROI(b) 43,398 104 (75) (75) (46) 43,352Czech Republic(b) 5,479 2 (166) (256) (420) 5,059Hungary 6,896 – – (58) (58) 6,838Poland 9,578 – (146) (151) (297) 9,281Slovakia 3,859 11 (123) (27) (139) 3,720Central Europe(b) 25,812 13 (435) (492) (914) 24,898Malaysia 4,005 64 (60) (179) (175) 3,830Thailand 15,522 413 (115) (348) (50) 15,472Asia 19,527 477 (175) (527) (225) 19,302
Group(b) 88,737 594 (685) (1,094) (1,185) 87,552UK (One Stop) 212 24 (12) – 12 224Czech Republic 92 2 (2) – – 92
Franchise stores 304 26 (14) – 12 316(a) Continuing operations.(b) Excludes franchise stores.(c) Repurposing of gross selling space is not included in the above net selling space measure.
Tesco PLC Annual Report and Financial Statements 2018148
Supplementary information (unaudited) continued

Group space summary continuedGroup space forecast to 23 February 2019 – ’000 sq. ft.(a)
2017/18 year-end Openings
Closures/disposals
Repurposing/ extensions
Net gain/ (reduction)
2018/19 year-end
Extra 17,672 – – – – 17,672Superstore 14,097 28 – – 28 14,125Metro 1,961 – – – – 1,961Express 4,074 95 (23) – 72 4,146Dotcom only 716 – – – – 716Total Tesco 38,520 123 (23) – 100 38,620One Stop(b) 1,266 37 (32) – 5 1,271UK(b) 39,786 160 (55) – 105 39,891ROI 3,566 81 – – 81 3,647
UK & ROI(b) 43,352 241 (55) – 186 43,538Czech Republic(b) 5,059 13 (285) (108) (380) 4,679Hungary 6,838 – (28) (314) (342) 6,496Poland 9,281 – (243) (235) (478) 8,803Slovakia 3,720 39 (86) (119) (166) 3,554Central Europe(b) 24,898 52 (642) (776) (1,366) 23,532Malaysia 3,830 43 (88) (40) (85) 3,745Thailand 15,472 596 – (211) 385 15,857Asia 19,302 639 (88) (251) 300 19,602
Group(b) 87,552 932 (785) (1,027) (880) 86,672UK (One Stop) 224 52 – – 52 276Czech Republic 92 4 – – 4 96
Franchise stores 316 56 – – 56 372(a) Continuing operations.(b) Excludes franchise stores.
Tesco Bank income statement2018(a)
£m2017(a)
£mRevenueInterest receivable and similar income 673 622Fees and commissions receivable 378 390
1,051 1,012Direct costsInterest payable (176) (175)Fees and commissions payable (22) (23)
(198) (198)Gross profit 853 814Other expensesStaff costs (174) (165)Premises and equipment (77) (76)Other administrative expenses (209) (215)Depreciation and amortisation (83) (96)Provisions for bad and doubtful debts (137) (105)Operating profit before exceptional items 173 157Exceptional items(b) (24) (80)Operating profit 149 77Net finance costs: movements on derivatives and hedge accounting 11 6Net finance costs: interest (4) (4)Share of profit/(loss) of joint venture 10 (16)Profit before tax 166 63(a) These results are for the 12 months ended 28 February 2018 and the previous period represents the 12 months ended 28 February 2017.(b) Exceptional items in 2018 consist of an increase in PPI provision of £35m partially offset by a decrease in CCA provision of £1m and a credit of £10m received following the conclusion
of negotiations with a third party in respect of previously recognised customer redress.
Other information
149Tesco PLC Annual Report and Financial Statements 2018

Alternative performance measuresIntroduction In the reporting of financial information, the Directors have adopted various APMs.
These measures are not defined by International Financial Reporting Standards (IFRS) and therefore may not be directly comparable with other companies’ APMs, including those in the Group’s industry.
APMs should be considered in addition to, and are not intended to be a substitute for, or superior to, IFRS measurements.
PurposeThe Directors believe that these APMs assist in providing additional useful information on the underlying trends, performance and position of the Group.
APMs are also used to enhance the comparability of information between reporting periods and geographical units (such as like-for-like sales), by adjusting for non-recurring or uncontrollable factors which affect IFRS measures, to aid users in understanding the Group’s performance.
Consequently, APMs are used by the Directors and management for performance analysis, planning, reporting and incentive-setting purposes.
The key APMs that the Group has focused on this financial year are as follows:
– Group sales: This is the headline measure of revenue for the Group. It excludes the impact of sales made at petrol filling stations due to the significant volatility of fuel prices. This volatility is outside the control of management and can mask underlying changes in performance.
– Like-for-like sales: This is a widely used indicator of a retailer’s current trading performance. It is a measure of growth in Group online sales and sales from stores that have been open for at least a year (but excludes prior year sales of stores closed during the year) at constant foreign exchange rates.
– Operating profit before exceptional items: This is the headline measure of the Group’s performance, and is based on operating profit before the impact of exceptional items. Exceptional items relate to certain costs or incomes that derive from events or transactions that fall within the normal activities of the Group but which, individually or, if of a similar type, in aggregate, are excluded by virtue of their size and nature in order to reflect management’s view of the performance of the Group.
– Retail operating cash flow: This is the operating cash flow of continuing operations, excluding the effects of Tesco Bank’s cash flows.
– Retail free cash flow: Retail free cash flow includes all cash flows from operating and investing activities for the Retail business, and the market purchase of shares in relation to share schemes. The following items are excluded: investing cash flows that increase/decrease items within Net debt, and cash flows from major corporate acquisitions and disposals.
– Net debt: This excludes the net debt of Tesco Bank but includes that of the discontinued operations to reflect the net debt obligations of the Retail business.
– Diluted earnings per share from continuing operations before exceptional items, net pension finance costs and fair value remeasurements on financial instruments: This relates to profit after tax before exceptional items from continuing operations, net pension finance costs and fair value remeasurements on financial instruments attributable to owners of the parent divided by the weighted average number of ordinary shares in issue during the financial year adjusted for the effects of potentially dilutive share options.
Some of the Group’s IFRS measures are translated at constant exchange rates. Constant exchange rates are the average actual periodic exchange rates for the previous financial year and are used to eliminate the effects of exchange rate fluctuations in assessing performance. Actual exchange rates are the average actual periodic exchange rates for that financial year.
Changes to APMsDuring the financial year, the following changes have been applied to the Group’s APMs:
– Free cash flow has been redefined to include all cash flows from operating and investing activities, and the market purchase of shares in relation to share schemes. The following items are excluded: investing cash flows that increase/decrease items within Group net debt, and cash flows from major corporate acquisitions and disposals. This measure reflects the cash available to shareholders. Previously, free cash flow only included capital expenditure cash flows within investing activities. Retail free cash flow is now considered a key APM.
– Diluted earnings per share from continuing operations before exceptional items and net pension finance costs has been replaced with diluted earnings per share from continuing operations before exceptional items, net pension finance costs and fair value remeasurements on financial instruments. Fair value remeasurements are now excluded as they are impacted by changes to credit risk and various market indices, which can fluctuate significantly. Also included in these items are fair value remeasurements on financial instruments resulting from liability management exercises. Other earnings per share measures before exceptional items are no longer considered APMs and have been removed.
– Total indebtedness ratio and Fixed charge cover have been included as new APMs during the year. EBITDAR has also been included as it is used to calculate these debt metrics. Total indebtedness ratio and Fixed charge cover are measures of the Group’s ability to meet its payment obligations and are widely used by analysts and credit rating agencies.
APMClosest equivalent IFRS measure
Adjustments to reconcile to IFRS measure
Note/page referencefor reconciliation
Definition and purpose
Income statementRevenue measuresGroup sales Revenue – Exclude sales made
at petrol filling stationsNote 2 – Excludes the impact of sales made at petrol filling
stations to demonstrate the Group’s underlying performance in the core retail and financial services businesses by removing the volatilities associated with the movement in fuel prices. This is a key management incentive metric.
Growth in sales No direct equivalent – Consistent with accounting policy
Not applicable – Growth in sales is a ratio that measures year-on-year movement in Group sales for continuing operations for 52 weeks. It shows the annual rate of increase in the Group’s sales and is considered a good indicator of how rapidly the Group’s core business is growing.
Like-for-like No direct equivalent – Consistent with accounting policy
Not applicable – Like-for-like is a measure of growth in Group online sales and sales from stores that have been open for at least a year (but excludes prior year sales of stores closed during the year) at constant foreign exchange rates. It is a widely used indicator of a retailer’s current trading performance and is important when comparing growth between retailers that have different profiles of expansion, disposals and closures.
Tesco PLC Annual Report and Financial Statements 2018150
Glossary

APMClosest equivalent IFRS measure
Adjustments to reconcile to IFRS measure
Note/page referencefor reconciliation
Definition and purpose
Income statementProfit measuresOperating profit before exceptional items
Operating profit* – Exceptional items Note 2 – Operating profit before exceptional items is the headline measure of the Group’s performance. It is based on operating profit before the impact of certain costs or incomes that derive from events or transactions that fall within the normal activities of the Group, but which are excluded by virtue of their size and nature in order to reflect management’s view of the performance of the Group. This is a key management incentive metric.
Operating margin No direct equivalent – Consistent with accounting policy
Not applicable – Operating margin is calculated as operating profit before exceptional items divided by revenue. Progression in operating margin is an important indicator of the Group’s operating efficiency.
Earnings before exceptional items, interest, tax, depreciation, amortisation and rent expense (EBITDAR)
Operating profit* – Exceptional items – Depreciation and amortisation – Rent expense – Tesco Bank EBITDAR – Discontinued operations
Page 153 – This measure is based on Retail operating profit from continuing operations before exceptional items. It excludes Retail depreciation, amortisation and rent expense and is used to derive the Total indebtedness ratio and Fixed charge cover APMs.
Profit before tax before exceptional items, net pension finance costs and fair value remeasurements on financial instruments
Profit before tax – Exceptional items – Net pension finance costs (IAS 19) – Fair value remeasurements on financial instruments (IAS 39)
Note 9 – This measure excludes exceptional items, the net finance costs of the defined benefit pension deficit and fair value remeasurements on financial instruments. Net pension finance costs are impacted by corporate bond yields, which can fluctuate significantly and are reset each year based on often volatile external market factors. Fair value remeasurements are impacted by changes to credit risk and various market indices, which can fluctuate significantly. Also included in these items are fair value remeasurements on financial instruments resulting from liability management exercises.
Profits/(losses) arising on property-related items
No direct equivalent – Consistent with accounting policy
Not applicable – Profits/(losses) arising on property-related items relates to the Group’s property activities including: gains and losses on disposal of property assets, development property built for resale and property joint ventures; costs resulting from changes in the Group’s store portfolio and distribution network, including pre-opening and post-closure costs; and income/(charges) associated with impairment of non-trading property and related onerous contracts.
– These items are disclosed separately to clearly identify the impact of these items versus the other operating expenses related to the core retail and financial services operations of the business. They are often one-time in nature and can have a disproportionate impact on profit between reporting periods.
Total finance costs before exceptional items, net pension finance costs and fair value remeasurements on financial instruments
Finance costs – Exceptional items – Net pension finance costs (IAS 19) – Fair value remeasurements on financial instruments (IAS 39)
Note 5 – Total finance costs before exceptional items, net pension finance costs and fair value remeasurements on financial instruments is the net finance costs adjusted for non-recurring one-off items, net pension finance costs and fair value remeasurements on financial instruments. Net pension finance costs are impacted by corporate bond yields, which can fluctuate significantly and are reset each year based on often volatile external market factors. Fair value remeasurements are impacted by changes to credit risk and various market indices, which can fluctuate significantly. Also included in these items are fair value remeasurements on financial instruments resulting from liability management exercises.
Earnings per share from continuing operations before exceptional items, net pension finance costs and fair value remeasurements on financial instruments
Diluted earnings per share
– Exceptional items – Discontinued operations – Net pension finance costs (IAS 19) – Fair value remeasurements on financial instruments (IAS 39)
Note 9 – This relates to profit after tax before exceptional items from continuing operations, net pension finance costs and fair value remeasurements attributable to owners of the parent divided by the weighted average number of ordinary shares in issue during the financial period.
– It excludes net pension finance costs and fair value remeasurements on financial instruments. Net pension finance costs are impacted by corporate bond yields, which can fluctuate significantly and are reset each year based on often volatile external market factors. Fair value remeasurements are impacted by changes to credit risk and various market indices, which can fluctuate significantly. Also included in these items are fair value remeasurements on financial instruments resulting from liability management exercises.
Other information
151Tesco PLC Annual Report and Financial Statements 2018
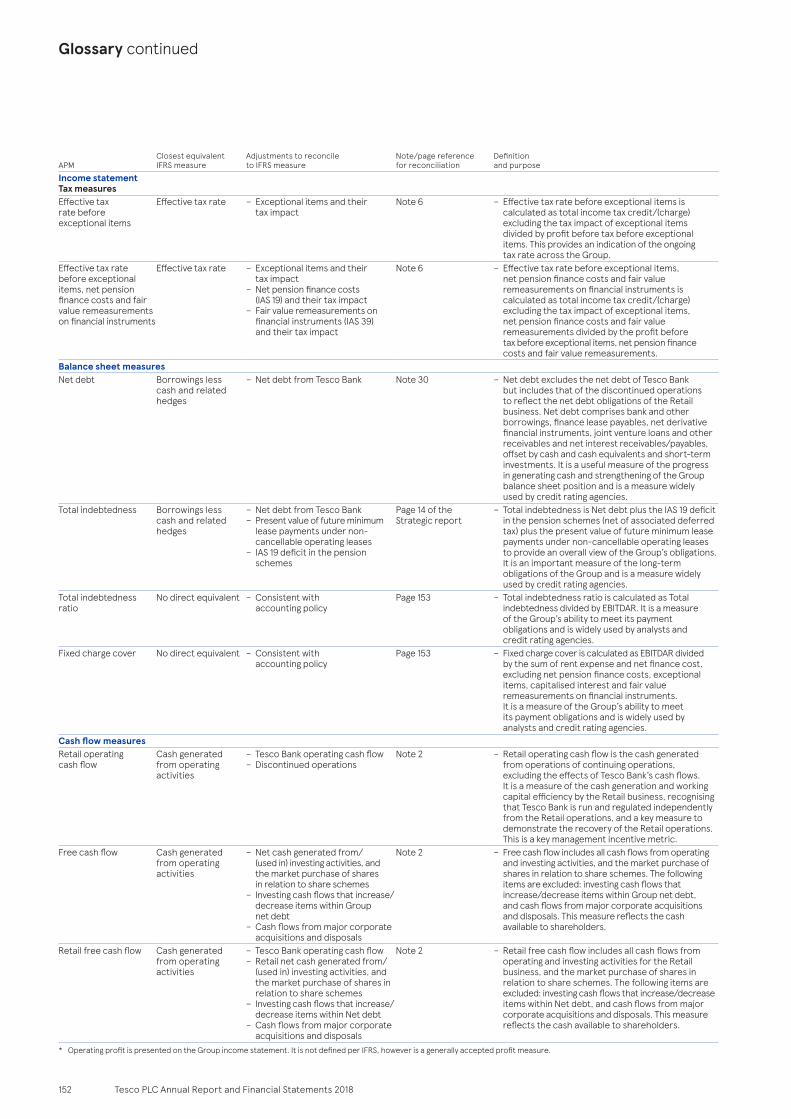
APMClosest equivalent IFRS measure
Adjustments to reconcile to IFRS measure
Note/page referencefor reconciliation
Definition and purpose
Income statementTax measuresEffective tax rate before exceptional items
Effective tax rate – Exceptional items and their tax impact
Note 6 – Effective tax rate before exceptional items is calculated as total income tax credit/(charge) excluding the tax impact of exceptional items divided by profit before tax before exceptional items. This provides an indication of the ongoing tax rate across the Group.
Effective tax rate before exceptional items, net pension finance costs and fair value remeasurements on financial instruments
Effective tax rate – Exceptional items and their tax impact
– Net pension finance costs (IAS 19) and their tax impact
– Fair value remeasurements on financial instruments (IAS 39) and their tax impact
Note 6 – Effective tax rate before exceptional items, net pension finance costs and fair value remeasurements on financial instruments is calculated as total income tax credit/(charge) excluding the tax impact of exceptional items, net pension finance costs and fair value remeasurements divided by the profit before tax before exceptional items, net pension finance costs and fair value remeasurements.
Balance sheet measuresNet debt Borrowings less
cash and related hedges
– Net debt from Tesco Bank Note 30 – Net debt excludes the net debt of Tesco Bank but includes that of the discontinued operations to reflect the net debt obligations of the Retail business. Net debt comprises bank and other borrowings, finance lease payables, net derivative financial instruments, joint venture loans and other receivables and net interest receivables/payables, offset by cash and cash equivalents and short-term investments. It is a useful measure of the progress in generating cash and strengthening of the Group balance sheet position and is a measure widely used by credit rating agencies.
Total indebtedness Borrowings less cash and related hedges
– Net debt from Tesco Bank – Present value of future minimum lease payments under non-cancellable operating leases
– IAS 19 deficit in the pension schemes
Page 14 of the Strategic report
– Total indebtedness is Net debt plus the IAS 19 deficit in the pension schemes (net of associated deferred tax) plus the present value of future minimum lease payments under non-cancellable operating leases to provide an overall view of the Group’s obligations. It is an important measure of the long-term obligations of the Group and is a measure widely used by credit rating agencies.
Total indebtedness ratio
No direct equivalent – Consistent with accounting policy
Page 153 – Total indebtedness ratio is calculated as Total indebtedness divided by EBITDAR. It is a measure of the Group’s ability to meet its payment obligations and is widely used by analysts and credit rating agencies.
Fixed charge cover No direct equivalent – Consistent with accounting policy
Page 153 – Fixed charge cover is calculated as EBITDAR divided by the sum of rent expense and net finance cost, excluding net pension finance costs, exceptional items, capitalised interest and fair value remeasurements on financial instruments. It is a measure of the Group’s ability to meet its payment obligations and is widely used by analysts and credit rating agencies.
Cash flow measuresRetail operating cash flow
Cash generated from operating activities
– Tesco Bank operating cash flow – Discontinued operations
Note 2 – Retail operating cash flow is the cash generated from operations of continuing operations, excluding the effects of Tesco Bank’s cash flows. It is a measure of the cash generation and working capital efficiency by the Retail business, recognising that Tesco Bank is run and regulated independently from the Retail operations, and a key measure to demonstrate the recovery of the Retail operations. This is a key management incentive metric.
Free cash flow Cash generated from operating activities
– Net cash generated from/ (used in) investing activities, and the market purchase of shares in relation to share schemes
– Investing cash flows that increase/decrease items within Group net debt
– Cash flows from major corporate acquisitions and disposals
Note 2 – Free cash flow includes all cash flows from operating and investing activities, and the market purchase of shares in relation to share schemes. The following items are excluded: investing cash flows that increase/decrease items within Group net debt, and cash flows from major corporate acquisitions and disposals. This measure reflects the cash available to shareholders.
Retail free cash flow Cash generated from operating activities
– Tesco Bank operating cash flow – Retail net cash generated from/ (used in) investing activities, and the market purchase of shares in relation to share schemes
– Investing cash flows that increase/decrease items within Net debt
– Cash flows from major corporate acquisitions and disposals
Note 2 – Retail free cash flow includes all cash flows from operating and investing activities for the Retail business, and the market purchase of shares in relation to share schemes. The following items are excluded: investing cash flows that increase/decrease items within Net debt, and cash flows from major corporate acquisitions and disposals. This measure reflects the cash available to shareholders.
* Operating profit is presented on the Group income statement. It is not defined per IFRS, however is a generally accepted profit measure.
Tesco PLC Annual Report and Financial Statements 2018152
Glossary continued

OtherCapital expenditure (Capex)The additions to property, plant and equipment, investment property and intangible assets (excluding assets acquired under business combinations).
Capital employedNet assets plus net debt plus dividend creditor less net assets of the disposal group and non-current assets classified as held for sale.
Enterprise ValueThis is calculated as market capitalisation plus net debt.
FTEFTE refers to full-time equivalents.
LPILPI refers to Limited Price Inflation.
Market capitalisationThe total value of all Tesco shares calculated as total number of shares multiplied by the closing share price at year-end.
MTNMTN refers to Medium Term Note.
Net Promoter Score (NPS)This is a loyalty measure based on a single question requiring a score between 0-10. The NPS is calculated by subtracting the percentage of detractors (scoring 0-6) from the percentage of promoters (scoring 9-10). This generates a figure between -100 and 100 which is the NPS.
Return on capital employed (ROCE)Return divided by the average of opening and closing capital employed.
ReturnProfit before exceptional items and interest, after tax (applied at effective rate of tax).
RPIRPI refers to Retail Price Index.
Total shareholder returnThe notional annualised return from a share, measured as the percentage change in the share price, plus the dividends paid with the gross dividends, reinvested in Tesco shares. This is measured over both a one and five year period.
APMs: Reconciliation of debt metrics
EBITDAR Notes2018
£m2017
£mOperating profit/(loss) from continuing operations before exceptional items 2 1,644 1,280Less: Tesco Bank operating profit/(loss) before exceptional items 2 (173) (157)Add: Depreciation and amortisation 2 1,295 1,298Less: Tesco Bank depreciation and amortisation 2 (83) (118)Add: Retail operating lease expense* 3 1,015 1,039
3,698 3,342
Total indebtedness ratio Notes 2018 2017Net debt (£m) 30 2,625 3,729Add: Defined benefit pension deficit, net of deferred tax (£m) 27 2,728 5,504Add: Discounted operating lease commitments (£m) 34 6,931 7,440Total indebtedness (£m) 12,284 16,673EBITDAR (£m) 3,698 3,342Total indebtedness ratio 3.3 5.0
Fixed charge cover Notes 2018 2017Net finance cost (£m) 5 533 765Less: Net pension finance costs (£m) 5 (162) (113)Less: Exceptional foreign exchange losses on GBP short-term investments held in overseas entities (£m) 5 (38) (244)Add: Capitalised interest (£m) 5 2 6Add: Fair value remeasurements on financial instruments (IAS 39) (£m) 5 23 61Net finance cost, excluding net pension finance costs, exceptional items, capitalised interest and fair value remeasurements on financial instruments (IAS 39) (£m)
358 475
Add: Retail operating lease expense (£m)* 3 1,015 1,0391,373 1,514
EBITDAR (£m) 3,698 3,342Fixed charge cover 2.7 2.2* Group operating lease expense of £1,018m (2017: £1,043m) includes £3m (2017: £4m) relating to Tesco Bank.
Other information
153Tesco PLC Annual Report and Financial Statements 2018

Figures below reflect the latest published information. For financial years prior to 2018, these figures represent the comparatives from the following years’ financial statements. During 2017, the Group decided to sell its operations in Turkey. Accordingly, these operations were treated as discontinued in 2017. The 2016 statistics have been re-presented to be consistent with 2017. Prior years have not been re-presented. Korea was first classified as a discontinued operation in 2016. China was first classified as a discontinued operation in 2013/14.
The Group has determined new segments during the financial year. Refer to Note 2. The Group had also determined new segments and defined new APMs during 2016. Historical data up to 2015 data for these new measures and segments has been presented, but prior historic data has not.
2014 2015(a) 2016 2017 2018Financial statistics (£m)SalesUK & ROI 38,228 37,189 37,692 38,650Central Europe 6,186 5,268 5,977 6,343Asia 4,492 4,447 5,186 4,947Tesco Bank 1,003 947 955 1,012 1,051Group sales(c) 49,853 47,859 49,867 50,991RevenueUK & ROI 45,062 43,080 43,524 44,908Central Europe 6,424 5,451 6,195 6,585Asia 4,492 4,447 5,186 4,947Tesco Bank 1,003 947 955 1,012 1,051Group revenue 63,557 56,925 53,933 55,917 57,491Operating profit/(loss) before exceptional items(c)
UK & ROI 498 503 803 1,053Central Europe (4) 102 58 119Asia 258 218 262 299Tesco Bank 188 162 157 173Group operating profit/(loss) before exceptional items(c) 940 985 1,280 1,644Operating profit margin before exceptional items 1.7% 1.8% 2.3% 2.9%Operating profit/(loss)UK & ROI (5,334) 597 519 1,199Central Europe (666) 111 190 212Asia 97 203 231 277Tesco Bank 153 161 77 149Group operating profit/(loss) 2,631 (5,750) 1,072 1,017 1,837Share of post-tax profits/(losses) of joint ventures and associates 60 (13) (21) (107) (6)Net finance costs (432) (571) (849) (765) (533)Profit/(loss) before tax 2,259 (6,334) 202 145 1,298Taxation (347) 670 54 (87) (306)Profit/(loss) for the year from continuing operations 1,912 (5,664) 256 58 992Discontinued operations (942) (102) (127) (112) 216Profit/(loss) for the year 970 (5,766) 129 (54) 1,208Attributable to:Owners of the parent 974 (5,741) 138 (40) 1,206Non-controlling interests (4) (25) (9) (14) 2Profit before tax before exceptional items, net pension finance costs and fair value remeasurements on financial instruments(c)
516 509 781 1,282
Other financial statisticsDiluted earnings/(losses) per share – continuing operations (69.56)p 3.22p 0.81p 12.08pDiluted earnings per share – continuing operations before exceptional items, net pension finance costs and fair value remeasurements on financial instruments(c)
5.70p 5.79p 7.30p 11.88p
Dividend per share(b) 14.76p 1.16p – – 3.00pCash generated from Retail operating activities (£m) 4,607 1,860 2,581 2,278 2,773Return on capital employed (ROCE)(c) 13.6% 4.0% 6.2% 8.1% 10.9%Total shareholder return(c) 3.7% (9.5)% (11.8)% (7.5)% 8.7%Net debt (£m)(c) 6,597 8,481 5,110 3,729 2,625Discounted operating lease commitments – continuing operations (£m) 9,419 9,353 7,814 7,440 6,931Pension deficit, net of deferred tax – Group (£m) 2,559 3,885 2,612 5,504 2,728Total indebtedness (£m)(c) 18,575 21,719 15,536 16,673 12,284Enterprise Value (£m)(c) 33,597 28,415 20,101 19,262 19,452Group Retail statisticsNumber of stores(d) 7,305 6,849 6,733 6,809 6,966Total sales area (’000 sq. ft.)(d) 109,572 95,811 91,195 89,041 87,990Average employees 510,444 480,607 475,399 464,520 448,988Average full-time equivalent employees (FTE) 391,868 362,370 351,289 342,770 327,916UK & ROI Retail statisticsNumber of stores(d) 3,524 3,710 3,743 3,739 3,754Total sales area (’000 sq. ft.)(d) 45,300 45,946 45,253 43,610 43,577Average full-time equivalent employees (FTE) 225,192 225,378 218,522 210,312Revenue (exc. fuel) (per FTE – £) 169,757 165,007 172,486 183,775Weekly revenue (exc. fuel) (per sq. ft. – £) 15.81 15.68 16.31 17.05(a) 53 weeks. (b) Dividend per share relating to the interim and proposed final dividend. (c) See glossary for definitions. (d) Including franchise stores.
Tesco PLC Annual Report and Financial Statements 2018154
Five-year record

Annual General Meeting 2018 (AGM)This year’s AGM will be held on Friday 15 June 2018 at the ICC Capital Suite, 3rd Floor of ExCel London, One Western Gateway, Royal Victoria Dock, London, E16 1XL. The meeting will start at 2.00pm and registration will be open from 1.00pm.
A separate notice convening the meeting has been sent to our shareholders, which includes details of the ordinary and special business to be considered at the meeting. A copy of the Notice of Meeting can be found on our website www.tescoplc.com/investors.
Managing shares onlineMany of our shareholders find that the easiest way to manage their shareholding is online by setting up a Shareview portfolio at www.shareview.co.uk. This is a free, easy and secure service provided by the Company’s registrars, Equiniti.
Some of the benefits of having a Shareview portfolio are:
– monitor your shareholding; – access shareholder information; – elect to receive shareholder communications electronically; – vote on the resolutions at the AGM, and any other shareholder meetings; and
– keep your contact details up to date.
For more information and to register for this service, please visit www.shareview.co.uk. Registration can be completed within minutes in just four easy steps. Please note, you will need your Shareholder Reference Number.
DividendFollowing the announcement on 4 October 2017 of the reinstatement of the Tesco dividend, an interim dividend of 1.0p per share was paid on 24 November 2017. Shareholders will be asked to approve a final dividend of 2.0p per share for the year ended 24 February 2018 at this year’s AGM. Dividends are expected to grow from 2017, with the aim of achieving a target cover of approximately two times earnings per share over the medium term.
Dividends can be paid quickly and securely directly into your bank account. You may also choose to have your dividends reinvested in further Tesco shares through our dividend reinvestment plan (DRIP) (terms and conditions apply). To arrange either of these options, simply call Equiniti on the number provided overleaf. Alternatively, you can manage your dividend payment choices by registering with Shareview at www.shareview.co.uk.
E-commsWe encourage our shareholders to accept all shareholder communications and documents electronically, in place of receiving traditional paper copies by post. This helps us to reduce the environmental impact of our business and to reduce costs. If you would like to sign up to receive all future shareholder communications electronically, please register with Shareview by visiting www.shareview.co.uk. Once you have signed up, you will receive an email to let you know when shareholder documents become available on our website, including our annual and interim financial results, notices of shareholder meetings and other shareholder documents.
Tesco Share AccountWe offer our shareholders a service to help them hold and manage their Tesco shares in a safe and simple way. With the Tesco Share Account (TSA) you can enjoy the convenience and reassurance of holding shares electronically, avoiding the need to hold paper share certificates, which can be lost or stolen and expensive to replace.
The TSA also offers shareholders access to preferential dealing rates and up-to-date market information through the Equiniti Share Dealing service.
The TSA is a sponsored nominee service operated for Tesco by Equiniti Financial Services Limited (Equiniti Financial), which is authorised and regulated by the Financial Conduct Authority. When you join the TSA, your shares are registered in the name of Equiniti Corporate Nominees Limited and held on your behalf on a private register. You remain the beneficial owner of your shares and continue to have the right to receive shareholder communications, vote at general meetings and to receive any dividends paid on your shares.
It is completely free to participate in the TSA and there are no annual fees to pay (terms and conditions apply). If you would like to join the TSA please contact Equiniti Financial on 0371 3284 2977 (or +44 121 415 7053 if outside of the UK).
Duplicate documentsSome of our shareholders hold multiple accounts on the share register and therefore receive duplicate copies of shareholder documentation as a result. If you have been receiving duplicate copies of shareholder documentation, please contact Equiniti to arrange for your accounts to be combined.
Share dealing serviceEquiniti offer Shareview Dealing, which is a real-time telephone and internet share dealing service in Tesco PLC shares available to all UK residents.
Further information about the Shareview Dealing service can be found at www.shareview.co.uk/dealing or by calling 03456 037 037 between 8.00am and 4.30pm, Monday to Friday.
Please remember that dealing fees vary between brokers and you are recommended to check that you are being charged the most competitive rate.
Changes to personal detailsIn order to avoid missing important correspondence relating to your shareholding, please inform Equiniti as soon as possible if:
– you have recently moved house; or – there are any changes to your bank details.
These changes can be made quickly and easily online via your Shareview portfolio or you can write to Equiniti to confirm your new and old addresses. Please remember to include your Shareholder Reference Number on all communication.
Share price informationDetails of our current and historical share price data and other share price tools are available at www.tescoplc.com/investors.
ShareGiftIf you have a small shareholding which would cost more to sell than the shares are worth, you may wish to consider donating the shares to the charity ShareGift (Registered Charity 1052686), a charity that specialises in the donation of such shares for good causes. There are no implications for Capital Gains Tax purposes on gifts of shares to charity. Further information about ShareGift can be found by visiting www.sharegift.org or by calling 0207 930 3737.
American Depositary Receipts (ADRs)The Company has a sponsored Level 1 ADR programme for which Deutsche Bank Trust Company Americas acts as depositary. The ADRs are traded in the US, where one ADR represents three ordinary shares. The ADR programme confers the right to receive dividends in US dollars.ADR detailsSymbol TSCDYCUSIP 881575302Exchange OTCRatio 1:3Effective Date April 01, 1992
All enquiries relating to the ADR programme should be directed to:
Tesco PLCc/o American Stock Transfer & Trust CompanyOperations Centre6201 15th AvenueBrooklyn NY 11219 USA
Email DB@astfinancial .com Telephone Toll free +1-866-249-2593 (toll free from within US and Canada)International +1-718-921-8137 (from outside US and Canada)Website www.adr.db.com
Corporate websiteYou can access the corporate website at www.tescoplc.com. The Tesco PLC corporate website provides useful information including annual reports, results announcements and share price data, as well as background information about the Company and current issues.
Shareholders are encouraged to sign up to receive email notification of results and press announcements as they are released by registering at www.tescoplc.com/investors/regulatory-news/regulatory-news-email-alerts.
Other information
155Tesco PLC Annual Report and Financial Statements 2018
Shareholder information

Shareholder securityIn recent years, Tesco PLC has become aware that its shareholders have received unsolicited phone calls or correspondence concerning investment matters. These are typically from overseas based ‘brokers’ who target UK shareholders, offering to sell them what often turn out to be worthless or high risk shares in US or UK investments. These operations are commonly known as ‘boiler rooms’. These ‘brokers’ can be very persistent and extremely persuasive. Shareholders are advised to be very wary of any unsolicited advice, offers to buy shares at a discount or offers of free company reports. Details of any share dealing facilities that we endorse are included in our mailings and on our website.
If you receive any unsolicited investment advice:
– make sure you note the correct name of the person and the organisation and make a record of any other information they give you; – check the Financial Services Register by visiting http://register.fca.org.uk to see if the person and firm contacting you are authorised by the FCA; – search the list of unauthorised firms to avoid at www.fca.org.uk/consumers/unauthorised-firms-individuals; and – report the matter to the FCA using the share fraud reporting form at www.fca.org.uk/consumers/report-scam-unauthorised-firm or by calling the Consumer Helpline on 0800 111 6768.
Information on the latest investment scams can be found at http://scamsmart.fca.org.uk/warninglist.
Share register analysisAs at 24 February 2018 the Company had 8,192,116,619 shares in issue (25 February 2017: 8,174,932,553) and 254,249 registered holders of Ordinary shares (25 February 2017: 270,372). Shareholdings are analysed below.
15 June 2018Q1 Trading Statement and Annual General Meeting22 June 2018Proposed payment date for final dividend
23 February 2019Financial year end 2018/19
January 2019Q3 and Christmas Trading Statement
3 October 2018Interim results announcement
June 2018
October 2018
January 2019
February 2019
24 February 2018Financial year end 2017/18
February 2018
Please note that these dates are provisional and subject to change.
Breakdown of shareholdings overall
Range of shareholdingNumber of
holdings% of issued
share capital1 - 500 155,129 0.25%501 - 1,000 25,541 0.23%1,001 - 5,000 51,211 1.47%5,001+ 22,368 98.05%Total 254,249 100.00%
Breakdown of shareholdings with over 5,001 shares
Range of shareholdingNumber of
holdings% of issued
share capital5,001 - 10,000 11,966 1.02%10,001 - 50,000 8,654 1.97%50,001 - 100,000 614 0.51%100,001 - 500,000 554 1.56%500,001 - 1,000,000 159 1.36%1,000,001 - 5,000,000 261 7.38%5,000,001+ 160 84.25%Total 22,368 98.05%
Category of shareholdersNumber of
shareholders% of total
shareholders
Number of Ordinary
shares% of issued
share capitalPrivate 247,842 97.48% 437,489,608 5.34%Institutional and corporate 6,407 2.52% 7,754,627,011 94.66%
Useful contactsTesco PLC Registered OfficeTesco House Shire Park Kestrel Way Welwyn Garden City AL7 1GA
Investor RelationsInvestor Relations Department Tesco House Shire Park Kestrel Way Welwyn Garden City AL7 1GA
Telephone +44 (0) 1707 912 922
RegistrarsEquiniti Limited Aspect House Spencer Road Lancing West Sussex BN99 6DA
Telephone (UK) 0371 384 2977 (Outside UK) +44 (0) 121 415 7071 Calls are charged at national rates. Calls from a mobile device may incur network extras. Website www.equiniti.com
Group Company SecretaryRobert Welch
Corporate BrokersBarclays Bank PLC Citigroup Global Markets Limited
Independent AuditorsDeloitte LLP
General QueriesSwitchboard +44 (0) 1992 632 222
Websitewww.tescoplc.com
Financial calendar 2018/19
Tesco PLC Annual Report and Financial Statements 2018156
Shareholder information continued

Designed and produced by Superunion (formerly Addison Group) www.superunion.com
Printed by Pureprint Group Limited
Photographers:Andrew Parsons, i-Images Mike Abrahams Stewart Foley, Caters Photographic Tara Fisher
This report is printed on Elements Fire 250gsm and Explorer Premium Offset 90gsm and 120gsm, both papers are FSC® certified. Explorer Premium Offset is a brilliant white uncoated paper made from elemental chlorine free pulps.
Explorer Premium Offset benefits from the highest level of environmental certification, including FSC® chain of custody and ISO 14001, which gives you the assurances you expect, that the pulp is sourced from sustainably managed forests.

Tesco PLC Annual Report and Financial Statements 2018
Tesco PLC Tesco House Shire Park Kestrel Way Welwyn Garden City AL7 1GA
www.tescoplc.com