services to assess the reasons for non-compliance of the … final... · 2017-09-22 · 2 services...
TRANSCRIPT

Project implemented by consortium partner
Services to assess the reasons for
non-compliance of the emission
ceilings set in the National Emission
Ceilings Directive
Final Report
Client: DG Environment
Rotterdam, December 2013


Services to assess the reasons for
non-compliance of the emission
ceilings set in the National
Emission Ceilings Directive
Final Report
Services to assess the reasons for
non-compliance of the emission
ceilings set in the National
Emission Ceilings Directive
Final Report
Services to assess the reasons for
non-compliance of the emission
ceilings set in the National
Emission Ceilings Directive
Final Report
Services to assess the reasons for
non-compliance of the emission
ceilings set in the National
Emission Ceilings Directive
Final Report
Services to assess the reasons for
non-compliance of the emission
ceilings set in the National
Emission Ceilings Directive
Final Report
Services to assess the reasons for
non-compliance of the emission
ceilings set in the National
Emission Ceilings Directive
Final Report
Client: DG Environment
Authors: Douglas Clark, Julija Dubasinska, Vladislav Bizek, Valts Vilnitis
Rotterdam, December 2013
2
Services to assess the reasons for non-compliance of the emission ceilings set in the National
Emission Ceilings Directive – Final Report
About Ecorys
At Ecorys we aim to deliver real benefit to society through the work we do. We offer
research, consultancy and project management, specialising in economic, social and
spatial development. Focusing on complex market, policy and management issues we
provide our clients in the public, private and not-for-profit sectors worldwide with a unique
perspective and high-value solutions. Ecorys’ remarkable history spans more than 80
years. Our expertise covers economy and competitiveness; regions, cities and real
estate; energy and water; transport and mobility; social policy, education, health and
governance. We value our independence, integrity and partnerships. Our staff are
dedicated experts from academia and consultancy, who share best practices both within
our company and with our partners internationally.
Ecorys Netherlands has an active CSR policy and is ISO14001 certified (the international
standard for environmental management systems). Our sustainability goals translate into
our company policy and practical measures for people, planet and profit, such as using a
100% green electricity tariff, purchasing carbon offsets for all our flights, incentivising staff
to use public transport and printing on FSC or PEFC certified paper. Our actions have
reduced our carbon footprint by an estimated 80% since 2007.
ECORYS Nederland BV
Watermanweg 44
3067 GG Rotterdam
P.O. Box 4175
3006 AD Rotterdam
The Netherlands
T +31 (0)10 453 88 00
F +31 (0)10 453 07 68
Registration no. 24316726
W www.ecorys.nl
3
Services to assess the reasons for non-compliance of the emission ceilings set in the National
Emission Ceilings Directive – Final Report
About MWH
MWH is one of the world’s largest independent, employee-owned consulting
organisations offering services to governments and public administrations to help them
conceive, articulate, manage and implement complex and demanding programmes, and
complete them on time, within budget, and to the best quality standards.
With 170 offices and more than 7,000 employees around the world, we provide
sustainable development solutions worldwide. Our client base, which includes
international agencies such as the European Commission, the World Bank, the European
Investment Bank, the United Nations, and the Millennium Challenge Corporation,
governments and government agencies, as well as municipal, national and multinational
industrial sectors, continues to expand rapidly, unleashing an enormous, pent-up demand
for our traditional and innovative offerings. We are passionate in our commitment and
partnership with clients to develop innovative solutions to their most challenging
problems, and create a sustainable world for future generations.
We take pride in approaching our projects with an eye towards long-term quality of life
and environmental issues. MWH strongly believes in the importance of management
practices that are economically and environmentally sustainable. Our sustainable
development approach reflects a balanced view of a project from start to finish. Often we
find these sustainable options provide even more savings than traditional technologies or
approaches would allow.
With a rich combined history, the MWH vision remains firmly toward the future. This eye
towards the future - combined with our well-established track record - is fuelling the
growth of our rapidly transforming company.
MWH SA/NV
Avenue Reine Astrid 92
1310 La Hulpe
Belgium
T +32 (0) 2 655 22 30
F +32 (0) 2 655 22 80
www.mwhglobal.com

4
Services to assess the reasons for non-compliance of the emission ceilings set in the National
Emission Ceilings Directive – Final Report
Acknowledgements
This report was prepared for the European Commission DG Environment. We are
grateful for the valuable feedback and comments from policy officers Ulf Björnholm
Ottosson and Andre Zuber and their collegues in the Commission. The team also thanks
an anonymous reviewer from the European Environment Agency for helpful comments on
the Executive Summary.
The project team thanks the Member State officials and technical experts who
participated in this study for their cordial discussions and contributions regarding the
national perspectives, and helpful insights and comments in the development of this
report.

5
Services to assess the reasons for non-compliance of the emission ceilings set in the National Emission Ceilings
Directive – Final Report
Acknowledgements 4
List of Figures 8
List of Tables 9
Abbreviations and Acronyms 13
Executive Summary 17
1 Introduction 33
1.1 Context of the project 33
1.2 Objectives and tasks 35
1.3 Methodology 36
1.4 Structure of this report 39
2 Analysis of Common Denominators for Non-compliance 41
2.1 Summary of reasons for non-compliance 41
2.2 Common issues for NOX non-compliance 43
2.3 Country-specific issues for NOX non-compliance 49
2.4 Common issues for NH3 non-compliance 51
2.5 Country-specific issues for NH3 52
2.6 Common issues on emission inventory methodology and reporting 53
2.7 Common issues on national programmes of reduction measures 54
2.8 Common issues on emission projections 54
2.9 Differences between the independent assessment and Member State
perceptions 55
3 Estimated Time for Compliance with 2010 and 2020 Commitments 57
3.1 Estimated time for compliance with the NECD 2010 ceilings 57
3.2 Estimated time for compliance with the 2020 reduction commitments in the
amended Gothenburg Protocol 60
4 General Observations and Recommendations 63
4.1 Removing disincentives to improved inventory methodology 63
4.2 Enhancing the transparency and comparability of emission inventories 64
4.3 Improved national programmes and projections 66
4.4 Improved policy coherence 67
4.5 Unified access to emission information 68
5 Austria 69
5.1 Introduction 69
5.2 Independent assessment 71
5.3 Main reasons for non-compliance as identified by Austria 75

6
Services to assess the reasons for non-compliance of the emission ceilings set in the National Emission Ceilings
Directive- Final Report
5.4 Expected time of compliance with the 2010 Ceilings 76
5.5 Impact on future reduction commitments 77
6 Belgium 79
6.1 Introduction 79
6.2 Independent assessment 80
6.3 Reasons for non-compliance as identified by Belgium 85
6.4 Expected time of compliance with the 2010 Ceilings 85
6.5 Impact on future reduction commitments 86
6.6 Observations and recommendations for Belgium 87
7 France 89
7.1 Introduction 89
7.2 Independent assessment 90
7.3 Reasons for non-compliance as identified by France 93
7.4 Expected time of compliance with the 2010 Ceilings 96
7.5 Impact on future reduction commitments 96
8 Germany 97
8.1 Introduction 97
8.2 Independent assessment 98
8.3 Reasons for non-compliance as identified by Germany 101
8.4 Expected time of compliance with the 2010 Ceilings 102
8.5 Impact on Future Reduction Commitments 102
8.6 Observations and recommendations for Germany 103
9 Ireland 105
9.1 Introduction 105
9.2 Independent assessment 106
9.3 Reasons for non-compliance as identified by Ireland 109
9.4 Expected time of compliance with the 2010 Ceilings 110
9.5 Impact on future reduction commitments 111
10 Luxembourg 113
10.1 Introduction 113
10.2 Independent assessment 115
10.3 Reasons for non-compliance as identified by Luxembourg 117
10.4 Expected time of compliance with the 2010 Ceilings 118
10.5 Impact on Future Reduction Commitments 119
10.6 Observations and recommendations for Luxembourg 120
11 Croatia 121
11.1 Introduction 121

7
Services to assess the reasons for non-compliance of the emission ceilings set in the National Emission Ceilings
Directive – Final Report
11.2 Independent assessment 122
11.3 Reasons for non-compliance as identified by Croatia 124
11.4 Expected time of compliance with the 2010 Ceilings 125
11.5 Impact on Future Reduction Commitments 126
12 Finland 127
12.1 Introduction 127
12.2 Independent assessment 128
12.3 Reasons for non-compliance as identified by Finland 131
12.4 Expected time of compliance with the 2010 Ceilings 132
12.5 Impact on future reduction commitments 133
13 References 135
8
Services to assess the reasons for non-compliance of the emission ceilings set in the National Emission Ceilings
Directive- Final Report
List of Figures
Figure 5-1 Major NOX contributing sectors (left scale, kt) and national total NOX
emissions in Austria (right scale, kt), based on fuel used, CLRTAP 2012 72
Figure 5-2 Number of diesel and petrol passenger cars registered annually in Austria
(left scale) and the total number of vehicles (right scale) (EUROSTAT data) 73
Figure 6-1 NOX contributing sectors in Belgium, fuel used, 2012 NECD submission (kt) 82
Figure 6-2 Final energy consumption in Belgium by sector and fuel type, 1000s TOE
(Eurostat) 83
Figure 6-3 Number of registered passenger cars in Belgium by engine type (Eurostat) 83
Figure 7-1 NOx emission trends in the national total and major contributing sources in
France (CEIP database, submitted before 2013) 91
Figure 7-2 Final energy consumption by sector and fuel type in France (Eurostat) 92

9
Services to assess the reasons for non-compliance of the emission ceilings set in the National Emission Ceilings
Directive – Final Report
List of Tables
Table 1-1 National NOX emissions in 2010 in comparison to NECD 2010 ceilings, for
non-compliant Member States. Blank entries indicate the values that are not
reported. Sources: EEA CDR online – NECD.SUBM12. 33
Table 1-2 National 2010 NH3 emissions in comparison to NECD 2010 ceilings, for non-
compliant Member States. 34
Table 1-3 National 2010 NMVOC emissions in comparison to NECD 2010 ceilings, for
non-compliant Member States. 34
Table 1-4 Gothenburg 2012 amendment NOX emission reduction commitments for
2020 and beyond. Blanks indicate values not reported. Sources:
NECD.SUBM12 35
Table 1-5 Gothenburg 2012 amendment NH3 emission reduction commitments for
2020 and beyond, with comparison to 2010 ceiling, for Member States non-
compliant in 2010 by 10% or more. Source: NEC.SUBM12, CLRTAP.SUBM13 35
Table 1-6 Differences in methodology – nitrogen oxides. 37
Table 1-7 Availability of national projections – ammonia. 37
Table 2-1 Summary matrix of reasons for non-compliance with NOx ceilings for Austria
(AT), Belgium (BE), France (FR), Germany (DE), Ireland (IE) and Luxembourg
(LU). 41
Table 2-2 Summary matrix of reasons for non-compliance with NH3 ceilings in 2010, for
Croatia (HR) and Finland (FI). 43
Table 2-3 Change in 2010 NOx emissions (fuel sold) from 1999 RAINS projections to
actual 2010 road transport activity and revised exhaust emission factors
(COPERT 4 ver 8.0), in comparison to distance from ceiling in 2010. Adapted
from Ntziachristos and Papageorgiou, 2011. 45
Table 2-4 Comparison of 1990 to 2010 changes in road transport fuel consumption
(fuel sold) and diesel share as assumed in 1999 when NECD ceilings were
agreed, versus actual changes in 2010, for the EU-15 Member States. Source:
IIASA, 1999; and Eurostat, 2013. 46
Table 2-5 Comparison of fuel sold and fuel used NOX emissions*. 48
Table 3-1 Estimated time for compliance with NECD 2010 ceilings based on the GAINS
model CLE scenario and available national with-measures projections (Nat.)
for 2015 to 2030. The GAINS model projections are compared to reported
emissions (Rep.) for 2005 and 2010. Emissions given in kt/year. 58
Table 3-2 Estimated annual compliance costs – 2025, based on GAINS model current
legislation (CLE) and maximum technically feasible reduction (MTFR)
scenarios 60
Table 3-3 Estimated time for compliance with the 2020 reduction commitments in the
2012 Gothenburg Protocol amendments, based on the GAINS model current
legislation scenario and national with-measures projections (Nat.) for 2015 to
2030. Emissions given in kt/year. 61
Table 5-1 Overview of Austria's final 2010 and provisional 2011 NOx emission data
submitted under NECD and CLRTAP. 69

10
Services to assess the reasons for non-compliance of the emission ceilings set in the National Emission Ceilings
Directive- Final Report
Table 5-2 Main reasons for Austria's non-compliance with the NECD 2010 NOx ceiling,
based on the independent assessment. Quantified contribution to
exceedance is given in kt and percent where possible. 74
Table 5-3 Reasons for Austria's non-compliance with the NECD 2010 NOX ceiling as
identified by Austria. Quantified contributions to NOX emission exceedance
are given in kt and percent, where provided by Austria. 75
Table 5-4 Summary of projection analysis on the year for Austria to attain the NECD
2010 NOX ceiling (103 kt, fuel used). Emissions in kt/year – fuel sold (fuel
used based emissions in brackets) 77
Table 5-5 Estimated compliance period – Gothenburg protocol (GP) – Austria.
Emissions in kt/year – fuel sold. 77
Table 6-1 Overview of Belgium's final 2010 and provisional 2011 NOx emission data
submitted under NECD and CLRTAP. 79
Table 6-2 Reasons for Belgium's non-compliance with the NECD 2010 NOx ceiling,
based on the independent assessment. Contribution to exceedance is given
in kt and percent where possible. 84
Table 6-3 Reasons for Belgium's non-compliance with the NECD 2010 NOx ceiling as
identified by Belgium. Contribution to NOx emission exceedance is given in kt
and percent where provided by Belgium. 85
Table 6-4 Summary of projection analysis for Belgium on the year to attain the 2010
ceiling (176 kt). Emissions in kt/year 85
Table 6-5 Estimated time for compliance – Gothenburg protocol (GP) – Belgium.
Emissions in kt/year. 86
Table 7-1 Overview of France's final 2010 and provisional 2011 NOx emission data
submitted under NECD and CLRTAP. 89
Table 7-2 Reasons for France's non-compliance with the NECD 2010 NOx ceiling, based
on the independent assessment. Contribution to exceedance is given in kt
and percent where possible. 93
Table 7-3 Total and road traffic NOx emission for France in 1990 and 2010. Source:
December 2012 submission. 94
Table 7-4 Comparison of French NOx emissions in 2010 for current methodology
compared to the methodology in place at the time the NEC Directive was
established, based on the French submission in December 2012. 95
Table 7-5 Reasons for France's non-compliance with the NECD 2010 NOx ceiling as
identified by France. Contribution to NOx emission exceedance is given in kt
and percent where provided by France. 95
Table 7-6 Summary of projection analysis for France on the year to attain the 2010
ceiling (810 kt). 96
Table 7-7 Estimated compliance period – Gothenburg protocol (GP) – France. Emissions
in kt/year. 96
Table 8-1 Overview of Germany's final 2010 and provisional 2011 NOx emission data
submitted under NECD and CLRTAP. 97
Table 8-2 Reasons for Germany's non-compliance with the NECD 2010 NOx ceiling,
based on the independent assessment. Contribution to exceedance is given
in kt and percent where possible. 100
Table 8-3 Reasons for Germany's non-compliance with the NECD 2010 NOx ceiling as
identified by Germany. Contribution to NOx emission exceedance is given in
kt and percent where provided by Germany. 101

11
Services to assess the reasons for non-compliance of the emission ceilings set in the National Emission Ceilings
Directive – Final Report
Table 8-4 Summary of projection analysis for Germany on the year to attain the 2010
ceiling (1051 kt). Emissions in kt/year – fuel sold 102
Table 8-5 Estimated time for compliance – Gothenburg protocol (GP) – Germany.
Emissions in kt/year – fuel sold. 103
Table 9-1 Overview of Ireland's final 2010 and provisional 2011 NOx emission data
submitted under NECD and CLRTAP. 105
Table 9-2 Reasons for Ireland's non-compliance with the NECD 2010 NOx ceiling, based
on the independent assessment. Contribution to exceedance is given in kt
and percent where possible. 109
Table 9-3 Reasons for Ireland's non-compliance with the NECD 2010 NOx ceiling as
identified by Ireland. Contribution to NOx emission exceedance is given in kt
and percent where provided by Ireland. 110
Table 9-4 Summary of projection analysis for Ireland on the year to attain the 2010
ceiling (65 kt). Emissions in kt/year 110
Table 9-5 Estimated time for compliance – Gothenburg protocol (GP) – Ireland.
Emissions in kt/year. 111
Table 10-1 Overview of Luxembourg's final 2010 and provisional 2011 NOx emission
data submitted under NECD and CLRTAP. 113
Table 10-2 Reasons for Luxembourg's non-compliance with the NECD 2010 NOx ceiling,
based on the independent assessment. Contribution to exceedance is given
in kt and percent where possible. 117
Table 10-3 Reasons for Luxembourg's non-compliance with the NECD 2010 NOx ceiling
as identified by Luxembourg. Contribution to NOx emission exceedance is
given in kt and percent where provided by Luxembourg. 118
Table 10-4 Summary of projection analysis for Luxembourg on the year to attain the
2010 ceiling (11 kt). Emissions in kt/year – fuel sold (fuel used based
emissions in brackets) 119
Table 10-5 Estimated compliance period – Gothenburg protocol (GP) – Luxembourg.
Emissions in kt/year – fuel sold (fuel used based emissions in brackets) 120
Table 11-1 Overview of Croatia's final 2010 and provisional 2011 NOx emission data
submitted under NECD and CLRTAP. 121
Table 11-2 Reasons for Croatia's non-compliance with the NECD 2010 NOx ceiling, based
on the independent assessment. Contribution to exceedance is given in kt
and percent of exceedance where possible. 124
Table 11-3 Reasons for Croatia's non-compliance with the NECD 2010 NH3 ceiling as
identified by Croatia. Contribution to NH3 emission exceedance is given in kt
and percent where provided by Croatia. 125
Table 11-4 Summary of projection analysis for Croatia on the year to attain the NECD
2010 ceiling (30 kt). Emissions in kt/year. 125
Table 11-5 Estimated compliance costs – 2025 - Croatia 126
Table 11-6 Estimated compliance period – Gothenburg protocol (GP) – Croatia.
Emissions in kt/year. 126
Table 12-1 Overview of Finland's final 2010 and provisional 2011 NH3 emission data
submitted under NECD and CLRTAP. 127
Table 12-2 Reasons for Finland's non-compliance with the NECD 2010 NOx ceiling, based
on the independent assessment. Contribution to exceedance is given in kt
and percent where possible. 131
12
Services to assess the reasons for non-compliance of the emission ceilings set in the National Emission Ceilings
Directive- Final Report
Table 12-3 Reasons for Finland's non-compliance with the NECD 2010 NH3 ceiling as
identified by Finland. Contribution to NH3 emission exceedance is given in kt
and percent where provided by Finland. 132
Table 12-4 Summary of projection analysis for Finland on the year to attain the 2010
ceiling (31 kt). Emissions in kt/year. 132
Table 12-5 Estimated annual compliance costs – 2025 - Finland 133
Table 12-6 Estimated compliance period – Gothenburg protocol (GP) – Finland.
Emissions in kt/year. 133
13
Services to assess the reasons for non-compliance of the emission ceilings set in the National Emission Ceilings
Directive – Final Report
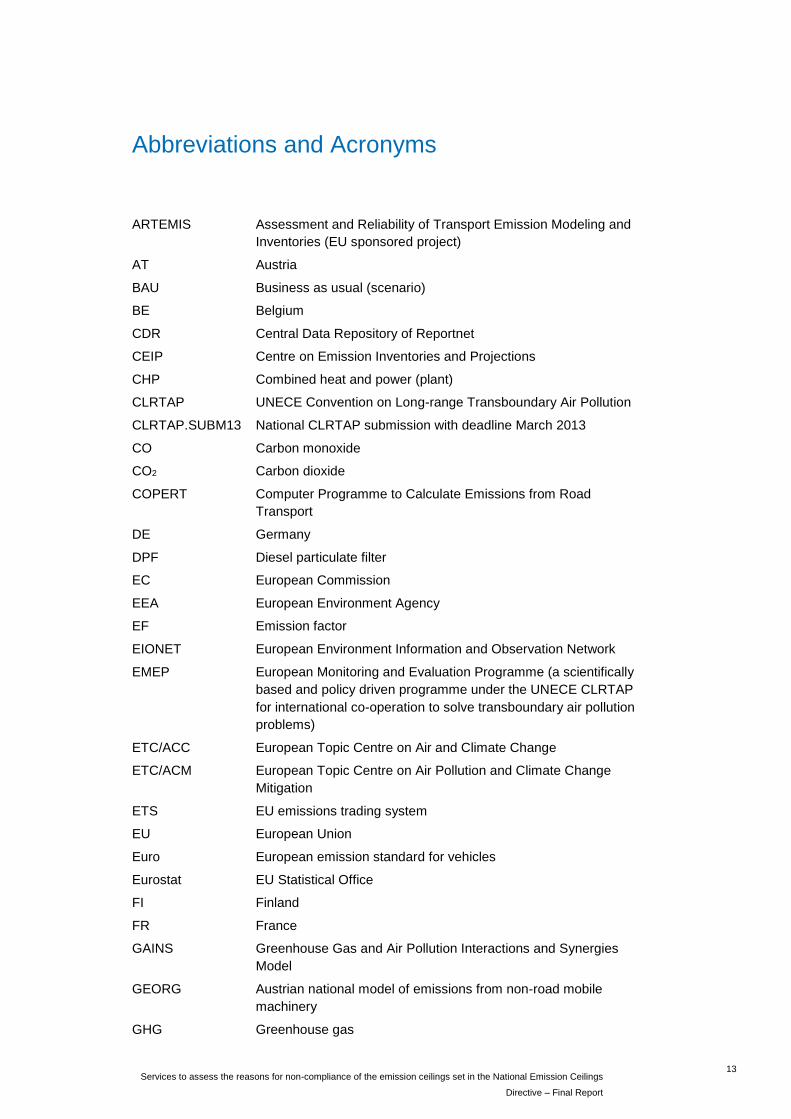
Abbreviations and Acronyms
ARTEMIS Assessment and Reliability of Transport Emission Modeling and
Inventories (EU sponsored project)
AT Austria
BAU Business as usual (scenario)
BE Belgium
CDR Central Data Repository of Reportnet
CEIP Centre on Emission Inventories and Projections
CHP Combined heat and power (plant)
CLRTAP UNECE Convention on Long-range Transboundary Air Pollution
CLRTAP.SUBM13 National CLRTAP submission with deadline March 2013
CO Carbon monoxide
CO2 Carbon dioxide
COPERT Computer Programme to Calculate Emissions from Road
Transport
DE Germany
DPF Diesel particulate filter
EC European Commission
EEA European Environment Agency
EF Emission factor
EIONET European Environment Information and Observation Network
EMEP European Monitoring and Evaluation Programme (a scientifically
based and policy driven programme under the UNECE CLRTAP
for international co-operation to solve transboundary air pollution
problems)
ETC/ACC European Topic Centre on Air and Climate Change
ETC/ACM European Topic Centre on Air Pollution and Climate Change
Mitigation
ETS EU emissions trading system
EU European Union
Euro European emission standard for vehicles
Eurostat EU Statistical Office
FI Finland
FR France
GAINS Greenhouse Gas and Air Pollution Interactions and Synergies
Model
GEORG Austrian national model of emissions from non-road mobile
machinery
GHG Greenhouse gas

14
Services to assess the reasons for non-compliance of the emission ceilings set in the National Emission Ceilings
Directive- Final Report
GLOBEMI Austrian national model of emissions from road transport
GP Gothenburg Protocol (UNECE CLRTAP Protocol to Abate
Acidification, Eutrophication and Ground-level Ozone)
HBEFA Handbook of Emission Factors
HDV Heavy duty vehicle
HR Croatia
IA independent assessment
IE Ireland
IIASA International Institute for Applied System Analysis
IIR Informative Inventory Report
IRCELIN Belgian Interregional Environmental Agency
kt Kiloton (1000 t)
LCP Large combustion plant
LDV Light duty vehicle
LEZ Low emission zone
LU Luxembourg
MMR Monitoring Mechanism Regulation (525/2013)
MS Member State
NEC National emission ceiling
NEC2010 National emission ceiling for 2010
NECD National emission ceiling directive - Directive 2001/81/EC of the
European Parliament and of the Council of 23 October 2001 on
national emission ceilings for certain atmospheric pollutants
NECD.SUBM12 National NECD submission with deadline 31 December 2012
NFR Nomenclature for Reporting
NH3 Ammonia
NMVOC Non-methane volatile organic compounds
NO2 Nitrogen dioxide
NOX Nitrogen oxides
NPK Combined mineral fertilizers (nitrogen, potassium, phosphorus)
PC Passenger car
PM2.5 Particulate matter which passes through a size-selective inlet with
a 50% efficiency cut-off at an aerodynamic diameter of 2.5 μm
RAINS Regional Air Pollution Information and Simulation model
Reportnet EIONET’s infrastructure for supporting and improving data and
information flows
SO2 Sulphur dioxide
Toe Ton of oil equivalent
TREMOD German national model for the calculation of emissions from road
transport where emission factors are taken from the “Handbook of
Emission Factors” (HBEFA)
15
Services to assess the reasons for non-compliance of the emission ceilings set in the National Emission Ceilings
Directive – Final Report
TSAP Thematic Strategy on Air Pollution
UK United Kingdom
UNECE United Nations Economic Commission for Europe
UNFCCC United Nations Framework Convention on Climate Change
WAM With additional measures (scenario)
WM With measures (scenario)
μm Micrometer

17
Services to assess the reasons for non-compliance of the emission ceilings set in the National Emission Ceilings
Directive – Final Report
Executive Summary
The European Commission (EC) is making a comprehensive review of EU air pollution
policy in 2013, including Directive 2001/81/EC on national emission ceilings (NECD). As
a part of this review, this report presents an in-depth assessment of the main reasons for
non-compliance with the 2010 national emission ceilings. This study covers eight Member
States whose reported emissions significantly exceeded (by 10% or more) the existing
2010 emission ceilings as set out in the NECD1: Austria, Belgium, France, Germany,
Ireland and Luxemburg for nitrogen oxides (NOX) and Croatia and Finland for ammonia
(NH3). This report also looks at the prospects for these Member States to meet the 2010
ceilings and the 2012 Gothenburg Protocol reduction commitments for 2020. The study
highlights lessons learned through these non-compliance cases and presents
recommendations to facilitate compliance with current and future emission reduction
commitments.
Two complementary approaches have been used to identify and compare the reasons for
non-compliance: 1) an independent assessment made by the authors of this report based
on submitted data and reports, and 2) Member States' own assessments based on official
reports and telephone interviews with Member State officials and experts.
The study identifies common denominators among the reasons for non-compliance and
identifies possible differences between the independent and Member State assessments.
Estimated compliance dates for these eight Member States to achieve the NECD 2010
emission ceilings and the Gothenburg Protocol commitments for 2020 have been
assessed based on available national emission projections and projections made from
the IIASA Greenhouse Gas and Air Pollution Interactions and Synergies (GAINS2) model.
Overview of emissions and non-compliance in 2010 and 2011
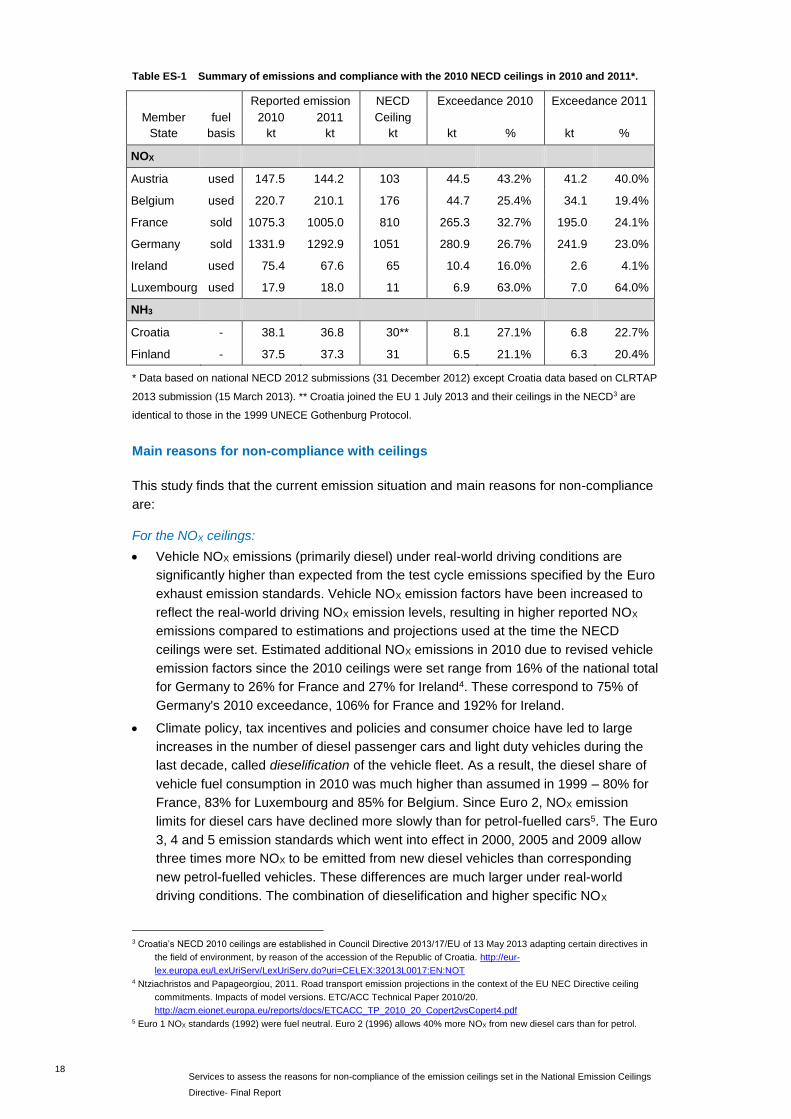
Table ES-1 shows the current status of emissions and non-compliance with the
respective NECD national ceilings in 2010 and 2011, for the eight Member States
studied. Exceedances are given in kilotons and percent of the ceiling. Reported data for
2011 are preliminary.
1 This selection of Member States was based on preliminary reporting for 2010 emissions made in December 2011. In
December 2012, Spain reported final 2010 NH3 emission and preliminary 2011 NOX emission that were 10% above the
respective ceilings, but the timing of this new information was too late for Spain to be included in this study, despite
fulfilling the 10% exceedance criteria. 2 The GAINS model is part of the standard modelling framework for cost-effective emission control strategies for transboundary
air pollutants and greenhouse gases. http://www.iiasa.ac.at/web/home/research/researchPrograms/GAINS.en.html
18
Services to assess the reasons for non-compliance of the emission ceilings set in the National Emission Ceilings
Directive- Final Report
Table ES-1 Summary of emissions and compliance with the 2010 NECD ceilings in 2010 and 2011*.
Reported emission NECD Exceedance 2010 Exceedance 2011
Member
State
fuel
basis
2010
kt
2011
kt
Ceiling
kt
kt
%
kt
%
NOX
Austria used 147.5 144.2 103 44.5 43.2% 41.2 40.0%
Belgium used 220.7 210.1 176 44.7 25.4% 34.1 19.4%
France sold 1075.3 1005.0 810 265.3 32.7% 195.0 24.1%
Germany sold 1331.9 1292.9 1051 280.9 26.7% 241.9 23.0%
Ireland used 75.4 67.6 65 10.4 16.0% 2.6 4.1%
Luxembourg used 17.9 18.0 11 6.9 63.0% 7.0 64.0%
NH3
Croatia - 38.1 36.8 30** 8.1 27.1% 6.8 22.7%
Finland - 37.5 37.3 31 6.5 21.1% 6.3 20.4%
* Data based on national NECD 2012 submissions (31 December 2012) except Croatia data based on CLRTAP
2013 submission (15 March 2013). ** Croatia joined the EU 1 July 2013 and their ceilings in the NECD3 are
identical to those in the 1999 UNECE Gothenburg Protocol.
Main reasons for non-compliance with ceilings
This study finds that the current emission situation and main reasons for non-compliance
are:
For the NOX ceilings:
Vehicle NOX emissions (primarily diesel) under real-world driving conditions are
significantly higher than expected from the test cycle emissions specified by the Euro
exhaust emission standards. Vehicle NOX emission factors have been increased to
reflect the real-world driving NOX emission levels, resulting in higher reported NOX
emissions compared to estimations and projections used at the time the NECD
ceilings were set. Estimated additional NOX emissions in 2010 due to revised vehicle
emission factors since the 2010 ceilings were set range from 16% of the national total
for Germany to 26% for France and 27% for Ireland4. These correspond to 75% of
Germany's 2010 exceedance, 106% for France and 192% for Ireland.
Climate policy, tax incentives and policies and consumer choice have led to large
increases in the number of diesel passenger cars and light duty vehicles during the
last decade, called dieselification of the vehicle fleet. As a result, the diesel share of
vehicle fuel consumption in 2010 was much higher than assumed in 1999 – 80% for
France, 83% for Luxembourg and 85% for Belgium. Since Euro 2, NOX emission
limits for diesel cars have declined more slowly than for petrol-fuelled cars5. The Euro
3, 4 and 5 emission standards which went into effect in 2000, 2005 and 2009 allow
three times more NOX to be emitted from new diesel vehicles than corresponding
new petrol-fuelled vehicles. These differences are much larger under real-world
driving conditions. The combination of dieselification and higher specific NOX
3 Croatia’s NECD 2010 ceilings are established in Council Directive 2013/17/EU of 13 May 2013 adapting certain directives in
the field of environment, by reason of the accession of the Republic of Croatia. http://eur-
lex.europa.eu/LexUriServ/LexUriServ.do?uri=CELEX:32013L0017:EN:NOT 4 Ntziachristos and Papageorgiou, 2011. Road transport emission projections in the context of the EU NEC Directive ceiling
commitments. Impacts of model versions. ETC/ACC Technical Paper 2010/20.
http://acm.eionet.europa.eu/reports/docs/ETCACC_TP_2010_20_Copert2vsCopert4.pdf 5 Euro 1 NOX standards (1992) were fuel neutral. Euro 2 (1996) allows 40% more NOX from new diesel cars than for petrol.
19
Services to assess the reasons for non-compliance of the emission ceilings set in the National Emission Ceilings
Directive – Final Report
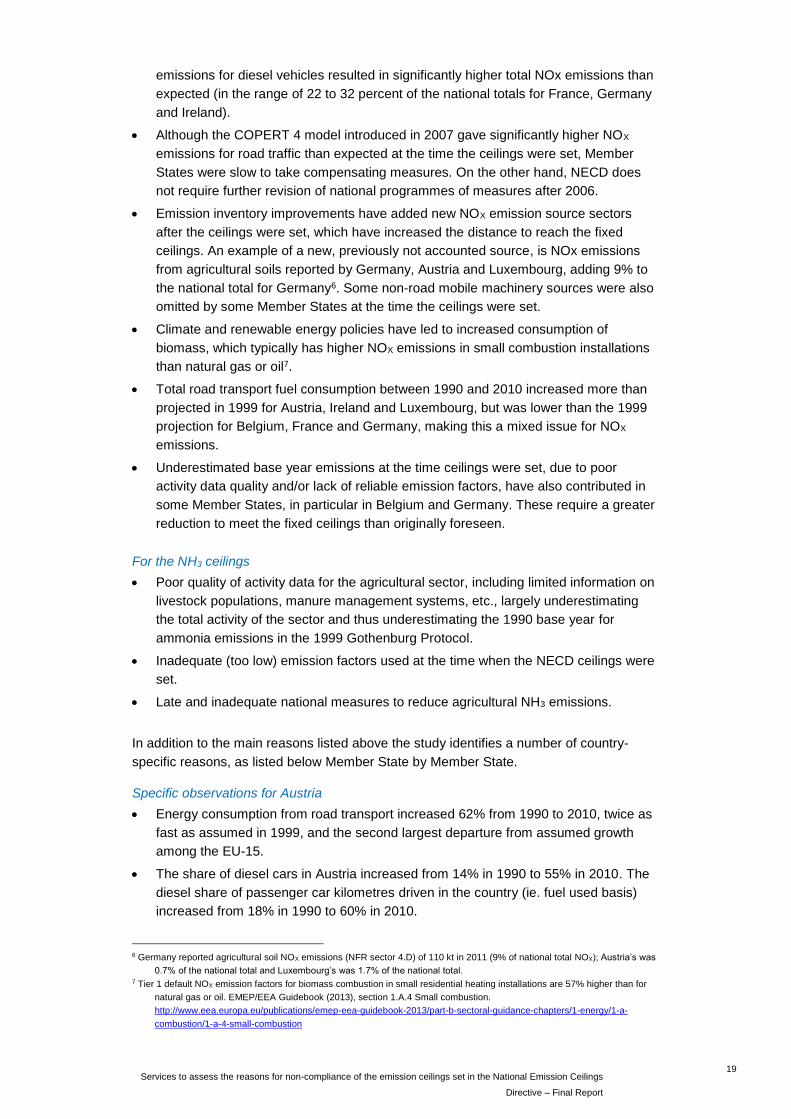
emissions for diesel vehicles resulted in significantly higher total NOx emissions than
expected (in the range of 22 to 32 percent of the national totals for France, Germany
and Ireland).
Although the COPERT 4 model introduced in 2007 gave significantly higher NOX
emissions for road traffic than expected at the time the ceilings were set, Member
States were slow to take compensating measures. On the other hand, NECD does
not require further revision of national programmes of measures after 2006.
Emission inventory improvements have added new NOX emission source sectors
after the ceilings were set, which have increased the distance to reach the fixed
ceilings. An example of a new, previously not accounted source, is NOx emissions
from agricultural soils reported by Germany, Austria and Luxembourg, adding 9% to
the national total for Germany6. Some non-road mobile machinery sources were also
omitted by some Member States at the time the ceilings were set.
Climate and renewable energy policies have led to increased consumption of
biomass, which typically has higher NOX emissions in small combustion installations
than natural gas or oil7.
Total road transport fuel consumption between 1990 and 2010 increased more than
projected in 1999 for Austria, Ireland and Luxembourg, but was lower than the 1999
projection for Belgium, France and Germany, making this a mixed issue for NOX
emissions.
Underestimated base year emissions at the time ceilings were set, due to poor
activity data quality and/or lack of reliable emission factors, have also contributed in
some Member States, in particular in Belgium and Germany. These require a greater
reduction to meet the fixed ceilings than originally foreseen.
For the NH3 ceilings
Poor quality of activity data for the agricultural sector, including limited information on
livestock populations, manure management systems, etc., largely underestimating
the total activity of the sector and thus underestimating the 1990 base year for
ammonia emissions in the 1999 Gothenburg Protocol.
Inadequate (too low) emission factors used at the time when the NECD ceilings were
set.
Late and inadequate national measures to reduce agricultural NH3 emissions.
In addition to the main reasons listed above the study identifies a number of country-
specific reasons, as listed below Member State by Member State.
Specific observations for Austria
Energy consumption from road transport increased 62% from 1990 to 2010, twice as
fast as assumed in 1999, and the second largest departure from assumed growth
among the EU-15.
The share of diesel cars in Austria increased from 14% in 1990 to 55% in 2010. The
diesel share of passenger car kilometres driven in the country (ie. fuel used basis)
increased from 18% in 1990 to 60% in 2010.
6 Germany reported agricultural soil NOX emissions (NFR sector 4.D) of 110 kt in 2011 (9% of national total NOX); Austria’s was
0.7% of the national total and Luxembourg’s was 1.7% of the national total. 7 Tier 1 default NOX emission factors for biomass combustion in small residential heating installations are 57% higher than for
natural gas or oil. EMEP/EEA Guidebook (2013), section 1.A.4 Small combustion.
http://www.eea.europa.eu/publications/emep-eea-guidebook-2013/part-b-sectoral-guidance-chapters/1-energy/1-a-
combustion/1-a-4-small-combustion

20
Services to assess the reasons for non-compliance of the emission ceilings set in the National Emission Ceilings
Directive- Final Report
No additional measures beyond measures in existing legislation were proposed in the
National Programmes of 2002 and 2006 despite updated national emission
projections indicating that without additional measures, NOX ceilings would be widely
exceeded.
Specific observations for Belgium
Improved inventory methodology has increased the reported NOX emissions for
19908 by 18% compared to the level reported at the time the ceilings were set,
making the reduction required to meet the fixed ceiling for 2010 larger than was
originally foreseen.
The Walloon and Brussels regions continued using the COPERT III (2002) road
transport emission model until updating to COPERT 4 in 20119. This delayed
introduction of "real world" vehicle emission factors, and underestimated NOX
emissions when developing the National Programme.
Climate policy in the Flemish region promoted the development of decentralized
electricity generation using small cogeneration plants (Combined Heat and Power,
CHP) with a capacity of less than 50 MW that have high specific NOX emissions.
Specific observations for France
France calculates an increase of 152 kt in 2010 NOX emissions due to the 2007
methodology change from COPERT III to COPERT 4 for road transport emissions
(57% of 2010 exceedance). An ETC/ACC study10 estimates an overall increase of
282 kt NOX in 2010 due to revised exhaust emission factors from COPERT II in use
at the time the ceilings were set as compared to COPERT 4 v8.0 (106% of 2010
exceedance)11.
The diesel share of road transport increased more than was assumed in 1999, but
was offset by total road transport fuel consumption increasing less than expected.
Inventory improvements added emissions from non-road mobile machinery in
industry and agriculture not reported at the time the ceilings were set, and lead to a
reported increase of the 2010 NOX emissions by 39 kt (15% of the 2010
exceedance).
Specific observations for Germany
An increase of 210 kt NOX in 2010 road transport emissions due to revision of
emission factors from COPERT II to COPERT 4 v8.010 (75% of 2010 exceedance)11.
Fuel consumption by heavy duty diesel vehicles increased much more than assumed
in the 1999 RAINS model projections. In spite of an overall 8% decline in road
transport fuel consumption from 1990 to 2010, the increase of heavy duty vehicle
activity and change in fleet composition compared to the 1999 assumptions accounts
for 113 kt of additional NOX in 201010 (40% of the 2010 exceedance).
Increased biomass combustion in energy and manufacturing industries and small
combustion resulted in an additional 106 kt NOX emission in 2010 (38% of the 2010
exceedance).
8 In the 1999 Gothenburg Protocol, the year 1990 is used as the reference year (or "base year") for defining interim
environmental objectives relative to the situation in that year (Article 5), but NECD does not use a base year. 9 Belgium, Informative Inventory Reports under CLRTAP, 2009, 2010, 2011. 10 Ntziachristos and Papageorgiou, 2011. Table 8, difference between "COPERT 4+New Activity" (v8.0) and "COPERT II+New
Activity" columns. 11 Note: the estimated additional emissions in 2010 can sum to more than 100% relative to the 2010 exceedance, indicating that
the 2010 NOX emissions could have been below the ceiling if all these issues had not arisen.
21
Services to assess the reasons for non-compliance of the emission ceilings set in the National Emission Ceilings
Directive – Final Report
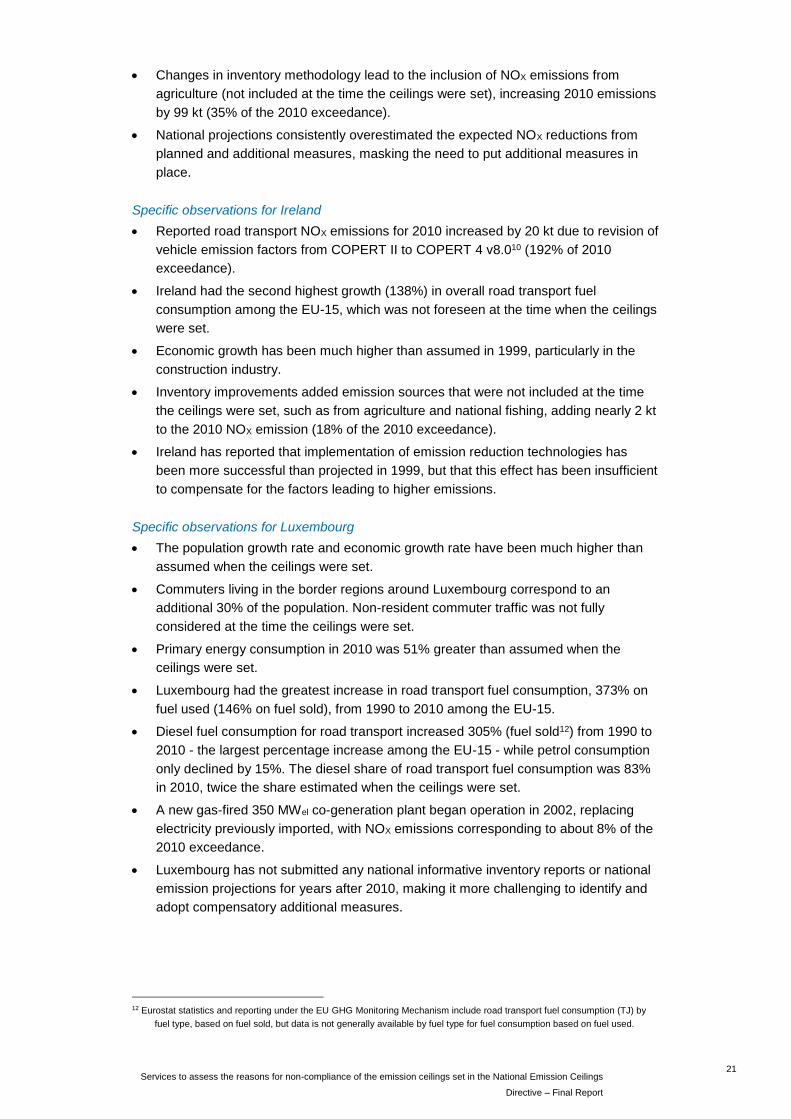
Changes in inventory methodology lead to the inclusion of NOX emissions from
agriculture (not included at the time the ceilings were set), increasing 2010 emissions
by 99 kt (35% of the 2010 exceedance).
National projections consistently overestimated the expected NOX reductions from
planned and additional measures, masking the need to put additional measures in
place.
Specific observations for Ireland
Reported road transport NOX emissions for 2010 increased by 20 kt due to revision of
vehicle emission factors from COPERT II to COPERT 4 v8.010 (192% of 2010
exceedance).
Ireland had the second highest growth (138%) in overall road transport fuel
consumption among the EU-15, which was not foreseen at the time when the ceilings
were set.
Economic growth has been much higher than assumed in 1999, particularly in the
construction industry.
Inventory improvements added emission sources that were not included at the time
the ceilings were set, such as from agriculture and national fishing, adding nearly 2 kt
to the 2010 NOX emission (18% of the 2010 exceedance).
Ireland has reported that implementation of emission reduction technologies has
been more successful than projected in 1999, but that this effect has been insufficient
to compensate for the factors leading to higher emissions.
Specific observations for Luxembourg
The population growth rate and economic growth rate have been much higher than
assumed when the ceilings were set.
Commuters living in the border regions around Luxembourg correspond to an
additional 30% of the population. Non-resident commuter traffic was not fully
considered at the time the ceilings were set.
Primary energy consumption in 2010 was 51% greater than assumed when the
ceilings were set.
Luxembourg had the greatest increase in road transport fuel consumption, 373% on
fuel used (146% on fuel sold), from 1990 to 2010 among the EU-15.
Diesel fuel consumption for road transport increased 305% (fuel sold12) from 1990 to
2010 - the largest percentage increase among the EU-15 - while petrol consumption
only declined by 15%. The diesel share of road transport fuel consumption was 83%
in 2010, twice the share estimated when the ceilings were set.
A new gas-fired 350 MWel co-generation plant began operation in 2002, replacing
electricity previously imported, with NOX emissions corresponding to about 8% of the
2010 exceedance.
Luxembourg has not submitted any national informative inventory reports or national
emission projections for years after 2010, making it more challenging to identify and
adopt compensatory additional measures.
12 Eurostat statistics and reporting under the EU GHG Monitoring Mechanism include road transport fuel consumption (TJ) by
fuel type, based on fuel sold, but data is not generally available by fuel type for fuel consumption based on fuel used.

22
Services to assess the reasons for non-compliance of the emission ceilings set in the National Emission Ceilings
Directive- Final Report
Specific observations for Croatia
National NH3 emission factors in use at the time the GP ceilings were set
underestimated NH3 emissions significantly. The fixed 30 kt ceiling requires a 7 kt
(19%) emission reduction from the reported 1990 emission at the time the ceilings
were set, but the improved methodology applied meant that the reduction effort
suddenly tripled to a much more challenging reduction of 21 kt. Although Croatia has
reduced annual NH3 emissions by 13 kt, which is nearly twice the reduction foreseen
when the ceiling was set, it is still 7 kt above the ceiling.
National legislation implementing emission ceilings and a National Programme of
emission reductions were adopted as late as 2008. However, the national legislation
established a national NH3 ceiling of 45 kt rather than the GP 30 kt ceiling, and
proposed reduction measures were insufficient to meet the 30 kt ceiling13 set out in
the GP and the NECD.
Specific observations for Finland
Improved inventory methodology for the agricultural sector (emission factors, activity
data) and addition of transport, energy, solvent use and waste management source
sectors, increased the reported 2010 NH3 emissions by 6 kt (89% of the 2010
exceedance) compared to the methodology at the time the ceiling was set.
No targeted national measures were adopted and planned for reduction of ammonia
emissions. The National Programmes only referred to other EU policies, such as the
Nitrate Directive14, and overestimated the effectiveness of those policies.
Finland continued through 2008 to report national current legislation projections for
2010 equal to the RAINS model projections made at the time the ceilings were set,
showing compliance with the ceiling value in 2010. Improved inventory methodology
was introduced in 2009, but recalculations showing the full impact of the changes
were not completed until 2011 when it was acknowledged that the ceiling would be
exceeded in 2010 and beyond. Updated projections showing non-compliance were
reported in 2012. These signals came very late that the measures in existing
legislation were inadequate and this could have contributed to delays in adopting
compensating measures.
Estimated time for compliance with NECD 2010 ceilings
National and GAINS projections have been analysed to estimate when the eight Member
States are likely to reach their NECD 2010 ceilings. The analysis is based on the most
recent national with-measures (WM) projections submitted under NECD or CLRTAP15,
and on the GAINS model current legislation scenario TSAP_Mar13_CLE16. A summary of
the analysis is shown in Table ES-2. The projections assume implementation of existing
EU and national legislation, including the Euro 6/VI vehicle emission standards, leading to
13 In August 2013, Croatia adopted a new regulation (OG 108/13) establishing the GP/NECD 30 kt NH3 ceiling and repealing the
national 45 NH3 kt ceiling. The National Programme is to be revised as necessary. 14 Council Directive 91/676/EEC of 12 December 1991 concerning the protection of waters against pollution caused by nitrates
from agricultural sources, http://eur-lex.europa.eu/LexUriServ/LexUriServ.do?uri=CELEX:31991L0676:EN:NOT 15 National projection submissions used: Austria – NECD.SUBM11; Belgium – NECD.SUBM12; France – NECD.SUBM12;
Germany – CLRTAP.SUBM12; Ireland – CLRTAP.SUBM13; Croatia – CLRTAP.SUBM13; Finland – CLRTAP August
2013. Luxembourg has not submitted any projections for years after 2010. 16 Amann et al. (2013). Policy Scenarios for the Revision of the Thematic Strategy on Air Pollution. TSAP Report #10, Version
1.2, March 2013, IIASA.
http://www.iiasa.ac.at/web/home/research/researchPrograms/MitigationofAirPollutionandGreenhousegases/TSAP_10-v1-
2.pdf

23
Services to assess the reasons for non-compliance of the emission ceilings set in the National Emission Ceilings
Directive – Final Report
relatively steep emission reductions of NOx emissions by 2020-2025. The first projections
indicating compliance for each Member State are highlighted in green in the table.
The GAINS model calculates national NOX projections based on fuel sold. For Member
States with NOX compliance checking based on fuels used, GAINS model values
corresponding to fuel used emissions have been estimated using the fuel used to fuel
sold ratio from concurrent national projections (Austria, Ireland), or from reported 2011
road transport emissions (Luxembourg)17. Belgium indicates that the GAINS model has
been adjusted for Belgium to represent as closely as possible fuel used emissions, so no
conversion is made.
The GAINS model does not include agricultural NOX emissions except field burning18, but
three Member States (Austria, Germany, Luxembourg) report agricultural NOX emissions
from manure management (NFR 4.B) and agricultural soils (NFR 4.D)19. To make
national NOX emissions and projections more comparable with the GAINS model,
agricultural soil NOX emissions are deducted from Austria's, Germany's and
Luxembourg's emission and national projection values in Table ES-2.
Table ES-2 shows the GAINS model projection values for 2005 and 2010 in comparison
to the reported NECD emissions for these years, indicating differences in the GAINS
modelling approach compared to reported emissions. The GAINS model underestimates
the 2005 and 2010 emissions – by 1 to 3 percent for France and Germany to as much as
24 to 25 percent for Croatia and Luxembourg, which suggests that the GAINS model may
underestimate emissions in the projection years for these Member States. The GAINS
model, on the other hand, overestimates Ireland emissions for 2005 and 2010 by 11 and
20 percent respectively, suggesting the GAINS model projection may also be
overestimated. For Belgium, the GAINS model overestimates the 2005 and 2010 fuel
used emissions by 3% and 6%. Not surprisingly, the GAINS model projects earlier
compliance than national projections for Austria, Germany and Finland, and later
compliance for Ireland. For France and Belgium, the GAINS model projections are very
close to the national projections.
17 The difference between fuels sold and fuels used is very large for Luxemburg, so this methodology may be subject to high
uncertainties. 18 The GAINS model includes NOX emissions from field burning of agricultural wastes (NFR sector 4.F), which are negligible for
the Member States in this study. 19 EEA (2013) NEC Directive status report 2012. Appendix 4: Member State reporting of NOX and NMVOC emissions from the
agriculture sector.

24
Services to assess the reasons for non-compliance of the emission ceilings set in the National Emission Ceilings
Directive- Final Report
Table ES-2 Estimated time for compliance with NECD 2010 ceilings based on the GAINS CLE scenario
and available national with-measures projections (Nat.) for 2015 to 2030. The GAINS model
projections are compared to reported emissions (Rep.) for 2005 and 2010. Emissions given
in kt/year.
Reported emissions for previous years,
used for reference, kt Projections, kt
2010 fuel 2005 2010 2011 2015 2020 2025 2030
ceiling basis GAINS Rep. GAINS Rep. Rep. GAINS Nat. GAINS Nat. GAINS Nat. GAINS Nat.
NOX
AT 103 sold 229 237 174 192 182 140 159 99 129 76 65 121
used 163 168 133 147 143 108 124 82 108 64 56 105
BE 176 sold 300 234 215 174 147 135
used 292 221 210 200 170
FR 810 sold 1374 1410 1053 1075 1005 847 848 619 620 496 438
DE 1051 sold 1413 1462 1219 1228 1182 991 1076 751 902 615 549
IE 65 sold 142 127 95 79 71 95 67 86 56 65 47 49
used 135 121 91 75 68 91 64 82 54 62 45 47
LU 11 sold 48 64 40 46 48 25 19 12 10
used 14 21 11 18 18 7 6 4 4
NH3
HR 30 - 29 40 29 38 37 31 39 32 42 32 33
FI 31 - 34 38 33 38 38 31 35 31 36 31 31 36
Data sources: GAINS online - scenario: TSAP_Mar13_CLE (current legislation); National emissions and WM
(with measures) projections from NECD and CLRTAP submissions through August 2013.
Notes:
a. For AT, BE, IE and LU, values based on fuel used are the basis for compliance assessment. Calculations of
NOX emissions in the GAINS model are based on fuel sold. The GAINS values based on fuel used are
estimated here based on the fuel used/fuel sold ratio from national emissions or projections in the same
year (AT, IE).
b. For LU, the fuel used/fuel sold ratio for 2011 reported road transport emissions is used to adjust GAINS
model road transport emission values to fuel used basis for all projection years.
c. Belgium informs that the GAINS model has been adjusted in such a way that it would represent as much as
possible the emissions as estimated in the Belgian inventory based on fuel used, and the actual difference
between fuel used and fuel sold is expected to be larger. The GAINS model values for BE are assumed to
represent fuel used emissions.
d. For AT, DE and LU, NFR categories 4D1 (emissions from soils) and 4D2 (handling of agricultural products)
are deducted from national values for comparability between Member States and with the GAINS model
projections.
e. For LU, fuel sold emissions are about 2½ times larger than fuel used emissions in 2010, making fuel export
emissions (28 kt) larger than the national total emission based on fuel used (18 kt). Without a projection for
fuel export, any conclusion for LU based on fuel sold projections from the GAINS model will be uncertain.
Conclusions for NECD 2010 ceilings
One Member State (Ireland) may achieve compliance before 2015 with current
legislation.
Ireland is projected to comply with the NOX ceiling shortly after 2015 by national
projections. The level projected for 2015 has already been reached in 2011, but
Ireland indicates that national NOX emissions in 2012 are likely to increase. The
GAINS model, which overestimates emissions in 2005 (11%) and 2010 (20%),
projects compliance shortly after 2020 with current legislation.

25
Services to assess the reasons for non-compliance of the emission ceilings set in the National Emission Ceilings
Directive – Final Report
Five Member States (Austria, Belgium, France, Germany and Luxembourg) are likely to
achieve compliance with their NOX ceilings between 2015 and 2020 with current
legislation.
Germany is likely to achieve compliance about 2015.
Belgium and France are likely to achieve compliance between 2015 and 2020.
Austria is likely to achieve compliance before 2020 according to the GAINS model,
but national projections submitted in 2011 do not show compliance through 2030.
Luxembourg has not submitted national projections for years after 2010. Fuel export
NOX emissions are significantly larger than national fuel used emissions and vary
over time. For this analysis, the GAINS model projections (based on fuels sold) are
adapted to the fuel used basis using the fuel used/fuels sold ratio for road transport
emissions in 2011. This approach shows compliance in 2010 – an underestimation
which indicates that this approach for Luxembourg is more uncertain than the others.
Two Member States (Croatia, Finland) are not likely to reach compliance with their NECD
2010 NH3 ceilings without significant additional measures beyond current legislation.
Croatia shows continued exceedance through 2030 according to both national and
GAINS model current legislation projections.
Finland shows continued exceedance through 2030 according to national current
legislation projections but just equalling the ceiling in 2015 and thereafter, according
to the GAINS model. However, the GAINS model underestimates Finland's NH3
emissions in 2005 (10%) and 2010 (13%), which may indicate that this projection is
unrealistic.
Additional measures
To assess the technical emission reduction potential for the Croatia and Finland, the
GAINS model current legislation projections (the CLE scenario20) were compared with
maximum technically feasible reduction (MTFR21) projections for 2025 in Table ES-3.
Cost figures are not available for 2020 but 2025 values are here used as a proxy for
emission reduction potential and costs for 2020.
Table ES-3 Estimated annual compliance costs, 2025, based on GAINS model current legislation (CLE) and
maximum technically feasible reduction (MTFR) scenarios.
Emission projections (kt) Cost 2025 (MEUR/year)
NEC2010
ceiling
CLE
2020
CLE
2025
MTFR
2025
Difference 2025
CLE – MTFR
CLE
2025
MTFR
2025
Difference 2025
MTFR - CLE
HR NH3 30 32 32 19 13 n.a. 46.9 46.9
FI NH3 31 31 31 24 7 15.8 64.6 48.8
Source: GAINS online.
20 GAINS current legislation scenario: TSAP_Mar13_CLE 21 GAINS TSAP_Mar13_MTFR_2025 scenario; cost level 2005, 4 % interest rate
26
Services to assess the reasons for non-compliance of the emission ceilings set in the National Emission Ceilings
Directive- Final Report
Estimated time for compliance with the 2020 reduction commitments in the
amended Gothenburg Protocol
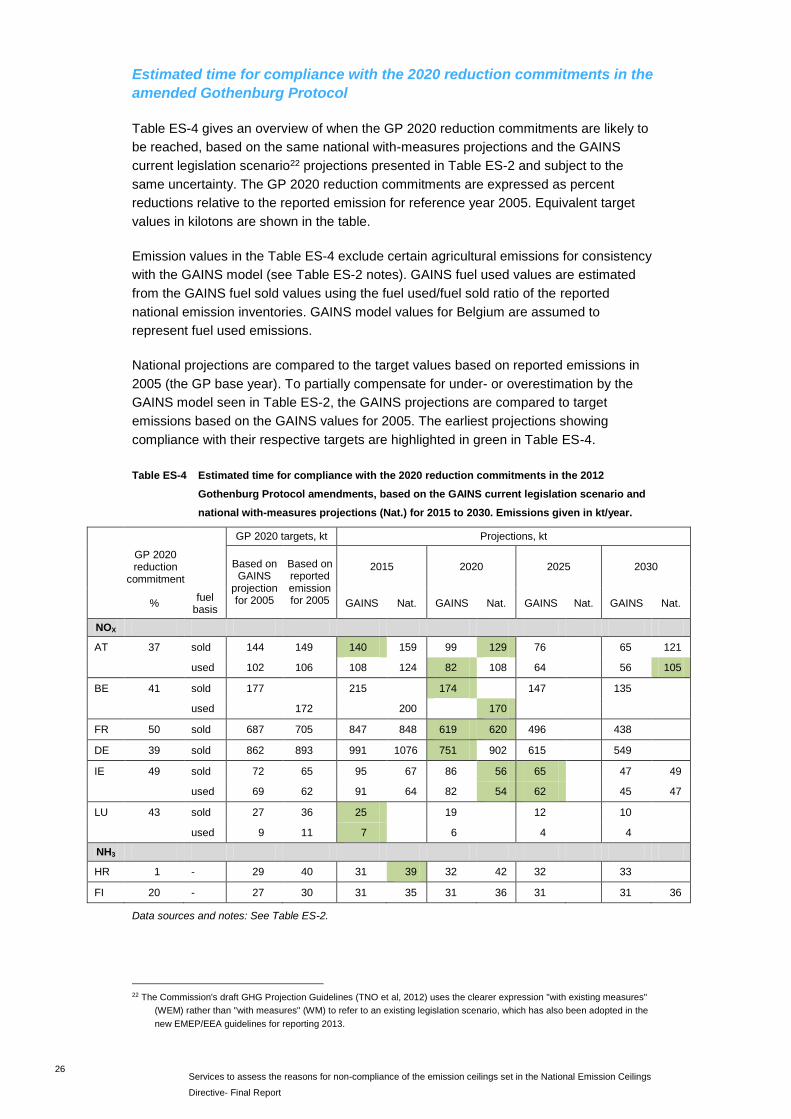
Table ES-4 gives an overview of when the GP 2020 reduction commitments are likely to
be reached, based on the same national with-measures projections and the GAINS
current legislation scenario22 projections presented in Table ES-2 and subject to the
same uncertainty. The GP 2020 reduction commitments are expressed as percent
reductions relative to the reported emission for reference year 2005. Equivalent target
values in kilotons are shown in the table.
Emission values in the Table ES-4 exclude certain agricultural emissions for consistency
with the GAINS model (see Table ES-2 notes). GAINS fuel used values are estimated
from the GAINS fuel sold values using the fuel used/fuel sold ratio of the reported
national emission inventories. GAINS model values for Belgium are assumed to
represent fuel used emissions.
National projections are compared to the target values based on reported emissions in
2005 (the GP base year). To partially compensate for under- or overestimation by the
GAINS model seen in Table ES-2, the GAINS projections are compared to target
emissions based on the GAINS values for 2005. The earliest projections showing
compliance with their respective targets are highlighted in green in Table ES-4.
Table ES-4 Estimated time for compliance with the 2020 reduction commitments in the 2012
Gothenburg Protocol amendments, based on the GAINS current legislation scenario and
national with-measures projections (Nat.) for 2015 to 2030. Emissions given in kt/year.
GP 2020 targets, kt Projections, kt
GP 2020 reduction
commitment Based on
GAINS projection for 2005
Based on reported emission for 2005
2015 2020 2025 2030
% fuel
basis GAINS Nat. GAINS Nat. GAINS Nat. GAINS Nat.
NOX
AT 37 sold 144 149 140 159 99 129 76 65 121
used 102 106 108 124 82 108 64 56 105
BE 41 sold 177 215 174 147 135
used 172 200 170
FR 50 sold 687 705 847 848 619 620 496 438
DE 39 sold 862 893 991 1076 751 902 615 549
IE 49 sold 72 65 95 67 86 56 65 47 49
used 69 62 91 64 82 54 62 45 47
LU 43 sold 27 36 25 19 12 10
used 9 11 7 6 4 4
NH3
HR 1 - 29 40 31 39 32 42 32 33
FI 20 - 27 30 31 35 31 36 31 31 36
Data sources and notes: See Table ES-2.
22 The Commission's draft GHG Projection Guidelines (TNO et al, 2012) uses the clearer expression "with existing measures"
(WEM) rather than "with measures" (WM) to refer to an existing legislation scenario, which has also been adopted in the
new EMEP/EEA guidelines for reporting 2013.
27
Services to assess the reasons for non-compliance of the emission ceilings set in the National Emission Ceilings
Directive – Final Report
Conclusions for GP 2020 reduction commitments
Except for Austria, the available projections show little difference between fuel sold and
fuel used estimates of time for compliance with the 2020 NOX reduction commitments.
Five Member States (Austria, Belgium, France, Ireland, Luxembourg) are likely to meet
their GP 2020 commitments based on current legislation.
Ireland is projected to comply shortly after 2015 by national projections. Reported
emissions in 2011 have already reached the level projected for 2015 by the national
projection, but Ireland indicates that national NOX emissions in 2012 are likely to
increase. The GAINS model projects compliance between 2020 and 2025, with
current legislation.
Luxembourg is projected to comply with its GP 2020 commitment before 2015
according to the GAINS model. Having no national projections to compare with
leaves some uncertainty around the conclusion.
Austria, Belgium and France are likely to comply with their respective GP 2020
reduction commitments by 2020 with measures in accordance with current legislation.
The GAINS current legislation projection based on fuel sold suggests compliance
closer to 2015 for Austria.
Germany would reach its reductions commitments between 2015 and 2020
according to the GAINS current legislation projections. However, national projections
do not indicate compliance by 2020, suggesting additional measures may be needed.
Two Member States (Croatia, Finland) are not likely to meet their GP 2020 commitments
for NH3 without additional measures.
Croatia's NH3 emission is below the GP 2020 target through 2015, but rises above
the target after 2015 according to the national projection (with measures scenario).
The GAINS model indicates non-compliance through 2030 based on current
legislation. Based on this analysis, Croatia is not likely to achieve the GP 2020
commitment without additional measures beyond current legislation.
Finland does not appear to reach the target level through 2030 according to both the
national and the GAINS model current legislation projections.
Table ES-3 also indicates the range of additional feasible reductions and mitigation costs
for Croatia and Finland to meet their GP 2020 commitments.
General observations and recommendations
This study of eight cases of non-compliance with the NECD ceilings in 2010 has identified
common denominators as well as country-specific reasons for the exceedances. These
include issues at EU, national and regional levels. This section summarizes key
observations and sets out a number of corresponding recommendations in the context of
a revised NECD.
Removing disincentives to improved inventory methodology
Changed methodology contributes to the non-compliance of several of the Member
States in this study. The NECD provides no mechanism to compensate for this, which
may constitute a disincentive for improving inventories, and could inhibit ambitions for
setting future reduction commitments. The 2012 Gothenburg Protocol amendments
introduce two provisions that can compensate for increasing emissions due to

28
Services to assess the reasons for non-compliance of the emission ceilings set in the National Emission Ceilings
Directive- Final Report
improvements in methodology – relative reduction targets and an "adjustment
mechanism":
Relative reduction targets maintain a proportional reduction requirement regardless of
whether reported base year emissions increase (or decrease) due to methodology
improvements. Relative targets also cancel out most differences with regard to
emissions based on fuel sold or fuel used.
The GP adjustment mechanism allows parties to propose adjustments in exceptional
circumstances to their emission reduction commitments or to their inventories used
for compliance checking, for non-compliance caused by three types of exceptional
circumstances: 1) inclusion of new emission categories, 2) revised emission factors
due to improved knowledge, and 3) significant changes in methodology since the
commitments were set.
These two provisions will remove earlier barriers to inventory improvements and reporting
of the most scientifically correct emissions, while at the same time alleviating some of the
risks related to uncertainties for emission inventories and projections.
Recommendation 1: Future national commitments for emission reductions under a
revised NECD should be expressed as percentage reductions relative to emissions
in a reference year (as reported at the time of compliance checking). The criteria,
procedures and timetable for checking compliance with the percentage reductions
should be clearly defined.
Recommendation 2: A mechanism should be provided in a revised NECD to enable
Member States to apply for adjustments in exceptional circumstances only to their
emission inventories used for checking compliance, when non-compliance is the
result of certain types of methodology improvements. Guidance should be provided
and the process should be transparent. Alignment with the GP adjustment
mechanism should be considered.
Enhancing the transparency and comparability of emission inventories
This study has encountered issues with some emission inventories which hindered the
assessment of reasons for non-compliance. A number of "new" source categories have
been recognized. However, many Member States do not estimate the new categories23
and some Member States also do not estimate a significant number of the "old"
categories. This motivates strengthening the requirements for completeness of inventory
reporting, and to limit reporting of "not estimated" categories.
The NECD, via the UNECE reporting guidelines, requires Member States to report NOx
emissions based on fuel sold, but allows some Parties to use emission inventories based
on fuels used when comparing with the ceilings24. The possibility to report emissions on
the basis of fuel used is inconsistent with the reporting obligations for climate and energy,
which are compiled on the basis of fuel sold only. With a change to relative emission
reduction targets, the significance of fuel sold versus fuel used for emission reduction
measures is lessened, enabling reconsideration of permitting compliance checking based
on fuel used.
23 NECD (via the UNECE reporting guidelines) allows MS to report emissions as "NE" for those sectors where emissions are
known to occur but have not been estimated or reported. 24 The fuel sold or fuel used basis refers to transport emissions.

29
Services to assess the reasons for non-compliance of the emission ceilings set in the National Emission Ceilings
Directive – Final Report
Basing compliance only on fuel sold emissions remains a problem for smaller Member
States where the transport sector is dominating. An adjustment mechanism for
inventories taking tank tourism into account could be considered for exceptional cases as
long as the environmental targets are not compromised.
An Informative Inventory Report (IIR) is essential to document the methodology and
changes in national emission inventories. Most Member States submit an IIR under
CLRTAP, but the NECD does not require an IIR.
Member States report emissions of the four NECD pollutants under the NECD, the
UNECE CLRTAP, and (except for NH3) the UNFCCC and Kyoto protocol, and the
Monitoring Mechanism Regulation25 (MMR) (525/2013) for greenhouse gasses. There are
differences in reporting requirements, submission deadlines, and methodologies. This
motivates further harmonization of reporting requirements among emission instruments
and protocols.
Recommendation 3: A revised NECD should better clarify the methodology and reporting
requirements for emissions, including:
that all source categories have to be reported in accordance with the EMEP
guidelines, reporting templates and EMEP/EEA Guidebook,
that it is made mandatory for all Member States to report road transport emissions
based on fuel sold for all years,
that future reduction commitments and thus reporting of road transport emissions
data be based on fuels sold only, and
that it is made mandatory for all Member States to submit an IIR under the NECD.
Harmonization of methodologies should enable a single IIR document to serve both
the CLRTAP and NECD requirements.
NECD, CLRTAP, UNFCCC and MMR reporting templates include reporting of activity
levels (primarily fuel consumption) associated with emission amounts and projections, for
each source sector, but not all Member States report these. Projected activity data are
valuable for monitoring changes in assumptions for projections. Activity data by fuel type
would be very useful for road transport sub-sectors, for monitoring of changing vehicle
fleet composition. Aggregate vehicle mileage is also a useful activity indicator.
The COPERT 4 software implements the Guidebook's Tier 3 mileage-based emission
methodology for road transport. Two thirds of Member States use various versions of
COPERT 4 to estimate emissions from road transport, and the remaining third use a
variety of other approaches26. There are few comparisons of the national approaches to
the Guidebook approach implemented in COPERT, so the magnitude of differences is not
known.
For Member States where tank tourism is significant (AT, BE, IE, LU), there is an
inconsistency between the requirement to report road transport emissions based on fuel
sold and the Guidebook Tier 3 methodology for road transport (and COPERT software)
based on in-country mileage corresponding to fuel used. Little guidance is given on
25 The Monitoring Mechanism Regulation (525/2013) Art. 7.1.b requires Member States to annually report CO, SO2, NOX and
VOC emissions that are consistent with data already reported under NECD and CLRTAP. 26 EEA (2013). NEC Directive status report 2012, Table 2.6

30
Services to assess the reasons for non-compliance of the emission ceilings set in the National Emission Ceilings
Directive- Final Report
reconciling fuel sold versus fuel used fuel consumption. This is a concern for some
Member States, indicating a need for improved guidance on this topic.
Recommendation 4: NECD guidance should be strengthened to:
encourage Member States using the COPERT software to use the latest available
version in a given reporting year.
promote comparison and harmonisation of national methodologies for road transport
emission estimation.
improve guidance on best practice for calculating road transport emissions due to fuel
export (tank tourism), for Member States where this is significant.
require complete reporting of annual activity data for all inventory years and
projection activity data for all projection years.
include annual reporting of road transport activity data by fuel type (petrol, diesel,
etc.) and also aggregate vehicle mileage.
Improved national programmes and projections
National programmes of measures for emissions reduction have varied considerably in
content and level of detail among the Member States in this study. The NECD does not
specify what types of information about policies and measures should be reported in
national programmes, other than quantified estimates of the effects on emissions.
Recommendation 5: More detailed requirements on format and content of national
programmes should be considered for the updated NECD. National programmes
under NECD should be consistent with policies and measures on greenhouse gases,
as reported under the Monitoring Mechanism Regulation (525/2013). Hence updates
and reporting of NECD national programmes every two years should be considered.
Detailed implementation guidelines for the preparation of national programmes
should be prepared to assure that all Member States include the same level of
information, including estimates of the expected emission reduction for all measures.
Revisions to programmes should indicate the progress of existing measures in
comparison to the planned reduction.
This study has encountered national emission inventories and national projections with
differences in emission categories and methodology, and widely varying levels of
documentation. There are also several cases where national emission projections have
not been updated for several years after major methodology changes.
Among the Member States in this study, there are varying interpretations of the meaning
of "with measures" (WM) and "with additional measures" (WAM) projection scenarios,
and the years for which projections are calculated varies. The EMEP/EEA Guidebook
(2013)27 and proposed revision of the EMEP reporting guidelines28 align the definitions for
reporting with those under MMR, and this harmonisation should be reflected in a revised
NECD.
27 EMEP/EEA air pollutant emission inventory guidebook 2013, http://www.eea.europa.eu//publications/emep-eea-guidebook-
2013 28 TFEIP (2013) Guidelines for Reporting Emission Data Under the Convention on Long-Range Transboundary Air Pollution
(draft v2). http://tfeip-secretariat.org/assets/Meetings/Documents/2013-TFEIP-Istanbul/UNECE-2014-RepGuidelines-draft-
v2-clean-commented.doc

31
Services to assess the reasons for non-compliance of the emission ceilings set in the National Emission Ceilings
Directive – Final Report
Recommendation 6: NECD guidance on projections should be strengthened regarding
the definitions and numbers of scenarios, the frequency and years for projections,
fuel basis, assessment of uncertainty, and updating of projections when
methodologies change. A two-year frequency for reporting projections as specified in
the MMR29 should be considered. Projections prepared for NECD should be
consistent with projections prepared for CLRTAP and MMR.
Improved policy coherence
Several Member States have mentioned during this study that implementation of other
EU environmental policies has led to increases in NOX emissions, which have contributed
to Member State non-compliance with the NOX ceilings, demonstrating shortcomings as
regards internal policy coordination in the Member States. Many Member States have
created incentives for diesel vehicles as part of their climate policies, which has led to
dieselification of vehicle fleets. The real-world emissions of NOx from diesel vehicles are
substantially above the limits set in the Euro exhaust emissions legislation, and this in
turn has led to increases in NOX emissions from transport.
Associated with climate policy, EU renewable energy policy promotes biomass. Several
Member States have reported increases in NOX emissions due to the shift to biomass,
especially from smaller combustion units with less strict emission limits.
One Member State noted that the EU Emission Trading System (ETS) places a financial
value on CO2 emissions, and a financial penalty for non-compliance. There is to date no
similar valuation or financial penalty for NECD non-compliance. This can cause Member
States to disproportionately prioritize GHG reduction measures, to the detriment of their
other pollutant reduction commitments.
Recommendation 7: Member States should improve policy coherence in the
implementation of interlinked environmental and climate and energy policies, e.g. by
comparing emissions and reduction measures for greenhouse gasses to emissions
and reduction measures of air pollutants. Further development of approaches to
establish equivalence factors or valuations for CO2 and non-GHG pollutants could be
helpful for policy comparisons and coherence. The EU should promote such efforts.
Unified access to emission information
A wealth of emission data is presently available online under various legal instruments,
and has been compiled into various datasets30 that are accessible or downloadable
online. The value of these resources would be enhanced for environmental monitoring,
education and research if the various NECD, CLRTAP and MMR national emission
databases were further harmonised to facilitate access and merging of these data
sources.
Recommendation 8: Publically-accessible databases of reported national emission and
activity data under the various emission instruments and protocols should be further
harmonised (common data definitions and encoding) to facilitate access and
merging of these data sources.
29 MMR Article 14, Reporting on projections. 30 For example NECD, CLRTAP and MMR emission datasets at EEA http://www.eea.europa.eu/data-and-maps/data and the
CLRTAP online emission database at EMEP CEIP http://www.ceip.at/webdab-emission-database, which also includes
activity and gridded data.


33
Services to assess the reasons for non-compliance of the emission ceilings set in the National Emission Ceilings
Directive – Final Report
1 Introduction
1.1 Context of the project
The Commission is undertaking a comprehensive review of EU air pollution policy in
2013. The review encompasses relevant EU regulatory instruments, including Directive
2001/81/EC on national emission ceilings (NECD), the focus of this project.
The National Emission Ceilings Directive (NECD) is a key element of EU air quality
policy. The aim of this Directive is to limit emissions of acidifying and eutrophying
pollutants and ozone precursors31. NECD covers emissions of sulphur dioxide (SO2),
nitrogen oxides (NOX), non-methane volatile organic compounds (NMVOC) and ammonia
(NH3). The Directive defines interim environmental objectives, introduces legally-binding
national emission ceilings to be met by 2010, and requires development and reporting of
national programmes for reduction of emissions, annual emission inventories and
projections.
Status of emissions under the NECD
Eleven Member States did not comply with their NOX emission ceilings in 2010, as shown
in Table 1-1.
Table 1-1 National NOX emissions in 2010 in comparison to NECD 2010 ceilings, for non-compliant
Member States. Blank entries indicate the values that are not reported. Sources: EEA CDR
online – NECD.SUBM12.
NOX
Country
2010 NOX emission
(fuel sold) kt
2010 NOX emission
(fuel used) kt
NECD 2010 emission ceiling, kt
Distance to NOX ceiling in
2010, kt
Distance to NOX ceiling in
2010, %
Luxembourg* 17.9 11* 6.9 63.0%
Austria* 193.2 147.5 103* 44.5 43.2%
France 1075.3 810 265.3 32.7%
Germany 1331.9 1051 280.9 26.7%
Belgium* 220.7 176* 44.7 25.4%
Ireland* 78.9 75.4 65* 10.4 16.0%
Spain 901.1 847 54.1 6.4%
Netherlands 274.1 291.9 260 14.1 5.4%
Denmark 133.5 127 6.5 5.1%
Sweden 153.4 148 5.4 3.6%
Malta 8.1 8 0.1 1.3%
* Compliance based on fuel-used emissions.
As shown in Table 1-2, Croatia, Finland and Spain did not comply with their 2010 NECD
ceilings for NH3. Croatia, Finland and Spain exceeded their NH3 ceilings by 10% or more.
31 In addition, pollutants covered by NECD are precursors of secondary particles, which represent considerable part of total PM
concentrations in the ambient air.
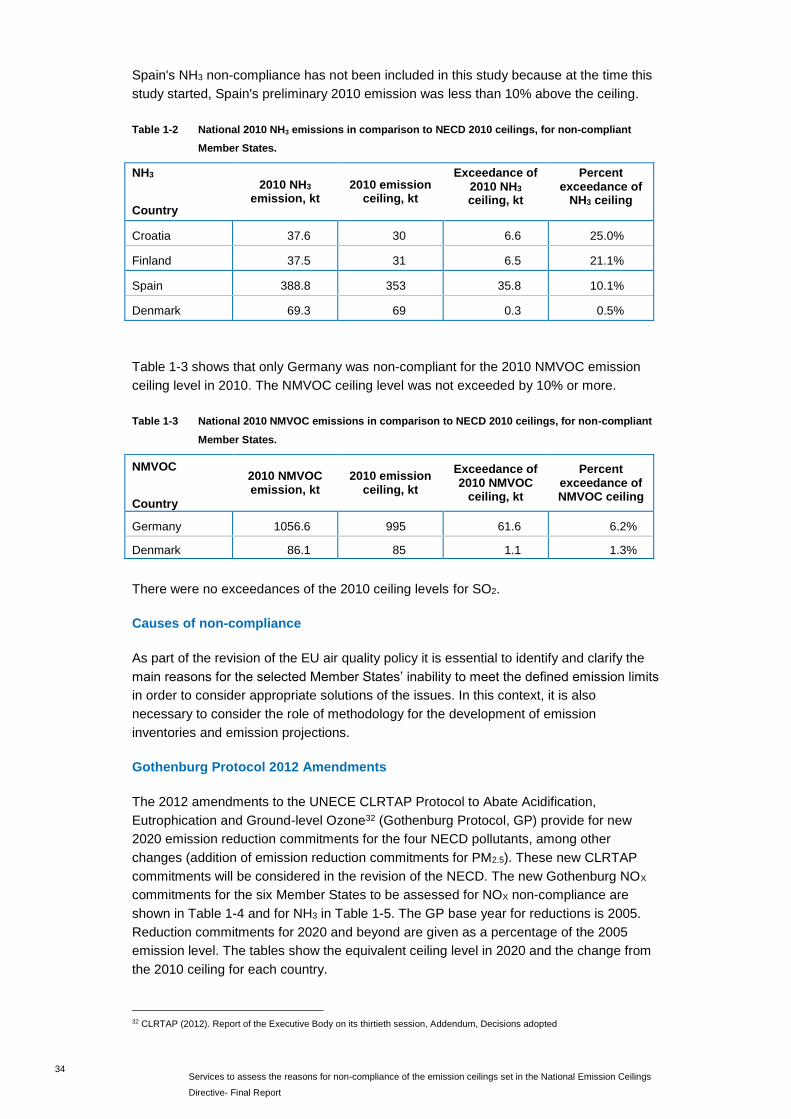
34
Services to assess the reasons for non-compliance of the emission ceilings set in the National Emission Ceilings
Directive- Final Report
Spain's NH3 non-compliance has not been included in this study because at the time this
study started, Spain's preliminary 2010 emission was less than 10% above the ceiling.
Table 1-2 National 2010 NH3 emissions in comparison to NECD 2010 ceilings, for non-compliant
Member States.
NH3
Country
2010 NH3 emission, kt
2010 emission ceiling, kt
Exceedance of 2010 NH3 ceiling, kt
Percent exceedance of
NH3 ceiling
Croatia 37.6 30 6.6 25.0%
Finland 37.5 31 6.5 21.1%
Spain 388.8 353 35.8 10.1%
Denmark 69.3 69 0.3 0.5%
Table 1-3 shows that only Germany was non-compliant for the 2010 NMVOC emission
ceiling level in 2010. The NMVOC ceiling level was not exceeded by 10% or more.
Table 1-3 National 2010 NMVOC emissions in comparison to NECD 2010 ceilings, for non-compliant
Member States.
NMVOC
Country
2010 NMVOC emission, kt
2010 emission ceiling, kt
Exceedance of 2010 NMVOC
ceiling, kt
Percent exceedance of NMVOC ceiling
Germany 1056.6 995 61.6 6.2%
Denmark 86.1 85 1.1 1.3%
There were no exceedances of the 2010 ceiling levels for SO2.
Causes of non-compliance
As part of the revision of the EU air quality policy it is essential to identify and clarify the
main reasons for the selected Member States’ inability to meet the defined emission limits
in order to consider appropriate solutions of the issues. In this context, it is also
necessary to consider the role of methodology for the development of emission
inventories and emission projections.
Gothenburg Protocol 2012 Amendments
The 2012 amendments to the UNECE CLRTAP Protocol to Abate Acidification,
Eutrophication and Ground-level Ozone32 (Gothenburg Protocol, GP) provide for new
2020 emission reduction commitments for the four NECD pollutants, among other
changes (addition of emission reduction commitments for PM2.5). These new CLRTAP
commitments will be considered in the revision of the NECD. The new Gothenburg NOX
commitments for the six Member States to be assessed for NOX non-compliance are
shown in Table 1-4 and for NH3 in Table 1-5. The GP base year for reductions is 2005.
Reduction commitments for 2020 and beyond are given as a percentage of the 2005
emission level. The tables show the equivalent ceiling level in 2020 and the change from
the 2010 ceiling for each country.
32 CLRTAP (2012). Report of the Executive Body on its thirtieth session, Addendum, Decisions adopted

35
Services to assess the reasons for non-compliance of the emission ceilings set in the National Emission Ceilings
Directive – Final Report
Table 1-4 Gothenburg 2012 amendment NOX emission reduction commitments for 2020 and beyond.
Blanks indicate values not reported. Sources: NECD.SUBM12 33, CLRTAP.SUBM13
NOX Reported 2005 NOX emission, kt
NOX reduction commitment
for 2020
Equivalent 2020 NOX target, kt
Country fuel sold fuel used fuel sold fuel used
Austria* 237.5 169.0 37% 149.6 106.5
Belgium* 291.8 41% 183.8 172.2
France 1409.5 50% 704.8
Germany 1575.4 39% 961.0
Ireland* 127.4 120.9 49% 65.0 61.7
Luxembourg* 61.8 18.9** 43% 35.2 10.8
* based on fuel-used emissions.
** CLRTAP.SUBM13.
Regarding NH3, Croatia’s 1% reduction commitment in 2020 from the 2005 reference
year is equivalent to a 2020 target level which is 10 kt (33%) higher than its 2010 ceiling
(30 kt). Finland’s 20% reduction commitment for 2020 is equivalent to a 0.8 kt (2.5%)
reduction compared to the 2010 ceiling level (31 kt).
Table 1-5 Gothenburg 2012 amendment NH3 emission reduction commitments for 2020 and beyond,
with comparison to 2010 ceiling, for Member States non-compliant in 2010 by 10% or more.
Source: NEC.SUBM12, CLRTAP.SUBM13
NH3
Country
Reported 2005 NH3 emission,
kt
Reduction commitment
from 2005
Equivalent 2020 NH3 target, kt
Croatia 40.4 1% 40.0
Finland 37.8 20% 30.2
1.2 Objectives and tasks
The role of this study is to improve the understanding of the main reasons that some EU
Member States did not meet their national air pollution reduction targets (ceilings) defined
in NECD as well as provide new information for the upcoming EU air quality review,
which is not included in existing reports34.
The specific tasks of the project include:
Independent assessment of the key reasons for non-compliance with the NECD 2010
emission ceilings for the Member States that have exceeded the defined ceilings in
year 2010 and/or 2011 (Task 1)
Assessment of the key reasons for non-compliance with the NECD 2010 emission
ceilings identified by the Member States themselves for the Member States that have
exceeded the defined ceilings in year 2010 and/or 2011 (Task 2)
Assessment of when the 2010 ceilings are expected to be met (Task 3)
33 EEA On-line CDR 34 such as EEA, 2012. Evaluation of progress under the EU National Emission Ceiling Directive. Technical report No 14/2012;
and EEA, 2013. NEC Directive status report 2012. Technical report No 6/2013.

36
Services to assess the reasons for non-compliance of the emission ceilings set in the National Emission Ceilings
Directive- Final Report
Assessment of the possible need for additional measures at the national level beyond
existing national or EU legislation for Member States to achieve the new Gothenburg
commitments for 2020. (Task 4)
Development of policy recommendations for the review and revision of NECD (Task
5)
The assignment focuses on those EU Member States (including Croatia as of July 2013),
which have exceeded the existing 2010 NECD ceilings for one or more pollutants by 10%
or more, as of October 2012. This study focuses on the six Member States (Austria,
Belgium, France, Germany, Ireland and Luxembourg) which exceeded their 2010 NOX
emission ceilings by 10% or more, and Finland and Croatia for exceeding their 2010 NH3
emission ceilings by 10% or more. None of the Member States exceeded their SO2 or
NMVOC emissions ceilings by 10% or more. The project thus focuses only on NOX and
NH3.
1.3 Methodology
1.3.1 Task 1 – Independent assessment of reason for non-compliance
An independent analysis of reasons for non-compliance with the NECD 2010 emission
ceilings was carried for each of the eight Member States through the following main
activities:
Review of the national legal framework related to the implementation of the NECD;
Assessment of the policies and measures implemented by the Member States to
reduce emissions of a pollutant. This was done by reviewing the National
Programmes developed in the context of NECD, and communication of the Member
States with the EU and Secretariat of CLRTAP;
Analysis of the emission inventories, main emission sources and statistical and
activity data;
Review of the emission projections reported by the Member States in different years,
as well as the assumptions and methodologies used in the development of the
projections.
The individual assessments are synthesized to identify common denominators shared by
several Member States pertaining to their non-compliance with NOX or NH3.
1.3.2 Task 2 – Member States' perception of the reasons for non-compliance
The Member States' perspective on the reasons for non-compliance with the 2010 NECD
ceilings was based on telephone interviews with Member State official representatives
and experts, and documents provided by or referred to by them. Questions specific to
each Member State were prepared and sent to the representatives in advance of the
telephone interviews. Some Member States also provided written replies to the questions.
The results of the interviews and analysis of documents has been summarised and
compared with the assessment of Task 1. Particular attention has been paid to the issues
of road transport emissions based on fuel sold versus fuel used, the associated tank-
tourism issue, and the impact of non-delivery of Euro standards in real world driving
conditions.
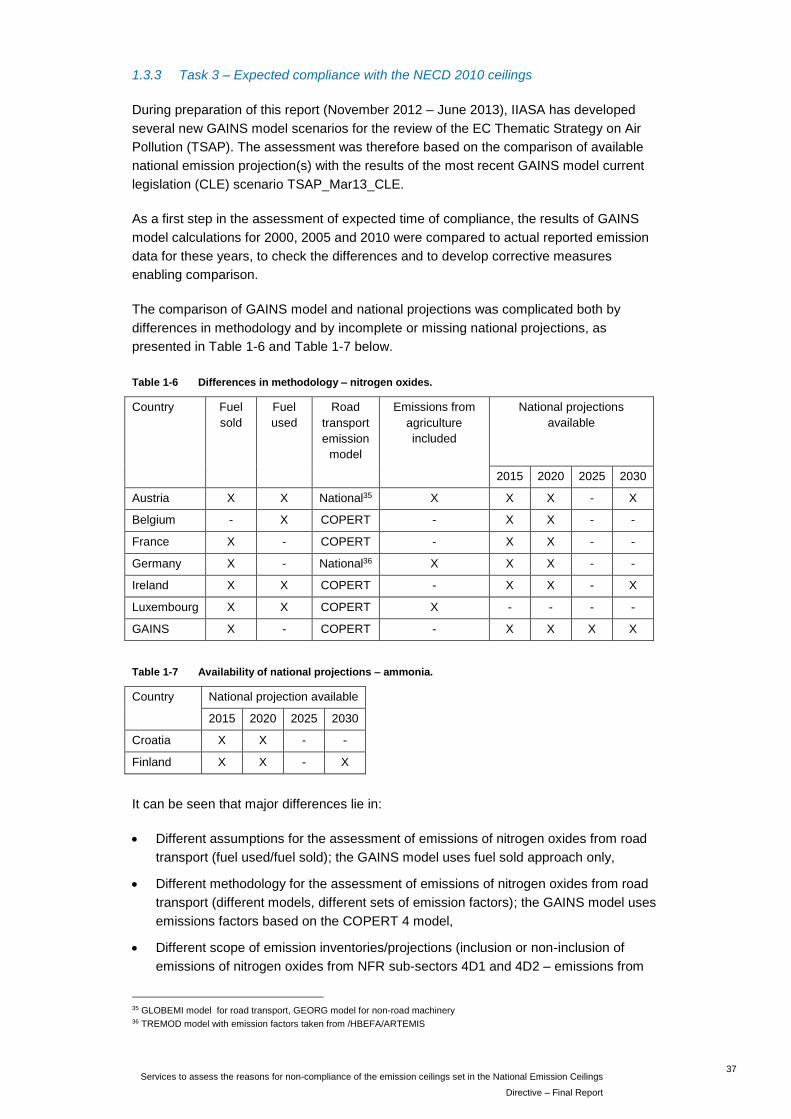
37
Services to assess the reasons for non-compliance of the emission ceilings set in the National Emission Ceilings
Directive – Final Report
1.3.3 Task 3 – Expected compliance with the NECD 2010 ceilings
During preparation of this report (November 2012 – June 2013), IIASA has developed
several new GAINS model scenarios for the review of the EC Thematic Strategy on Air
Pollution (TSAP). The assessment was therefore based on the comparison of available
national emission projection(s) with the results of the most recent GAINS model current
legislation (CLE) scenario TSAP_Mar13_CLE.
As a first step in the assessment of expected time of compliance, the results of GAINS
model calculations for 2000, 2005 and 2010 were compared to actual reported emission
data for these years, to check the differences and to develop corrective measures
enabling comparison.
The comparison of GAINS model and national projections was complicated both by
differences in methodology and by incomplete or missing national projections, as
presented in Table 1-6 and Table 1-7 below.
Table 1-6 Differences in methodology – nitrogen oxides.
Country Fuel
sold
Fuel
used
Road
transport
emission
model
Emissions from
agriculture
included
National projections
available
2015 2020 2025 2030
Austria X X National35 X X X - X
Belgium - X COPERT - X X - -
France X - COPERT - X X - -
Germany X - National36 X X X - -
Ireland X X COPERT - X X - X
Luxembourg X X COPERT X - - - -
GAINS X - COPERT - X X X X
Table 1-7 Availability of national projections – ammonia.
Country National projection available
2015 2020 2025 2030
Croatia X X - -
Finland X X - X
It can be seen that major differences lie in:
Different assumptions for the assessment of emissions of nitrogen oxides from road
transport (fuel used/fuel sold); the GAINS model uses fuel sold approach only,
Different methodology for the assessment of emissions of nitrogen oxides from road
transport (different models, different sets of emission factors); the GAINS model uses
emissions factors based on the COPERT 4 model,
Different scope of emission inventories/projections (inclusion or non-inclusion of
emissions of nitrogen oxides from NFR sub-sectors 4D1 and 4D2 – emissions from 35 GLOBEMI model for road transport, GEORG model for non-road machinery 36 TREMOD model with emission factors taken from /HBEFA/ARTEMIS

38
Services to assess the reasons for non-compliance of the emission ceilings set in the National Emission Ceilings
Directive- Final Report
fertilizers and handling of agricultural products); emissions of these sub-sectors are
not included in the GAINS model,
Different projection years provided, and no national projections beyond 2010 in the
case of Luxembourg,
Different break-down of emissions among NFR sectors in national projections and
GAINS model projections,
Different assumptions for activity projections between national projections and GAINS
model projections.
The scope of national emission inventories/projections varies. The inclusion or non-
inclusion of emissions of nitrogen oxides from agriculture (NFR sub-sectors 4D1 and
4D2) represents a major issue. In the case of Germany, this item represents around 8 %
of the national total and representing more than a third of the exceedance for the 2010
ceiling, while in the case of France it is not included in national totals but rather reported
as a memo item (7B).
1.3.4 Task 4 – Impact on future reduction commitments for 2020
The aim of the Task 4 is to investigate if the compliance with the new Gothenburg
Protocol reduction commitment for year 2020 will require any additional national or EU
policy measures, in particular for three non-compliant countries: Austria, Luxembourg and
Finland. The analysis is based on available national and GAINS scenarios and
projections for years 2015, 2020, 2025 and 2030. Where compliance with the GP 2020
reduction targets is in doubt from projections based on existing legislation ("with existing
measures" or "with current legislation" scenarios), the potential of "additional measures"
or "maximum technically feasible measures" scenarios is investigated.
1.3.5 Task 5 – Make policy recommendations in the context of the revision of the
NECD
Task 5 is to synthesise and present observations from the results of the prior tasks, and
to make policy recommendations to be taken into consideration in the process of the
review of NECD. The observations and recommendations are to focus on
emission inventory methodology, including frequency of reporting
emission projection methodology
national programmes for emission reduction
interaction (antagonism/synergy) with other Directives:
o Ambient air quality
o Climate change policy instruments (e.g. ETS)
o Energy policy instruments
o Agricultural policy instruments
1.3.6 Special issues
The following special concerns and risks have been identified by the EC and the project
team.
39
Services to assess the reasons for non-compliance of the emission ceilings set in the National Emission Ceilings
Directive – Final Report
Difficulty of comparison
There are some complications in making comparisons among national emission
inventories due to the different scope of emission sectors included and different
methodologies applied, mainly for calculation of emissions from mobile sources. The
same problems have been found in the case of comparisons between national
projections and GAINS model projections (due to different source categories used,
changing methodologies and data completeness over time). Careful attention is given to
these types of issues when making comparisons or evaluating trends.
Fuel sold versus fuel used
The NEC Directive and the CLRTAP Gothenburg Protocol allow parties to choose to base
emissions (for mobile sources) on either fuel sold or fuel used, for the purpose of
checking compliance with ceilings. Four of the Member States in the study (AT, BE, IE
and LU) have chosen to base compliance checking on fuels used. This is related
primarily to tank tourism – the purchase of fuel by transit vehicles, which is then used in
neighbouring countries. Tank tourism is caused by fuel price differences, primarily due to
tax differences.
The project team has been careful to distinguish emissions based on fuel used or fuel
sold when making analyses and assessments. National and international analyses of
tank tourism, and relevant fuel price and tax information, have been reviewed to assess
the significance of tank tourism and the extent to which it may be a reason for non-
compliance.
Euro standards
The Euro 3, 4 and 5 standards have not delivered the expected NOX reductions, because
real world driving NOX emissions are much higher than the test-cycle emission limits in
the Euro Directives. Member States point to the failure of the Euro standards as a main
reason for difficulty in reducing national NOX emissions.
Euro 6/IV will be a necessary element for future NOX reductions, since the timing and
success of Euro 6/VI standards to deliver expected NOX reductions is critical for
achievement of 2020 commitments and beyond. The Euro VI emission standards for
heavy duty vehicles came into force in January 2013. The Euro 6 emission standards for
passenger cars and light duty vehicles comes into force in September 2014. Additional
requirements will be phased in from 2016 to 2017 and requirements for on-road
emissions verification are planned to come into force in 2017, so it may take several
years to achieve the full effect of Euro 6. The experience with the failure of the previous
Euro generations has created uncertainty among some Member States regarding
willingness to commit to reductions dependent on the outcome of Euro 6 emissions under
real world driving conditions.
Evolving inventory methodology
Inventory completeness, the addition of new source categories, changes in emission
factors and inventory methodologies, and possibly mistakes in inventories, may be part of
the reasons for non-compliance.
1.4 Structure of this report
This report is organised in two groups of chapters: First, chapters 1 to 4 present the
overall assessment and second, chapters 5 to 12 present more detailed individual
assessments for each of the eight Member States in the study.
40
Services to assess the reasons for non-compliance of the emission ceilings set in the National Emission Ceilings
Directive- Final Report
Chapter 2 presents a synthesis of the reasons for non-compliance compiled from the
independent and Member State assessments. Common issues contributing to non-
compliance are identified and discussed.
Chapter 3 present the analysis of estimated times that the non-compliant Member States
in this study will achieve compliance with the NECD 2010 ceilings, and also with the 2020
emission reduction commitments in the 2012 amendments to the Gothenburg Protocol.
Chapter 4 contains observations drawn from the study and policy recommendations for
consideration in the review and revision of the NECD.
Chapters 5 to 12 present the study's analyses of the eight individual Member States in
the study. Each chapter contains a summary of independent assessment of reasons for
non-compliance, a summary of the Member State's assessment of reasons, and
estimates of the time that the Member State will comply with the NECD 2010 ceilings and
the 2020 emission reduction commitments in the 2012 amendments to the Gothenburg
Protocol.
References are listed in Chapter 13, and also in footnotes throughout the text.

41
Services to assess the reasons for non-compliance of the emission ceilings set in the National Emission Ceilings
Directive – Final Report
2 Analysis of Common Denominators for Non-compliance
2.1 Summary of reasons for non-compliance
Reasons for non-compliance with the NECD ceilings in 2010 have been identified in two
ways: 1) an independent assessment and 2) by asking the Member States. For the six
Member States where NOX emissions in 2010 were more than 10% above the NECD
ceilings, Table 2-1 provides a long-list of the main reasons for non-compliance compiled
from the two approaches. Similarly, Table 2-2 summarizes the main reasons for non-
compliance with the NH3 ceilings, for the two countries where NH3 emission in 2010 were
more than 10% above the NECD ceilings. Discussion of the common reasons is given in
following sections and the specific Member State situations are presented in the country
chapters 5 to 12.
These tables indicate with letter "I" if a reason was identified in the independent
assessment, and by letter "M" if the reason was identified by the Member State. "I+M" is
shown where the reason was identified by both. These three combinations are also
highlighted by colour shading.
The lists of reasons in Table 2-1 and Table 2-2 are presented in groups according to:
reasons related to the available knowledge, data and methodology at the time the
ceilings were set;
reasons associated with the national programmes of emission reduction measures or
national projection required by the NECD;
national or international developments from 2001 to 2010;
mobile source emissions;
issues related to emission inventory and projection methodologies; and
policy interactions identified in the study.
Table 2-1 Summary matrix of reasons for non-compliance with NOx ceilings for Austria (AT),
Belgium (BE), France (FR), Germany (DE), Ireland (IE) and Luxembourg (LU).
Reason for non-compliance with 2010 NOx ceiling AT BE FR DE IE LU
Emission inventories and projections at the time of NECD
negotiation 1998-2000
1) 1990 activity levels were underestimated M I I+M I
2) NOx inventory omitted significant source categories M I
3) Population growth rate underestimated I+M
4) Economic growth rate underestimated I M
5) Primary energy growth rate underestimated I+M I+M
6) Road transport mileage growth underestimated I+M M I+M I+M
7) Projections showed compliance by 2010 with existing
legislation and measures
I+M

42
Services to assess the reasons for non-compliance of the emission ceilings set in the National Emission Ceilings
Directive- Final Report
Reason for non-compliance with 2010 NOx ceiling AT BE FR DE IE LU
National programmes of emission reduction measures
8) National programme of measures inadequate or delayed I I
9) National programme lacked reduction estimates for
measures
I
10) National measures cannot compensate for projection
errors or failure of Euro vehicle emission standards
M M
National projections
11) National projections overestimated emissions I
12) National projections underestimated emissions I I I I I
13) National projections showed compliance until too late M
Activity developments
14) Activity and energy consumption growth very high I I I I+M
15) Major new stationary source was not in original
projections
I+M
16) Increase in biofuel combustion with higher NOX emission M M M
Mobile source emissions
17) Vehicle NOX emissions did not decline as expected due
to real-world driving emissions higher than Euro limit
values
I+M I+M I+M I+M I+M I+M
18) Dieselification of PC and LDV fleet due to fuel price
and/or vehicle tax favouring diesel vehicles, with higher
NOx emission
I I I+M I I I+M
19) Higher than expected growth of passenger car fleet I I M I I
20) High growth in road freight transport activity and/or share I I I I I
21) High transit road transport, which is outside national
control
M
22) High growth of non-resident commuter traffic M
23) Delayed and weak EU emission standards for non-road
mobile machinery
M
24) Relatively low tax on diesel fuel encourages “tank
tourism”
I+M I+M I
Emission inventory methodology
25) Improved inventory methodology has resulted in an
increase in total assessed emissions
I M M
26) Non-road mobile source categories added to inventory I+M M I
27) Agricultural emissions (4.D) added to inventory M I
28) Default small combustion emission factors don't reflect
new technology
M
Policy interactions
1) Reducing CO2 via combustion units < 50 MW increases
NOX
M M
2) Decentralization of electricity generation increases NOX M
3) Reducing CO2 through incentives for diesel vehicles
and/or diesel fuel increases NOX
I M I I I
4) Renewable energy policy favours biofuels, but NOx
emission is higher
M I+M M
Table key: Letters and colour shading indicate reasons identified by: I - Independent
assessment, M – Member State, or I+M for both.

43
Services to assess the reasons for non-compliance of the emission ceilings set in the National Emission Ceilings
Directive – Final Report
Table 2-2 Summary matrix of reasons for non-compliance with NH3 ceilings in 2010, for Croatia (HR)
and Finland (FI).
Reason for non-compliance with 2010 NH3 ceiling HR FI
Emission inventory at the time of NECD negotiation 1998-2000
1) Incorrect or poor quality of agricultural statistics for year 1990 I+M I+M
2) National emission factors significantly underestimate NH3 emissions
for 1990 I+M
3) Minor NH3 source categories were not estimated (transport, energy,
waste, solvent use) I+M
Projections at the time of NECD negotiation 1998-2000
4) 2010 activity levels underestimated (N-excretion rate, passenger
transport volume growth) I+M
5) 2010 emission reductions overestimated for existing measures (incl.
Nitrate Directive) I+M
National programmes of reduction measures
6) Absent, delayed or inadequate measures I I
7) Overestimation of emission reduction from measures I+M
National projections
8) Reported projections not updated when new methodology adopted I
Emission inventory methodology
9) Revised emission factors I+M I+M
10) Minor new source categories added – transport, waste, energy, solvent
use I+M
11) Improved agricultural activity data I+M I+M
EU policy conflicts
12) Vehicle emission control (catalysts) leads to increased NH3 emissions M
Table key: Letters and colour shading indicate reasons identification by: I - Independent
assessment, M – Member State, or I+M for both.
The common issues regarding NOX revealed by Table 2-1 are discussed in section 2.2
below. The remaining reasons given in Table 2-1 and Table 2-2 are mostly specific to the
individual Member States. The country-specific issues are briefly summarised in section
2.3 for NOX and in section 2.5 for NH3. The overall situation in each Member State is
summarized the eight country chapters 5 to 12. The sections on reasons for non-
compliance are followed by general issues related to emission inventory methodology
and reporting, national programmes of measures, and emission projections. Differences
between the independent assessment and reasons identified by the Member States are
also discussed.
2.2 Common issues for NOX non-compliance
Vehicle NOX emissions (primarily diesel) under real-world driving conditions are
significantly higher than expected from the test cycle emissions specified by the Euro
exhaust emission standards. Vehicle NOX emission factors have been increased to
reflect the real-world driving NOX emission levels, resulting in higher reported NOX
emissions compared to estimations and projections used at the time the NECD
ceilings were set. Estimated additional NOX emissions in 2010 due to revised vehicle

44
Services to assess the reasons for non-compliance of the emission ceilings set in the National Emission Ceilings
Directive- Final Report
emission factors since the 2010 ceilings were set range from 16% of the national total
for Germany to 26% for France and 27% for Ireland37. These correspond to 75% of
Germany's 2010 exceedance, 106% for France and 192% for Ireland.
Climate policy, tax incentives and policies and consumer choice have led to large
increases in the number of diesel passenger cars and light duty vehicles during the
last decade, called dieselification of the vehicle fleet. As a result, the diesel share of
vehicle fuel consumption in 2010 was much higher than assumed in 1999 – 80% for
France, 83% for Luxembourg and 85% for Belgium. Since Euro 2, NOX emission
limits for diesel cars have declined more slowly than for petrol-fuelled cars38. The
Euro 3, 4 and 5 emission standards which went into effect in 2000, 2005 and 2009
allow three times more NOX to be emitted from new diesel vehicles than
corresponding new petrol-fuelled vehicles. These differences are much larger under
real-world driving conditions. The combination of dieselification and higher specific
NOX emissions for diesel vehicles resulted in significantly higher total NOx emissions
than expected (in the range of 22 to 32 percent of the national totals for France,
Germany and Ireland).
Although the COPERT 4 model introduced in 2007 gave significantly higher NOX
emissions for road traffic than expected at the time the ceilings were set, Member
States were slow to take compensating measures. On the other hand, NECD does
not require further revision of national programmes of measures after 2006.
Emission inventory improvements have added new NOX emission source sectors
after the ceilings were set, which have increased the distance to reach the fixed
ceilings. An example of a new, previously not accounted source, is NOx emissions
from agricultural soils reported by Germany, Austria and Luxembourg, adding 9% to
the national total for Germany39. Some non-road mobile machinery sources were also
omitted by some Member States at the time the ceilings were set.
Climate and renewable energy policies have led to increased consumption of
biomass, which typically has higher NOX emissions in small combustion installations
than natural gas or oil40.
Total road transport fuel consumption between 1990 and 2010 increased more than
projected in 1999 for Austria, Ireland and Luxembourg, but was lower than the 1999
projection for Belgium, France and Germany, making this a mixed issue for NOX
emissions.
Underestimated base year emissions at the time ceilings were set, due to poor
activity data quality and/or lack of reliable emission factors, have also contributed in
some Member States, in particular in Belgium and Germany. These require a greater
reduction to meet the fixed ceilings than originally foreseen.
Additional discussion of some of these common reasons is provided below.
37 Ntziachristos and Papageorgiou, 2011. Road transport emission projections in the context of the EU NEC Directive ceiling
commitments. Impacts of model versions. ETC/ACC Technical Paper 2010/20.
http://acm.eionet.europa.eu/reports/docs/ETCACC_TP_2010_20_Copert2vsCopert4.pdf 38 Euro 1 NOX standards (1992) were fuel neutral. Euro 2 (1996) allows 40% more NOX from new diesel cars than for petrol. 39 Germany reported agricultural soil NOX emissions (NFR sector 4.D) of 110 kt in 2011 (9% of national total NOX); Austria’s was
0.7% of the national total and Luxembourg’s was 1.7% of the national total. 40 Tier 1 default NOX emission factors for biomass combustion in small residential heating installations are 57% higher than for
natural gas or oil. EMEP/EEA Guidebook (2013), section 1.A.4 Small combustion.
http://www.eea.europa.eu/publications/emep-eea-guidebook-2013/part-b-sectoral-guidance-chapters/1-energy/1-a-
combustion/1-a-4-small-combustion

45
Services to assess the reasons for non-compliance of the emission ceilings set in the National Emission Ceilings
Directive – Final Report
2.2.1 Real-world vehicle emissions exceed Euro emission limit values
The failure of the Euro vehicle emission standards for NOx to deliver the expected
emission reductions is a reason cited by all six Member States, and also by the
independent assessment for the six countries. The failure is most prominent for light duty
diesel vehicle (PC & LDV). Petrol vehicles are closer to the standards.
New vehicle models must meet the Euro emission standards to obtain EU type approval.
Emission testing is carried out on a dynamometer that runs a vehicle through a standard
test cycle while exhaust emissions are measured. On-road emission measurements of in-
service diesel vehicles have shown that "real-world" NOx emissions can be considerably
higher than the Euro standards. Exhaust emission factors used for inventory calculations
that were originally based on the Euro emission limit values have had to be revised to
reflect the higher real-world emissions. As a consequence, national NOx emissions from
road transport have increased each time the vehicle emission factors are revised. The
higher real-world emission rates were not foreseen at the time the Gothenburg Protocol
and NECD 2010 ceilings were set (1998-2000) and compound the effect of higher than
expected overall growth in road transport and shift from petrol to diesel vehicles.
The impact of these changes since the ceilings were set has been investigated by the
EEA ETC/ACC topic centre (Ntziachristos and Papageorgiou, 2011). This study
compared national NOx emissions for 2010 calculated by the 1999 RAINS model using
the original exhaust emission factors and projected 2010 transport activity levels with
NOx emissions based on revised emission factors and actual 2010 transport activity and
vehicle fleet composition. Four countries were studied: Germany, France, Netherlands
and Ireland. Table 2-3 shows the estimated NOx emissions attributable to the differences
in road transport activity and exhaust emission factors, from the 1999 RAINS projections
to actual 2010 activity and emission factors (represented by COPERT 4 ver 8.0). The
emission differences are also shown relative to the distance to ceiling in 2010.
Table 2-3 Change in 2010 NOx emissions (fuel sold) from 1999 RAINS projections to actual 2010 road
transport activity and revised exhaust emission factors (COPERT 4 ver 8.0), in comparison
to distance from ceiling in 2010. Adapted from Ntziachristos and Papageorgiou, 2011.
2010 NOx
exceedance
(fuel sold)
NOx difference due actual
2010 vehicle activity level
and fleet composition
NOx difference due to
revised exhaust emission
factors (COPERT 4 v8.0)
Country kt kt % of 2010
exceedance
kt % of 2010
exceedance
France 265.3 -44 -17% +282 +106%
Germany 280.9 +113 +40% +210 +75%
Ireland 13.9 +5 +36% +20 +144%
Netherlands 14.1 0 0% +56 +396%
The impact of activity and fleet differences and emission factor differences varied widely
among the four countries, but the impact of revised emission factors was substantial in all
four cases. For France, Ireland and The Netherlands, the emission factor changes were
larger than the distance to the NOx ceiling in 2010 based on fuel sold, but 75% of the
distance for Germany.
A study of the impact of real-driving Euro 2-5 emission factors for light duty diesel
vehicles was done by Borken-Kleefeld and Ntziachristos, 2012. The issue is also
discussed in EEA, 2012. However, it is not clear from the available studies if the impact of

46
Services to assess the reasons for non-compliance of the emission ceilings set in the National Emission Ceilings
Directive- Final Report
revision of vehicle emission factors was significantly worse for the six Member States
studied in this report compared to other Member States or the EU-27 average.
2.2.2 Road transport growth and dieselification
Unforeseen growth in road transport is indicated as a reason for non-compliance for
Austria, Germany, Ireland and Luxembourg, and unforeseen dieselification of the road
transport fleet is indicated for all six Member States. Both of these factors would
contribute to higher than expected NOx emissions. It is useful to compare the assumed
and actual changes in fuel consumption, with respect to changes experienced by other
Member States and the EU as a whole.
Table 2-4 compares the assumed 1990 to 2010 changes in road transport fuel
consumption (fuel sold) used in 1999 RAINS projections, to the actual changes according
to Eurostat in 2013, for the EU-15 Member States.
Table 2-4 Comparison of 1990 to 2010 changes in road transport fuel consumption (fuel sold) and
diesel share as assumed in 1999 when NECD ceilings were agreed, versus actual changes
in 2010, for the EU-15 Member States. Source: IIASA, 1999; and Eurostat, 2013.
Change in road transport fuel sold, 1990 to 2010 Diesel share in 2010
Assumed change, 1999, % Actual change, Eurostat, % Assumed Actual
Country Petrol Diesel Total Petrol Diesel Total share, % share, %
Austria 14% 54% 32% -31% 200% 62% 52% 74%
Belgium -2% 68% 37% -54% 97% 32% 68% 85%
Denmark -1% -1% -1% -4% 66% 31% 59% 63%
Finland 17% 14% 16% -23% 44% 7% 52% 60%
France 15% 40% 27% -58% 79% 8% 54% 80%
Germany -7% 72% 23% -40% 45% -8% 53% 59%
Greece 116% 102% 109% 55% 53% 54% 45% 42%
Ireland 123% 141% 131% 64% 241% 138% 47% 60%
Italy 38% 12% 23% -25% 42% 11% 52% 69%
Luxembourg 25% 17% 21% -15% 305% 146% 41% 83%
Netherlands 19% 46% 33% 17% 65% 42% 57% 61%
Portugal 125% 63% 88% 1% 160% 87% 52% 75%
Spain 76% 48% 60% -33% 127% 56% 52% 81%
Sweden 35% 2% 21% -23% 96% 13% 34% 52%
UK -7% 79% 24% -39% 79% 0% 52% 59%
EU-15 16% 48% 31% -34% 76% 14% 52% 68%
At the time the ceilings were set, road transport energy growth for the EU-15 was
projected to increase by 31% from 1990 to 2010. The actual growth was only 14% - less
than half the expected growth. There was quite a difference in the growth rates for petrol
and diesel. Gasoline consumption declined by more than one third while diesel fuel
consumption increased 76%. In comparison, EU-15 petrol consumption had been
expected to increase by 16% and Diesel by 48% at the time ceilings were set. The diesel
share of EU-15 road transport fuel consumption in 2010 had been expected to be 52%
47
Services to assess the reasons for non-compliance of the emission ceilings set in the National Emission Ceilings
Directive – Final Report
but was actually 68%. The fuel consumption and diesel share situation in the individual
Member States varied widely from these average levels, as is discussed below.
Austria: Road transport fuel consumption (fuel sold) increased nearly twice as fast
from 1990 to 2010 as foreseen in 1999. Petrol declined 31% instead of
increasing, but diesel increased 200%, nearly four times more than
assumed. The resulting 74% diesel share in 2010 was sixth highest in the
EU-15. The departure of the diesel share in 2010 from the 1999
assumption was the second largest in the EU-15 (74% versus 52%).
Belgium: Road transport fuel consumption (fuel sold) increased slightly less from
1990 to 2010 than assumed in 1999. Diesel consumption increased more
than assumed (97% versus 68%), but not significantly more than other
Member States. The diesel share of 85% in 2010 was the highest among
the EU-15.
France: The diesel share of road transport fuel consumption (fuel sold) increased to
80% in 2010, compared to 54% assumed in 1999 RAINS projections – the
third largest dieselification among the EU-15. The 58% decline in petrol
consumption from 1990 to 2010 was the largest decline among the EU-15.
As a result, total road transport fuel consumption increased less than
assumed in 1999 (8% versus 27%), which more than offset the NOx
increase due to dieselification (see Table 2-3).
Germany: Germany was the only EU-15 State to have an overall decline (-8%) in
road transport fuel consumption (fuel sold) from 1990 to 2010. A 23%
increase had been assumed in 1999. The diesel share in 2010 was 59%,
which is less than the EU-15 average of 68%, but higher than the 53%
share foreseen in 1999. However, diesel consumption by heavy duty
vehicles increased much more than expected (Ntziachristos and
Papageorgiou, 2011). As shown in Table 2-3, the combined increase of
heavy duty vehicle activity and change in fleet composition compared to
the 1999 assumptions accounts for 113 kt of additional NOx in 2010 (40%
of the 2010 exceedance).
Ireland: Ireland had the second highest growth in overall road transport fuel
consumption (fuel sold) among the EU-15. Ireland's 60% diesel share in
2010 was not unusual among the EU-15, but it was much higher than
assumed in 1999. The ETC/ACC study estimated the increase in vehicle
activity and change in fleet composition compared to the 1999 RAINS
assumptions added 5 kt to the 2010 NOx emission (36% of the 2010
exceedance based on fuel sold)
Luxembourg: Growth of road transport fuel consumption (fuel sold) from 1990 to 2010
was 146% compared to the assumed 21%. Diesel fuel consumption
increased three-fold while petrol consumption fell. The diesel share in 2010
was more than twice the share assumed in 1999, with a diesel share
second only to Belgium.
2.2.3 Fuel sold versus fuel used
The NECD, via the UNECE reporting guidelines, requires Member States to report NOx
emissions based on fuel sold, but allows some Parties to use emission inventories based

48
Services to assess the reasons for non-compliance of the emission ceilings set in the National Emission Ceilings
Directive- Final Report
on fuels used when comparing with the ceilings41. Seven Member States (AT, BE, IE, LT,
LU, NL, UK)42 may thus use emissions based on fuel used as the basis for compliance
checking. Four of the six NOX countries in this study (Austria, Belgium, Ireland,
Luxemburg) base compliance with the NECD ceilings on fuel used emissions (for road
transport), while France and Germany are based on fuel sold. Austria, Ireland and
Luxembourg report both fuel sold and fuel used emissions, but Belgium only reports fuel
used emissions. Germany and France report only fuel sold emissions. The fuel basis is
not significant for NH3 emissions.
The difference between fuel sold and fuel used emission varies over time, and can be
quite significant especially for the smaller Member States. Since Belgium only reports
emissions based on fuel used43, the difference between fuel sold and fuel used is not
known.
Table 2-5 compares the fuel sold and fuel used NOX emissions for the three countries
reporting both. The difference between fuel sold and fuel used NOX emissions, labelled
export, represents the emissions estimated to occur outside the Member State from
consumption of fuel bought in the Member State. The difference between fuel sold and
fuel used – known as tank tourism – arises when fuel prices are significantly lower than in
neighbouring countries, and especially in countries with high transit traffic.
Table 2-5 Comparison of fuel sold and fuel used NOX emissions*.
Reported NOX Emission
Member State basis 1990
kt
2005
kt
2010
kt
2011
kt
Austria fuel sold 195.5 237.5 193.2 182.7
fuel used 181.6 169.0 147.5 144.2
export 13.9 68.5 45.6 38.5
% of fuel sold 7% 29% 24% 21%
Ireland fuel sold 122.6 127.4 78.9 70.5
fuel used 128.2 120.9 75.4 67.6
export -5.6 6.5 3.5 2.9
% of fuel sold -5% 5% 4% 4%
Luxembourg fuel sold 41.5** 64.2** 46.1 48.2
fuel used 23.8* 21.4* 17.9 18.0
export 17.7** 42.8** 28.2 30.2
% of fuel sold 43% 67% 61% 63%
* Data from NECD.SUBM12 except NECD.SUBM11 for Luxembourg fuel used 1990 and 2005. ** LU Fuel sold and export
emissions for 1990 and 2005 estimated based on the difference between fuel sold and fuel used emissions reported in
CLRTAP.SUBM13.
The export amounts have varied over time, primarily in response to changing national fuel
tax levels. Since 2005 is the base year for the new Gothenburg Protocol emission
reduction commitments, the fuel sold/fuel used difference in 2005 will be significant for
the future choice of basis for compliance checking in these three countries.
EEA calculates the sum of EU-27 (EU-28) NOX emissions based on the national totals
used for compliance checking, which is a mix of emissions reported by Member States
41 The fuel sold or fuel used basis refers to transport emissions. 42 EEA, 2013. NEC Directive status report 2012. 43 EEA, 2013. NEC Directive status report 2012, Table 2.6.

49
Services to assess the reasons for non-compliance of the emission ceilings set in the National Emission Ceilings
Directive – Final Report
based on fuel used (6 Member States) and fuel sold (21 Member States)44. The export
emissions between Member States reporting on the basis of fuel used and neighbouring
Member States reporting on the basis of fuel sold may therefore not be accounted for in
the EU totals. The export NOX amounts in Table 2-5 total 77 kt in 2010, nearly 1% of the
EU-27 NOX total. This illustrates the potential size of unaccounted NOX emissions at the
EU level due to mixed fuel sold/fuel used reporting.
The fuel sold/fuel used issue must be taken into account when working with energy
statistics, which are normally compiled on the basis of fuel sold within a Member State.
The fuel basis must also be considered when evaluating GAINS model emission
projections, because the GAINS model is based on fuel sold. Since fuel export can vary
significantly over time due to changing fuel price differences, there can be considerable
uncertainty in calculating future fuel used emissions based on GAINS model fuel sold
projections.
2.3 Country-specific issues for NOX non-compliance
In addition to the main reasons listed above the study identifies a number of country-
specific reasons, as listed below Member State by Member State.
Specific observations for Austria
Energy consumption from road transport increased 62% from 1990 to 2010, twice as
fast as assumed in 1999, and the second largest departure from assumed growth
among the EU-15.
The share of diesel cars in Austria increased from 14% in 1990 to 55% in 2010. The
diesel share of passenger car kilometres driven in the country (ie. fuel used basis)
increased from 18% in 1990 to 60% in 2010.
No additional measures beyond measures in existing legislation were proposed in the
National Programmes of 2002 and 2006 despite updated national emission
projections indicating that without additional measures, NOX ceilings would be widely
exceeded.
Specific observations for Belgium
Improved inventory methodology has increased the reported NOX emissions for
199045 by 18% compared to the level reported at the time the ceilings were set,
making the reduction required to meet the fixed ceiling for 2010 larger than was
originally foreseen.
The Walloon and Brussels regions continued using the COPERT III (2002) road
transport emission model until updating to COPERT 4 in 201146. This delayed
introduction of "real world" vehicle emission factors, and underestimated NOX
emissions when developing the National Programme.
Climate policy in the Flemish region promoted the development of decentralized
electricity generation using small cogeneration plants (Combined Heat and Power,
CHP) with a capacity of less than 50 MW that have high specific NOX emissions.
44 EEA, 2013. NEC Directive status report 2012. Technical report No 6/2013, page 23.
http://www.eea.europa.eu/publications/nec-directive-status-report-2012/at_download/file 45 In the 1999 Gothenburg Protocol, the year 1990 is used as the reference year (or "base year") for defining interim
environmental objectives relative to the situation in that year (Article 5), but NECD does not use a base year. 46 Belgium, Informative Inventory Reports under CLRTAP, 2009, 2010, 2011.
50
Services to assess the reasons for non-compliance of the emission ceilings set in the National Emission Ceilings
Directive- Final Report
Specific observations for France
France calculates an increase of 152 kt in 2010 NOX emissions due to the 2007
methodology change from COPERT III to COPERT 4 for road transport emissions
(57% of 2010 exceedance). An ETC/ACC study47 estimates an overall increase of
282 kt NOX in 2010 due to revised exhaust emission factors from COPERT II in use
at the time the ceilings were set as compared to COPERT 4 v8.0 (106% of 2010
exceedance)48.
The diesel share of road transport increased more than was assumed in 1999, but
was offset by total road transport fuel consumption increasing less than expected.
Inventory improvements added emissions from non-road mobile machinery in
industry and agriculture not reported at the time the ceilings were set, and lead to a
reported increase of the 2010 NOX emissions by 39 kt (15% of the 2010
exceedance).
Specific observations for Germany
An increase of 210 kt NOX in 2010 road transport emissions due to revision of
emission factors from COPERT II to COPERT 4 v8.047 (75% of 2010 exceedance)48.
Fuel consumption by heavy duty diesel vehicles increased much more than assumed
in the 1999 RAINS model projections. In spite of an overall 8% decline in road
transport fuel consumption from 1990 to 2010, the increase of heavy duty vehicle
activity and change in fleet composition compared to the 1999 assumptions accounts
for 113 kt of additional NOX in 201047 (40% of the 2010 exceedance).
Increased biomass combustion in energy and manufacturing industries and small
combustion resulted in an additional 106 kt NOX emission in 2010 (38% of the 2010
exceedance).
Changes in inventory methodology lead to the inclusion of NOX emissions from
agriculture (not included at the time the ceilings were set), increasing 2010 emissions
by 99 kt (35% of the 2010 exceedance).
National projections consistently overestimated the expected NOX reductions from
planned and additional measures, masking the need to put additional measures in
place.
Germany notes that during 2010, the inclusion of revised vehicle emission factors in
HBEFA 3.149 and other inventory changes increased reported emission projections for
2010 by about 200 kt/year (71% of 2010 exceedance). Germany also notes that the EU-
level emission standards for non-road mobile machinery were delayed and inadequate,
which delayed and weakened potential NOX reductions in this sector.
Specific observations for Ireland
Reported road transport NOX emissions for 2010 increased by20 kt due to revision of
vehicle emission factors from COPERT II to COPERT 4 v8.047 (192% of 2010
exceedance).
47 Ntziachristos and Papageorgiou, 2011. Table 8, difference between "COPERT 4+New Activity" (v8.0) and "COPERT II+New
Activity" columns. 48 Note: the estimated additional emissions in 2010 can sum to more than 100% relative to the 2010 exceedance, indicating that
the 2010 NOX emissions could have been below the ceiling if all these issues had not arisen. 49 Vehicle emission model HBEFA (www.hebfa.net) was updated to version 3.1 in January 2010, in particular with emission
factors for Euro II-V heavy duty vehicles to reflect real-world driving emissions. COPERT 4 was updated to v8.0 in October
2010 to match the changes in HBEFA 3.1 (Gkatzoflias and Ntziachistos, 2010).

51
Services to assess the reasons for non-compliance of the emission ceilings set in the National Emission Ceilings
Directive – Final Report
Ireland had the second highest growth (138%) in overall road transport fuel
consumption among the EU-15, which was not foreseen at the time when the ceilings
were set.
Economic growth has been much higher than assumed in 1999, particularly in the
construction industry.
Inventory improvements added emission sources that were not included at the time
the ceilings were set, such as from agriculture and national fishing, adding nearly 2 kt
to the 2010 NOX emission (18% of the 2010 exceedance).
Ireland has reported that implementation of emission reduction technologies has
been more successful than projected in 1999, but that this effect has been insufficient
to compensate for the factors leading to higher emissions.
Specific observations for Luxembourg
The population growth rate and economic growth rate have been much higher than
assumed when the ceilings were set.
Commuters living in the border regions around Luxembourg correspond to an
additional 30% of the population. Non-resident commuter traffic was not fully
considered at the time the ceilings were set.
Primary energy consumption in 2010 was 51% greater than assumed when the
ceilings were set.
Luxembourg had the greatest increase in road transport fuel consumption, 373% on
fuel used (146% on fuel sold), from 1990 to 2010 among the EU-15.
Diesel fuel consumption increased 287% (fuel sold50) from 1990 to 2010 - the largest
percentage increase among the EU-15 - while petrol consumption only declined by
15%. The diesel share of the vehicle fleet was as high as 83% in 2010, twice the
share estimated when the ceilings were set.
A new gas-fired 350 MWel co-generation plant began operation in 2002, replacing
electricity previously imported, with NOX emissions corresponding to about 8% of the
2010 exceedance.
Luxembourg has not submitted any national informative inventory reports or national
emission projections for years after 2010, making it more challenging to identify and
adopt compensatory additional measures.
Luxembourg adds that biofuel combustion has doubled during the last decade, with
higher NOX emissions, although not a big impact on overall emissions. Luxembourg
further considers that the default emission factors for small combustion units may
overestimate the real NOX emissions, because they may not reflect the relatively large
proportion of high-efficiency, low-emission units used in Luxembourg due to extensive
new residential and commercial construction.
2.4 Common issues for NH3 non-compliance
Although only two Member States are reviewed regarding NH3, the following three
common issues for NH3 non-compliance have been identified and are discussed below:
50 Eurostat statistics and reporting under the EU GHG Monitoring Mechanism include road transport fuel consumption (TJ) by
fuel type, based on fuel sold, but data is not generally available by fuel type for fuel consumption based on fuel used.

52
Services to assess the reasons for non-compliance of the emission ceilings set in the National Emission Ceilings
Directive- Final Report
Poor quality of activity data for the agricultural sector, including limited information on
livestock populations, manure management systems, etc., largely underestimating
the total activity of the sector and thus underestimating the 1990 NH3 emissions.
Inadequate (too low) emission factors used at the time when the NECD ceilings were
set.
Late and inadequate national measures to reduce agricultural NH3 emissions.
2.4.1 Poor quality of activity data for the agricultural sector
Ammonia emissions estimations for both Finland and Croatia have experienced
significant changes due to the changes (improvements) in quality of the activity data used
for calculation of emissions from agricultural sector. Complex and precise calculations of
emission from agricultural sector (Tier 2 and 3) require detailed information of such
parameters like population of livestock in various age and/or weight groups, manure
management practices, etc.
In the case of Croatia, statistical data was updated to include livestock number split by
categories, which resulted in changes in the total NH3 emissions in agricultural sector.
Finland recognised the need for improvement of agricultural statistics in 2006 and since
then has introduces a model which aims to improve the unsatisfactory activity data quality
and reduce the uncertainty in emission estimations.
2.4.2 Outdated emission factors used at the time of the ceiling negotiations
At the time of emission ceilings negotiation for the Gothenburg Protocol, Croatia relied on
emission factors based on national expert judgement for estimating ammonia emissions
from animal husbandry. These emission factors were several times smaller than the
emission factors recommended by the EMEP/EEA Guidebook. Croatia changed to the
EMEP/EEA Guidebook methodology for NH3 in 2003.
The latest ammonia emission estimations in Finland are performed based on the
specially developed model which takes into consideration most current knowledge on
manure management and ammonia volatilization in Finland. The emissions factors
estimation based on this new approach differ both from the emission factors integrated
into RAINS model and emission factors previously used by Finland, resulting in significant
changes in the recalculated time-series.
2.4.3 Absence or lack of measures other than those implemented at EU level
In relation to measures aimed at reduction of ammonia emissions both Finland and
Croatia have largely relied on existing legislation and EU regulations and policies (mainly
the Nitrate Directive and the Industrial Emissions Directive), with little or no specific
measures developed to address agricultural NH3 emissions.
2.5 Country-specific issues for NH3
Specific observations for Croatia
National NH3 emission factors in use at the time the GP ceilings were set
underestimated NH3 emissions significantly. The fixed 30 kt ceiling requires a 7 kt
(19%) emission reduction from the reported 1990 emission at the time the ceilings
were set, but the improved methodology applied meant that the reduction effort
suddenly tripled to a much more challenging reduction of 21 kt. Although Croatia has

53
Services to assess the reasons for non-compliance of the emission ceilings set in the National Emission Ceilings
Directive – Final Report
reduced annual NH3 emissions by 13 kt, which is nearly twice the reduction foreseen
when the ceiling was set, it is still 7 kt above the ceiling.
National legislation implementing emission ceilings and a National Programme of
emission reductions were adopted as late as 2008. However, the national legislation
established a national NH3 ceiling of 45 kt rather than the GP 30 kt ceiling, and
proposed reduction measures were insufficient to meet the 30 kt ceiling51 set out in
the GP and the NECD.
Croatia also underlines that the political importance given to the agricultural sector means
that only "win-win", cost-effective policy options targeting the period until 2020 for farmers
are politically acceptable.
Specific observations for Finland
Improved inventory methodology for the agricultural sector (emission factors, activity
data and additional source sectors) increased the 2010 NH3 emissions by 6 kt (89%
of the 2010 exceedance) compared to the methodology at the time the ceiling was
set.
No targeted national measures were adopted and planned for reduction of ammonia
emissions. The National Programmes only referred to other EU policies, such as the
Nitrate Directive52, and overestimated the effectiveness of those policies.
Finland continued through 2008 to report national current legislation projections for
2010 equal to the RAINS model projections made at the time the ceilings were set,
showing compliance with the ceiling value in 2010. Improved inventory methodology
was introduced in 2009, but recalculations showing the full impact of the changes
were not completed until 2011 when it was acknowledged that the ceiling would be
exceeded in 2010 and beyond. Updated projections showing non-compliance were
reported in 2012. These signals came very late that the measures in existing
legislation were inadequate and this could have contributed to delays in adopting
compensating measures.
2.6 Common issues on emission inventory methodology and reporting
A number of inventory methodology issues were identified during the study. These do not
necessarily contribute to non-compliance with the NECD ceilings, but can be significant
for the efficient management and monitoring of emission inventories the timely and
reliable provision of information to decision makers responsible for planning and
implementation of policies and measures.
Changes in the emission estimation methodologies, emission factors used and the
number of sectors included in the inventory appears as a critical issue for non-compliance
in most of the countries.
As discussed in section 2.2.1, changes in emission factors for road transport –
corresponding to the increase in NOx emissions for real-world driving conditions
compared to the type-approval emission limit values - was explicitly stated as one of the
51 In August 2013, Croatia adopted a new regulation (OG 108/13) establishing the GP/NECD 30 kt NH3 ceiling and repealing the
national 45 NH3 kt ceiling. The National Programme is to be revised as necessary. 52 Council Directive 91/676/EEC of 12 December 1991 concerning the protection of waters against pollution caused by nitrates
from agricultural sources, http://eur-lex.europa.eu/LexUriServ/LexUriServ.do?uri=CELEX:31991L0676:EN:NOT

54
Services to assess the reasons for non-compliance of the emission ceilings set in the National Emission Ceilings
Directive- Final Report
main reasons for non-compliance with the 2010 NECD emission ceilings by the six
countries concerned. Quantitative estimates of the impact of revised vehicle emission
factors due to Euro failure are available for Austria, Belgium, France, Germany and
Ireland, but the scope of the estimates varies. The available analyses suggest that for
Belgium, France and Ireland, the impact of Euro failure alone could account for all or
most of the NOX exceedance in 2010. No estimates of the impact in Luxembourg are
available.
The situation is similar for the two countries exceeding their ammonia ceilings.
Development of improved methodologies for emission inventories based on the emission
factors presented in the EMEP/EEA Guidebook instead of national emission factors in
Croatia resulted in an increase of emission estimates of up to 40%. This makes the
attainment of the Gothenburg Protocol 2010 emission ceilings very challenging. In
addition, improvements of the quality of the activity data and overall methodology applied
in the estimation of the emissions from the agricultural sector, resulted in the significant
increase of the ammonia emission for the whole time-series. The level of knowledge and
data for calculating NH3 emissions has increased significantly since the time the ceilings
were set, but these improvements have resulted in reporting of significantly higher
emissions.
For all of the countries, it appears that there have been major shortcomings in the
emission projections used for negotiation of the 2010 emission ceilings. This suggests
that inadequate or incorrect activity data and/or inventory methodologies were used at
that time. Only several years after the conclusion of negotiations, when developing the
first National Programmes, some Member States found that even implementation of
additional measures would not be enough to bring the NOx emission level below the
ceilings. Some of the Member States found it very challenging to introduce necessary
additional emission reduction measures, which would be both socially and economically
proportionate.
The issue of emission estimation and assessment based on “fuel used” and “fuel sold”
discussed in 2.2.3 is also a complicating factor for emission inventories and projections
which makes comparisons between the Member States more difficult.
2.7 Common issues on national programmes of reduction measures
The issue of quality and consistency of the National Programmes is an equally important
factor when looking at the reasons for non-compliance. Despite the Commission
guidelines for the development of National Programmes, very few of the eight countries
analysed in this study have followed these guidelines completely. For instance, the lack
of estimates of the emission reductions expected for specific measures hinders analysis
of the impact that individual measures have had in the past. Additionally, the terms
“implemented measures”, “planned measures” and “additional measures” seem to be
interpreted differently by some Member States.
This suggests that the guidance is followed rather loosely by some Member States. The
guidance would be strengthened if key elements of the information to be included when
reporting on national programmes were identified as requirements in a revised NECD.
2.8 Common issues on emission projections
Different interpretations of the guidance on emissions projections were apparent in some
Member States. The interpretation of "business as usual", "with measures" and "with
55
Services to assess the reasons for non-compliance of the emission ceilings set in the National Emission Ceilings
Directive – Final Report
additional measures" varied considerably and the scenarios included in projections also
varied. Although most of the Member States in this study submit IIRs to document their
emission inventories and projections, the documentation of projection methodologies
varies from detailed to almost none. In the context of a revised NECD, additional
requirements and guidance on best practices for preparation, reporting and
documentation of emission projections would be beneficial.
2.9 Differences between the independent assessment and Member State
perceptions
A visual comparison of Table 2-1 and Table 2-2 clearly shows more "green" I+M entries
in the NH3 table than in the NOX table, indicating greater coherence between independent
assessment and the Member State's perceptions for ammonia than for NOX. For NOX
there seems to be somewhat more reasons identified only by the independent
assessment or by the Member State interviews.
An explanation for the additional discrepancies between the independent assessment
and the Member States assessments for NOX can be that the "blame" for some of the
reasons for NOX exceedance is placed on the EU rather than being the Member States'
own responsibility. NH3 emissions do not have that aspect of "external responsibility".
Member States in several instances presented arguments for exceedances that might not
be apparent from the routinely reported inventories and projections alone, such as:
National measures cannot compensate for projection errors or failure of Euro vehicle
standards.
High transit road transport, which is outside national control, and
Few Member States have the capacity to identify the range of national cost-effective
measures to address the gap left by the underperformance of the Euro standards.
There were differences between the independent assessment and Member States' views
regarding the responsiveness of national programmes to compensate for the "failure" of
the Euro emission standards. In a number of cases the independent assessment did not
identify justification for the amount of time elapsed between reporting or projections of
much higher emissions than originally expected and the responses to the developing
patterns evidenced by revisions of policies and measures. The NECD (Article 6) requires
preparation and reporting of a national programme of emission reduction measures in
2002 with updating and revision in 2006. Technically, there was not a requirement for
further revision of the national programmes after 2006, although the binding commitment
to meet the ceilings remains.
Several Member States argue that the full effect of Euro failure was not known until 2010
(COPERT 4 v8.0), too late to respond to it. However, substantial increases in road
transport NOX emissions were seen with the introduction of COPERT III in 2002, the
transition from COPERT III to COPERT 4 (v3.0) in November 2006, and to COPERT 4
v4.0 in October 2007 (revised emission factors for Euro 4 diesel PC). While additional
increases came as late as 2010 (COPERT 4 v8.0), there were earlier warnings of the
increasing departure of road transport NOX emissions from the levels projected at the
time the ceilings were set. In addition to the time required to prepare revised emission
factors, the lag between introduction of new COPERT versions and implementation of the
new versions by the Member States further delays the recognition of increased
emissions.
56
Services to assess the reasons for non-compliance of the emission ceilings set in the National Emission Ceilings
Directive- Final Report
Differences between the independent assessment and the Member States' views of
reasons for NOX exceedances can also be due to the way in the exceedances are
perceived. A given reason can be attributed to uncertainty or incorrect information in the
original projections, unreliable emission factors, trends that were not anticipated, or
developments beyond the control of the Member State. These viewpoints varied among
the Member States interviewed, which may have led to some similar issues for NOX being
compiled under different headings in the long list in Table 2-1, making the correlation to
the independent assessment less clear.
An additional aspect can be that the national contact persons interviewed for Finland and
Croatia were both technical specialists in NH3 emissions, responsible for preparation and
documentation of the NH3 inventories. Thus there was fairly close agreement between
the interviews and the independent assessment of submitted materials. The primary
contact points for the NOX interviews were largely with policy specialists with broader
responsibilities, with technical experts serving a supporting role. Technical specialist and
policy specialists may describe the reasons for differences in different ways, which could
have contributed to some differences in the compilation of reasons between the
independent assessment and the Member States' views for NOX.
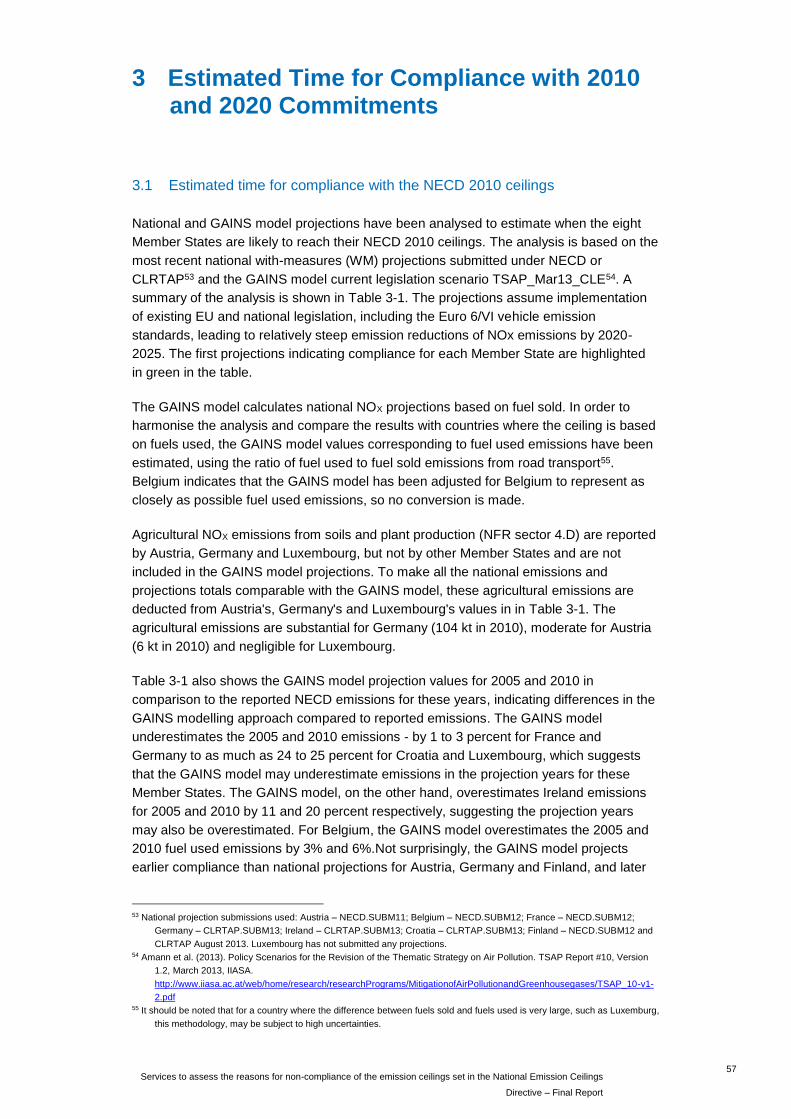
57
Services to assess the reasons for non-compliance of the emission ceilings set in the National Emission Ceilings
Directive – Final Report
3 Estimated Time for Compliance with 2010 and 2020 Commitments
3.1 Estimated time for compliance with the NECD 2010 ceilings
National and GAINS model projections have been analysed to estimate when the eight
Member States are likely to reach their NECD 2010 ceilings. The analysis is based on the
most recent national with-measures (WM) projections submitted under NECD or
CLRTAP53 and the GAINS model current legislation scenario TSAP_Mar13_CLE54. A
summary of the analysis is shown in Table 3-1. The projections assume implementation
of existing EU and national legislation, including the Euro 6/VI vehicle emission
standards, leading to relatively steep emission reductions of NOx emissions by 2020-
2025. The first projections indicating compliance for each Member State are highlighted
in green in the table.
The GAINS model calculates national NOX projections based on fuel sold. In order to
harmonise the analysis and compare the results with countries where the ceiling is based
on fuels used, the GAINS model values corresponding to fuel used emissions have been
estimated, using the ratio of fuel used to fuel sold emissions from road transport55.
Belgium indicates that the GAINS model has been adjusted for Belgium to represent as
closely as possible fuel used emissions, so no conversion is made.
Agricultural NOX emissions from soils and plant production (NFR sector 4.D) are reported
by Austria, Germany and Luxembourg, but not by other Member States and are not
included in the GAINS model projections. To make all the national emissions and
projections totals comparable with the GAINS model, these agricultural emissions are
deducted from Austria's, Germany's and Luxembourg's values in in Table 3-1. The
agricultural emissions are substantial for Germany (104 kt in 2010), moderate for Austria
(6 kt in 2010) and negligible for Luxembourg.
Table 3-1 also shows the GAINS model projection values for 2005 and 2010 in
comparison to the reported NECD emissions for these years, indicating differences in the
GAINS modelling approach compared to reported emissions. The GAINS model
underestimates the 2005 and 2010 emissions - by 1 to 3 percent for France and
Germany to as much as 24 to 25 percent for Croatia and Luxembourg, which suggests
that the GAINS model may underestimate emissions in the projection years for these
Member States. The GAINS model, on the other hand, overestimates Ireland emissions
for 2005 and 2010 by 11 and 20 percent respectively, suggesting the projection years
may also be overestimated. For Belgium, the GAINS model overestimates the 2005 and
2010 fuel used emissions by 3% and 6%.Not surprisingly, the GAINS model projects
earlier compliance than national projections for Austria, Germany and Finland, and later
53 National projection submissions used: Austria – NECD.SUBM11; Belgium – NECD.SUBM12; France – NECD.SUBM12;
Germany – CLRTAP.SUBM13; Ireland – CLRTAP.SUBM13; Croatia – CLRTAP.SUBM13; Finland – NECD.SUBM12 and
CLRTAP August 2013. Luxembourg has not submitted any projections. 54 Amann et al. (2013). Policy Scenarios for the Revision of the Thematic Strategy on Air Pollution. TSAP Report #10, Version
1.2, March 2013, IIASA.
http://www.iiasa.ac.at/web/home/research/researchPrograms/MitigationofAirPollutionandGreenhousegases/TSAP_10-v1-
2.pdf 55 It should be noted that for a country where the difference between fuels sold and fuels used is very large, such as Luxemburg,
this methodology, may be subject to high uncertainties.

58
Services to assess the reasons for non-compliance of the emission ceilings set in the National Emission Ceilings
Directive- Final Report
compliance for Ireland. For France, the GAINS model projections are very close to the
national projections.
Table 3-1 Estimated time for compliance with NECD 2010 ceilings based on the GAINS model CLE
scenario and available national with-measures projections (Nat.) for 2015 to 2030. The
GAINS model projections are compared to reported emissions (Rep.) for 2005 and 2010.
Emissions given in kt/year.
, Reported emissions for previous years, used for
reference, kt Projections, kt
2010 fuel 2005 2010 2015 2020 2025 2030
ceiling basis GAINS Rep. GAINS Rep. GAINS Nat. GAINS Nat. GAINS Nat. GAINS Nat.
NOX
AT 103 sold 229 237 174 192 140 159 99 129 76 65 121
used 163 168 133 147 108 124 82 108 64 56 105
BE 176 sold 300 234 215 174 147 135
used 292 221 200 170
FR 810 sold 1374 1410 1053 1075 847 848 619 620 496 438
DE 1051 sold 1413 1462 1219 1228 991 1076 751 902 615 549
IE 65 sold 142 127 95 79 95 67 86 56 65 47 49
used 135 121 91 75 91 64 82 54 62 45 47
LU 11 sold 48 64 40 46 25 19 12 10
used 14 21 11 18 7 6 4 4
NH3
HR 30 - 29 40 29 38 31 39 32 42 32 33
FI 31 - 34 38 33 38 31 35 31 36 31 31 36
Data sources: GAINS online - scenario: TSAP_Mar13_CLE (current legislation); National emissions and WM
(with measures) projections from NECD and CLRTAP submissions through August 2013.
Notes:
a. For AT, BE, IE and LU, values based on fuel used are the basis for compliance assessment. Calculations of
NOX emissions in the GAINS model are based on fuel sold. The GAINS values based on fuel used are
estimated here based on the fuel used/fuel sold ratio from national emissions or projections in the same
year (AT, IE).
b. For LU, the fuel used/fuel sold ratio for 2011 reported road transport emissions is used to adjust GAINS
model road transport emission values to fuel used basis for all projection years.
c. BE does not report emissions based on fuel sold, so a fuel used/fuel sold ratio cannot be estimated. The
difference between the GAINS value (fuel sold) and national value (fuel used) for 2020 is 4 kt (2%). Belgium
informs that the GAINS model has been adjusted in such a way that it would represent as much as possible
the emissions as estimated in the Belgian inventory based on fuel used, and the actual difference between
fuel used and fuel sold is expected to be larger. The GAINS model values for BE are assumed to represent
fuel used emissions.
d. For AT, DE and LU, NFR (Nomenclature for Reporting) categories 4D1 (emissions from soils) and 4D2
(handling of agricultural products) are deducted from national values for comparability between Member
States and with the GAINS model projections.
e. For LU, fuel sold emissions are about 2½ times larger than fuel used emissions in 2010, making fuel export
emissions (28 kt) larger than the national total emission based on fuel used (18 kt). Without a projection for
fuel export, any conclusion for LU based on fuel sold projections from the GAINS model will be uncertain.

59
Services to assess the reasons for non-compliance of the emission ceilings set in the National Emission Ceilings
Directive – Final Report
Conclusions for NECD 2010 ceilings
One Member State (Ireland) may achieve compliance before 2015 with current
legislation.
Ireland is projected to comply with the NOX ceiling shortly after 2015 by national
projections. The level projected for 2015 has already been reached in 2011, but
Ireland indicates that national NOX emissions in 2012 are likely to increase. The
GAINS model, which overestimates emissions in 2005 (11%) and 2010 (20%),
projects compliance shortly after 2020 with current legislation.
Five Member States (Austria, Belgium, France, Germany and Luxembourg) are likely to
achieve compliance with their NOX ceilings between 2015 and 2020 with current
legislation.
Germany is likely to achieve compliance about 2015.
Belgium and France are likely to achieve compliance between 2015 and 2020.
Austria is likely to achieve compliance before 2020 according to the GAINS model,
but national projections submitted in 2011 do not show compliance through 2030.
Luxembourg has not submitted national projections, and fuel export NOX emissions
are significantly larger than national fuel used emissions and vary over time. For this
purpose, the GAINS model projections (which are based on fuels sold) has been
adapted on the basis of on the fuel used/fuels sold ratio in the case of emissions from
road transport sector as reported in2010, by which the analysis shows compliance
shortly after 2010. This result is however more uncertain than the others.
Two Member States (Croatia, Finland) are not likely to reach compliance with their NECD
2010 NH3 ceilings without significant additional measures beyond current legislation.
Croatia shows continued exceedance through 2030 according to both national and
GAINS model current legislation projections.
Finland shows continued exceedance through 2030 according to national current
legislation projections but just equalling the ceiling in 2015 and thereafter, according
to the GAINS model. However, the GAINS model underestimates Finland's NH3
emissions in 2005 (10%) and 2010 (13%), which may indicate that this projection is
unrealistic.
Additional measures
To assess the technical emission reduction potential for the three countries where
projections indicate compliance with the 2010 ceilings after 2020 (Croatia, Finland), the
GAINS model current legislation projections (the CLE scenario56) were compared with
maximum technically feasible reduction (MTFR57) projections for 2025 in Table 3-2. Cost
figures are not available for 2020 but 2025 values are here used as a proxy for emission
reduction potential and costs for 2020.
56 GAINS current legislation scenario: TSAP_Mar13_CLE 57 GAINS TSAP_Mar13_MTFR_2025 scenario; cost level 2005, 4 % interest rate

60
Services to assess the reasons for non-compliance of the emission ceilings set in the National Emission Ceilings
Directive- Final Report
Table 3-2 Estimated annual compliance costs – 2025, based on GAINS model current legislation (CLE)
and maximum technically feasible reduction (MTFR) scenarios
Emission projections (kt) Cost 2025 (MEUR/year)
NEC2010
ceiling
CLE
2020
CLE
2025
MTFR
2025
Difference 2025
CLE – MTFR
CLE
2025
MTFR
2025
Difference 2025
MTFR - CLE
HR NH3 30 32 32 19 13 n.a. 46.9 46.9
FI NH3 31 31 31 24 7 15.8 64.6 48.8
Source: GAINS online. FU: fuel used basis; FS: fuel sold basis.
Table 3-2 shows that there is considerable scope for Croatia and Finland to reach the
2010 ceilings by 2020 at the latest, by adopting additional measures going beyond
current legislation.
3.2 Estimated time for compliance with the 2020 reduction commitments in the
amended Gothenburg Protocol
Table 3-3 gives an overview of when the GP 2020 reduction commitments are likely to be
reached, based on the same national with-measures projections and the GAINS model
current legislation scenario projections presented in Table 3-1 and subject to the same
uncertainty. The GP 2020 reduction commitments are expressed as percent reductions
relative to the reported emission for reference year 2005. Equivalent target values in
kilotons are shown in the table.
Emission values in the table exclude certain agricultural emissions for consistency with
the GAINS model (see Table 3-1 notes). GAINS model fuel used values are estimated
from the GAINS model fuel sold values using the fuel used/fuel sold ratio of the national
values.
National projections are compared to the target values based on reported emissions in
2005. To partially compensate for under- or overestimation by the GAINS model seen in
Table 3-3, the GAINS model projections are compared to target emissions based on the
GAINS model values for 2005 (the GP base year). The earliest projections showing
compliance with their respective targets are highlighted in green in Table 3-3.
61
Services to assess the reasons for non-compliance of the emission ceilings set in the National Emission Ceilings
Directive – Final Report
Table 3-3 Estimated time for compliance with the 2020 reduction commitments in the 2012
Gothenburg Protocol amendments, based on the GAINS model current legislation scenario
and national with-measures projections (Nat.) for 2015 to 2030. Emissions given in kt/year.
GP 2020 targets, kt Projections, kt
GP 2020 reduction
commitment Based on
GAINS projection for 2005
Based on reported emission for 2005
2015 2020 2025 2030
% fuel
basis GAINS Nat. GAINS Nat. GAINS Nat. GAINS Nat.
NOX
AT 37 sold 144 149 140 159 99 129 76 65 121
used 102 106 108 124 82 108 64 56 105
BE 41 sold 177 215 174 147 135
used 172 200 170
FR 50 sold 687 705 847 848 619 620 496 438
DE 39 sold 862 893 991 1076 751 902 615 549
IE 49 sold 72 65 95 67 86 56 65 47 49
used 69 62 91 64 82 54 62 45 47
LU 43 sold 27 36 25 19 12 10
used 9 12 7 6 4 4
NH3
HR 1 - 29 40 31 39 32 42 32 33
FI 20 - 27 30 31 35 31 36 31 31 36
Data sources and notes: See Table 3-1.
Conclusions for GP 2020 reduction commitments
Except for Austria, there is little difference between fuel sold and fuel used estimates of
time for compliance with the 2020 NOX reduction commitments.
Five Member States (Austria, Belgium, France, Ireland, Luxembourg) are likely to meet
their GP 2020 commitments based on current legislation.
Ireland is projected to comply shortly after 2015 by national projections and reported
emissions in 2011 have already reached the level projected for 2015, but Ireland
indicates that national NOX emissions in 2012 are likely to increase. The GAINS
model projects compliance between 2020 and 2025, with current legislation.
Luxembourg is projected to comply with its GP 2020 commitment before 2015
according to the GAINS model. Luxembourg questions the assumptions used for
these projections, especially regarding transit traffic through Luxembourg.
Austria, Belgium and France are likely to comply with their respective GP 2020
reduction commitments by 2020 at the latest with measures in accordance with
current legislation. The GAINS model current legislation projection based on fuel sold
suggests compliance closer to 2015 for Austria.
Germany would reach its reductions commitments between 2015 and 2020
according to the GAINS model current legislation projections. However, national
projections do not indicate compliance by 2020, suggesting additional measures may
be needed.

62
Services to assess the reasons for non-compliance of the emission ceilings set in the National Emission Ceilings
Directive- Final Report
Two Member States (Croatia, Finland) are not likely to meet their GP 2020 commitments
for NH3 based without additional measures.
Croatia's NH3 emission is below the GP 2020 target through 2015, but rises above
the target after 2015 according to the national projection (with measures scenario).
The GAINS model indicates non-compliance through 2030 based on current
legislation. Based on this analysis, Croatia is not likely to achieve the GP 2020
commitment without additional measures beyond current legislation.
Finland does not appear to reach the target level through 2030 according to both the
national and the GAINS model current legislation projections.
Table 3-2 shows the range of additional reductions and mitigation costs per year in 2025
estimated by the GAINS model associated with technically feasible additional measures
for Croatia and Finland. These measures are largely also applicable for emission
reductions by 2020.

63
Services to assess the reasons for non-compliance of the emission ceilings set in the National Emission Ceilings
Directive – Final Report
4 General Observations and Recommendations
This study of eight cases of non-compliance with the NECD ceilings in 2010 has identified
common denominators as well as country-specific reasons for the exceedances. These
include issues at EU, national and regional levels. This section summarizes key
observations and sets out a number of corresponding recommendations in the context of
a revised NECD.
4.1 Removing disincentives to improved inventory methodology
Fixed kiloton emission ceilings were set in the NECD based on a proposal from the
Commission and the agreed reduction targets in the 1999 Gothenburg Protocol.
Improved emission inventory methodologies, updated and improved emission factors and
the inclusion of new sources have in some cases led to increased reported emissions.
The changed methodology contributes to the non-compliance of several of the Member
States in this study. The NECD provides no mechanism to compensate for this, which
may constitute a disincentive for improving inventories, and could inhibit ambitions for
setting future reduction commitments.
The 2012 Gothenburg Protocol amendments introduce two provisions that can
compensate for increasing emissions due to improvements in methodology – relative
reduction targets and an "adjustment mechanism":
Relative reduction targets maintain a proportional reduction requirement regardless of
whether reported base year emissions increase (or decrease) due to methodology
improvements. Relative targets also cancel out most differences with regard to
emissions based on fuel sold or fuel used.
The GP adjustment mechanism allows parties to propose adjustments in exceptional
circumstances to their emission reduction commitments or to their inventories used
for compliance checking, for non-compliance caused by three types of exceptional
circumstances: 1) inclusion of new emission categories, 2) revised emission factors
due to improved knowledge, and 3) significant changes in methodology since the
commitments were set.
These two provisions will remove earlier barriers to inventory improvements and reporting
of the most scientifically correct emissions, while at the same time alleviating some of the
risks related to uncertainties for emission inventories and projections.
Recommendation 1: Future national commitments for emission reductions under a
revised NECD should be expressed as percentage reductions relative to emissions
in a reference year (as reported at the time of compliance checking). The criteria,
procedures and timetable for checking compliance with the percentage reductions
should be clearly defined.
Recommendation 2: A mechanism should be provided in a revised NECD to enable
Member States to apply for adjustments in exceptional circumstances only to their
emission inventories used for checking compliance, when non-compliance is the
result of certain types of methodology improvements. Guidance should be provided

64
Services to assess the reasons for non-compliance of the emission ceilings set in the National Emission Ceilings
Directive- Final Report
and the process should be transparent. Alignment with the GP adjustment
mechanism should be considered.
4.2 Enhancing the transparency and comparability of emission inventories
The study has encountered issues with some emission inventories which hindered the
assessment of reasons for non-compliance.
A number of "new" source categories have been recognized that were not included in the
RAINS projections made at the time the NECD ceilings were set, including NOX
emissions in the agriculture sector (NFR sector 4.D). However, many Member States do
not estimate the new categories58. Some Member States also do not estimate a
significant number of the "old" categories. EEA59 has estimated the impact of "not
estimated" categories. For most Member States the underestimation is small, but for
others it is a significant percentage of the total emissions. There are default methods for
assessing all categories provided by the joint EMEP/EEA Guidebook. This motivates
strengthening the requirements for completeness of inventory reporting, and to limit
reporting of "not estimated" categories.
The NECD, via the UNECE reporting guidelines, requires Member States to report NOx
emissions based on fuel sold, but allows some Parties to use emission inventories based
on fuels used when comparing with the ceilings60. Seven Member States (AT, BE, IE, LT,
LU, NL, UK)61 may thus use emissions based on fuel used as the basis for compliance
checking. The difference between fuel sold and fuel used emission varies over time, and
can be quite significant especially for the smaller Member States. Belgium only reports
emissions based on fuel used62, so the difference between fuel sold and fuel used is not
known. The possibility to report emissions on the basis of fuel used is inconsistent with
the reporting obligations for climate and energy, which are compiled on the basis of fuel
sold only. The fuel basis is also relevant for GAINS emission projections, because the
GAINS model is based only on fuel sold data. With a change to relative emission
reduction targets, the significance of fuel sold versus fuel used for emission reduction
measures is lessened, enabling reconsideration of permitting compliance checking based
on fuel used.
Basing compliance only on fuel sold emissions remains a problem for smaller Member
States where the transport sector is dominating. Fuel tax differences between
neighbouring States leads to tank tourism, leaving behind an added burden of emissions
based on fuel sold... An adjustment mechanism for inventories taking tank tourism into
account could be considered for exceptional cases as long as the environmental targets
are not compromised.
An Informative Inventory Report (IIR) is essential to document the methodology and
changes in national emission inventories. Most Member States submit an IIR under
CLRTAP, but the NECD does not require an IIR.
58 NECD (via the UNECE reporting guidelines) allows MS to report emissions as "NE" for those sectors where emissions are
known to occur but have not been estimated or reported. 59 EEA, 2013. ibid. 60 The fuel sold or fuel used basis refers to transport emissions. 61 EEA, 2013. NEC Directive status report 2012. 62 EEA, 2013. NEC Directive status report 2012, Table 2.6.

65
Services to assess the reasons for non-compliance of the emission ceilings set in the National Emission Ceilings
Directive – Final Report
Member States report emissions of the four NECD pollutants under the NECD, the
UNECE CLRTAP, and (except for NH3) the UNFCCC and Kyoto protocol, and the
Monitoring Mechanism Regulation63 (MMR) (525/2013) for greenhouse gasses. There are
differences in reporting requirements, submission deadlines, and methodologies. This
motivates further harmonization of reporting requirements among emission instruments
and protocols.
Recommendation 3: A revised NECD should better clarify the methodology and reporting
requirements for emissions, including:
that all source categories have to be reported in accordance with the EMEP
guidelines, reporting templates and EMEP/EEA Guidebook,
that it is made mandatory for all Member States to report road transport emissions
based on fuel sold for all years,
that future reduction commitments and thus reporting of road transport emissions
data be based on fuels sold only, and
that it is made mandatory for all Member States to submit an IIR under the NECD.
Harmonization of methodologies should enable a single IIR document to serve both
the CLRTAP and NECD requirements.
NECD, CLRTAP, UNFCCC and MMR reporting templates include reporting of activity
levels (primarily fuel consumption) associated with emission amounts and projections, for
each source sector. Most Member States report activity data under CLRTAP64
corresponding to reported emissions, but less than half report activity data under
NECD65. Few report projected activity data. Activity data are valuable for interpretation
and monitoring progress of emissions reductions and would make Member State
emissions inventories more transparent. Projected activity data are valuable for
monitoring changes in assumptions for projections.
Activity data to be reported in NECD and CLRTAP templates include fuel consumption by
sector, but there is no breakdown by road transport fuel types (gasoline, diesel, LPG,
etc.). Activity data by fuel type would be very useful for road transport sub-sectors, for
monitoring of changing vehicle fleet composition. MMR templates do include road
transport fuel consumption by fuel type, so these additional activity data in NECD and
CLRTAP templates would contribute to harmonisation of reporting. Aggregate vehicle
mileage is also a useful activity indicator, since road transport emissions in Guidebook
Tier 2 or Tier 3 methodologies are mileage based. Vehicle mileage would permit
calculation of mileage-based indicative emission factors for road transport sub-sectors.
The COPERT 4 software implements the Guidebook's Tier 3 mileage-based emission
methodology for road transport. Two thirds of Member States use various versions of
COPERT 4 to estimate emissions from road transport, and the remaining third use a
variety of other approaches66. Some of the national approaches are based on the same
emission factors as COPERT 4. Some approaches have incorporated new knowledge
about real world vehicle emissions earlier than COPERT, while others are not as up to
date as COPERT. There are few comparisons of the national approaches to the
63 The Monitoring Mechanism Regulation (525/2013) Art. 7.1.b requires Member States to annually report CO, SO2, NOX and
VOC emissions that are consistent with data already reported under NECD and CLRTAP. 64 EEA (2013) EU emission inventory report 1990-2011 under the UNECE Convention on LRTAP. Table A3.1. 65 EEA (2013) NEC Directive status report 2012. Table A3.1 66 EEA (2013). NEC Directive status report 2012, Table 2.6

66
Services to assess the reasons for non-compliance of the emission ceilings set in the National Emission Ceilings
Directive- Final Report
Guidebook approach implemented in COPERT, so the magnitude of differences is not
known. Further harmonization and synchronization of road transport emission
methodologies would improve comparability and compliance checking of emission
inventories.
For Member States where tank tourism is significant (AT, BE, IE, LU), there is an
inconsistency between the requirement to report road transport emissions based on fuel
sold and the Guidebook Tier 3 methodology for road transport (and COPERT software)
that is based on in-country mileage corresponding to fuel used. The Guidebook presently
suggests that the methodology is applicable where "the fuel sold in the region (statistical
consumption) equals the actual consumption of the vehicles operating in the region"67,
which is not true where tank tourism is large. Little guidance is given on reconciling fuel
sold versus fuel used fuel consumption. This is a concern for some Member States,
indicating a need for improved guidance on this topic.
Recommendation 4: NECD guidance should be strengthened to:
encourage Member States using the COPERT software to use the latest available
version in a given reporting year.
promote comparison and harmonisation of national methodologies for road transport
emission estimation.
improve guidance on best practice for calculating road transport emissions due to fuel
export (tank tourism), for Member States where this is significant.
require complete reporting of annual activity data for all inventory years and
projection activity data for all projection years.
include annual reporting of road transport activity data by fuel type (petrol, diesel,
etc.) and also aggregate vehicle mileage.
4.3 Improved national programmes and projections
National programmes of measures for emissions reduction have varied considerably in
content and level of detail. The NECD leaves it to Member States to decide how to
achieve the necessary emissions reductions to meet the ceilings. This study has
encountered national programmes of measures for emissions reduction that are
incomplete, e.g. by omitting estimates of emissions reductions for certain measures or
sectors. This has made it difficult to assess if measures have achieved the intended
reductions, or if the proposed measures were sufficient to meet the ceilings.
Specific requirements for reporting air quality plans are included in the Ambient Air
Quality Directive (2008/50/EC) and the recent Monitoring Mechanism Regulation (MMR)
(525/2013)68 specifies information to be reported on national policies and measures for
GHG emission reduction, every two years. The NECD does not specify what types of
information about policies and measures should be reported in national programmes,
other than quantified estimates of the effects on emissions.
67 EMEP/EEA Guidebook, 2013, section 1.A.3.b.i-iv, page 118 68 Regulation (EU) No 525/2013 of the European Parliament and of the Council of 21 May 2013 on a mechanism for monitoring
and reporting greenhouse gas emissions and for reporting other information at national and Union level relevant to climate
change and repealing Decision No 280/2004/EC. http://eur-
lex.europa.eu/LexUriServ/LexUriServ.do?uri=OJ:L:2013:165:0013:0040:EN:PDF

67
Services to assess the reasons for non-compliance of the emission ceilings set in the National Emission Ceilings
Directive – Final Report
Recommendation 5: More detailed requirements on format and content of national
programmes should be considered for the updated NECD. National programmes
under NECD should be consistent with policies and measures on greenhouse gases,
as reported under the Monitoring Mechanism Regulation (525/2013). Hence updates
and reporting of NECD national programmes every two years should be considered.
Detailed implementation guidelines for the preparation of national programmes
should be prepared to assure that all Member States include the same level of
information, including estimates of the expected emission reduction for all measures.
Revisions to programmes should indicate the progress of existing measures in
comparison to the planned reduction.
This study has encountered national emission inventories and national projections that
are not fully comparable with each other, nor comparable with the GAINS model
projections, due to differences in emission categories and methodology. This makes it
difficult to assess progress toward meeting reduction commitments and to develop policy
on future emission reduction commitments. There are also several cases where national
emission projections have not been updated for several years after major methodology
changes, although there is a requirement under the NECD to annually update and report
projections (for 2010).
Most national emission projections provide only a single "with measures" (WM) scenario,
corresponding to existing legislation69. Few include a "with additional measures" (WAM)
projection that would indicate further reduction potential. Among the Member States in
this study, there are varying interpretations of the meaning of WM and WAM, and the
years for which projections are calculated varies. One Member State studied provides
projections only based on fuel used, which complicates the comparison to the GAINS
model projections or to other Member States' projections based on fuel sold. The
EMEP/EEA Guidebook (2013)70 and proposed revision of the EMEP reporting
guidelines71 align the definitions for reporting with those under MMR, and this
harmonisation should be reflected in a revised NECD.
Recommendation 6: NECD guidance on projections should be strengthened regarding
the definitions and numbers of scenarios, the frequency and years for projections,
fuel basis, assessment of uncertainty, and updating of projections when
methodologies change. The two-year frequency for reporting projections specified in
the MMR72 should be considered. Projections prepared for NECD should be
consistent with projections prepared for CLRTAP and MMR.
4.4 Improved policy coherence
Several Member States have mentioned during this study that implementation of other
EU environmental policies has led to increases in NOX emissions, which have contributed
to Member State non-compliance with the NOX ceilings, demonstrating shortcomings as
regards internal policy coordination in the Member States. For instance, EU climate policy
69 The Commission's draft GHG Projection Guidelines (Coenen et al, 2012) uses the clearer expression "with existing
measures" (WEM) rather than "with measures" (WM) to refer to an existing legislation scenario. This terminology is
adopted in the EMEP/EEA Guidebook (2013) chapter on projections. 70 EMEP/EEA air pollutant emission inventory guidebook 2013, http://www.eea.europa.eu//publications/emep-eea-guidebook-
2013 71 TFEIP (2013) Guidelines for Reporting Emission Data Under the Convention on Long-Range Transboundary Air Pollution
(draft v2). http://tfeip-secretariat.org/assets/Meetings/Documents/2013-TFEIP-Istanbul/UNECE-2014-RepGuidelines-draft-
v2-clean-commented.doc 72 MMR Article 14, Reporting on projections.

68
Services to assess the reasons for non-compliance of the emission ceilings set in the National Emission Ceilings
Directive- Final Report
requires Member States to reduce GHG emissions and some Member States have
created incentives for diesel vehicles as part of their climate policies, which has led to
dieselification of vehicle fleets and increases in NOX emissions from transport. One non-
compliant Member State also noted that climate policy gave incentives to decentralized
electricity production using energy-efficient smaller combustion units (less than 50 MW)
for which EU emission limits did not exist, resulting in increasing NOX emissions.
Associated with climate policy, EU renewable energy policy promotes biomass. Several
Member States have reported increases in NOX emissions due to the shift to biomass,
especially from smaller combustion units with less strict emission limits.
One Member State noted that the EU Emission Trading System (ETS) places a financial
value on CO2 emissions, and a financial penalty for non-compliance. There is to date no
similar valuation or financial penalty for NECD non-compliance. This can cause Member
States to disproportionately prioritize GHG reduction measures, to the detriment of their
other pollutant reduction commitments.
Recommendation 7: Member States should improve policy coherence in the
implementation of interlinked environmental and climate and energy policies, e.g. by
comparing emissions and reduction measures for greenhouse gasses to emissions
and reduction measures of air pollutants. Further development of approaches to
establish equivalence factors or valuations for CO2 and non-GHG pollutants could be
helpful for policy comparisons and coherence. The EU should promote such efforts.
4.5 Unified access to emission information
A wealth of emission data is presently available online under the various protocols, and
has been compiled into various datasets73 that are accessible or downloadable online.
The value of these resources would be enhanced for environmental monitoring,
education and research if the various NECD, CLRTAP and MMR national emission
databases were further harmonised to facilitate access and merging of these data
sources. Harmonisation includes establishment of common structures and encoding of
data. Reported activity data under each legal instrument should be included. Inclusion of
historical submission data (values reported in previous years) in the databases would
also facilitate monitoring of progress and coherence of policies, and review of Member
States' requests for adjustments to reduction commitments or inventories.
Recommendation 8: Publically-accessible databases of reported national emission and
activity data under the various emission instruments and protocols should be further
harmonised (common data definitions and encoding) to facilitate access and
merging of these data sources.
73 For example NECD, CLRTAP and MMR emission datasets at EEA http://www.eea.europa.eu/data-and-maps/data and the
CLRTAP online emission database at EMEP CEIP http://www.ceip.at/webdab-emission-database, which also includes
activity and gridded data.

69
Services to assess the reasons for non-compliance of the emission ceilings set in the National Emission Ceilings
Directive – Final Report
5 Austria
5.1 Introduction
Status of Austria's NOx reduction commitments
Table 5-1 summarises the status in 2010 and 2011 of Austria's commitments for national
NOx emissions under the NECD and the 1999 CLRTAP Gothenburg Protocol, and for the
reduction commitment for 2020 under the 2012 amendments to the Gothenburg Protocol.
The table lists reported emissions in the GP base years 1990 and 2005, and the two most
recent years, 2010 and 2011. Distance to target is given in kt and as a percent of the
target value (ceiling). Austria's NECD and CLRTAP NOx emission totals are identical for
these years in present reporting.
Table 5-1 Overview of Austria's final 2010 and provisional 2011 NOx emission data submitted under
NECD and CLRTAP.
Austria, NOX Fuel sold basis Fuel used basis
emission
distance to target Emission
distance to target
Year (submission year) kt NOX kt NOX % kt NOX kt NOX %
NECD NOX 2010 ceiling 103 103
1990 (NECD.SUBM12) 195.5 92.5 89.8% 181.6 78.6 76.3%
2010 (NECD.SUBM12) 193.2 90.2 87.5% 147.5 44.5 43.2%
2011 (NECD.SUBM12) 182.7 79.7 77.4% 144.2 41.2 40.0%
CLRTAP NOX 2010 ceiling 107 107
1990 (CLRTAP.SUBM13) 195.5 88.5 82.7% 181.6 74.6 69.7%
2010 (CLRTAP.SUBM13) 193.2 86.2 80.5% 147.5 40.5 37.9%
2011 (CLRTAP.SUBM13) 182.7 75.7 70.8% 144.2 37.2 34.8%
CLRTAP NOx 2020 reduct. 37% 149.6 106.5
2005 (CLRTAP.SUBM13) 237.5 87.9 58.7% 169.0 62.5 58.7%
2010 (CLRTAP.SUBM13) 193.2 43.5 29.1% 147.5 41.1 38.6%
2011 (CLRTAP.SUBM13) 182.7 33.1 22.1% 144.2 37.8 35.5%
* Austria has not ratified the 1999 Gothenburg Protocol
Austria reports emissions both on the basis of fuel sold and fuel used, and bases
compliance with the 2010 ceilings on fuel used emissions. Austria's fuel used NOx
emission was 43% above the 103 kt NECD ceiling in 2010 and 40% above in 2011. NOX
emission declined by 34 kt (33% of the ceiling) from 1990 to 2010, and by 3 kt (3% of the
ceiling) from 2010 to 2011.
NOx emissions based on fuel sold have been much higher than based on fuel used,
reflecting high levels of "tank tourism" due to relatively low fuel prices in Austria compared
to neighbour countries. The difference between fuel sold and fuel used emissions was 46
kt in 2010 and 39 kt in 2011.
Austria agreed to a 5 kt lower NOx ceiling under the NEC Directive compared to the 1999
CLRTAP Gothenburg Protocol ceiling. Austria has not ratified the 1999 Gothenburg
Protocol, but has continued to report emissions to the CLRTAP.

70
Services to assess the reasons for non-compliance of the emission ceilings set in the National Emission Ceilings
Directive- Final Report
Austria's NOX reduction commitment under the Gothenburg Protocol 2012 amendments
is for a 37% reduction between 2005 and 2020. This was based on respecting the
existing 2010 NOx ceiling in the NECD (103 kt) in 2020, based on the 2005 emission
reported at the time the commitments were set. The reported emission for 2005 has risen
slightly since then, resulting in a current 2020 NOx target of 150 kt fuel sold and 107 kt
fuel used (shown in grey in the table).
Fuel sold emissions have declined sharply from 2010 to 2011 compared to fuel used
emissions, making Austria closer to the 2020 target based on fuel sold than based on fuel
used. This suggests that tank tourism has declined rapidly, and may continue to do so in
future.
Summary of conclusions
The main reasons for Austria's non-compliance with the NECD 2010 NOx ceiling are:
NOX emissions from road transport are much higher than expected due to vehicle
NOX emissions (primarily diesel) under real-world driving conditions being much
higher than expected for Euro 1-5/I-V standards. Euro 1-2/I-III vehicles alone were
estimated to account for about 9 kt more NOX in 2010 than projected in 1999 (20% of
Austria's exceedance).
Energy consumption from road transport increased 62% from 1990 to 2010, twice as
fast as assumed in 1999, and the second largest departure from assumed growth
among the EU-15. The number of passenger vehicles increase 48% from 1990 to
2010, a relatively large increase.
Diesel fuel consumption increased 200% from 1990 to 2010, a rate of increase nearly
four times larger than assumed in 1999, while petrol consumption declined 31%. The
share of diesel cars in Austria increased from 14% in 1990 to 55% in 2010. The
diesel share of passenger car kilometres driven in the country (ie. fuel used basis)
increased from 18% in 1990 to 60% in 2010. The resulting dieselification – the
increase in diesel share – was the second highest among the EU-15. Diesel NOX
emission factors are higher than for petrol.
No additional measures beyond measures in existing legislation were proposed in the
National Programmes of 2002 and 2006 despite updated national emission
projections indicating that without additional measures, NOX ceilings would be widely
exceeded.
Increased consumption of biofuels due to climate and renewable energy policies has
led to higher NOX emissions.
The outlook for compliance with the NECD 2010 ceiling and the CLRTAP 2020 target is:
Austria is likely to achieve compliance with the NECD 2010 ceiling between 2015 and
2020 with measures in accordance with current legislation.
Austria is likely to comply with its respective CLRTAP 2020 reduction commitment by
2020 with measures in accordance with current legislation. The GAINS model current
legislation projection based on fuel sold suggests compliance closer to 2015.
The reasons for non-compliance and estimation of time for compliance are discussed in
the following sections.

71
Services to assess the reasons for non-compliance of the emission ceilings set in the National Emission Ceilings
Directive – Final Report
5.2 Independent assessment
Legislation, National Programmes and policies and measures
In the context of NECD, Austria agreed to limit its annual nitrogen oxides (NOx)
emissions to 103 kt by 2010. The NECD ceiling is 4 kt lower than the 107 kt ceiling
defined in the context of CLRTAP. However, Austria has not ratified the Gothenburg
Protocol. The NEC Directive (2001/81/EC) has been transposed into the Austrian national
legislation by the Emissionshöchstmengengesetz-Luft (EG-L), BGBl I Nr. 34/2003 (Law
on Emission Values), which explicitly sets the emission ceiling for Austria in accordance
with the targets defined under the NECD.
Projections made at the time the NECD ceilings were set (RAINS model REF scenario74)
showed that Austria would achieve its 2010 NOx emission ceiling with measures in
current EU and national legislation at that time.
The first National Programme (December 2002) developed under NECD presented only
emission reduction measures already adopted prior to the transposition of NECD, with
measures generally referring to the relevant EU Directives. Projections presented in the
Programme suggested that under “Business-as-usual” scenario (“with existing measures”
or "under current legislation"), Austria would exceed its NOx ceiling by 47 kt in 2010. A
study to identify potential additional measures was commissioned, which concluded that
even with implementation of these additional measures, Austria would exceed the NOx
ceiling by 38 to 40 kt in 2010.
The revised programme of 2006 provided an updated list of measures, most of which
were already implemented and were mainly of regulatory nature. It was estimated that
implementation of these measures would reduce NOx emission by 25 kt by 2010, which
would still lead to an exceedance of some 34 kt in 2010.
In 2010, Austria developed a second updated National Programme. This programme
presented emission reduction measures already in place in much more detail as well as
included a number of additional specific measures and policies aimed to reduce NOx
emissions. Implementation of the additional measures was expected to reduce NOx
emissions in 2010 by 11 kt (of which 7 kt in transport sector), and by an additional 1 kt in
2015. However, it is also noted that these additional measures would still not be sufficient
to achieve the 2010 NECD ceiling for NOx before 2015. The programme also stated that
changes in the emission factors for diesel cars resulting from poor real world driving
performance of Euro standards lead to the increase in NOx emissions for year 2010 of 9
kt. However, this change explains only 20% of 2010 NOx emission exceedance.
Methodology, reported emissions and emission projections
Compliance with both the NECD and the GP emission ceilings for Austria is assessed
based on “fuel used”, taking into consideration a significant impact of “fuel tourism”. This
is in line with special provisions for Austria and several other countries75 to avoid unfair
impacts from so-called “tank tourism”. However, the informative inventory report (IIR) also
provides information on emissions based on “fuel sold”. Assessment of road transport
74 IIASA Seventh Interim Report, 1999, available from: http://www.iiasa.ac.at/~rains/reports/ir7.pdf 75 For the following countries compliance with NECD ceilings is assessed based on “fuel used”: Austria, Belgium, Ireland and
Luxembourg.

72
Services to assess the reasons for non-compliance of the emission ceilings set in the National Emission Ceilings
Directive- Final Report
emission in Austria is done using GLOBEMI and ARTEMIS76 models. For off-road
transport emission modelling the GEORG emission model is utilised.
Figure 5-1 Major NOX contributing sectors (left scale, kt) and national total NOX emissions in Austria
(right scale, kt), based on fuel used, CLRTAP 2012
The time series of national and major sector NOX emissions from 1990 to 2010 is shown
in Figure 5-1. Overall emissions were reduced by 19% from 1990 to 2010 based on fuels
used, and 1% based on fuels sold. In 2010, the road transport emissions based on fuels
used accounted for approximately 45% per cent of the total emissions. The greatest
emission reduction from 1990 to 2010 of 15 kt (33%) was achieved in passenger car
transport followed by heavy duty vehicles with the reduction of 5 kt (or 14%). These
reductions were achieved despite the fact that the number of registered passenger cars
in Austria has constantly increased during the past 2 decades, with the proportion of
diesel cars increasing from 13.7% in 1990 to 55% in 201077 (see Figure 5-2), and the
dominance of road vehicles in passenger and freight transportation modal splits remained
unchanged.
Activity data used for RAINS model projection development78 suggested that under the
baseline scenario in 2010, 3272 thousand TOE of diesel fuel will be used by transport
sector in Austria; according to Eurostat in 2010, 5396 thousand TOE of diesel fuel were
consumed in transport sector, 64% more than foreseen. Activity data projections used in
76 Austria’s Informative Inventory Report (IIR) 2012, available from:
http://www.umweltbundesamt.at/fileadmin/site/publikationen/REP0380.pdf 77 In 2010 EU-27 average was 31.6% according to the Eurostat data (data for 17 countries was available). 78 IIASA 1998 6th Interim Report, available from: http://gains.iiasa.ac.at/reports/pre-2002/6th interim a2.pdf
0
20
40
60
80
100
120
140
160
180
200
0
2
4
6
8
10
12
14
16
NO
x e
mis
sio
n, k
t
NO
x em
issi
on
s, k
t
YearStationary combustion in manufacturing industries and construction: Other (1 A 2 f i)
Residential: Stationary plants (1 A 4 b i)
Public Electricity and Heat Production (1 A 1 a)
Total
Transport: fuel used (1 A 3)

73
Services to assess the reasons for non-compliance of the emission ceilings set in the National Emission Ceilings
Directive – Final Report
RAINS modelling79 suggested that total energy consumed in transport sector (petrol and
diesel only) will increase by 32%. The latest Eurostat data shows this increase amounted
to 62% (petrol and diesel only).This indicates that while the sector has not achieved as
significant NOx reductions as in other countries (e.g. in Germany emissions from
passenger cars decreased by 74% and in Ireland by 61%), technological improvements
have to some extent compensated for the significant increase in the number of cars.
A comparison of fuel prices with neighbouring countries shows that fuel prices were
historically lower in Austria due to lower fuel taxes. This has led to significant levels of
“fuel tourism”, meaning that road transport NOx emission calculated based on fuels sold
include emissions from exported fuel. However, this effect is neutralised with regard to
Summary NECD and GP compliance by the possibility to use fuel used as a basis for
compliance checking.
Figure 5-2 Number of diesel and petrol passenger cars registered annually in Austria (left scale) and
the total number of vehicles (right scale) (EUROSTAT data)
The reasons for Austria's non-compliance with the NECD 2010 NOx ceiling are
summarised in Table 5-2. The contribution to the exceedance is given where it can be
estimated.
79 IIASA 1998 6th Interim Report, available from: http://gains.iiasa.ac.at/reports/pre-2002/6th interim a2.pdf
0
500
1000
1500
2000
2500
3000
3500
4000
4500
5000
0
500
1000
1500
2000
2500
3000
Tota
l: 1
00
0s
of
veh
icle
s
By
en
gin
e t
ype
: 1
00
0s
of
veh
icle
s
Year
Total Diesel cars Petrol cars

74
Services to assess the reasons for non-compliance of the emission ceilings set in the National Emission Ceilings
Directive- Final Report
Table 5-2 Main reasons for Austria's non-compliance with the NECD 2010 NOx ceiling, based on the
independent assessment. Quantified contribution to exceedance is given in kt and percent
where possible.
Contribution to
44.5 kt
Reason kt NOx %
Euro standard performance for diesel cars: Overestimation of 2010
reductions from road transport due to poor real world driving performance of
Euro standards (Euro I-III and Euro 1-2)
980 20
Increase in the total number of passenger cars:
- Significant increase in the number of passenger vehicles: 48% from
1990 to 2010 compared to 36.5% in BE, 38% in DE, 40% in NL, 37% in
UK81
- Significant increase in the total energy consumption in transport sector:
63% from 1990 to 2010 compared to 29% total in EU-27
Unexpectedly high “dieselification” of road transport fleet: Increase in
proportion of diesel cars from 14% in 1990 to 55% in 2010. 2010 Baseline
activity projection used in RAINS82 underestimated diesel fuel consumption by
transport sector in 2010 by 64% or 2124 thousand TOE.
Increase e.g. due to:
- Lower diesel prices compared to petrol prices
- Fiscal policy favouring vehicles with lower fuel consumption and lower
CO2 emissions
Unexpected increase in energy consumption: In 1998 National activity data
projection (used in RAINS modelling83) underestimated energy consumption in
2010
- Primary energy consumption was expected to increase by 14% from
1990 to 2010; the actual increase was 38%
- Energy consumed in transport sector was expected to increase by
32%; actual increase amounted to 62% (diesel and petrol only)
Inadequate emission scenarios at the time of setting the ceilings: in 1999
RAINS REF84 scenario projected that the ceiling (103 kt) could be achieved by
2010 with existing measures in current legislation at the time.
- The reported 1990 emission has not changed significantly, so the issue
is mainly related to incorrect activity projections.
80 Programm der österreichischen Bundesregierung zur Einhaltung der nationalen Emissionshöchstmengen für bestimmte
Luftschadstoffe gemäß § 6 Emissionshöchstmengengesetz-Luft (2010). 81 Due to incomplete data available from Eurostat is it impossible to adequately estimate EU-27 average. 82 IIASA 1998 6th Interim Report, available from: http://gains.iiasa.ac.at/reports/pre-2002/6th interim a2.pdf 83 IIASA 1998 6th Interim Report, available from: http://gains.iiasa.ac.at/reports/pre-2002/6th interim a2.pdf 84 IIASA Seventh Interim Report, 1999, available from: http://www.iiasa.ac.at/~rains/reports/ir7.pdf

75
Services to assess the reasons for non-compliance of the emission ceilings set in the National Emission Ceilings
Directive – Final Report
Contribution to
44.5 kt
Reason kt NOx %
Late and inadequate implementation measures: Despite updated national
emission projections indicating that without additional measures, NOx ceilings
would be exceeded in 2010, no additional measures were proposed in National
Programmes of 2002 or 2006 beyond the existing legislation. Only the updated
National Programme of 2010 proposed additional measures, which still would
not be enough to reach the target before 2015.
Adopted fuel tax policy made fuel prices in Austria significantly lower
compared to neighbouring countries: this stimulated “tank tourism”– NOx
emissions estimated based on fuel sold are 31% higher than emissions based
on fuel used.
5.3 Main reasons for non-compliance as identified by Austria
The reasons for Austria's non-compliance with the NECD 2010 NOX ceiling are
summarised in Table 5-3. This is based on a telephone interview 12 December 2012 and
subsequent email correspondence with an official of the Federal Ministry of Agriculture,
Forestry, Environment and Water Management. Official correspondence between the
Ministry and the Commission in 2010, 2011 and 2012 regarding non-compliance with the
NECD ceiling and revision of the Gothenburg Protocol was also reviewed.
Table 5-3 includes any Austrian estimates of NOX amounts attributable to specific issues
that were provided during the interview. The preceding section on the independent
assessment includes additional estimates of these contributions calculated by this study
based on various sources, including Austrian submissions and reports.
Table 5-3 Reasons for Austria's non-compliance with the NECD 2010 NOX ceiling as identified by
Austria. Quantified contributions to NOX emission exceedance are given in kt and percent,
where provided by Austria.
Contribution
Reason kt NOX %
The failure of Euro I-III (HDV) and Euro 1-2 (LDV) diesel standards was
already known in 2006 to give 10 kt higher NOx emission than assumed when
the ceiling was set.
10 22%
The share of diesel cars in Austria increased from 14% in 1990 to 55% in
2010. The share of vehicle kilometres driven in the country (ie. fuel used
basis) by diesel cars increased from 18% in 1990 to 60% in 2010, which had
not been anticipated when the ceilings were set (figures based on cars only,
without light and heavy duty vehicles).
About 60% of Austria's NOx emissions are from mobile sources for which
emission limits have been set on the EU level.

76
Services to assess the reasons for non-compliance of the emission ceilings set in the National Emission Ceilings
Directive- Final Report
Contribution
Reason kt NOX %
The 1999 RAINS emission projections on which the NECD ceiling was based
were overly optimistic and were not a good basis for defining a realistic and
implementable emission target for Austria (underestimation of activities and
overestimation of the effect of technology).
The 1999 RAINS projections indicated that measures in existing legislation
would be sufficient to meet the ceiling by 2010.
The large gap between projected emissions and real emissions could not be
compensated by proportionate measures. The 40% gap between the 1999
projection and the actual 2010 NOX emissions corresponds to total NOX
emissions from power plants and manufacturing industries, or to emissions
from cars plus residential heating.
Austria is a transit country and cannot restrict international mobility. Decisions
of the European Court have confirmed the priority of the free movement (road
transport) of goods over environmental considerations. The increase in transit
road transport has contributed to higher NOX emissions.
Increasing use of biofuels is an important part of GHG reduction policy and
renewable energy policy, including in plants that are part of the EU CO2
emission trading system. The share of biogenic fuels in energy transformation
input increased from 1% in 1990 to 10% in 2010. In manufacturing industries,
the share of biogenic fuels in final energy consumption increased from 10% to
15%. Biofuels generally have higher NOx emissions.
Regarding NOX emission reduction measures implemented between 2000 and 2010,
Austria notes that it was very difficult to get a consensus on a complete set of measures
for a national programme, especially due to the fact that reduction demand increased
continuously with new measurement data from vehicle testing and with new projections.
The programme of February 2010 comprises several measures that had started earlier:
Various tax measures, for example, had been implemented in 2007, mileage based road
toll for heavy duty vehicles had been implemented in 2004. The new emission abatement
installation of the refinery started operation in 2007, and the decision for that installation
was of course taken much earlier. Measures for mobility management and
environmentally sound transport started in 2004 and were later continued under the
programme title “klima:aktiv mobil”. Technical standards and subsidies to improve the
energy efficiency of buildings were introduced or optimised in the last decade (under the
jurisdiction of the Federal Provinces).
5.4 Expected time of compliance with the 2010 Ceilings
On the basis of recent emission projections from the GAINS model (CLE current
legislation scenario) and the available national projections (submitted in 2011) shown in
Table 5-4, an estimate was made for when Austria may reach its 2010 ceiling.

77
Services to assess the reasons for non-compliance of the emission ceilings set in the National Emission Ceilings
Directive – Final Report
Table 5-4 Summary of projection analysis on the year for Austria to attain the NECD 2010 NOX ceiling
(103 kt, fuel used). Emissions in kt/year – fuel sold (fuel used based emissions in brackets)
, Reported emissions for previous
years, used for reference, kt Projections, kt
2010 fuel 2005 2010 2015 2020 2025 2030
ceiling basis GAINS Rep. GAINS Rep. GAINS Nat. GAINS Nat. GAINS Nat. GAINS Nat.
103 sold 229 237 174 192 140 159 99 129 76 65 121
used 163 168 133 147 108 124 82 108 64 56 105
Data sources: GAINS online - scenario: TSAP_Mar13_CLE (current legislation); National emissions and WM
(with measures) projections from NECD and CLRTAP submissions through March 2013.
Notes:
a. Values based on fuel used are the basis for compliance assessment.
b. Calculations of NOX emissions in the GAINS model are based on fuel sold. The GAINS values based on
fuel used are estimated here based on the fuel used/fuel sold ratio for road transport emissions from
national emissions or projections in the same year.
c. NFR categories 4D1 (emissions from soils) and 4D2 (handling of agricultural products) are deducted from
the national values to enable comparison with the GAINS model projections.
Conclusion for NECD 2010 ceiling
Austria is likely to achieve compliance with its NECD 2010 NOX ceiling between
2015 and 2020 with measures based on current legislation.
5.5 Impact on future reduction commitments
Table 5-5 gives an estimation of when the GP 2020 ceilings is likely to be reached, based
on the latest available national emission projections and the results of GAINS model
projection (scenario: TSAP_Mar13_CLE (current legislation)). Comparisons are based on
reductions from the GP base year emissions for 2005. The target for national projections
is based on the reported 2005 emission. To minimize the effect of any GAINS model bias,
while the target for GAINS model projections is based on the GAINS model estimates for
2005 emissions.
Table 5-5 Estimated compliance period – Gothenburg protocol (GP) – Austria. Emissions in kt/year –
fuel sold.
GP 2020 targets, kt Projections, kt
GP 2020 reduction
commitment Based on
GAINS projection for 2005
Based on reported emission for 2005
2015 2020 2025 2030
% fuel
basis GAINS Nat. GAINS Nat. GAINS Nat. GAINS Nat.
37 sold 144 149 140 159 99 129 76 65 121
used 102 106 108 124 82 108 64 56 105
Data sources: GAINS online - scenario: TSAP_Mar13_CLE (current legislation); National emissions and WM
(with measures) projections from NECD and CLRTAP submissions through March 2013.
Notes: see notes under Table 5-4.
Conclusion for GP 2020 reduction commitment
Based on the analysis made, Austria is likely to comply with its GP 2020 reduction
commitment by 2020 with measures in accordance with current legislation. The
GAINS model current legislation projection based on fuel sold suggests
compliance closer to 2015.

78
Services to assess the reasons for non-compliance of the emission ceilings set in the National Emission Ceilings
Directive- Final Report

79
Services to assess the reasons for non-compliance of the emission ceilings set in the National Emission Ceilings
Directive – Final Report
6 Belgium
6.1 Introduction
Status of Belgium's NOx reduction commitments
Table 6-1 summarises the status in 2010 and 2011 of Belgium's commitments for national
NOx emissions under the NECD and the 1999 CLRTAP Gothenburg Protocol, and for the
reduction commitment for 2020 under the 2012 amendments to the Gothenburg Protocol.
The table lists reported emissions in the GP base years 1990 and 2005, and the two most
recent years, 2010 and 2011. Distance to target is given in kt and as a percent of the
target value (ceiling). Belgium's NECD and CLRTAP NOX emission totals are identical for
1990, 2005 and 2010 in present reporting, but there is a small difference (0.058 kt)
between the NECD and CLRTAP preliminary values for 2011 (not visible in the table).
Table 6-1 Overview of Belgium's final 2010 and provisional 2011 NOx emission data submitted under
NECD and CLRTAP.
Belgium, NOX Fuel sold basis Fuel used basis
emission distance to target emission distance to target
Year (submission year) kt NOX kt NOX % kt NOX kt NOX %
NECD NOX 2010 ceiling 176 176
1990 (NECD.SUBM12) 401.5 225.5 128.1%
2010 (NECD.SUBM12) 220.7 44.7 25.4%
2011 (NECD.SUBM12) 210.1 34.1 19.4%
CLRTAP NOX 2010 ceiling 181 181
1990 (CLRTAP.SUBM13) 401.5 220.5 121.8%
2010 (CLRTAP.SUBM13) 220.7 39.7 22.0%
2011 (CLRTAP.SUBM13) 210.1 29.1 16.1%
CLRTAP NOX 2020 reduct. 41% 172.1
2005 (CLRTAP.SUBM13) 291.8 119.6 69.5%
2010 (CLRTAP.SUBM13) 220.7 48.6 28.2%
2011 (CLRTAP.SUBM13) 210.1 37.9 22.0%
Belgium reports only emissions based on fuel used to both NECD and CLRTAP, although
the UNECE Guidelines on Reporting require reporting of emissions based on fuel sold.
Belgium has chosen to base compliance with the 2010 ceilings on fuel used emissions.
Belgium's NOX emission based on fuel used was above the 176 kt NECD ceiling by 45 kt
(25%) in 2010, and 34 kt (19%) above in 2011. NOx emission declined nearly 11 kt (24%)
from 2010 to 2011, and 191 kt (45%) from the 1990 base year to 2011.
Belgium agreed to a 5 kt lower NOX ceiling under the NEC Directive compared to the
CLRTAP Gothenburg Protocol ceiling. For the 2012 Gothenburg Protocol amendments,
Belgium agreed to a 41% NOX reduction by 2020 from the base year 2005. This is
equivalent to a 2020 NOX target of 172 kt based on the currently reported 2005 fuel used
emission. This 2020 target is 4 kt (2%) lower than the NECD 2010 ceiling.
Summary of conclusions
The main reasons for Belgium's non-compliance with the NECD 2010 NOx ceiling are:

80
Services to assess the reasons for non-compliance of the emission ceilings set in the National Emission Ceilings
Directive- Final Report
Vehicle NOX emissions (primarily diesel) under real-world driving conditions are much
higher than expected for Euro 1-5/I-V standards. Belgium has estimated an additional
NOX emission of 54 kt (121% of the 2010 exceedance) due to vehicle emission factor
changes since the 1999 projections.
Improved inventory methodology has increased the 1990 base year NOX emission by
14% compared to the value used in the 1999 RAINS projections, and 18% compared
to the 2001 NECD submission. A 14% base year increase effectively adds an
additional 51 kt NOX reduction needed to meet the fixed 2010 ceiling (113% of the
2010 exceedance);
Inventory improvements have added emission sources in the off-road transport sector
not reported at the time the ceilings were set: SSS (heavy fuel oil), off-road
construction and industry vehicles and other off-road sources. These give 16 kt
additional NOX emission in 2010 (36% of the 2010 exceedance);
Diesel fuel consumption (fuel sold) and the diesel share of road transport increased
from 1990 to 2010 more than expected in 1999, although the differences were near
average for the EU-15. Belgium was projected to have the highest diesel share
among the EU-15 (68%), but the actual share in 2010 was even higher (85%);
The regions did not all update their versions of COPERT when new "real world"
emission factors were introduced, which lead to underestimation of vehicle NOX
emissions when the National Programmes of measures were developed;
Delayed update of the transport emission estimation methodologies and hence
underestimated emission projections: The 2006 National Programme based emission
projections on RAINS emission factors without taking into consideration improved
methodologies and available information on Euro standards real world driving
performance leading to underestimation of emission projections for 2010 by about 57
kt (34% of the 2010 NECD NOx ceiling, or 128% of the 2010 exceedance).
Climate policy in stationary engine legislation (less than 50 MW) in the Flemish region
stimulated decentralized electricity generation using small cogeneration plants (CHP)
with high specific NOx emissions. Emission limit values have now been strengthened.
The outlook for compliance with the NECD 2010 ceiling and the CLRTAP 2020 target is:
Belgium is likely to achieve compliance with its NECD 2010 ceiling between 2015 and
2020 with current legislation.
Belgium is likely to comply with their respective CLRTP 2020 reduction commitment
by 2020 at the latest with measures in accordance with current legislation.
The reasons for non-compliance and estimation of time for compliance are discussed in
the following sections.
6.2 Independent assessment
Legislation, National Programmes and policies and measures
In Belgium, the NECD was not transposed on the Federal level but integrated in the
regional legal systems individually by each of the regions. In order to reach national
NECD targets, the national ceilings had been divided into a national sub-ceiling for
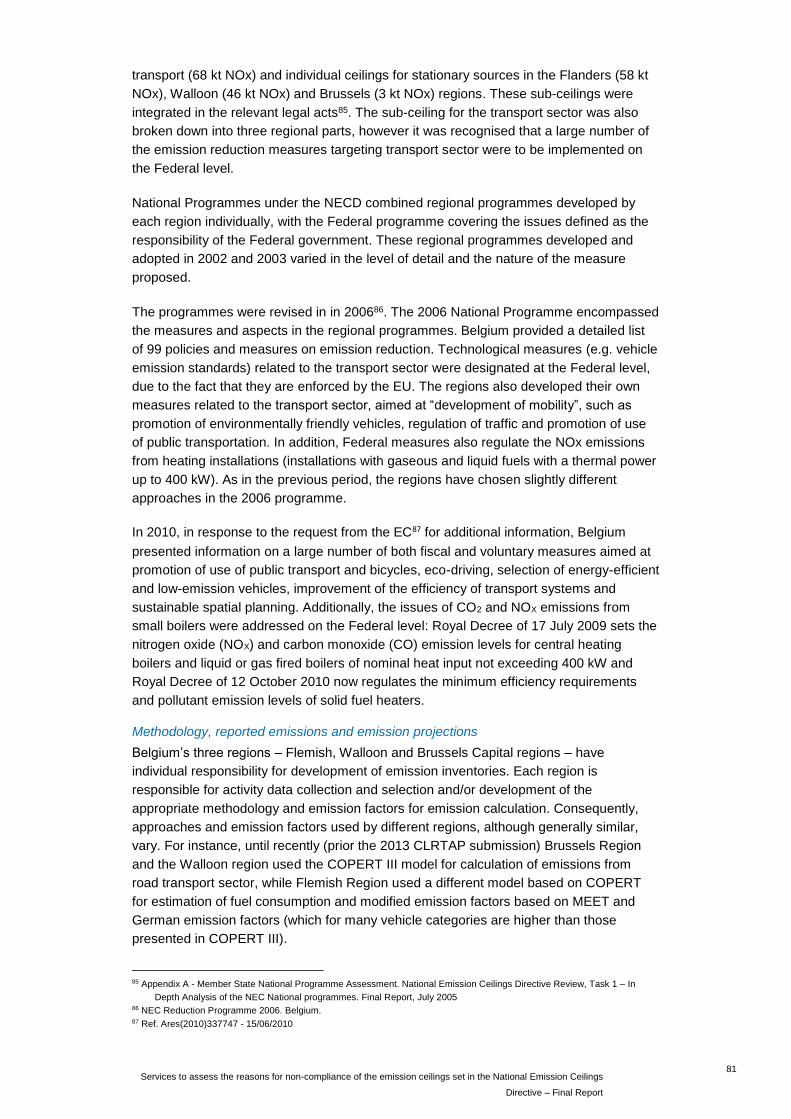
81
Services to assess the reasons for non-compliance of the emission ceilings set in the National Emission Ceilings
Directive – Final Report
transport (68 kt NOx) and individual ceilings for stationary sources in the Flanders (58 kt
NOx), Walloon (46 kt NOx) and Brussels (3 kt NOx) regions. These sub-ceilings were
integrated in the relevant legal acts85. The sub-ceiling for the transport sector was also
broken down into three regional parts, however it was recognised that a large number of
the emission reduction measures targeting transport sector were to be implemented on
the Federal level.
National Programmes under the NECD combined regional programmes developed by
each region individually, with the Federal programme covering the issues defined as the
responsibility of the Federal government. These regional programmes developed and
adopted in 2002 and 2003 varied in the level of detail and the nature of the measure
proposed.
The programmes were revised in in 200686. The 2006 National Programme encompassed
the measures and aspects in the regional programmes. Belgium provided a detailed list
of 99 policies and measures on emission reduction. Technological measures (e.g. vehicle
emission standards) related to the transport sector were designated at the Federal level,
due to the fact that they are enforced by the EU. The regions also developed their own
measures related to the transport sector, aimed at “development of mobility”, such as
promotion of environmentally friendly vehicles, regulation of traffic and promotion of use
of public transportation. In addition, Federal measures also regulate the NOx emissions
from heating installations (installations with gaseous and liquid fuels with a thermal power
up to 400 kW). As in the previous period, the regions have chosen slightly different
approaches in the 2006 programme.
In 2010, in response to the request from the EC87 for additional information, Belgium
presented information on a large number of both fiscal and voluntary measures aimed at
promotion of use of public transport and bicycles, eco-driving, selection of energy-efficient
and low-emission vehicles, improvement of the efficiency of transport systems and
sustainable spatial planning. Additionally, the issues of CO2 and NOX emissions from
small boilers were addressed on the Federal level: Royal Decree of 17 July 2009 sets the
nitrogen oxide (NOX) and carbon monoxide (CO) emission levels for central heating
boilers and liquid or gas fired boilers of nominal heat input not exceeding 400 kW and
Royal Decree of 12 October 2010 now regulates the minimum efficiency requirements
and pollutant emission levels of solid fuel heaters.
Methodology, reported emissions and emission projections
Belgium’s three regions – Flemish, Walloon and Brussels Capital regions – have
individual responsibility for development of emission inventories. Each region is
responsible for activity data collection and selection and/or development of the
appropriate methodology and emission factors for emission calculation. Consequently,
approaches and emission factors used by different regions, although generally similar,
vary. For instance, until recently (prior the 2013 CLRTAP submission) Brussels Region
and the Walloon region used the COPERT III model for calculation of emissions from
road transport sector, while Flemish Region used a different model based on COPERT
for estimation of fuel consumption and modified emission factors based on MEET and
German emission factors (which for many vehicle categories are higher than those
presented in COPERT III).
85 Appendix A - Member State National Programme Assessment. National Emission Ceilings Directive Review, Task 1 – In
Depth Analysis of the NEC National programmes. Final Report, July 2005 86 NEC Reduction Programme 2006. Belgium. 87 Ref. Ares(2010)337747 - 15/06/2010

82
Services to assess the reasons for non-compliance of the emission ceilings set in the National Emission Ceilings
Directive- Final Report
Inventory reports submitted by the regions are later compiled into a single inventory by
the Belgian Interregional Environmental Agency (IRCELIN). Belgium has chosen an
option of reporting emissions based on “fuel used” and provides no additional information
on the emissions calculated based on the “fuel sold”.
According to the 2006 National Programme the significant changes in emission
estimations approaches affected transport sector emissions. When the transport
emissions for the whole country were calculated using a more advance approach applied
in the Flemish Region and the latest emission factors for ARTEMIS database, as well as
updated methodologies for off-road transport, the NOx emissions in 2010 were 57 kt
higher than if estimated using original RAINS emission factors (41 kt of this from road
transport).
Figure 6-1 NOX contributing sectors in Belgium, fuel used, 2012 NECD submission (kt)
The total NOx emissions in Belgium decreased by 45% from 1990 to 2010. Figure 6-1
shows the major NOx emission sources in Belgium. According to the 2012 IIR, the
reduction in the NOx emissions in the public electricity and heat production sector
compared to 1990 is driven by closure of some of the coal power plants, shift to cleaner
fuels, improvements of the efficiency and use of modern technologies in the sector
(Figure 6-2). National statistics on the modal split of the passenger transport show a
decrease in the intensity of use of passenger cars, compared to the railway and busses
from the beginning of 2000s. Meanwhile, the total number of registered passenger cars
has increased by 30% from 1992 to 2009 with the total energy consumed by transport
sector increasing by 31.6%88 (instead of 37% projected in 199889). Additionally, a trend
88 Petrol and diesel only
401.4
332.1291.0
265.3262.5
238.7
207.5220.7
0
50
100
150
200
250
300
350
400
450
1990 1995 2000 2005 2010
kt
Other sectors1 A 2 c Stationary combustion in manufacturing industries and construction: Chemicals1 A 2 a Stationary combustion in manufacturing industries and construction: Iron and steel1 A 3 b ii Road transport:Light duty vehicles1 A 2 f i Stationary combustion in manufacturing industries and construction: Other2 A 1 Cement production1 A 4 b i Residential: Stationary plants1 A 1 a Public electricity and heat production1 A 3 b i Road transport: Passenger cars1 A 3 b iii Road transport:, Heavy duty vehiclesNational total for the entire territory
83
Services to assess the reasons for non-compliance of the emission ceilings set in the National Emission Ceilings
Directive – Final Report
towards dieselification of road transport fleet can be notices: the proportion of diesel cars
has increased from 29% in 1992 to 59% in 2009 (Figure 6-3). In 1998, consumption of
diesel in the transport sector was expected to increase by 68% from 1990 to 2010,
constituting 68% of the total energy consumed by this sector. The latest Eurostat data
shows that diesel consumption in transport sector increased by 97% and making up 85%
of the energy consumed by transport sector. At the same time, the total primary energy
consumption in Belgium increased by 18%, which is lower than the 28% increase
expected at the time of RAINS projections development90.
Figure 6-2 Final energy consumption in Belgium by sector and fuel type, 1000s TOE (Eurostat)
Figure 6-3 Number of registered passenger cars in Belgium by engine type (Eurostat)
Beginning with submission year 2004, Belgium reported NOX projections for year 2010
that were above the 176 kt NECD ceiling. The NOX emission projection for the “with
89 Petrol and diesel only. IIASA 1998 6th Interim Report, available from: http://gains.iiasa.ac.at/reports/pre-2002/6th interim
a2.pdf 90 Footnote 89.
0
2000
4000
6000
8000
10000
12000
10
00
s TO
E
Residential Solid
Residential Oil
Residential Gas
Transport Oil
Industry Solid
Industry Oil
Industry Gas
0
1000
2000
3000
4000
5000
6000
0
500
1000
1500
2000
2500
3000
3500
10
00
s To
tal
10
00
s D
iese
l or
Pe
tro
l
Diesel Petrol Total
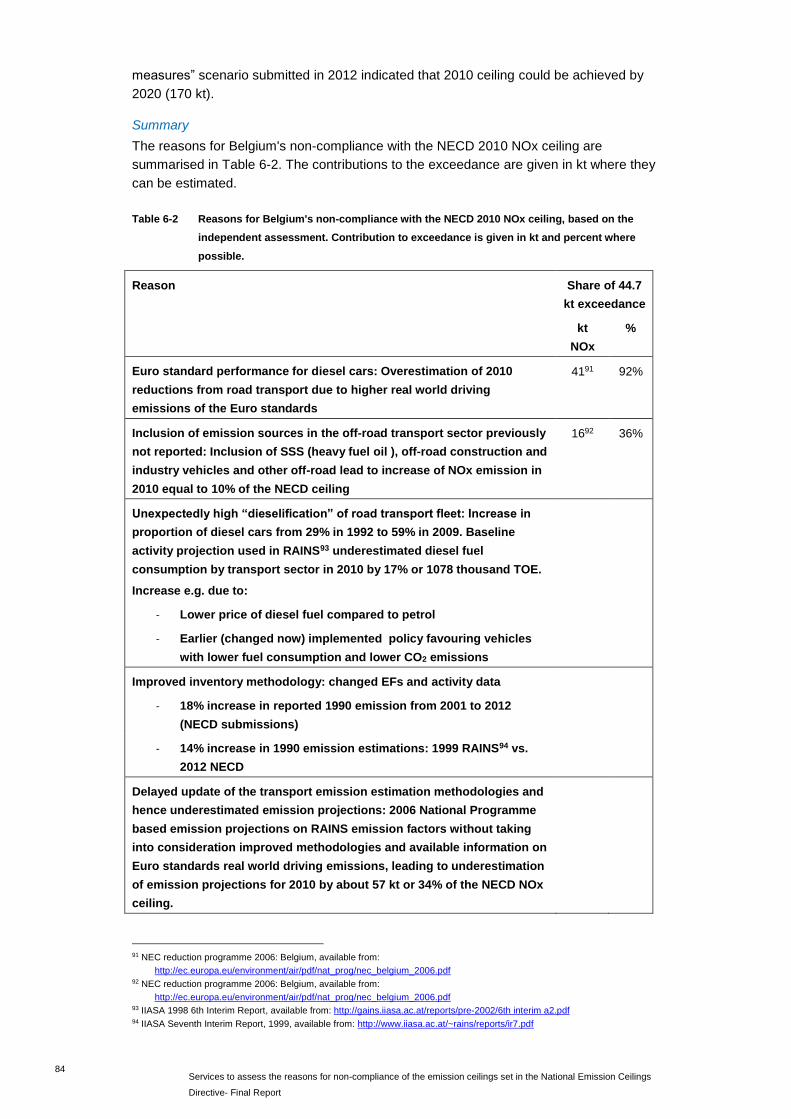
84
Services to assess the reasons for non-compliance of the emission ceilings set in the National Emission Ceilings
Directive- Final Report
measures” scenario submitted in 2012 indicated that 2010 ceiling could be achieved by
2020 (170 kt).
Summary
The reasons for Belgium's non-compliance with the NECD 2010 NOx ceiling are
summarised in Table 6-2. The contributions to the exceedance are given in kt where they
can be estimated.
Table 6-2 Reasons for Belgium's non-compliance with the NECD 2010 NOx ceiling, based on the
independent assessment. Contribution to exceedance is given in kt and percent where
possible.
Reason Share of 44.7
kt exceedance
kt
NOx
%
Euro standard performance for diesel cars: Overestimation of 2010
reductions from road transport due to higher real world driving
emissions of the Euro standards
4191 92%
Inclusion of emission sources in the off-road transport sector previously
not reported: Inclusion of SSS (heavy fuel oil ), off-road construction and
industry vehicles and other off-road lead to increase of NOx emission in
2010 equal to 10% of the NECD ceiling
1692 36%
Unexpectedly high “dieselification” of road transport fleet: Increase in
proportion of diesel cars from 29% in 1992 to 59% in 2009. Baseline
activity projection used in RAINS93 underestimated diesel fuel
consumption by transport sector in 2010 by 17% or 1078 thousand TOE.
Increase e.g. due to:
- Lower price of diesel fuel compared to petrol
- Earlier (changed now) implemented policy favouring vehicles
with lower fuel consumption and lower CO2 emissions
Improved inventory methodology: changed EFs and activity data
- 18% increase in reported 1990 emission from 2001 to 2012
(NECD submissions)
- 14% increase in 1990 emission estimations: 1999 RAINS94 vs.
2012 NECD
Delayed update of the transport emission estimation methodologies and
hence underestimated emission projections: 2006 National Programme
based emission projections on RAINS emission factors without taking
into consideration improved methodologies and available information on
Euro standards real world driving emissions, leading to underestimation
of emission projections for 2010 by about 57 kt or 34% of the NECD NOx
ceiling.
91 NEC reduction programme 2006: Belgium, available from:
http://ec.europa.eu/environment/air/pdf/nat_prog/nec_belgium_2006.pdf 92 NEC reduction programme 2006: Belgium, available from:
http://ec.europa.eu/environment/air/pdf/nat_prog/nec_belgium_2006.pdf 93 IIASA 1998 6th Interim Report, available from: http://gains.iiasa.ac.at/reports/pre-2002/6th interim a2.pdf 94 IIASA Seventh Interim Report, 1999, available from: http://www.iiasa.ac.at/~rains/reports/ir7.pdf

85
Services to assess the reasons for non-compliance of the emission ceilings set in the National Emission Ceilings
Directive – Final Report
6.3 Reasons for non-compliance as identified by Belgium
Belgium's perspective on the reasons for non-compliance with the NECD 2010 NOX
ceiling was obtained through a telephone interview with an official of the Environmental
Administration of the Flemish Government and subsequent written replies to questions,
and documents provided. The reasons identified by Belgium for non-compliance are
summarised in Table 6-3. The quantitative contributions to the exceedance are given as
provided by Belgium.
Table 6-3 Reasons for Belgium's non-compliance with the NECD 2010 NOx ceiling as identified by
Belgium. Contribution to NOx emission exceedance is given in kt and percent where
provided by Belgium.
Share of 44.7 kt
exceedance
Reason kt NOx %
It was assumed when defining the ceiling that real world vehicle emissions
would follow the Euro emission standards. Real world emissions for Euro 3
and 4 diesel cars and LDV and Euro VI diesel HDV are significantly higher
than the test cycle emission standards. Fully compensating for the failure
of the Euro standards would in Belgium only be possible with very
unrealistic and drastic measures (for example a drastic reduction in total
km driven)
54 121%
Emissions from off-road subsectors are now reported that were not
included in the inventory or RAINS projections at the time the ceiling was
set.
12 30%
New knowledge (improved emission factors) for off-road subsectors
included at the time the ceiling was set has raised NOx emissions in these
subsectors.
4 9%
For the Flemish region, climate policy in legislation on stationary engines
< 50 MW has stimulated cogeneration (CHP) in recent years. This has
resulted in a significant increase of small stationary CHP gas engines in
Flanders (for example in greenhouses). These installations have very high
specific NOx emissions. Flanders has now strengthened emission limit
values for diesel and gas engines.
6.4 Expected time of compliance with the 2010 Ceilings
On the basis of recent emission projections from the GAINS model (CLE - current
legislation) and national scenario estimates were made for when Belgium may reach its
2010 ceiling, shown in Table 6-4.
Table 6-4 Summary of projection analysis for Belgium on the year to attain the 2010 ceiling (176 kt).
Emissions in kt/year
, Reported emissions for previous
years, used for reference, kt Projections, kt
2010 fuel 2005 2010 2015 2020 2025 2030
ceiling basis GAINS Rep. GAINS Rep. GAINS Nat. GAINS Nat. GAINS Nat. GAINS Nat.
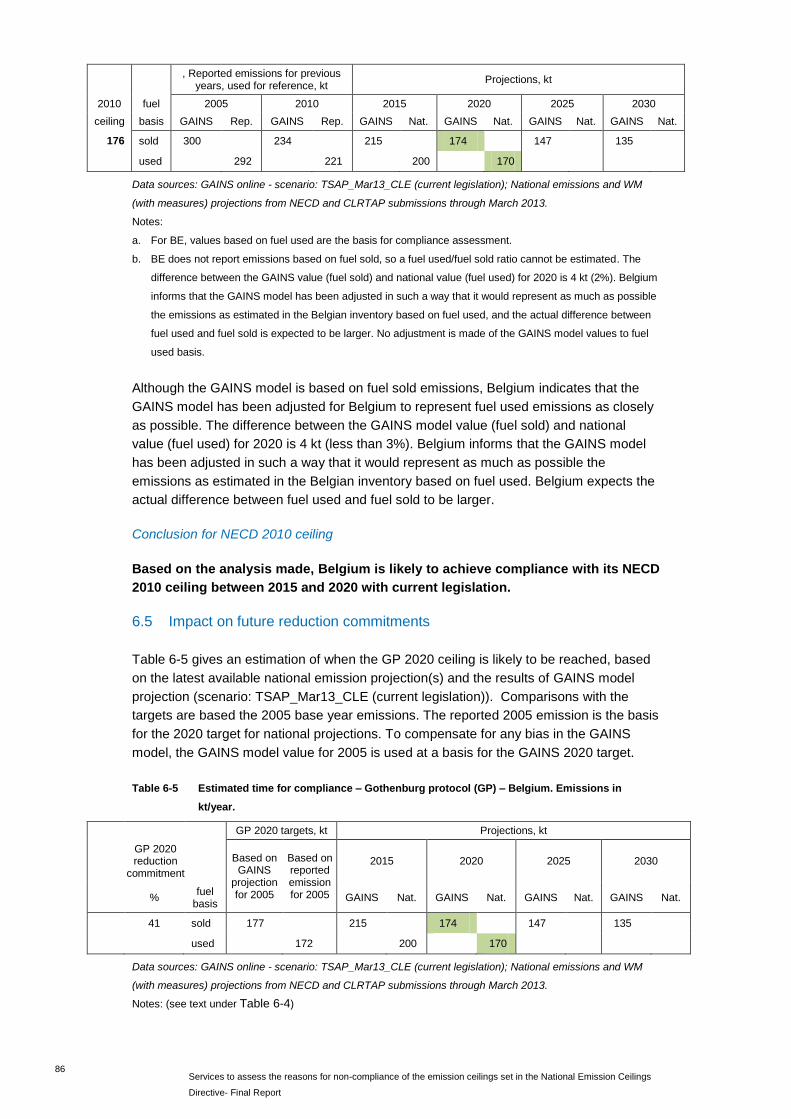
86
Services to assess the reasons for non-compliance of the emission ceilings set in the National Emission Ceilings
Directive- Final Report
, Reported emissions for previous
years, used for reference, kt Projections, kt
2010 fuel 2005 2010 2015 2020 2025 2030
ceiling basis GAINS Rep. GAINS Rep. GAINS Nat. GAINS Nat. GAINS Nat. GAINS Nat.
176 sold 300 234 215 174 147 135
used 292 221 200 170
Data sources: GAINS online - scenario: TSAP_Mar13_CLE (current legislation); National emissions and WM
(with measures) projections from NECD and CLRTAP submissions through March 2013.
Notes:
a. For BE, values based on fuel used are the basis for compliance assessment.
b. BE does not report emissions based on fuel sold, so a fuel used/fuel sold ratio cannot be estimated. The
difference between the GAINS value (fuel sold) and national value (fuel used) for 2020 is 4 kt (2%). Belgium
informs that the GAINS model has been adjusted in such a way that it would represent as much as possible
the emissions as estimated in the Belgian inventory based on fuel used, and the actual difference between
fuel used and fuel sold is expected to be larger. No adjustment is made of the GAINS model values to fuel
used basis.
Although the GAINS model is based on fuel sold emissions, Belgium indicates that the
GAINS model has been adjusted for Belgium to represent fuel used emissions as closely
as possible. The difference between the GAINS model value (fuel sold) and national
value (fuel used) for 2020 is 4 kt (less than 3%). Belgium informs that the GAINS model
has been adjusted in such a way that it would represent as much as possible the
emissions as estimated in the Belgian inventory based on fuel used. Belgium expects the
actual difference between fuel used and fuel sold to be larger.
Conclusion for NECD 2010 ceiling
Based on the analysis made, Belgium is likely to achieve compliance with its NECD
2010 ceiling between 2015 and 2020 with current legislation.
6.5 Impact on future reduction commitments
Table 6-5 gives an estimation of when the GP 2020 ceiling is likely to be reached, based
on the latest available national emission projection(s) and the results of GAINS model
projection (scenario: TSAP_Mar13_CLE (current legislation)). Comparisons with the
targets are based the 2005 base year emissions. The reported 2005 emission is the basis
for the 2020 target for national projections. To compensate for any bias in the GAINS
model, the GAINS model value for 2005 is used at a basis for the GAINS 2020 target.
Table 6-5 Estimated time for compliance – Gothenburg protocol (GP) – Belgium. Emissions in
kt/year.
GP 2020 targets, kt Projections, kt
GP 2020 reduction
commitment Based on
GAINS projection for 2005
Based on reported emission for 2005
2015 2020 2025 2030
% fuel
basis GAINS Nat. GAINS Nat. GAINS Nat. GAINS Nat.
41 sold 177 215 174 147 135
used 172 200 170
Data sources: GAINS online - scenario: TSAP_Mar13_CLE (current legislation); National emissions and WM
(with measures) projections from NECD and CLRTAP submissions through March 2013.
Notes: (see text under Table 6-4)

87
Services to assess the reasons for non-compliance of the emission ceilings set in the National Emission Ceilings
Directive – Final Report
Conclusion for GP 2020 reduction commitment
Based on the analysis made, Belgium is likely to comply with their respective
CLRTP 2020 reduction commitment by 2020 with measures in accordance with
current legislation.
6.6 Observations and recommendations for Belgium
Issue: Fuel sold emissions are not submitted by Belgium to NECD or CLRTAP, as
required by EMEP Guidelines for Reporting.
Recommendation:
Consider introduction of nitrogen oxides emission assessment on the basis of fuel
sold in parallel to existing practice based on fuel used.
Issue: Regions have been using different methodologies for emission estimation for road
transport which complicates aggregation and comparison of the results.
Recommendation:
Consider centralised calculation of road transport emissions at the Federal level, to
ensure the same methodology is applied for all regions, consistent treatment of fuel
tourism by the regions, and to facilitate calculation and reporting of national
emissions based on fuel sold.

88
Services to assess the reasons for non-compliance of the emission ceilings set in the National Emission Ceilings
Directive- Final Report
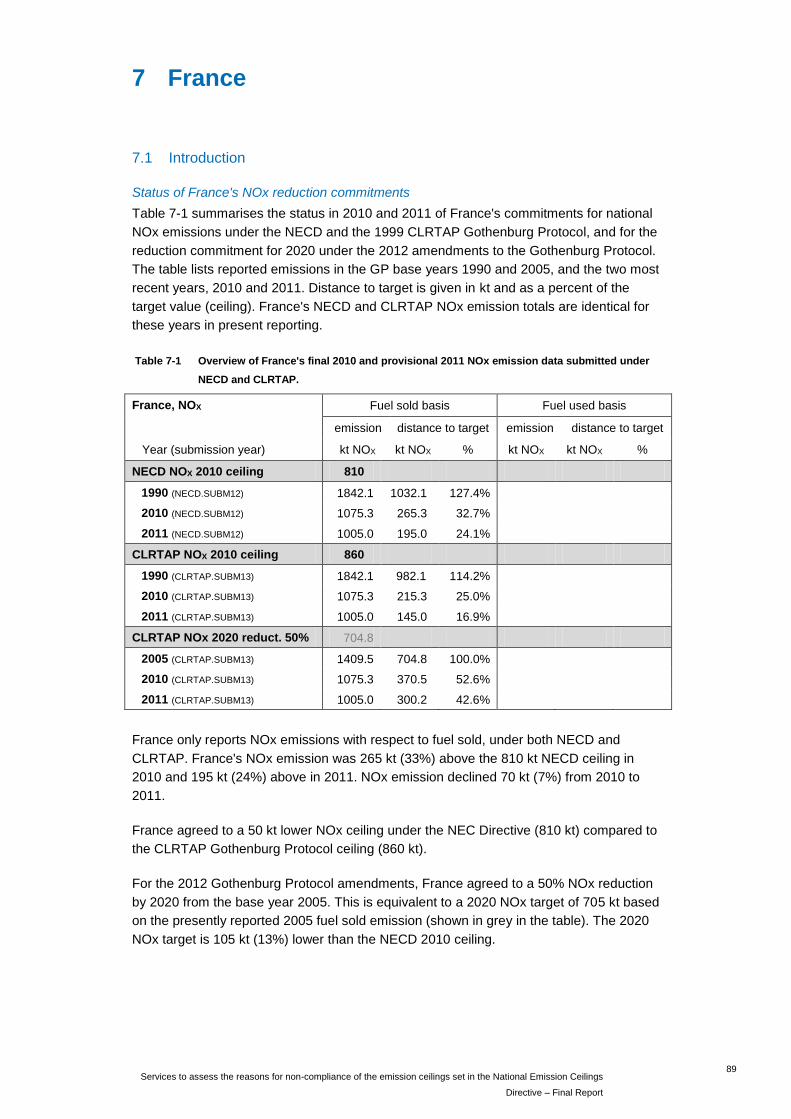
89
Services to assess the reasons for non-compliance of the emission ceilings set in the National Emission Ceilings
Directive – Final Report
7 France
7.1 Introduction
Status of France's NOx reduction commitments
Table 7-1 summarises the status in 2010 and 2011 of France's commitments for national
NOx emissions under the NECD and the 1999 CLRTAP Gothenburg Protocol, and for the
reduction commitment for 2020 under the 2012 amendments to the Gothenburg Protocol.
The table lists reported emissions in the GP base years 1990 and 2005, and the two most
recent years, 2010 and 2011. Distance to target is given in kt and as a percent of the
target value (ceiling). France's NECD and CLRTAP NOx emission totals are identical for
these years in present reporting.
Table 7-1 Overview of France's final 2010 and provisional 2011 NOx emission data submitted under
NECD and CLRTAP.
France, NOX Fuel sold basis Fuel used basis
emission distance to target emission distance to target
Year (submission year) kt NOX kt NOX % kt NOX kt NOX %
NECD NOX 2010 ceiling 810
1990 (NECD.SUBM12) 1842.1 1032.1 127.4%
2010 (NECD.SUBM12) 1075.3 265.3 32.7%
2011 (NECD.SUBM12) 1005.0 195.0 24.1%
CLRTAP NOX 2010 ceiling 860
1990 (CLRTAP.SUBM13) 1842.1 982.1 114.2%
2010 (CLRTAP.SUBM13) 1075.3 215.3 25.0%
2011 (CLRTAP.SUBM13) 1005.0 145.0 16.9%
CLRTAP NOx 2020 reduct. 50% 704.8
2005 (CLRTAP.SUBM13) 1409.5 704.8 100.0%
2010 (CLRTAP.SUBM13) 1075.3 370.5 52.6%
2011 (CLRTAP.SUBM13) 1005.0 300.2 42.6%
France only reports NOx emissions with respect to fuel sold, under both NECD and
CLRTAP. France's NOx emission was 265 kt (33%) above the 810 kt NECD ceiling in
2010 and 195 kt (24%) above in 2011. NOx emission declined 70 kt (7%) from 2010 to
2011.
France agreed to a 50 kt lower NOx ceiling under the NEC Directive (810 kt) compared to
the CLRTAP Gothenburg Protocol ceiling (860 kt).
For the 2012 Gothenburg Protocol amendments, France agreed to a 50% NOx reduction
by 2020 from the base year 2005. This is equivalent to a 2020 NOx target of 705 kt based
on the presently reported 2005 fuel sold emission (shown in grey in the table). The 2020
NOx target is 105 kt (13%) lower than the NECD 2010 ceiling.
90
Services to assess the reasons for non-compliance of the emission ceilings set in the National Emission Ceilings
Directive- Final Report
Summary of conclusions
The main reasons for France's non-compliance with the NECD 2010 NOx ceiling are:
Vehicle NOX emissions (primarily diesel) under real-world driving conditions are much
higher than expected for Euro 1-5/I-V standards. France has estimated an additional
2010 NOX emission of 152 kt (57% of the 2010 exceedance) due to vehicle emission
factor changes from COPERT III to COPERT 4 v9.0. An ETC/ACC study estimated
282 kt additional NOX in 2010 (106% of 2010 exceedance) due to revisions of
exhaust emission factors from the 1999 RAINS projections to COPERT 4 v8.0.
Inventory improvements added emissions from non-road mobile engines that were
not in the original inventory or RAINS projections, increasing the 2010 NOX emission
by 39 kt (15% of the 2010 exceedance).
The diesel share of road transport fuel consumption (fuel sold) increased to 80% in
2010, compared to 54% assumed in 1999 RAINS projections – the third largest
dieselification among the EU-15. However, total road transport fuel consumption
increased less than assumed in 1999, which more than offset the NOX increase due
to dieselification.
The outlook for compliance with the NECD 2010 ceiling and the CLRTAP 2020 target is:
France is likely to achieve compliance with its NECD 2010 ceiling between 2015 and
2020 with current legislation.
France is likely to comply with its respective CLRTAP 2020 reduction commitment by
2020 with measures in accordance with current legislation.
The reasons for non-compliance and estimation of time for compliance are discussed in
the following sections.
7.2 Independent assessment
Legislation, National Programmes and policies and measures
NEC Directive has been transposed into France’s national legislation by Ministerial Order
of July 8, 200395, explicitly adopting the NECD national emission ceilings.
The first French National Programme was finalised in 2003 and provided a description of
existing and planned policies and measures and emission projections under a number of
scenarios. Regarding emissions from the transport sector, France stated that is has
followed all the requirements of the EU by implementing the legislation relevant to the
transport emissions. There were no additional transport sector related measures
presented in the programme and it stated that additional measures in the sector are
required on the European level in order to control emissions.
Emission projections presented in the 2003 National Programme suggested that under
“business-as-usual” scenario, i.e. taking into consideration measures already
implemented, in 2010 NOx emission in France would reach approximately 990 kt, while
additional measures would reduce the emission to the level of 840 kt, still exceeding the
NECD ceiling by some 30 kt.
95 Arrêté du 8/7/2003 portant approbation du programme national de réduction des émissions de polluants atmosphérique (SO,
NOX, COV et NH) JORF du 30/10/2003 p. 18556

91
Services to assess the reasons for non-compliance of the emission ceilings set in the National Emission Ceilings
Directive – Final Report
Revision of the National Atmospheric Pollutant Reduction Programme was completed in
February 2007. France acknowledged that with the measures already in place, NOx
emissions will exceed NECD ceiling in 2010 by 295 kt. The main reasons for this were
identified as the inclusion of NOx emissions from the fertilizer application (previously not
estimated) and the change in the emission factors for road transport included in the new
COPERT 4 model. According to the national programme, the difference between the
emissions in road transport sector estimated with COPERT III and COPERT 4 for France
was about 140 kt96. Implementation of additional measures was expected to reduce the
exceedance of the NOx ceiling by 239 kt (81%).
Methodology, reported emissions and emission projections
Figure 7-1 NOx emission trends in the national total and major contributing sources in France (CEIP
database, submitted before 2013)
The time series of national total NOX emission and major sectors for 1990 to 2010 are
shown in Figure 7-1. NOx emissions in France have decreased by 42% from 1990 to
2010. The sectors with the largest decreases in emissions were the mobile combustion
sector, passenger cars, stationary combustion and public electricity and heat production.
These have decreased by 62%, 62%, 45% and 43% respectively from 1990 to 2010.
According to the 2012 IIR, NOx emission reductions in the transport sector are driven by
the technological changes. At the same time the total number of registered cars has
increased by 28% from 1991-2006. The country also experienced an unexpected rate of
dieselification of transport fleet, with the proportion of diesel cars increasing from 18% in
1991 to 50% in 2006.
Activity data projections97 used in the RAINS modelling at the time the ceilings were set
expected consumption of petrol to increase by 15% and diesel to increase by 40% from
1990 to 2010. The latest Eurostat data indicates that petrol consumption has decreased
96 According to the National Programme 2006 the difference was between 137 and -148 kt depending on the estimation
scenario. 97 IIASA 1998 6th Interim Report, available from: http://gains.iiasa.ac.at/reports/pre-2002/6th interim a2.pdf
0
200
400
600
800
1000
1200
1400
1600
1800
2000
0
100
200
300
400
500
600
700
Tota
l, kt
Sect
ors
, kt
National totalRoad Transport:, Passenger carsRoad Transport:, Heavy duty vehiclesRoad Transport:, Light duty vehiclesAgriculture/Forestry/Fishing: Off-road Vehicles and Other MachineryPublic Electricity and Heat Production

92
Services to assess the reasons for non-compliance of the emission ceilings set in the National Emission Ceilings
Directive- Final Report
by 58% while diesel increased by 79%. The total energy consumed by transport sector
(petrol and diesel only) has increased by 8% instead of the projected 27%. NOx
emissions from the public heat and electricity production sector as well as in industrial
stationary combustion have decreased considerably during the last decade. This
coincided with the gradual shift from oil and solid fuel to gas in both sectors, as well as
general reduction (22%) in the final energy consumption by the industrial sector (Figure
7-2). The total primary energy consumption in France has increased by 20% from 1990 to
2010, which is slightly lower than the 22% increase foreseen for RAINS model projections
at the time the ceilings were set98.
Figure 7-2 Final energy consumption by sector and fuel type in France (Eurostat)
Emission projections reported in France’s 2013 CLRTAP submission suggest that under
“with measures” scenario in 2015, NOx emission in France will still be 38 kt above the
2010 NECD ceiling, declining to 620 kt by 2020.
Summary
The reasons for France's non-compliance with the NECD 2010 NOx ceiling identified by
the independent assessment are summarised in Table 7-2. The contribution to the
exceedance is given in kt where it can be estimated.
98 Supra note 97
0
2000
4000
6000
8000
10000
12000
14000
16000
18000
20000
10
00
s TO
E
Residential: Solid fuels Industry: Solid fuels
Industry: Oil Residential: Oil
Industry: Gas Residential: Gas
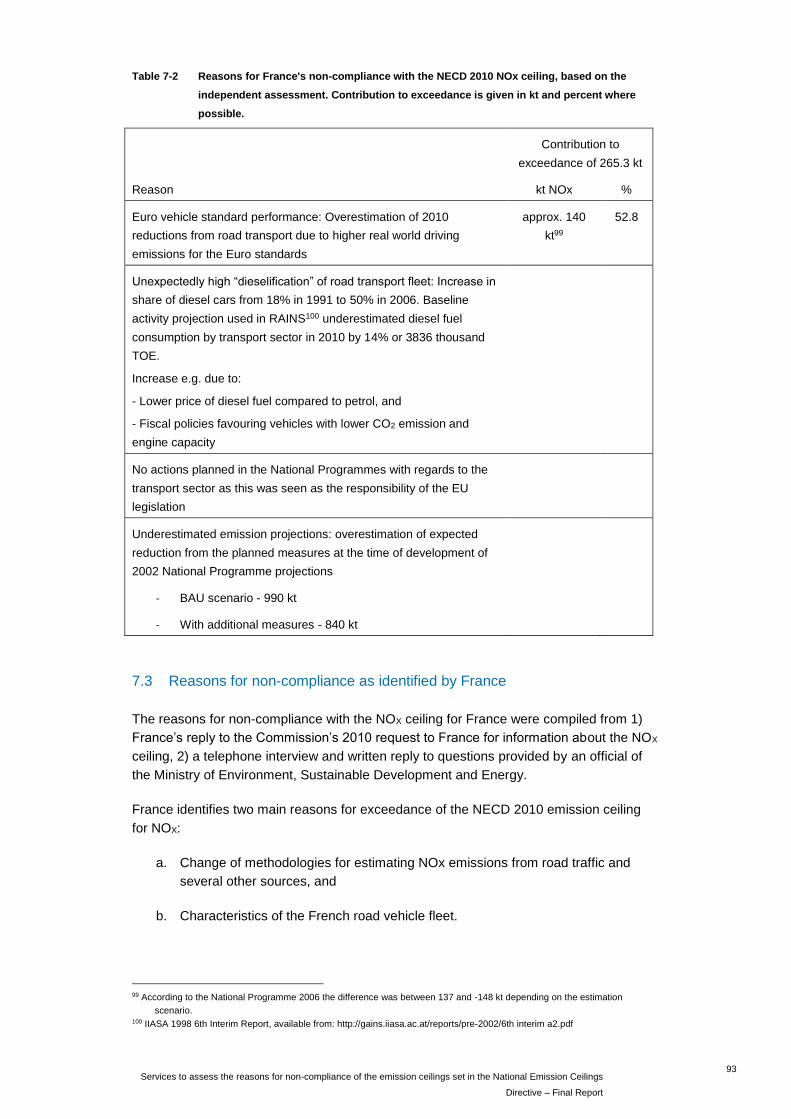
93
Services to assess the reasons for non-compliance of the emission ceilings set in the National Emission Ceilings
Directive – Final Report
Table 7-2 Reasons for France's non-compliance with the NECD 2010 NOx ceiling, based on the
independent assessment. Contribution to exceedance is given in kt and percent where
possible.
Contribution to
exceedance of 265.3 kt
Reason kt NOx %
Euro vehicle standard performance: Overestimation of 2010
reductions from road transport due to higher real world driving
emissions for the Euro standards
approx. 140
kt99
52.8
Unexpectedly high “dieselification” of road transport fleet: Increase in
share of diesel cars from 18% in 1991 to 50% in 2006. Baseline
activity projection used in RAINS100 underestimated diesel fuel
consumption by transport sector in 2010 by 14% or 3836 thousand
TOE.
Increase e.g. due to:
- Lower price of diesel fuel compared to petrol, and
- Fiscal policies favouring vehicles with lower CO2 emission and
engine capacity
No actions planned in the National Programmes with regards to the
transport sector as this was seen as the responsibility of the EU
legislation
Underestimated emission projections: overestimation of expected
reduction from the planned measures at the time of development of
2002 National Programme projections
- BAU scenario - 990 kt
- With additional measures - 840 kt
7.3 Reasons for non-compliance as identified by France
The reasons for non-compliance with the NOX ceiling for France were compiled from 1)
France’s reply to the Commission’s 2010 request to France for information about the NOX
ceiling, 2) a telephone interview and written reply to questions provided by an official of
the Ministry of Environment, Sustainable Development and Energy.
France identifies two main reasons for exceedance of the NECD 2010 emission ceiling
for NOX:
a. Change of methodologies for estimating NOx emissions from road traffic and
several other sources, and
b. Characteristics of the French road vehicle fleet.
99 According to the National Programme 2006 the difference was between 137 and -148 kt depending on the estimation
scenario. 100 IIASA 1998 6th Interim Report, available from: http://gains.iiasa.ac.at/reports/pre-2002/6th interim a2.pdf

94
Services to assess the reasons for non-compliance of the emission ceilings set in the National Emission Ceilings
Directive- Final Report
Even when taking into account the methodological changes described below, the
exceedance remains but at a small level.
Emissions of NOx in 1990 and 2010, according to the most recent estimation (December
2012), are shown in Table 7-3.
Table 7-3 Total and road traffic NOx emission for France in 1990 and 2010. Source: December 2012
submission.
Inventory year
Total NOx emissions
NOx emissions from road
traffic
Proportion of NOx
emissions due to road
traffic
1990 1842 1144 62%
2010 1075 592 55%
Reduction -42% -48%
According France’s latest inventory submission (December 2012), NOx emissions from
road traffic were 56% of the total in 2011, compared to 62 % in 1990. From 1990 to 2010,
total NOx emissions have decreased by 42 %. The road traffic NOx emissions have
decreased by 48 %.
This low decrease of emissions in road traffic is due to the singular characteristics of the
French fleet of vehicles combined with the fact that reduction of NOx emissions due to
Euro vehicle standards is less effective than expected. The difference between
theoretical Euro emission standards and actual on-road emissions is very significant.
Furthermore, the use of DPFs for diesel cars has increased emissions of NO2, as shown
by European studies.
Diesel cars are used for longer trips. The diesel share of passenger cars (PC) mileage is
71% in 2010. Diesel LDV represented 95% of LDV mileage in 2010. In comparison, the
diesel share of LDV mileage is very low in Switzerland. The tremendous increase in the
use of diesel cars is mainly due to the lower fuel consumption of diesel vehicles
compared to gasoline cars, and that diesel fuel is cheaper than gasoline in France. Most
importantly, the ambitious European and national climate policies to reduce CO2
emissions of vehicles, has led France to develop and promote the use of diesel cars. This
is one of the reasons why diesel fuel is cheaper than gasoline in France.
Table 7-4 shows the impact of changes in methodology since the NEC Directive went into
force.

95
Services to assess the reasons for non-compliance of the emission ceilings set in the National Emission Ceilings
Directive – Final Report
Table 7-4 Comparison of French NOx emissions in 2010 for current methodology compared to the
methodology in place at the time the NEC Directive was established, based on the French
submission in December 2012.
NOx kt National total in 2010 according
to the 2012 submission
National total in 2010 with older methodologies
Difference
Total emissions 1075 883 -192
Road transport 592
(COPERT 4)
439
(COPERT III)
-152
Light fuel oil Off-road mobile engines from industry
16 3 -12
Light fuel oil Off-road mobile engines from agriculture forestry
117 90 -27
France based its 2010 NOx ceiling on IIASA RAINS projections at the time of the
negotiations. In the REF scenario of IIASA (1998), NOx emissions from road transport
were projected to decrease almost 69%, from 1045 kt in 1990 (French inventory in 1997)
to 329 kt in 2010. Actual road transport NOx emissions in 2010 were 592 kt (French
inventory for 2010 using COPERT 4), a 43% reduction from the 1990 level. The 1998
IIASA RAINS projection using the REF scenario underestimated the 2010 road transport
NOx emission by 80%.
Summary
The reasons non-compliance with the NECD 2010 NOx ceiling identified by France are
summarised in Table 7-5. The contribution to the exceedance is given in kt where it can
be estimated.
Table 7-5 Reasons for France's non-compliance with the NECD 2010 NOx ceiling as identified by
France. Contribution to NOx emission exceedance is given in kt and percent where
provided by France.
Share of 265.3 kt
Reason kt NOx %
The change in methodology (emission factors) for road transport
between COPERT III and COPERT 4
152 57%
Inclusion of off-road mobile engines from agriculture and forestry
that were not in the original inventory or RAINS projections
27 10%
Inclusion of off-road mobile engines from industry that were not in
the original inventory or RAINS projections
12 5%
Ambitious EU and national climate policies have led to promotion of
diesel vehicles and lower diesel fuel prices, which has resulted in
tremendous growth in the use of diesel cars.
The total of the NOX emission increases given in Table 7-5 is 191 kt. This accounts for
72% of the NOX exceedance in 2010, leaving 75 kt (28% of the exceedance) to be
accounted for.

96
Services to assess the reasons for non-compliance of the emission ceilings set in the National Emission Ceilings
Directive- Final Report
7.4 Expected time of compliance with the 2010 Ceilings
On the basis of recent emission projection from the GAINS model (CLE - current
legislation) and national current legislation projections shown in Table 7-6, an estimate is
made for when France may reach its 2010 ceiling.
Table 7-6 Summary of projection analysis for France on the year to attain the 2010 ceiling (810 kt).
Reported emissions for previous
years, used for reference, kt Projections, kt
2010 fuel 2005 2010 2015 2020 2025 2030
ceiling basis GAINS Rep. GAINS Rep. GAINS Nat. GAINS Nat. GAINS Nat. GAINS Nat.
810 sold 1374 1410 1053 1075 847 848 619 620 496 438
Data sources: GAINS online - scenario: TSAP_Mar13_CLE (current legislation); National emissions and WM
(with measures) projections from NECD and CLRTAP submissions through March 2013.
Conclusion for NECD 2010 ceiling
Based on the analysis made, France is likely to achieve compliance with its NECD
2010 ceiling between 2015 and 2020 with current legislation.
7.5 Impact on future reduction commitments
Table 7-7 gives an estimation of when the GP 2020 ceiling is likely to be reached, based
on the latest available national emission projection(s) and the results of GAINS model
projection (scenario: TSAP_Mar13_CLE (current legislation)). National projections are
compared to a target level based on the currently reported emission in 2005. To minimize
any bias in GAINS model projections, the GAINS model projections are compared to a
target level based on the GAINS projection for 2005.
Table 7-7 Estimated compliance period – Gothenburg protocol (GP) – France. Emissions in kt/year.
GP 2020 targets, kt Projections, kt
GP 2020 reduction
commitment Based on
GAINS projection for 2005
Based on reported emission for 2005
2015 2020 2025 2030
% fuel
basis GAINS Nat. GAINS Nat. GAINS Nat. GAINS Nat.
50 sold 687 705 847 848 619 620 496 438
Data sources: GAINS online - scenario: TSAP_Mar13_CLE (current legislation); National emissions and WM
(with measures) projections from NECD and CLRTAP submissions through March 2013.
Conclusion for GP 2020 reduction commitment
Based on the analysis made, France is likely to comply with its respective CLRTAP
2020 reduction commitment by 2020 with measures in accordance with current
legislation.

97
Services to assess the reasons for non-compliance of the emission ceilings set in the National Emission Ceilings
Directive – Final Report
8 Germany
8.1 Introduction
Status of Germany's NOX reduction commitments
Table 8-1 summarises the status in 2010 and 2011 of Germany's commitments for
national NOx emissions under the NECD and the 1999 CLRTAP Gothenburg Protocol,
and for the reduction commitment for 2020 under the 2012 amendments to the
Gothenburg Protocol. The table lists reported emissions in the GP base years 1990 and
2005, and the two most recent years, 2010 and 2011. Distance to target is given in kt and
as a percent of the target value (ceiling). Germany's NECD and CLRTAP NOx emission
totals are identical for these years in present reporting.
Table 8-1 Overview of Germany's final 2010 and provisional 2011 NOx emission data submitted
under NECD and CLRTAP.
Germany, NOX Fuel sold basis Fuel used basis
emission distance to target emission distance to target
Year (submission year) kt NOX kt NOX % kt NOX kt NOX %
NECD NOX 2010 ceiling 1051
1990 (NECD.SUBM12) 2875.0 1824.0 173.5%
2010 (NECD.SUBM12) 1331.9 280.9 26.7%
2011 (NECD.SUBM12) 1292.9 241.9 23.0%
CLRTAP NOX 2010 ceiling 1081
1990 (CLRTAP.SUBM13) 2875.0 1794.0 166.0%
2010 (CLRTAP.SUBM13) 1331.9 250.9 23.2%
2011 (CLRTAP.SUBM13) 1292.9 211.9 19.6%
CLRTAP NOx 2020 reduct. 39% 961.0
2005 (CLRTAP.SUBM13) 1575.4 614.4 63.9%
2010 (CLRTAP.SUBM13) 1331.9 370.9 38.6%
2011 (CLRTAP.SUBM13) 1292.9 331.9 34.5%
Germany only reports NOX emissions with respect to fuel sold, under both NECD and
CLRTAP. Germany's NOX emission was 281 kt (27%) above the 1051 kt NECD ceiling in
2010 and 242 kt (23%) above in 2011. NOX emission declined 39 kt (3%) from 2010 to
2011.
Germany agreed to a 30 kt lower NOX ceiling (1051 kt) under the NEC Directive
compared to the CLRTAP Gothenburg Protocol ceiling (1081 kt).
For the 2012 Gothenburg Protocol amendments, Germany agreed to a 39% NOx
reduction by 2020 from the base year 2005. This is equivalent to a 2020 NOx target of
961 kt based on the presently reported 2005 fuel sold emission (shown in grey in the
table). The 2020 NOx target is 90 kt (9%) lower than the NECD 2010 ceiling.
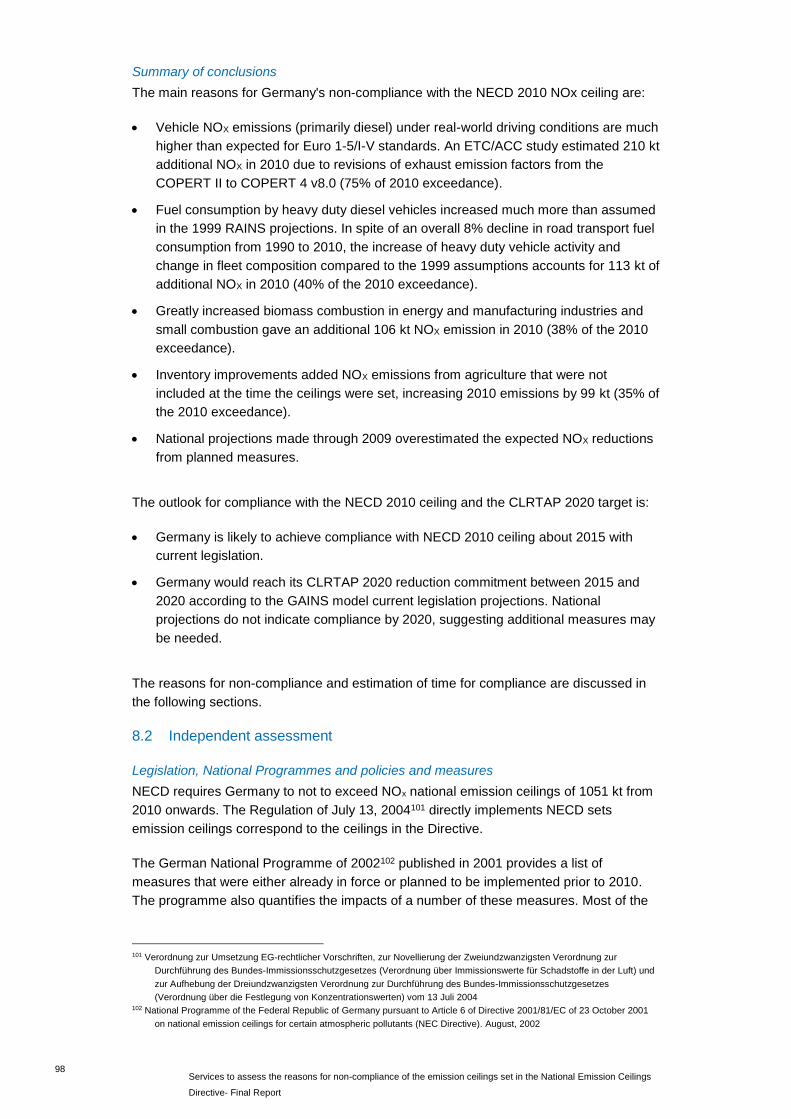
98
Services to assess the reasons for non-compliance of the emission ceilings set in the National Emission Ceilings
Directive- Final Report
Summary of conclusions
The main reasons for Germany's non-compliance with the NECD 2010 NOx ceiling are:
Vehicle NOX emissions (primarily diesel) under real-world driving conditions are much
higher than expected for Euro 1-5/I-V standards. An ETC/ACC study estimated 210 kt
additional NOX in 2010 due to revisions of exhaust emission factors from the
COPERT II to COPERT 4 v8.0 (75% of 2010 exceedance).
Fuel consumption by heavy duty diesel vehicles increased much more than assumed
in the 1999 RAINS projections. In spite of an overall 8% decline in road transport fuel
consumption from 1990 to 2010, the increase of heavy duty vehicle activity and
change in fleet composition compared to the 1999 assumptions accounts for 113 kt of
additional NOX in 2010 (40% of the 2010 exceedance).
Greatly increased biomass combustion in energy and manufacturing industries and
small combustion gave an additional 106 kt NOX emission in 2010 (38% of the 2010
exceedance).
Inventory improvements added NOX emissions from agriculture that were not
included at the time the ceilings were set, increasing 2010 emissions by 99 kt (35% of
the 2010 exceedance).
National projections made through 2009 overestimated the expected NOX reductions
from planned measures.
The outlook for compliance with the NECD 2010 ceiling and the CLRTAP 2020 target is:
Germany is likely to achieve compliance with NECD 2010 ceiling about 2015 with
current legislation.
Germany would reach its CLRTAP 2020 reduction commitment between 2015 and
2020 according to the GAINS model current legislation projections. National
projections do not indicate compliance by 2020, suggesting additional measures may
be needed.
The reasons for non-compliance and estimation of time for compliance are discussed in
the following sections.
8.2 Independent assessment
Legislation, National Programmes and policies and measures
NECD requires Germany to not to exceed NOx national emission ceilings of 1051 kt from
2010 onwards. The Regulation of July 13, 2004101 directly implements NECD sets
emission ceilings correspond to the ceilings in the Directive.
The German National Programme of 2002102 published in 2001 provides a list of
measures that were either already in force or planned to be implemented prior to 2010.
The programme also quantifies the impacts of a number of these measures. Most of the
101 Verordnung zur Umsetzung EG-rechtlicher Vorschriften, zur Novellierung der Zweiundzwanzigsten Verordnung zur
Durchführung des Bundes-Immissionsschutzgesetzes (Verordnung über Immissionswerte für Schadstoffe in der Luft) und
zur Aufhebung der Dreiundzwanzigsten Verordnung zur Durchführung des Bundes-Immissionsschutzgesetzes
(Verordnung über die Festlegung von Konzentrationswerten) vom 13 Juli 2004 102 National Programme of the Federal Republic of Germany pursuant to Article 6 of Directive 2001/81/EC of 23 October 2001
on national emission ceilings for certain atmospheric pollutants (NEC Directive). August, 2002
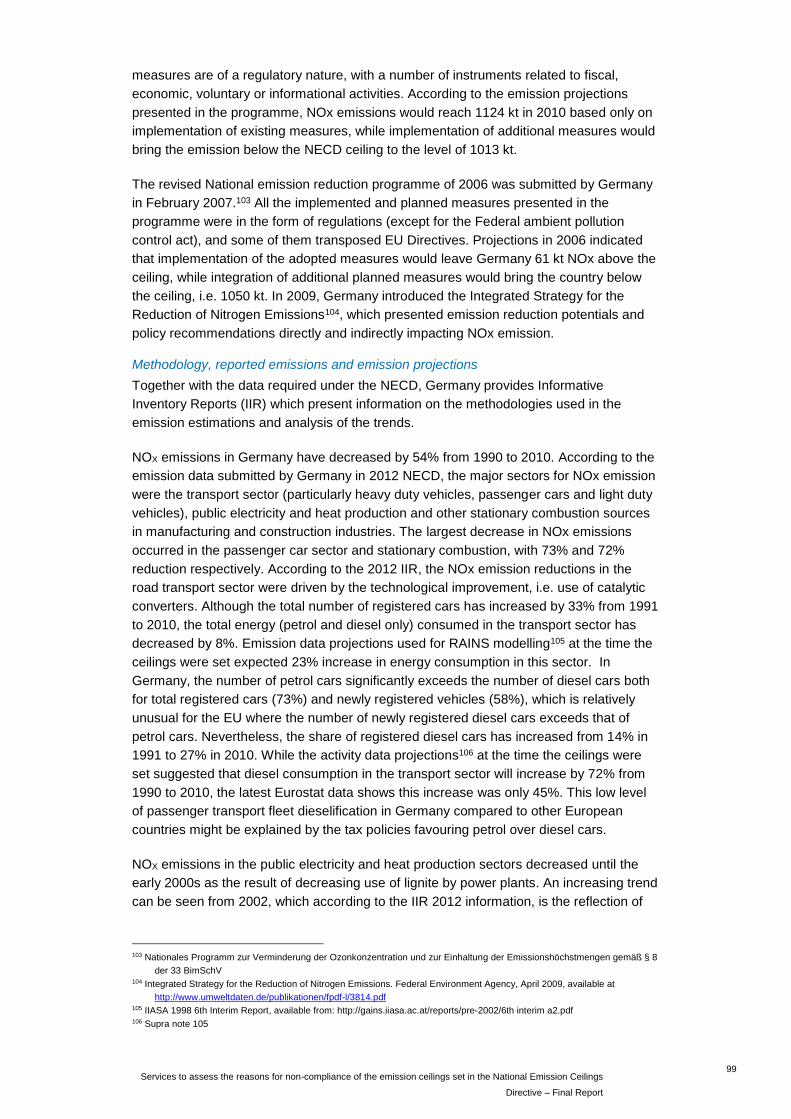
99
Services to assess the reasons for non-compliance of the emission ceilings set in the National Emission Ceilings
Directive – Final Report
measures are of a regulatory nature, with a number of instruments related to fiscal,
economic, voluntary or informational activities. According to the emission projections
presented in the programme, NOx emissions would reach 1124 kt in 2010 based only on
implementation of existing measures, while implementation of additional measures would
bring the emission below the NECD ceiling to the level of 1013 kt.
The revised National emission reduction programme of 2006 was submitted by Germany
in February 2007.103 All the implemented and planned measures presented in the
programme were in the form of regulations (except for the Federal ambient pollution
control act), and some of them transposed EU Directives. Projections in 2006 indicated
that implementation of the adopted measures would leave Germany 61 kt NOx above the
ceiling, while integration of additional planned measures would bring the country below
the ceiling, i.e. 1050 kt. In 2009, Germany introduced the Integrated Strategy for the
Reduction of Nitrogen Emissions104, which presented emission reduction potentials and
policy recommendations directly and indirectly impacting NOx emission.
Methodology, reported emissions and emission projections
Together with the data required under the NECD, Germany provides Informative
Inventory Reports (IIR) which present information on the methodologies used in the
emission estimations and analysis of the trends.
NOX emissions in Germany have decreased by 54% from 1990 to 2010. According to the
emission data submitted by Germany in 2012 NECD, the major sectors for NOx emission
were the transport sector (particularly heavy duty vehicles, passenger cars and light duty
vehicles), public electricity and heat production and other stationary combustion sources
in manufacturing and construction industries. The largest decrease in NOx emissions
occurred in the passenger car sector and stationary combustion, with 73% and 72%
reduction respectively. According to the 2012 IIR, the NOx emission reductions in the
road transport sector were driven by the technological improvement, i.e. use of catalytic
converters. Although the total number of registered cars has increased by 33% from 1991
to 2010, the total energy (petrol and diesel only) consumed in the transport sector has
decreased by 8%. Emission data projections used for RAINS modelling105 at the time the
ceilings were set expected 23% increase in energy consumption in this sector. In
Germany, the number of petrol cars significantly exceeds the number of diesel cars both
for total registered cars (73%) and newly registered vehicles (58%), which is relatively
unusual for the EU where the number of newly registered diesel cars exceeds that of
petrol cars. Nevertheless, the share of registered diesel cars has increased from 14% in
1991 to 27% in 2010. While the activity data projections106 at the time the ceilings were
set suggested that diesel consumption in the transport sector will increase by 72% from
1990 to 2010, the latest Eurostat data shows this increase was only 45%. This low level
of passenger transport fleet dieselification in Germany compared to other European
countries might be explained by the tax policies favouring petrol over diesel cars.
NOX emissions in the public electricity and heat production sectors decreased until the
early 2000s as the result of decreasing use of lignite by power plants. An increasing trend
can be seen from 2002, which according to the IIR 2012 information, is the reflection of
103 Nationales Programm zur Verminderung der Ozonkonzentration und zur Einhaltung der Emissionshöchstmengen gemäß § 8
der 33 BimSchV 104 Integrated Strategy for the Reduction of Nitrogen Emissions. Federal Environment Agency, April 2009, available at
http://www.umweltdaten.de/publikationen/fpdf-l/3814.pdf 105 IIASA 1998 6th Interim Report, available from: http://gains.iiasa.ac.at/reports/pre-2002/6th interim a2.pdf 106 Supra note 105

100
Services to assess the reasons for non-compliance of the emission ceilings set in the National Emission Ceilings
Directive- Final Report
the growing consumption of the biogas, wood and other biomass in this sector. The total
primary consumption of energy in Germany has decreased by 7%, which is a 4% greater
decrease than projected at the time of the RAINS projections development.
According to the IIR 2012, a completely new methodology for emission projections is
used in Germany since 2010. This method allows for integrated assessment of
greenhouse gas emission and air pollution as well as calculation of emissions under
various scenarios. The latest projections (IIR 2012) indicate that in 2015 NOx emission in
Germany will decline to 1182 kt, which is 131 kt above the 2010 NECD ceiling. The NOx
emission level is projected to drop to 1013 kt by 2020.
It should be noted that Germany's national inventories include NOx emissions from two
agricultural sectors that were not originally included in the RAINS model, i.e. 4.D.1.a
synthetic N-fertilizers and 4.D.2.a farm-level agricultural operations including storage,
handling and transport of agricultural products. These two sectors were responsible for
total of 99 kt of NOx emission in 2010 – 7% of the total national emissions and 35% of the
NECD ceiling exceedance in 2010.
Summary
The reasons for Germany's non-compliance with the NECD 2010 NOx ceiling are
summarised in Table 8-2. The contribution to the exceedance is given where it can be
estimated.
Table 8-2 Reasons for Germany's non-compliance with the NECD 2010 NOx ceiling, based on the
independent assessment. Contribution to exceedance is given in kt and percent where
possible.
Contribution to
280.9 kt
Reason kt NOx %
Inclusion of previously not estimated emission sectors: In 2010 the
4.D.1.a and 4.D.2.a sectors contributed 99 kt of NOx emission, or 7% of the
total national emissions and 35% of the NECD ceiling exceedance
99 35%
Euro standard performance for cars: Overestimation of 2010 reductions
from road transport due to higher NOX emissions in real world driving
conditions than the test cycle emissions for the Euro standards
Changes in base year emission estimations
6% increase in base year emission estimations: 2000 CLRTAP vs. 2012
CLRTAP submission
8% increase in base year emission estimations: RAINS vs. 2012 CLRTAP
submission

101
Services to assess the reasons for non-compliance of the emission ceilings set in the National Emission Ceilings
Directive – Final Report
Contribution to
280.9 kt
Reason kt NOx %
Underestimated emission projections: overestimation of expected reduction
from the planned measures
2002 National Programme projections
- With existing measures 1,124 kt
With additional measures 1,013 kt
2006 National Programme projections
- With existing measures 1,112 kt
With additional measures 1,050 kt
Recent growth in consumption of biofuels
Unexpectedly high “dieselification” of the road transport fleet: Increase in
proportion of diesel cars from 14% in 1991 to 27% in 2010. A major contributor
to the increase is lower diesel fuel prices compared to petrol.
8.3 Reasons for non-compliance as identified by Germany
A list of questions was sent to Germany in January 2013 and following a reply, a
telephone interview was held on 29 January with an official from the Federal Ministry for
the Environment, Nature Conservation and Nuclear Safety, and five specialists from the
Federal Environment Agency. Additional information was received after the telephone
interview.
The reasons identified by Germany for the non-compliance with the NECD 2010 NOx
ceiling are summarised in Table 8-3. The contribution to the exceedance is given in kt
where it has been provided by Germany.
Table 8-3 Reasons for Germany's non-compliance with the NECD 2010 NOx ceiling as identified by
Germany. Contribution to NOx emission exceedance is given in kt and percent where
provided by Germany.
Share of 280.9 kt
Reasons for exceedance of 2010 NOx ceiling kt NOx %
It was assumed that the implementation of Euro 3/4 and Euro III-IV
would strongly reduce overall emissions. Real-world driving NOx
emissions are significantly higher than the test-cycle emission limits.
The Euro 5 emission standards have also failed. 18 6%
The proportion of diesel passenger cars is significantly higher than
projected at the time the ceiling was set.
Traffic volumes are higher than originally projected in 1999.
There are higher NOx emissions from biomass combustion due to
"Energiewende". In 2010 this gave an additional 77 kt from energy
and manufacturing industries and 29 kt from small combustion.
106 38%
Delayed and weak EU emission standards for non-road mobile
machinery.

102
Services to assess the reasons for non-compliance of the emission ceilings set in the National Emission Ceilings
Directive- Final Report
Inclusion of agricultural NOx emissions into the inventory increased
emissions by ca. 100 kt/a. These are not fully available for reduction
(so reduction as percentage of 1990 emissions was reduced from
ca. 60% to ca. 55%)
100 36%
The emission inventory at the time NEC ceilings were set was much
less complete and reliable than nowadays. For example, agricultural
emissions and incomplete source disaggregation in other sectors.
Emission projections at the time NEC ceilings were set were less
reliable in many ways. This includes traffic volumes, percentage of
diesel vehicles, vehicle emission factors and energy split (nuclear,
biomass)
The improvement in inventory methodology has in some cases
resulted in an increase of total assessed emissions (IIR 2012).
The difficulty to give reliable estimates for the energy sector, due to
annual changes.
8.4 Expected time of compliance with the 2010 Ceilings
On the basis of recent emission projections from the GAINS model (CLE - current
legislation) and national projections, estimates were made for when Germany may reach
its 2010 ceiling in Table 8-4.
Table 8-4 Summary of projection analysis for Germany on the year to attain the 2010 ceiling (1051
kt). Emissions in kt/year – fuel sold
, Reported emissions for previous
years, used for reference, kt Projections, kt
2010 fuel 2005 2010 2015 2020 2025 2030
ceiling basis GAINS Rep. GAINS Rep. GAINS Nat. GAINS Nat. GAINS Nat. GAINS Nat.
1051 sold 1413 1462 1219 1228 991 1076 751 902 615 549
Data sources: GAINS online - scenario: TSAP_Mar13_CLE (current legislation); National emissions and WM
(with measures) projections from NECD and CLRTAP submissions through March 2013.
Notes: NFR categories 4D1 (emissions from soils) and 4D2 (handling of agricultural products) are deducted
from national values to ensure a coherent approach between Member States and enable comparison with the
GAINS model projections.
Conclusion for NECD 2010 ceiling
Based on the analysis made, Germany is likely to achieve compliance with NECD
2010 ceiling in about 2015 with current legislation.
8.5 Impact on Future Reduction Commitments
Table 8-5 gives an estimation of when the GP 2020 ceilings are likely to be reached,
based on the latest available national emission projection(s) and the results of GAINS
model projection (scenario: TSAP_Mar13_CLE (current legislation)). National projections
are compared to a target level based on the currently reported emission in 2005. To
minimize any bias in GAINS model projections, the GAINS model projections are
compared to a target level based on the GAINS projection for 2005.
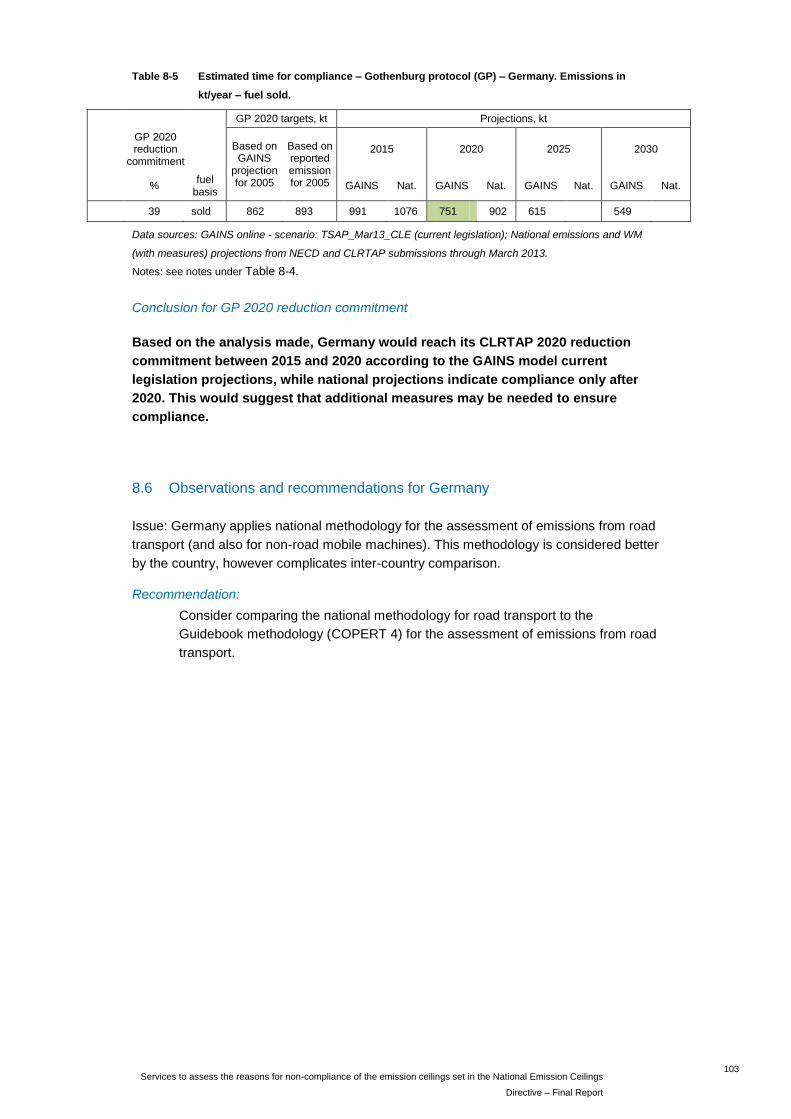
103
Services to assess the reasons for non-compliance of the emission ceilings set in the National Emission Ceilings
Directive – Final Report
Table 8-5 Estimated time for compliance – Gothenburg protocol (GP) – Germany. Emissions in
kt/year – fuel sold.
GP 2020 targets, kt Projections, kt
GP 2020 reduction
commitment Based on
GAINS projection for 2005
Based on reported emission for 2005
2015 2020 2025 2030
% fuel
basis GAINS Nat. GAINS Nat. GAINS Nat. GAINS Nat.
39 sold 862 893 991 1076 751 902 615 549
Data sources: GAINS online - scenario: TSAP_Mar13_CLE (current legislation); National emissions and WM
(with measures) projections from NECD and CLRTAP submissions through March 2013.
Notes: see notes under Table 8-4.
Conclusion for GP 2020 reduction commitment
Based on the analysis made, Germany would reach its CLRTAP 2020 reduction
commitment between 2015 and 2020 according to the GAINS model current
legislation projections, while national projections indicate compliance only after
2020. This would suggest that additional measures may be needed to ensure
compliance.
8.6 Observations and recommendations for Germany
Issue: Germany applies national methodology for the assessment of emissions from road
transport (and also for non-road mobile machines). This methodology is considered better
by the country, however complicates inter-country comparison.
Recommendation:
Consider comparing the national methodology for road transport to the
Guidebook methodology (COPERT 4) for the assessment of emissions from road
transport.

104
Services to assess the reasons for non-compliance of the emission ceilings set in the National Emission Ceilings
Directive- Final Report
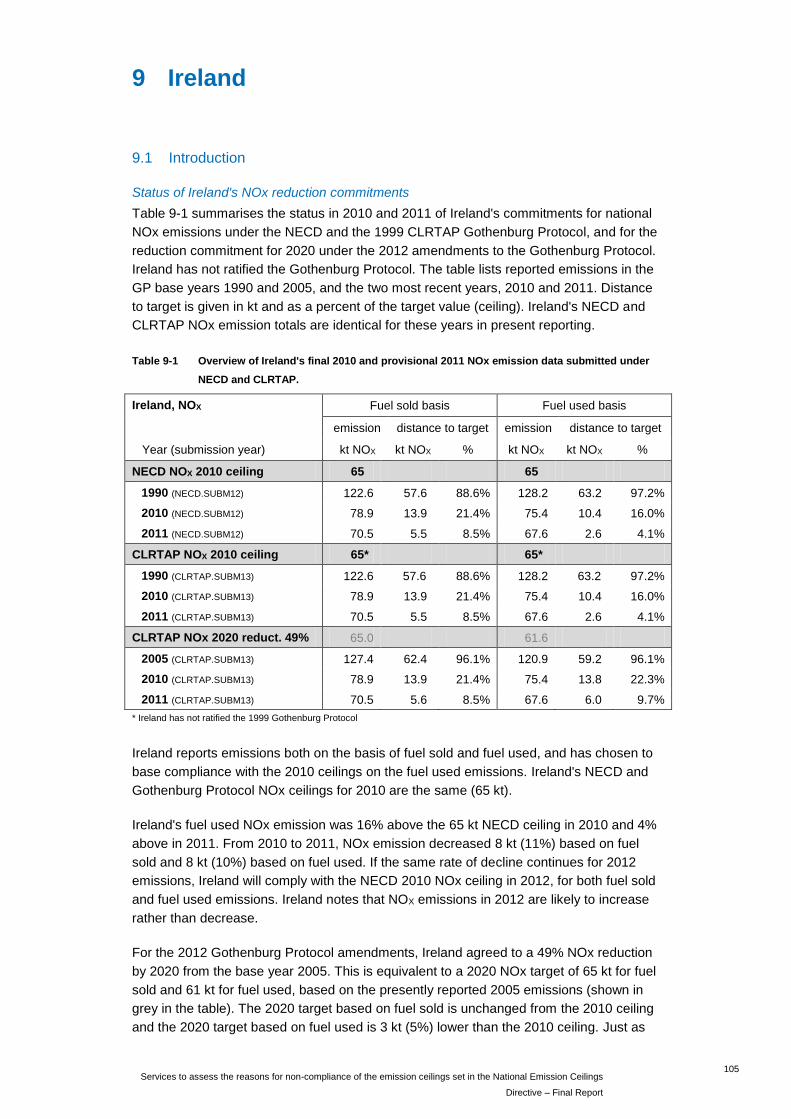
105
Services to assess the reasons for non-compliance of the emission ceilings set in the National Emission Ceilings
Directive – Final Report
9 Ireland
9.1 Introduction
Status of Ireland's NOx reduction commitments
Table 9-1 summarises the status in 2010 and 2011 of Ireland's commitments for national
NOx emissions under the NECD and the 1999 CLRTAP Gothenburg Protocol, and for the
reduction commitment for 2020 under the 2012 amendments to the Gothenburg Protocol.
Ireland has not ratified the Gothenburg Protocol. The table lists reported emissions in the
GP base years 1990 and 2005, and the two most recent years, 2010 and 2011. Distance
to target is given in kt and as a percent of the target value (ceiling). Ireland's NECD and
CLRTAP NOx emission totals are identical for these years in present reporting.
Table 9-1 Overview of Ireland's final 2010 and provisional 2011 NOx emission data submitted under
NECD and CLRTAP.
Ireland, NOX Fuel sold basis Fuel used basis
emission distance to target emission distance to target
Year (submission year) kt NOX kt NOX % kt NOX kt NOX %
NECD NOX 2010 ceiling 65 65
1990 (NECD.SUBM12) 122.6 57.6 88.6% 128.2 63.2 97.2%
2010 (NECD.SUBM12) 78.9 13.9 21.4% 75.4 10.4 16.0%
2011 (NECD.SUBM12) 70.5 5.5 8.5% 67.6 2.6 4.1%
CLRTAP NOX 2010 ceiling 65* 65*
1990 (CLRTAP.SUBM13) 122.6 57.6 88.6% 128.2 63.2 97.2%
2010 (CLRTAP.SUBM13) 78.9 13.9 21.4% 75.4 10.4 16.0%
2011 (CLRTAP.SUBM13) 70.5 5.5 8.5% 67.6 2.6 4.1%
CLRTAP NOx 2020 reduct. 49% 65.0 61.6
2005 (CLRTAP.SUBM13) 127.4 62.4 96.1% 120.9 59.2 96.1%
2010 (CLRTAP.SUBM13) 78.9 13.9 21.4% 75.4 13.8 22.3%
2011 (CLRTAP.SUBM13) 70.5 5.6 8.5% 67.6 6.0 9.7%
* Ireland has not ratified the 1999 Gothenburg Protocol
Ireland reports emissions both on the basis of fuel sold and fuel used, and has chosen to
base compliance with the 2010 ceilings on the fuel used emissions. Ireland's NECD and
Gothenburg Protocol NOx ceilings for 2010 are the same (65 kt).
Ireland's fuel used NOx emission was 16% above the 65 kt NECD ceiling in 2010 and 4%
above in 2011. From 2010 to 2011, NOx emission decreased 8 kt (11%) based on fuel
sold and 8 kt (10%) based on fuel used. If the same rate of decline continues for 2012
emissions, Ireland will comply with the NECD 2010 NOx ceiling in 2012, for both fuel sold
and fuel used emissions. Ireland notes that NOX emissions in 2012 are likely to increase
rather than decrease.
For the 2012 Gothenburg Protocol amendments, Ireland agreed to a 49% NOx reduction
by 2020 from the base year 2005. This is equivalent to a 2020 NOx target of 65 kt for fuel
sold and 61 kt for fuel used, based on the presently reported 2005 emissions (shown in
grey in the table). The 2020 target based on fuel sold is unchanged from the 2010 ceiling
and the 2020 target based on fuel used is 3 kt (5%) lower than the 2010 ceiling. Just as

106
Services to assess the reasons for non-compliance of the emission ceilings set in the National Emission Ceilings
Directive- Final Report
for the 2010 ceiling, if the rate of decline seen from 2010 to 2011 continues in 2012, the
new 2020 target could be reached in 2012, for both fuel sold and fuel used emissions.
Summary of conclusions
The main reasons for Ireland's non-compliance with the NECD 2010 NOx ceiling are:
Vehicle NOx emissions (primarily diesel) under real-world driving conditions are much
higher than expected for Euro 1-5/I-V standards. An ETC/ACC study estimated 20 kt
additional NOX in 2010 (144% of 2010 exceedance based on fuel sold) due to
revisions of exhaust emission factors from the 1999 RAINS projections to COPERT 4
v8.0. Ireland attributes 15 kt to the failure of the Euro standards (144% of the 2010
exceedance based on fuel used).
Ireland had the second highest growth in overall road transport fuel consumption (fuel
sold) among the EU-15. Ireland's 60% diesel share in 2010 was not unusual among
the EU-15, but it was much higher than assumed in 1999. The ETC/ACC study
estimated the increase in vehicle activity and change in fleet composition compared
to the 1999 RAINS assumptions added 5 kt to the 2010 NOX emission (36% of the
2010 exceedance based on fuel sold).
Economic growth was much higher than assumed in 1999, particularly in the
construction industry. GDP increased 127% from 1995 to 2008, but has declined 6%
from 2008 to 2010.
Inventory improvements added emissions from agriculture (fishing) that were not
included at the time the ceilings were set, adding nearly 2 kt to the 2010 NOX
emission (18% of the 2010 exceedance).
Reduction of CO2 emissions via combustion units below 50 MW has increased NOX
emissions.
The outlook for compliance with the NECD 2010 ceiling and the CLRTAP 2020 target is:
Ireland is projected to comply with the NECD 2010 ceiling shortly after 2015 by
national projections. The level projected for 2015 has already been reached in 2011,
so compliance could be obtained before 2015. The GAINS model, which
overestimates emissions in 2005 (11%) and 2010 (20%), projects compliance shortly
after 2020 with current legislation.
Ireland is projected to comply with its CLRTAP 2020 reduction commitment shortly
after 2015 by national projections and reported emissions in 2011 have already
reached the level projected for 2015. The GAINS model projects compliance between
2020 and 2025, with current legislation.
The reasons for non-compliance and estimation of time for compliance are discussed in
the following sections.
9.2 Independent assessment
Legislation, National Programmes and policies and measures
According to NECD Annex I, Ireland was to attain 65 kt NOx emissions by 2010, which
corresponds to the ceilings established in Gothenburg’s Protocol. The NEC Directive is
107
Services to assess the reasons for non-compliance of the emission ceilings set in the National Emission Ceilings
Directive – Final Report
transposed to Irish system through European Communities (National Emission Ceilings)
Regulations 2004107 reflecting emission ceilings set in the Directive.
Ireland’s first National Programme under the NECD was published in June 2003. The
programme presents measures that were already in place and additional measures that
were planned to be implemented before 2010, including regulatory, fiscal and voluntary
measures. The programme identifies the transport sector as being the most problematic,
and indicates the need for assessment of cost and benefits of proposed measures and
development of synergies with other relevant programmes and strategies including
climate change strategy. The projections presented in the National Programme show that
even the implementation of additional measures proposed in the programme would not
bring the NOx emission level below the 2010 NECD ceiling, exceeding it by 17 kt.
The National Programme concluded that taking into consideration the knowledge
available at the time and the national circumstances, achievement of NOx emission
ceiling would be prohibitively expensive for the national economy.
The review of the national programme was finished in 2007. The revised programme
stated that Ireland is in a difficult position regarding NOx emissions and additional
measures are needed to move closer to the ceiling. Besides providing the list of
implemented measures, the programme included examples of additional measures and
assumptions required to further reduce NOx emissions, such as renewable energy
making up 18% of total energy consumed by 2010 (linear increase to 30% by 2020),
increase of wind energy component up to 14% of total energy production, assumption of
strict BAT (500 mg/m3) for cement sector, examination of viability of retrofitting scheme
for HDVs and captive fleets.
The incorporated emission projections demonstrated that under “with measures” scenario
NOx emission ceiling will be exceeded by 33 kt in 2010, while emission estimated based
of “with additional measures” scenarios would leave Ireland 28 kt above the ceiling.
Methodology, reported emissions and emission projections
Compliance with the CLRTAP and NECD ceilings for Ireland is assessed based on “fuel
used”. For the purpose of the emission reporting (both under CLRTAP and NECD
submissions) national emissions are reported based on “fuel sold” (using data from the
energy balance), together with the national total and emissions from the transport sector
calculated based on “fuel used”.
According to the 2012 NECD submission, the total NOx emission in Ireland in 2010 was
79 kt based on “fuel sold” and 75 kt based on “fuel used”, which are 14 kt or 10 kt above
the ceiling. From 1990 to 2020, the total NOx emission have decreased by 36% based on
fuel sold and by 41% based on fuel used.
At the beginning of the 1990s, the main source of NOx emissions in Ireland was public
electricity and heat production sector, which according to the 2012 IIR experience a
decline in the emissions of 75% or 35 kt by 2010. This can be explained by the significant
change from oil and solid fuels to gas. Road transport NOx emissions contributed 50% of
total (based on fuel used) in 2010.
107 European Communities (National Emissions Ceilings) Regulations 2004. SI n° 10 of 13/1/2004
108
Services to assess the reasons for non-compliance of the emission ceilings set in the National Emission Ceilings
Directive- Final Report
While NOx emissions in passenger transport have decreased dramatically (61%),
emissions from heavy vehicles and light duty vehicles have been increasing during the
same period (5% and 87% respectively), with a slight decline after 2008, which coincides
with the economic downturn.
Reductions in NOx emissions from passenger cars and heavy-duty vehicles resulting
from the technology improvements (such as use of catalytic converters), in Ireland have
been largely offset by the significant increase in the number of passenger cars (119%
from 1992 to 2007108) as well as growing freight volumes (55% increase in the volume of
national road freight transport (2000-2011) and increase in from proportion of freight
transported by road from 90% in 1990 to 99% in 2010). Moreover, the role of diesel cars
in the road transport fleet has become more significant. The share of diesel cars in
Ireland has increased from 12% in 1992 to 18% in 2007. The volume of used diesel fuel
in transport sector has increased by 241% from 1990 to 2010, which is a much greater
increase than had been expected at the time the ceilings were set109 (141%). The total
final energy consumed by transport sector has increased by 130% from 1990 to 2010.
The comparison of prices for diesel and petrol fuel in Ireland shows no observable
preference between the two fuel types. At the same time, fuel prices were in general
lower in Ireland than in the UK, which explains the significant impact of “fuel tourism”.
According to the Pilot response110 submitted by Ireland in 2010, the difference between
the vehicle emissions calculated based on knowledge at the time the ceilings were set
ant emissions based on the recent knowledge of real world driving emissions amounted
to 15 kt (23% of the NOx ceiling, 144% of the 2010 exceedance).
Emissions from stationary combustion in manufacturing industry have increased by 16%
since 1990. According to the IIR 2012, the main contribution to this increase came from
the cement production sector which experienced significant growth during the last decade
driven by the high economic growth, which was not foreseen at the time the ceilings were
set.
The most recent emission projections submitted in March 2013 (CLRTAP) indicate that
NOx emissions in Ireland in 2020 will decline to 56 kt based on the “with measures”
scenario, or 54 kt “with additional measures”, both below the 2010 ceiling and the GP
2020 reduction target.
Summary
The reasons for Ireland's non-compliance with the NECD 2010 NOx ceiling are
summarised in Table 9-2. The contribution to the exceedance is given in kt where it can
be estimated.
108 In comparison to 36.5% in BE, 38% in DE, 40% in NL, 37% in UK; due to incomplete data available from Eurostat is it
impossible to adequately estimate EU-27 average. 109 IIASA Seventh Interim Report, 1999, available from: http://www.iiasa.ac.at/~rains/reports/ir7.pdf 110 Pilot Response by Ireland (Reference - 13.8.4 vol 2) in response to the Pilot request (Reference - DG ENV C.3 PV/cl Ares
(2010))
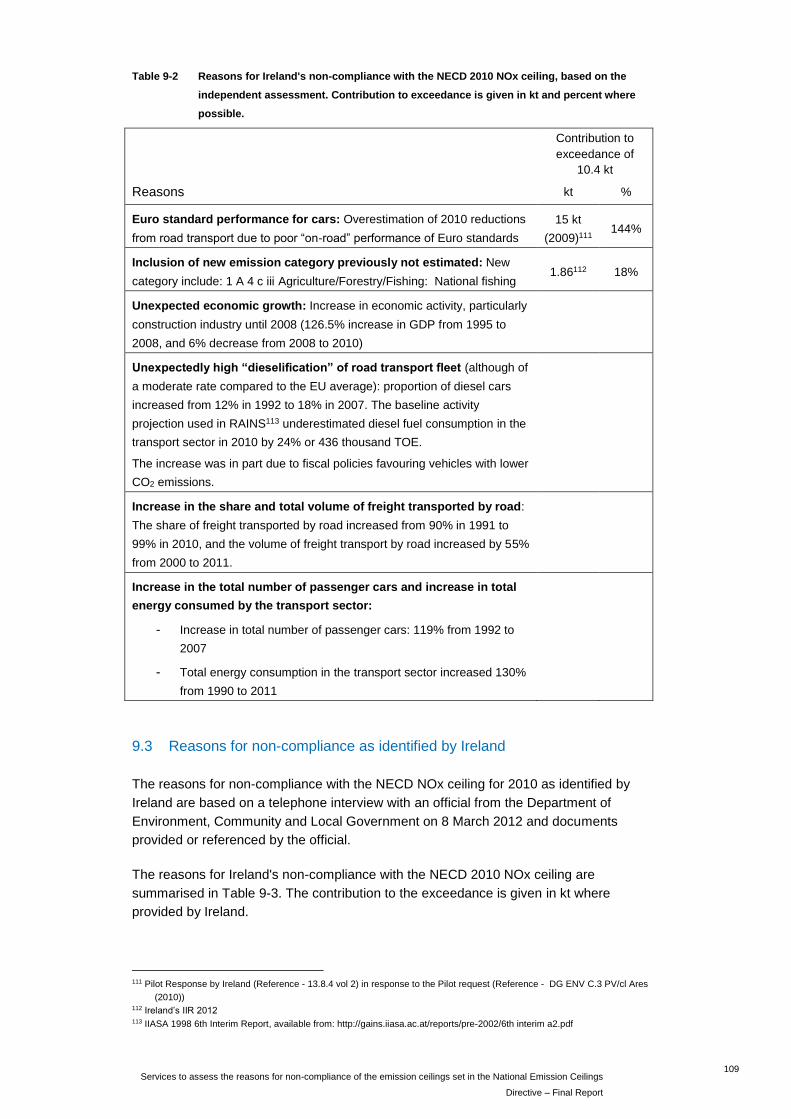
109
Services to assess the reasons for non-compliance of the emission ceilings set in the National Emission Ceilings
Directive – Final Report
Table 9-2 Reasons for Ireland's non-compliance with the NECD 2010 NOx ceiling, based on the
independent assessment. Contribution to exceedance is given in kt and percent where
possible.
Contribution to
exceedance of
10.4 kt
Reasons kt %
Euro standard performance for cars: Overestimation of 2010 reductions
from road transport due to poor “on-road” performance of Euro standards
15 kt
(2009)111 144%
Inclusion of new emission category previously not estimated: New
category include: 1 A 4 c iii Agriculture/Forestry/Fishing: National fishing 1.86112 18%
Unexpected economic growth: Increase in economic activity, particularly
construction industry until 2008 (126.5% increase in GDP from 1995 to
2008, and 6% decrease from 2008 to 2010)
Unexpectedly high “dieselification” of road transport fleet (although of
a moderate rate compared to the EU average): proportion of diesel cars
increased from 12% in 1992 to 18% in 2007. The baseline activity
projection used in RAINS113 underestimated diesel fuel consumption in the
transport sector in 2010 by 24% or 436 thousand TOE.
The increase was in part due to fiscal policies favouring vehicles with lower
CO2 emissions.
Increase in the share and total volume of freight transported by road:
The share of freight transported by road increased from 90% in 1991 to
99% in 2010, and the volume of freight transport by road increased by 55%
from 2000 to 2011.
Increase in the total number of passenger cars and increase in total
energy consumed by the transport sector:
- Increase in total number of passenger cars: 119% from 1992 to
2007
- Total energy consumption in the transport sector increased 130%
from 1990 to 2011
9.3 Reasons for non-compliance as identified by Ireland
The reasons for non-compliance with the NECD NOx ceiling for 2010 as identified by
Ireland are based on a telephone interview with an official from the Department of
Environment, Community and Local Government on 8 March 2012 and documents
provided or referenced by the official.
The reasons for Ireland's non-compliance with the NECD 2010 NOx ceiling are
summarised in Table 9-3. The contribution to the exceedance is given in kt where
provided by Ireland.
111 Pilot Response by Ireland (Reference - 13.8.4 vol 2) in response to the Pilot request (Reference - DG ENV C.3 PV/cl Ares
(2010)) 112 Ireland’s IIR 2012 113 IIASA 1998 6th Interim Report, available from: http://gains.iiasa.ac.at/reports/pre-2002/6th interim a2.pdf

110
Services to assess the reasons for non-compliance of the emission ceilings set in the National Emission Ceilings
Directive- Final Report
Table 9-3 Reasons for Ireland's non-compliance with the NECD 2010 NOx ceiling as identified by
Ireland. Contribution to NOx emission exceedance is given in kt and percent where
provided by Ireland.
Share of 10.4 kt
Reason kt NOx %
Failure of the Euro standards. 15 144%
Actual economic growth in Ireland since 1990 has been much
higher than foreseen at the time the ceiling was set
Due to high economic growth, transport activity in 2010 was much
higher than projected in 1999.
Construction activity in 2010 was higher than projected in 1999.
The vehicle fleet in Ireland is comparatively young, but the smaller
reductions in real world diesel NOx emissions, or even increase in
the case of Euro 5, reduces the benefit of rapid fleet turnover on
NOx emissions.
Implementation of emission reduction technologies has been
greater than projected in 1999, but this has been insufficient to
compensate for the unexpected growth and Euro failure.
9.4 Expected time of compliance with the 2010 Ceilings
On the basis of recent emission projections from the GAINS model (CLE - current
legislation) estimates were made for when Ireland may reach its 2010 ceiling in Table
9-4.
Table 9-4 Summary of projection analysis for Ireland on the year to attain the 2010 ceiling (65 kt).
Emissions in kt/year
, Reported emissions for previous
years, used for reference, kt Projections, kt
2010 fuel 2005 2010 2015 2020 2025 2030
ceiling basis GAINS Rep. GAINS Rep. GAINS Nat. GAINS Nat. GAINS Nat. GAINS Nat.
65 sold 142 127 95 79 95 67 86 56 65 47 49
used 135 121 91 75 91 64 82 54 62 45 47
Data sources: GAINS online - scenario: TSAP_Mar13_CLE (current legislation); National emissions and WM
(with measures) projections from NECD and CLRTAP submissions through March 2013.
Notes:
a. Values based on fuel used are the basis for compliance assessment. Calculations of NOX emissions in the
GAINS model are based on fuel sold.
b. The GAINS values based on fuel used are estimated here based on the fuel used/fuel sold ratio from
national emissions or projections in the same year.
Conclusion for NECD 2010 ceiling
Based on the analysis made, Ireland is projected to comply with the NOX ceiling
shortly after 2015 by national projections. The level projected for 2015 has already
been reached in 2011, but Ireland indicates that national NOX emissions in 2012 are
likely to increase. The GAINS model, which overestimates emissions in 2005 (11%)
and 2010 (20%), projects compliance shortly after 2020 with current legislation.

111
Services to assess the reasons for non-compliance of the emission ceilings set in the National Emission Ceilings
Directive – Final Report
9.5 Impact on future reduction commitments
Table 9-5 gives an estimation of when the GP 2020 ceilings are likely to be reached,
based on the results of GAINS projection (scenario: TSAP_Mar13_CLE (current
legislation)). National projections are compared to a target level based on the currently
reported emission in 2005. To minimize any bias in GAINS model projections, the GAINS
model projections are compared to a target level based on the GAINS projection for
2005.
Table 9-5 Estimated time for compliance – Gothenburg protocol (GP) – Ireland. Emissions in kt/year.
GP 2020 targets, kt Projections, kt
GP 2020 reduction
commitment Based on
GAINS projection for 2005
Based on reported emission for 2005
2015 2020 2025 2030
% fuel
basis GAINS Nat. GAINS Nat. GAINS Nat. GAINS Nat.
49 sold 72 65 95 67 86 56 65 47 49
used 69 62 91 64 82 54 62 45 47
Data sources: GAINS online - scenario: TSAP_Mar13_CLE (current legislation); National emissions and WM
(with measures) projections from NECD and CLRTAP submissions through March 2013.
Notes: see notes under Table 9-4.
Conclusion for GP 2020 reduction commitment
Based on the analysis made, Ireland is likely to comply shortly after 2015
according to national projections. Reported emissions in 2011 have already
reached the level projected for 2015 by the national projection, but Ireland
indicates that national NOX emissions in 2012 are likely to increase. The GAINS
model projects compliance between 2020 and 2025, with current legislation.

112
Services to assess the reasons for non-compliance of the emission ceilings set in the National Emission Ceilings
Directive- Final Report

113
Services to assess the reasons for non-compliance of the emission ceilings set in the National Emission Ceilings
Directive – Final Report
10 Luxembourg
10.1 Introduction
Status of Luxembourg's NOX reduction commitments
Table 10-1 summarises the status in 2010 and 2011 of Luxembourg's commitments for
national NOx emissions under the NECD and the 1999 CLRTAP Gothenburg Protocol,
and for the reduction commitment for 2020 under the 2012 amendments to the
Gothenburg Protocol. The table lists reported emissions in the GP base years 1990 and
2005, and the two most recent years, 2010 and 2011. Distance to target is given in kt and
as a percent of the target value (ceiling). Luxembourg's NECD and CLRTAP NOx
emission totals are different for these years in present reporting, apparently due to
differences in source categories included in the NECD and CLRTAP inventory reporting.
Table 10-1 Overview of Luxembourg's final 2010 and provisional 2011 NOx emission data submitted
under NECD and CLRTAP.
Luxembourg, NOX Fuel sold basis Fuel used basis
emission distance to target emission distance to target
Year (submission year) kt NOX kt NOX % kt NOX kt NOX %
NECD NOX 2010 ceiling 11 11
1990 (NECD.SUBM11) 41.5* 30.5 277.2% 23.8 12.8 116.3%
2010 (NECD.SUBM12) 46.1 35.1 319.4% 17.9 6.9 63.0%
2011 (NECD.SUBM12) 48.2 37.2 338.1% 18.0 7.0 64.0%
CLRTAP NOX 2010 ceiling 11 11
1990 (CLRTAP.SUBM13) 38.7 27.7 252.1% 21.0 10.0 91.1%
2010 (CLRTAP.SUBM13) 45.8 34.8 316.4% 17.6 6.6 60.0%
2011 (CLRTAP.SUBM13) 47.9 36.9 335.1% 17.7 6.7 60.9%
CLRTAP NOx 2020 reduct. 43% 35.2 10.8
2005 (CLRTAP.SUBM13) 61.8 26.6 75.4% 18.9 8.1 75.4%
2010 (CLRTAP.SUBM13) 45.8 10.6 30.1% 17.6 6.8 63.1%
2011 (CLRTAP.SUBM13) 47.9 12.6 35.9% 17.7 6.9 64.1%
* Luxembourg has not reported the 1990 NOx emission under NECD based on fuel sold. The 1990 NECD fuel sold value is
estimated from the fuel used value (NECD.SUBM11), adjusted by the difference between CLRTAP 1990 fuel sold and fuel used emissions (CLRTAP.SUBM13).
Luxembourg reports emissions both on the basis of fuel sold and fuel used, and has
chosen to base compliance with the 2010 ceilings on the fuel used emissions.
Luxembourg's fuel used NOX emission was 63% above the 11 kt NECD ceiling in 2010
and 64% above in 2011. NOX emissions increased slightly from 2010 to 2011 based on
fuel used (0.1 kt, 0.6%), and 2.1 kt (5%) based on fuel sold.
Emissions based on fuel sold have been much higher than based on fuel used, due to
high levels of "tank tourism" in Luxembourg. Reported NOx emissions based on fuel sold
were 74% higher than the fuel used emission in 1990, increasing to 227% higher than
fuel used in 2005 before declining to the present 168% greater than fuel used emissions.
The difference between fuel sold and fuel used NOx emissions was 28 kt in 2010 and 30
kt in 2011.

114
Services to assess the reasons for non-compliance of the emission ceilings set in the National Emission Ceilings
Directive- Final Report
The Gothenburg Protocol 2020 reduction commitment for Luxemburg – 43% NOX
reduction between 2005 and 2020 – was based on the need to continue to respect the
existing 2010 NOx ceiling in the NECD (11 kt NOx). The equivalent NOX target value in
2020 is also 11 kt (rounded) based on the presently reported 2005 fuel used emission.
The target based on fuel sold is 35 kt (targets shown in grey in the table).
Summary of conclusions
The main reasons for Luxembourg's non-compliance with the NECD 2010 NOx ceiling
are:
Vehicle NOX emissions (primarily diesel) under real-world driving conditions are much
higher than expected for Euro 1-5/I-V standards.
The population growth rate and economic growth rate have been much higher than
assumed in 1999 RAINS projections.
Commuters living in the border regions around Luxembourg correspond to an
additional 30% of the population. Non-resident commuter traffic was not included in
projections at the time the ceilings were set.
Primary energy consumption in 2010 was 51% greater than assumed for the 1999
RAINS projections. In contrast, almost all other EU-15 states had lower primary
energy consumption in 2010 than was assumed in 1999.
Luxembourg had the greatest increase (146%) in road transport fuel consumption
(fuel sold) from 1990 to 2010 among the EU-15. The difference in growth rate from
that assumed in 1999 (21%) was also the largest among the EU-15. NOX emissions
from heavy duty diesel vehicles increased 59% from 1990 to 2010, while emissions
declined in this sector in many Member States.
Diesel fuel consumption for road transport increased 287% (fuel sold114) from 1990 to
2010 - the largest percentage increase among the EU-15 - while petrol consumption
only declined by 15%. The diesel share of road transport fuel consumption was 83%
in 2010, twice the share estimated when the ceilings were set (41%). The high
dieselification is largely the result of climate policy to reduce CO2 emissions, including
CO2-based vehicle tax and diesel fuel tax incentive.
A new gas-fired 350 MWel co-generation plant began operation in 2002, replacing
electricity previously imported and adding 0.5 kt NOX (8% of the 2010 exceedance).
Luxembourg has not submitted any national informative inventory reports or national
emission projections for years after 2010, making it more challenging to identify and
adopt compensatory additional measures.
The outlook for compliance with the NECD 2010 ceiling and the CLRTAP 2020 target is:
The GAINS model, with a rough adjustment to fuel used basis, projects Luxembourg
to comply with the 2010 ceiling shortly after 2010. Without a national projection or
estimate of future fuel export for adjustment of the GAINS projections, this result is
much more uncertain than the others.
Luxembourg is likely to comply with its CLRTAP 2020 commitment before 2015
according to the GAINS model.
114 Eurostat statistics and reporting under the EU GHG Monitoring Mechanism include road transport fuel consumption (TJ) by
fuel type, based on fuel sold, but data is not generally available by fuel type for fuel consumption based on fuel used.

115
Services to assess the reasons for non-compliance of the emission ceilings set in the National Emission Ceilings
Directive – Final Report
The reasons for non-compliance and estimation of time for compliance are discussed in
the following sections.
10.2 Independent assessment
Legislation, National Programmes and policies and measures
Luxembourg’s NECD NOx ceiling for 2010 is 11 kt. The same ceiling value is given in the
Gothenburg Protocol. These requirements have been transposed into national legislation
by Regulation of November 8, 2002115, which explicitly states the values of national
emission ceilings and presents a basis for development and submission of a programme
for progressive reduction of the pollutants at issue.
Luxembourg’s first National Programme under NECD was completed in 2003. The
programme presented policies and measures implemented at the time of the National
Programme development (“Business-as-usual”). Additionally, planned measures with
estimated emission reductions and some additional measures were included in the
programme. Projections under the “business-as-usual” scenario indicated that the NOX
emission in 2010 would be 14.2 kt, which is more than 4 kt (29%) above the ceiling.
Luxembourg acknowledged the need for additional policies and measures. According to
the 2003 programme, implementation of all proposed measures, including the most
expensive and economically unfeasible measures, would reduce the NOX emission to a
level below the NECD ceiling, i.e. 10.9 kt.
The revised National Programme116 was published in December 2008, two years after the
deadline provided by the NECD. NOX emissions projections in the 2008 National
Programme are lower than those in the 2002 National Programme (due to changes in
emission factors). NOX emission projections under the “business-as-usual” scenario were
expected to be 1.7 kt (15%) above the NECD ceiling. However, the review of the
programme provided no information on the planned measures which could be
implemented in order to bring the NOX emission under the ceiling by 2010.
In 2010, Luxembourg provided information117 on additional measures that were
considered to be necessary for progress towards the NOx ceiling. These mostly focused
on transport sector. It was argued that these additional measures were expected to
“reduce NOx emissions to 11 kt by 2010, or at least as soon as possible”.
Methodology, reported emissions and emission projections
Luxembourg has not submitted any Informative Inventory Reports (IIR) together with their
emission inventory data since 2008. There is thus no information on the inventory or
projection methodologies or the activity data used. Annual submissions included only a
single inventory year each year until 2011, when recalculated emissions for years 1990 to
2009 were submitted.
Luxembourg is among the countries which base compliance with the NECD ceilings on
“fuel used” emissions. The 2012 submission indicated that the difference between the
total annual NOx emissions based on fuel sold and fuel used in 2010 was 28.3 kt (257%
of the NECD ceiling).
115 Règlement grand-ducal du 8 novembre 2002 portant application de la directive 2001/0081/CE fixant des plafonds d'émission
nationaux pour certains pollutants atmosphériques Mémorial A n° 129 du 02/12/2002 p. 3032 116 Révision du programme national de réduction des émissions de SO2, NOx, COV et NH3, décembre 12, 2008 117 Reference: AEV/NEC/DGENV15_06_2010 M10/1772

116
Services to assess the reasons for non-compliance of the emission ceilings set in the National Emission Ceilings
Directive- Final Report
Notable differences in the total NOx emission reported in different years by Luxembourg
can be identified, signalling that recalculation took place. However, no details on the
reasons for or nature of these changes are provided.
The NECD emission inventory submitted in 2012 shows total NOx emissions in
Luxembourg in 2010 based on “fuel used” were 17.9 kt, which is 6.9 kt or 63% above the
NECD ceiling. Total NOx emissions based on fuel sold have increased by 19% from 1990
to 2010, while emissions based on fuel used have increased 14%.
The major NOx emission contributing sector in Luxembourg in 2010 was road transport.
Heavy duty vehicles are responsible for more than 56% of total emission (based on “fuel
sold”). When assessed based on “fuel used” (NECD 2011 submission) different major
emitting sectors can be identified, i.e. public electricity and heat production, heavy duty
vehicles and stationary combustion in manufacturing industries and construction each
contribute approximately 16% of total NOx emission, closely followed by passenger
transport with 15% of total emissions. Only in the stationary combustion sectors have
NOx emissions decreased from 1990 to 2010 (6%). Emissions in other major NOx
contributing sectors have increased during the same period.
The upward trend in the NOx emissions in the road transport sector coincides with the
growth in the total number of registered vehicles (52%), as well as significant increase in
the share of diesel cars in Luxembourg in the past decade (from 17% in 1993 to 62% in
2009). The energy consumption in transport sector (petrol and diesel only) has increased
by 146% from 1990 to 2010. In contrast, at the time the ceilings were set118, this increase
was expected to reach only 21%. Moreover, 1998 activity data projections indicated that
diesel consumption would increase by 17%, while the latest Eurostat data shows that the
actual increase amounted to 305%. The share of road transport in the freight transport
sector has also increased by more than 10% since 1990. The price of diesel fuel in
Luxembourg has been significantly lower than petrol prices during the reviewed period.
Moreover, fuel prices were also considerably lower compared to the neighbouring
countries, which explains the significant impact of “fuel tourism” in the country.
In the past two decades, final energy consumption in the industrial sector has significantly
decreased (60%), particularly in oil and solid fuels. A considerable impact on the NOx
emissions was brought about by the new co-generation power plant with the capacity of
350 MW which went online in 2002. According to the national estimations this resulted in
additional NOx emissions of approximately 0.5 kt. The increase in population of 33% from
1990 was presented as one of the significant factors responsible for the increase in the
energy consumption, particularly in transport sector.
Luxembourg submitted no emission projections other than those presented in the both
editions of National Programmes.
Summary
The reasons for Luxembourg's non-compliance with the NECD 2010 NOX ceiling are
summarised in Table 10-2. The contribution to the exceedance is given in kt where it can
be estimated.
118 IIASA 1998 6th Interim Report, available from: http://gains.iiasa.ac.at/reports/pre-2002/6th interim a2.pdf

117
Services to assess the reasons for non-compliance of the emission ceilings set in the National Emission Ceilings
Directive – Final Report
Table 10-2 Reasons for Luxembourg's non-compliance with the NECD 2010 NOx ceiling, based on the
independent assessment. Contribution to exceedance is given in kt and percent where
possible.
Contribution to
exceedance of
6.9 kt
Reason kt NOx %
New co-generation plant installed in 2002 0.5119 8%
Unexpected increase in total number of passenger cars and energy
consumption in transport sector:
- Increase in total number of passenger cars: 52%
- Increase in total energy consumption in transport sector: 145%
compared to the projected 21%120 (petrol and diesel only)
Incorrect assumption at the time of GP/NECD negotiations: activity data
projection used for RAINS modelling underestimated primary energy
consumption in 2010 by 1560 thousand TOE or 51%
Unexpectedly high “dieselification” of road transport fleet: proportion of
diesel cars increased from 17% in 1993 to 62% in 2009. Baseline activity
projection used in RAINS121 underestimated diesel fuel consumption by
transport sector in 2010 by 961% or 1604 thousand TOE.
Increase e.g. due to:
- Fiscal policies favouring vehicles with lower CO2 emissions
- Lower diesel fuel prices compared to petrol
Euro standard performance for diesel cars: Overestimation of 2010
reductions from road transport due to poor “on-road” performance of Euro
standards
Underestimated emission projections: overestimation of expected reduction
from the planned measures
2002 National Programme projections:
With Measures 12.9 kt
With additional measures 10.9 kt
2006 National Programme projections:
Business-as-usual 12.7 kt
2006 Review of National Programme provided no information on
implementation of existing measures or planned measures
10.3 Reasons for non-compliance as identified by Luxembourg
The reasons for non-compliance with the NECD 2010 NOx ceiling as identified by
Luxembourg are summarised in Table 10-3. The contribution to the exceedance is given
in kt where it can be estimated.
119 The letter to Commissioner for Environment of the EC from Department of Environment of Ministry of Sustainable
Development and Infrastructure of Luxembourg of 25 April 2012. 120 IIASA 1998 6th Interim Report, available from: http://gains.iiasa.ac.at/reports/pre-2002/6th interim a2.pdf 121 IIASA 1998 6th Interim Report, available from: http://gains.iiasa.ac.at/reports/pre-2002/6th interim a2.pdf
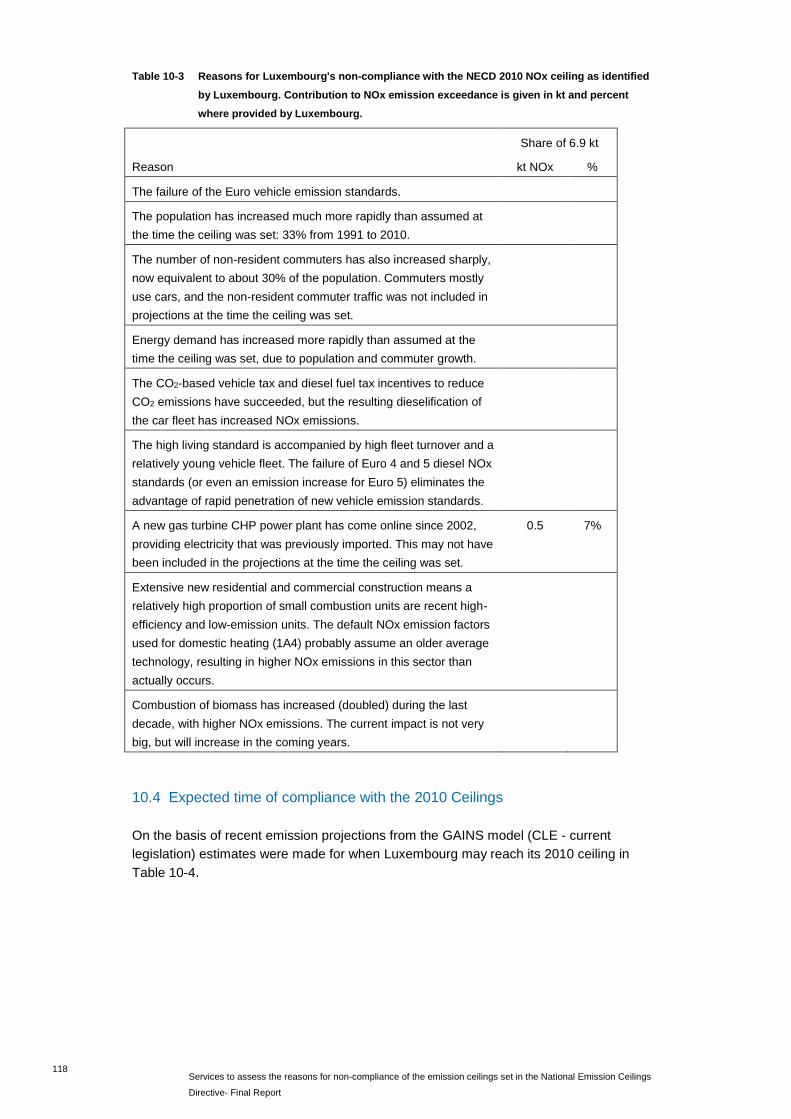
118
Services to assess the reasons for non-compliance of the emission ceilings set in the National Emission Ceilings
Directive- Final Report
Table 10-3 Reasons for Luxembourg's non-compliance with the NECD 2010 NOx ceiling as identified
by Luxembourg. Contribution to NOx emission exceedance is given in kt and percent
where provided by Luxembourg.
Share of 6.9 kt
Reason kt NOx %
The failure of the Euro vehicle emission standards.
The population has increased much more rapidly than assumed at
the time the ceiling was set: 33% from 1991 to 2010.
The number of non-resident commuters has also increased sharply,
now equivalent to about 30% of the population. Commuters mostly
use cars, and the non-resident commuter traffic was not included in
projections at the time the ceiling was set.
Energy demand has increased more rapidly than assumed at the
time the ceiling was set, due to population and commuter growth.
The CO2-based vehicle tax and diesel fuel tax incentives to reduce
CO2 emissions have succeeded, but the resulting dieselification of
the car fleet has increased NOx emissions.
The high living standard is accompanied by high fleet turnover and a
relatively young vehicle fleet. The failure of Euro 4 and 5 diesel NOx
standards (or even an emission increase for Euro 5) eliminates the
advantage of rapid penetration of new vehicle emission standards.
A new gas turbine CHP power plant has come online since 2002,
providing electricity that was previously imported. This may not have
been included in the projections at the time the ceiling was set.
0.5 7%
Extensive new residential and commercial construction means a
relatively high proportion of small combustion units are recent high-
efficiency and low-emission units. The default NOx emission factors
used for domestic heating (1A4) probably assume an older average
technology, resulting in higher NOx emissions in this sector than
actually occurs.
Combustion of biomass has increased (doubled) during the last
decade, with higher NOx emissions. The current impact is not very
big, but will increase in the coming years.
10.4 Expected time of compliance with the 2010 Ceilings
On the basis of recent emission projections from the GAINS model (CLE - current
legislation) estimates were made for when Luxembourg may reach its 2010 ceiling in
Table 10-4.
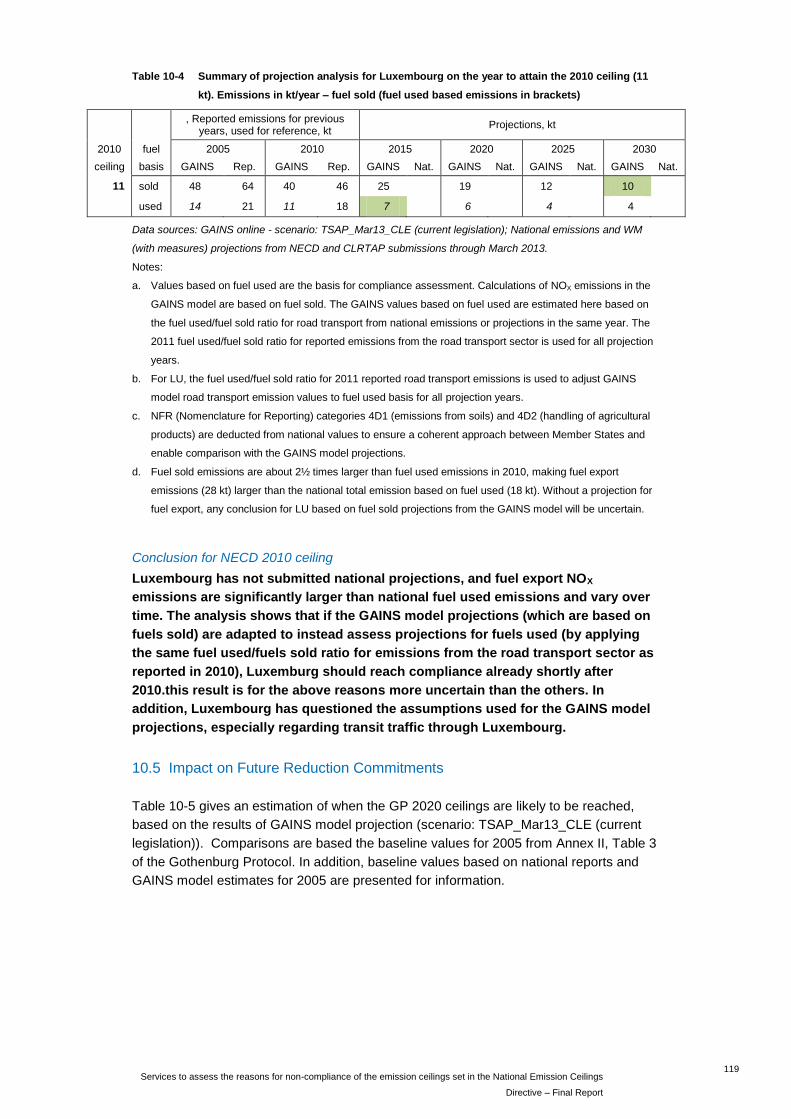
119
Services to assess the reasons for non-compliance of the emission ceilings set in the National Emission Ceilings
Directive – Final Report
Table 10-4 Summary of projection analysis for Luxembourg on the year to attain the 2010 ceiling (11
kt). Emissions in kt/year – fuel sold (fuel used based emissions in brackets)
, Reported emissions for previous
years, used for reference, kt Projections, kt
2010 fuel 2005 2010 2015 2020 2025 2030
ceiling basis GAINS Rep. GAINS Rep. GAINS Nat. GAINS Nat. GAINS Nat. GAINS Nat.
11 sold 48 64 40 46 25 19 12 10
used 14 21 11 18 7 6 4 4
Data sources: GAINS online - scenario: TSAP_Mar13_CLE (current legislation); National emissions and WM
(with measures) projections from NECD and CLRTAP submissions through March 2013.
Notes:
a. Values based on fuel used are the basis for compliance assessment. Calculations of NOX emissions in the
GAINS model are based on fuel sold. The GAINS values based on fuel used are estimated here based on
the fuel used/fuel sold ratio for road transport from national emissions or projections in the same year. The
2011 fuel used/fuel sold ratio for reported emissions from the road transport sector is used for all projection
years.
b. For LU, the fuel used/fuel sold ratio for 2011 reported road transport emissions is used to adjust GAINS
model road transport emission values to fuel used basis for all projection years.
c. NFR (Nomenclature for Reporting) categories 4D1 (emissions from soils) and 4D2 (handling of agricultural
products) are deducted from national values to ensure a coherent approach between Member States and
enable comparison with the GAINS model projections.
d. Fuel sold emissions are about 2½ times larger than fuel used emissions in 2010, making fuel export
emissions (28 kt) larger than the national total emission based on fuel used (18 kt). Without a projection for
fuel export, any conclusion for LU based on fuel sold projections from the GAINS model will be uncertain.
Conclusion for NECD 2010 ceiling
Luxembourg has not submitted national projections, and fuel export NOX
emissions are significantly larger than national fuel used emissions and vary over
time. The analysis shows that if the GAINS model projections (which are based on
fuels sold) are adapted to instead assess projections for fuels used (by applying
the same fuel used/fuels sold ratio for emissions from the road transport sector as
reported in 2010), Luxemburg should reach compliance already shortly after
2010.this result is for the above reasons more uncertain than the others. In
addition, Luxembourg has questioned the assumptions used for the GAINS model
projections, especially regarding transit traffic through Luxembourg.
10.5 Impact on Future Reduction Commitments
Table 10-5 gives an estimation of when the GP 2020 ceilings are likely to be reached,
based on the results of GAINS model projection (scenario: TSAP_Mar13_CLE (current
legislation)). Comparisons are based the baseline values for 2005 from Annex II, Table 3
of the Gothenburg Protocol. In addition, baseline values based on national reports and
GAINS model estimates for 2005 are presented for information.

120
Services to assess the reasons for non-compliance of the emission ceilings set in the National Emission Ceilings
Directive- Final Report
Table 10-5 Estimated compliance period – Gothenburg protocol (GP) – Luxembourg. Emissions in
kt/year – fuel sold (fuel used based emissions in brackets)
GP 2020 targets, kt Projections, kt
GP 2020 reduction
commitment Based on
GAINS projection for 2005
Based on reported emission for 2005
2015 2020 2025 2030
% fuel
basis GAINS Nat. GAINS Nat. GAINS Nat. GAINS Nat.
43 sold 27 36 25 19 12 10
used 9 12 7 6 4 4
Data sources: GAINS online - scenario: TSAP_Mar13_CLE (current legislation); National emissions and WM
(with measures) projections from NECD and CLRTAP submissions through March 2013.
Notes: See notes under Table 10-4.
It must be noted that Luxembourg questions the assumptions used for these GAINS
projections, especially regarding transit traffic through Luxembourg.
Conclusion for GP 2020 reduction commitment
Based on the analysis made Luxembourg is likely to comply with its CLRTAP 2020
commitment before 2015 according to the GAINS model (based on fuels sold), but
no national projections are available for comparison, making this conclusion more
uncertain that the others.
10.6 Observations and recommendations for Luxembourg
Issue: National emission projections are not available for the years after 2010.
Recommendation:
Develop national emission projections, in order to estimate future compliance
and the possible need for additional measures to meet the reduction
commitments.
Issue: No information on methodologies and activity data used for emission estimation is
available.
Recommendation:
Develop and submit IIR presenting detailed descriptions of the methodologies
and activity data used for emission estimation.

121
Services to assess the reasons for non-compliance of the emission ceilings set in the National Emission Ceilings
Directive – Final Report
11 Croatia
11.1 Introduction
Status of Croatia's NH3 reduction commitments
Croatia became a Member of the EU in July 2013. NECD 2010 ceilings for Croatia are
set equal to the Gothenburg Protocol 2010 ceilings122. Croatia did not have NECD
ceilings previously, and has not reported yet under NECD. Croatia has reported under
CLRTAP. Table 11-1 summarises the status of Croatia's commitment for national NH3
emissions in 2010 and 2011 under NECD and the 1999 CLRTAP Gothenburg Protocol,
and for the reduction commitment for 2020 under the 2012 amendments to the
Gothenburg Protocol. The table lists reported emissions in the GP base years 1990 and
2005, and the two most recent years, 2010 and 2011. Distance to target is given in kt and
as a percent of the target value (ceiling).
Table 11-1 Overview of Croatia's final 2010 and provisional 2011 NOx emission data submitted under
NECD and CLRTAP.
Croatia, NH3 emission distance to target
Year (submission year) kt NOX kt NOX %
NECD/CLRTAP NH3 2010 ceiling 30
1990 (CLRTAP.SUBM13) 50.9 20.9 69.7%
2010 (CLRTAP.SUBM13) 38.1 8.1 27.1%
2011 (CLRTAP.SUBM13) 36.8 6.8 22.7%
CLRTAP NH3 2020 reduction 1% 40.0
2005 (CLRTAP.SUBM13) 40.4 0.4 1.0%
2010 (CLRTAP.SUBM13) 38.1 -1.9 -4.7%
2011 (CLRTAP.SUBM13) 36.8 -3.2 -7.9%
Croatia's reported NH3 emission was 8 kt (27%) above the 30 kt CLRTAP ceiling in 2010
and 7 kt (23%) above in 2011. Croatia's reported NH3 emission declined 1.3 kt (3%) from
2010 to 2011.
For the 2012 Gothenburg Protocol amendments, Croatia agreed to a 1% NH3 reduction
by 2020 from the base year 2005. This is equivalent to a 2020 NH3 target of 40 kt based
on the presently reported 2005 emission. This target is 10 kt (33%) higher than the NECD
2010 ceiling. Croatia's NH3 emission has been under the GP 2020 target since 2008. The
reported NH3 emission for 2010 is 1.9 kt (5%) below the GP 2020 target, and the
preliminary 2011 NH3 emission is 3.2 kt (8%) below it.
Summary of conclusions
The main reasons for Croatia's non-compliance with the NECD 2010 NH3 ceiling are:
National NH3 emission factors in use at the time the CLRTAP ceilings were set
underestimated NH3 emissions significantly. Croatia began to use the EMEP/EEA
122 Croatia’s NECD 2010 ceilings are established in Council Directive 2013/17/EU of 13 May 2013 adapting certain directives in
the field of environment, by reason of the accession of the Republic of Croatia. http://eur-
lex.europa.eu/LexUriServ/LexUriServ.do?uri=CELEX:32013L0017:EN:NOT

122
Services to assess the reasons for non-compliance of the emission ceilings set in the National Emission Ceilings
Directive- Final Report
Guidebook emission factors in 2003, which increased the 1990 GP base year NH3
emission from the 37 kt level listed in the Gothenburg Protocol to nearly 56 kt, a 50%
increase. Further improvements (improved agricultural activity data) have revised the
base year emission to the present 51 kt level. The fixed 30 kt ceiling required a 7 kt
(19%) emission reduction from the original GP base year emission, but the improved
methodology increased the required emission reduction by 14 kt (173% of the
exceedance in 2010). Although Croatia has reduced annual NH3 emissions by 13 kt
compared to 1990, which is nearly twice the reduction foreseen when the ceiling was
set, it is still 7 kt above the ceiling.
National legislation implementing emission ceilings and a National Programme of
emission reductions were first adopted in 2008. These included a national NH3 ceiling
of 45 kt rather than the 30 kt CLRTAP ceiling. Proposed reduction measures were
insufficient to meet the CLRTAP and NECD 2010 ceiling.
The outlook for compliance with the NECD 2010 ceiling and the CLRTAP 2020 target is:
Croatia shows continued exceedance of the NECD 2010 NH3 ceiling through 2030
according to both national and GAINS model current legislation projections. Based on
this analysis, Croatia is not likely to reach compliance with its NECD 2010 ceiling
without additional measures beyond current legislation.
Croatia's NH3 emission is below the GP 2020 target through 2015, but rises above
the target after 2015 according to the national projection (with measures scenario).
The GAINS model indicates non-compliance through 2030 based on current
legislation. Based on this analysis, Croatia is not likely to achieve the GP 2020
commitment without additional measures beyond current legislation.
The reasons for non-compliance and estimation of time for compliance are discussed in
the following sections.
11.2 Independent assessment
Legislation, National Programmes and policies and measures
Croatia is a party to the Gothenburg Protocol, which sets a 2010 ceiling of 30 kt for NH3.
The GP 2010 ceilings are now adopted as Croatia's NECD 2010 ceilings122. Regulation
on emission quotas for certain pollutants in the Republic of Croatia (OG No. 141/08)
transposes requirements set forth by CLRTAP and sets the national ammonia emission
ceilings at the level of 45 kt, which is 50% higher than the ceiling Croatia agreed to under
the Gothenburg Protocol.
The Regulation on emission quotas also prescribes the development of a programme for
gradual reduction of emissions of certain pollutants in the Republic of Croatia until year
2010 with emission projections for the period from 2010 to 2020. This corresponds to the
NECD requirement for development of national programmes.
The National Programme developed in 2008 identified three measures for the reduction
of ammonia emissions implemented at the time of programme development: effective
manure management, national use of mineral fertilizers based on soil analysis and
nutrient balance and reduction of emissions from production of NPK fertilizers.
Implementation of these measures was closely related to integration of EU Directives,
particularly the Nitrate Directive, which indirectly influences NH3 emissions into
atmosphere.
123
Services to assess the reasons for non-compliance of the emission ceilings set in the National Emission Ceilings
Directive – Final Report
In August 2013, Croatia adopted a new regulation (OG 108/13) establishing the
GP/NECD 30 kt NH3 ceiling and repealing the national 45 NH3 kt ceiling. Croatia indicates
that the National Programme is to be revised as necessary.
Methodology, reported emissions and emission projections
Since Croatia was not an EU Member State until July 2013, it has not yet submitted
emission inventories under the NECD. Information on the emission inventories and
emission projections submitted by Croatia under the Gothenburg Protocol have been
analysed in this study.
Croatian emission inventories are currently based on the methodologies and emission
factors presented in the EMEP/EEA Emission Inventory Guidebook. Before 2003, the
methodology for estimation of NH3 emissions used national emission factors for the
agricultural sector based on expert opinion. The change to EMEP/EEA Guidebook
emission factors in 2003 resulted in a significant increase in NH3 emissions for the whole
time series. The 1990 GP base year emission of NH3 was given as 37 kt in the 2002 IIR
submission, but was raised to 56 kt in the 2007 IIR submission – an increase of 50% due
to the change in emission factors. This recalculated time series was used by Croatia in
the development of the Regulation on emission quotas (2008).
Total ammonia emissions have decreased by 26% from 1990 to 2010. According to
Croatia’s CLRTAP 2012 IIR, the agricultural sector is responsible for 78% of the NH3
emissions. The “Other chemical industry” sector (NFR 2 B 5 a) and Wastewater treatment
(NFR 6 B) are the other major contributors of NH3 emissions with 10% and 8%
respectively. Ammonia emissions in 2010 have decreased by 26% compared to 1990,
mainly as the result of the significant decrease in the livestock population. The 2010 NH3
emission exceeded the 30 kt Gothenburg Protocol ceiling by 25%, but was below the 45
kt national NH3 ceiling set in the Croatian national Regulation of emission quotas.
The emission projections developed as part of the National Programme indicated that the
45 kt national NH3 emission ceiling will be achieved under the “business-as-usual”
scenario by 2010, while the 30 kt Gothenburg Protocol ceiling for NH3 will not be reached
by 2010 or by 2020, even with additional measures implemented – remaining more than
10 kt (30%) above the ceiling.
At the time the NECD was being developed in 1999, the RAINS model NH3 projections
for the REF and H1 scenarios123 indicated that Croatia would achieve an ammonia
emission of 37 kt by 2010, an 8% reduction from the 1990 emission listed as 40 kt124.
Croatia had already accepted an even lower ammonia ceiling of 30 kt under the
Gothenburg Protocol, which listed Croatia's 1990 NH3 emission as 37 kt (GP Annex II,
Table 3).
Summary
The reasons for Croatia's non-compliance with the NECD 2010 NH3 ceiling are
summarised in Table 11-2. The contribution to the exceedance is given in kt where it can
be estimated.
123 IIASA Seventh Interim Report (1999) Cost-effective control of acidification and ground-level ozone:
http://webarchive.iiasa.ac.at/~rains/reports/ir7.pdf
124 Amann, M., Bertok, I., Cofala, J., Gyarfas, F., Heyes, C., Klimont, Z., & Schöpp, W. (1999). Integrated Assessment Modelling
for the Protocol to Abate Acidification, Eutrophication and Ground-level Ozone in Europe. IIASA, for the Netherlands
Ministry of Housing, Spatial Planning and the Environment. http://www.iiasa.ac.at/rains/dutch/dutch2.pdf
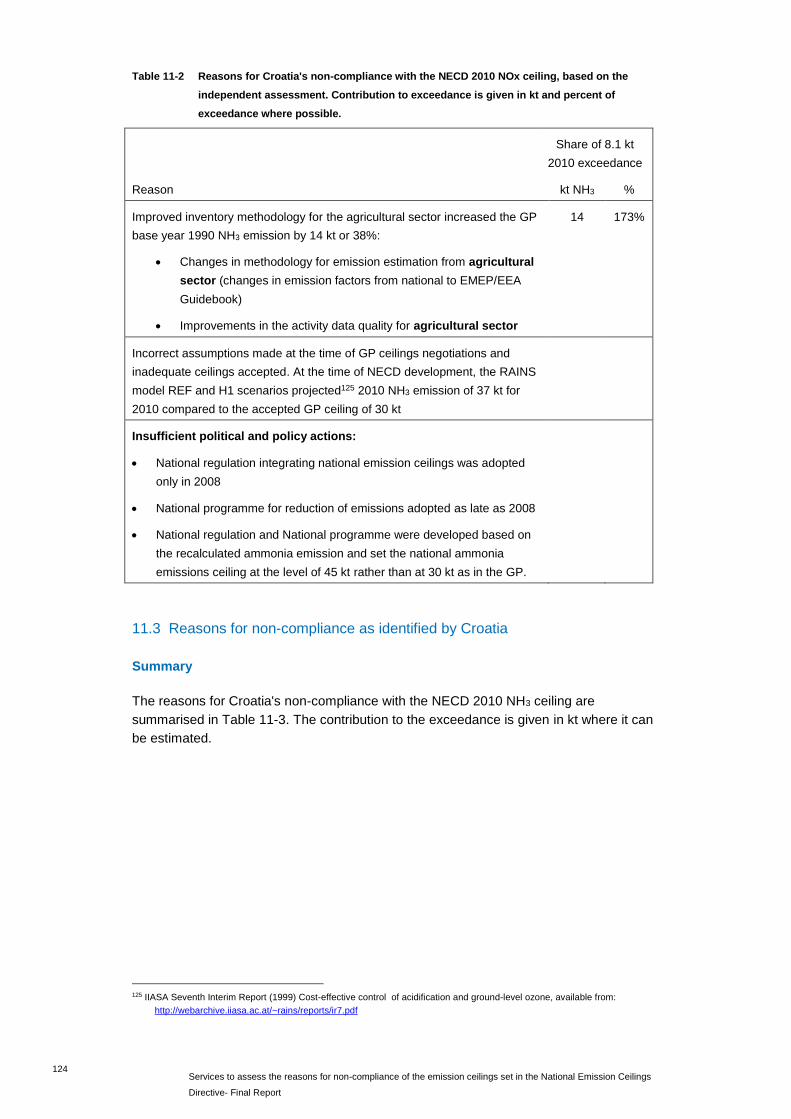
124
Services to assess the reasons for non-compliance of the emission ceilings set in the National Emission Ceilings
Directive- Final Report
Table 11-2 Reasons for Croatia's non-compliance with the NECD 2010 NOx ceiling, based on the
independent assessment. Contribution to exceedance is given in kt and percent of
exceedance where possible.
Share of 8.1 kt
2010 exceedance
Reason kt NH3 %
Improved inventory methodology for the agricultural sector increased the GP
base year 1990 NH3 emission by 14 kt or 38%:
14 173%
Changes in methodology for emission estimation from agricultural
sector (changes in emission factors from national to EMEP/EEA
Guidebook)
Improvements in the activity data quality for agricultural sector
Incorrect assumptions made at the time of GP ceilings negotiations and
inadequate ceilings accepted. At the time of NECD development, the RAINS
model REF and H1 scenarios projected125 2010 NH3 emission of 37 kt for
2010 compared to the accepted GP ceiling of 30 kt
Insufficient political and policy actions:
National regulation integrating national emission ceilings was adopted
only in 2008
National programme for reduction of emissions adopted as late as 2008
National regulation and National programme were developed based on
the recalculated ammonia emission and set the national ammonia
emissions ceiling at the level of 45 kt rather than at 30 kt as in the GP.
11.3 Reasons for non-compliance as identified by Croatia
Summary
The reasons for Croatia's non-compliance with the NECD 2010 NH3 ceiling are
summarised in Table 11-3. The contribution to the exceedance is given in kt where it can
be estimated.
125 IIASA Seventh Interim Report (1999) Cost-effective control of acidification and ground-level ozone, available from:
http://webarchive.iiasa.ac.at/~rains/reports/ir7.pdf
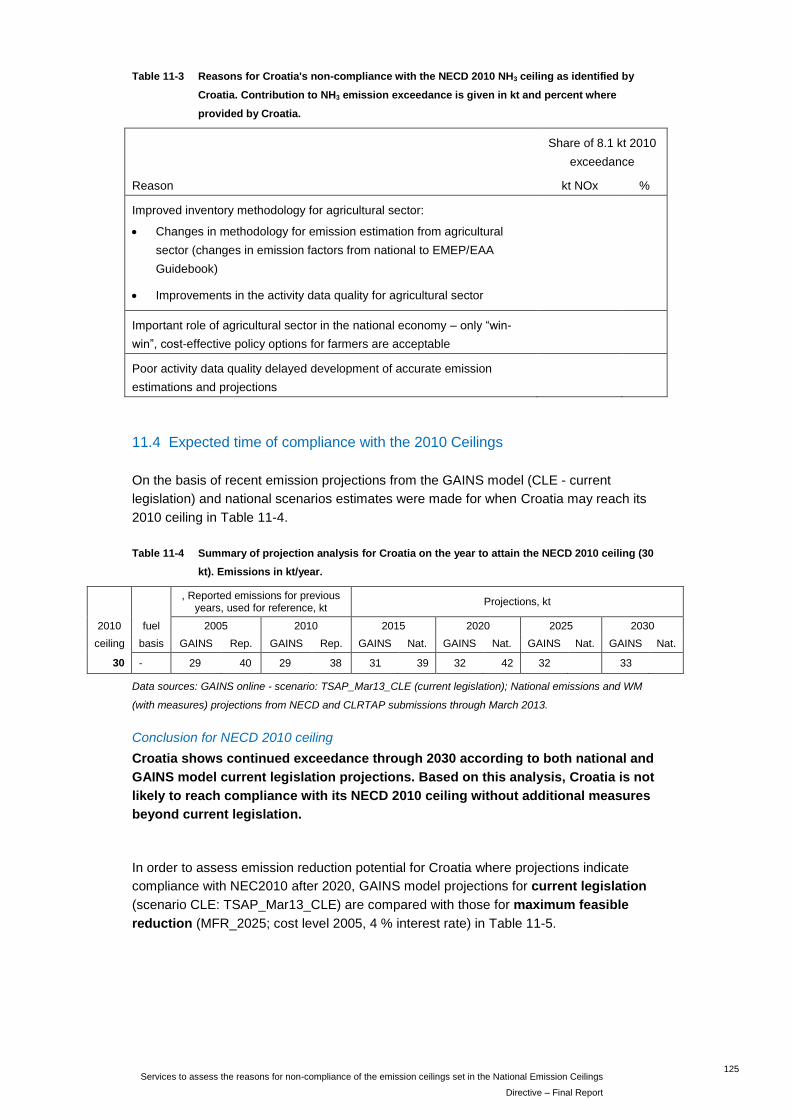
125
Services to assess the reasons for non-compliance of the emission ceilings set in the National Emission Ceilings
Directive – Final Report
Table 11-3 Reasons for Croatia's non-compliance with the NECD 2010 NH3 ceiling as identified by
Croatia. Contribution to NH3 emission exceedance is given in kt and percent where
provided by Croatia.
Share of 8.1 kt 2010
exceedance
Reason kt NOx %
Improved inventory methodology for agricultural sector:
Changes in methodology for emission estimation from agricultural
sector (changes in emission factors from national to EMEP/EAA
Guidebook)
Improvements in the activity data quality for agricultural sector
Important role of agricultural sector in the national economy – only “win-
win”, cost-effective policy options for farmers are acceptable
Poor activity data quality delayed development of accurate emission
estimations and projections
11.4 Expected time of compliance with the 2010 Ceilings
On the basis of recent emission projections from the GAINS model (CLE - current
legislation) and national scenarios estimates were made for when Croatia may reach its
2010 ceiling in Table 11-4.
Table 11-4 Summary of projection analysis for Croatia on the year to attain the NECD 2010 ceiling (30
kt). Emissions in kt/year.
, Reported emissions for previous
years, used for reference, kt Projections, kt
2010 fuel 2005 2010 2015 2020 2025 2030
ceiling basis GAINS Rep. GAINS Rep. GAINS Nat. GAINS Nat. GAINS Nat. GAINS Nat.
30 - 29 40 29 38 31 39 32 42 32 33
Data sources: GAINS online - scenario: TSAP_Mar13_CLE (current legislation); National emissions and WM
(with measures) projections from NECD and CLRTAP submissions through March 2013.
Conclusion for NECD 2010 ceiling
Croatia shows continued exceedance through 2030 according to both national and
GAINS model current legislation projections. Based on this analysis, Croatia is not
likely to reach compliance with its NECD 2010 ceiling without additional measures
beyond current legislation.
In order to assess emission reduction potential for Croatia where projections indicate
compliance with NEC2010 after 2020, GAINS model projections for current legislation
(scenario CLE: TSAP_Mar13_CLE) are compared with those for maximum feasible
reduction (MFR_2025; cost level 2005, 4 % interest rate) in Table 11-5.
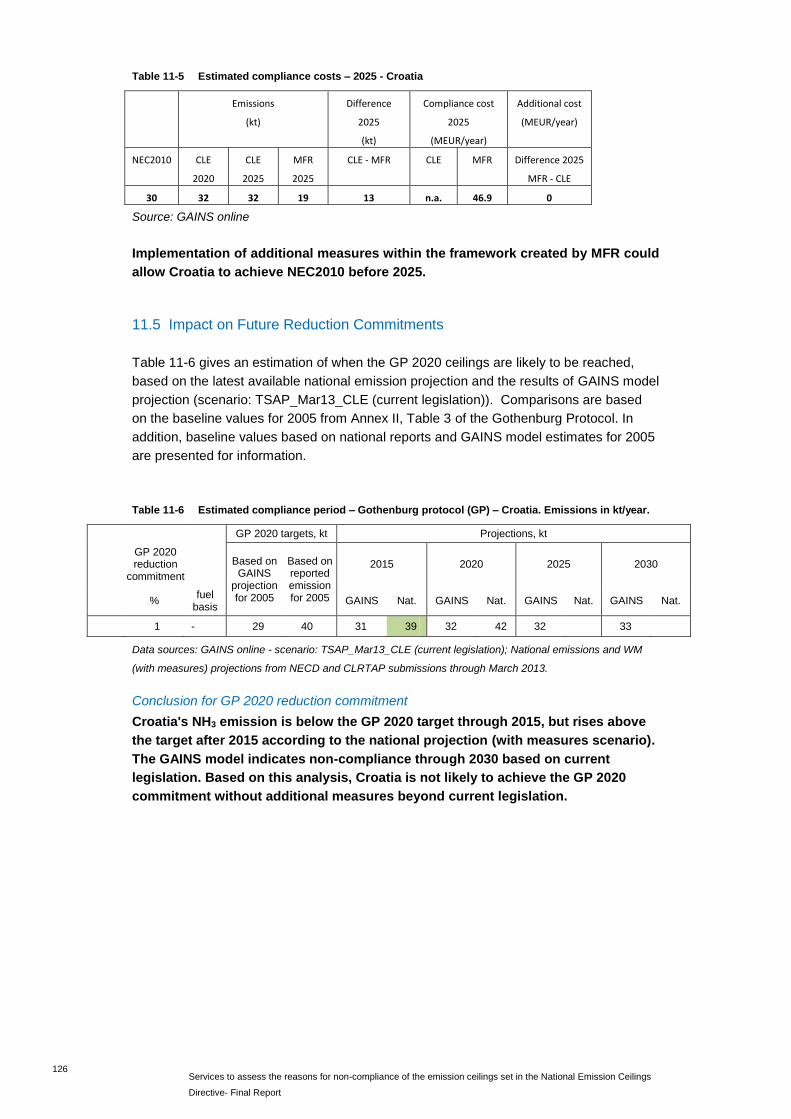
126
Services to assess the reasons for non-compliance of the emission ceilings set in the National Emission Ceilings
Directive- Final Report
Table 11-5 Estimated compliance costs – 2025 - Croatia
Emissions
(kt)
Difference
2025
(kt)
Compliance cost
2025
(MEUR/year)
Additional cost
(MEUR/year)
NEC2010 CLE
2020
CLE
2025
MFR
2025
CLE - MFR CLE MFR Difference 2025
MFR - CLE
30 32 32 19 13 n.a. 46.9 0
Source: GAINS online
Implementation of additional measures within the framework created by MFR could
allow Croatia to achieve NEC2010 before 2025.
11.5 Impact on Future Reduction Commitments
Table 11-6 gives an estimation of when the GP 2020 ceilings are likely to be reached,
based on the latest available national emission projection and the results of GAINS model
projection (scenario: TSAP_Mar13_CLE (current legislation)). Comparisons are based
on the baseline values for 2005 from Annex II, Table 3 of the Gothenburg Protocol. In
addition, baseline values based on national reports and GAINS model estimates for 2005
are presented for information.
Table 11-6 Estimated compliance period – Gothenburg protocol (GP) – Croatia. Emissions in kt/year.
GP 2020 targets, kt Projections, kt
GP 2020 reduction
commitment Based on
GAINS projection for 2005
Based on reported emission for 2005
2015 2020 2025 2030
% fuel
basis GAINS Nat. GAINS Nat. GAINS Nat. GAINS Nat.
1 - 29 40 31 39 32 42 32 33
Data sources: GAINS online - scenario: TSAP_Mar13_CLE (current legislation); National emissions and WM
(with measures) projections from NECD and CLRTAP submissions through March 2013.
Conclusion for GP 2020 reduction commitment
Croatia's NH3 emission is below the GP 2020 target through 2015, but rises above
the target after 2015 according to the national projection (with measures scenario).
The GAINS model indicates non-compliance through 2030 based on current
legislation. Based on this analysis, Croatia is not likely to achieve the GP 2020
commitment without additional measures beyond current legislation.

127
Services to assess the reasons for non-compliance of the emission ceilings set in the National Emission Ceilings
Directive – Final Report
12 Finland
12.1 Introduction
Status of Finland's NH3 reduction commitments
Table 12-1 summarises the status of Finland's two commitments for national NH3
emissions in 2010 and 2011 under the NECD and the 1999 CLRTAP Gothenburg
Protocol, and for the reduction commitment for 2020 under the 2012 amendments to the
Gothenburg Protocol. The table lists reported emissions in the base years 1990 and
2005, and the two most recent years, 2010 and 2011. Distance to target is given in kt and
as a percent of the target value (ceiling). Finland's NECD and CLRTAP NH3 emission
totals are identical for these years in present reporting.
Table 12-1 Overview of Finland's final 2010 and provisional 2011 NH3 emission data submitted under
NECD and CLRTAP.
Finland, NH3 emission distance to target
Year (submission year) kt NOX kt NOX %
NECD NH3 2010 ceiling 31
1990 (NECD.SUBM12) 38.7 7.7 25.0%
2010 (NECD.SUBM12) 37.5 6.5 21.1%
2011 (NECD.SUBM12) 37.3 6.3 20.4%
CLRTAP NH3 2010 ceiling 31
1990 (CLRTAP.SUBM13) 38.7 7.7 25.0%
2010 (CLRTAP.SUBM13) 37.5 6.5 21.1%
2011 (CLRTAP.SUBM13) 37.1 6.1 19.5%
CLRTAP NH3 2020 reduction 20% 30.2
2005 (CLRTAP.SUBM13) 37.8 7.6 25.0%
2010 (CLRTAP.SUBM13) 37.5 7.3 24.2%
2011 (CLRTAP.SUBM13) 37.1 6.8 22.5%
Finland's reported NH3 emission was 21% above the 31 kt ceiling in 2010 and 20% above
in 2011. Finland's reported NH3 emission declined 0.4 kt (1%) from 2010 to 2011.
The Gothenburg Protocol reduction commitment for Finland, 20% reduction between
2005 and 2020 was based on the need to continue to respect the existing NH3 2010
ceiling in the NECD (31 kt). This is equivalent to a 2020 NH3 target of 30 kt based on the
presently reported 2005 emission. This target is 1 kt (3%) lower than the 2010 ceiling.
The 2010 and preliminary 2011 NH3 emission totals are 7 kt above this 2020 target.
Summary of conclusions
The main reasons for Finland's non-compliance with the NECD 2010 NH3 ceiling are:
Improved inventory methodology for the agricultural sector (emission factors, activity
data), and addition of transport, energy, solvent use and waste management source
sectors, increased the 2010 NH3 emission by 6 kt (89% of the 2010 exceedance)
compared to the methodology at the time the ceiling was set.

128
Services to assess the reasons for non-compliance of the emission ceilings set in the National Emission Ceilings
Directive- Final Report
No specific measures were planned for reduction of ammonia emissions. The
National Programmes only referred to other EU policies, such as the Nitrate Directive,
and overestimated the effectiveness of those policies.
Finland continued through 2008 to report national current legislation projections for
2010 equal to the RAINS model projections made at the time the ceilings were set,
showing compliance with the ceiling value in 2010. Improved inventory methodology
was introduced in 2009, but recalculations showing the full impact of the changes
were not completed until 2011 when it was acknowledged that the ceiling would be
exceeded in 2010 and beyond. Updated projections showing non-compliance were
reported in 2012. These signals came very late that the measures in existing
legislation were inadequate and this could have contributed to delays in adopting
compensating measures.
The outlook for compliance with the NECD 2010 ceiling and the CLRTAP 2020 target is:
Finland shows continued exceedance through 2030 according to national current
legislation projections but just equalling the ceiling in 2015 and thereafter, according
to the GAINS model. However, the GAINS model underestimates Finland's NH3
emissions in 2005 (10%) and 2010 (13%), which may indicate that this projection is
unrealistic. Finland is not likely to reach compliance with its NECD 2010 ceiling
without additional measures beyond current legislation.
Finland does not reach the CLRTAP 2020 target level through 2030 according to both
the national and the GAINS model current legislation projections; additional
measures are needed.
12.2 Independent assessment
Legislation, National Programmes and policies and measures
Finland’s NECD 2010 ceiling for ammonia is 31 kt. The NEC Directive is not directly
transposed into the Finnish legal system and the emissions ceilings are only stated in the
Air Pollution Control Programme 2010 (National Programme), developed in accordance
with section 26 of the Environmental Protection Act126.
Finland’s first National Programme was developed in 2002, mainly relying on policy
stemming from the National Climate Strategy and focused on measures related to the
energy and transport sectors. The only measure affecting NH3 emissions was the Agri-
environmental support system, a voluntary support mechanism aimed to reduce air and
water pollution caused by agriculture. No mandatory regulatory or fiscal measures
targeting ammonia emissions were proposed in the context of this programme. Reference
is made to the Nitrate Directive as a policy tool with potential for reducing ammonia
emissions.
The National Programme was revised in 2006. The Ministry of the Environment of Finland
concluded that there was no need to update the original programme, as the existing
measures were considered sufficient to comply with the emission ceilings. No additional
measures targeting ammonia emissions were implemented.
126 Section 26 of Environmental Protection Act, 86/2000, “National plans and programmes” refers to the general principles of the
development and adoption of the national plans and programmes referred to in the acts of the European Union.
http://www.finlex.fi/fi/laki/kaannokset/2000/en20000086.pdf
129
Services to assess the reasons for non-compliance of the emission ceilings set in the National Emission Ceilings
Directive – Final Report
Methodology, reported emissions and emission projections
Although not required by NECD, Finland has routinely submitted detailed Informative
Inventory Reports (IIR) each year providing information on the methodologies and
approaches used in the emission estimation. In 2009, a study conducted in Finland
presented a new model for the calculation of ammonia emissions from agricultural
sources, accounting for the most current knowledge on manure management and
ammonia volatilization in Finland. Application of this model, together with the estimation
of ammonia emission from sources previously not accounted for (energy and transport
sectors) resulted in an increase in the total reported NH3 emissions for the whole time-
series.
Finland's total ammonia emissions decreased by 3% from 1990 to 2010, according to the
2012 reporting. In 2010, the agricultural sector was responsible for more than 90% of
ammonia emissions127 with passenger cars contributing around 7%. Although ammonia
emissions in the agricultural sector have decreased from 1980 to 2010 emissions (from
44 kt in 1980 to 34 in 2010) a recent tendency of slow increase of emissions from
agriculture can be noticed.
According to the analysis of ammonia emissions provided in Finland's NECD IIR 2012,
the fluctuations in the emissions from the agricultural sector can be explained by
significant changes in the economic structure of the sector, which took place after Finland
joined the EU in 1995. These changes led to a significant decrease in the total number of
livestock. Fertilizer use has also become more efficient. However, during the same period
the value of N excretion per animal has significantly increased (partly due to the
increased productivity of the livestock). Consequently, the contribution of the agricultural
sector to the total ammonia emissions has not changed significantly since 1990. The
contribution of the transport sector to the annual NH3 emissions in Finland has increased
from 5% in 1990 to 7% in 2010, which according to the IIR 2012 is the result of the
growth in road traffic and the number of cars with catalysts.
History of NH3 reporting
Finland's NH3 emissions reported through 2006 showed emissions declining from 38 kt in
1997 to a level of 33 kt in 2001 to 2004. In the 2007 submission, the 2005 emission was
reported at 36 kt, a 3 kt (9%) jump from the total reported for 2004. This was the first
indication of revised methodology and activity data for the NH3 calculations.
The CLRTAP reporting in 2008 presents recalculated emissions for 1990 to 2001 with
moderate changes, but the 2011 submission to CLRTAP included substantial revision of
the emissions from 1990 to 2009. The recalculated NH3 emissions from 1997 to 2007
were raised by 2 to 5 kt (5% to 14%), close to the presently reported values for these
years. The latest reporting shows NH3 emissions at 37 to 38 kt for years 2002 to 2011,
with only small variations.
Projections for 2010
Finland reported a current legislation projection of 31 kt for 2010 NH3 emission under
NECD, through 2008. The official NECD reporting in 2009 and 2010 did not include a
projection for 2010, although the 31 kt value continued to appear in the IIRs (Chapter 13)
through March 2013.
127 According to the NECD emission inventory submitted in 2012.

130
Services to assess the reasons for non-compliance of the emission ceilings set in the National Emission Ceilings
Directive- Final Report
In March 2011, Finland reported a 2009 NH3 emission of 37 kt, and the CLRTAP IIR
stated that the NH3 emission was "projected to be about 37 kilotonnes in 2010 and
around 35 kilotonnes in the years after that". The NECD submission in December 2011
reported the preliminary 2010 NH3 emission of 37 kt, and referred to this as the projection
for 2010.
No documentation of the projection methodology is given in the IIR's through 2011, but
the memos presenting the annual emissions and 2010 projections listed RAINS model
scenarios for the SO2 and NOX projections. The various RAINS model scenarios at the
time the ceilings were set all gave a NH3 projection of 31 kt, including the "H1" scenario128
that was the basis for the Commission's proposal for national emission ceilings129. This
suggests that through 2008, Finland continued to report the RAINS NH3 projection value,
equal to the NECD NH3 ceiling, as its official 2010 NH3 projection.
Projections beyond 2010
Beginning in 2009, the IIRs include NH3 projections for 2020 and 2050 that are slightly
below the 31 kt ceiling, indicating compliance with the NECD 2010 ceiling. As mentioned
above, the March 2011 IIR acknowledges that NH3 emissions in 2010 and after will be
above the ceiling, but Chapter 13 in the IIRs continues to present the same below-ceiling
projection values for 2020 and 2050, through the March 2013 CLRTAP IIR.
NRF spreadsheets submitted from 2008 to March 2012 include Table 2A-WM with the
NH3 projection values for 2020 and 2050 showing compliance with the ceiling. In
December 2012, the submitted NFR Table 2A-WM shows new NH3 projection values for
2020, 2030 and 2050 of 36 to 38 kt, although the IIR continues to list the previous
projection values. This inconsistency indicates a lag in updating of the IIR after
projections are revised in the NFR spreadsheets.
In August 2013, Finland submitted a new CLRTAP NFR Table 2A-WM with national
current legislation projections for 2010, 2015, 2020, 2030 and 2050. These projections
range from 35 kt in 2015 to 37 kt in 2050 – all exceeding the 2010 NECD ceiling and the
new GP 2020 reduction commitment by 13% to 19%. Documentation of the methodology
for these new projections has not yet been reported.
Summary
Finland continued to report the same projection value for 2010 given by the RAINS model
at the time the ceilings were set – equal to the ceiling – through the 2008 submission.
The first reported indication that NH3 emissions were higher than previously reported
came in 2007 with a significant increase calculated for the 2005 emission. The full impact
of revised methodology was not clear until the March 2011 CLRTAP submission where
Finland acknowledges that the 2010 NH3 ceiling will not be met. New projections showing
non-compliance in 2020 and 2050 are first reported in December 2012, with a full set of
new projections reported in August 2013. The late methodology change, prolonged
period for recalculations to be completed, and the lack of updated NH3 projections until
after 2010 are all likely to contribute to the lack of additional reduction measures.
128 Amann, M., Bertok, I., Cofala, J., Gyarfas, F., Heyes, C., Klimont, Z., & Schöpp, W. (2000). Cost-effective Control of
Acidification and Ground-level Ozone: Further Analysis. Eighth Interim Report, Part 1, January 2000.
http://ec.europa.eu/environment/air/pdf/documents/cost1.pdf 129 Proposal for a Directive of the European Parliament and of the Council on national emission ceilings for certain atmospheric
pollutants. COM(99)0125 final. http://eur-
lex.europa.eu/LexUriServ/LexUriServ.do?uri=CELEX:51999PC0125%2801%29:EN:NOT
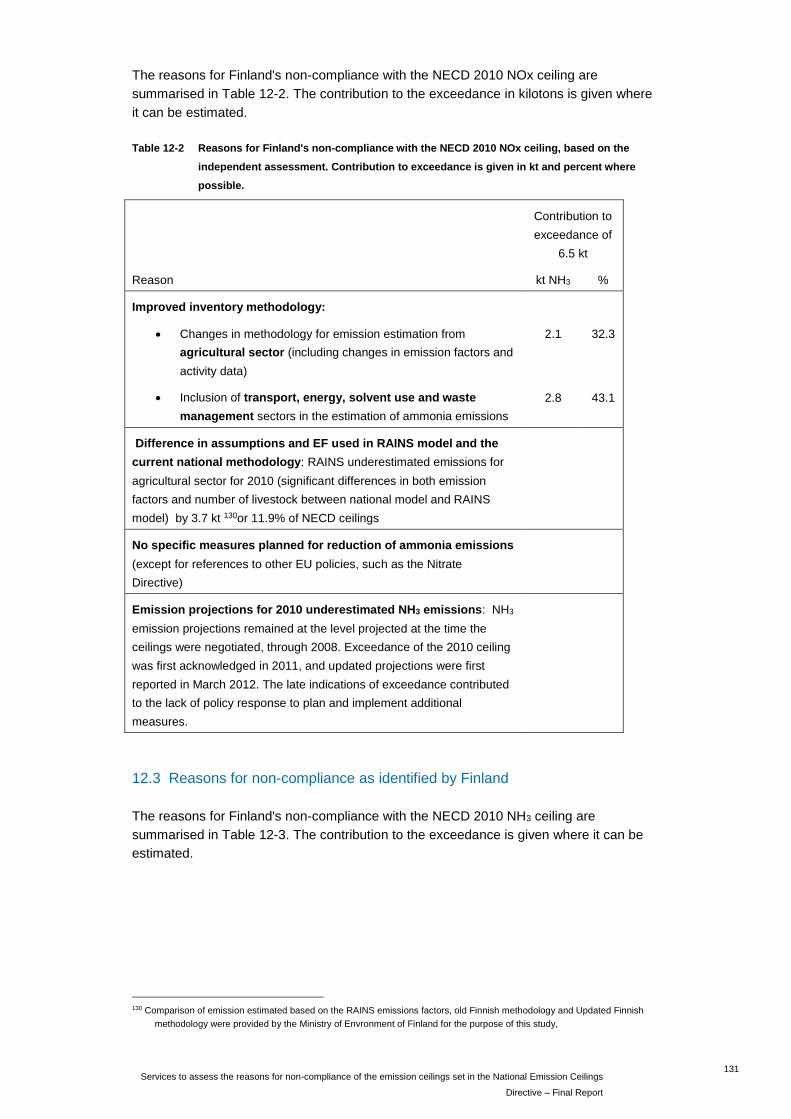
131
Services to assess the reasons for non-compliance of the emission ceilings set in the National Emission Ceilings
Directive – Final Report
The reasons for Finland's non-compliance with the NECD 2010 NOx ceiling are
summarised in Table 12-2. The contribution to the exceedance in kilotons is given where
it can be estimated.
Table 12-2 Reasons for Finland's non-compliance with the NECD 2010 NOx ceiling, based on the
independent assessment. Contribution to exceedance is given in kt and percent where
possible.
Contribution to
exceedance of
6.5 kt
Reason kt NH3 %
Improved inventory methodology:
Changes in methodology for emission estimation from
agricultural sector (including changes in emission factors and
activity data)
2.1
32.3
Inclusion of transport, energy, solvent use and waste
management sectors in the estimation of ammonia emissions
2.8 43.1
Difference in assumptions and EF used in RAINS model and the
current national methodology: RAINS underestimated emissions for
agricultural sector for 2010 (significant differences in both emission
factors and number of livestock between national model and RAINS
model) by 3.7 kt 130or 11.9% of NECD ceilings
No specific measures planned for reduction of ammonia emissions
(except for references to other EU policies, such as the Nitrate
Directive)
Emission projections for 2010 underestimated NH3 emissions: NH3
emission projections remained at the level projected at the time the
ceilings were negotiated, through 2008. Exceedance of the 2010 ceiling
was first acknowledged in 2011, and updated projections were first
reported in March 2012. The late indications of exceedance contributed
to the lack of policy response to plan and implement additional
measures.
12.3 Reasons for non-compliance as identified by Finland
The reasons for Finland's non-compliance with the NECD 2010 NH3 ceiling are
summarised in Table 12-3. The contribution to the exceedance is given where it can be
estimated.
130 Comparison of emission estimated based on the RAINS emissions factors, old Finnish methodology and Updated Finnish
methodology were provided by the Ministry of Envronment of Finland for the purpose of this study,

132
Services to assess the reasons for non-compliance of the emission ceilings set in the National Emission Ceilings
Directive- Final Report
Table 12-3 Reasons for Finland's non-compliance with the NECD 2010 NH3 ceiling as identified by
Finland. Contribution to NH3 emission exceedance is given in kt and percent where
provided by Finland.
Contribution to
exceedance of 6.5 kt
Reason kt NOx %
Change in methodology:
- New national methodology/RAINS methodology for 2010 3.7 56.9
- New national methodology/Old national methodology for 2010
(including new sectors)
2.1 32.3
Inclusion of new emission sectors: Energy, transport, solvent use and
waste management
Incorrect RAINS model projections: BAU scenario assumed 31 kt
level will be achieved with no additional measures, due to the decrease
of number of livestock
Poor quality of activity data in agricultural sector at the time of
GP/NECD ceilings negotiation (and until now) – leading to incorrect
projections
Less significant impact of Agri-Environmental support system than
initially expected due to its focus on fertilizer use rather than manure
management
12.4 Expected time of compliance with the 2010 Ceilings
On the basis of recent emission projections from the GAINS model (CLE - current
legislation) and national scenarios estimates were made for when Finland may reach its
2010 ceiling in Table 12-4.
Table 12-4 Summary of projection analysis for Finland on the year to attain the 2010 ceiling (31 kt).
Emissions in kt/year.
, Reported emissions for previous
years, used for reference, kt Projections, kt
2010 fuel 2005 2010 2015 2020 2025 2030
ceiling basis GAINS Rep. GAINS Rep. GAINS Nat. GAINS Nat. GAINS Nat. GAINS Nat.
31 - 34 38 33 38 31 35 31 36 31 31 36
Data sources: GAINS online - scenario: TSAP_Mar13_CLE (current legislation); National emissions and WM
(with measures) projections from NECD and CLRTAP submissions through August 2013.
Conclusion for NECD 2010 ceiling
Finland shows continued exceedance through 2030 according to national current
legislation projections but just equalling the ceiling in 2015 and thereafter,
according to the GAINS model. However, the GAINS model underestimates
Finland's NH3 emissions in 2005 (10%) and 2010 (13%), which may indicate that this
projection is unrealistic. Based on this analysis, Finland is not likely to reach
compliance with its NECD 2010 ceiling without additional measures beyond current
legislation.

133
Services to assess the reasons for non-compliance of the emission ceilings set in the National Emission Ceilings
Directive – Final Report
In order to assess emission reduction potential for Finland where projections indicate
non-compliance with NEC2010 in 2020 and later, GAINS model projections for current
legislation (scenario CLE: TSAP_Mar13_CLE) are compared with those for maximum
feasible reduction (MFR_2025; cost level 2005, 4% interest rate) in Table 12-5.
Table 12-5 Estimated annual compliance costs – 2025 - Finland
Emissions
(kt)
Difference
2025
(kt)
Cost 2025
(MEUR/year)
Additional cost
(MEUR/year)
NEC2010 CLE
2020
CLE
2025
MFR
2025
CLE - MFR CLE MFR Difference 2025
MFR - CLE
31 31 31 24 7 15.8 64.6 48.8
Source: GAINS online
Implementation of additional measures within the framework created by MFR could
allow Finland to keep its emissions below the ceiling.
12.5 Impact on future reduction commitments
Table 62 gives an estimation of when the GP 2020 ceilings are likely to be reached,
based on the latest available national emission projection(s) and the results of GAINS
model projection (scenario: TSAP_Mar13_CLE (current legislation)). Comparisons are
based the baseline values for 2005 from Annex II, Table 3 of the Gothenburg Protocol. In
addition, baseline values based on national reports and GAINS model estimates for 2005
are given for information.
Table 12-6 Estimated compliance period – Gothenburg protocol (GP) – Finland. Emissions in kt/year.
GP 2020 targets, kt Projections, kt
GP 2020 reduction
commitment Based on
GAINS projection for 2005
Based on reported emission for 2005
2015 2020 2025 2030
% fuel
basis GAINS Nat. GAINS Nat. GAINS Nat. GAINS Nat.
20 - 27 30 31 35 31 36 31 31 36
Data sources: GAINS online - scenario: TSAP_Mar13_CLE (current legislation); National emissions and WM
(with measures) projections from NECD and CLRTAP submissions through August 2013.
Conclusion for GP 2020 reduction commitment
Based on the analysis made of both national and the GAINS model current
legislation projections, Finland is unlikely to reach the CLRTAP 2020 commitment
without significant additional measures.

134
Services to assess the reasons for non-compliance of the emission ceilings set in the National Emission Ceilings
Directive- Final Report
135
Services to assess the reasons for non-compliance of the emission ceilings set in the National Emission Ceilings
Directive – Final Report
13 References
NECD and CLRTAP submissions
Austria
Austria´s National Air Emission Projections for 2010 (submission under the
NEC Directive), UBA 2006,
Austria’s Annual Air Emission Inventory 1990–2011: Submission under
National Emission Ceilings Directive 2001/81/EC, Environment Agency
Austria (UBA) 2012,
Austria´s National Air Emission Projection for 2010 – 2030 (submission under the UNECE CLRTAP), UBA 2011,
Austria´s Informative Inventory Report (IIR) 2012: Submission under the UNECE CLRTAP, UBA 2012,
NECD submissions of Austria: http://cdr.eionet.europa.eu/at/eu/nec
CLRTAP submissions of Austria:
http://cdr.eionet.europa.eu/at/un/CLRTAP_AT
Belgium
NECD submissions of Belgium: http://cdr.eionet.europa.eu/be/eu/nec
CLRTAP submissions of Belgium: http://cdr.eionet.europa.eu/be/un/UNECE_CLRTAP_BE
France
France Informative Inventory Report (IIR) 2012: Submission under the
UNECE CLRTAP, 2012: http://www.ceip.at/overview-of-submissions-
under-clrtap/2012-submissions/
CLRTAP Reports of France: http://www.ceip.at/overview-of-submissions-
under-clrtap/2012-submissions/
NECD submissions of France: http://cdr.eionet.europa.eu/fr/eu/nec
CLRTAP submissions of France: http://cdr.eionet.europa.eu/fr/eea/ae1/envqaatja (2003); http://cdr.eionet.europa.eu/fr/eu/colqhxdtq (2005-2013)
Germany
Germany´s Informative Inventory Report (IIR) 2012: Submission under the
UNECE CLRTAP, 2012 and 2013: http://iir-de.wikidot.com/http://iir-
de.wikidot.com/
CLRTAP submissions of Germany: http://www.ceip.at/overview-of-
submissions-under-clrtap/2012-submissions/
NECD submissions of Germany: http://cdr.eionet.europa.eu/de/eu/nec
CLRTAP submissions of Germany: at EEA: http://cdr.eionet.europa.eu/de/un/UNECE_CLRTAP_DE

136
Services to assess the reasons for non-compliance of the emission ceilings set in the National Emission Ceilings
Directive- Final Report
Ireland
Ireland's Informative Inventory Report (IIR) 2012: Submission under the
UNECE CLRTAP, 2012: http://www.ceip.at/overview-of-submissions-
under-clrtap/2012-submissions/
CLRTAP Reports of Ireland: http://www.ceip.at/overview-of-submissions-
under-clrtap/2012-submissions/
NECD submissions of Ireland: http://cdr.eionet.europa.eu/ie/eu/nec
CLRTAP submissions of Ireland: http://cdr.eionet.europa.eu/ie/un
Luxembourg
NECD submissions of Luxembourg: http://cdr.eionet.europa.eu/lu/eu/nec
CLRTAP submissions of Luxembourg: http://cdr.eionet.europa.eu/lu/un/UNECE_CLRTAP_LU
Croatia
Croatia reports under CLRTAP: http://www.ceip.at/overview-of-submissions-under-clrtap/2012-submissions/
Finland
Finland reports under CLRTAP: http://www.ceip.at/overview-of-submissions-under-clrtap/2012-submissions/
NECD submissions of Finland: http://cdr.eionet.europa.eu/fi/eu/nec
CLRTAP submissions of Finland:
http://cdr.eionet.europa.eu/fi/un/UNECE_CLRTAP_FI
IIASA Reports
NEC
An Updated Set of Scenarios of Cost-effective Emission Reduction for the
Gothenburg Protocol, CIAM report 4/2011,
NEC Scenario Analysis Report No 1, IIASA 2006,
NEC Scenario Analysis Report No 2, IIASA 2006,
NEC Scenario Analysis Report No 3, IIASA 2007,
NEC Scenario Analysis Report No 4, IIASA 2007,
NEC Scenario Analysis Report No 5, IIASA 2007,
NEC Scenario Analysis Report No 6, IIASA 2008,
NEC Scenario Analysis Report No 7, IIASA 2010,
NEC Scenario Analysis Report No 8, IIASA 2011,
Cost-effective Emission Reduction to Improve Air Quality in Europe, CIAM
report 1/2011.
TSAP
Future Emissions of Air Pollutants in Europe – Current Legislation baseline
and the Scope for Further Reduction; TSAP report # 1, ver 1, IIASA June
2012,
Factors determining recent changes of emissions of air pollutants in
Europe; TSAP Report #2, Version 1.0, IIASA June 2012,
Emissions from agriculture and their control potentials; TSAP Report #3,
Version 1.0, IIASA June 2012,

137
Services to assess the reasons for non-compliance of the emission ceilings set in the National Emission Ceilings
Directive – Final Report
The potential for further controls of emissions from mobile sources in
Europe; TSAP Report #4 Version 2.0, IIASA November 2012,
Emissions from households and other small combustion sources and their
reduction potential; TSAP Report #5, Version 1.0, IIASA June 2012
TSAP-2012 Baseline: Health and Environmental Impacts; TSAP report # 6,
Version 1, IIASA November 2012,
Scenarios of Cost-effective Emission Controls after 2020; TSAP Report #7
Version 1.0, IIASA November 2012
GAINS model
GAINS: http://gains.iiasa.ac.at/models/
GAINS online (see http://gains.iiasa.ac.at/gains/EUN/index.login?logout=1)
Amann M, Bertok I, Cofala J, Gyarfas F, Heyes C, Klimont Z, Schöpp W, Winiwarter W,
2005. CAFE Scenario Analysis Report Nr. 1; Baseline Scenarios for the Clean Air for
Europe (CAFE) Programme; Final Report. International Institute for Applied Systems
Analysis (IIASA), Prepared for the European Commission, Directorate General for
Environment, Directorate C – Environment and Health, February 2005, 79 pp.
http://ec.europa.eu/environment/archives/cafe/activities/pdf/cafe_scenario_report_1.pdf
Amann, M., Bertok, I., Cofala, J., Gyarfas, F., Heyes, C., Klimont, Z., & Schöpp, W.,
2000. Cost-effective Control of Acidification and Ground-level Ozone: Further Analysis.
Eighth Interim Report, Part 1, January 2000.
http://ec.europa.eu/environment/air/pdf/documents/cost1.pdf
Amann, M., Bertok, I., Cofala, J., Gyarfas, F., Heyes, C., Klimont, Z., & Schöpp, W.,
1999. Integrated Assessment Modelling for the Protocol to Abate Acidification,
Eutrophication and Ground-level Ozone in Europe. IIASA, for the Netherlands Ministry of
Housing, Spatial Planning and the Environment.
http://www.iiasa.ac.at/rains/dutch/dutch2.pdf
Borken-Kleefeld J and Ntziachristos L, 2012. The potential for further controls of
emissions from mobile sources in Europe. TSAP Report #4 Version 2.0. IIASA.
http://www.iiasa.ac.at/web/home/research/researchPrograms/MitigationofAirPollutionand
Greenhousegases/TSAP-TRANSPORT-v2-20121128.pdf (impact of real-driving euro 2-5)
CEIP, 2012. Inventory Review 2012: Review of emission data reported under the LRTAP
Convention and NEC Directive, Stage 1 and 2 review, Review of POP emission
inventories, Status of gridded and LPS data, Technical report CEIP 1/2012,
Coenen, P., Jozwicka, M., Pulles, T., Grebot, B., Lee, J., Goodwin, J., Weis, P., 2012.
GHG projection guidelines, Part A: General Guidance (No. CLIMA.A.3/SER/2010/0004).
TNO, AMEK UK limited, Aether Limited, Öko Institut e.V., Umweltbundesamt GmbH.
Retrieved from http://ec.europa.eu/clima/policies/g-
gas/monitoring/docs/ghg_projection_guidelines_a_en.pdf
EC, 1999. Proposal for a Directive of the European Parliament and of the Council on
national emission ceilings for certain atmospheric pollutants. COM(99)0125 final.
http://eur-
lex.europa.eu/LexUriServ/LexUriServ.do?uri=CELEX:51999PC0125%2801%29:EN:NOT
138
Services to assess the reasons for non-compliance of the emission ceilings set in the National Emission Ceilings
Directive- Final Report
EEA, 2012. NEC Directive status report 2011. Technical report No 6/2012, European
Environment Agency. http://www.eea.europa.eu/publications/nec-directive-status-report-
2011/at_download/file
EEA, 2013. NEC Directive status report 2012. Technical report No 6/2013, European
Environment Agency. http://www.eea.europa.eu/publications/nec-directive-status-report-
2012/at_download/file
Ntziachristos L and Papageorgiou T, 2011. Road transport emission projections in the
context of the EU NEC Directive ceiling commitments. Impacts of model versions.
ETC/ACC Technical Paper 2010/20, February 2011, 45 pp.
http://acm.eionet.europa.eu/reports/ETCACC_TP_2010_20_Copert2vsCopert4
UNECE CLRTAP, 1999. Protocol to the 1979 Convention on Long-Range Transboundary
Air Pollution to Abate Acidification, Eutrophication and Ground-Level Ozone. [Gothenburg
Protocol]
http://www.unece.org/fileadmin/DAM/env/lrtap/full%20text/1999%20Multi.E.Amended.200
5.pdf
UNECE CLRTAP, 2013. Gothenburg Protocol to Abate Acidification, Eutrophication and
Ground-level Ozone. Retrieved 10 October 2013, from
http://www.unece.org/env/lrtap/multi_h1.html

P.O. Box 4175
3006 AD Rotterdam
The Netherlands
Watermanweg 44
3067 GG Rotterdam
The Netherlands
T +31 (0)10 453 88 00
F +31 (0)10 453 07 68
www.ecorys.nl
Avenue Reine Astrid 92
1310 La Hulpe