services innovation and economic performance luísa ferreira lopes manuel mira godinho
TRANSCRIPT

Services Innovation and Economic Performance
Luísa Ferreira Lopes
Manuel Mira Godinho

Services Contribution to GDP
0
0,1
0,2
0,3
0,4
0,5
0,6
0,7
0,8
0,9
1
Aus
tral
iaA
ustr
iaB
elgi
umC
anad
aC
zech
Rep
.D
enm
ark
Fin
land
Fra
nce
Ger
man
yG
reec
eIc
elan
dIr
elan
dIt
aly
Japa
nK
orea
Lux
emb.
Mex
ico
Net
herl
ands
New
Zea
land
Nor
way
Por
tuga
lSp
ain
Swed
enSw
itzer
land
Tur
key
U.K
.U
.S.A
.
% Services 1987 % Services 1997
Source: National Accounts, OECD

CIS2 – Results for PortugalInnovation in Services
0
10
20
30
40
50
60IT
-BS
Tel
ecom
Fin
ance
Eng
enee
.-B
ST
rans
port
Tra
de
%Innovativefirms
Source: Conceição & Ávila, 2001

CIS2 – Results for Europe% Innovative Firms in Services
0102030405060708090
Bel
giu
mG
erm
any
Fra
nce
Irel
and
Lu
xem
bur
gN
eth
erl..
.A
ust
ria
Fin
lan
dS
wed
enU
.K.
No
rway
Po
rtu
gal
Trade
Transport &Telecom
Finance
IT & Engeneering
Source: Conceição & Ávila, 2001
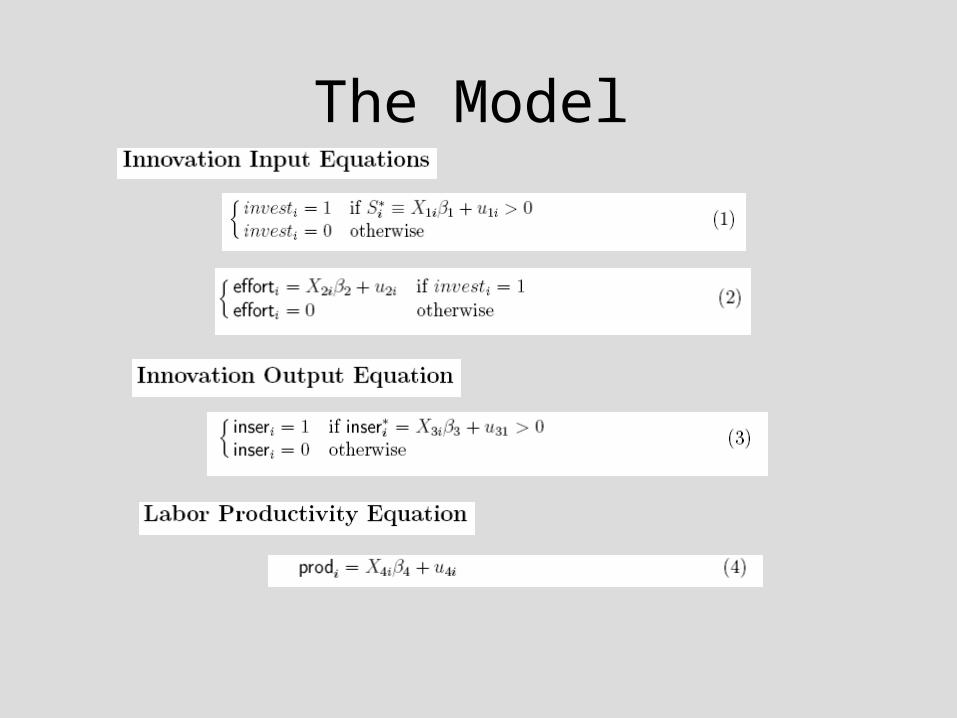
The Model

List of Variables

Innovation Activities

Model Specification

Services Industries in Data Set

Sample Description

Sistem Estimation

Separate Estimation

What is new ?
• The analyses of the innovation-productivity relationship in the services context – With a structural model– Considering the characteristics of the data
• Compare previous quantitative services studies

Limitations
• Pure cross-section
• Proxis for labor productivity and innovation output

Any conclusions, so far? ......
• Endogeneity is a major problem
• The choice of instruments is critical for the results
• The model is highly sensitive to different estimation methods

Developments
• Further tests to determine the best specification and estimation method
• Test for structural changes in the model• Extend the model and consider other
countries – SIEPI database• Use a value added measure for
productivity• Combine CIS3 survey with CIS2 to build a
panel data set