service time variability at the blaine, washington...
TRANSCRIPT

Service Time Variability at the Blaine, Washington, International Border Crossing and the Impact on Regional Supply Chains
Anne Goodchild, Ph.D.Department of Civil and Environmental EngineeringUniversity of Washington
Steven Globerman, Ph.D.College of Business and EconomicsWestern Washington University
Susan Albrecht, MAPSJackson School of International StudiesUniversity of Washington
Research Report No. 3June 2007
Border Policy Research InstituteWestern Washington UniversityBellingham, Washingtonwww.ac.wwu.edu/~bpri/

About the Border Policy Research Institute
The BPRI focuses on research that informs policy-makers on matters related to the Canada—U.S. border. Policy areas of importance include transportation and mobility, security, immigration, energy, environment, economics, and trade.
Border Policy Research InstituteWestern Washington University516 High StreetBellingham, WA 98225-9110(360) 650-3728
The BPRI encourages use of this report. Any part of the material may be duplicated with proper acknowledgment.
This research was supported by the U.S. Department of Transportation, Office of the Secretary, Grant No. DTOS59-05-G-00016.
This report is available at http://www.ac.wwu.edu/~bpri/resources.html

1
by Anne Goodchild, Ph.D., Steven Globerman, Ph.D.,
and Susan Albrecht, MAPS
Service Time Variability at the
Blaine, Washington, International Border
Crossing and the Impact on Regional
Supply Chains
ABstRAct
Service times at vehicle processing facilities (borders, weigh stations, landside marine
port gates) are variable, thereby causing transportation planning challenges for carriers
that visit them on a regular basis. Carriers must either build in more time than is
necessary, therefore underutilizing their equipment, or risk missing delivery windows,
which can result in fines or cause lost business opportunities. In this study, border
crossing times at Blaine, Washington, are examined. The variability in crossing times
at this border crossing, and the impact of this variability on regional supply chains is
considered for bi-directional trade. Directional, daily, hourly, and seasonal variations
are examined. Interviews with regional carriers were conducted to better understand
the current response to variability, the benefit of a reduction in variability, and how
this is related to the goods moved or to other business operating characteristics. This
paper describes the level of variability in border crossing times and describes carriers’
responses to this variability. It is demonstrated that the primary strategy used,
increasing buffer times, reduces carrier productivity. However, this cost is negligible
due to the current nature of the market.
made a point of reducing tariff barriers.
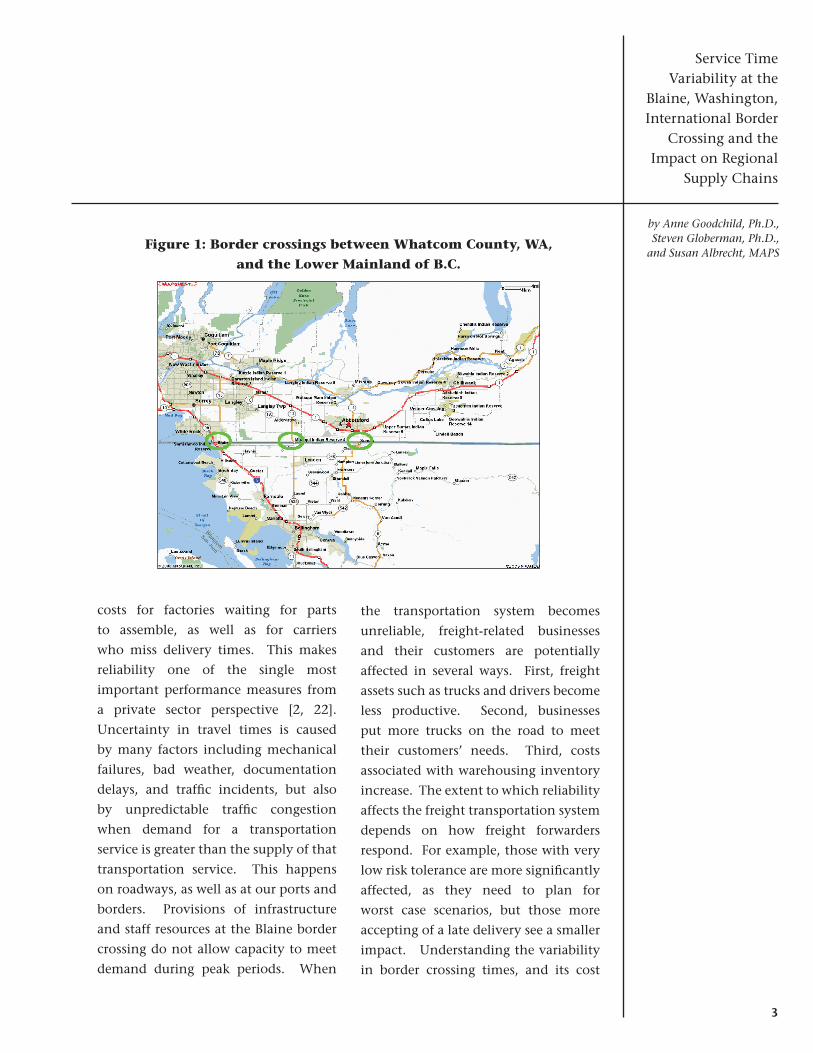
The Pacific Highway border crossing
at Blaine, Washington, is the main
commercial crossing between Whatcom
County, Washington, and the Lower
Mainland of British Columbia. It is the
fourth busiest commercial crossing on
the Canada – US border [1], and the most
significant commercial crossing for the
Western portion of the US and Canada.
The crossing is approximately 100 miles
north of Seattle and 30 miles south of
Vancouver, B.C., on Washington State
Route 543 and B.C. Provincial Highway
15. The Blaine crossing, as well as
many others, is congested during peak
IntRoductIon1. The US and Canada are each other’s
biggest trading partners. The value of
trade between the two is the largest
between any two countries worldwide.
For the US, trade with Canada is larger
than combined trade with all of the
countries in the EU [3]. The volume of
freight moved by the U.S. transportation
system has grown dramatically in
recent decades and is projected to grow
nearly 50 percent between 2005 and
2020 [3], [15]. Supply chains in many
manufacturing sectors span the Canada
– US border daily, and bilateral trade
agreements between the two countries

2
Service Time Variability at the Blaine, Washington, International Border Crossing and the Impact on Regional Supply Chains
by Anne Goodchild, Ph.D., Steven Globerman, Ph.D., and Susan Albrecht, MAPS
periods. Transit times can be long and
unpredictable [20, 21]. The two major
reasons for time delays are the lack of
investment in physical infrastructure,
and time consuming customs and
immigration procedures, including
Food and Drug Administration (FDA)
inspections for goods entering the US.
International border delay is perceived
as a major problem. The province of
Ontario has carried out a significant
amount of work in an attempt to
quantify the impact of border delay on
their economy [8]. Ontario and the states
surrounding the Great Lakes area have
formed a regionally integrated economy
that is very dependent on the ability to
move goods efficiently across the border.
A recent report by the Ontario Chamber
of Commerce finds that the US economy
absorbs 40 percent of the current cost
of border delays ($4.13 billion/year and
$471,461/hour); unless improvements
are made on regional border issues, the
US stands to lose 17,345 jobs by 2020.
With future trade expected to grow 180
percent by 2015, without investments
and improvements in cross border trade,
Ontario will likely “suffer tremendous
economic and social costs.” Because of
this, Ontario has deemed it important
that its border remain free from delays
[20].
The terrorist attacks of September
11, 2001 focused attention on border
security, and resulting legislation has
changed security processes. Many
changes have occurred at the border,
including the Advanced Electronic
Presentation of Cargo Information (ACE)
under the US Trade Act, Customs-Trade
Partnership Against Terrorism (C-TPAT),
Free and Secure Trade (FAST), and US
FDA prior notice arrival. In addition,
there have been recent increases in
cross-border trade. These changes drew
attention to the question of border
delay [14, 29]. At the same time, the
liberalization of trade policies, such as
NAFTA, internationalization of supply
chains, and changes in transportation
and information technologies have
contributed to this growth in freight
movement. North-south traffic between
the US and Canada, fostered by NAFTA,
has placed increasing demands on
the domestic freight transportation
system. US – Canada trade has grown
by 152 percent since 1989 (growth in
commercial traffic of 122.5 percent),
and trucks move just over 70 percent
of the value of exports from the US to
Canada [21]. As a result, the nation’s
highway and rail networks, initially
developed for the traditional east-west
trade, are now strained, especially at
border crossings such as those between
Whatcom County and the Lower
Mainland of B.C. (see Figure 1) which
includes the Blaine crossing.
One of the most significant challenges
for private industry is planning for
uncertainty in travel time. Late
arrivals can have significant economic
3
by Anne Goodchild, Ph.D., Steven Globerman, Ph.D.,
and Susan Albrecht, MAPS
Service Time Variability at the
Blaine, Washington, International Border
Crossing and the Impact on Regional
Supply Chains
costs for factories waiting for parts
to assemble, as well as for carriers
who miss delivery times. This makes
reliability one of the single most
important performance measures from
a private sector perspective [2, 22].
Uncertainty in travel times is caused
by many factors including mechanical
failures, bad weather, documentation
delays, and traffic incidents, but also
by unpredictable traffic congestion
when demand for a transportation
service is greater than the supply of that
transportation service. This happens
on roadways, as well as at our ports and
borders. Provisions of infrastructure
and staff resources at the Blaine border
crossing do not allow capacity to meet
demand during peak periods. When
the transportation system becomes
unreliable, freight-related businesses
and their customers are potentially
affected in several ways. First, freight
assets such as trucks and drivers become
less productive. Second, businesses
put more trucks on the road to meet
their customers’ needs. Third, costs
associated with warehousing inventory
increase. The extent to which reliability
affects the freight transportation system
depends on how freight forwarders
respond. For example, those with very
low risk tolerance are more significantly
affected, as they need to plan for
worst case scenarios, but those more
accepting of a late delivery see a smaller
impact. Understanding the variability
in border crossing times, and its cost
Figure 1: Border crossings between Whatcom County, WA,
and the Lower Mainland of B.C.

4
Service Time Variability at the Blaine, Washington, International Border Crossing and the Impact on Regional Supply Chains
by Anne Goodchild, Ph.D., Steven Globerman, Ph.D., and Susan Albrecht, MAPS
to freight forwarders, is essential to
matching infrastructure supply with
demand, assessing potential operational
strategies, and prioritizing investments.
The issue of border crossing time
variability is therefore very timely, and
it is anticipated that the issue will only
become more pressing for the industry.
The paper begins with a review of the
related literature. The variability in
border crossing times is quantified,
assessing the impact of season, day of
the week, and time of day. The results
of in-person qualitative interviews with
carriers that frequently move goods
across the border are presented. Carriers
employ a range of strategies, especially
those that frequently cross the border,
to reduce crossing time variability and
the resulting costs and consequences
for their business. Finally, the
economic consequences of variability
are considered.
An important distinction to emphasize
at the outset is one between average
time to cross the Canada – US border at
a specific site and the variability around
the average time needed to cross. The
focus of this study is on the latter,
although there is a statistical linkage
between the two. As is demonstrated by
empirical data, longer average crossing
times are associated with greater
variability around the average. In this
paper, a distinction is drawn between
the two, although interviewees were
more inclined to discuss the average,
due to the magnitude of frustration
with the average delay, rather than the
variability in delay. This in and of itself
is an interesting result of the research.
2. contRIButIons
This paper offers the following
contributions to the existing body of
knowledge:
Identify the level of variability 1.
in border crossing times and the
relationship between variability
and season, time of day, and border
processing (FAST or nonFAST).
Identify the strategies used by 2.
carriers to manage border crossing
time variability.
Evaluate the cost of crossing time 3.
variability given the nature of the
industry in the Pacific Northwest.
Identify the differential impact 4.
of variability between US and
Canadian carriers and carriers with
various logistics structures.
Demonstrate that FAST lane wait 5.
times are shorter than nonFAST
wait times due to processing time
rather than arrival rate.
Present carriers’ perceptions of the 6.
border and their relative value of
border processes.
Provide data to support the 7.
conclusion that variability in border
crossing times is not currently a
significant cost for regional carriers
to bear.

5
by Anne Goodchild, Ph.D., Steven Globerman, Ph.D.,
and Susan Albrecht, MAPS
Service Time Variability at the
Blaine, Washington, International Border
Crossing and the Impact on Regional
Supply Chains
3. LIteRAtuRe RevIew
The most relevant work to our
research is a study for the Michigan,
New York State and US Departments
of Transportation concerning the total
cost of highway border crossing delays
as well as related costs of maintaining a
border. Unlike other studies, this study
includes uncertainties in transit times
when estimating the cost to US and
Canadian economies [25]. However,
this study did not consider the structure
of supply chains or the potential for
employers to change their logistics
operations in response to border travel
time uncertainty.
The relevant literature for this project
spans many topic areas including travel
time reliability, metrics for supply chain
management, the value of time for
freight movement, reliability in freight
transportation, and studies specific to
border crossing. A summary of some
representative articles from each of
these topics is described below.
3.1 travel time reliability
Travel time reliability is an element
of transportation system performance
that is generally measured according to
buffer time or buffer time index [10, 19,
26, 27]:
Buffer Time - a measure of travel •reliability calculated by ranking
crossing times of individual trucks at
each port of entry. It is the difference
between, say the 95th percentile time
(any percentile could be used) and
the average time for all trucks—it
represents the ‘extra time’ a driver
must budget to cross the border at
the average time with a 95 percent
certainty.
Buffer Index - the buffer time •expressed as a percentage of average
time. This is the measure that will
be most comparable on an annual
basis and between crossings as
it standardizes the measure by
removing variables such as crossing
length.
Travel time reliability has become
an increasingly important metric for
passenger transportation and has
received significant research attention
[5, 6]. For freight carriers, significant
variations in travel time can impact
inventory planning and the efficient
use of transportation infrastructure,
particularly for time-sensitive goods
due to value, perishability or business
operating characteristics (such as just-in-
time operations) [30]. New technologies
are being developed and tested as
data collection methodologies to cost
effectively measure transportation
system performance characteristics such
as truck volumes, mean travel times, and
80th and 95th percentile travel times.
3.2 Metrics for supply
chain management
Modern supply chains are data
Figure 1. optimal toll for single Link Roadway
6
Service Time Variability at the Blaine, Washington, International Border Crossing and the Impact on Regional Supply Chains
by Anne Goodchild, Ph.D., Steven Globerman, Ph.D., and Susan Albrecht, MAPS
rich – for example, shipment dates,
inventory levels, and dwell times are
easy to calculate [24]. Companies
that outsource transportation services
to another provider often use these
statistics to measure the performance of
their contractor. However, there is very
little literature available concerning
system design and measures selection.
Instead, the literature focuses on
higher-level metrics. Recent papers
suggest a systems-thinking perspective
and process-based models are a more
holistic perspective better employed
in the use of performance measures in
supply chain management because they
span all business aspects involved in the
supply chain [16, 18].
3.3 value of time
for freight movements
Significant work has been done to
estimate the cost of delay (typically from
congestion) to the goods-movement
industry, although significantly less
work has been done on the value
of freight as compared to passenger
time [17, 18]. While issues related to
freight value-of-time are somewhat
similar to passenger value-of-time, they
differ in several important aspects [7].
For example, travel time savings for
passengers may be a direct or indirect
function of the utility as a resource
constraint on traveling decisions. For
freight, however, this is an indirect
value—time is a resource used in the
production function. Freight transport
also has several actors, making it
difficult to identify a single decision
maker and the actual agent who
will take advantage of time savings.
Another reason why the topic has not
been investigated in as much detail is
that reliable and complete information
on freight transport generally is not
available. In addition, heterogeneity of
shipments requires a higher number of
attributes to characterize a shipment
than passenger trips. Freight value-
of-time is typically calculated using
the following three components:
value-of-time savings for the driver;•savings of vehicle operating costs;•value-of-time savings to the freight •carried.
Unfortunately these estimates
ignore the dynamic environment of
freight transportation where delay
such as variability might cost carriers
through lost business opportunities,
late fees, schedule changes or changes
to their logistics structure. This is
recognized in some articles [34], but a
thorough classification of the impacts
or an estimate of their value does not
exist. One article [23] does provide a
specific value for schedule delay. It is
widely agreed that the measurement
of time delay and its associated costs
needs further refinement with rigorous
analysis.

7
by Anne Goodchild, Ph.D., Steven Globerman, Ph.D.,
and Susan Albrecht, MAPS
Service Time Variability at the
Blaine, Washington, International Border
Crossing and the Impact on Regional
Supply Chains
Within this framework, typical
estimates of the value of freight
congestion range from $25 to $200
per hour depending on the product
being carried. [32, 17, 16, 29, 28,
20]. It is recognized that the value of
reliability for trucks is another 50 to
250 percent higher [32]. For example
an NCHRP report estimates the cost of
delay between $144.22 to $192.83 per
hour depending on the commodity,
and savings in late schedule delays at
$371.33/hour [23]. An Australian survey
used a contextual stated preference
method to survey shippers about freight
transit time and reliability. In this study,
the value of time falls as the distance of
the shipment increases. Results showed
that metropolitan freight travel time
is more highly valued than that of
intercity or urban freight movements,
and that intercity reliability is more
highly valued than that of urban or
metropolitan freight movements [33].
3.4 Reliability in freight transportation
Given recent terrorist activity and
extreme weather events, a significant
amount of attention has been paid in the
literature to addressing the reliability of
supply chains [4]. While relevant, this
work has focused upon how companies
should organize to anticipate and
respond to disruptions, rather than
on understanding the magnitude of
recurrent delays such as border crossing
times.
3.5 Border crossing time studies
There are several reports from efforts
by government agencies on both sides
of the border to quantify border delay.
The US Federal Highway Administration
conducted a detailed study in the
summer of 2001 on traffic at the four
major Canada – US and the three
major US – Mexico crossings. The four
Canada – US border crossings were the
Windsor-Ambassador Bridge between
Windsor and Detroit, the Peace Bridge
between Niagara and Fort Erie in
upstate New York, the Blue Water Bridge
in Michigan, and the Pacific Highway-
Blaine crossing. For each location the
study computed a zero congestion time
for both northbound and southbound
traffic crossing the border. Blaine
crossing travel times were computed
over a single three-day period. Actual
travel times start from the first queuing
point before the border and end when
the vehicle is released from inspection.
Data used include average crossings
per day, average delay per trip, and a
buffer index (the difference between
the average crossing time and the 95th
percentile crossing time). The study
shows a direct correlation between
delays and the number of customs/
immigration booths open—the greater
the number of booths open, the shorter
the delay. The data also suggest that
staffing at a number of crossings is not
responsive to traffic buildup in peak
periods [30, 31]. The study does not

8
Service Time Variability at the Blaine, Washington, International Border Crossing and the Impact on Regional Supply Chains
by Anne Goodchild, Ph.D., Steven Globerman, Ph.D., and Susan Albrecht, MAPS
consider the impact of variability on
regional supply-chains or economies.
While this demonstrates the extensive
amount of literature available on
topics related to border crossing time
variability, it also highlights the gap in
the literature addressing border crossing
time variability. The strategies used by
carriers to accommodate variability
in border crossing time have not been
identified or confirmed by carriers,
nor has their impact on these carriers’
businesses or regional supply chains.
To date these costs have been ignored in
attempts to quantify the cost of border
delay and congestion.
4. BoRdeR cRossIng tIMe vARIABILIty
Typically the US border at Blaine,
WA, operates with either two or three
gates available for truck crossings
(southbound into the US), including
one FAST (Free and Secure Trade) lane.
The FAST lane can be used by carriers
who comply with procedures outlined
by the FAST [36] program. Compliance
with the FAST procedures offers shorter
average wait times for carriers and
more information about shipments for
Customs and Border Protection [9]. 1
Border crossing time data for this
project comes from two sources: (1) a
short duration but more detailed data
collection southbound (entry into
the US) at Pacific Highway sponsored
by the Whatcom County Council of
Governments (referred to as WCOG
data), and (2) a longer duration but less
detailed collection both southbound
(into the US) and northbound (into
Canada) using probe vehicles (referred
to as probe data). The two datasets are
described here:
The WCOG data was collected 1.
between the hours of 8:00 am and
5:00 pm from Monday, June 5,
through Thursday, June 8, 2006.
Using surveyors with electronic
PDAs, time stamps were collected
when trucks arrived in queue,
entered, and exited processing at
the border. The data is completely
described in [35]. The usable dataset
includes 579 FAST observations over
3 days (June 6 was removed as the
FAST lane was opened to all traffic),
and 1480 nonFAST observations.
Only southbound data is available
(vehicles entering the US)
The probe data was collected using 2.
a fleet of vehicles such that one
vehicle crosses the Pacific Highway
Border crossing in Blaine, WA,
approximately every 30 minutes, 7
days a week, every week of the year.
Border wait times both northbound
and southbound were collected
between August 1, 2005, and July
17, 2006 (excluding January 2006).
1 In this paper we use the term FAST to refer to a vehicle that can use the FAST lane when transiting the border (therefore transportation mode, company, driver, and owner of the goods must all be FAST approved).

9
by Anne Goodchild, Ph.D., Steven Globerman, Ph.D.,
and Susan Albrecht, MAPS
Service Time Variability at the
Blaine, Washington, International Border
Crossing and the Impact on Regional
Supply Chains
Drivers work for a single company
that moves fuel from Washington
to B.C. Trucks cross the border
northbound full and return to
Washington empty. Drivers self-
report arrival at the back of the
queue at the border, and departure
from the border. Drivers are paid by
the hour regardless of whether they
are waiting in a queue at the border
or driving. The company and its
drivers are FAST approved and use
the FAST lane whenever possible.
The FAST lane is only available
southbound (vehicles entering the
US). It is a Customs and Border
Protection program and therefore
not relevant for northbound
crossings into Canada. The
dataset includes 5658 observations
southbound and 5805 observations
northbound.
The WCOG dataset is used to validate
the probe data. The WCOG data
does not hold enough observations
across day, week, and hour to analyze
variability, but it does contain nonFAST
vehicles. The probe data contains many
observations, but only for FAST vehicles
(southbound). The distribution of wait
times in the two data sets is essentially
equivalent, with average wait times for
FAST vehicles of 22 minutes for the
WCOG data and 23 minutes for the
probe data. The standard deviation is
21 minutes in the WCOG data and 24
minutes for the probe data. Recall the
WCOG data represents only three days
in June 2006, whereas the probe data
represents almost one year between
August 2005 and July 2006. Given
that the FAST vehicle distributions
match in the two datasets, it is assumed
that the nonFAST data for June 2006
is reasonably representative of average
nonFAST crossing times. The average
crossing time for southbound nonFAST
vehicles is 1 hour 23 minutes and the
standard deviation 26 minutes. While
the average wait time for southbound
nonFAST vehicles is distinctly longer
than for southbound FAST vehicles,
the standard deviation, or level of
variability, is not significantly loner.
Over the three day period, the average
arrival rate per lane (southbound) for
the WCOG data is the same for FAST
and nonFAST (21.5 vehicles per hour),
but FAST service rates are shorter (86
seconds compared to 119 and 121 for
the two nonFAST lanes). This means
that differences in wait time are due to
differences in service rates rather than
differences in arrival rates.
5. PRoBe dAtA AnALysIs
The average wait time across all trips
(north and southbound) is 22 minutes
37 seconds; the standard deviation is
22 minutes 1 second; and the 90th per-
centile 47 minutes 5 seconds. The wait
time data follow an approximately log-

10
Service Time Variability at the Blaine, Washington, International Border Crossing and the Impact on Regional Supply Chains
by Anne Goodchild, Ph.D., Steven Globerman, Ph.D., and Susan Albrecht, MAPS
normal distribution, as expected. The
two parameters of a lognormal distribu-
tion, μ and σ, were computed with μ
equal to 4.53, and σ equal to 0.87.
Wait times are more variable
southbound. The standard deviation
of wait times southbound is about 23
minutes and the 90th percentile value is
almost 50 minutes, whereas northbound
the standard deviation is approximately
20 minutes and the 90th percentile is
approximately 45 minutes. Northbound
gate staffing tends to be more demand
responsive than southbound gate
staffing, which can help in reducing the
frequency of especially long delays.2
Figure 2 shows the average wait time
in each one-hour period. Note that each
number represents a one-hour period
following the start time designated by
that number. For example, 8 means
the one-hour period from 8:00 to 9:00.
As we expected, average wait times
tend to be higher during the morning,
particularly southbound. Figures 3 and
4 demonstrate the variability by hour of
the day. Broadly, the standard deviation
and 90th percentile both trend with
the average. Recall the southbound
vehicles are using the FAST lane. There
is no equivalent lane in the northbound
direction.
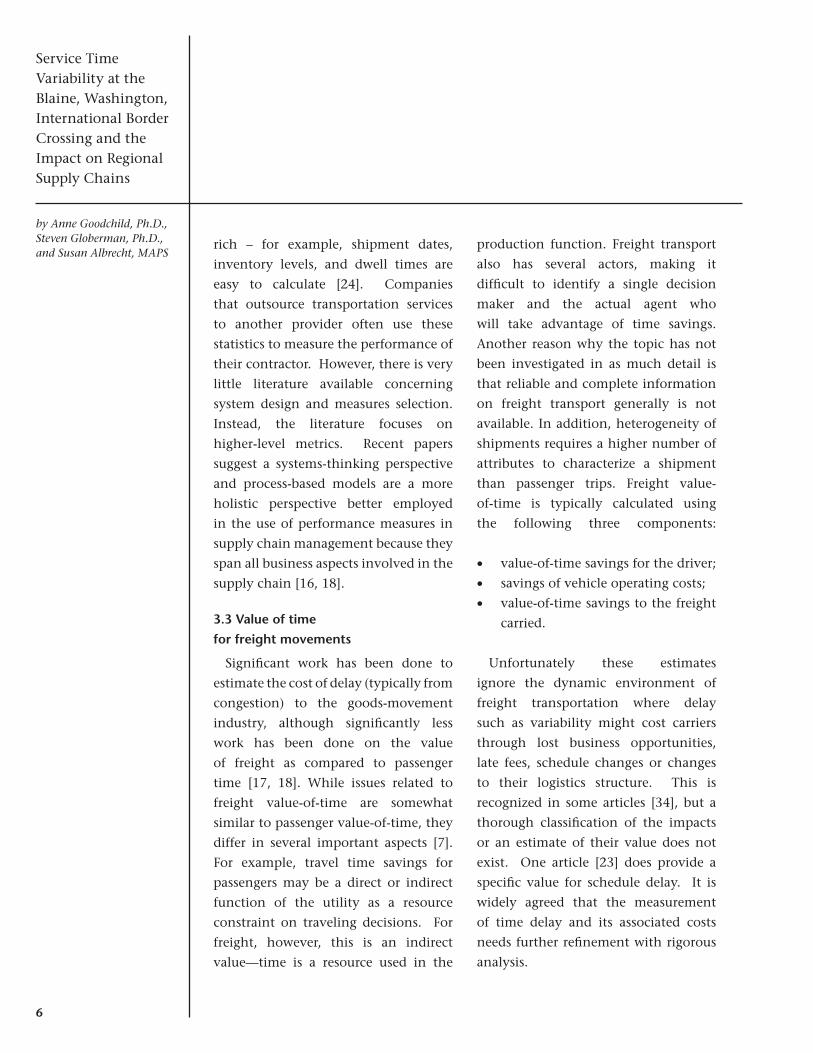
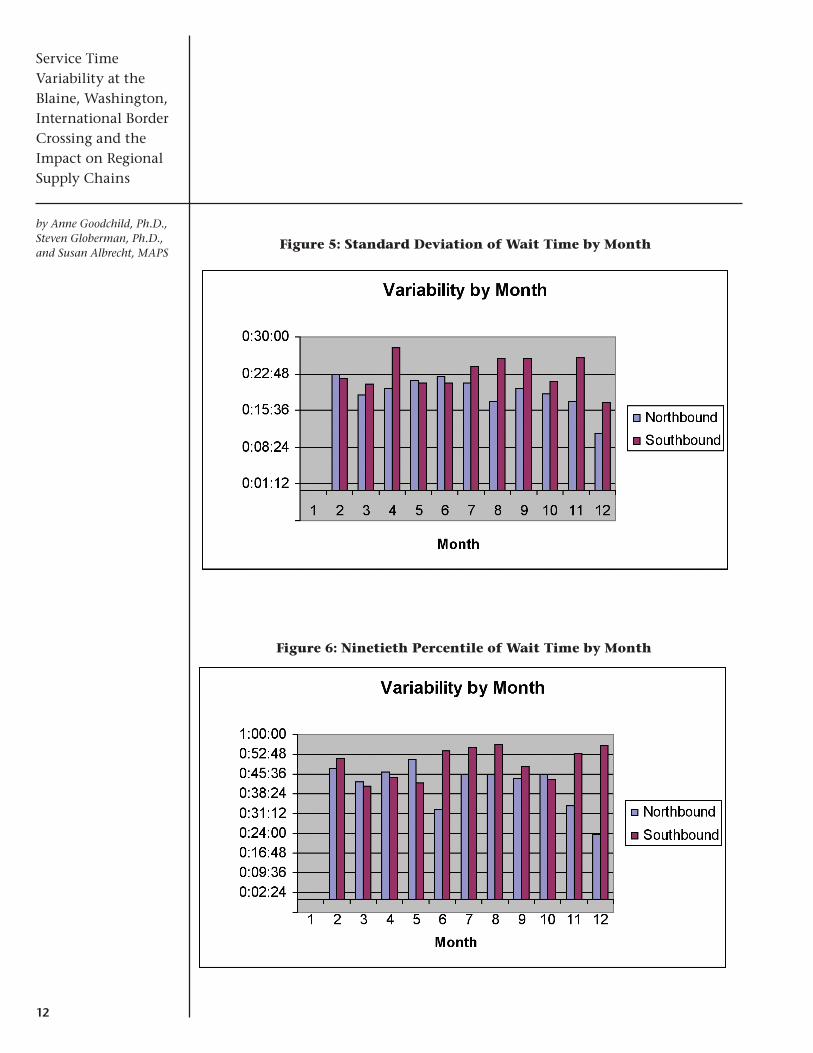
Figures 5 and 6 show the variability
across month. Generally, the
southbound variability peaks in the
late summer/fall (except for some large
values in April). Northbound, the
variability peaks earlier, in the summer,
but with some particularly large values in
February. These large values off-season
may have been due to other issues such
as mechanical or staffing failures.
Clearly, few would argue that border
delays are a significant problem for
FAST approved vehicles southbound, or
for northbound vehicles. The average
delay is on the order of 20 minutes, and
delays of more than 1 hour are very
infrequent.
6. BoRdeR cRossIng tIMe vARIABILIty And ReAL outPut
There are various ways to model the
economic consequences of variability
in the time required to cross an
international border by truck.3 One
approach is to treat border crossings
as an input to an aggregate production
function, as in Equation 1:
Qt = AtLtaKt
bCt1-a-b
where Qt is real output in time period t ; A
is a constant term representing potential
(factor neutral) changes in technology
that affect overall productivity; Lta is
labor input in time period t, Ktb is capital
input in time period t, and Ctc represents
border crossings in time period t.4
The exponents for the three inputs
represent output elasticities.5 In this
broad framework, increased commercial
border crossings contribute to increases
2 Northbound gates are operated by Canada and are thus subject to different policies than the southbound gates operated by the US.
3 At the moment, the direction of crossing is irrelevant.

11
by Anne Goodchild, Ph.D., Steven Globerman, Ph.D.,
and Susan Albrecht, MAPS
Service Time Variability at the
Blaine, Washington, International Border
Crossing and the Impact on Regional
Supply Chains
Figure 2: Average Wait Time by Time of Day
Figure 3: Standard Deviation of Wait Time by Time of Day
Figure 4: Ninetieth Percentile of Wait Time by Time of Day
12
Service Time Variability at the Blaine, Washington, International Border Crossing and the Impact on Regional Supply Chains
by Anne Goodchild, Ph.D., Steven Globerman, Ph.D., and Susan Albrecht, MAPS
Figure 5: Standard Deviation of Wait Time by Month
Figure 6: Ninetieth Percentile of Wait Time by Month
13
by Anne Goodchild, Ph.D., Steven Globerman, Ph.D.,
and Susan Albrecht, MAPS
Service Time Variability at the
Blaine, Washington, International Border
Crossing and the Impact on Regional
Supply Chains
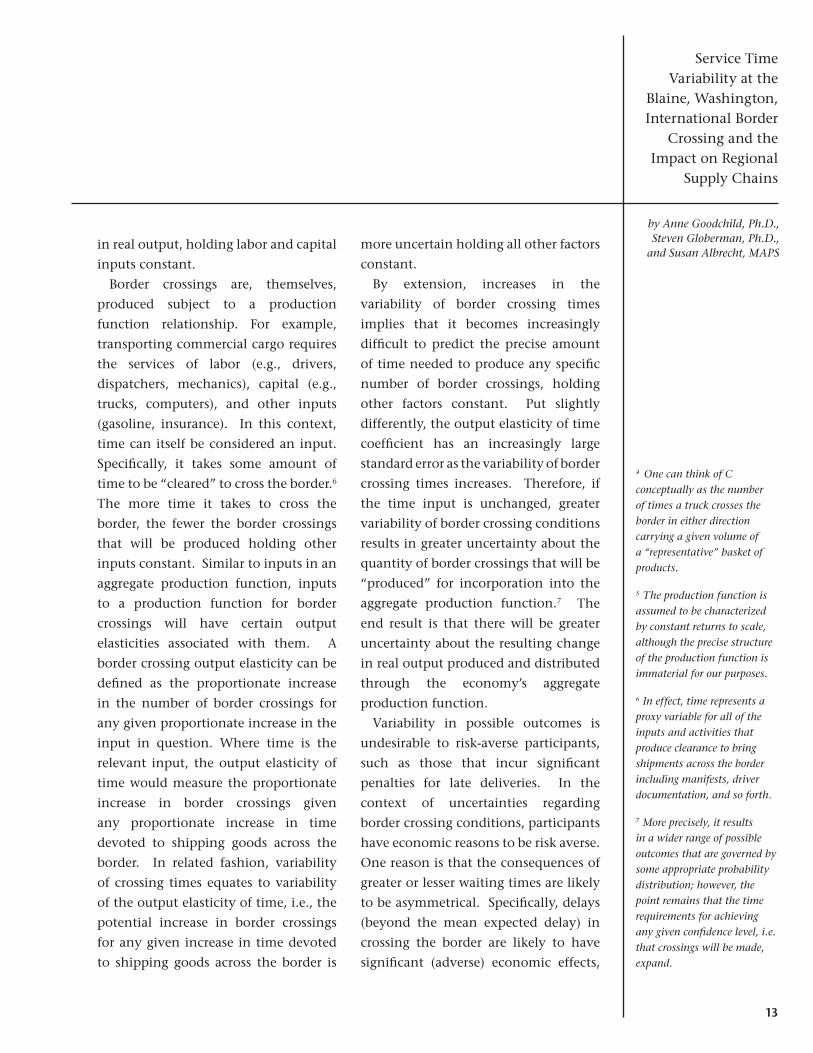
in real output, holding labor and capital
inputs constant.
Border crossings are, themselves,
produced subject to a production
function relationship. For example,
transporting commercial cargo requires
the services of labor (e.g., drivers,
dispatchers, mechanics), capital (e.g.,
trucks, computers), and other inputs
(gasoline, insurance). In this context,
time can itself be considered an input.
Specifically, it takes some amount of
time to be “cleared” to cross the border.6
The more time it takes to cross the
border, the fewer the border crossings
that will be produced holding other
inputs constant. Similar to inputs in an
aggregate production function, inputs
to a production function for border
crossings will have certain output
elasticities associated with them. A
border crossing output elasticity can be
defined as the proportionate increase
in the number of border crossings for
any given proportionate increase in the
input in question. Where time is the
relevant input, the output elasticity of
time would measure the proportionate
increase in border crossings given
any proportionate increase in time
devoted to shipping goods across the
border. In related fashion, variability
of crossing times equates to variability
of the output elasticity of time, i.e., the
potential increase in border crossings
for any given increase in time devoted
to shipping goods across the border is
more uncertain holding all other factors
constant.
By extension, increases in the
variability of border crossing times
implies that it becomes increasingly
difficult to predict the precise amount
of time needed to produce any specific
number of border crossings, holding
other factors constant. Put slightly
differently, the output elasticity of time
coefficient has an increasingly large
standard error as the variability of border
crossing times increases. Therefore, if
the time input is unchanged, greater
variability of border crossing conditions
results in greater uncertainty about the
quantity of border crossings that will be
“produced” for incorporation into the
aggregate production function.7 The
end result is that there will be greater
uncertainty about the resulting change
in real output produced and distributed
through the economy’s aggregate
production function.
Variability in possible outcomes is
undesirable to risk-averse participants,
such as those that incur significant
penalties for late deliveries. In the
context of uncertainties regarding
border crossing conditions, participants
have economic reasons to be risk averse.
One reason is that the consequences of
greater or lesser waiting times are likely
to be asymmetrical. Specifically, delays
(beyond the mean expected delay) in
crossing the border are likely to have
significant (adverse) economic effects,
4 One can think of C conceptually as the number of times a truck crosses the border in either direction carrying a given volume of a “representative” basket of products.
5 The production function is assumed to be characterized by constant returns to scale, although the precise structure of the production function is immaterial for our purposes.
6 In effect, time represents a proxy variable for all of the inputs and activities that produce clearance to bring shipments across the border including manifests, driver documentation, and so forth.
7 More precisely, it results in a wider range of possible outcomes that are governed by some appropriate probability distribution; however, the point remains that the time requirements for achieving any given confidence level, i.e. that crossings will be made, expand.

14
Service Time Variability at the Blaine, Washington, International Border Crossing and the Impact on Regional Supply Chains
by Anne Goodchild, Ph.D., Steven Globerman, Ph.D., and Susan Albrecht, MAPS
while delays that are less than the mean
expected delay are unlikely to offer
similarly significant economic benefits.
Clearing the border in less time than
expected, on average, is the equivalent
of an unexpected (and temporary)
increase in shipping capacity; however,
it may not be possible for shippers and
customers to engage in spot contracting
such that indirect increases in shipping
capacity can be put to use. That is,
imperfectly anticipated improvements
in border crossing conditions are difficult
to translate into increased commercial
shipments across the border and,
therefore, into increased real output. On
the other hand, imperfectly anticipated
delays in shipments that have already
been contracted for are the equivalent
of unexpected short-term reductions in
shipping capacity which will have real
(adverse) consequences for the number
of commercial border crossings that take
place in a given period of time, as well
as for the real output produced during
that period of time.
The adverse economic consequences
(in terms of foregone real output)
associated with imperfectly anticipated
border crossing delays will depend
upon the nature of the underlying
economic transactions, among other
things. For example, transactions
involving perishable goods are likely
to be more adversely affected by such
delays than will transactions involving
durable goods, since the former have
higher opportunity costs of time for any
given economic value of the shipments.
In a related fashion, the economic
consequences of unanticipated delays in
border crossing times will depend upon
the degree of “slack” in the economy’s
logistical network. Slack in this context
can be thought of as inventories of the
products that are shipped across the
border, as well as in other inputs that
are used to produce border crossings in
addition to time.
Inventories of the products that
are shipped across the border can be
drawn upon in place of new shipments
of those same products in the event
of imperfectly anticipated delays
in new product shipments. While
random drawdowns of inventory
create additional risk for supply chain
managers, they need not result in a
permanent loss of real output as long as
inventory levels can be restored to their
“steady states” before actual shortages in
intermediate and final products emerge.
Likewise, to some extent, inputs such
as truck drivers can be substituted for
time. For example, in the limit, drivers
can be kept on call to undertake border
crossings when imperfectly anticipated
favorable crossing conditions exist
to the extent that slack exists at the
receiving end of the shipment, e.g.
unused warehouse space available to the
receiver of the shipment. If the drivers
would be otherwise unemployed and
have relatively low opportunity costs
15
by Anne Goodchild, Ph.D., Steven Globerman, Ph.D.,
and Susan Albrecht, MAPS
Service Time Variability at the
Blaine, Washington, International Border
Crossing and the Impact on Regional
Supply Chains
of leisure time, they can effectively be
considered a slack variable that can
reduce the variability of the output
elasticity of border crossings with
respect to time.
The existence of slack capacity in
transportation supply chains is not
necessarily an indication of inefficiency.
Indeed, a degree of slack is efficient
much as it is efficient for individuals
to purchase various types of insurance
policies whose expected values (in
terms of payoffs) are less than their
costs to the acquirers; however, to the
extent that the “optimal” level of slack
capacity can be reduced by reducing
the variability of border crossing times,
resources can be freed up to be used
in other ways to increase real output.
Whether it pays society to incur costs
in order to reduce slack capacity, as
well as other manifestations of variable
border crossing times, ultimately
depends upon the seriousness of
the consequences of the variability.
From the qualitative interviews it is
possible to gain a perspective on how
broadly significant these economic
consequences are. Before evaluating
this evidence, it is important to
stress that the relevant consequences
can take a variety of forms besides
increasing spare capacity in the supply
chain network. Indeed, one might
expect firms affected by imperfectly
anticipated delays in border crossings to
adopt the least expensive “remedy” to
the associated increase in the standard
error of the output elasticity of border
crossings with respect to time. The
range of possible responses itself makes
it difficult to be precise about the
economic consequences of variability
of border crossing times.
7. otheR souRces oF deLAy
While these costs are significant, it is
important to put border delay into
context. On a trip between Vancouver,
B.C., and Los Angeles, CA, the variability
in travel time due to congestion in major
cities (Vancouver, Seattle, Portland, etc.)
will overwhelm the variability due to
border crossings. In addition there may
be mechanical failures, road closures or
construction. Variable delays are also
incurred at the origin or destination
due to a variety of reasons.
Through the interview process,
perceptions of various kinds of delays
were discussed with carriers. Recurrent
delays are a source of significant
frustration, whereas infrequent delays
are seen as unavoidable. The perception
amongst carriers is that border delays
could be distinctly improved with
changes that are perceived to be low cost
to implement, such as increasing the
level of staffing at key border crossings.
On the other hand, congestion in major
cities is recognized as a very difficult
issue to solve.
So, for all carriers, and in particular

16
Service Time Variability at the Blaine, Washington, International Border Crossing and the Impact on Regional Supply Chains
by Anne Goodchild, Ph.D., Steven Globerman, Ph.D., and Susan Albrecht, MAPS
those with origins and destinations
outside of the Vancouver and Seattle
regions, the variability in travel times
due to border delay is much less
significant than the variability due to
other sources, but is a source of more
frustration as it is seen as easier to
solve.
8. ResPonses to vARIABILIty And econoMIc consequences
A series of interviews have been
conducted with commercial carriers to
investigate the responses to variability
in border crossing times, and the
economic costs of this variability. 20
one-on-one interviews were carried out
with firms that engage in regular cross-
border shipments. Screening criteria for
these interviews and suggested interview
questions can be found in Appendix I.
Of these interviews 13 have been with
US firms and 7 with Canadian firms.
Summaries of these interviews can be
found in Appendix II.
The primary commodities crossing
at Blaine are wood, pulp and paper
products, food and farm products,
metals, and petroleum products.
Approximately 15 to 20 percent of the
trucks are empty vehicles. These are
not typically moving in a particularly
time critical environment. This
differentiates the border between BC
and Washington from that between
Ontario and Michigan,where a
significant number of automotive plants
exist on either side of the border that
exchange parts and operate in a Just-In-
Time manufacturing environment.
Increases in the standard error of
the elasticity of border crossings with
respect to time may impose expected
losses in real economic output upon
participants in the economy. Risk-averse
participants can therefore be expected
to react to those potential losses. The
magnitude and nature of the reactions
will be a function of: (1) the magnitude
of the increase in the standard error;
(2) the economic consequences of the
increase in the standard error. The larger
the magnitude of the increase in the
standard error, the larger the associated
economic losses. Larger economic losses
make it more likely that participants will
undertake (costly) actions to mitigate
either the increase in the standard error
and/or the economic losses associated
with increases in the standard error. The
interviews identified several strategies
that carriers use for minimizing the
impact of variability of border crossing
times on their operations. These
strategies are identified in Table 1 and
discussed further below.

17
by Anne Goodchild, Ph.D., Steven Globerman, Ph.D.,
and Susan Albrecht, MAPS
Service Time Variability at the
Blaine, Washington, International Border
Crossing and the Impact on Regional
Supply Chains
Table 1: Carrier responses to variability in cross border travel times
Strategy Consequence
Increase buffer times
Reduces capacity of •existing infrastructure or requires additional hires and equipmentIncreases transportation •and inventory cost Reduces late arrivals •and stock-outs
Increase dwell times at intermediate handling facilities
Reduces impact of delay •on outbound vehicles, particularly relevant for LTL (less than truckload) operationsIncreases total transit •time and therefore inventory cost
Routing Changes
Reduces the impact of •variability on operations
Schedule changes
Reduces the impact of •variability on operations
Reduce level of activity in cross-border trade
Reduce impact of •variability on operationsStop providing courier or •same day serviceReduce revenue to •carrier and level of cross border economic activity
Change transportation mode
Change border •procedures which, depending on local circumstances, may improve travel time reliability
8.1 Increase Buffer times
Although the average crossing time
southbound for nonFAST vehicles is
about 1 hour and 23 minutes, most
carriers leave 2 hours to cross the border.
In doing so, they are building in 37
minutes of buffer time to accommodate
longer than average crossing times.
This is the most common response to
variability. FAST approved vehicles
typically allow an hour for border
crossing (significantly more than
the average of approximately 20
minutes). Increasing buffer times
reduces the possibility that the driver
will arrive late for an appointment.
None of the respondents incur
specific fees for late arrivals, but there
are other significant consequences:
Customer dissatisfaction with late •deliveries leading to loss of business
(in one case a carrier operating
within a Just-In-Time framework
that is contractually obligated to
arrive on time at least 94 percent of
the time).
With LTL carriers the possibility •that outbound trucks from a
handling facility will be delayed
by incoming trucks. Delay to one
vehicle can therefore impact many
outbound vehicles, and customers
whose goods were not delayed
in the original shipment. These
customers have little sympathy
for the delay and will not bear the
18
Service Time Variability at the Blaine, Washington, International Border Crossing and the Impact on Regional Supply Chains
by Anne Goodchild, Ph.D., Steven Globerman, Ph.D., and Susan Albrecht, MAPS
financial consequences of delay
(missed business opportunities, staff
overtime, perished goods, etc.).
Missed appointments at the Port •of Vancouver can lead to a loss of
future appointment times.
If outbound rail cars are not filled •at a trans-load facility the company
is charged demurrage for empty rail
cars.
If trips are particularly long and a •driver cannot make the return trip
due to hours of service regulations a
replacement driver may need to be
hired or overnight accommodation
expenses may be incurred.
There are also consequences of
arriving too early, which happens on
the majority of occasions. These are
primarily underutilization of the driver
and rolling-stock.
Typically drivers are paid per trip
(rather than per hour), so as individuals
would bear the cost of increasing the
buffer time, but in many cases drivers
are compensated for border wait times
over some threshold. This cost is borne
by the transportation company and
passed on to their customers through
increased rates. In the case that drivers
are not specifically compensated for
border delay, the carrier may keep
the increased revenue. One company
estimates a 7 percent increase in their
freight rates over the last year due solely
to border crossings. Again, long border
delays can be an additional source of
revenue for the driver or carrier.
One carrier moves goods between
Seattle and Vancouver (approximately
140 miles), but also between Seattle and
Portland (approximately 170 miles).
Although the distance is fairly similar,
and congestion would be expected in
the three metropolitan regions, the
carrier allows 12 hours for a round-trip
between Seattle and Vancouver, but
just 8 hours for a round-trip between
Seattle and Portland. The additional
4 hours (50 percent) required is due to
the border crossing, and the rate is 81
percent higher.
8.2 Increased dwell times at
Intermediate handling Facilities
For an LTL firm that uses an
intermediate handling facility, longer
than expected inbound delays can
disrupt outbound trucks. The firms
interviewed have therefore increased
the dwell time of goods at the handling
facility to reduce the possibility of delay
to the outbound trucks. This increases
the time between pick-up and delivery,
reducing the quality of service offered
by the provider.
For carriers with handling facilities
where goods are moved between
vehicles, in order to minimize the impact
of very long delays, it is best to cross the
border after handling goods and loading
trucks to their final destinations (Figure
8), as opposed to crossing the border

19
by Anne Goodchild, Ph.D., Steven Globerman, Ph.D.,
and Susan Albrecht, MAPS
Service Time Variability at the
Blaine, Washington, International Border
Crossing and the Impact on Regional
Supply Chains
before handling goods (Figure 7). For
south-bound supply chains this benefits
Canadian firms with handling facilities
in the Lower Mainland. For north-bound
supply chains this benefits US firms
with handling facilities in Washington
State. The net effect given trade in the
region is probably to favor Canadian
carriers. If the level of variability in
border crossing times could be reduced,
this benefit for Canadian firms would
be removed.
8.3 Routing changes
When feasible, some carriers have
decided to use border crossings that
offer both a more reliable and shorter
crossing time. For example, if the
variability of border crossing times
at Blaine increased relative to the
variability of border crossing times at
Sumas (a commercial port-of-entry 25
miles east of Blaine), some shippers
who previously used Blaine might shift
to Sumas. Presumably it was more
expensive to use the latter crossing
prior to the assumed change in border
crossing conditions; otherwise Sumas
would have been used in the first place.
Average distances traveled between
origins and destinations might be
longer using Sumas, nevertheless, given
a sufficiently large difference between
the two crossings in the predictability
of border crossing times, it might be
economically worthwhile for some
shippers to change their routing.
By changing their border crossing
Figure 7: Logistics network where border crossing occurs before handling goods and loading vehicles for their final destinations.

20
Service Time Variability at the Blaine, Washington, International Border Crossing and the Impact on Regional Supply Chains
by Anne Goodchild, Ph.D., Steven Globerman, Ph.D., and Susan Albrecht, MAPS
route, commercial shippers might be
able to reduce the variability of border
crossings “produced” per unit of time
(holding other inputs constant), albeit
at a higher cost in terms of real inputs
per border crossing produced. In effect,
changing the border crossing location(s)
is tantamount to buying insurance
against imperfectly predictable
disruptions to the “production” of
border crossings. The effective cost of
the insurance is the additional expense
associated with utilizing more fuel,
drivers’ time, and so forth.
To the extent that little to no switching
among border crossing locations is
observed to take place among shippers,
at least two inferences are plausible:
(1) that there are few differences in the
variability of border crossing times across
different border crossing locations,
and (2) that the variability that does
exist is not of sufficient consequence
to warrant incurring the additional
expenses associated with altering
traditional transportation routes.
Hence, if little or no switching behavior
is observed, it does not necessarily
mean that variability of crossing times
has no economic significance; however,
it does suggest that the related costs of
variability may be no greater than the
costs associated with altering border
crossing transportation routes.
Our interviews suggest to us that
the risks associated with imperfectly
anticipated border crossing times
are likely to be of modest economic
Figure 8: Logistics network where border crossing occurs after handling goods and loading trucks to their final destinations.

21
by Anne Goodchild, Ph.D., Steven Globerman, Ph.D.,
and Susan Albrecht, MAPS
Service Time Variability at the
Blaine, Washington, International Border
Crossing and the Impact on Regional
Supply Chains
consequence against the background
of other determinants of the costs of
producing cross-border shipments, and
that the routing changes that do take
place are in a response to average wait
times rather than the variability in wait
times.
8.4 schedule changes
Another way to mitigate increases
in the elasticity of border crossings
with respect to time is to spend more
resources monitoring border conditions
on a “real-time” basis and create the
flexibility within the organization to
alter time patterns of shipments such
that shipments can be moved forward in
time to take advantage of unexpectedly
favorable border crossing conditions.
After learning about favorable periods,
schedules can be permanently adjusted
to cross at favorable times.
When shippers are hauling freight
under long-term business arrangements,
as opposed to spot contracting, it might
be difficult to accelerate shipments in
terms of time of delivery, since there
may be other capacity constraints in the
relevant logistics systems that make it
uneconomical to accelerate shipments
in order to take advantage of border
crossing “windows of opportunity.” For
example, customers taking delivery of
shipments may have warehouse capacity
constraints which make it impractical
to unload and store expedited
shipments on the customer’s premises.
Nevertheless, regular schedule changes
can be made to exploit consistently
reliable crossing times.
Customers (or intermediaries such
as independent warehouses) could
invest in “spare capacity” such that
there is always some additional slack
to accommodate accelerated shipments
between suppliers and customers who
do business on something other than
a spot contracting basis. Presumably
these types of investments would be
economical if the risks associated with
variable border crossing times were of
a significant economic magnitude. In
effect, investments in redundant capacity
in order to alleviate “bottlenecks”
to accelerated shipping enhance the
viability of implementing more “real-
time” management of the border
crossing production function, thereby
mitigating the impact of variability of
crossing times on the elasticity of border
crossings with respect to time.
Carriers were observed shifting their
regular schedules to take advantage
of shorter and more reliable crossing
periods. For carriers that do not shift
their schedules, it suggests that increased
variability of crossing times had only
modest impacts on the elasticity of
border crossings with respect to time or
that the requisite investments to allow
substantially more real time expediting
of shipments are prohibitively expensive.
Several of our survey participants
indicated that they engaged in real time
22
Service Time Variability at the Blaine, Washington, International Border Crossing and the Impact on Regional Supply Chains
by Anne Goodchild, Ph.D., Steven Globerman, Ph.D., and Susan Albrecht, MAPS
(internet) monitoring of border crossing
conditions and were able (at relatively
low cost) to alter shipping times in
order to take advantage of “favorable”
crossing conditions. While the ability
to engage in real time management of
border crossings will not be identical
across all shippers, many of our
respondents are located relatively close
to the Canada – US border. Furthermore,
all have access to relatively low cost
internet monitoring of border crossing
conditions.
However, these schedule changes
were primarily in response to average
delay rather than the variability in
delay because the costs associated with
variability in border crossing times are
of modest importance.
8.5 Reduce Levels of
Activity in cross Border trade
Another approach to mitigating the
adverse consequences of variability
of border crossing times is to reduce
the number of border crossings. In
particular, companies that acquire
inputs from foreign suppliers might
switch to domestic suppliers of those
inputs. In like manner, companies that
sell final output to foreign customers
might seek to replace those foreign
sales with sales to domestic customers.
In effect, variability of border crossing
times might lead to a reduction in the
geographic specialization of production
within North America.
Clearly, the costs associated with
replacing foreign sources of input
supply with domestic sources and/
or replacing foreign customers with
domestic customers can be quite
substantial. To the extent that our
survey respondents indicated that they
have engaged in such replacement
activities, it would signal that the
costs of variability are quite high. In
fact, there was no indication from our
survey interviews that carriers were
cutting back on cross-border shipments
in any significant way in response to
changes in their customers’ value chain
management.
Several Canadian carriers have de-
cided to exit the business of cross-border
trade partially or entirely. Several firms
that, two years ago, offered same-day
courier services between the Lower
Mainland of B.C. and the Puget Sound
region of Seattle have discontinued
this service due to their inability to
reliably deliver and return to B.C. on
the same day. This was primarily due
to the magnitude of border delay, rather
than its variability. In addition, the two
carriers that move containers between
the ports and rail yards in Vancouver
and destinations in Washington have
moved from doing so within one day to
two-day operations. Only two years ago
it was possible to pick-up containers at
the rail yards very early in the morning,
cross the border, drop-off a container,
pick up a container, and return to
23
by Anne Goodchild, Ph.D., Steven Globerman, Ph.D.,
and Susan Albrecht, MAPS
Service Time Variability at the
Blaine, Washington, International Border
Crossing and the Impact on Regional
Supply Chains
Vancouver on the same day. Now this
trip requires two days, so the rates have
increased significantly.
8.6 change transportation Mode
In the Whatcom County/Lower
Mainland region, it may be possible to
substitute rail or marine transportation
for truck transportation. For example,
one fuel company that delivers fuel
in trucks from a coastal refinery in
Washington to Vancouver International
Airport faces competition from a barge
company that can serve the same route
but is subject to less average border delay
and less variability in travel times.
9. InteRPRetIng the evIdence
As suggested by the preceding
discussion, a number of empirical issues
are relevant to evaluating the economic
consequences of variability of border
crossings with respect to time. While
it is impossible to provide quantitative
estimates of the costs of variability
to the North American economy,
several empirical issues bear upon the
qualitative importance of those costs.
One empirical issue is the magnitude
of the observed variability. That such
variability exists at the Pacific Highway
crossing was established earlier in this
report. It was also established that
the average crossing time for nonFAST
vehicles is more than three times
longer than for FAST vehicles, while
the standard deviation of crossing times
for the two types of vehicles is virtually
identical. These observations lead to
the inference that variability of crossing
times is of relatively limited importance
to carriers compared to average crossing
times. Specifically, it is costly for carriers
to join the FAST program.8 Carriers
will incur the relevant costs only if
the expected benefits of qualifying for
and joining the program exceed the
related costs. The border crossing data
described earlier suggest that those
joining the FAST program can expect
to save time, on average, crossing the
border but cannot expect to reduce the
variability of border crossing times. To
the extent that the latter is of significant
economic consequence to carriers and
those hired to ship their products, one
would expect the FAST program to
focus on reducing variability as well
as average crossing times. Certainly,
one cannot conclude from the border
crossing data that variability is of no
economic importance to participants in
the North American economy; however,
it does seem reasonable to conclude
that the economic costs associated with
variability are likely to be modest in
comparison to the costs associated with
average waiting times.
A second empirical issue is whether or
not variability is a significant economic
concern on the part of carriers and/
or their customers. In this regard,
8 It is particularly costly relative to total revenues for smaller companies to join the program given certain fixed costs associated with filing the relevant documents and so forth.

24
Service Time Variability at the Blaine, Washington, International Border Crossing and the Impact on Regional Supply Chains
by Anne Goodchild, Ph.D., Steven Globerman, Ph.D., and Susan Albrecht, MAPS
our survey respondents provided
little indication that variability of
border crossing times was a matter of
substantial concern to them. In fact,
several of the respondents were explicit
in stating the opposite. For example,
one stated explicitly that border
variability has not caused them any
problems. Another survey respondent
stated that a few minutes difference in
border crossing times is insignificant.
A third respondent indicated there is
a high degree of flexibility regarding
border crossing time; this implies
that imperfectly anticipated delays
are unlikely to impose serious costs or
disruption on certain firms.
Canadian carriers are more likely to
identify wait times at the border as a
problem than are US carriers.9 This is
consistent with evidence from other
studies identifying longer wait times for
south-bound cross-border commercial
shipments than for north-bound
commercial shipments (particularly
when nonFAST southbound vehicles
are compared to northbound
vehicles).10 However, most Canadian
carriers participating in our interviews
also did not mention variability of
border crossing times as an important
issue in their logistics planning and
management. A respondent from
a lumber company that ships wood
products from Canada to the US notes
that modest unanticipated delays are
of no material consequence, as the
industry ships primarily by rail, and
rail product is quoted for delivery for a
specific week, rather than for a specific
day.
A third relevant empirical issue is
whether carriers have implemented
any significant changes in their
production or logistical systems in
response to variability, indicating
that the consequences of variability
are of sufficient magnitude to justify
incurring additional costs to mitigate
the variability or to mitigate the
consequences of variability. While a
number of survey respondents indicated
that they took some action to address
border delay problems, the actions were
fairly modest. For example, a number
indicated that they check internet web
cameras to see what border lineups look
like and whether there are any “unusual”
delays.11 Two respondents stated that
they will occasionally change border
crossings in response to delays, and one
also indicated that it will change hours
at which its trucks cross the border. The
broad conclusion one might therefore
draw is that variability of border delays
is not generating additional risks and
costs sufficient to motivate a significant
number of carriers to implement even
fairly modest changes in their logistical
operations.
10. concLusIons
The overall conclusion that might
9 In this regard we are talking about average wait times and not variability around average wait times.
10 The relevant evidence is discussed in Globerman and Storer [14].
11 One respondent indicated that they can literally look out the window and check the border traffic lineups.
25
by Anne Goodchild, Ph.D., Steven Globerman, Ph.D.,
and Susan Albrecht, MAPS
Service Time Variability at the
Blaine, Washington, International Border
Crossing and the Impact on Regional
Supply Chains
be drawn from the interview evidence
is that border delays, on average, are
not of great concern to US carriers,
although they are of greater concern
to Canadian carriers. Variability in
border crossing times, per se, does not
appear to be a significant concern to the
firms that were interviewed. Many of
the interviewees mentioned that there
was “slack in their logistics systems”
such that variability of the magnitude
identified in the earlier part of this
study, i.e. a standard deviation of less
than half an hour in crossing times, is
not considered to be a serious problem.
In some cases, truck drivers are the
effective slack variable. In particular, in
many cases they are paid by the trip, so
the truck drivers absorb the incidence
of any unanticipated border crossing
delays in the form of uncompensated
time spent on the job. The magnitude
of this cost from a social perspective
depends upon the opportunity cost of
the drivers’ time. If the opportunity
cost is relatively low, the social cost of
the slack associated with using drivers’
time as a “buffer” is correspondingly
low.
What does seem clear from our
interviews is that truck drivers are
becoming an increasingly scarce input.
Part of this has to do with demography,
as the average age of truck drivers has
been increasing in recent years and large
numbers are on the verge of retirement.
It also has to do with drivers reacting
to their providing slack for the logistics
networks of North American firms. In
the short-run, effective reductions in
real wages will be largely absorbed by
the drivers themselves. Over time,
the supply curve for truck drivers
becomes more elastic as younger drivers
leave the industry for other forms
of employment, and older drivers
choose retirement rather than work
an incremental year or two. The point
here is that the consequences of variable
border crossing conditions are likely to
be more economically significant in the
future if variability persists.
Truck drivers do not absorb all of
the effective costs of variable crossing
times. This is indicated by the fact
that some of our interviewees build
anticipated border crossing delays into
their pricing structure. If truck drivers
absorbed all of the relevant costs of
variability, firms in a competitive
market would not be passing on costs
of variability in the form of higher
prices. It is unclear from our interviews
whether the higher (resulting) prices
are calibrated on the mean expected
delay or whether they are calibrated
for intervals around the mean expected
delay, e.g. one standard deviation unit
around the mean expected delay. In
two cases, interviewees reported that an
average time delay (e.g., 3.5—4 hours)
is built into their flat rate (per haul)
pricing structure, which suggests that
carriers are making an allowance for
26
Service Time Variability at the Blaine, Washington, International Border Crossing and the Impact on Regional Supply Chains
by Anne Goodchild, Ph.D., Steven Globerman, Ph.D., and Susan Albrecht, MAPS
variability of crossing times within their
pricing. On the other hand, several
other interviewees mentioned that
they incorporate the estimated costs of
specific assumed time delays, e.g. one
hour, into their pricing schedules.
What should be emphasized is that
variability in border crossing times
can be caused by a variety of factors.
While this research considered the
variability in border crossing times,
which includes only the amount of time
waiting in queue at the border, many
respondents were eager to discuss other
delays, such as those caused by FDA
inspections and “paperwork problems”
related to customs documentation.
The point again underscored is that
variability in the time spent waiting
in queue to cross the border may add
only a marginal additional amount of
risk into the North American logistical
network. Against this background, the
impact of variability in border crossing
time associated with security-related
disruptions is arguably relatively small
in economic terms, particularly given
existing slack in the trucking portion of
the transportation network.

27
by Anne Goodchild, Ph.D., Steven Globerman, Ph.D.,
and Susan Albrecht, MAPS
Service Time Variability at the
Blaine, Washington, International Border
Crossing and the Impact on Regional
Supply Chains
APPendIx I
Interviewees should include some firms who operate within a JIT operation, and who move a perishable commodity, high value commodity, and low value commodity.
We plan to conduct the interviews in two phases. First we will interview Shippers (companies that move goods for customers), Private Carriers (companies that operate their own transportation fleet) and 3PLs (companies that provide broader transportation services such as UPS and FedEx). After these interviews are completed we will interview Sellers (companies that contract out their transportation services to another firm).
We will try to achieve a sample of 25 total interviews in the Shipper/3PL/Private Carrier category, and 10 interviews with Sellers. These will all be one-on-one interviews carried out by Anne, Susan, and Steve. Our goal is to carry out the first phase of interviews by the end of October, and the second phase of interviews before Thanksgiving. Companies located in Northwest Washington and the Lower Mainland of B.C. that move goods across the US-Canadian border will be interviewed.
In order to identify the correct person at each firm we will ask the following questions:
Shipper/3PLWho is responsible for making strategic decisions about your service? For example, how frequently to make shipments, how to time shipments, how to route shipments, or how to price services?
SellerWho is responsible for making decisions about who provides your transportation services, and the structure of this contract?
Private CarrierWho is responsible for making strategic decisions about transportation within your company? For example, how frequently to make shipments, how to route shipments, how much inventory to hold, and the structure of your supply chain?
suggested shipper/Private carrier/3PL interview questions
Please briefly describe your transportation service and the logistics structure.
Who decides how frequently shipments are made and how they are routed?1.
Who determines whether the company will store inventory for customers and 2. the levels of any stored inventories?
28
Service Time Variability at the Blaine, Washington, International Border Crossing and the Impact on Regional Supply Chains
by Anne Goodchild, Ph.D., Steven Globerman, Ph.D., and Susan Albrecht, MAPS
How do border crossing conditions get factored into decisions regarding 3. shipment scheduling, shipping routes and inventory levels?
Define variability. It currently takes, on average, about 20 minutes to cross 4. the border at Blaine. This required time varies between 0 and 4 hours, but it is typically (90% of the time) less than 45 minutes. How important is variability of crossing time to your company in scheduling shipments, choosing border crossing sites and determining inventory levels?
How would your company respond to a 10% change in variability of crossing 5. times (i.e., 90% of the time the required crossing time was less than 50 minutes)? In particular, how would the change affect your costs? Which costs, in particular, would change? How would it affect your prices? How would it affect the volume of your shipments?
Would you build extra time into trips? •Would this cause you to hire additional drivers, purchase additional •trucks? How would this affect your pricing?•Reduce the amount of business you carried?•How would this additional variability in travel time affect the level of •inventory you hold? What are the ramifications of this?
How would your company respond to a 50% change in variability of crossing 6. times (i.e. 90% of the time the required crossing time would be less than 70 minutes)? What about a doubling of the variability, so that it took up to 1.5 hours to clear 90% of shipments through the border?
Would you build extra time into trips? •Would this cause you to hire additional drivers, purchase additional •trucks? How would this affect your pricing?•Reduce the amount of business you carried?•How would this additional variability in travel time affect the level of •inventory you hold? What are the ramifications of this?
How large would this variability need to be before it caused some reaction by 7. your company?
What would this response be? E.g. charging a higher price to your •customer, relocating warehousing/distribution facilities, increasing inventories in the supply chain?How would these decisions be made?•
What is the goal of the border? Does the border provide a useful service? 8.
What else causes variability in trip length? Congestion? How do you deal 9. with this? How is this different from border crossing time variability?
29
by Anne Goodchild, Ph.D., Steven Globerman, Ph.D.,
and Susan Albrecht, MAPS
Service Time Variability at the
Blaine, Washington, International Border
Crossing and the Impact on Regional
Supply Chains
Pricing: how do you pay your drivers? How do you price your service? How 10. much has border crossing delay increased your cost base? Do you incur specific fees for delay?
suggested seller Interview questions
Please describe your transportation requirements and how they are currently served.
Who determines how frequently shipments are made? How much and where 1. inventories are held? Who is responsible for your inventory in transit, and at the destination?
Do you require that your transportation provider meet delivery deadlines? How 2. tight are the deadlines? What is the penalty for missing deadlines?
Define variability. Then state the background delivery time information and 3. ask: If the variability increased by x%, how would your transportation provider likely respond?, e.g. increase rates? Increase levels of inventory in transit or at the destination? (Increase the x% as in the case of shippers to get at the sensitivity of the relationships). Discuss.
How would your company react to the responses of shippers identified in your 4. answers to Question 3? e.g., would you reduce the amount of shipping that you contract for? If so, by how much? Would you increase average inventory levels? What are the cost implications of increasing inventory levels? Would you reconsider your choice in a transportation firm? How would this increase in cost be absorbed by your company? How would the cost of this inventory be absorbed by your company? Would you reduce production levels? How would these decisions be made?
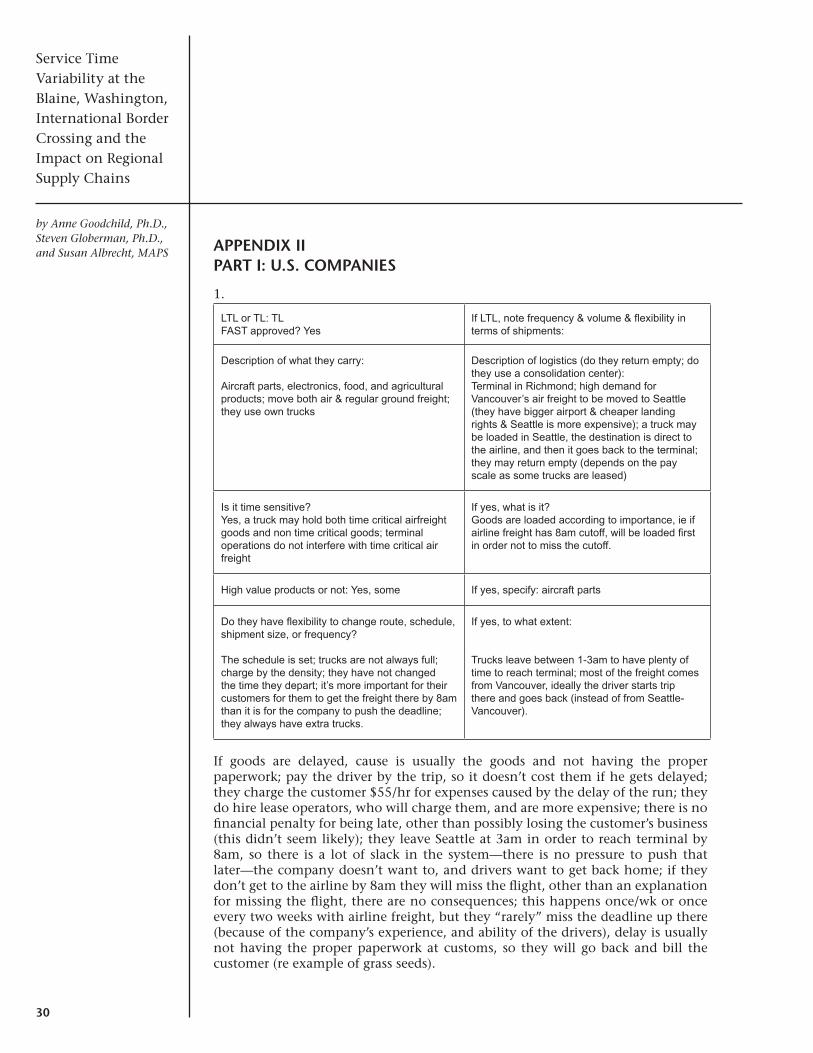
30
Service Time Variability at the Blaine, Washington, International Border Crossing and the Impact on Regional Supply Chains
by Anne Goodchild, Ph.D., Steven Globerman, Ph.D., and Susan Albrecht, MAPS APPendIx II
PARt I: u.s. coMPAnIes
1.
LTL or TL: TLFAST approved? Yes
If LTL, note frequency & volume & flexibility in terms of shipments:
Description of what they carry:
Aircraft parts, electronics, food, and agricultural products; move both air & regular ground freight; they use own trucks
Description of logistics (do they return empty; do they use a consolidation center):Terminal in Richmond; high demand for Vancouver’s air freight to be moved to Seattle (they have bigger airport & cheaper landing rights & Seattle is more expensive); a truck may be loaded in Seattle, the destination is direct to the airline, and then it goes back to the terminal; they may return empty (depends on the pay scale as some trucks are leased)
Is it time sensitive? Yes, a truck may hold both time critical airfreight goods and non time critical goods; terminal operations do not interfere with time critical air freight
If yes, what is it? Goods are loaded according to importance, ie if airline freight has 8am cutoff, will be loaded first in order not to miss the cutoff.
High value products or not: Yes, some If yes, specify: aircraft parts
Do they have flexibility to change route, schedule, shipment size, or frequency?
The schedule is set; trucks are not always full; charge by the density; they have not changed the time they depart; it’s more important for their customers for them to get the freight there by 8am than it is for the company to push the deadline; they always have extra trucks.
If yes, to what extent:
Trucks leave between 1-3am to have plenty of time to reach terminal; most of the freight comes from Vancouver, ideally the driver starts trip there and goes back (instead of from Seattle-Vancouver).
If goods are delayed, cause is usually the goods and not having the proper paperwork; pay the driver by the trip, so it doesn’t cost them if he gets delayed; they charge the customer $55/hr for expenses caused by the delay of the run; they do hire lease operators, who will charge them, and are more expensive; there is no financial penalty for being late, other than possibly losing the customer’s business (this didn’t seem likely); they leave Seattle at 3am in order to reach terminal by 8am, so there is a lot of slack in the system—there is no pressure to push that later—the company doesn’t want to, and drivers want to get back home; if they don’t get to the airline by 8am they will miss the flight, other than an explanation for missing the flight, there are no consequences; this happens once/wk or once every two weeks with airline freight, but they “rarely” miss the deadline up there (because of the company’s experience, and ability of the drivers), delay is usually not having the proper paperwork at customs, so they will go back and bill the customer (re example of grass seeds).
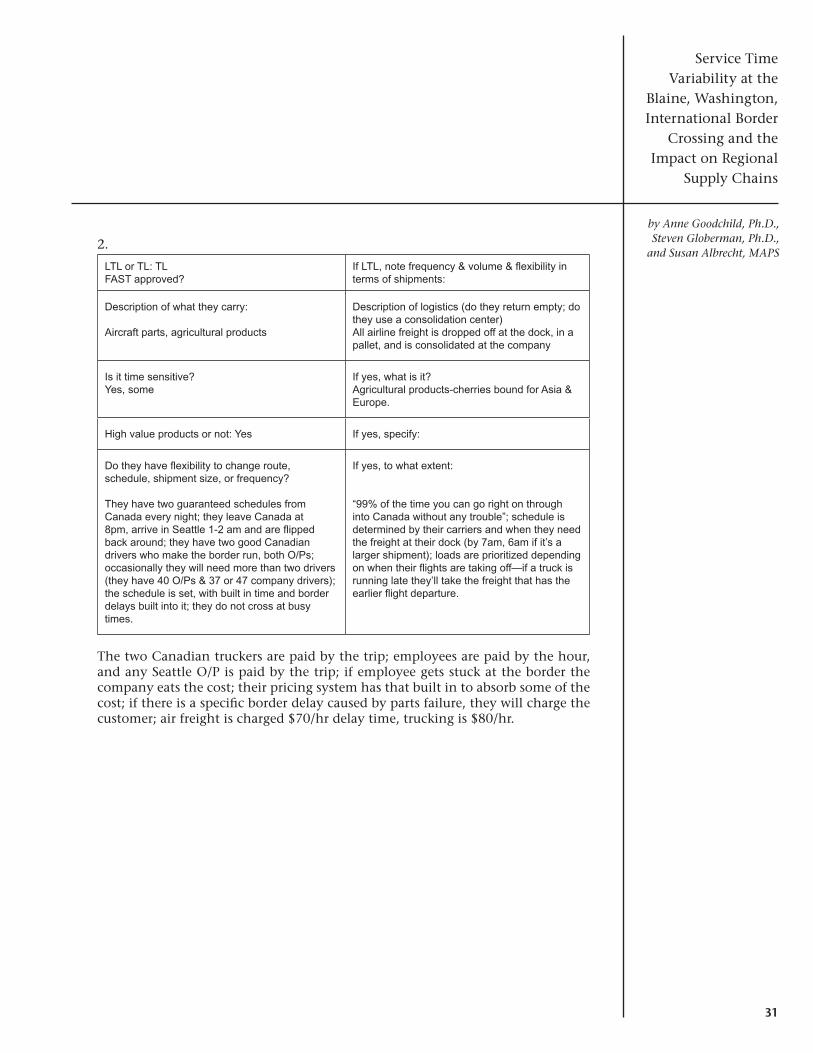
31
by Anne Goodchild, Ph.D., Steven Globerman, Ph.D.,
and Susan Albrecht, MAPS
Service Time Variability at the
Blaine, Washington, International Border
Crossing and the Impact on Regional
Supply Chains
2.
LTL or TL: TLFAST approved?
If LTL, note frequency & volume & flexibility in terms of shipments:
Description of what they carry:
Aircraft parts, agricultural products
Description of logistics (do they return empty; do they use a consolidation center)All airline freight is dropped off at the dock, in a pallet, and is consolidated at the company
Is it time sensitive? Yes, some
If yes, what is it? Agricultural products-cherries bound for Asia & Europe.
High value products or not: Yes If yes, specify:
Do they have flexibility to change route, schedule, shipment size, or frequency?
They have two guaranteed schedules from Canada every night; they leave Canada at 8pm, arrive in Seattle 1-2 am and are flipped back around; they have two good Canadian drivers who make the border run, both O/Ps; occasionally they will need more than two drivers (they have 40 O/Ps & 37 or 47 company drivers); the schedule is set, with built in time and border delays built into it; they do not cross at busy times.
If yes, to what extent:
“99% of the time you can go right on through into Canada without any trouble”; schedule is determined by their carriers and when they need the freight at their dock (by 7am, 6am if it’s a larger shipment); loads are prioritized depending on when their flights are taking off—if a truck is running late they’ll take the freight that has the earlier flight departure.
The two Canadian truckers are paid by the trip; employees are paid by the hour, and any Seattle O/P is paid by the trip; if employee gets stuck at the border the company eats the cost; their pricing system has that built in to absorb some of the cost; if there is a specific border delay caused by parts failure, they will charge the customer; air freight is charged $70/hr delay time, trucking is $80/hr.
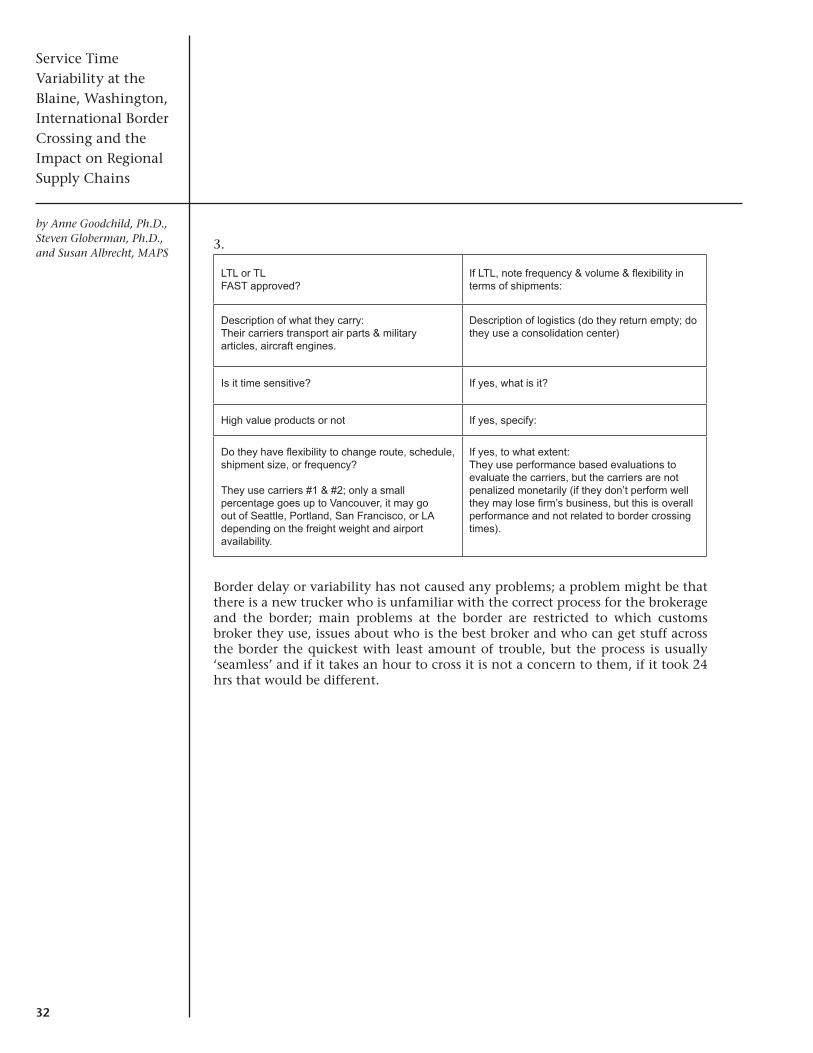
32
Service Time Variability at the Blaine, Washington, International Border Crossing and the Impact on Regional Supply Chains
by Anne Goodchild, Ph.D., Steven Globerman, Ph.D., and Susan Albrecht, MAPS
3.
LTL or TLFAST approved?
If LTL, note frequency & volume & flexibility in terms of shipments:
Description of what they carry:Their carriers transport air parts & military articles, aircraft engines.
Description of logistics (do they return empty; do they use a consolidation center)
Is it time sensitive? If yes, what is it?
High value products or not If yes, specify:
Do they have flexibility to change route, schedule, shipment size, or frequency?
They use carriers #1 & #2; only a small percentage goes up to Vancouver, it may go out of Seattle, Portland, San Francisco, or LA depending on the freight weight and airport availability.
If yes, to what extent:They use performance based evaluations to evaluate the carriers, but the carriers are not penalized monetarily (if they don’t perform well they may lose firm’s business, but this is overall performance and not related to border crossing times).
Border delay or variability has not caused any problems; a problem might be that there is a new trucker who is unfamiliar with the correct process for the brokerage and the border; main problems at the border are restricted to which customs broker they use, issues about who is the best broker and who can get stuff across the border the quickest with least amount of trouble, but the process is usually ‘seamless’ and if it takes an hour to cross it is not a concern to them, if it took 24 hrs that would be different.
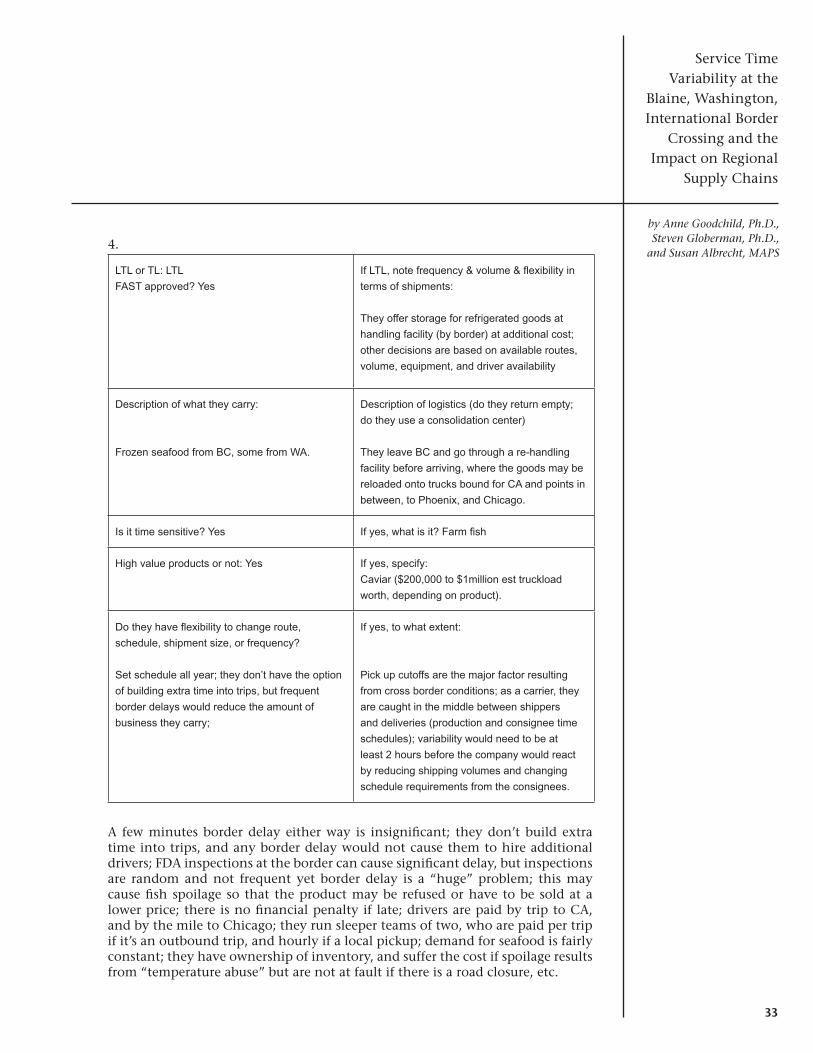
33
by Anne Goodchild, Ph.D., Steven Globerman, Ph.D.,
and Susan Albrecht, MAPS
Service Time Variability at the
Blaine, Washington, International Border
Crossing and the Impact on Regional
Supply Chains
4.
LTL or TL: LTL
FAST approved? Yes
If LTL, note frequency & volume & flexibility in
terms of shipments:
They offer storage for refrigerated goods at
handling facility (by border) at additional cost;
other decisions are based on available routes,
volume, equipment, and driver availability
Description of what they carry:
Frozen seafood from BC, some from WA.
Description of logistics (do they return empty;
do they use a consolidation center)
They leave BC and go through a re-handling
facility before arriving, where the goods may be
reloaded onto trucks bound for CA and points in
between, to Phoenix, and Chicago.
Is it time sensitive? Yes If yes, what is it? Farm fish
High value products or not: Yes If yes, specify:
Caviar ($200,000 to $1million est truckload
worth, depending on product).
Do they have flexibility to change route,
schedule, shipment size, or frequency?
Set schedule all year; they don’t have the option
of building extra time into trips, but frequent
border delays would reduce the amount of
business they carry;
If yes, to what extent:
Pick up cutoffs are the major factor resulting
from cross border conditions; as a carrier, they
are caught in the middle between shippers
and deliveries (production and consignee time
schedules); variability would need to be at
least 2 hours before the company would react
by reducing shipping volumes and changing
schedule requirements from the consignees.
A few minutes border delay either way is insignificant; they don’t build extra time into trips, and any border delay would not cause them to hire additional drivers; FDA inspections at the border can cause significant delay, but inspections are random and not frequent yet border delay is a “huge” problem; this may cause fish spoilage so that the product may be refused or have to be sold at a lower price; there is no financial penalty if late; drivers are paid by trip to CA, and by the mile to Chicago; they run sleeper teams of two, who are paid per trip if it’s an outbound trip, and hourly if a local pickup; demand for seafood is fairly constant; they have ownership of inventory, and suffer the cost if spoilage results from “temperature abuse” but are not at fault if there is a road closure, etc.

34
Service Time Variability at the Blaine, Washington, International Border Crossing and the Impact on Regional Supply Chains
by Anne Goodchild, Ph.D., Steven Globerman, Ph.D., and Susan Albrecht, MAPS
5.
LTL or TL: TLFAST approved?
If LTL, note frequency & volume & flexibility in terms of shipments:
Description of what they carry:
Lumber from Canada
Description of logistics (do they return empty; do they use a consolidation center)Customer brings lumber across border via truck or rail (mostly by truck); they ship out by truck (20%) and rail (80%).
Is it time sensitive? No If yes, what is it?
High value products or not: Yes
If yes, specify: Carry own insurance in case of fire
Do they have flexibility to change route, schedule, shipment size, or frequency?
They must order specific # of RR cars, and are charged for all cars even if they do not fill them; must coordinate with RR every day; they are on a tight schedule
If yes, to what extent:
A truck is booked once they receive an order with specific amount of wood for a RR car.
As a lumber re-load, they depend on the RR to ship product; the resolution of the softwood lumber dispute has resulted in it being more expensive for their customers to send across the border now (it used to be cheaper to bring across by truck over the border and put on the rails); in the current slowdown, they survive by looking for business elsewhere and possibly diversifying and not relying only on lumber; they used to do 20 rail cars/day, now approx 250/month; they provide free storage for 30 days then they charge for storage, what they charge for this storage varies by customer and if the customer has an on going rail plan or not; they may hold an inventory for select customers, who can also bring in product without actually having to place an order; customers are charged a freight rate (includes cost of facilities and overhead); border travel time affects trucks only and the timing of the wood coming in; if a truck gets stuck at the border, they have to wait and incur a cost in waiting; there is no reload competition on the US side, more competition on the Canadian side—perhaps because of more RR options.
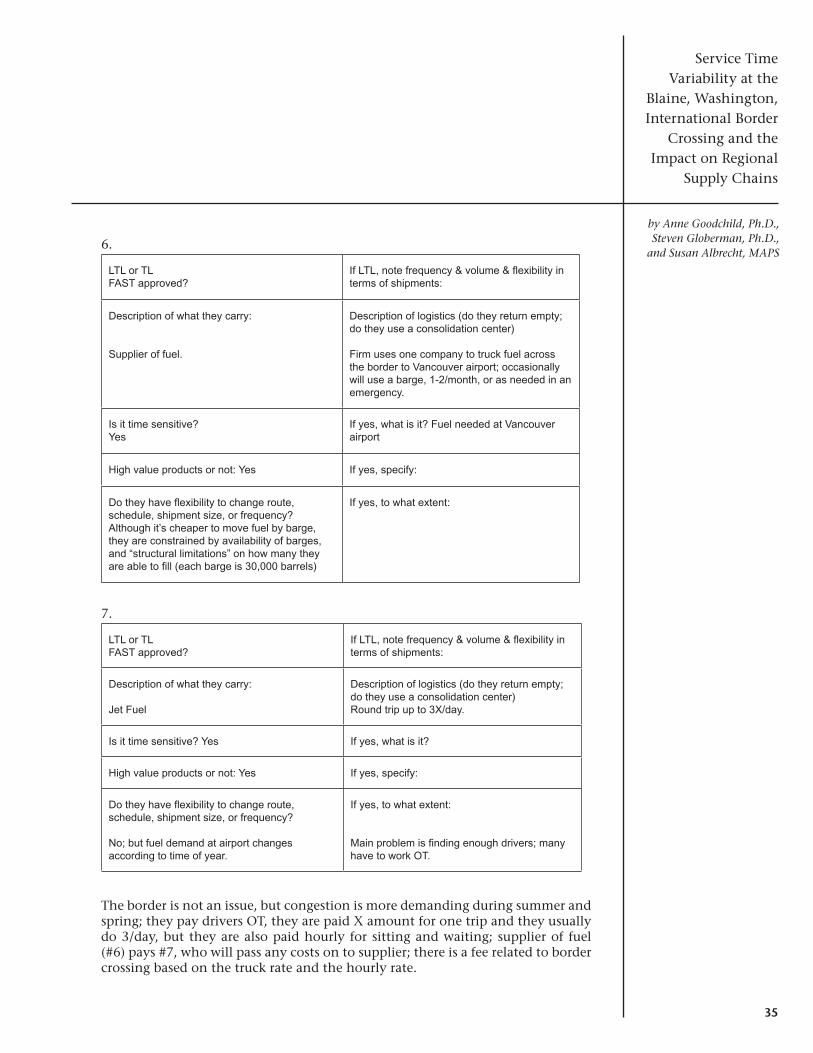
35
by Anne Goodchild, Ph.D., Steven Globerman, Ph.D.,
and Susan Albrecht, MAPS
Service Time Variability at the
Blaine, Washington, International Border
Crossing and the Impact on Regional
Supply Chains
6.
LTL or TLFAST approved?
If LTL, note frequency & volume & flexibility in terms of shipments:
Description of what they carry:
Supplier of fuel.
Description of logistics (do they return empty; do they use a consolidation center)
Firm uses one company to truck fuel across the border to Vancouver airport; occasionally will use a barge, 1-2/month, or as needed in an emergency.
Is it time sensitive? Yes
If yes, what is it? Fuel needed at Vancouver airport
High value products or not: Yes If yes, specify:
Do they have flexibility to change route, schedule, shipment size, or frequency?Although it’s cheaper to move fuel by barge, they are constrained by availability of barges, and “structural limitations” on how many they are able to fill (each barge is 30,000 barrels)
If yes, to what extent:
7.
LTL or TLFAST approved?
If LTL, note frequency & volume & flexibility in terms of shipments:
Description of what they carry:
Jet Fuel
Description of logistics (do they return empty; do they use a consolidation center)Round trip up to 3X/day.
Is it time sensitive? Yes If yes, what is it?
High value products or not: Yes If yes, specify:
Do they have flexibility to change route, schedule, shipment size, or frequency?
No; but fuel demand at airport changes according to time of year.
If yes, to what extent:
Main problem is finding enough drivers; many have to work OT.
The border is not an issue, but congestion is more demanding during summer and spring; they pay drivers OT, they are paid X amount for one trip and they usually do 3/day, but they are also paid hourly for sitting and waiting; supplier of fuel (#6) pays #7, who will pass any costs on to supplier; there is a fee related to border crossing based on the truck rate and the hourly rate.

36
Service Time Variability at the Blaine, Washington, International Border Crossing and the Impact on Regional Supply Chains
by Anne Goodchild, Ph.D., Steven Globerman, Ph.D., and Susan Albrecht, MAPS
8.
LTL or TLFAST approved? Yes
If LTL, note frequency & volume & flexibility in terms of shipments:
Description of what they carry: Description of logistics (do they return empty; do they use a consolidation center)
Dealer network & distribution centers in US & Canada; plant locations in Mexico and US.
Is it time sensitive? It depends on what the part is.
If yes, what is it?
High value products or not: Yes, some.
If yes, specify: Truck parts
Do they have flexibility to change route, schedule, shipment size, or frequency?
Yes, they have NASA like computerized inventory & tracking system.
If yes, to what extent:
They have an extremely high degree of flexibility and ability to respond quickly.
Manufacture trucks; have plants (specific to products) and distribution network; their strategy is to respond quickly if a dealer needs a part; they carry less inventory at the dealers now but because they can respond so quickly to replace a part it is not a problem; border delays are not a problem, biggest problem is with congestion; problems at the border concern ‘sub-assembly’ of parts (originate with many parts to make one piece means invoice may list a different number of parts); Canadians do better at consistency regarding border issues and crossing.

37
by Anne Goodchild, Ph.D., Steven Globerman, Ph.D.,
and Susan Albrecht, MAPS
Service Time Variability at the
Blaine, Washington, International Border
Crossing and the Impact on Regional
Supply Chains
9.
LTL or TL: TLFAST approved? No
If LTL, note frequency & volume & flexibility in terms of shipments:
Description of what they carry:
Produce, house packages, telephone poles, refrigerated storage units.
Description of logistics (do they return empty; do they use a consolidation center)
Empty if returning from Canada; they may load at company and go south; they don’t have a warehouse
Is it time sensitive? No; If produce, Yes,
If yes, what is it?
High value products or not: No If yes, specify:
Do they have flexibility to change route, schedule, shipment size, or frequency?
If yes, to what extent:
They have a lot of flexibility regarding border-crossing time; they charge by the hour (especially for Canadians), but also do contracted work, majority by the hour but by the mile if they are O/P.

38
Service Time Variability at the Blaine, Washington, International Border Crossing and the Impact on Regional Supply Chains
by Anne Goodchild, Ph.D., Steven Globerman, Ph.D., and Susan Albrecht, MAPS
10.
LTL or TL: BothFAST approved? Yes
If LTL, note frequency & volume & flexibility in terms of shipments:
Description of what they carry:
Machinery, presses, pipes, steel
Description of logistics (do they return empty; do they use a consolidation center)
Is it time sensitive? Sometimes If yes, what is it?
High value products or not If yes, specify:
Do they have flexibility to change route, schedule, shipment size, or frequency?
Yes, firm will give a general idea of arrival, especially for LTL; but may be very precise especially if need to cross to Victoria (ferry crossing times).
If yes, to what extent:
Check the internet web cameras at the border in the morning so see what the lineups are like.
Pay light haul drivers by mile, pay local drivers by the hour (local is anywhere between WA, OR, ID, and B.C.); there may be financial penalties for being late; bad planning can cause a miss reload and loss of revenue, increased costs from coming back empty; border crossing times depend on day of week—Mondays are very heavy; everything is priced by the job; fleet of 100 trucks, O/P, fleet needs to be working at “80% to maintain profitability”; border crossings have gotten easier with FAST; schedule jobs a month in advance for long haul, and other stuff is day to day, needing a week’s notice; in general, delays are rarely caused by border delays.

39
by Anne Goodchild, Ph.D., Steven Globerman, Ph.D.,
and Susan Albrecht, MAPS
Service Time Variability at the
Blaine, Washington, International Border
Crossing and the Impact on Regional
Supply Chains
11.
LTL or TLFAST approved? Yes
If LTL, note frequency & volume & flexibility in terms of shipments:
Description of what they carry:
Pipes
Description of logistics (do they return empty; do they use a consolidation center)Manufacture in Bellingham
Is it time sensitive? No If yes, what is it?
High value products or not If yes, specify:
Do they have flexibility to change route, schedule, shipment size, or frequency?
They do little shipping across the border.
If yes, to what extent:
Border delays are rare; they have experienced delays as long as a day, but this was due to improper paperwork by the broker, and had nothing to do with border security or border congestion.
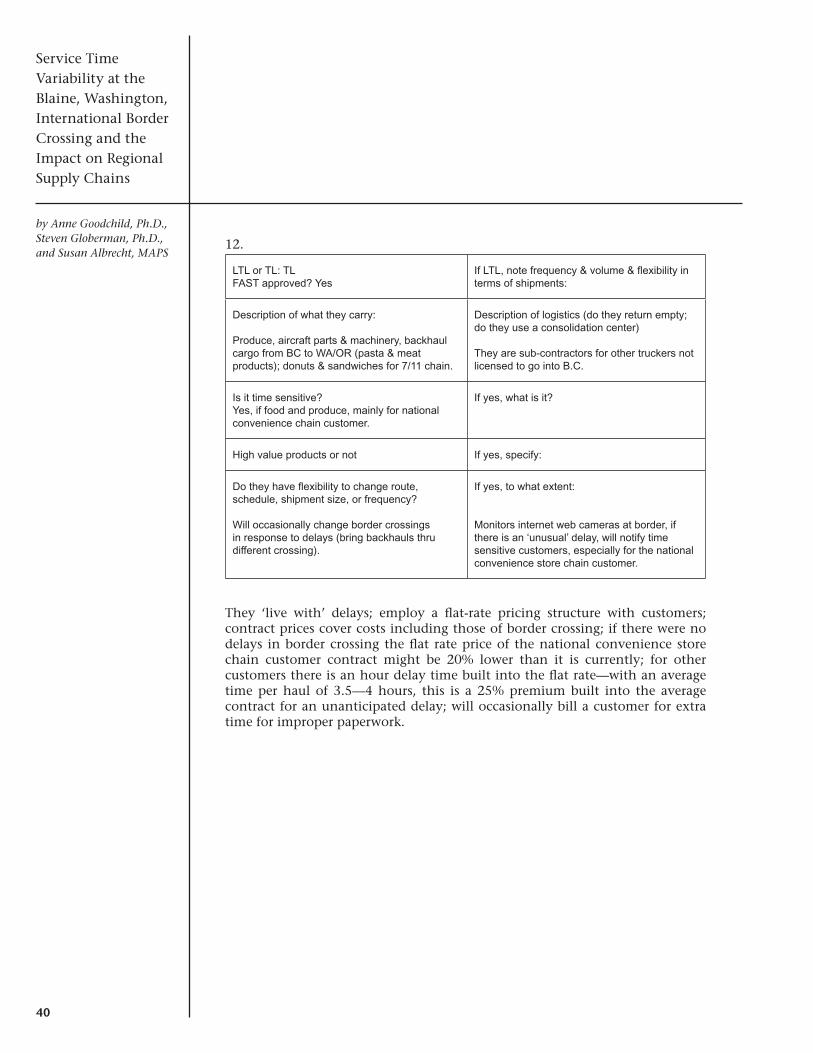
40
Service Time Variability at the Blaine, Washington, International Border Crossing and the Impact on Regional Supply Chains
by Anne Goodchild, Ph.D., Steven Globerman, Ph.D., and Susan Albrecht, MAPS
12.
LTL or TL: TLFAST approved? Yes
If LTL, note frequency & volume & flexibility in terms of shipments:
Description of what they carry:
Produce, aircraft parts & machinery, backhaul cargo from BC to WA/OR (pasta & meat products); donuts & sandwiches for 7/11 chain.
Description of logistics (do they return empty; do they use a consolidation center)
They are sub-contractors for other truckers not licensed to go into B.C.
Is it time sensitive? Yes, if food and produce, mainly for national convenience chain customer.
If yes, what is it?
High value products or not If yes, specify:
Do they have flexibility to change route, schedule, shipment size, or frequency?
Will occasionally change border crossings in response to delays (bring backhauls thru different crossing).
If yes, to what extent:
Monitors internet web cameras at border, if there is an ‘unusual’ delay, will notify time sensitive customers, especially for the national convenience store chain customer.
They ‘live with’ delays; employ a flat-rate pricing structure with customers; contract prices cover costs including those of border crossing; if there were no delays in border crossing the flat rate price of the national convenience store chain customer contract might be 20% lower than it is currently; for other customers there is an hour delay time built into the flat rate—with an average time per haul of 3.5—4 hours, this is a 25% premium built into the average contract for an unanticipated delay; will occasionally bill a customer for extra time for improper paperwork.

41
by Anne Goodchild, Ph.D., Steven Globerman, Ph.D.,
and Susan Albrecht, MAPS
Service Time Variability at the
Blaine, Washington, International Border
Crossing and the Impact on Regional
Supply Chains
13.
Company NameLTL or TLFAST approved? No (typical for package carriers)
If LTL, note frequency & volume & flexibility in terms of shipments:
Description of what they carry:
Packages.
Description of logistics (do they return empty; do they use a consolidation center)Pickups in Richmond BC for delivery to Seattle by 5 or 5:30pm.
Is it time sensitive? No. If yes, what is it?
High value products or not:Depends on package.
If yes, specify:
Do they have flexibility to change route, schedule, shipment size, or frequency?
If yes, to what extent:
Because they move ground freight, there are no guarantees of delivery times, so if goods are delayed at the border there is no penalty (except losing business in the long-term): “If people have very time critical goods they should move them via air freight.” Border is congested between 10am—9pm, and times are longer in the summer when more trucks are crossing; company had experienced longer delays after 9-11 from increased inspections.
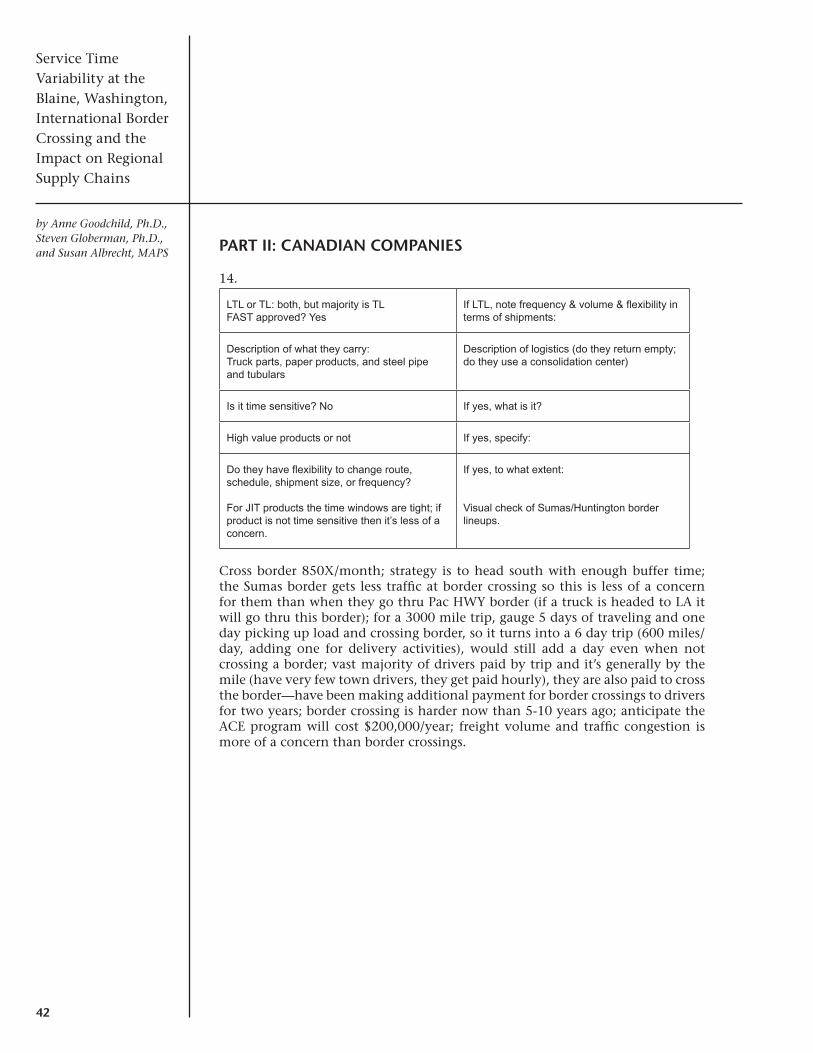
42
Service Time Variability at the Blaine, Washington, International Border Crossing and the Impact on Regional Supply Chains
by Anne Goodchild, Ph.D., Steven Globerman, Ph.D., and Susan Albrecht, MAPS PARt II: cAnAdIAn coMPAnIes
14.
LTL or TL: both, but majority is TLFAST approved? Yes
If LTL, note frequency & volume & flexibility in terms of shipments:
Description of what they carry: Truck parts, paper products, and steel pipe and tubulars
Description of logistics (do they return empty; do they use a consolidation center)
Is it time sensitive? No If yes, what is it?
High value products or not If yes, specify:
Do they have flexibility to change route, schedule, shipment size, or frequency?
For JIT products the time windows are tight; if product is not time sensitive then it’s less of a concern.
If yes, to what extent:
Visual check of Sumas/Huntington border lineups.
Cross border 850X/month; strategy is to head south with enough buffer time; the Sumas border gets less traffic at border crossing so this is less of a concern for them than when they go thru Pac HWY border (if a truck is headed to LA it will go thru this border); for a 3000 mile trip, gauge 5 days of traveling and one day picking up load and crossing border, so it turns into a 6 day trip (600 miles/day, adding one for delivery activities), would still add a day even when not crossing a border; vast majority of drivers paid by trip and it’s generally by the mile (have very few town drivers, they get paid hourly), they are also paid to cross the border—have been making additional payment for border crossings to drivers for two years; border crossing is harder now than 5-10 years ago; anticipate the ACE program will cost $200,000/year; freight volume and traffic congestion is more of a concern than border crossings.

43
by Anne Goodchild, Ph.D., Steven Globerman, Ph.D.,
and Susan Albrecht, MAPS
Service Time Variability at the
Blaine, Washington, International Border
Crossing and the Impact on Regional
Supply Chains
15.
LTL or TLFAST approved? Yes
If LTL, note frequency & volume & flexibility in terms of shipments:
Description of what they carry:
Timber, manufacturing products, chemicals, ocean containers, produce
Description of logistics (do they return empty; do they use a consolidation center)Lower Mainland to Seattle, OR, eastern WA
Is it time sensitive? No; if produce, yes If yes, what is it?
High value products or not If yes, specify:
Do they have flexibility to change route, schedule, shipment size, or frequency?
If yes, to what extent:
O/P company, 26 owner operators, 2 company trucks; flat decks are ‘cut-
throat.’
16.
LTL or TL: LTLFAST approved? Yes
If LTL, note frequency & volume & flexibility in terms of shipments:
Description of what they carry:Lumber & steel
Description of logistics (do they return empty; do they use a consolidation center)
Is it time sensitive? No If yes, what is it?
High value products or not If yes, specify:
Do they have flexibility to change route, schedule, shipment size, or frequency?
If yes, to what extent:
Use border cameras.
Rely on backhaul for extra revenue; is dispatch service for O/P; fleet is O/P; raise rate 15% for border delays; charge by hour; one hour at border; average delay is 2 hours—that’s what is put into the schedule; cost incurred to customer for delay; drivers don’t want to cross border.

44
Service Time Variability at the Blaine, Washington, International Border Crossing and the Impact on Regional Supply Chains
by Anne Goodchild, Ph.D., Steven Globerman, Ph.D., and Susan Albrecht, MAPS
17.
LTL or TL: used to be LTL but gave it up because of logistics of managing.FAST approved? Yes, but clients are NOT
If LTL, note frequency & volume & flexibility in terms of shipments:
Description of what they carry:
Containers, mainly
Description of logistics (do they return empty; do they use a consolidation center)Yes, return empty; pick up at CP & CN rail; deliver to all points in WA in 1-2 days; would cross more often at Sumas, but there are limited hours of service there (frequently go through Sumas northbound; southbound go thru Pac HWY because the customs brokers are there).
Is it time sensitive? Yes, if FDA product If yes, what is it?
High value products or not: No If yes, specify:
Do they have flexibility to change route, schedule, shipment size, or frequency? Estimate when arriving at rail yard
If yes, to what extent:
Are experiencing 100% FDA inspections; drivers are paid by trip and paid for border time, this adds cost, up to $100 additional cost, they charge for anything over two hours (unloading, loading, and border time: $58.00 CND/per hour); also accommodating for delays at the port; clients are shipping lines; move 5-10 boxes across the border; border delay has been increasing; they’ve hired an extra person to prepare for ACE; no penalties at rail yard for being late; drivers are O/P; have two company drivers; rate increases a year ago were 5%, now a 12% increase because of border delays; fuel surcharge of 20%.
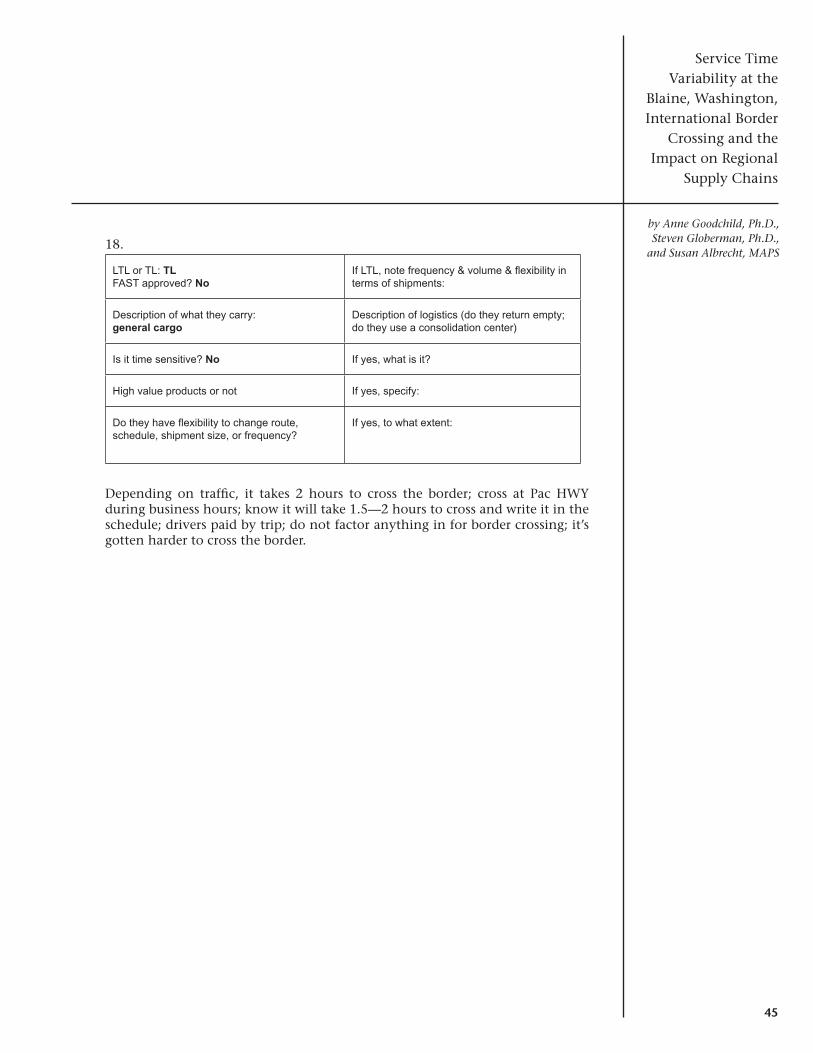
45
by Anne Goodchild, Ph.D., Steven Globerman, Ph.D.,
and Susan Albrecht, MAPS
Service Time Variability at the
Blaine, Washington, International Border
Crossing and the Impact on Regional
Supply Chains
18.
LTL or TL: TLFAST approved? No
If LTL, note frequency & volume & flexibility in terms of shipments:
Description of what they carry: general cargo
Description of logistics (do they return empty; do they use a consolidation center)
Is it time sensitive? No If yes, what is it?
High value products or not If yes, specify:
Do they have flexibility to change route, schedule, shipment size, or frequency?
If yes, to what extent:
Depending on traffic, it takes 2 hours to cross the border; cross at Pac HWY during business hours; know it will take 1.5—2 hours to cross and write it in the schedule; drivers paid by trip; do not factor anything in for border crossing; it’s gotten harder to cross the border.

46
Service Time Variability at the Blaine, Washington, International Border Crossing and the Impact on Regional Supply Chains
by Anne Goodchild, Ph.D., Steven Globerman, Ph.D., and Susan Albrecht, MAPS
19.
LTL or TLFAST approved?
If LTL, note frequency & volume & flexibility in terms of shipments:
Description of what they carry:
Wood products
Description of logistics (do they return empty; do they use a consolidation center)Don’t ship product until customer plans to buy it—a make & sell industry; may truck across or ship to a reload facility; rail cars generally return empty.
Is it time sensitive? No If yes, what is it?
High value products or not If yes, specify:
Do they have flexibility to change route, schedule, shipment size, or frequency?
While the timing is very loose; the schedules are timed.
If yes, to what extent:
Have booking times, but trucks generally come from a rural area and phone ahead when leaving a mill to the crossing, give customs number and book a certain time so that customs broker will have paperwork ready.
Border crossing times not a big issue in terms of logistics planning; most lumber companies ship product by rail, rail is looser than truck deliveries because the product will get quoted for a certain week; rail is more consistent, and cheaper too, although rail is getting more expensive.

47
by Anne Goodchild, Ph.D., Steven Globerman, Ph.D.,
and Susan Albrecht, MAPS
Service Time Variability at the
Blaine, Washington, International Border
Crossing and the Impact on Regional
Supply Chains
20.
LTL or TL: TLFAST approved? Yes
If LTL, note frequency & volume & flexibility in terms of shipments:
Description of what they carry:
Food products, lumber, paper products, machinery & ammunition.
Description of logistics (do they return empty; do they use a consolidation center)“Irregular route carrier” will haul freight on a one time basis
Is it time sensitive? Perhaps 10% If yes, what is it?
High value products or not If yes, specify:
Do they have flexibility to change route, schedule, shipment size, or frequency?They cross during off hours, may cross at Sumas rather than Aldergrove, even though Aldergrove is closer to main terminal.
If yes, to what extent:
Bill on a flat rate basis, also bill on per mile basis, also bill by hour; unanticipated delays are passed on to the customer in form of added hourly rates; operates on tight profit margins; difficult to find drivers who are FAST approved.
48
Service Time Variability at the Blaine, Washington, International Border Crossing and the Impact on Regional Supply Chains
by Anne Goodchild, Ph.D., Steven Globerman, Ph.D., and Susan Albrecht, MAPS ReFeRences
1. 2005 IMTC Resource Manual, International Mobility and Trade Corridor Project, 2005, Whatcom Council of Governments.
2. Murray, D., 2003. Director of Research for the American Transportation Research Institute, Personal Comments.
3. The Freight Story: A National Perspective on Enhancing Freight Transportation, November 2002. Federal Highway Administration Research Report.
4. Sheffi, Y., 2005. “The Resilient Enterprise: Overcoming Vulnerability for Competitive Advantage”, MIT Press, Cambridge MA.
5. Nee, J., J. Ishimaru, and M. Hallenbeck, 2002. “HOV Lane Performance Monitoring,” Washington State Transportation Center Research Report.
6. Chao, C., A. Skabardonis, P. Varaiya, 2003. “Travel Time Reliability as a Measure of Service,” Transportation Research Record 1855, p. 74-79.
7. Bates, John, John Polak, Peter Jones, and Andrew Cook, 2001. “The Valuation of Reliability for Personal Travel,” Transportation Research Part E, 37, pp. 191-229).
8. Belzer, Michael H, 2003. The Jobs Tunnel: The Economic Impact of Adequate Border-crossing Infrastructure. The Jobs Tunnel, Detroit River Tunnel Partnership.
9. Bonsor, Norman. 2004. “Fixing the Potholes in North American Transportation Systems.” Choices, Vol. 10, no. 8. Institute for Research on Public Policy, Montreal, Canada.
10. Brownstone, David, and K.A. Small, 2005. “Valuing Time and Reliability: Assessing the Evidence from Road Pricing Demonstrations.” Transportation Research Part A-Policy and Practice 39 (4), pp. 279-293. eScholarship Repository, University of California. http://repositories.cdlib.org/postprints/699
11. Chan, Felix T.S., and H.J Qi, 2003. “An Innovative Performance Measurement Method for Supply Chain Management.” Supply Chain Management, 8, 3/4, pp. 209-223.
12. Department of Homeland Security, Bureau of Customs and Border Protection, 2003. Regulatory Impact Analysis Advanced Electronic Filing System, November 13, 2003.
13. Farris, M. Theodore II, and Paul D. Hutchison, 2002. “Cash-to-cash: The New Supply Chain Management Metric.” International Journal of Physical Distribution & Logistics Management, 32, 3/4, pp. 288-298.
14. Globerman, Steve, and Paul Storer. Forthcoming, 2007. The Impacts of 9/11 on Canada-U.S. Trade. University of Toronto Press, Toronto, Canada.
15. Jones, Crystal, Daniel Murray and Jeffrey Short, 2005. Methods of Travel Time

49
by Anne Goodchild, Ph.D., Steven Globerman, Ph.D.,
and Susan Albrecht, MAPS
Service Time Variability at the
Blaine, Washington, International Border
Crossing and the Impact on Regional
Supply Chains
Measurement in Freight-Significant Corridors. American Transportation Research Institute, Alexandria, VA.
16. KPMG, 2002. Report on the Survey of Canadian Commercial Carriers on Border Crossing Issues.
17. Mackie, P.J., S. Jara-Diaz, and A.S. Fowkes, 2001. “The Value of Travel Time Savings in Evaluation,” Transportation Research Part E, 37, pp. 91-106.
18. Mackie, P.J., A.S. Fowkes, M. Wardman, G. Whelan and J. Nellthorp, 2003. “Value of Travel Time Savings in the UK - Summary Report.” Institute for Transport Studies, University of Leeds, United Kingdom.
19. McCormack, Edward, and Mark E. Hallenbeck, 2005. Options for Benchmarking Performance Improvements Achieved from Construction of Freight Mobility Projects. Report WA-RD 607.1. Washington State Transportation Center, University of Washington, Seattle, WA.
20. Ontario Chamber of Commerce (OCC), OCC Borders and Trade Development Committee, 2004. Cost of Border Delays to Ontario.
21. Ontario Chamber of Commerce (OCC), OCC Borders and Trade Development Committee 2005. Cost of Border Delays to the United States Economy.
22. Schrank, David, and Tim Lomax, 2005. The 2005 Urban Mobility Report. Texas Transportation Institute, Texas A&M University. http://mobility.tamu.edu
23. Small, Kenneth A., Robert Noland, Xeuhao Chu, and David Lewis, 1999. Valuation of Travel-time Savings and Predictability in Congested Conditions for Highway User-cost Estimation. National Cooperative Highway Research Program Report 431, National Academy Press, Washington, DC.
24. Stank, Theodore P., and Michael R. Crum, 1997. “Just-in-time Management and Transportation Service Performance in a Cross-border Setting.” Transportation Journal. 36, 3, pp. 31-42.
25. Tayor, John C., and Douglas Robideaux, 2003. The US-Canada Border: Cost Impacts, Causes and Short to Long-term Management Positions. Michigan Department of Transportation, US Department of Transportation and New York State Department of Transportation.
26. TRAC-University of Washington (Washington State Transportation Research Center), 2003 (update 2005). Central Puget Sound Freeway Usage and Performance Report. Seattle, WA.
27. TRAC-University of Washington (Washington State Transportation Research Center), 2004 HOV Lane Performance Monitoring: 2002 Report. Seattle, WA.
28. TRAC-University of Washington (Washington State Transportation Research Center), 2005. Options for Benchmarking Performance Improvements Achieved from Construction of Freight Mobility Projects. Seattle, WA.
50
Service Time Variability at the Blaine, Washington, International Border Crossing and the Impact on Regional Supply Chains
by Anne Goodchild, Ph.D., Steven Globerman, Ph.D., and Susan Albrecht, MAPS
29. Transport Canada, 2005. The Cumulative Impact of U.S. Impact Compliance Programs at the Canada/U.S. Land Border on the Canadian Trucking Industry. DAMF Consultants Inc, and L-P Tardif & Associates Inc.
30. U.S. Department of Transportation (USDOT), Federal Highway Administration (FHWA) 2002a. Evaluation of Travel Time Methods to Support Mobility Performance Monitoring: International Border Crossing Truck Travel Time for 2001. Texas Transportation Institute and Battelle Memorial Institute.
31. U.S. Department of Transportation (USDOT), Federal Highway Administration (FHWA) 2002b. Evaluation of Travel Time Methods to Support Mobility Performance Monitoring: Border Crossing Freight Delay Data Collection and Analysis 2001 Data Collection-Pacific Highway (Blaine Border) Crossing. Battelle Memorial Institute.
32. U.S. Department of Transportation (USDOT), Federal Highway Administration (FHWA) 2002c. Creating a Freight Sector within HERS. HLB Decision Economics.
33. Wigan, Marcus, Nigel Rockliffe, Thorolf Thorensen, and Dimitris Tsolakis, 2000. Valuing Long-haul and Metropolitan Freight Travel Time and Teliability. Bureau of Transportation Statistics.
34. Zhang, Anming, Anthony E. Boardman, David Gillen, and W.G. Waters II, 2004. Towards Estimating the Social and Environmental Costs of Transportation in Canada. Transport Canada.
35. Halcrow Consulting, 2006. Whatcom Council of Governments Pacific Crossing Commercial Vehicle Border Delay Survey Final Report.
36. FAST program website: http://www.cbp.gov/xp/cgov/import/commercial_enforcement/ctpat/fast/


Research Report No. 3June 2007
Border Policy Research InstituteWestern Washington UniversityBellingham, Washingtonwww.ac.wwu.edu/~bpri/