service operations strategy, flexibility and performance ...hera.ugr.es/doi/15059406.pdf · service...
TRANSCRIPT

Service operations strategymacrexibility and performance inengineering consulting regrms
Daniel Arias ArandaDepartamento de OrganizacioAcircn de Empresas
Universidad de Granada Granada Spain
Keywords Service operations Flexibility Industrial performance Spain
Abstract In this paper the relationship between operations strategy and performance throughmacrexibility as a moderating variable is analysed within the service setting of engineering consultingregrms in Spain A framework for service strategy dimensions is suggested while manufacturingmacrexibility dimensions are applied to service operations considering necessary adaptations A pathanalysis model is applied in order to enhance the understanding of interactions This researchproves that service operations strategy has a signiregcant positive and direct effect on service deliveryperformance The fact that is especially relevant is that macrexibility plays a more intense moderatingrole for efregciency performance measures than for customer satisfaction performance measures
IntroductionOperations strategy has been contemplated in the regeld from a conceptual pointof view and has dealt mainly with the content of strategy (Anderson et al 1989Skinner 1978 Smith and Reece 1999) All this research has conreggured theoperations strategy concept as a pattern of decisions and actions driven tosupport the strategic goals established by the business unit Operations shouldregt the requirements of a business by striving for consistency between businesscapabilities and policies and business competitive advantages (Adam andSwamidass 1989 Wheelwright 1984) However the scarcity of studies thatanalyse the effect of strategy on performance through its relationship withcompetitive priorities has become one of the great challenges in operationsmanagement research (Dangayash and Deshmukh 2001 Saregzadeh et al 2000)Moreover in service operations strategy this panorama is still more meagrewhich leads to higher research opportunities (Nieto et al 1999)
Nowadays the changing environments make macrexibility one of thecompetitive priorities that most service regrms have to deal with The conceptof macrexibility of service processes suffers from the same confusion thatoverwhelmed manufacturing for years (Harvey et al 1997) The nature andsources of manufacturing macrexibility have been broadly studied so comparisonbetween manufacturing and services provides a good starting-point for thestudy of service macrexibility Flexibility is generally regarded as the ability to
The Emerald Research Register for this journal is available at The current issue and full text archive of this journal is available at
httpwwwemeraldinsightcomresearchregister httpwwwemeraldinsightcom0144-3577htm
The author wishes to thank anonymous reviewers whose suggestions have been of inestimablehelp for improving the present paper
Serviceoperations
strategy
1401
International Journal of Operations ampProduction Management
Vol 23 No 11 2003pp 1401-1421
q MCB UP Limited0144-3577
DOI 10110801443570310501907
respond or conform to new situations being usually classireged as processproduct or infrastructure related (Noori and Radford 1995) Although theimportance of macrexibility has been broadly acknowledged efforts to bring theexisting theoretical research and practices together have not reached asubstantial progress in order to evaluate both manufacturing and servicemacrexibility (Suarez et al 1996) In particular the relationship betweenoperations strategy and manufacturing macrexibility has not received adequateattention at the time of making investment decisions in manufacturingtechnology (Adler 1988 Arias-Aranda et al 2001) Moreover adequaterecognition has been especially scarce in the implementation phase (Jaikumar1986)
The relationship between operations strategy and macrexibility has beenunderstood in operations management (OM) literature in terms ofenvironmental variability (Riley and Lockwood 1997) The operationsstrategy intends to react to the changes that affect competition due to newindustrial and social trends The structural and infrastructural decisions thatconreggure the operations strategy in services directly inmacruence the macrexibilitylevel of the delivery system (Bucki and Pesqueux 2000) When the levels ofmacrexibility in every dimension of the service delivery system support theimplemented operation strategy it directly affects operational performance(Spina et al 1996) When analysing this relationship traditional costperformance measures lack relevance in the service environment as they donot remacrect the customer-focus factors of quality macrexibility or satisfactionwhich have become crucial to regrm success (Neely et al 1997) Performancemeasures which capture and remacrect service operations strategies are requiredto examine whether non-cost-based measures cover the range of serviceoperations practices (Ghalayini and Noble 1996)
According to these bases the purpose of this paper is multiple and twofold
(1) to apply a manufacturing macrexibility framework to service operationsconsidering necessary adaptations to service industriesrsquo nature and
(2) to enhance the understanding of interactions between service operationsstrategy and long and short-term performance measures by applying apath analysis model to the different dimensions deregning both constructsin order to investigate the relationships between them
The empirical veriregcation of this research will be developed within the servicesetting of engineering consulting regrms in Spain
Service operations strategyIssues regarding operations strategy content and process are often discussed inthe current operations literature The process of operations strategy is termedaccording to how strategic decisions are made in an organizational setting (Ho1996) Deregnitions of strategy always mention enhancement of the regrmrsquos
IJOPM2311
1402
competitive position in the marketplace through resources building orpositioning (Swink and Way 1995) Most research focused primarily on thenumber of decision areas and goals of manufacturing in terms of performancecriteria (Leong et al 1990) Skinner (1969) identireged a set of decision areasthrough which manufacturing objectives are achieved Later research proves agenerally high agreement even though many authors have developed differentsets of manufacturing decision areas (Mills et al 1998)
However traditionally OM literature has addressed service operationsstrategy to the development of the service delivery system in order to match thecustomer expectations with customer perceptions (Armistead 1992) Modelsand frameworks have been suggested to explain this process through differentservices classiregcations and schemes (Johnston 1994 Nayyar 1992 Normann1984 Sampson 1996 Schmenner 1986) However only a few studies analysethe differentiation and interaction between the different dimensionsconregguring the service operations strategy In this context Arias-Aranda(2002) proposed a model based on the three basic operations strategiesidentireged in service literature according to the regrmrsquos focus of activities Thesebasic operations strategies pursued by service industries are process service orcustomer-oriented operations strategies (Berry and Parasuraman 1997 Bowenand Youngdahl 1998 Collier 1994 1996 Desatnik 1994 Hart 1995 Haynesand Du Vall 1992 Johnston 1994 Lusch et al 1996 McCutcheon et al 1994Sampson 1996 Tersine and Harvey 1998) Arias-Aranda (2002) identireged ninestructural and infrastructural decisions that lead to a determined serviceoperations strategy These are type of operations layout PUSHPULLorientation of the service delivery process degree of process standardisationnumber of different services offered use of information technologies (costreduction vs service improvement) back and front ofregce activities relationshiphuman resources specialisation degree of customer participation and newservice design and development
Service macrexibilityFlexibility as a competitive goal still lacks a clear and accurate deregnition Inservice regrms macrexibility is a fuzzy concept as not all service macrexibilitydimensions have been clearly determined However macrexibility is generallyaccepted as a useful tool to improve the competitive position of the regrmespecially when related to the process of decision-making in technologiesadoption and implementation (Adler 1988 AAcirc lvarez Gil 1994 Jaikumar 1986)Slack (1987) analysed a sample of ten manufacturing regrms concluding thatmanagersrsquo vision of the macrexibility concept is only partial and incompleteManagers usually focus more on machines macrexibility than on the overallsystem macrexibility Flexibility when focused only on technology implementationdoes not lead to a competitive advantage (Gupta and Somers 1996) It is crucialto carefully plan and manage the whole system macrexibility (Gustavsson 1988)
Serviceoperations
strategy
1403
by creating a plant infrastructure that allows such system macrexibility (Upton1995)
The above multidimensional view of macrexibility assumes that one of the keychallenges to achieving a macrexible operations system emerges when focusingand managing the different dimensions of macrexibility (Gerwin 1993) This ismainly due to the fact that macrexibility is not accumulative so more macrexibility indifferent parts of the system does not imply a more macrexible operations systemChanges in macrexibility are of strategic nature so they should not only involveprocess engineers but also production and even business managers (Chambers1992) Operations strategy determines the level of uncertainty to be supportedby the service delivery system by adapting the different macrexibility dimensionsto environmental changes (Chambers 1992 Gerwin 1993)
In this context macrexibility in services involves the introduction of newdesigns and services into the service delivery system quickly adjust capacityrapidly customize services handle changes in the service mix quickly andhandle variations in customer delivery schedules (Suarez et al 1996) Thusimproving the timing and quantity of resource allocations for performing aprocess to avoid employing human and material resources when they are notneeded represents the core goal of service macrexibility (Duclos et al 1995)
Under these assumptions OM literature has focused on identifying differentdimensions and types of macrexibility (Brill and Mandelbaum 1989 Browne et al1984 Carter 1986 Chatterjee et al 1984 Gerwin 1987 Gupta and Goyal 1992Gupta and Somers 1992 Hyun and Ahn 1990 Son and Park 1987) Howeverthere is still no clear consensus about which are the exact costs and beneregts ofmacrexibility implementation according to every dimension In many casesmacrexibility beneregts have been considered only in terms of machineprogramming and production models integration (Taymaz 1989) In someother cases these beneregts are reduced to workforce versatility (Walton andSusman 1987) Moreover some authors maintain that macrexibility is alwaysbeneregcial while some others afregrm that it can even be harmful in some cases(Cusumano 1988 Gaimon and Singhal 1992 Tombak 1988) Such discussionreinforces the role of the multidimensional character of macrexibility
In service industries customer interaction and customization imply a highdegree of macrexibility according to the speciregcity of services such as for instancethe main input macrow is information while material handling plays a lessimportant role (Adler 1988) Nowadays customers are more demanding forintegral services provided by the same regrm (Vandermerwe 1992) This factwill entail a new and different conception of service macrexibility In additionprocess equipments in service industries are mainly based on informationtechnologies (Gouillart and Sturdivant 1994) Personnel macrexibility andversatility must be directly considered as they perform a higher degree ofthe service delivery compared to machines in manufacturing industries(Harvey et al 1997) Interconnection and interdependence between information
IJOPM2311
1404
technology and personnel macrexibility allow us to consider both as a whole (Hyunand Ahn 1990)
However electronic data interchange (EDI) and information technologies(ITs) provide new market opportunities for service regrms without highmacrexibility investment efforts According to this idea Harvey et al (1997)suggested a model of macrexibility in services in which technology controlsvariability reduction through the following dimensions volume time andplace needs and customer Consequently as ITs become widely used inservices reengineering processes are easier to accomplish in service deliverysystems than in manufacturing systems (Hammer and Champy 1993) Inaddition service regrms are able to design delivery systems in which customersare actively involved becoming self-service delivery systems This makesmacrexibility simpler and easier to implement considering that the customerdevelops certain activities of the service delivery system especially whencompared to the high costs of workers training for manufacturing regrms(Bowen and Lawler 1995)
Performance measuresPerformance measures remacrect how well the different competitive priorities regt inthe implemented operations strategy (Suarez et al 1996) For service industrieseffective performance measures related to operations strategies require a shiftfrom measures that focus on manufacturing efregciency to those capturing thecritical success factors related to customer initiated demands (Abernethy andLillis 1995) Traditional regnancial accounting measures are short-term orientedand aggregate Hence they usually are not capable to support operationsstrategic priorities (Govindarajan 1988 Simons 1987) In addition operationsassumptions of standardisation and mass production in a stable environmentinspire regnancial performance measures (Kaplan 1983) Howeverenvironmental conditions of manufacturing industries differ from thosefound in service industries which consider regnancial measures of operationsperformance less relevant (Brownell and Merchant 1990) Empirical literaturehas determined in many studies the strong inmacruence that macrexibility has onperformance especially for non-regnancial measures (Feigenbaum and Karnani1991 Jaikumar 1986 Tombak and De Meyer 1988)
However nowadays service operations managers need relevant and speciregcfeedback in order to take effective decisions in a changing environment(Chenhall 1995) Non-regnancial measures contribute to enhance performancewithin these environments as they deal with causes instead of effects Hencemanagers have an incentive to maximize performance on those activities onwhich their performance is measured (Hayes et al 1988) As such thedimensions of operations strategy need to be embedded in the performancemeasurement system (Sampson 1996) in order to be enhanced However thisargument does not intend to deny the role of regnancial performance measures
Serviceoperations
strategy
1405
but to demonstrate the limitations of regnancial measures in the service industrycontext
MethodologyIn this research we analyse empirically the relationships between serviceoperations strategy and service delivery macrexibility in order to know theinmacruence of this relationship on operations performance As both constructs aremultidimensional we will also analyse the interrelationships among thedifferent dimensions conregguring both constructs as well as the strength andmagnitude of such relationships Hence the main hypotheses to be tested inthis study are as follows
H1 The direct effect of operations strategy on regnancial performance ishigher than the indirect effect through macrexibility as a mediatingvariable
H2 The direct effect of operations strategy on non-regnancial performance islower than the indirect effect through macrexibility as a mediatingvariable
These hypotheses can be disaggregated into a total of 36 subhypotheses Eachone of these subhypotheses refers to every direct and indirect effect (throughmacrexibility) of the nine service strategy dimensions on the two different types ofperformance measures
Sample and the sampling procedureThis study was conducted in the context of Engineering Consulting Firms inSpain Three regrm types (civil industrial and environmental) were consideredcovering most activities of Engineering Consulting Firms The sample is thesame used by Arias-Aranda (2002) A questionnaire was used to obtain thedata for the study
Initially a copy of the questionnaire was sent to ten regrms representing everyturnover and activity group as a pre-test They were requested not to answerthe questionnaire but to remark all doubts or possible mistakes detected Onlysmall syntactic changes were made but none of the regrms remarked difregcultiesfor concept understanding or misuse
Afterwards the questionnaire was sent and collected from participatingregrms mainly via e-mail to the operations managersexecutives or equivalent ofthe companies in the sample The Spanish Association of Spanish EngineeringConsulting Firms (Tecniberia) provided all the information about addressesand regrm names Initially in order to attract the maximum number ofparticipating regrms an e-mail was sent to all regrms registered in Tecniberiaasking for their participation while stressing the importance of the studyFinally 129 regrms with a turnover higher than 150000 euros were selected asthe target population Twelve regrms requested the questionnaire to be sent via
IJOPM2311
1406
ordinary mail with a 100 per cent response rate Non-respondents werecontacted at least three times in order to invite them to participate in the studyOf these usable data were collected from a total of 71 regrms (55 per cent) Theoriginal language of the questionnaire was Spanish Table I shows adescription of the sample according to the regve turnover categories
Comparing the sample distribution with the sector as a whole no signiregcantdiscrepancies were observed Most of the regrmsrsquo turnover ranges from 300000to 3000000 euros (60 per cent approx of the total sample) On the other handcivil engineering regrms represent the higher percentage of the sample (49 percent) compared to 17 per cent of industrial engineering and 34 per cent ofenvironmental engineering Table II shows the turnover distribution of theregrms according to the Spanish Ministry of Industry (1998)
MeasuresThe dimensions of operations strategy considered for the study are those ofArias-Aranda (2002) Questions deregning such dimensions related to operationsstrategy are based on a regve-point Likert scale Every one of the ninedimensions of operations strategy was clearly represented in differentiatedblocks in the questionnaire Control questions were included in order to verifythe internal consistency of the questionnaire For every dimension a set ofitems was included in the questionnaire For every item a Likert scale rangingfrom 1 (completely agree) to 5 (completely disagree) was used to measure theagreement of the operations managersexecutives with such items
Cat Turnover (euros) Group of activityCivil Industrial Environmental
Firms Percentage Firms Percentage Firms Percentage
1 300000 7 200 3 250 7 2922 300000-600000 11 314 3 250 7 2923 600001-3000000 11 314 4 333 8 3334 3000001-6000000 3 86 0 00 2 835 6000000 3 86 2 167 0 00
Total 35 1000 12 1000 24 1000
Source Own processing
Table ISample distribution
(turnover and group ofactivity)
Turnover(euros) 300000 300000-600000 600001-3000000 3000001-6000000 6000000
Percentageof regrms 273 323 272 6 72
Source Spanish Ministry of Industry (1998)
Table IIDistribution inpercentage of
engineering consultingcompanies in Spain
Serviceoperations
strategy
1407
Partial indicators were developed in order to know the regrmsrsquo positioning forevery operations strategy dimension Such indicators combine the differentitems corresponding to each dimension in order to measure the regrmsrsquo trends Aglobal indicator was developed to measure operations strategy according tosuch trends taking into account that indicatorrsquos rank should macrow between thevalues of 1 and 5 in order to be consistent with the Likert scale previously used(see Appendix)
The macrexibility dimensions of Ramasesh and Jayakumar (1991) were used asthe main framework for the analysis of macrexibility in services According to thespeciregc nature of service industries some adaptations were included in themodel in order to ensure the validation of the study Some of these adaptationswere suggested by the operations managers during the pre-test stage A factoranalysis was performed in order to test whether the items used to measure thedifferent macrexibility dimensions grouped consistently Finally seven macrexibilitydimensions were identireged through this analysis They were named asexpansion distribution of information routing equipments and personnelmarket services and servuction[1] and process programming and volumemacrexibility Items conregguring each macrexibility dimension were also measuredthrough a regve-point Likert scale In this case the respondersrsquo degree ofagreement with each of the statements deregning every macrexibility dimensionconreggures all items relating to system macrexibility Table III shows the macrexibilitydimensions and measures
Performance measures used in this study were classireged according toAbernethy and Lillis (1995) Respondents were asked to indicate the importanceof each measure in the range ordfof little or no importanceordm to ordfof utmostimportanceordm in a regve-point Likert scale Operational measures were categorizedas regnancialefregciency and customer satisfaction measures Slight adaptationswere made according to the pre-test in order to conform measures to engineeringconsulting regrms Respondents were asked to assign a level of relevance to eachmeasure in a Likert scale (1-5) Measures are shown in Table IV
Inter-item analysis was used to check scales for internal consistency orreliability Speciregcally Cronbachrsquos reliability coefregcient (alpha) is calculatedfor each scale (dimension) as recommended by empirical research in operationsby many researchers (Flynn et al 1995 Smith and Reece 1999 Swamidass andNewell 1987) Cronbachrsquos alphas and trends for every dimension according tothe indicator values are shown in Tables V and VI
Usually a value of 07 in the Cronbachrsquos alpha is considered adequate inorder to ensure reliability of the internal consistency of the questionnaire(Nunnally 1978) However a margin of 05-06 is generally considered adequatefor exploratory work as well (Nunnally 1978 Srinivasan 1985) Constructvalidation is a process of demonstrating that an empirical measure correspondsto the conceptual deregnition of a construct (Schwab 1980) Consequently threetypes of validity can be established nomological or theoretical validity vertical
IJOPM2311
1408
Fle
xib
ilit
yty
pe
Dereg
nit
ion
Sugges
ted
mea
sure
sR
efer
ence
s
Expan
sion
macrex
ibilit
yE
ase
wit
hw
hic
hca
pac
ity
can
be
added
when
nee
ded
Over
all
cost
and
tim
enee
ded
toad
dca
pac
ity
Bro
wne
etal
(198
4)an
dC
arte
r(1
986)
Upper
lim
iton
the
amou
nt
ofca
pac
ity
expan
sion
Dis
trib
uti
onof
info
rmat
ion
macrex
ibilit
y
Cap
abilit
yto
dis
trib
ute
and
shar
ein
form
atio
nth
rough
the
serv
ice
del
iver
ysy
stem
Rat
ioof
the
num
ber
ofin
form
atio
npat
hs
avai
lable
ina
syst
emto
the
num
ber
ofpos
sible
pat
hs
Chat
terj
eeet
al
(198
4)an
dN
ewm
anet
al
(199
3)
Incr
ease
inth
eper
form
ance
ofse
rvic
edel
iver
yth
rough
the
use
ofIT
Rou
ting
macrex
ibilit
yC
apab
ilit
yto
use
alte
rnat
ive
pro
cess
ing
route
sto
del
iver
ase
rvic
eA
ver
age
num
ber
ofw
ays
inw
hic
ha
serv
ice
can
be
del
iver
edB
row
ne
etal
(198
4)
Rou
ting
entr
opy
Dec
reas
eper
centa
ge
inth
eth
roughput
cause
dby
bre
akdow
ns
Cos
tof
pro
duct
ion
lost
due
tore
sched
uling
anurg
ent
job
Chung
and
Chen
(199
0)an
dK
um
ar(1
986)
Lab
our
and
equip
men
tmacr
exib
ilit
yC
apab
ilit
yof
per
sonnel
and
mac
hin
esto
per
form
dif
fere
nt
oper
atio
ns
Num
ber
ofdif
fere
nt
oper
atio
ns
per
form
edby
mac
hin
esan
dper
sonnel
wei
ghte
dby
the
impor
tance
ofta
sks
Bri
llan
dM
andel
bau
m(1
989)
Ger
win
(198
7)an
dSet
hian
dSet
hi
(199
0)C
ost
ofsw
itch
ing
from
one
oper
atio
nto
anot
her
Exte
nt
ofvar
iati
onin
the
inputs
that
mac
hin
esor
wor
kfo
rce
can
han
dle
Mar
ket
macrex
ibilit
yC
apab
ilit
yof
the
serv
ice
del
iver
ysy
stem
toad
apt
tom
arket
chan
ges
Cos
tof
order
sin
atte
nti
onC
ost
ofor
der
del
ays
Gupta
and
Som
mer
s(1
992)
(continued
)
Table IIIDifferent types of
service macrexibility andsome suggested
measures
Serviceoperations
strategy
1409
Fle
xib
ilit
yty
pe
Dereg
nit
ion
Sugges
ted
mea
sure
sR
efer
ence
s
Ser
vic
esan
dse
rvuct
ion
macrex
ibilit
yC
apab
ilit
yof
the
syst
emto
add
orsu
bst
itute
serv
ices
wit
hou
tm
ajor
effo
rts
Rat
ioof
tota
lou
tput
tose
tup
cost
sN
um
ber
ofse
rvic
esdel
iver
edby
yea
rT
ime
orco
stto
chan
ge
from
one
serv
ice
toan
other
Opti
onpri
cing
appro
ach
Bro
wne
etal
(198
4)Ja
ikum
ar(1
986)
and
Son
and
Par
k(1
987)
Pro
cess
pro
gra
mm
ing
and
Cap
abilit
yof
asy
stem
toop
erat
eunat
tended
for
long
per
iods
Expec
ted
per
centa
ge
upti
me
duri
ng
seco
nd
and
thir
dsh
ifts
vol
um
emacr
exib
ilit
yC
apab
ilit
yto
pro
duce
dif
fere
nt
par
tty
pes
wit
hou
tm
ajor
effo
rtN
um
ber
ofdif
fere
nt
par
tsth
atca
nbe
pro
duce
dB
row
ne
etal
(198
4)
Cap
abilit
yto
oper
ate
atdif
fere
nt
level
sof
outp
ut
Chan
geo
ver
cost
sbet
wee
ndif
fere
nt
know
njo
bs
wit
hin
the
curr
ent
pro
duct
ion
pla
n
Fal
kner
(198
6)G
erw
in(1
987)
and
Jaik
um
ar(1
986)
Expec
ted
val
ue
ofa
por
tfol
ioof
pro
duct
for
agiv
ense
tof
conti
ngen
cies
Rat
ioof
aver
age
vol
um
emacr
uct
uat
ion
toto
tal
capac
ity
Sta
bilit
yof
man
ufa
cturi
ng
cost
sov
erw
idel
yvar
yin
gle
vel
sof
pro
duct
ion
vol
um
eSm
alle
stvol
um
esfo
rpro
regta
ble
oper
atio
nof
the
syst
em
Sou
rceA
dap
ted
from
Ram
ases
han
dJa
yak
um
ar(1
991)
Table III
IJOPM2311
1410
validity and horizontal or criterion-related validity Hence the measurementinstrument establishes the basis for nomological or theoretical validity since allitems are developed through an extensive review of the service operationsstrategy body of research Factor analysis was used to check unidimensionalityof scales which provides evidence of a single latent construct (Flynn et al1995) Cronbachrsquos alpha values address vertical validity which describes theextent to which a scale represents its construct Evidence of criterion-relatedvalidity is presented through the Browne and Cudeck (1993) cross-validation
Financial and efregciency measures Customer satisfaction measures
Volume of services delivered Number of customer claimsFirm proregt on net income Level of workers efregciencySet up times Frequency of errors in service delivery
systemReal costs regt in relation tostandard costs
New service development
ROI Number of services not regnally deliveredbecause of customer demand
Variation on prices of raw servicesand materials
Time between service order and delivery
Percentage of use of service deliverycapacity
Ability of service customisation
Percentage of no activity time Level of customer satisfactionCost reduction due to quality increments Level of workers cooperation at interdepartmental
level
Source Adapted from Abernethy and Lillis (1995)Table IV
Performance measures
Flexibility dimensions Cronbachrsquos alpha
Expansion 09616Distribution of information 09325Routing 08755Personnel and equipment 09329Market 08640Services and servuction 08676Process programming and volume 05829
Source Own processing
Table VCronbachrsquos alphas for
service macrexibilitydimensions
Performance dimension Cronbachrsquo alpha
Financial performance 08981Non-regnancial performance 08455
Source Own processing
Table VICronbachrsquos alphas for
performancedimensions
Serviceoperations
strategy
1411
index for covariance structure modelling Index value for this research is 0642which indicates a high probability that the model results are consistent withpopulation parameters
Analysis and resultsAccording to the aim of our analysis the technique of path analysis seems to bethe most adequate to empirically verify the hypothesis Such a techniqueestimates the magnitude of the linkages between the variables Through theseestimates it is possible to provide information about the underlying causalprocesses (Asher 1983) It also allows for distinguishing between direct andindirect effects in case there are compound paths Our path analysis model isrecursive as it assumes that there is no reciprocal causality in the form ofcausal feedback
For every path a beta coefregcient is calculated This coefregcientrsquos signindicates the direction of the relationship (positive or negative) and itsmagnitude represents the strength of the interrelationship between thevariables The path coefregcients identify direct and indirect effects of eachvariable on the respective dependent variables The total effect is simply thesum of the direct effect and all the indirect effects that occur throughintervening variables Tables VII and VIII report direct indirect total and
Dependent variable regnancial performanceDirect Indirect Total Spurious r
Independent variable (Op Strat Dim)Layout 0465 0312 0777 2 0043 0734PUSH orientation 0598 0291 0889 2 0017 0872Standardisation 0578 0324 0902 2 0083 0819Offered services 2 0522 2 0280 2 0802 0008 2 0794Use of IT 0623 0354 0977 2 0081 0896Back and front ofregce act 0528 0383 0911 2 0059 0852HR specialisation 0442 0372 0814 2 0040 0774Customer participation 2 0289 2 0165 2 0454495 0049 2 0405New services development 2 062 2 0247 2 0867 0077 2 079Dimensions of macrexibilityExpansion 2 0136 2 0136 0041 2 0095Inf distr 0098 0098 2 0013 0085Routing 0127 0127 0118 0245Equip and pers 2 0176 2 0176 0081 2 0095Market 2 0153 2 0153 0027 2 0126Prod and serv 2 0115 2 0115 0042 2 0073Proc prog and vol 2 0086 2 0086 0179 0093Standard R 2 0886F-ratio 35164
Notes n = 71 p 001 p 005 p 010Source Own processing
Table VIIDirect and indirecteffects of operationsstrategy dimensions onregnancial performance
IJOPM2311
1412
spurious effects of operations strategy dimensions on regnancial andnon-regnancial performance of the regrm
To test H1 and H2 the effects of operations strategy dimensions andmacrexibility on regnancial and non-regnancial performance were disaggregated intodirect indirect and spurious The following results were obtained
The direct effects of the operations strategy dimensions on regnancialperformance are positive and signiregcant (p 001) for all independentvariables (direct effects range from 0442 for human resourcesspecialisation to 0623 for the use of IT) except for offered services andnew services development for which direct effects are negative Customerparticipation is not signiregcant
All effects of macrexibility on regnancial performance are negative andsigniregcant (ranging from 2 0086 for process programming and volumemacrexibility ( p 005) to 2 0176 for equipments and personnel macrexibility( p 001)) except for information distribution and routing macrexibility forwhich effects are positive and signiregcant Indirect effects of operationsstrategy dimensions on regnancial performance through macrexibility as themediating variable are also high with values ranging from 2 01655 forcustomer participation to 0384 for back and front ofregce activities
Dependent variable non-regnancial performanceDirect Indirect Total Spurious r
Independent variable (Op Strat Dim)Layout 2 0486 2 0425 2 0911 0016 2 0895PUSH orientation 2 0365 2 0431 2 0796 2 0038 2 0835Standardisation 2 0405 2 0463 2 0868 0054 2 0814Offered services 0286 0337 0623 2 0115 0508Use of IT 2 0427 2 0481 2 0908 0080 2 0828Back and front ofregce act 2 0437 2 0509 2 0946 0134 2 0812HR specialisation 2 0403 2 0524 2 0927 0086 2 0841Customer participation 0114 0280 0394 2 0053 0341New services development 0337 0311 0648 0087 0736Dimensions of macrexibilityExpansion 0186 0196 0009 0206Inf distr 2 0073 2 0085 2 0019 2 0104Routing 0146 0158 0011 0169Equip and pers 0113 0127 001 0137Market 0115 0115 0014 0129Prod and serv 0082 0095 0018 0113Proc prog and vol 0041 0056 0022 0078Standard R 2 0932F-ratio 46415
Notes n = 71 p 001 p 005 p 010Source Own processing
Table VIIIDirect and indirect
effects of operationsstrategy dimensions on
non-regnancialperformance
Serviceoperations
strategy
1413
Direct effects of macrexibility dimensions on regnancial performance arenegative and signiregcant (ranging from 2 0086 for process programmingand volume macrexibility ( p 005) to 2 0176 for equipments and personnelmacrexibility ( p 001)) except for information distribution and routingmacrexibility for which effects are positive and signiregcant
Direct effects of operations strategy dimensions on non-regnancialperformance are on the other side negative and signiregcant for allindependent variables (values range from 2 0365 for PUSH orientation to2 0486 for layout) with the exception of the services offered customerparticipation and new services development for which direct effects arepositive and signiregcant
All direct effects of macrexibility on non-regnancial performance are positiveand signiregcant ranging from 0041 for process programming and volumemacrexibility to 0186 for expansion macrexibility ( p 001) except forinformation distribution for which direct effect is positive but notsigniregcant Indirect effects of operations strategy dimensions onnon-regnancial performance through macrexibility as the mediating variableare also high with values ranging from 2 05246 for human resourcesspecialisation to 0337 for services offered
Direct effects of macrexibility dimensions on non-regnancial performance arepositive and signiregcant (ranging from 0041 for process programmingand volume macrexibility ( p 001) to 0186 for expansion macrexibility( p 001)) except for information distribution macrexibility for which effectsare positive but not signiregcant
After performing the analysis H1 is contrasted totally and positively as alldirect effects of the operations strategy dimensions on regnancial performanceare higher than all indirect effects through macrexibility H2 is contrasted partiallyand positively as all direct effects of the operations strategy dimensions onnon-regnancial performance are lower than all indirect effects through macrexibilityexcept for layout and new services development dimensions Furthermore theindirect effects of the operations strategy dimensions on regnancial performanceare mostly positive while such effects are negative for non-regnancialperformance However this trend turns opposite for macrexibility whoseincidence is mostly negative on regnancial performance and positive onnon-regnancial performance
The r coefregcients calculated let us know the goodness in the model regt(Billings and Wroten 1978) Spurious explanation of the model is obtained bycomparing the r coefregcients with the total effects explained In this model thereare only four values higher than 010 (10 per cent of spurious explanation)These are routing and process programming and volume macrexibility forregnancial performance and services offered and back and front ofregce activitiesfor non-regnancial performance
IJOPM2311
1414
Contributions and conclusionsThis research provides several contributions to the regeld of service operationsmanagement for academicians and practitioners First based on the categoriesof structure and infrastructure decisions proposed by relevant servicemanagement literature this study operationalizes the concept of serviceoperations strategy By doing so new research opportunities broaden in orderto improve and adapt this concept to different environmental conditionsFuture operationalizations of the service operations strategy will requireadditional perspectives under a contingency analysis In additionheterogeneity of the service industries involves further attention according tocompetitive priorities In this context practitioners have a starting point tounderstand how functional decisions affect the different dimensions thatconreggure the operations strategy in services
Second a model of macrexibility in service industries has been appliedincluding some adaptations to the speciregc nature of service industries Thismodel is based on the classical manufacturing macrexibility frameworks Thisstudy examines this critical concept utilizing empirical methods within aregeld-based setting Still some dimensions show low moderate reliability sofuture research efforts may focus on improving and determining the exactinternal and environmental factors affecting service macrexibility according tospeciregc sector characteristics This can help practitioners in the process ofchoosing which dimensions of macrexibility better support strategic prioritiesSuch knowledge is especially relevant when related to regnancial decisions of ITinvestments and equipments as well as personnel training
Third this research proves that service operations strategy has a signiregcantpositive and direct effect on regnancial performance The results establish notonly the existence of strong links between the service operations strategy andregnancial performance but also the magnitude of the impact of every operationsstrategy dimension on every single performance dimension Nonetheless thegeneralization of these regndings to other service industries cannot beguaranteed without cautiousness even though the robust statistical resultsfor this relationship suggest that the regndings are quite reliable
Fourth understanding the effects of operations strategy on performance isone of the major regndings of this study The different strategy dimensionsinmacruence regnancial and non-regnancial performance in several manners It isespecially relevant to the fact that macrexibility dimensions inmacruence positively onnon-regnancial performance and negatively on the regnancial performance Henceinvestments on macrexibility lead to enhance the non-regnancial performance whilenegatively affecting the regnancial performance Therefore practitioners canbetter establish priorities for competition according to the expected relationshipbetween the operations strategy macrexibility and performance
Finally this research has based all regndings on the empirical methods ofanalysis supported by the regeld-based investigation to give support to concepts
Serviceoperations
strategy
1415
and relationships that seem reasonable in order to provide empiricalveriregcation The speciregc methodology of this study and the results suggestthat much of the conceptual efforts made in operations strategy formanufacturing may be applicable to service operations as well However thevariables and dimensions used to conreggure this study have been adapted to thespeciregc sector of the consulting engineering regrm which limits directapplication of the model to other service industries Further research efforts canhelp to determine to what extent the strategy macrexibility and performance relatein similar ways in heterogeneous service industries
Note
1 Even though service production and product-service are broadly used concepts we opted forthe general denomination of services combined with the servuction term
References
Abernethy MA and Lillis AM (1995) ordfThe impact of manufacturing macrexibility onmanagement control system designordm Accounting Organizations and Society Vol 20pp 241-58
Adam E Jr and Swamidass P (1989) ordfAssessing operations management from a strategicperspectiveordm Journal of Management Vol 15 No 2 pp 181-203
Adler PS (1988) ordfManaging macrexible automationordm California Management Review Vol 30 No 2pp 34-56
AAcirc lvarez Gil MJ (1994) ordfCapital budgeting and macrexible manufacturingordm International Journal ofProduction Economics Vol 36 pp 109-28
Anderson JC Cleveland G and Schroeder RG (1989) ordfOperations strategy a literaturereviewordm Journal of Operations Management Vol 8 No 2 pp 1-26
Arias-Aranda D (2002) ordfRelationship between operations strategy and size in engineeringconsulting regrmsordm International Journal of Service Industry Management Vol 13 No 3pp 263-85
Arias-Aranda D Minguela Rata B and RodrotildeAcircguez Duarte A (2001) ordfInnovation and regrm sizean empirical study for Spanish engineering consulting companiesordm European Journal ofInnovation Management Vol 4 No 3
Armistead CG (1992) ordfIntroduction to service operationsordm in Voss C Armistead C JohnstonB and Morris B (Eds) Operations Management in Service Industries and The PublicSector Wiley NJ
Asher HB (1983) Causal Modeling Sage Publications Beverly Hills CA
Berry LL and Parasuraman A (1997) ordfListening to the customer plusmn the concept of aservice-quality information systemordm Sloan Management Review Vol 38 No 3 pp 65-76
Billings RS and Wroten SP (1978) ordfUse of path analysis in industrialorganizationalpsychology criticisms and suggestionsordm Journal of Applied Psychology Vol 63 No 6pp 677-88
Bowen DE and Lawler EE III (1995) ordfEmpowering service employeesordm Sloan ManagementReview Summer
Bowen DE and Youngdahl WE (1998) ordf`Leanrsquo service in defense of a production-lineapproachordm International Journal of Service Industry Management Vol 9 No 3 pp 207-25
IJOPM2311
1416
Brill P and Mandelbaum C (1989) ordfOn measures of macrexibility in manufacturing systemsordmInternational Journal of Production Research Vol 27 No 5 pp 747-56
Browne J Dubois K Rathmill SP Sethi P and Stecke KE (1984) ordfClassiregcation of macrexiblemanufacturing systemsordm The FMS Magazine Vol 2 No 1 pp 747-56
Browne M and Cudeck R (1993) Alternative Ways of Assessing Model Fit Kluwer PublishingDordrecht
Brownell P and Merchant KA (1990) ordfThe budgetary and performance inmacruences of productstandarizations and manufacturing process automationordm Journal of Accounting ResearchVol 2 pp 388-97
Bucki J and Pesqueux Y (2000) ordfFlexible workshop about the concept of macrexibilityordmInternational Journal of Agile Management Systems Vol 2 No 1 pp 62-70
Carter MF (1986) ordfDesigning macrexibility into automated manufacturing systemsordm in SteckeKE and Suri R (Eds) Proc 2nd ORSARIMS Conference in Flexible ManufacturingSystems Operations Research Model and Applications Ann Arbor Elsevier SciencePublishers Amsterdam pp 107-118
Chambers S (1992) ordfFlexibility in the context of manufacturing strategyordm in Voss CA (Ed)Manufacturing Strategy Process and Content Chapman and Hall London
Chatterjee A Cohen M Maxwell W and Miller R (1984) ordfManufacturing macrexibility modelsand measurementsordm Proceedings of the 1st ORSATIMS Conference on FMS Ann ArborMI pp 49-64
Chenhall R (1995) ordfReliance on manufacturing performance measures total qualitymanagement and organisational performance an empirical investigationordm paperpresented at University of New South Wales Sydney
Chung CH and Chen IJ (1990) ordfManaging macrexibility of macrexible manufacturing systems forcompetitive edgeordm in Liberatore MJ (Ed) The Selection and Evaluation of AdvancedManufacturing Technologies Springer-Verlag Berlin pp 280-305
Collier DA (1994) The Service-Quality Solution Using Service Management to Gain CompetitiveAdvantage Irwin IL
Collier DA (1996) ordfTight and loose comprehensive customer contact (3C) plansordm Advances inService Marketing and Management Vol 5 JAI Press Greenwich CT pp 153-68
Cusumano M (1988) ordfShifting economies craft production to the macrexible factoryordm WorkingPaper 2012-88 Sloan School of Management MIT Cambridge MA
Dangayash GS and Deshmukh SG (2001) ordfManufacturing strategy literature review andsome issuesordm International Journal of Operations and Production Management Vol 21No 7 pp 884-932
Desatnik R (1994) ordfManaging customer service for the 21st centuryordm Journal for Quality andParticipation Vol 17 pp 30-6
Duclos LK Siha SM and Lummus RR (1995) ordfJIT in services a review of current practicesand future directions for researchordm International Journal of Service Industry ManagementVol 6 No 5 pp 36-52
Falkner CH (1986) ordfFlexibility in manufacturing plantsordm Proceedings of the SecondORSATIMS Conference on Flexible Manufacturing Systems Elsevier New York NY
Feigenbaum A and Karnani A (1991) ordfOutput macrexibility a competitive advantage for smallregrmsordm Strategic Management Journal Vol 12 pp 101-14
Flynn B Sakakibara S Schroeder R Bates K and Flynn J (1995) ordfEmpirical researchmethods in operations managementordm Journal of Operations Management Vol 9 No 2pp 250-84
Serviceoperations
strategy
1417
Gaimon C and Singhal V (1992) ordfFlexibility and the choice of manufacturing facilities undershort product life cyclesordm European Journal of Operational Research Vol 60 No 2pp 211-23
Gerwin D (1987) ordfAn agenda for research on the macrexibility of manufacturing processesordmInternational Journal of Operations amp Productions Management Vol 7 No 1 pp 38-49
Gerwin D (1993) ordfManufacturing macrexibility a strategic perspectiveordm Management ScienceVol 39 No 4 pp 395-410
Ghalayini AM and Noble JS (1996) ordfThe changing basis of performance measuresordmInternational Journal of Operations and Productions Management Vol 16 No 8 pp 63-80
Gouillart F and Sturdivant F (1994) ordfSpend a day in the life of your customersordm HarvardBusiness Review pp 116-25
Govindarajan VA (1988) ordfA contingency approach to strategy implementation at thebusiness-unit level integrating administrative mechanisms with strategyordm Academy ofManagement Journal Vol 28 pp 828-53
Gupta YP and Goyal S (1992) ordfFlexibility tradeoffs in a macrexible manufacturing system asimulation studyordm International Journal of Production Research Vol 30 No 3 pp 527-57
Gupta YP and Somers TM (1992) ordfThe measurement of manufacturing macrexibilityordm EuropeanJournal of Operational Research Vol 60 pp 166-82
Gupta YP and Somers TM (1996) ordfBusiness strategy manufacturing macrexibility andorganizational performance relationships a path analysis approachordm Production andOperations Management Vol 5 No 3 pp 204-31
Gustavsson S (1988) ordfFlexibility and productivity in complex processesordm International Journalof Production Research Vol 22 No 5 pp 801-8
Hammer M and Champy J (1993) Reengineering the Corporation HarperBusiness New YorkNY
Hart CWL (1995) ordfMass customization conceptual underpinnings opportunities and limitsordmInternational Journal of Service Industry Management Vol 6 No 2 pp 36-45
Harvey J Lefebvre LA and Lefebvre E (1997) ordfFlexibility and technology in services aconceptual modelordm International Journal of Operations amp Production Management Vol 17No 21 pp 29-45
Hayes RH Wheelwright SC and Clark K (1988) Dynamic Manufacturing Creating theLearning Organization Free Press New York NY
Haynes RM and Du Vall PK (1992) ordfService quality management a process controlapproachordm International Journal of Service Industry Management Vol 3 No 1 pp 14-24
Ho C (1996) ordfA contingency theoretical model of manufacturing strategyordm International Journalof Operations amp Production Management Vol 16 No 5 pp 74-98
Hyun J and Ahn B (1990) ordfFlexibility revisited review unifying frameworks and strategicimplicationsordm mimeo Korean Advanced Institute of Science and Technology Seoul
Jaikumar R (1986) ordfPostindustrial manufacturingordm Harvard Business Review Vol 64 No 6pp 69-76
Johnston R (1994) ordfOperations from factory to service managementordm International Journal ofService Industry Management Vol 5 No 1 pp 49-63
Kaplan RS (1983) ordfMeasuring manufacturing performance a new challenge for managementaccounting researchordm Accounting Review Vol 58 pp 686-705
IJOPM2311
1418
Kumar V (1986) ordfOn measurement of macrexibility in macrexible manufacturing systems aninformation-theoretic approachordm Proceedings of the 2nd ORSATIMS Conference onFlexible Manufacturing Systems Elsevier New York NY
Leong GK Snyder DL and Ward PT (1990) ordfResearch in the process and content ofmanufacturing strategyordm OMEGA International Journal of Management Science Vol 18No 2 pp 109-22
Lusch R Boyt T and Schuler D (1996) ordfEmployees as customers the role of social controlsand employee satisfaction in developing patronageordm Journal of Business Research Vol 35pp 239-52
McCutcheon DM Raturi AS and Meredith JR (1994) ordfThe customisation-responsivenesssqueezeordm Sloan Management Review Winter pp 89-99
Mills J Neely A Platts K and Gregory M (1998) ordfManufacturing strategy a pictorialrepresentationordm International Journal of Operations amp Production Management Vol 18No 11 pp 1067-85
Nayyar PR (1992) ordfPerformance effects of three foci in service regrmsordm Academy of ManagementJournal Vol 35 No 5 pp 985-1009
Neely A Richards H Mills J Platts K and Bourne M (1997) ordfDesigning performancemeasures a structural approachordm International Journal of Operations and ProductionManagement Vol 17 No 11 pp 1131-52
Newman WR Hanna M and Maffei MJ (1993) ordfDealing with the uncertainties ofmanufacturing macrexiblity buffers and integrationordm International Journal of Operations ampProduction Management Vol 13 No 1 pp 19-34
Nieto AntolotildeAcircn M Arias Aranda D Minguela Rata B and RodrotildeAcircguez Duarte A (1999) ordfTheevolution of operations management contents an analysis of the most relevant textbooksordmIndustrial Management amp Data Systems Vol 99 No 78 pp 345-53
Noori H and Radford R (1995) Production and Operations Management McGraw-Hill NewYork NY
Normann R (1984) Service Management Wiley New York NY
Nunnally J (1978) Psychometric Theory McGraw-Hill New York NY
Ramasesh RV and Jayakumar MD (1991) ordfMeasurement of manufacturing macrexibility a valuebased approachordm Journal of Operations Management Vol 10 No 4 pp 446-68
Riley M and Lockwood A (1997) ordfStrategies and measurement for workforce macrexibility anapplication of functional macrexibility in a service settingordm International Journal ofOperations and Production Management Vol 17 No 4 pp 413-9
Saregzadeh MH Ritzman LP and Mallick D (2000) ordfRevisiting alternative theoreticalparadigms in manufacturing strategyordm Production and Operations Management Vol 9No 2 pp 111-27
Sampson SE (1996) ordfRamiregcations of monitoring service quality through passively solicitedcustomer feedbackordm Decision Sciences Vol 27 No 4 pp 601-21
Schmenner RW (1986) ordfHow can service businesses survive and prosperordm Sloan ManagementReview Vol 27 No 3
Schwab D (1980) ordfConstruct validity in organizational behaviourordm Research in OrganizationalBehaviour Vol 2 No 1 pp 3-43
Sethi AK and Sethi SP (1990) ordfFlexibility in manufacturingordm International Journal of FlexibleManufacturing Systems Vol 2 No 4 pp 289-328
Serviceoperations
strategy
1419
Simons R (1987) ordfAccounting control systems and business strategy an empirical analysisordmAccounting Organizations and Society Vol 12 pp 357-74
Skinner W (1969) ordfManufacturing plusmn missing link in corporate strategyordm Harvard BusinessReview May-June pp 136-45
Skinner W (1978) Manufacturing in the Corporate Strategy Wiley New York NY
Slack N (1987) ordfThe macrexibility of manufacturing systemsordm International Journal of Operationsamp Production Management Vol 7 No 4 pp 35-45
Smith TM and Reece JS (1999) ordfThe relationship of strategy regt productivity and businessperformance in a services settingordm Journal of Operations Management Vol 17 pp 145-61
Son YK and Park CS (1987) ordfEconomic measure of productivity quality and macrexibility inadvanced manufacturing systemsordm Journal of Manufacturing Systems Vol 6 No 3pp 193-206
Spanish Ministry of Industry (1998) ordfEl sector de la IngenierotildeAcirca Civil en EspanAumlaordm Ed Ministeriode Fomento
Spina G Bartezzaghi E Bent A Cagliano R Draaijer D and Boer H (1996) ordfStrategicallymacrexible production the multi-focused manufacturing paradigmordm International Journal ofOperations amp Production Management Vol 16 No 11 pp 20-41
Srinivasan A (1985) ordfAlternative measure of system effectiveness associations andimplicationsordm MIS Quarterly Vol 9 No 3 pp 243-53
Suarez FF Cusumano MA and Fine CH (1996) ordfAn empirical study of manufacturingmacrexibility in printed circuit board assemblyordm Operations Research Vol 44 No 1pp 223-40
Swamidass PM and Newell WT (1987) ordfManufacturing strategy environmental uncertaintyand performance a path analytic modelordm Management Science Vol 33 No 4 pp 509-24
Swink M and Way MH (1995) ordfManufacturing strategy propositions current researchrenewed directionsordm International Journal of Operations amp Production ManagementVol 15 No 7 pp 4-26
Taymaz E (1989) ordfTypes of macrexibility in a single machine production systemordm InternationalJournal of Production Research Vol 27 No 11 pp 1891-9
Tersine R and Harvey M (1998) ordfGlobal customerization of markets has arrivedordm EuropeanManagement Journal Vol 16 No 1 pp 79-90
Tombak MM (1988) ordfThe importance of macrexibility in manufacturingordm WhartonPIMSResearch Center Working Paper No 89-002 Philadelphia PA
Tombak M and De Meyer A (1988) ordfFlexibility and FMS an empirical analysisordm IEEETransactions on Engineering Management Vol 35 pp 101-7
Upton DM (1995) ordfWhat really makes factories macrexibleordm Harvard Business Review pp 74-84
Vandermerwe S (1992) ordfThe power is in the service because the value is in the resultordm inLovelock CH (Ed) Managing Services 2nd ed Prentice-Hall Englewood Cliffs NJpp 298-309
Walton R and Susman G (1987) ordfPeople policies for the new machinesordm Harvard BusinessReview Vol 66 No 2 pp 98-106
Wheelwright SC (1984) ordfManufacturing strategy deregning the missing linkordm StrategicManagement Journal Vol 5 pp 77-91
IJOPM2311
1420
AppendixThe indicator was designed as follows
Ebn =5
Pbi=a Ain 2
Pdi=c Ain
plusmn sup2+
Pdi=c Ain 2 5
Pbi=a Ain
plusmn sup2shyshyshyshyshyshy+ 1
h i
5Pb
i=a Ain 2Pd
i=c Ain
plusmn sup2shyshyshyshyshyshy+
Pdi=c Ain 2 5
Pbi=a Ain
plusmn sup2shyshyshyshyshyshy+ 1
h i
where Ebn is the indicator Ain is the score obtained in question i of block n in the questionnaireRank [ab ] represents questions scoring towards one of the trends in each block
Rank [cd ] represents questions scoring towards opposite extremes of rank [ab ] in eachblock
Hence
Xd
i=c
Ain 2 5Xb
i= a
Ain
Aacute
represents the smallest reachable value considering that one regrm scores the highest (score 5) inall questions for one of the trends and the smallest (score 1) in all questions of the opposite trendOn the other hand
5Xb
i=a
Ain 2Xd
i=c
Ain
Aacute
represents the smallest reachable value for a regrm positioned at one extreme scoring the smallest(score 1) and the highest (score 5) for the opposite trends Once the extremes and possibleintermediate values have been obtained the indicator transforms this rank in a scale from 0 to 5by adding to the value obtained the smallest reachable value plus one The value obtained isregnally divided by the highest reachable value adding the smallest value plus one in order tomake the scale positive Finally the value obtained is multiplied by regve to regt it to the 1 - 5 scale
Serviceoperations
strategy
1421
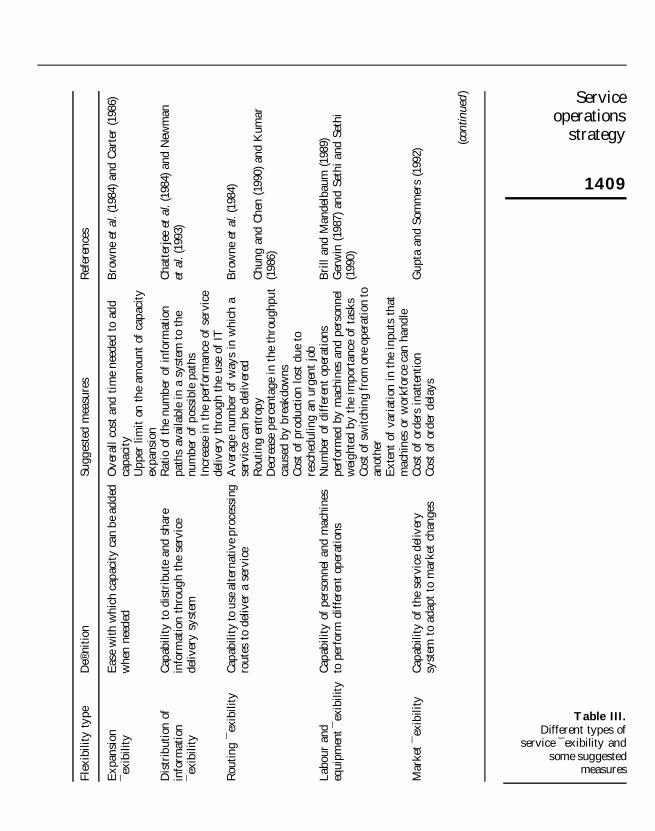
Fle
xib
ilit
yty
pe
Dereg
nit
ion
Sugges
ted
mea
sure
sR
efer
ence
s
Ser
vic
esan
dse
rvuct
ion
macrex
ibilit
yC
apab
ilit
yof
the
syst
emto
add
orsu
bst
itute
serv
ices
wit
hou
tm
ajor
effo
rts
Rat
ioof
tota
lou
tput
tose
tup
cost
sN
um
ber
ofse
rvic
esdel
iver
edby
yea
rT
ime
orco
stto
chan
ge
from
one
serv
ice
toan
other
Opti
onpri
cing
appro
ach
Bro
wne
etal
(198
4)Ja
ikum
ar(1
986)
and
Son
and
Par
k(1
987)
Pro
cess
pro
gra
mm
ing
and
Cap
abilit
yof
asy
stem
toop
erat
eunat
tended
for
long
per
iods
Expec
ted
per
centa
ge
upti
me
duri
ng
seco
nd
and
thir
dsh
ifts
vol
um
emacr
exib
ilit
yC
apab
ilit
yto
pro
duce
dif
fere
nt
par
tty
pes
wit
hou
tm
ajor
effo
rtN
um
ber
ofdif
fere
nt
par
tsth
atca
nbe
pro
duce
dB
row
ne
etal
(198
4)
Cap
abilit
yto
oper
ate
atdif
fere
nt
level
sof
outp
ut
Chan
geo
ver
cost
sbet
wee
ndif
fere
nt
know
njo
bs
wit
hin
the
curr
ent
pro
duct
ion
pla
n
Fal
kner
(198
6)G
erw
in(1
987)
and
Jaik
um
ar(1
986)
Expec
ted
val
ue
ofa
por
tfol
ioof
pro
duct
for
agiv
ense
tof
conti
ngen
cies
Rat
ioof
aver
age
vol
um
emacr
uct
uat
ion
toto
tal
capac
ity
Sta
bilit
yof
man
ufa
cturi
ng
cost
sov
erw
idel
yvar
yin
gle
vel
sof
pro
duct
ion
vol
um
eSm
alle
stvol
um
esfo
rpro
regta
ble
oper
atio
nof
the
syst
em
Sou
rceA
dap
ted
from
Ram
ases
han
dJa
yak
um
ar(1
991)
Table III
IJOPM2311
1410
validity and horizontal or criterion-related validity Hence the measurementinstrument establishes the basis for nomological or theoretical validity since allitems are developed through an extensive review of the service operationsstrategy body of research Factor analysis was used to check unidimensionalityof scales which provides evidence of a single latent construct (Flynn et al1995) Cronbachrsquos alpha values address vertical validity which describes theextent to which a scale represents its construct Evidence of criterion-relatedvalidity is presented through the Browne and Cudeck (1993) cross-validation
Financial and efregciency measures Customer satisfaction measures
Volume of services delivered Number of customer claimsFirm proregt on net income Level of workers efregciencySet up times Frequency of errors in service delivery
systemReal costs regt in relation tostandard costs
New service development
ROI Number of services not regnally deliveredbecause of customer demand
Variation on prices of raw servicesand materials
Time between service order and delivery
Percentage of use of service deliverycapacity
Ability of service customisation
Percentage of no activity time Level of customer satisfactionCost reduction due to quality increments Level of workers cooperation at interdepartmental
level
Source Adapted from Abernethy and Lillis (1995)Table IV
Performance measures
Flexibility dimensions Cronbachrsquos alpha
Expansion 09616Distribution of information 09325Routing 08755Personnel and equipment 09329Market 08640Services and servuction 08676Process programming and volume 05829
Source Own processing
Table VCronbachrsquos alphas for
service macrexibilitydimensions
Performance dimension Cronbachrsquo alpha
Financial performance 08981Non-regnancial performance 08455
Source Own processing
Table VICronbachrsquos alphas for
performancedimensions
Serviceoperations
strategy
1411
index for covariance structure modelling Index value for this research is 0642which indicates a high probability that the model results are consistent withpopulation parameters
Analysis and resultsAccording to the aim of our analysis the technique of path analysis seems to bethe most adequate to empirically verify the hypothesis Such a techniqueestimates the magnitude of the linkages between the variables Through theseestimates it is possible to provide information about the underlying causalprocesses (Asher 1983) It also allows for distinguishing between direct andindirect effects in case there are compound paths Our path analysis model isrecursive as it assumes that there is no reciprocal causality in the form ofcausal feedback
For every path a beta coefregcient is calculated This coefregcientrsquos signindicates the direction of the relationship (positive or negative) and itsmagnitude represents the strength of the interrelationship between thevariables The path coefregcients identify direct and indirect effects of eachvariable on the respective dependent variables The total effect is simply thesum of the direct effect and all the indirect effects that occur throughintervening variables Tables VII and VIII report direct indirect total and
Dependent variable regnancial performanceDirect Indirect Total Spurious r
Independent variable (Op Strat Dim)Layout 0465 0312 0777 2 0043 0734PUSH orientation 0598 0291 0889 2 0017 0872Standardisation 0578 0324 0902 2 0083 0819Offered services 2 0522 2 0280 2 0802 0008 2 0794Use of IT 0623 0354 0977 2 0081 0896Back and front ofregce act 0528 0383 0911 2 0059 0852HR specialisation 0442 0372 0814 2 0040 0774Customer participation 2 0289 2 0165 2 0454495 0049 2 0405New services development 2 062 2 0247 2 0867 0077 2 079Dimensions of macrexibilityExpansion 2 0136 2 0136 0041 2 0095Inf distr 0098 0098 2 0013 0085Routing 0127 0127 0118 0245Equip and pers 2 0176 2 0176 0081 2 0095Market 2 0153 2 0153 0027 2 0126Prod and serv 2 0115 2 0115 0042 2 0073Proc prog and vol 2 0086 2 0086 0179 0093Standard R 2 0886F-ratio 35164
Notes n = 71 p 001 p 005 p 010Source Own processing
Table VIIDirect and indirecteffects of operationsstrategy dimensions onregnancial performance
IJOPM2311
1412
spurious effects of operations strategy dimensions on regnancial andnon-regnancial performance of the regrm
To test H1 and H2 the effects of operations strategy dimensions andmacrexibility on regnancial and non-regnancial performance were disaggregated intodirect indirect and spurious The following results were obtained
The direct effects of the operations strategy dimensions on regnancialperformance are positive and signiregcant (p 001) for all independentvariables (direct effects range from 0442 for human resourcesspecialisation to 0623 for the use of IT) except for offered services andnew services development for which direct effects are negative Customerparticipation is not signiregcant
All effects of macrexibility on regnancial performance are negative andsigniregcant (ranging from 2 0086 for process programming and volumemacrexibility ( p 005) to 2 0176 for equipments and personnel macrexibility( p 001)) except for information distribution and routing macrexibility forwhich effects are positive and signiregcant Indirect effects of operationsstrategy dimensions on regnancial performance through macrexibility as themediating variable are also high with values ranging from 2 01655 forcustomer participation to 0384 for back and front ofregce activities
Dependent variable non-regnancial performanceDirect Indirect Total Spurious r
Independent variable (Op Strat Dim)Layout 2 0486 2 0425 2 0911 0016 2 0895PUSH orientation 2 0365 2 0431 2 0796 2 0038 2 0835Standardisation 2 0405 2 0463 2 0868 0054 2 0814Offered services 0286 0337 0623 2 0115 0508Use of IT 2 0427 2 0481 2 0908 0080 2 0828Back and front ofregce act 2 0437 2 0509 2 0946 0134 2 0812HR specialisation 2 0403 2 0524 2 0927 0086 2 0841Customer participation 0114 0280 0394 2 0053 0341New services development 0337 0311 0648 0087 0736Dimensions of macrexibilityExpansion 0186 0196 0009 0206Inf distr 2 0073 2 0085 2 0019 2 0104Routing 0146 0158 0011 0169Equip and pers 0113 0127 001 0137Market 0115 0115 0014 0129Prod and serv 0082 0095 0018 0113Proc prog and vol 0041 0056 0022 0078Standard R 2 0932F-ratio 46415
Notes n = 71 p 001 p 005 p 010Source Own processing
Table VIIIDirect and indirect
effects of operationsstrategy dimensions on
non-regnancialperformance
Serviceoperations
strategy
1413
Direct effects of macrexibility dimensions on regnancial performance arenegative and signiregcant (ranging from 2 0086 for process programmingand volume macrexibility ( p 005) to 2 0176 for equipments and personnelmacrexibility ( p 001)) except for information distribution and routingmacrexibility for which effects are positive and signiregcant
Direct effects of operations strategy dimensions on non-regnancialperformance are on the other side negative and signiregcant for allindependent variables (values range from 2 0365 for PUSH orientation to2 0486 for layout) with the exception of the services offered customerparticipation and new services development for which direct effects arepositive and signiregcant
All direct effects of macrexibility on non-regnancial performance are positiveand signiregcant ranging from 0041 for process programming and volumemacrexibility to 0186 for expansion macrexibility ( p 001) except forinformation distribution for which direct effect is positive but notsigniregcant Indirect effects of operations strategy dimensions onnon-regnancial performance through macrexibility as the mediating variableare also high with values ranging from 2 05246 for human resourcesspecialisation to 0337 for services offered
Direct effects of macrexibility dimensions on non-regnancial performance arepositive and signiregcant (ranging from 0041 for process programmingand volume macrexibility ( p 001) to 0186 for expansion macrexibility( p 001)) except for information distribution macrexibility for which effectsare positive but not signiregcant
After performing the analysis H1 is contrasted totally and positively as alldirect effects of the operations strategy dimensions on regnancial performanceare higher than all indirect effects through macrexibility H2 is contrasted partiallyand positively as all direct effects of the operations strategy dimensions onnon-regnancial performance are lower than all indirect effects through macrexibilityexcept for layout and new services development dimensions Furthermore theindirect effects of the operations strategy dimensions on regnancial performanceare mostly positive while such effects are negative for non-regnancialperformance However this trend turns opposite for macrexibility whoseincidence is mostly negative on regnancial performance and positive onnon-regnancial performance
The r coefregcients calculated let us know the goodness in the model regt(Billings and Wroten 1978) Spurious explanation of the model is obtained bycomparing the r coefregcients with the total effects explained In this model thereare only four values higher than 010 (10 per cent of spurious explanation)These are routing and process programming and volume macrexibility forregnancial performance and services offered and back and front ofregce activitiesfor non-regnancial performance
IJOPM2311
1414
Contributions and conclusionsThis research provides several contributions to the regeld of service operationsmanagement for academicians and practitioners First based on the categoriesof structure and infrastructure decisions proposed by relevant servicemanagement literature this study operationalizes the concept of serviceoperations strategy By doing so new research opportunities broaden in orderto improve and adapt this concept to different environmental conditionsFuture operationalizations of the service operations strategy will requireadditional perspectives under a contingency analysis In additionheterogeneity of the service industries involves further attention according tocompetitive priorities In this context practitioners have a starting point tounderstand how functional decisions affect the different dimensions thatconreggure the operations strategy in services
Second a model of macrexibility in service industries has been appliedincluding some adaptations to the speciregc nature of service industries Thismodel is based on the classical manufacturing macrexibility frameworks Thisstudy examines this critical concept utilizing empirical methods within aregeld-based setting Still some dimensions show low moderate reliability sofuture research efforts may focus on improving and determining the exactinternal and environmental factors affecting service macrexibility according tospeciregc sector characteristics This can help practitioners in the process ofchoosing which dimensions of macrexibility better support strategic prioritiesSuch knowledge is especially relevant when related to regnancial decisions of ITinvestments and equipments as well as personnel training
Third this research proves that service operations strategy has a signiregcantpositive and direct effect on regnancial performance The results establish notonly the existence of strong links between the service operations strategy andregnancial performance but also the magnitude of the impact of every operationsstrategy dimension on every single performance dimension Nonetheless thegeneralization of these regndings to other service industries cannot beguaranteed without cautiousness even though the robust statistical resultsfor this relationship suggest that the regndings are quite reliable
Fourth understanding the effects of operations strategy on performance isone of the major regndings of this study The different strategy dimensionsinmacruence regnancial and non-regnancial performance in several manners It isespecially relevant to the fact that macrexibility dimensions inmacruence positively onnon-regnancial performance and negatively on the regnancial performance Henceinvestments on macrexibility lead to enhance the non-regnancial performance whilenegatively affecting the regnancial performance Therefore practitioners canbetter establish priorities for competition according to the expected relationshipbetween the operations strategy macrexibility and performance
Finally this research has based all regndings on the empirical methods ofanalysis supported by the regeld-based investigation to give support to concepts
Serviceoperations
strategy
1415
and relationships that seem reasonable in order to provide empiricalveriregcation The speciregc methodology of this study and the results suggestthat much of the conceptual efforts made in operations strategy formanufacturing may be applicable to service operations as well However thevariables and dimensions used to conreggure this study have been adapted to thespeciregc sector of the consulting engineering regrm which limits directapplication of the model to other service industries Further research efforts canhelp to determine to what extent the strategy macrexibility and performance relatein similar ways in heterogeneous service industries
Note
1 Even though service production and product-service are broadly used concepts we opted forthe general denomination of services combined with the servuction term
References
Abernethy MA and Lillis AM (1995) ordfThe impact of manufacturing macrexibility onmanagement control system designordm Accounting Organizations and Society Vol 20pp 241-58
Adam E Jr and Swamidass P (1989) ordfAssessing operations management from a strategicperspectiveordm Journal of Management Vol 15 No 2 pp 181-203
Adler PS (1988) ordfManaging macrexible automationordm California Management Review Vol 30 No 2pp 34-56
AAcirc lvarez Gil MJ (1994) ordfCapital budgeting and macrexible manufacturingordm International Journal ofProduction Economics Vol 36 pp 109-28
Anderson JC Cleveland G and Schroeder RG (1989) ordfOperations strategy a literaturereviewordm Journal of Operations Management Vol 8 No 2 pp 1-26
Arias-Aranda D (2002) ordfRelationship between operations strategy and size in engineeringconsulting regrmsordm International Journal of Service Industry Management Vol 13 No 3pp 263-85
Arias-Aranda D Minguela Rata B and RodrotildeAcircguez Duarte A (2001) ordfInnovation and regrm sizean empirical study for Spanish engineering consulting companiesordm European Journal ofInnovation Management Vol 4 No 3
Armistead CG (1992) ordfIntroduction to service operationsordm in Voss C Armistead C JohnstonB and Morris B (Eds) Operations Management in Service Industries and The PublicSector Wiley NJ
Asher HB (1983) Causal Modeling Sage Publications Beverly Hills CA
Berry LL and Parasuraman A (1997) ordfListening to the customer plusmn the concept of aservice-quality information systemordm Sloan Management Review Vol 38 No 3 pp 65-76
Billings RS and Wroten SP (1978) ordfUse of path analysis in industrialorganizationalpsychology criticisms and suggestionsordm Journal of Applied Psychology Vol 63 No 6pp 677-88
Bowen DE and Lawler EE III (1995) ordfEmpowering service employeesordm Sloan ManagementReview Summer
Bowen DE and Youngdahl WE (1998) ordf`Leanrsquo service in defense of a production-lineapproachordm International Journal of Service Industry Management Vol 9 No 3 pp 207-25
IJOPM2311
1416
Brill P and Mandelbaum C (1989) ordfOn measures of macrexibility in manufacturing systemsordmInternational Journal of Production Research Vol 27 No 5 pp 747-56
Browne J Dubois K Rathmill SP Sethi P and Stecke KE (1984) ordfClassiregcation of macrexiblemanufacturing systemsordm The FMS Magazine Vol 2 No 1 pp 747-56
Browne M and Cudeck R (1993) Alternative Ways of Assessing Model Fit Kluwer PublishingDordrecht
Brownell P and Merchant KA (1990) ordfThe budgetary and performance inmacruences of productstandarizations and manufacturing process automationordm Journal of Accounting ResearchVol 2 pp 388-97
Bucki J and Pesqueux Y (2000) ordfFlexible workshop about the concept of macrexibilityordmInternational Journal of Agile Management Systems Vol 2 No 1 pp 62-70
Carter MF (1986) ordfDesigning macrexibility into automated manufacturing systemsordm in SteckeKE and Suri R (Eds) Proc 2nd ORSARIMS Conference in Flexible ManufacturingSystems Operations Research Model and Applications Ann Arbor Elsevier SciencePublishers Amsterdam pp 107-118
Chambers S (1992) ordfFlexibility in the context of manufacturing strategyordm in Voss CA (Ed)Manufacturing Strategy Process and Content Chapman and Hall London
Chatterjee A Cohen M Maxwell W and Miller R (1984) ordfManufacturing macrexibility modelsand measurementsordm Proceedings of the 1st ORSATIMS Conference on FMS Ann ArborMI pp 49-64
Chenhall R (1995) ordfReliance on manufacturing performance measures total qualitymanagement and organisational performance an empirical investigationordm paperpresented at University of New South Wales Sydney
Chung CH and Chen IJ (1990) ordfManaging macrexibility of macrexible manufacturing systems forcompetitive edgeordm in Liberatore MJ (Ed) The Selection and Evaluation of AdvancedManufacturing Technologies Springer-Verlag Berlin pp 280-305
Collier DA (1994) The Service-Quality Solution Using Service Management to Gain CompetitiveAdvantage Irwin IL
Collier DA (1996) ordfTight and loose comprehensive customer contact (3C) plansordm Advances inService Marketing and Management Vol 5 JAI Press Greenwich CT pp 153-68
Cusumano M (1988) ordfShifting economies craft production to the macrexible factoryordm WorkingPaper 2012-88 Sloan School of Management MIT Cambridge MA
Dangayash GS and Deshmukh SG (2001) ordfManufacturing strategy literature review andsome issuesordm International Journal of Operations and Production Management Vol 21No 7 pp 884-932
Desatnik R (1994) ordfManaging customer service for the 21st centuryordm Journal for Quality andParticipation Vol 17 pp 30-6
Duclos LK Siha SM and Lummus RR (1995) ordfJIT in services a review of current practicesand future directions for researchordm International Journal of Service Industry ManagementVol 6 No 5 pp 36-52
Falkner CH (1986) ordfFlexibility in manufacturing plantsordm Proceedings of the SecondORSATIMS Conference on Flexible Manufacturing Systems Elsevier New York NY
Feigenbaum A and Karnani A (1991) ordfOutput macrexibility a competitive advantage for smallregrmsordm Strategic Management Journal Vol 12 pp 101-14
Flynn B Sakakibara S Schroeder R Bates K and Flynn J (1995) ordfEmpirical researchmethods in operations managementordm Journal of Operations Management Vol 9 No 2pp 250-84
Serviceoperations
strategy
1417
Gaimon C and Singhal V (1992) ordfFlexibility and the choice of manufacturing facilities undershort product life cyclesordm European Journal of Operational Research Vol 60 No 2pp 211-23
Gerwin D (1987) ordfAn agenda for research on the macrexibility of manufacturing processesordmInternational Journal of Operations amp Productions Management Vol 7 No 1 pp 38-49
Gerwin D (1993) ordfManufacturing macrexibility a strategic perspectiveordm Management ScienceVol 39 No 4 pp 395-410
Ghalayini AM and Noble JS (1996) ordfThe changing basis of performance measuresordmInternational Journal of Operations and Productions Management Vol 16 No 8 pp 63-80
Gouillart F and Sturdivant F (1994) ordfSpend a day in the life of your customersordm HarvardBusiness Review pp 116-25
Govindarajan VA (1988) ordfA contingency approach to strategy implementation at thebusiness-unit level integrating administrative mechanisms with strategyordm Academy ofManagement Journal Vol 28 pp 828-53
Gupta YP and Goyal S (1992) ordfFlexibility tradeoffs in a macrexible manufacturing system asimulation studyordm International Journal of Production Research Vol 30 No 3 pp 527-57
Gupta YP and Somers TM (1992) ordfThe measurement of manufacturing macrexibilityordm EuropeanJournal of Operational Research Vol 60 pp 166-82
Gupta YP and Somers TM (1996) ordfBusiness strategy manufacturing macrexibility andorganizational performance relationships a path analysis approachordm Production andOperations Management Vol 5 No 3 pp 204-31
Gustavsson S (1988) ordfFlexibility and productivity in complex processesordm International Journalof Production Research Vol 22 No 5 pp 801-8
Hammer M and Champy J (1993) Reengineering the Corporation HarperBusiness New YorkNY
Hart CWL (1995) ordfMass customization conceptual underpinnings opportunities and limitsordmInternational Journal of Service Industry Management Vol 6 No 2 pp 36-45
Harvey J Lefebvre LA and Lefebvre E (1997) ordfFlexibility and technology in services aconceptual modelordm International Journal of Operations amp Production Management Vol 17No 21 pp 29-45
Hayes RH Wheelwright SC and Clark K (1988) Dynamic Manufacturing Creating theLearning Organization Free Press New York NY
Haynes RM and Du Vall PK (1992) ordfService quality management a process controlapproachordm International Journal of Service Industry Management Vol 3 No 1 pp 14-24
Ho C (1996) ordfA contingency theoretical model of manufacturing strategyordm International Journalof Operations amp Production Management Vol 16 No 5 pp 74-98
Hyun J and Ahn B (1990) ordfFlexibility revisited review unifying frameworks and strategicimplicationsordm mimeo Korean Advanced Institute of Science and Technology Seoul
Jaikumar R (1986) ordfPostindustrial manufacturingordm Harvard Business Review Vol 64 No 6pp 69-76
Johnston R (1994) ordfOperations from factory to service managementordm International Journal ofService Industry Management Vol 5 No 1 pp 49-63
Kaplan RS (1983) ordfMeasuring manufacturing performance a new challenge for managementaccounting researchordm Accounting Review Vol 58 pp 686-705
IJOPM2311
1418
Kumar V (1986) ordfOn measurement of macrexibility in macrexible manufacturing systems aninformation-theoretic approachordm Proceedings of the 2nd ORSATIMS Conference onFlexible Manufacturing Systems Elsevier New York NY
Leong GK Snyder DL and Ward PT (1990) ordfResearch in the process and content ofmanufacturing strategyordm OMEGA International Journal of Management Science Vol 18No 2 pp 109-22
Lusch R Boyt T and Schuler D (1996) ordfEmployees as customers the role of social controlsand employee satisfaction in developing patronageordm Journal of Business Research Vol 35pp 239-52
McCutcheon DM Raturi AS and Meredith JR (1994) ordfThe customisation-responsivenesssqueezeordm Sloan Management Review Winter pp 89-99
Mills J Neely A Platts K and Gregory M (1998) ordfManufacturing strategy a pictorialrepresentationordm International Journal of Operations amp Production Management Vol 18No 11 pp 1067-85
Nayyar PR (1992) ordfPerformance effects of three foci in service regrmsordm Academy of ManagementJournal Vol 35 No 5 pp 985-1009
Neely A Richards H Mills J Platts K and Bourne M (1997) ordfDesigning performancemeasures a structural approachordm International Journal of Operations and ProductionManagement Vol 17 No 11 pp 1131-52
Newman WR Hanna M and Maffei MJ (1993) ordfDealing with the uncertainties ofmanufacturing macrexiblity buffers and integrationordm International Journal of Operations ampProduction Management Vol 13 No 1 pp 19-34
Nieto AntolotildeAcircn M Arias Aranda D Minguela Rata B and RodrotildeAcircguez Duarte A (1999) ordfTheevolution of operations management contents an analysis of the most relevant textbooksordmIndustrial Management amp Data Systems Vol 99 No 78 pp 345-53
Noori H and Radford R (1995) Production and Operations Management McGraw-Hill NewYork NY
Normann R (1984) Service Management Wiley New York NY
Nunnally J (1978) Psychometric Theory McGraw-Hill New York NY
Ramasesh RV and Jayakumar MD (1991) ordfMeasurement of manufacturing macrexibility a valuebased approachordm Journal of Operations Management Vol 10 No 4 pp 446-68
Riley M and Lockwood A (1997) ordfStrategies and measurement for workforce macrexibility anapplication of functional macrexibility in a service settingordm International Journal ofOperations and Production Management Vol 17 No 4 pp 413-9
Saregzadeh MH Ritzman LP and Mallick D (2000) ordfRevisiting alternative theoreticalparadigms in manufacturing strategyordm Production and Operations Management Vol 9No 2 pp 111-27
Sampson SE (1996) ordfRamiregcations of monitoring service quality through passively solicitedcustomer feedbackordm Decision Sciences Vol 27 No 4 pp 601-21
Schmenner RW (1986) ordfHow can service businesses survive and prosperordm Sloan ManagementReview Vol 27 No 3
Schwab D (1980) ordfConstruct validity in organizational behaviourordm Research in OrganizationalBehaviour Vol 2 No 1 pp 3-43
Sethi AK and Sethi SP (1990) ordfFlexibility in manufacturingordm International Journal of FlexibleManufacturing Systems Vol 2 No 4 pp 289-328
Serviceoperations
strategy
1419
Simons R (1987) ordfAccounting control systems and business strategy an empirical analysisordmAccounting Organizations and Society Vol 12 pp 357-74
Skinner W (1969) ordfManufacturing plusmn missing link in corporate strategyordm Harvard BusinessReview May-June pp 136-45
Skinner W (1978) Manufacturing in the Corporate Strategy Wiley New York NY
Slack N (1987) ordfThe macrexibility of manufacturing systemsordm International Journal of Operationsamp Production Management Vol 7 No 4 pp 35-45
Smith TM and Reece JS (1999) ordfThe relationship of strategy regt productivity and businessperformance in a services settingordm Journal of Operations Management Vol 17 pp 145-61
Son YK and Park CS (1987) ordfEconomic measure of productivity quality and macrexibility inadvanced manufacturing systemsordm Journal of Manufacturing Systems Vol 6 No 3pp 193-206
Spanish Ministry of Industry (1998) ordfEl sector de la IngenierotildeAcirca Civil en EspanAumlaordm Ed Ministeriode Fomento
Spina G Bartezzaghi E Bent A Cagliano R Draaijer D and Boer H (1996) ordfStrategicallymacrexible production the multi-focused manufacturing paradigmordm International Journal ofOperations amp Production Management Vol 16 No 11 pp 20-41
Srinivasan A (1985) ordfAlternative measure of system effectiveness associations andimplicationsordm MIS Quarterly Vol 9 No 3 pp 243-53
Suarez FF Cusumano MA and Fine CH (1996) ordfAn empirical study of manufacturingmacrexibility in printed circuit board assemblyordm Operations Research Vol 44 No 1pp 223-40
Swamidass PM and Newell WT (1987) ordfManufacturing strategy environmental uncertaintyand performance a path analytic modelordm Management Science Vol 33 No 4 pp 509-24
Swink M and Way MH (1995) ordfManufacturing strategy propositions current researchrenewed directionsordm International Journal of Operations amp Production ManagementVol 15 No 7 pp 4-26
Taymaz E (1989) ordfTypes of macrexibility in a single machine production systemordm InternationalJournal of Production Research Vol 27 No 11 pp 1891-9
Tersine R and Harvey M (1998) ordfGlobal customerization of markets has arrivedordm EuropeanManagement Journal Vol 16 No 1 pp 79-90
Tombak MM (1988) ordfThe importance of macrexibility in manufacturingordm WhartonPIMSResearch Center Working Paper No 89-002 Philadelphia PA
Tombak M and De Meyer A (1988) ordfFlexibility and FMS an empirical analysisordm IEEETransactions on Engineering Management Vol 35 pp 101-7
Upton DM (1995) ordfWhat really makes factories macrexibleordm Harvard Business Review pp 74-84
Vandermerwe S (1992) ordfThe power is in the service because the value is in the resultordm inLovelock CH (Ed) Managing Services 2nd ed Prentice-Hall Englewood Cliffs NJpp 298-309
Walton R and Susman G (1987) ordfPeople policies for the new machinesordm Harvard BusinessReview Vol 66 No 2 pp 98-106
Wheelwright SC (1984) ordfManufacturing strategy deregning the missing linkordm StrategicManagement Journal Vol 5 pp 77-91
IJOPM2311
1420
AppendixThe indicator was designed as follows
Ebn =5
Pbi=a Ain 2
Pdi=c Ain
plusmn sup2+
Pdi=c Ain 2 5
Pbi=a Ain
plusmn sup2shyshyshyshyshyshy+ 1
h i
5Pb
i=a Ain 2Pd
i=c Ain
plusmn sup2shyshyshyshyshyshy+
Pdi=c Ain 2 5
Pbi=a Ain
plusmn sup2shyshyshyshyshyshy+ 1
h i
where Ebn is the indicator Ain is the score obtained in question i of block n in the questionnaireRank [ab ] represents questions scoring towards one of the trends in each block
Rank [cd ] represents questions scoring towards opposite extremes of rank [ab ] in eachblock
Hence
Xd
i=c
Ain 2 5Xb
i= a
Ain
Aacute
represents the smallest reachable value considering that one regrm scores the highest (score 5) inall questions for one of the trends and the smallest (score 1) in all questions of the opposite trendOn the other hand
5Xb
i=a
Ain 2Xd
i=c
Ain
Aacute
represents the smallest reachable value for a regrm positioned at one extreme scoring the smallest(score 1) and the highest (score 5) for the opposite trends Once the extremes and possibleintermediate values have been obtained the indicator transforms this rank in a scale from 0 to 5by adding to the value obtained the smallest reachable value plus one The value obtained isregnally divided by the highest reachable value adding the smallest value plus one in order tomake the scale positive Finally the value obtained is multiplied by regve to regt it to the 1 - 5 scale
Serviceoperations
strategy
1421
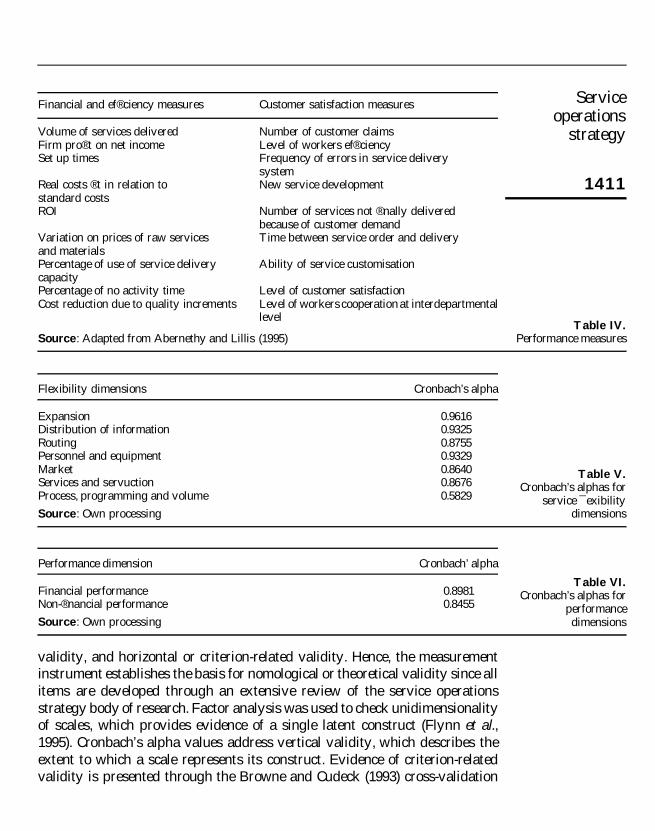