service life of repaired concrete bridge decks - diva …8589/fulltext01.pdf · service life of...
TRANSCRIPT

Service Life of Repaired ConcreteBridge Decks
Jonatan Paulsson-Tralla
Department of Structural EngineeringRoyal Institute of Technology
SE-100 44 Stockholm, Sweden
Akademisk avhandling
Som med tillstånd av Kungl Tekniska Högskolan i Stockholm framlägges tilloffentlig granskning för avläggande av teknologie doktorsexamen fredagen den29 oktober 1999 kl 10.00 i Kollegiesalen, Valhallavägen 79, Stockholm.Avhandlingen försvaras på engelska.
Fakultetsopponent: Professor George SomervilleHuvudhandledare: Biträdande professor Johan Silfwerbrand
TRITA-BKN. Bulletin 50, 1999ISSN 1103-4270ISRN KTH/BKN/B—50—SE
Stockholm 1999

ABSTRACT
Pre-mature deterioration of reinforced concrete causes problems world-wide and the search forreliable cost effective and environmental friendly repairs is intense. The service life of the repairedstructure is important in order to establish the annual cost and environmental impact for differentalternatives. This doctoral thesis focuses on the service life of concrete bridge decks repaired withbonded concrete overlays. The approach was broad and based on the performance of a number ofbridge decks after approximately ten years in service. The main aims were to establish the overallservice life and to improve the design where improvements were needed. Efforts have been madeto make the repairs as robust as possible and the crucial production stage is always considered.The following parameters were investigated:
• Wear and rutting• Bond strength and extent and cause of cracks• Relative humidity and temperature in the deck• Freeze-thaw resistance and number of freeze-thaw cycles• Concrete cover and service life criterion with respect to chloride initiated corrosion• Service life predictions using moving boundary theory• Chloride concentrations in de-icing water and in the surfaces of concrete overlays• Absorption of water and chloride ions due to capillary suction of de-icing water• Chloride ingress in solid and cracked parts of bonded concrete overlays
The wear and rutting were found to be limited. The bond between new and old concrete wasunaltered or increased after ten years in service. The cracking on the overlays was generallylimited. The main cracking causes were insufficient curing and reflective cracking due toconstruction joints (cold casting joints) in the old bridge deck. The cracks can be avoided or madenon-hazardous with respect to corrosion and freeze-thaw damages with simple measures.
The chloride ingress was low in solid and limited in cracked parts of the overlay. Samples ofconcrete, snow, slush and water were taken from the overlay during two years to quantify thechloride concentrations and their variations. The chloride concentration interacted with theweather, the local climate and the salt-spreading procedures. The chloride content in the overlayswas affected to at least 10 mm from the surface.
The relative humidity in the overlay was stable and low at approximately 20 mm from the wearsurface. The number of (salt)-freeze-thaw cycles was high. The thickness of the overlays wasfound to be fairly normal distributed and this was used in the service life predictions.
The moving boundary method is suitable to predict the ingress of a chloride threshold value. Themethod is easy to use with a probabilistic approach and simple and cheap to update and noparameters have to be guessed. Numerical methods were also used and the influence of varioussurface concentrations was investigated. The transport of chloride ions into cracked concrete wastreated with a two dimensional model and the influence of crack depth was found to be limited.
Both conventional capillary absorption tests and cyclic wetting and drying test out-doors wereconducted on mature concrete cast and aged in-situ. The conclusion was that capillary suction ofde-icing water could be the dominating factor in the chloride absorption process.
Key words: Repairs, bridge decks, bonded concrete overlays, service life, chloride ingress.


1
SUMMARY
Pre-mature deterioration of reinforced concrete structures causes problems and costs world-wide. The search for reliable costeffective and environmental friendly repair techniques is, therefore, intense. The service life of the repaired structure is offundamental importance in order to establish the annual cost (and environmental impact) for different techniques. The thesisfocuses on service life predictions of repaired Concrete Bridge Decks (CBD). The work is partly based on major field-testsconducted in 1995 and between 1996 and 1998. The main aims were to establish the overall service life of the repaired concretebridge decks and to improve the design where (if) improvements were needed. Efforts have been made to make the repairmethod as robust and reliable as possible. The production stage is, therefore, always considered in the conclusions andrecommendations.
The following parameters were investigated:• Wear and rutting• Bond strength and compressive strength• Extent and cause of cracks• Relative humidity and its distribution in the deck• Temperature and its distribution in the deck• Freeze-thaw resistance and number of freeze-thaw cycles• Concrete cover• Service life criterion with respect to chloride initiated corrosion• Service life predictions using moving boundary theory• Chloride concentrations in de-icing water and in the surfaces of concrete overlays• Absorption of water and chloride ions due to capillary suction of de-icing water• Chloride ingress in solid and cracked parts of bonded concrete overlays
Comprehensive sampling (130 cores) was conducted on seven concrete bridge decks repaired with bonded concrete overlays inthe mid-eighties. The wear and rutting were measured regularly between 1987 and 1995 on four of the bridges and were found tobe limited. The bond between new and old concrete was good and was unaltered or improved after ten years in service.
The cracking on the overlays was generally limited. The main causes were insufficient curing and reflective cracking due toconstruction joints (cold casting joints) in the old bridge deck. The cracks can be avoided or made non-hazardous with respectto corrosion and freeze-thaw damages with simple measures.
More than 140 so called chloride profiles were analysed from both solid and cracked parts of the overlays. Extensive samplingwas also conducted regularly during two years on a concrete bridge decks (flat slab) repaired with bonded concrete overlays.Over 300 samples of concrete, snow, slush and water were taken from the surface of the overlay to evaluate the chlorideconcentrations and their variations during the years. Chloride and moisture profiles were also established by field-testing.
The concrete flat slab was also monitored with temperature and relative humidity sensors between 1996 and 1999. The moistureand temperature state in both the bonded overlay and in the old concrete bridge deck were measured and used to establish thenumber of freeze-thaw cycles and salt-freeze-thaw cycles.
The concrete covers (height of the overlays) and their distribution were established for every bridge and used in the service lifepredictions. The heights of the overlays were found to be fairly normal distributed. The service life criterion for chloride initiatedcorrosion was also discussed partly from a structural view. Different service life criteria were established for different structuralelements.
The moving boundary theory was proposed and used in order to predict the chloride ingress in the interior parts of solidconcrete. The overall result was that the moving theory method was suitable to predict the ingress of a chosen chloridethreshold value and that it could easily be used with a probabilistic approach. The method was easy to understand, simple andcheap to update and no parameters had to be guessed. The only input needed was approximately six chloride profiles where thedistance to the threshold value had been established carefully and the age of the concrete. The method does not need dataabout the temperature, the precipitation, the use of de-icing agents, the composition of the concrete and the porosity etc. Theneed for such a method is today large especially for old structures where the needed data often are lacking and expensive toobtain.
The chloride concentration in the surface water and in the concrete surface interacted with the weather, the local climate and thesalt-spreading procedures. The chloride concentration in the concrete surface increased rapidly when it was covered with achloride contaminated slush and decreased rapidly when rinsed with precipitation.

2
Capillary suction of de-icing water has been suggested by researches as a strong contributor to the chloride ingress in de-icingenvironments. Both conventional capillary absorption tests and cyclic wetting and drying test out-doors were conducted onmature concrete cast, cured and aged in-situ in order to quantify the amount of water that may be transported in and out ofconcrete during cyclic wetting and drying. This information was used with the measured chloride content in the de-icing wateron wear surfaces to quantify the amount of chloride ions that may penetrate into concrete through absorption of de-icing water.The conclusion was that capillary suction of de-icing water could be the dominating factor.
Chloride profiles were also obtained in the spring and in the autumn of 1998 from the same bridge at the same locations were thesamples for the surface concentrations were taken. Chloride ions were clearly transported from the concrete overlay due to therinsing of precipitation during the summer and autumn. The chloride content in the overlays was affected (decreased) to at least10 mm from the surface.
Numerical methods were used with Fick’s second law of diffusion in order to predict the chloride ingress in solid and crackedconcrete overlays. The influence of various surface concentrations was investigated. The surface concentrations used hadbeen established through the field tests. The chloride ingress differed using different surface concentrations but the differencesdecreased with time. The influence of chloride ions present in the old water-jetted CBD was also evaluated with the numericalmethod and found to be small. The influence of the thickness of the overlay and the old concrete bridge deck were examined tooand the former had large and the latter small influence on the chloride ingress.
The two dimensional transport of chloride ions into cracked concrete was treated with a two dimensional model using anumerical method. The influence of crack depth on the service life was evaluated briefly and found to be limited. However, if thediffusion coefficient was high in the old concrete, the effect of a crack was increased significantly.
Alternative repair materials were also discussed. Stainless steel may be a robust and reliable cost-effective solution for bondedconcrete overlays.
Future research is needed in several fields and stainless steel and active maintenance are two of the more promising. The lattercould for example be use of hydrophobic treatment and rinsing of structures (at least sensitive details) at several occasionsduring the de-icing seasons.

3
SAMMANFATTNING
Förtida nedbrytning av armerade betongkonstruktioner orsakar problem och kostnader över hela världen. Sökandet eftertillförlitliga, kostnadseffektiva och miljöanpassade reparationsmetoder är därför intensivt. Att kunna prediktera livslängd för enreparerad struktur är avgörande för att kunna uppskatta årlig kostnad och miljöbelastning för olika reparationsalternativ.Föreliggande avhandling fokuserar på livslängden hos reparerade brofarbanor av betong. Farbanorna repareras medvattenbilning och pågjuten betong. Arbetet är baserat på omfattande provtagningar på olika broar under flera år. Huvudsyftenamed avhandlingen är dels att prediktera den övergripande livslängden hos de reparerade brofarbanorna, dels att förbättrautformningen av reparationerna där (om) det behövdes. Stor möda är nedlagd för att få reparationstekniken så robust ochtillförlitlig som möjligt. Produktionen är därför alltid beaktad i konklusioner och rekommendationer.
Följande parametrar undersöktes:
• Slitage och spårdjup• Vidhäftning mellan gammal brofarbana och slitbetong• Tryckhållfasthet hos slitbetongen• Utbredning och orsaker till eventuell sprickbildning i slitbetongen• Relativ fuktighet och dennas fördelning i slitbetong och gammal farbana• Temperatur och dess fördelning över tvärsnittet• Frostbeständighet och antal frostcykler i verkligheten• Slitbetongens tjocklek (täckande betongskikt) och dess fördelning• Kriterier för kloridinitierad korrosion• Livslängdsbestämning med den så kallade ”Moving boundary”-metoden• Kloridkoncentrationer i tösaltningsvatten och i ytan på slitbetongen• Absorption av vatten och klorider genom kapillärsugning av tösaltningsvatten• Kloridinträngning i spruckna och ospruckna delar av slitbetongen
Slitage
Omfattande mätningar företogs såväl vid reparationerna av brofarbanorna i mitten på 1980-talet som 1995. Slitage och spårdjupmättes regelbundet mellan 1987 och 1995. Såväl slitage som spårdjup var begränsade och slitbetongerna befanns ha tillräckligslitstyrka. På broar med stor trafikmängd, smala körfält och olika färger hos den slitstarka ballasten och cementpastan kan djupaspår (20 mm) bildas efter tio år (40 miljoner fordon). Det finns flera enkla metoder för att förhindra att djupa spår bildas eller föratt reparera redan befintliga spår. Användandet av vit (grå) slitstark ballast, breda körfält, sidoförflyttning av trafiken ochtillsatser av silika minskar spårdjupen markant.
Att skapa och bibehålla jämna övergångar mellan väg och bro är viktigt för att minska påkänningarna (främst utmattning) i broar.Övergångskonstruktionerna, inklusive en anslutande vägsträcka vars längd beror på trafikhastigheten, måste ses över med tätaintervall.
Vidhäftning och tryckhållfasthet
Vidhäftningen mellan slitbetong och gammal betong är helt avgörande för konstruktionens funktion. Den vattenbilade ytan skallrengöras noggrant både efter vattenbilningen och precis innan slitbetongen appliceras. Rengöringen är en absolut förutsättningför att god vidhäftning skall uppnås. Provningen visade att vidhäftningen är oförändrad eller något förbättrad efter tio år. Viddragprovningen sker brotten nästan uteslutande i den gamla betongen. Det finns inga tecken på utmattning av vidhäftningen.Tryckhållfastheten hos slitbetongerna hade ökat och ökningen var störst för de slitbetonger som inte innehöll silika.
Sprickor
Slitbetongytorna sprickkarterades dels för att bestämma omfattningen av sprickorna, dels klargöra orsakerna till sprickorna (ommöjligt). Generellt uppvisade slitbetongerna låg eller begränsad uppsprickning. De flesta av sprickorna var krympsprickor vilkauppstått under de tio första dagarna efter det att slitbetongen applicerats. Dessa sprickor kunde ha undvikits om

4
produktionsmetoderna hade korrigerats något. Vattenhärdning med hjälp av vattendimma till dess att slitbetongen tålkonventionell vattenhärdning rekommenderas. Tält eller andra skyddande åtgärder bör också övervägas för att skyddaslitbetongen från regn (eller uttorkning) innan ytan uppnått tillräcklig hållfasthet.
Förutom krympsprickor i tidig ålder orsakade i vissa fall konstruktionsfogar och sprickor i den gamla betongenreflektionssprickor i slitbetongen. Dessa sprickor kan med rätt utformning av reparationen undvikas och/eller göras ofarliga iframtiden. Om samtliga krymp- och reflektionssprickor lämnas därhän är det kvarvarande antalet sprickor lågt ochuppsprickningen ofarlig.
Frostbeständighet
Pågjutningarna uppvisade god eller mycket god frostbeständighet. Frostbeständigheten hos pågjutningarna var oförändradeller förbättrad efter tio år i en saltrik miljö. Det fanns inga spår efter saltfrostavskalningar hos pågjutningarna.
Klorider
Över 140 kloridprofiler analyserades. Kloridinträngningen var låg i ospruckna delar och begränsad i spruckna delar avslitbetongen efter tio års exponering i tösaltad miljö och slitbetongerna har motstått kloridinträngningen väl. Det finns ingen riskför klorid- eller karbonatiseringsinitierad korrosion hos armeringen i den gamla betongen, förutom vid några få djupa krymp- ellerreflektionssprickor. Livslängden kan dock relativt enkelt förlängas om de djupa sprickorna impregneras eller repareras med hjälpav någon av de lågviskösa reparationsmaterial som finns tillgängliga idag.
Relevanta beskrivningar av mikroklimatet (randvilkor) på betongytor i tösaltad miljö saknas i stor utsträckning. För attkvantifiera kloridkoncentrationer i tösaltningsvatten, snö, slask och i betongytor togs över 300 prover i täta intervall under tvåår vid tre olika mätområden på Gullmarsplans trafikplats (pelardäck av betong). Skillnaderna mellan de tre mätområdena med olikamikroklimat vara stora. Kloridkoncentrationerna ökade när tösalter användes och minskade efter regn- ochsnösmältningsperioder. Det värsta miljön infann sig under långa perioder med kall väderlek (-10 °C) och snöfall då snö ochtösalter bildade en ”smet” med höga kloridkoncentrationer som låg kvar på slitytorna.
Kloridprofiler togs även under vår och höst 1998 på samma plats som vissa ytprover tagits. Kloridinnehållet i betongenminskade under vår, sommar och höst på grund av den sköljande effekten av regn och smältvatten. Ursköljningen varsignifikant till ett djup av åtminstone 10 mm från ytan.
Fukt
Pelardäcket instrumenterades med givare för att mäta temperatur och relativ fuktighet i tio olika mätpunkter med en timmesintervall mellan 1996 och 1999. Den relativa fuktigheten i nivå med underkantsarmeringen varierade cykliskt mellan 88 %(sommar) och 92 % (vinter) vilket innebär att korrosionshastigheten bör vara hög om korrosion initieras. Propageringsfasen hardärför negligerats vid livslängdsbestämningarna. Antalet frostcykler och saltfrostcykler räknades och fanns vara ca 20 per år.
Täckskikt och tröskelvärde
Slitbetongens höjd (täckande betongskikt) och fördelning mättes på samtliga broar. Normalfördelningen fanns vara en godapproximation. Kriteriet för kloridinitierad korrosion diskuterades med hänsyn till strukturernas statiska verkningssätt och olikakriterier användes för olika typer av broar.
Den så kallade moving boundary-metoden prövades för att prediktera inträngningen av ett kloridtröskelvärde i de inre delarnaav slitbetongen. Resultatet visar preliminärt att metoden kan användas och att ett sannolikhetsbaserat angreppssätt enkelt kanimplementeras. Metoden är lätt att förstå, enkel och billig att uppdatera och inga parametrar behöver ”gissas”. Den endainformation som behövs är ca sex kloridprofiler där avståndet från ytan till det valda tröskelvärdet har bestämts noggrant.Metoden behöver inte data kring temperatur, nederbörd, tösaltanvändning, betongrecept och porositet. Behovet för en sådanmetod är stort idag, speciellt för äldre strukturer, där information ofta saknas och/eller är dyr att ta fram.
Kloridinträngning genom kapillärsugning
Kapillärsugning av tösaltningsvatten har av flera forskare framförts som starkt bidragande till kloridinträngningen i tösaltadmiljö. Både konventionella kapillärsugningsförsök och försök med cyklisk torkning och kapillärsugning utomhus under höst ochvinter utfördes med gammal betong med låga vbt. Betongen hade gjutits och åldrats utomhus. Syftet var att kvantifierasmängden (tösaltnings)vatten som kan absorberas av slitbetongen under relevanta förhållanden. Denna information användestillsammans med de uppmätta kloridkoncentrationerna i tösaltningsvattnet på Gullmarsplans trafikplats för att beräkna mängden

5
klorider som kan tas upp till följd av kapillärsugning utomhus. Huvudkonklusionen var att kapillärsugning kan vara dendominerande mekanismen för kloridinträngning utomhus. Inomhus (parkeringshus) påskyndades absorptionen markant.
Numerisk beräkning av kloridinträngning
Numeriska metoder användes tillsammans med Ficks andra lag för att prediktera kloridinträngning i såväl sprucken somosprucken betong. Olika typer av tidsberoende ytkoncentrationer användes men generellt var effekten av tidsberoenderandvillkor liten efter ca 40 år. Inverkan av befintliga klorider i den gamla betongen undersöktes också med numeriska metoderoch brfanns vara liten. Inverkan av tjockleken på slitbetongen och det befintliga brobanedäcket undersöktes också och denförra brfanns ha stor inverkan och den senare liten inverkan på kloridinträngningen.
Kloridinträngning i delvis sprucken slitbetong behandlades med tvådimensionella finita differenser. Inverkan av sprickdjupetundersöktes och befanns vara måttlig om sprickan inte propagerat genom hela slitbetongen. Inverkan av sprickor ökade markantom diffusions-koefficienten var hög i den gamla betongen.
Alternativa reparationsmetoder
Alternativa utformningar av reparationen diskuteras också. Rostfri armering är idag ett tillförlitligt och kostnadseffektivtalternativ.
Planerat underhåll
Reparationens utformning och underhållsinsatserna måste vara förenliga för att hela potentialen hos reparationen skall kunnatillgodogöras och därigenom minska kostnaderna och miljöbelastningen för att hålla strukturen i drift. Framtida underhåll bör(och kan) förutses redan i projekteringsfasen för att man redan där skall kunna förbereda för dessa. Förslag på framtidareparationers utformning kan också skisseras. All information rörande bron bör dokumenteras och arkiveras i en servicebok.Orsak, filosofi, metod och provresultat (vad, var, hur, varför, resultat och slutsats) från reparationen (nybyggnationen) bördokumenteras för framtida användning.
Slitbetongerna har fungerat väl. De flesta av skadorna (sprickorna) kan lätt repareras och framförallt undvikas på framtida objekt.Reparationsmetoden med vattenbilning och pågjutning av betong är sund, pålitlig, snabb och kostnadseffektiv.Miljöbelastningen bör vara begränsad om det löpande underhållet sköts väl.
Fortsatt forskning
Fortsatt forskning behövs på flera områden för armerade betongkonstruktioner. Användning av rostfritt stål och aktivtunderhåll är två intressanta områden. Det senare inkluderar användning av hydrofobisk behandling och frekvent spolning(automatisk eventuellt) av utsatta konstruktionsdelar under tösaltningssäsongen.
CONTENT OF THE THESIS
The thesis comprises the following nine papers:
1. Andersen, A., & Paulsson, J., (1997), “Measurements on seasonal and diurnal variations of environmental conditionssurrounding a heavily trafficked bridge structure”, Proceedings, International Conference on Repair of Concrete Structures,Svolvaer, Norway, May 28-29, 1997, pp. 144-152.

6
2. Alavizadeh-Farhang, A., & Paulsson, J., (1997), “Measurements on seasonal and daily variation of temperature distributionacross a concrete bridge slab due to change of ambient temperature and solar radiation”, Proceedings, Nordic Mini-seminarof the Nordic Concrete Federation on “Moisture Measurements in Concrete Constructions Exposed to Temperature andMoisture Variations” (VTT Symposium No. 174), Espoo, Finland, August 22, 1997, pp. 20-42.
3. Paulsson, J., & Alavizadeh-Farhang, A., (1997), “Measurements on the moisture state in a heavily trafficked concrete slabrepaired with a bonded concrete overlay”, Proceedings, Nordic Mini-seminar of the Nordic Concrete Federation on“Moisture Measurements in Concrete Constructions Exposed to Temperature and Moisture Variations” (VTT SymposiumNo. 174), Espoo, Finland, August 22, 1997, pp. 5-19.
4. Paulsson, J., & Silfwerbrand, J., (1998), “Durability of repaired bridge deck overlays - effects of deicing salt and freeze-thawcycles”, Concrete International, Vol. 20, No. 2, February 1998, pp. 76-82.
5. Silfwerbrand, J., & Paulsson, J., (1998), “Swedish experience: Better bonding of bridge deck overlays”, ConcreteInternational, Vol. 20, No. 10, October 1998, pp. 56-61.
6. Paulsson-Tralla, J., (1999), “Service life prediction of concrete bridge decks repaired with bonded concrete overlays”,submitted to Materials & Structures.
7. Paulsson-Tralla, J., (1999), “Absorption and desorption of water for mature concrete with low w/b ratios”, submitted toMagazine of Concrete Research.
8. Paulsson-Tralla, J., (1999), “Water absorption properties, moisture state, and number of freeze-thaw cycles in a repairedconcrete bridge deck”, submitted to Nordic Concrete Research.
9. Paulsson-Tralla, J., (1999), “Evaluation of chloride ingress in solid and cracked concrete using real environmental loads”,submitted to ACI Materials Journal.
Jonatan Paulsson-Tralla’s contribution to the publications with co-authors:1. Major part of sampling and research. Major part of writing. No chemical analysis.2. Major part of technology. Minor part of writing.3. Major part of technology. Major part of writing.4. Major part of experiment. Major part of writing.5. Part of experiment. Part of writing.
INTRODUCTION
An ever increasing number of damaged concrete bridge decks have been reported during the last two decades from severalparts of the world, Ingvarsson and Westerberg (1985), Hoff (1985) and Mallet (1994). There are approximately 240,000 bridgesclassified as structurally or functionally deficient in the United States, Grace and Abdel-Sayed (1996) and Ma et. al. (1996). Thereare several different mechanisms that cause the damages but chloride initiated corrosion is probably the dominating mechanism.
A typical Swedish concrete bridge deck is shown in figure 1. The material composition and thickness of each layer has changedduring the years but the main principles are the same today. The concrete bridge deck should be protected from water and de-icing water by the (often bituminous) isolation. A thin (50 mm) reinforced concrete topping is thereafter placed on top of theisolation to protect it from wear and fatigue. The wearing layer consists of asphalt.
Concrete bridge deck reinforced in two ways, 200 mm
Bitumen mat Asphalt, 40-100 mm Protective concrete, 50 mm

7
Figure 1. Cross-section of a typical Swedish concrete bridge deck.
The effectiveness of the protective system is questionable (Racutanu, 1998). The system has often performed satisfactorily wereit has been installed properly but the system is quite vulnerable and signs of distress are rarely noticed until severe damage hasoccurred. It is important that every layer is installed with caution. The concrete has to dry for approximately one month beforeinstalling the isolation (if protected from precipitation). This can be a risk because the contractor can try to make up lost time byignoring the need for drying.
The Swedish National Road Administration (SNRA) was in early nineteen-eighties searching for a cost effective repair thatcould be used on many of the damaged bridge decks in Sweden. The water-jetting technique was developed at the same timeand the SNRA decided to repair a large number of bridge decks with this technique.
In order to give the repaired concrete bridge deck sufficient service life, the bonded concrete overlay requires:
1. A long-term stable bond to the old bridge deck.2. Sufficient wear resistance to withstand wear and rutting.3. Sufficient salt-freeze-thaw resistance to withstand numerous freeze-thaw cycles with de-icing agents.4. Sufficient resistance to chloride ingress to protect the reinforcement from corrosion.It is, therefore necessary to have a broad approach when predicting the service life of the repaired concrete bridge deck. Someof the deterioration mechanisms may need different measures that may interfere with each other.
AIM AND SCOPE
The aim with this thesis is to bring the conclusions from studied parameters together to a broad synthesis with overallconclusions and with clear recommendations for future repair and maintenance. The recommendations are based both on theresults from the extensive work by Silfwerbrand (1987) and Silfwerbrand (1990) and from the current studies and on the author’sexperience with practical work with this type of repair (Paulsson, 1995, and Paulsson and Silfwerbrand, 1995). The followingparameters were investigated for the repaired bridge decks:
• Wear and rutting• Bond strength and compressive strength• Extent and cause of cracks• Relative humidity and its distribution in the deck• Temperature and its distribution in the deck• Freeze-thaw resistance and number of freeze-thaw cycles• Concrete cover• Service life criterion with respect to chloride initiated corrosion• Service life predictions using moving boundary theory• Chloride concentrations in de-icing water and in the surfaces of concrete overlays• Absorption of water and chloride ions due to capillary suction of de-icing water• Chloride ingress in solid and cracked parts of bonded concrete overlays
The results are based on detailed field studies from eight bridge decks and any extension of the results to other elementsshould, therefore, be done with care.
ABRASION RESISTANCE
One of the main reasons why the SNRA decided to try out bonded concrete overlays in the mid-eighties was the high wearresistance and low (no) deformation at high temperatures of concrete overlays. The goal was to develop an overlay that couldsustain the severe rutting that took place on many of the bridges with asphalt wear courses. Some bridges were repaired almostevery year due to the rutting before the bonded concrete overlays were installed.
The Department of Structural Engineering, KTH, has in co-operation with SNRA, during the time period 1987-1995 continuouslymeasured the wear on four of the bridges in current investigation: Viktoria Bridge, Teg Bridge, Bjurholm Bridge and ÖverbodaBridge. The measurements were made with a laser-equipped beam that was developed at the department. Only the overall results

8
will be given here and for further information, see Paulsson, 1996 a, and Paulsson 1996 b. Ocular inspection of the wear andrutting on Mälsund Bridge, Långhals Bridge and Södertälje Bridge, were also made in 1995 and 1997.
The wear resistance of a concrete overlay is dependent on several factors. The production stage may be the most critical part inachieving a concrete overlay with good wear resistance and good rideability. If the fresh concrete cannot be handled andfinished in proper way, all benefits from designing a wear resistant concrete may be lost. The concrete must be designed withrespect to in situ conditions and that the tools and techniques used in the production must be known before the concrete mix isdesigned (or the other way around).
Abrasion mechanisms
Different concretes may have different major deterioration mechanisms to wear. There are at least three major deteriorationmechanisms: (i) The aggregates are worn down. (ii) The paste is worn down. (iii) The aggregates are ripped out of the wearsurface (paste) due to lack of bond, see figure 2. The three mechanisms interact and the interaction is dependent on the concreteproperties.
Figure 2a. The fresh concrete separated and the aggregate content at the wear surface was low and uneven. b. The aggregatehas higher resistance to wear than the paste and the paste is worn down faster than the aggregates which causes the latter to“stand up”. c. Finally, the aggregate is ripped out of the surface causing the adjacent aggregate to “stand up”.
The composition of the concrete, as well in the fresh state as in the hardened state, will decide the dominating abrasionmechanism. Knowledge of how the concrete will wear down is necessary in order to improve its wear resistance (if it is needed).If the overlay is worn down by mechanism iii, there is no use of choosing a more wear resistant aggregate. The actions mightinstead be focused on achieving a better bond between the aggregate and the paste and less separation.
Basic steps to achieve an overlay with proper wear resistance
The recommendations are mainly based on measurements, on inspections and on observations of the behaviour of overlaysduring casting. The recommendations are suited for the traditional casting technique with vibrating pokers and screeds andmagnesium bull floats. The technique requires that the concrete has a slump between 70 and 130 mm.
The first step is to decide how wear resistant the overlay has to be in order to be cost efficient including maintenance, repair,and traffic jams during repair etc. The traffic volume and the frequency of studded tyres are the two main factors to consider.There are no reasons to use special aggregates if the traffic volume and/or the use of studded tyres are low. If the bridge iswide, an eventual repair may not disturb the traffic and the use of a normal wear resistant overlay may be the best choice. Thesame holds if alternative traffic routs are available.
The second step is to establish the relation between the paste’s and the aggregate’s abrasion resistance and the bond betweenthem. If the paste has higher wear resistance than the aggregates, little effort has to be made to get high aggregate content inthe wear surface. Eventual aggregate separation is then not a problem but merely advantageous as long as it occurs evenly onthe entire overlay. Uneven wear properties of the overlay may cause an uneven wear surface with low rideability and acceleratedwear.
If the paste and the aggregates have equal wear resistance, the effect of any change in the concrete composition has to beanalysed. If the w/c-ratio is lowered, the wear resistance of the paste and the bond to the aggregate will probably increase andso also the wear resistance of the overlay. If instead a more wear resistant aggregate is used, and the w/c-ratio is held constant,the wear resistance may not increase at all. The paste may be abraded away around the aggregate that will “stand up” from thewear surface and, finally, be ripped out of the surface.
Effects of silica fume
a. At the completionof the overlay
b. The wear has exposedsome of the aggregates
c. One aggregate is ripped out ofthe surface and the next one is onits way
A strong bond is especiallyimportant below theaggregates

9
If aggregates with high wear resistance are used, the bond to the paste has to be good. Water separation may cause water togather below large aggregates and weaken the bond below the aggregates. Silica fume improves the bond between aggregatesand paste since the interfacial zone is improved and by decreasing the water separation. The bond also is improved the mostwhere it is needed the most, namely below the aggregate, due to the increased stability of the fresh mix. Silica fume alsodecreases the aggregate separation, which further improves the wear resistance.
Influence of the maximum size of the aggregates
The optimal dmax for high wear resistance is a function of many variables, e.g., type of aggregate, shape and texture of theaggregate, the composition of the paste and the rheology of the fresh mix. If the aggregates are more resistant to wear than thepaste, increasing the total aggregate content may improve the wear resistance of the overlay. The increase in aggregate contentmay be accomplished by increasing the dmax but the separation risk may increase and the benefits may easily be spoiled. A dmax
of 16 mm seemed to be the upper limit for the conventional casting technique, i.e., vibrating pokers and screeds.
Effect of the tyre properties
The use of studded tyres has decreased in Sweden the last decade due to the increased market share for winter tyres withoutstuds. The use of studs has probably decreased the most in the urban areas where the problem with rutting has been thelargest. Studded tyres have also been subjected to rapid improvements. The new lightweight studs are not as harmful tooverlays as the old heavy studs and the wear may have decreased with 30 to 70 % in the last ten years. The service lives due towear (rutting) may, therefore, have been increased without increasing the wear resistance.
However, there is a new law in Sweden that will force cars to use winter tyres in the winter. The law is partly due to a number ofsevere traffic accidents during the winter of 1998-99 and the law may increase the use of studded tyres. This may increase thewear and the example shows that service life of bridges may be affected by political decisions, which are hard to incorporate inany service life predictions.
Effects of the colour of the aggregates
A bright and dense overlay reflects the light better than a porous and dark one. This is especially important for tunnels but alsofor roads. The maintenance cost for the road light can be as high as the cost for maintaining the rideability of the road surface(Wilk, 1980).
The colour of the aggregate is important and if it has a deviating colour from the cement paste, the ruts after the initial wear willbe seen clearly and the drivers may (intentionally or not) place their vehicles in the same ruts and the rutting may be acceleratedand concentrated. If white or grey aggregates are used instead, e.g., quartzite, the initial wear will not be seen as clearly and theservice life with respect to rutting may be prolonged.
Another method to avoid the initial wear would be to spray a retarder on top of the overlay. The laitence layer could then beremoved after a couple of hours by gentle brushing and the aggregates would be exposed over the whole overlay. The entireoverlay would then have the same appearance (colour) throughout its service life. However, this method may be hard to use incombination with proper water curing.
Repair of ruts
There are in principal two methods of repairing ruts. Either the abraded concrete is replaced with new material or the middle part(tops) is removed by milling or grinding. The first method has been tried in Sweden with success (Pettersson and Silfwerbrand,1993, and Pettersson and Silfwerbrand, 1994, and Berglund, 1999).
The other method, i.e., milling or grinding down the tops, is quick and easy but it demands that the expansion joints can handlethe decreased height (10 to 20 mm) of the overlay. The height difference at the expansion joints can be handled on both some ofthe existing joints and on new joints (Paulsson, 1997).
A third method, which avoids the rutting, is in principle the same as the previous method but the grinding of the tops is done bythe traffic. The trick is to move the traffic sideways, see figure 3, when the ruts are 5 to 10 mm deep.

10
Figure 3. Move the traffic sideways to make the overlay wear down evenly. The ruts are exaggerated.
The traffic can easily be moved sideways by repainting the road lines if the necessary room is available on the bridge deck. Thebridge could also be slightly widened, 0,2 to 0,3 m at each side, at the repair to create the necessary space. The cost for thewidening would be low (if any) if the end beams have to be replaced anyway at the repair.
The benefits of this type of planning and active maintenance cannot be over-emphasised for bridges with large traffic volumes.The service life with respect to rutting for the south bound lane at Teg Bridge was 11 years (44·106 vehicles) while the servicelife with respect to corrosion, frost damages and bond was at least 50, probably 100 years. If the traffic had been movedsideways or if the tops had been milled down, the service life with respect to wear could easily be extended to 30 years with low(if any) extra costs. The design (repair) philosophy has to be compatible with the maintenance philosophy.
Results from the overlays in the investigation
Wear will be rendered as maximum depth of the ruts, development of the ruts (rutting rate) and the total amount of abradedconcrete per vehicle. Mälsund Bridge, Överboda Bridge and Södertälje Bridge had almost identical dry concrete mixes butdifferent geographic location and amount of traffic.
The total amount of abraded concrete per vehicle was in the same range for Viktoria Bridge, Teg Bridge and Överboda Bridge.The compressive strength did not seemed to have affected the total amount of abraded material on the overlays on thesebridges (Paulsson, 1996a). The rutting was mainly a function of the amount of traffic, the width of the lanes on the bridge andthe colour of the coarse aggregates. In table 1, the depth of the ruts in 1995 is shown. The rutting rate was approximately twiceas high at the bridges with red aggregates and narrow lanes as on bridges with wide lanes and grey aggregates.
Table 1. Depth of ruts in 1995 (1997)
Bridge Depthof ruts(mm)
Increase
(mm)
Number ofvehicles inlane
Increase per vehicle(mm/million)
Width of lane
(m)
Colour ofaggregates
Teg 21 18 32 million 0,56 3,5 Red
Old CBD SFRC overlay CurbRuts 0,5 m

11
(Umeå)Viktoria 16,5 14 23 million 0,61 3,75 RedÖverboda 5 3 13 million 0,23 4,5 (6 incl.
shoulder)Grey
Södertälje - ∼5 15 million 0,33 4,5 Grey
The rutting rate was not accelerated at any of the overlays. Långhals Bridge and Mälsund Bridge, with low amount of traffic,showed no ruts at all after 10 years in service. The development of the ruts at Teg Bridge, Viktoria Bridge and at ÖverbodaBridge is shown in figure 4.
Figure 4. Development of the maximum depth of ruts at Teg (Umeå) Bridge, Viktoria Bridge and Överboda Bridge.
Conclusions - Abrasion Resistance
The concrete overlays in the investigation have performed well but to take full advantage of the overlays’ potential, some minoractions could be taken at the design stage. The traffic lanes should, if possible, be moved sideways at regular intervals to avoidthe rutting on bridges with high traffic volume and narrow lanes and the service life would thereby increase two to three times.The tops could also be ground but additional care might have to be taken to the expansion joints so that they can handle thewear.
The concrete should be designed with respect to casting procedures. A concrete mix with dmax 16 mm, a smooth particle sizedistribution (no discontinuities), wear resistant aggregates, grey aggregates, a good bond between aggregate and cement paste(5 % silica fume), good stability and good workability will give high wear resistance in situ. With a concrete mix, a productiontechnique and a maintenance philosophy that are compatible, bonded concrete overlays offer a good and reliable repair methodwith long service life with respect to wear and rutting to a low annual cost.
BOND STRENGTH (PAPER 5)
The bond between new and old concrete is fundamental for bonded concrete overlays and its importance can not be over-emphasised. The bond was tested on almost every repaired deck approximately one month after casting by the Department ofStructural Engineering and was found to be good as long as the surface of the old concrete had been properly cleaned beforecasting the new overlay (Silfwerbrand, 1990). However, the long-term properties of the bond between water-jetted concrete andnew concrete had not been investigated. An important task was, therefore, to evaluate how the bond had developed after tenyears in service with exposure to stresses caused by shrinkage, temperature and live loads.
Seven bridges were selected in collaboration with SNRA to be part of the study. Four continuous steel girder bridges withconcrete decks, two concrete arch bridges and one concrete flat slab bridge were selected to evaluate if and how differentbearing systems affected the long-term behaviour of the repair. The amount of traffic that the different bridges carried rangedfrom 200 to 24 000 vehicles per day. All bridges were exposed to de-icing salt to various extents.
0
5
10
15
20
25
1987 1988 1989 1990 1991 1992 1993 1994 1995
Dep
th o
f rut
s (m
m)
Teg Bridge 32 million vehicles
Viktoria Bridge 23 million vehicles
Överboda Bridge 13 million vehicles

12
From each bridge, approximately 20 cores with a diameter of 100 mm were drilled and nine of them were used for bond testing(Paulsson, 1997). The failure stress was defined as the stress at which the core broke. If the failure occurred in the old concrete,the failure stress was just a lower bound for the bond strength. Almost all failures took place in the old concrete and no purebond failure occurred. Table 2 shows the failure stresses approximately one month after the repair and in 1995.
Table 2. Failure stress from bond test
Bridge Bridge type Built Repair Failure stress at time ofrepairMPa
Failure stress1995MPa
Bjurholm Composite 1966 1985 1,96 (9)1 1,99 (8)3
Mälsund Arch 1924 1986 1,71 (6)1 2,17 (8)3
Viktoria Composite 1960 1987 1,43 (3)1 1,82 (9)3
Södertälje Flat slab 1966 1989 > 1,5 (-)2 1,83 (9)3
Umeå Composite 1949 1987 1,56 (4)1 1,61 (9)3
Vrena Composite 1937 1987 1,49 (8)1 1,56 (9)3
Överboda Arch 1946 1986 1,80 (5)1 2,18 (9)3
1. Number of cores tested at repair. 2. Unknown number tested. 3. Number of cores tested in 1995.
The bond was found to be at least as good as and in most cases better in 1995 than at times of repair (Paper 5). There were nodifferences in bond strength between areas subjected to positive or negative moment in the decks and there were no signs offatigue of the bond or the old concrete. The bond was not negatively affected by stresses due to differential shrinkage andtemperature. These observations imply that removal of concrete with water-jetting and replacing it with bonded concrete is areliable technique with respect to structural interaction.
CRACKING IN CONCRETE OVERLAYS (PAPER 4)
A comprehensive crack mapping was conducted on every bridge in the investigation (Paulsson, 1997). The main concern wasthat cracks could promote the ingress of de-icing agents and initiate corrosion in the reinforcement in the old bridge deck. Therewas also a risk that de-icing water could cause freeze-thaw damages on the old bridge deck since the old concrete seldom hadadequate salt-freeze-thaw resistance. The overall result of the crack mapping was that the cracking was limited afterapproximately ten years in service and that most cracks can be avoided on future objects. There were mainly two causes to thecracks:
(i) Insufficient curing procedures in combination with hot and windy conditions at time of placing the overlays. Most cracksfound in the overlays after ten years in service could also have been detected after ten days (Paper 4). The low w/b-ratios (0,31)of the overlays on some of the bridges made the concrete vulnerable to early loss of water. The use of curing compounds wasprobably a mistake. It was sometimes applied too late (on semi-dry concrete surfaces) and it later prevented the water from thesubsequent water curing to reach the concrete. Fresh concrete wit low w/b-ratios should never be allowed to loose any water tothe ambient air but instead be kept moist by fogging the concrete until the surface is strong enough to handle ordinary watercuring. Water curing with cold water will also decrease the rate of hydration and heat development of the overlay somewhat andthereby decrease the risks of temperature cracks. Shrinkage cracks can be avoided since it is possible to use concrete with loww/b-ratios in hot conditions if the fogging and water curing are done with care (Paulsson, 1995, and Paulsson and Silfwerbrand,1995).
(ii) Construction (casting or cold) joints in the old concrete bridge deck sometimes reflected through some of the overlays andcaused reflective cracks throughout the overlay (Paulsson, 1997). The construction joints are a problem no matter if bondedconcrete overlays or isolation systems (often bituminous) are used. Concentrated strains in an isolation material above the jointmay cause it to fatigue and crack, especially in cold conditions, and thereby create a path for de-icing water and oxygen to thereinforcement in construction joint. The problems with the reflective cracks can be dealt with in several ways. Stainless steelreinforcement can be installed in the overlay above the construction joint. The reinforcement can be used to decrease the widthof an eventual reflective crack and thereby protect the underlying parts from de-icing water and corrosion. It could also be usedto “replace” the reinforcement in the underlying joint and thereby eliminate the effect of corrosion in the old reinforcement in thejoint. Another alternative, which may be cost effective, is to ignore the construction joints at the repairs. The overlay isthereafter kept under surveillance and if any reflective cracks appear, they could be repaired with any of the self-penetratingrepair materials that are available on the market (Paulsson, 1997).

13
MOISTURE AND TEMPERATURE STATE IN REPAIRED CONCRETE BRIDGE DECKS(PAPER 2 AND 3)
The moisture state in concrete structures is important to quantify since it affects most of the important deterioration mechanism.The Relative Humidity (RH) in both the concrete overlay (100 mm, w/c-ratio 0,33) and the concrete flat slab (300 mm, w/c-ratio0,45) for Gullmarsplan Bridge was, therefore, measured with two different methods. First ten so called Sahlén gauges (RH andtemperature gauges) were installed at different depths of the overlay and concrete bridge deck (Paper 3). The RH and thetemperature were measured every hour during two and a half years to evaluate if and how seasonal and diurnal changes in theweather affected the moisture and temperature state in the concrete slab.
The concrete slab clearly interacted with changes in the environment. The RH in the top part of the overlay increased after longwet periods with rain and with increased temperature. However, the measurements in the top part of the overlay may beuncertain due to the inherent difficulties in measuring the RH in concrete with low w/c-ratios during rapid temperaturefluctuations. The measurement at the soffit using the Sahlén sensors was probably reliable. The RH in the old concrete at thelevel of the reinforcement (35 mm from the soffit) was approximately 88 % in the summer and 92 % in the winter.
Concrete samples were also taken out of the overlay with a jackhammer and transported in tubes to laboratory where the RHwas measured in a climate chamber. The RH was 86 % to 92 % in the top 15 mm of the overlay after several days of heavy rainand 72 % to 70 % from 20 to 70 mm of the overlay. The measurements showed that the RH below 20 mm in solid parts of theoverlay was low even after long periods of rain, which also have been showed by Paroll and Nykänen (1999). This in turnimplies that the risk of corrosion and eventual rate of corrosion could be low at 20 mm from the surface. It also implies that thechloride ingress rate could be lower in the interior drier part than in the top 20 mm of the overlay. The degree of capillarysaturation was also measured and found to be 80 % for the top 30 mm. The risk for freeze-thaw damages may, therefore, be low.
The temperature measurement showed that the temperature in the concrete flat slab was controlled by the temperature in theambient air and the amount of solar heating. The temperature in the wear surface increased rapidly due to solar radiation and themaximum temperature recorded was 37º C. The maximum temperature difference between the surface and the soffit was 17º C andthe distribution was highly non-linear (Paper 2).
SALT-FREEZE-THAW RESISTANCE AND NUMBER OF FREEZE-THAW CYCLES (PAPER 4AND 8)
The salt-freeze-thaw resistance of all overlays was good or very good after 112 cycles according to the so-called Borås-method.Deterioration due to frost damages was, therefore, not a problem for the overlays. No scaling was observed on any of theoverlays (Paulsson, 1997).
The number of Freeze-Thaw Cycles (FTC) at different depths from the surface was investigated at Gullmarsplan Bridge. Thetemperature throughout the concrete flat slab (400 mm including overlay) was measured at ten locations every hour, see Paper 3for test set-up and details and Paper 8 for more results. Three different criteria for the freezing of pore water have been used: (i)The pore water freezes and thaws at 0 °C. (ii) The pore water freezes and thaws at –2 °C. (iii) The pore water freezes at –2 °C(super-cools) and thaws at 0 °C (Krus, 1996).
The overall result indicates that for each sampling depth the two first criteria yield the same number of FTC in Stockholm duringthe winter of 1997/1998, see table 3. The top part of the concrete flat slab had the largest number of FTC and the middle part hadthe least number. All parts of the slab had fewer FTC than ambient air. Similar observations were made by Krus (1996) usingnumerical simulations. Solar radiation etc. did not affect the number of FTC significantly at the depth of 35 mm.
Table 3 Temperature data and the number of FTC from Oct 3, 1997, to Oct 3, 1998
Distance fromsurface tosensormm
Mintemp°C
Maxtemp°C
Averagetemp°C
Number offreeze-thawcycles 0 °C
Number offreeze-thawcycles –2 °C
Number of freeze-thaw cycles –2/0°C2
5 -11,5 37 8,2 37 39 2115 -10,5 37 8,8 34 32 1635 -12 33,5 8,3 32 32 1865 -12 31,5 8,5 27 29 16340 (40)1 -12 24,5 7,6 33 32 14Outside3 -13,5 25 7,6 77 47 32

14
1. Distance from the bottom (soffit) of the slab. 2. Pore water is assumed to freeze at –2 °C but thaw at 0 °C. 3. At the soffit of the flat slab andprotected from sun, wind and precipitation.
If the effect of super-cooling was taken into account the number of FTC decreased with approximately 50 %. This was alsofound by Krus (1996). He further concluded that the simulated number of FTC for a concrete slab with a thickness of 500 mm inStockholm was 27 at the surface, 15 at 50 mm from the surface and 10 at 100 mm from the surface using criterion (iii). Thenumbers of FTC corresponds fairly well with the measured numbers. The observation shows that the method proposed by Krus(1996) can be used to predict the number of FTC in concrete members subjected to temperature variations.
The number of freeze-thaw cycles was high at all depths of the repaired concrete flat slab (Paper 8) and adequate freeze-thawresistance is necessary. The measured highest freezing rate at the surface was 1 °C/h (from 0 °C to –2 °C in two hours). Freezingrates of 0,5 °C/h was observed at several occasions.
De-icing agents were used at approximately 70 occasion between the 3rd of October 1997 and the 3rd of October 1998. Sensor G1close to the wear surface registered approximately 20 freezing occasions (using any of the three criteria) when de-icing agentshad been spread on the wear surface the same day or the day before. The number shows that freezing and thawing of the wearsurface in combination with de-icing agents occur frequently. Adequate salt-frost-resistance is, therefore, necessary for theconcrete in order to provide a durable concrete overlay.
The “mean” chloride content in the de-icing water or slush present on the overlay after the use of de-icing agents wasapproximately 6 g/l (10 g/l NaCl). Chloride contents of 36 g/l (60 g/l NaCl) were also recorded occasionally. The Borås-method(SS 13 72 44) uses a NaCl content of 30 g/l, which is considered as the worst exposure (BHB). The observations indicate that thechloride content used in the Borås-method is realistic.
CONCRETE COVER (PAPER 6)
One of the most important factors affecting the service life of reinforced concrete structures is the concrete cover. For aconcrete bridge deck that has been water-jetted and overlaid with a new bonded concrete overlay, the prediction of the concretecover is difficult. The uncertainties are large since some concrete has been removed and new concrete has been installed.Physical measurements are hard to perform due to the large cover. Most of the uncertainties could be avoided if the contractorsurveyed both the water-jetted surface and the top surface of the overlay to document the real height of the overlay. Thisdocument could then be used for quality assurance and incorporated in the “service book” for planning of future maintenance.The reliability of service life predictions would also increase since the real distribution of the height of the overlay would beknown. If a survey is not available, the height of the overlay could be estimated by coring.
Measured heights of the overlays
The heights of the concrete overlays in the investigation are shown in Table 4. The measurements were made by coring exceptfor Gullmarsplan Bridge where the measurements are from surveys done in 1993 and 1994 by the author when working for thecontractor conducting the repairs (Paulsson, 1995). The error in the measurements was ± 5 mm due to the rough surface createdby the water jetting. The lower 5 % percentile values were obtained assuming a normal distribution and that the STD wasknown. The values in the parenthesis should be used if the STD is not known (which it is not). These values have beenobtained with the t-distribution (student-) but the influence was small since the number of samples for each overlay was fairlylarge.
The effect of the old concrete cover remaining or exposed re-bars after the water jetting has been neglected since the effect wassmall (Paper 6). The assumption is in most cases on the conservative side since hardly any re-bars were found at the interface orin the overlay, i.e., the entire old concrete cover is rarely removed by the water-jetting.
Table 4. Height of overlays in the investigation
Bridge Minblue printmm
Min
mm
Max
mm
Mean
mm
STD
mm
Height5 % perc.mm
STD ofmeanmm
Height5 % of meanmm
No. ofsamples
Södertälje 60 70 110 88 11 69 (68) 3 83 (83) 15Mälsund 80 100 140 121 12 102
(100)3 116 (116) 15
Överboda 601 60 90 75 11 57 (56) 3 71 (70) 17Bjurholm2 90 35 120 69 23 32 (30) 5 61 (61) 20Viktoria 60 50 130 90 22 53 (51) 6 81 (80) 16

15
Teg (Umeå) 60 60 100 79 12 60 (59) 3 75 (75) 18Långhals 80 95 160 110 14 87 (86) 3 105 (104) 17Gullmarsplan 60 60 250 142 40 78 (76) 4 136 (136) 97
1. No information regarding thickness of overlay found in blue prints but 60 mm could be assumed. 2. The bonded concrete overlay on BjurholmBridge was milled two years after the repair and the thickness of the overlay probably decreased with 5 to 15 mm.
In figures 5 and 6, the histograms of the relative and the cumulative frequencies are shown for the heights of the overlays at TegBridge and Gullmarsplan Bridge. The normal distribution for the mean values and the STD is also shown. The other bridges’distributions are shown in Appendix Concrete Covers. The normal distribution was generally a fair approximation for all eightbridges.
The spread of the height of the overlay at Teg (Umeå) Bridge was small and the range (maximum-minimum) was only 40 mm. Theprescribed minimum thickness of the overlay at the blue prints was achieved. The 5 % percentile value is 76 % of the meanvalue, which is economical. The depth of the overlay should be as even as possible to achieve a cost efficient repair.
Umeå
0
0.05
0.1
0.15
0.2
0.25
0.3
0.35
0.4
0.45
0.5
5-14
15-2
4
25-3
4
35-4
4
45-5
4
55-6
4
65-7
4
75-8
4
85-9
4
95-1
04
105-
114
115-
124
125-
134
135-
144
145-
154
155-
164
Depth of overlay [mm]
Rel
ativ
e fr
eque
ncy
0
0.1
0.2
0.3
0.4
0.5
0.6
0.7
0.8
0.9
1
Cum
ulat
ive
freq
uenc
y
Umeå
Normal
Cumulative Umeå
Figure 5. Relative and cumulative frequency for the overlay depth on Teg (Umeå) Bridge.
The distribution of the height of the overlay at Gullmarsplan Bridge was close to normal distributed. The number of samplingpoints was larger than on the other bridges, which indicates that the height is normal distributed if only the number of samplingpoint was large.
Figure 6. Relative and cumulative frequency for the overlay depth on Gullmarsplan Bridge.
The large spread at Gullmarsplan Bridge was due to the nature of the repairs of the structure. The old concrete flat slab,completed in 1945, had its top part of the slab cast with 1 to 2 % slope to accommodate the rinsing of water, see figure 7.However, in 1984, the flat slab was widened by building a new flat slab adjacent to the old one with only an expansion joint
Lower 5 % percentile Mean
Gullmarsplan
0
0,02
0,04
0,06
0,08
0,1
0,12
0,14
0,16
0,18
0,2
5-1415
-2425
-34
35-4
445
-5455
-64
65-7
475
-8485
-94
95-1
04
105-
114
115-
124
125-
134
135-
144
145-
154
155-
164
165-
174
175-
184
185-
194
195-
204
205-
214
215-
224
225-
234
235-
244
245-
254
Depth of overlay [mm]
Rel
ativ
e fr
eque
ncy
0
0,1
0,2
0,3
0,4
0,5
0,6
0,7
0,8
0,9
1
Cum
ulat
ive
freq
uenc
y
Gullmarsplan
Normal
Cumulative
Lower 5 % percentile Mean

16
between the old and new flat slab. The traffic, when driving in the same lane, passes from the old slab onto the new one and thelevel of the riding surface on the two flat slabs must of course be consistent. For some reason 150 to 300 mm of asphalt overlaywas added on to the existing asphalt overlay on the old slab to create the consistent level of the riding surface in 1984. This wasnot known by the contractor when the repair work started in 1993 since the survey conducted before the repairs started waslimited. To make a long story short, the thickness of the bonded concrete overlay had to be increased from 100 mm to 200 mmand in some spots even to 300 mm. This is the main reason for the large spread of the height of the overlay.
Figure 7. Schematic sketch describing the reason for the large spread of the depth of the overlay at Gullmarsplan Bridge.
Documentation (Service book)
The example shows some situations that the contractor may run into due to limited information regarding the structure. It alsoshows how valuable proper documentation of the repairs in 1984 in a “service book” would have been for both the maintenanceengineer and the contractor when planning the repairs in 1993. The situations where already repaired/widened etc. structureshave to be repaired/altered again are growing in numbers, especially in urban areas. In order to meet the public demand on cost-effective traffic system, all documentation regarding the infrastructures must be gathered and kept accessible. The SNRA hasserved as a good example during the years and many conclusions in the current thesis would not have been possible to drawwithout the information in the archives of SNRA. It is important that these and other achieves are maintained, updated andcomputerised in the future. Racutanu (1998) showed that the archives can give us valuable information on which bridgeelements (i.e., end-beams) where the design needs to be altered.
Many structures have their material properties, chloride content etc. examined several times during their service lives. Allinformation regarding the samples should also be documented and kept with the rest of the information regarding the structure,e.g., in a service book. The location and size of the samples, the time of sampling, the reason for the testing, the results and theconclusions drawn should easily be accessible for future use. The information may be very valuable in the future since theingress rates of carbonation fronts and chloride ions could be updated at the same spot as the previous samples. This wouldgive us information on how different transport coefficients develop in time for example, which could improve future service lifepredictions.
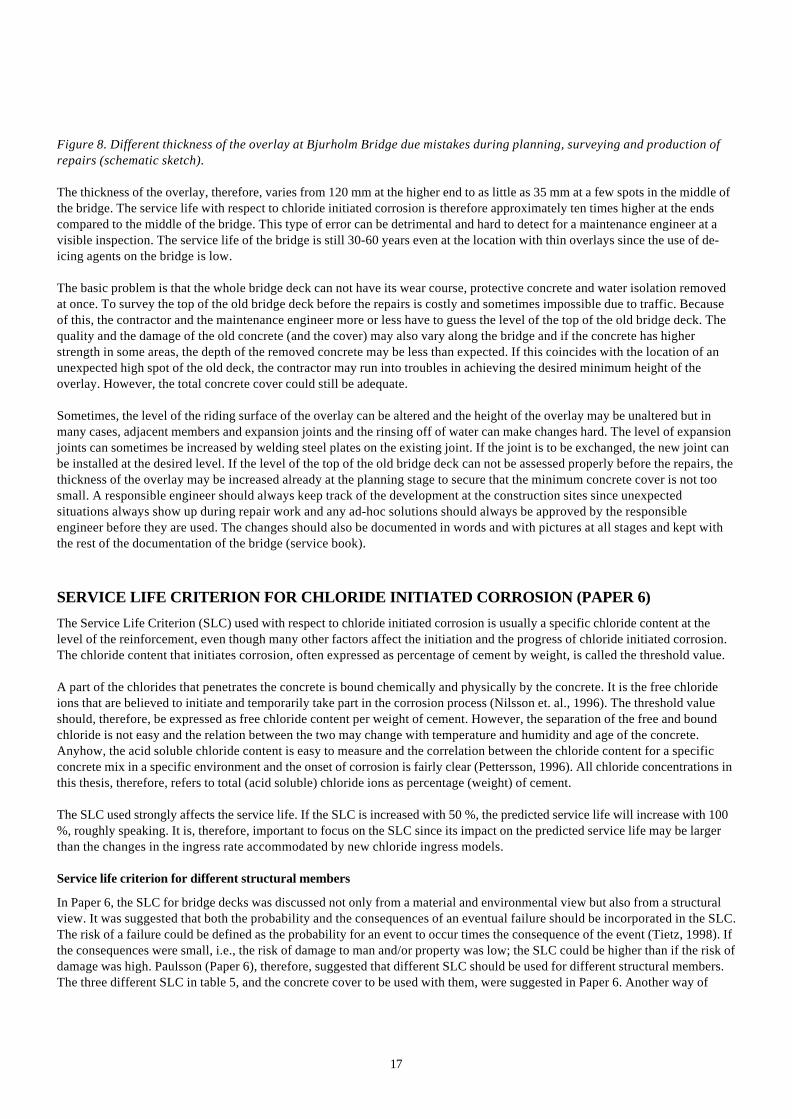
Another real example shows that wrong assumptions regarding the vertical positions of the top surface of the old concretebridge deck and of expansion joints may lead to thinner overlays than stated in the repair blue prints. Bjurholm Bridge wasdesigned to have a minimum thickness of the overlay of 90 mm. The bridge is 246 m long and it has a mean slope of 2,9 %, whichwas assumed by the contractor for the repairs to be constant along the bridge. The repair work started at the high end of thebridge and continued towards the low end. The riding surface of the concrete overlay was designed to mean slope of 2,9 % too.However, as the work progressed toward the middle part of the bridge it was recognised that the top surface of the old concretebridge deck did not have an even slope. The slope was less than 2,9 % on the first 120 to 130 m and the more on the rest of thebridge, see figure 8. This caused the contractor problems since he was supposed to create a riding surface with an even slope.The contractor decided to decrease the thickness of the overlay towards the middle of the bridge and then increase thethickness of the overlay at the lower end of the bridge to accomplish an even slope of the riding surface.
CROSS SECTIONThickness of asphalt wear course was increasedin 1984 to fit with the new flat slab’s wear course.In 1993, the asphalt was replaced with a bondedSFRC overlay with similar thickness.Edge beam removed in 1984
Flat slab 1945Flat slab 1984
100 mm
300 mm
120 mm35 mm
OverlayInterface (bond line)Old bridge deck
17
Figure 8. Different thickness of the overlay at Bjurholm Bridge due mistakes during planning, surveying and production ofrepairs (schematic sketch).
The thickness of the overlay, therefore, varies from 120 mm at the higher end to as little as 35 mm at a few spots in the middle ofthe bridge. The service life with respect to chloride initiated corrosion is therefore approximately ten times higher at the endscompared to the middle of the bridge. This type of error can be detrimental and hard to detect for a maintenance engineer at avisible inspection. The service life of the bridge is still 30-60 years even at the location with thin overlays since the use of de-icing agents on the bridge is low.
The basic problem is that the whole bridge deck can not have its wear course, protective concrete and water isolation removedat once. To survey the top of the old bridge deck before the repairs is costly and sometimes impossible due to traffic. Becauseof this, the contractor and the maintenance engineer more or less have to guess the level of the top of the old bridge deck. Thequality and the damage of the old concrete (and the cover) may also vary along the bridge and if the concrete has higherstrength in some areas, the depth of the removed concrete may be less than expected. If this coincides with the location of anunexpected high spot of the old deck, the contractor may run into troubles in achieving the desired minimum height of theoverlay. However, the total concrete cover could still be adequate.
Sometimes, the level of the riding surface of the overlay can be altered and the height of the overlay may be unaltered but inmany cases, adjacent members and expansion joints and the rinsing off of water can make changes hard. The level of expansionjoints can sometimes be increased by welding steel plates on the existing joint. If the joint is to be exchanged, the new joint canbe installed at the desired level. If the level of the top of the old bridge deck can not be assessed properly before the repairs, thethickness of the overlay may be increased already at the planning stage to secure that the minimum concrete cover is not toosmall. A responsible engineer should always keep track of the development at the construction sites since unexpectedsituations always show up during repair work and any ad-hoc solutions should always be approved by the responsibleengineer before they are used. The changes should also be documented in words and with pictures at all stages and kept withthe rest of the documentation of the bridge (service book).
SERVICE LIFE CRITERION FOR CHLORIDE INITIATED CORROSION (PAPER 6)
The Service Life Criterion (SLC) used with respect to chloride initiated corrosion is usually a specific chloride content at thelevel of the reinforcement, even though many other factors affect the initiation and the progress of chloride initiated corrosion.The chloride content that initiates corrosion, often expressed as percentage of cement by weight, is called the threshold value.
A part of the chlorides that penetrates the concrete is bound chemically and physically by the concrete. It is the free chlorideions that are believed to initiate and temporarily take part in the corrosion process (Nilsson et. al., 1996). The threshold valueshould, therefore, be expressed as free chloride content per weight of cement. However, the separation of the free and boundchloride is not easy and the relation between the two may change with temperature and humidity and age of the concrete.Anyhow, the acid soluble chloride content is easy to measure and the correlation between the chloride content for a specificconcrete mix in a specific environment and the onset of corrosion is fairly clear (Pettersson, 1996). All chloride concentrations inthis thesis, therefore, refers to total (acid soluble) chloride ions as percentage (weight) of cement.
The SLC used strongly affects the service life. If the SLC is increased with 50 %, the predicted service life will increase with 100%, roughly speaking. It is, therefore, important to focus on the SLC since its impact on the predicted service life may be largerthan the changes in the ingress rate accommodated by new chloride ingress models.
Service life criterion for different structural members
In Paper 6, the SLC for bridge decks was discussed not only from a material and environmental view but also from a structuralview. It was suggested that both the probability and the consequences of an eventual failure should be incorporated in the SLC.The risk of a failure could be defined as the probability for an event to occur times the consequence of the event (Tietz, 1998). Ifthe consequences were small, i.e., the risk of damage to man and/or property was low; the SLC could be higher than if the risk ofdamage was high. Paulsson (Paper 6), therefore, suggested that different SLC should be used for different structural members.The three different SLC in table 5, and the concrete cover to be used with them, were suggested in Paper 6. Another way of

18
dealing with this issue is to use the coefficient of safety as proposed in Brite Euram 4062 (1997) where these topics (and others)are discussed rigorously.
Table 5. SLC for different types of structural members
Type of member Secondary loadcarrying member
Staticallyindeterminate
SLC% Cl/C
Concrete cover
Continuous bridge deckon steel girders
Yes Yes 0,6 5 % percentile ofmean value
Concrete flat slab No Yes 0,4 5 % percentile ofmean value
Simply supportedconcrete slab
No No 0,3 5 % percentile ofmean value
The SLC is the acceptable total chloride concentration at the level of the reinforcement. It does not mean that corrosion has, orhas not, started since corrosion depends on many other factors. The chosen SLC are supported by work by Pettersson (1996),Syed Ehtesham Hussain et. al. (1994), Sandberg (1995) and Matushima et. al. (1998). They all suggested similar or higher SLC.The Swedish Bridge Code (1994) uses a free chloride concentration of 0,3 % per weight of cement as SLC. If the free chloridecontent is assumed to be 50 % of the total content, the SLC according to the Swedish Bridge Code would be a chlorideconcentration of 0,6 % per weight of cement.
ESTIMATION OF SERVICE LIFE WITH THE MOVING BOUNDARY THEORY (PAPER 6)
The service life of a concrete structure can be estimated by a fast, simple and cheap method if the chloride threshold value isassumed to be transported into the concrete as a moving boundary. The moving boundary theory is often used to predict theingress rate of a carbonation front in concrete (Fagerlund, 1996). The use of the method for predicting the ingress of a thresholdvalue can be questioned (Paper 6). Nevertheless, the simplicity of the method makes it attractive to use especially if chlorideprofiles obtained at different occasions from the same structure and the same microclimate are available. The coefficient k , seeexample 1 for definition, can then be established for different exposure duration and if they are of the same magnitude, themethod may predict the ingress rate of the threshold value fairly accurately.

19
year , years 8after front the todistance theusing and Cl/C % 0,6 of SLC a using life Service
m/year years, 8after front the todistance theand Cl/C % 0,6 of SLC a usingt Coefficien
m ,mean value of percentile % 5 at the Cl/C % 0,6 of SLC a usingcover Concrete
where
years 100104,7
075,0
m/year 104,78
021,0
s)mean value of percentile % (5 m 0,075 years, 8 m, 0,021 Cl/C, % 0,6
year time,Exposure
m/year t,Coefficien
m value, threshold the tosurface thefrom Distance
where
% 0,6year 8
0,5% 0,6year 8
% 0,6
2
3
2
% 0,6year 8
% 0,6% 0,6
year 8
0,53% 0,6year 8
% 0,6
5,0
kSL
k
CC
k
CCSL
k
CC t x
t
k
x
t
xk
tkx
=
=
=
=
⋅
=
=
⋅==
===
==
=
=
⋅=
−
−
1995 25, July Bridge Umeåat profile Chloride
1 Example
In example 1, the service life for Teg (Umeå) Bridge is estimated with the proposed method. The service life was more or lesssimilar to the results using the analytical solution for Fick’s second law with a surface concentration of 2,2 % and a diffusioncoefficient of 8·10-13 m/s² (Paulsson, 1997). The observation indicates that the two methods may give similar results.
However, the method used in example 1 is a lot simpler and, in the author’s opinion, a lot safer to use since neither the surfaceconcentration nor the apparent diffusion coefficient has to be estimated. The estimation of the surface concentration and thediffusion coefficient in a de-icing environment is always subjective to some extent and the estimation therefore demands skilland experience. The method in example 1 is easy to use and understand for less skilled maintenance personnel. The only input isa number of chloride profiles evaluated so that the distance from the surface to the threshold level can be determined accuratelyand no subjective estimations are needed. All calculations can also be made by hand by “non-experts” and the money saved bythis could instead be used to take more samples and thereby get more information of the distribution of both the concretecovers and the distance to the “front”. This may be a cost efficient and reliable method to estimate the service life of an existingstructure. A probabilistic approach (mean value or percentile values) can also be used in a simple way for the coefficient k andbe incorporated with the service life criteria and the concrete cover. This is of great value for service life predictions.
CHLORIDE CONCENTRATIONS IN DE-ICING WATER AND CONCRETE SURFACE (PAPER 1AND 9)
Relevant chloride concentrations in the de-icing water on concrete overlays were needed in order to quantify the effect ofcapillary suction of de-icing water. The Surface Concentrations (SC) in the concrete wear surface were also needed as boundaryconditions to Fick’s second law of diffusion, later used to predict the chloride ingress. Water, slush and concrete samples weretaken at close intervals, sometimes once every day, during the de-icing season and once every two to four weeks in the summerand early autumn during two years (Paper 9). Detailed information of the de-icing procedures was also collected (Paper 1). It wasfound that chloride content in surface water, slush and concrete surface closely interacted with the weather and the de-icingprocedures. The average chloride content in the de-icing water was 6 g/l the days when de-icing agents were used. Thetemperature in de-icing water (fluid) in an expansion joint of Maurer type was also measured occasionally and it was once as lowas -3 °C (± 0,5 °C). This freezing point depression corresponds to a 52 g/l of NaCl, i.e., 35 g/l chloride ions (Weast, 1973). Themeasured chloride concentration of the same water was 36 g/l, which supports the temperature readings in field. Theobservations also show that concrete around an expansion joint may be exposed to severe conditions.
The most important factor for the SC was the duration of the exposure, not the amount of de-icing agents used. During cold (-10º C) and fairly dry conditions with relative little de-icing agents used the precipitation turned into a chloride contaminated

20
slush that stayed on the surface, which increased the SC in the concrete rapidly. However, the SC could also decrease fast, from2,7 % to 1,5 %, in only 10 days during snow melting periods (Paper 1).
ABSORPTION OF WATER AND CHLORIDE IONS DUE TO CAPILLARY SUCTION (PAPER 7AND 8)
Several researchers have shown that absorption of chloride contaminated water is the dominating ingress mechanism forchloride ions if the concrete is exposed to cyclic wetting and drying. However, data on absorption properties for matureconcrete with low w/b-ratios (0,3 to 0,4) at or below the freezing point of water are scarce. Punkki and Sellevold (1994) presentedresults for concrete with a w/b-ratio of 0,39 (2 % silica fume). They concluded that resistance numbers and capillary numberswere hard to establish due to non-linear absorption curves when plotted against square root of time. Silica fume is generallybelieved to decrease the rate and the amount of water absorbed due to the decreased pore size. However, Halford (1997) foundthat the water absorption for concrete cast in-situ was similar for concrete with and without silica fume.
The main aim of this part of the work was to quantify and evaluate to what extent capillary suction of de-icing water couldcontribute to the chloride ingress for the overlays in the investigation. The information could serve as a basis for the measurestaken to decrease the chloride ingress rate.
Binding of chloride ions
The so-called binding of chloride ions to pore walls of concrete has been studied by many researchers. For a brief overview, seethe literature reviews by Nilsson et. al. (1996) and Justnes (1998). The binding is today generally believed to consist of chemicalbinding and physically binding (Nagataki et. al. 1993). If the chlorides penetrate the concrete after it had hydrated, the chlorideions are probably mainly fixed to the pore walls physically (Nilsson et. al., 1996).
Covino et. al. (1999) concluded that all chloride ions that had penetrated a repaired concrete bridge beam were water soluble.This in turn indicates that the chloride binding could be limited. Volkvein (1991) concluded that the major part of the chlorideions absorbed due to absorption of chloride contaminated water was water-soluble. The observations supports theobservations in Paper 1 where it was shown that almost all chloride ions absorbed (1,2 %Cl/C) in the concrete surface (0-3 mm)during four weeks of cold weather (-10 °C) were washed away in ten days by water from melting snow and rain.
Type and duration of chloride exposure
There are at least four different types of chloride exposures in a de-icing environment for a concrete overlay:
1. Chloride ions are spread on a semi-wet or wet overlay surface followed by rain or wet snow. This is often the case inNovember and December in Stockholm. The duration of the chloride exposure is short due to the rinsing effect of the rain andmelting snow.
2. Chloride ions are spread on a semi-wet or wet overlay surface followed by dry weather. This is often the case in the spring.The chloride concentration in the water may be high due to the limited amount of water. Some of the water is transported fromthe overlay by vehicles and wind. Some of the water may evaporate to the air as the air temperature increases. The NaCl mayprecipitate at the surface and later moved either into the concrete with subsequent rain or moved away from the surface bywater from rain and/or melting snow or by wear from tires and drag from vehicles and wind. If the rain starts out slow a large partof the NaCl at the surface may be sucked into the concrete. If the rain starts out heavily a large part may instead be rinsed of thesurface.
3. De-icing agents are spread during and/or after snowfalls. If the temperature is somewhere around the freezing point, a largepart of the chlorides are transported away from the surface by the water from the melting snow. Samples have shown that thechloride content is 0-10 g/l in the surface water, which corresponds fairly well with the amount of de-icing salt used and theaverage amount precipitation. If the amount of chloride ions spread on the surface is 2,5-7 g/m² (Paper 1) and the precipitation is2-4 l/m² (2-4 mm), the chloride concentration in the surface water varies between 0,63 and 3,5 g/l.
4. De-icing agents are spread during and/or after snowfalls. If the temperature drops below the melting point for the chloridecontaminated snow (slush), a large amount of the chlorides stays on the surface in the slush. Samples of the slush showed thatthe chloride content was 5 to 20 g/l and the slush exposure is the toughest since the duration can be long.
The scenarios show that a simple general chloride exposure does not exist. The amount and the speed of the traffic, the saltspreading techniques and the prevailing wind conditions have also a significant effect on the exposure since they affects the

21
rate and the amount of chlorides transported from the surface. However, the author has chosen the average duration of theprecipitation as absorption duration for simplicity.
Capillary suction tests
The author conducted a series of capillary suction test to quantify the amount of water absorbed for the concrete mixes in theinvestigation. Only two to four samples from each overlay were tested due to lack of specimens. For details regarding thetesting, see Paper 7.
The definitions and the overall results from the absorption test are given in Papers 7 (table 2) and 8 (table 2) and the mainconclusions were: (i) The concreting procedures affect the absorption properties significantly. (ii) The spread was sometimeslarge even for samples from the same overlay. (iii) Dense and well-cured samples with low w/b-ratio absorbed significantly lesswater than samples with higher w/b-ratios.
Cyclic Wetting and Drying (CWD)
The first absorption test showed that large quantities of water could be absorbed if the concrete was conditioned toapproximately 60 % RH prior to the absorption. However, the exterior parts of concrete outdoors frequently subjected toprecipitation as bonded concrete overlays, never dry out to that extent (Papers 7 and 8).
Butler (1997) presented a test method where the absorption/desorption of concrete was simulated by two-day wetting phasefollowed by a 12-day drying phase. The duration of each phase was chosen on the basis of meteorological data in the UK. Theapproach is similar to the one used in this report but the duration of the both phases is too long for overlays in Sweden. Butler(1997) noticed that the absorption/desorption for young (1-2 month) concrete was not representative for 18 months oldconcrete. He also noticed that samples conditioned in situ absorbed/desorbed significantly less water compared to samplesconditioned in lab. This was also confirmed in the author’s investigation.
To investigate the absorption and desorption of water during CWD outdoors, the specimens previously tested for waterabsorption were exposed to one-sided CWD. The samples were weighed after each drying period (mainly 66 to 72 h) and thenallowed to absorb water for six hours. The samples where then weighed again and thereafter left to dry for another 66 hours withthe exposed surface upwards. The cycle was chosen to simulate the average wetting and drying periods in Sweden and for moredetails see Paper 7.
The CWD-test started in mid August 1998 and continued to mid January 1999. The samples were kept outdoors, sheltered fromprecipitation and fairly sheltered from wind and sun, until December the 8th when they were brought indoors. The waterabsorption took also place outdoors (until the 8th of December) and when the temperature was below the freezing point 8,2 g/dm³NaCl (5 g/dm³ of chloride ions) was added to the water to prevent freezing. The chosen chloride content was about the same asthe average chloride content found in the de-icing water on the bonded concrete overlay on Gullmarsplan Bridge.
Results from the CWD test
The mean amount of water absorbed and desorbed in each month for the samples during the autumn of 1998 are shown in Paper8 (table 3) and Paper 9 (table 3). It was clear that the samples that absorbed large amount of water during the first absorption testalso absorbed and desorbed more water in each cycle than samples that absorbed small amounts of water during the firstabsorption test. Samples with large capillary porosity (from the same bridge) both absorbed and desorbed more water thansamples with less capillary porosity (except for the samples from Viktoria Bridge).
All samples lost more water than they gained during August, i.e., the mean water content was decreasing. In September, theamount of water absorbed and desorbed was fairly equal. In November, the amount of absorbed water increased for almostsamples. The increase could be attributed to the use of NaCl in the absorption water that started the 8th of November. The watercontent in the concrete increased for all samples during November, which indicated that concrete stored outside and exposed tofree water accumulated water during the winter.
During the indoor testing, all samples desorbed and absorbed between 40 % and 95 % more water than outdoors in October, seetable 4, Paper 7. The result clearly shows that any predictions on the amount of water moving in and out of the concrete shouldbe based on the performance in the right conditions.
All samples clearly increased the amounts of water desorbed during a warm desorption period with low RH. The amount ofwater absorbed during the subsequent absorption period was also higher after a dry and warm period than after a “wet” periodwhen also less water was desorbed. The effect of the extended drying period was clear but generally small since most of the

22
water was lost during the first twelve hours of desorption. Increased absorption duration increased the amount of waterabsorbed by the samples but the effect was limited since most of the water was absorbed during the first two hours.
The effect of temperature on the amount of water absorbed was small between 5 °C to 15 °C (Paper 7). The use of NaCl in theabsorption water when the temperature was below the freezing point slightly increased the amount of water absorbed comparedto the amount of water absorbed between 5 and 15 °C. This may indicate that NaCl increased the amount of water absorbed.
The convective depth after a desorption period, defined as the zone where the colour change from dark to bright due to thechange in moisture content, is shown in table 4, Paper 7. The depths were approximate but a trend may be spotted. The higherthe w/b-ratio the deeper convective depth. The calculated penetration depth after 6 h of absorption, using the resistancenumbers in Papers 7 and 8, were in the same orders as the visible water front after 66 h of desorption indoors. There was no clearrelationship between the behaviour in the first absorption test and the CWD-test.
All samples (except GPL98) absorbed more water during the first six hours in the first absorption test than they did in the CWD-test. The ratio between absorbed water during absorption and CWD-test varied widely but a trend may be distinguished. Thesamples from Mälsund Bridge and Överboda Bridge and sample Sö13 from Södertälje Bridge (w/b-ratio 0,31 with 10 % silicafume) had similar and the lowest ratios in the investigation. The samples from Teg (Umeå) Bridge and Gullmarsplan Bridge withfairly similar concrete mixes had also fairly similar ratios. However, the ratios were considerably higher than for the samples fromMälsund Bridge and Överboda Bridge and sample Sö13 from Södertälje Bridge. The ratios for the two samples from LånghalsBridge (w/c-ratio of 0,42) were the highest in the investigation. The observations indicate that the ratio was dependent on w/b-ratio. It is also clear that the first absorption test by far overestimates the amount of water absorbed in the CWD-test.
Amount of de-icing agents used
The use of de-icing agents in Sweden varies widely depending on the type and the amount of traffic, the tolerance of the road-users and the macro and micro climate (Swedish County Association, 1991). The road-users’ tolerance and point of view are ofmajor importance and may lead to peculiar situations. In a local district in Västerbotten, Sweden, the use of crushed lime rockinstead of local sand (dark) used earlier led to many complains about slippery roads. The friction was tested and was found tobe satisfactory. Why did then the road users complain? It was later found that the road users could not spot the crushed limerock (which is white or light grey) since it was spread on snow. The road users therefore thought that sand had not been usedand the road was assumed to be slippery. The crushed lime rock was thereafter coloured black and the complains stopped. Theexample illustrates that the road keeping strategies may not solely be based on rational assumptions.
Some information on the type and amount of de-icing agents used on the bridges in the investigation is presented in table 6.The yearly and the total amounts of chloride ions spread are also shown. The amounts are based on interviews with the roadmaintenance staff for each bridge. The numbers of applications are based on information regarding the season 1996-1997, 1997-1998 and 1998-1999.
Table 6. Amount of de-icing agents used on the overlays
Bridge Useofsand
Chlorideions4
g/m²
UseofNaCl
Chlorideionsg/m²
Weightedaverage1
g/m²
Number ofapplicationsper year
Chlorideions usedg/m² year
Ageyear
Totalchloride ionsusedg/m²
Södertälje Occ2 4 Yes 6 5 120 600 7 4200Mälsund Rare3 4 Yes 6 6 20 120 9 1100Överboda Occ 4 Yes 6 5 70 350 9 3200Bjurholm Yes 1 No - 1 30 30 10 300Viktoria Occ 0,5 Yes 6 5 90 450 8 3600Teg (Umeå) Occ 0,5 Yes 6 6 110 660 8 5300Långhals Rare 4 Yes 6 6 15 90 8 700Gullmarsplan Occ 4 Yes 4 4 70 280 5 1400
1. Based on interviews with road keeping staff. 2. Occasionally (∼10 times). 3. Rarely (∼5 times). 4. Spread in the sand.
Estimation of the chloride ingress due to capillary suction
Paper 1 showed that surface water on a concrete overlay surface could have a chloride content of 0 to 10 g/l (averageapproximately 6 g/l) and that snow slush could contain 5-40 g/l (average 10 g/l). If the surface water is assumed to have the samechloride content during the entire absorption period, a simple estimation of the amount of chlorides absorbed could be made.The technique was schematically showed by Nilsson et. al. (1996) and Hildingson (1989).

23
The amount of chloride absorbed would be equal to the amount of water absorbed times the chloride content in the surfacewater. The amount of water absorbed after six hours (measured) for the first stage in the absorption test and the CWD-test areshown in table 7 and table 8, respectively. There are several uncertainties in the method (absorption properties, chloride contentin surface water, number of salt applications among others) but the needed data can be quantified by simple measurements andobservations which can increase the accuracy of the method. Effects of changes in de-icing procedures and effects of, forexample, a hydrophobic treatment can be quantified.
If the absorbed water is assumed to have a triangular shape, see figure 9, the chloride supply will also be triangular, e.g., morechloride ions will be absorbed at the surface and may therefore be easy to wash out. However, in the calculations in tables 9 and10, the amount of chloride ions absorbed is smeared over the so-called convective depth, i.e., a box distribution is used forsimplicity.
Figure 9. Triangular distribution (assumed) of the water and chlorides ions absorbed.
The amount of chlorides absorbed in every cycle, using the first absorption test, is shown in table 7. It was assumed that allchloride ions absorbed by the concrete stayed in the concrete. The depth of the water absorption, estimated from both thecalculated and the measured depths, is shown too.
The calculated amount of absorbed chloride ions (as weight percent of cement content) in the top part of the overlay (6 to 14mm depending on the sample) was high. The measured chloride content in the top of the cores was reached in only 20 cycles if abox distribution (figure 9) of the absorbed chloride ions was assumed. This implies that only two to three absorption cycles withde-icing water per year would occur, which is clearly wrong. Further, many samples would have absorbed more chloride ionsthan spread on the wear surface. This is of course impossible. The method, using the results from the first absorption test, was,therefore, unsuitable for predicting the amount of chloride ions absorbed by the concrete overlay.
The calculated total amount of chloride ions absorbed during the overlays’ service life and the measured amount are shown intable 7. It is obvious that the amount of chloride ions present in the overlays is a lot less than the calculated amount based onthe first absorption test. However, the calculation (based on measured properties) shows that concrete in a dry environmentmay absorb huge quantities of chloride ions if exposed to chloride-contaminated water for 1 to 6 hours every day.
Table 9. Amount of chloride ions absorbed due to the water absorption (1st absorption test)
Sample 6 hdepthm
6 habs.kg/m²
Clabs.g/m²
Cl/Cabs.percycle1
%
Saltapplic.peryear
Age
year
Total Clabsorbed(calculated)g/m²
Total Clabsorbed(measured)g/m²
Ratioabsorbed/spread
Sö10 0,012
0,512 3,0 0,06 120 7 2520 210 0,084
Sö13 0,008
0,252 1,5 0,04 120 7 1260 170 0,068
Sö15a 0,01 0,575 3,5 0,08 120 7 2900 150 0,06
80 90 100 DCS (%)
Moisture profile after wetting“Amount” of (chloridecontaminated) water absorbed
10
Depth
Chloride ions
6 h penetration depth
Amount at surface
Assumed distribution of chlorideions (water)
Amount of chlorides absorbed(box distribution)
Moisture profile after drying

24
0Sö15b 0,00
80,626 3,8 0,11 120 7 3200 150 0,06
Sö mean 0,010
0,491 3,0 0,07 2470 0,071
M1B 0,009
0,276 1,7 0,04 20 9 300 50 0,056
M2B 0,009
0,230 1,4 0,03 20 9 250 50 0,056
M mean 0,009
0,253 1,6 0,035 280 50 0,056
Ö11 0,007
0,168 1,0 0,03 70 9 640 110 0,035
Ö12 0,007
0,193 1,2 0,04 70 9 730 120 0,038
Ö mean 0,007
0,180 1,1 0,035 680 120 0,036
B13 0,014
0,585 3,5 0,06 15 10 530 90 0,3
B14a 0,015
0,905 5,4 0,09 15 10 810 90 0,3
B14b 0,014
0,884 5,3 0,09 15 10 800 90 0,3
B mean 0,014
0,791 4,7 0,08 710 90 0,3
V11 0,012
0,786 4,7 0,09 90 8 3400 80 0,022
V12 0,012
0,459 2,8 0,05 90 8 1980 70 0,019
V mean 0,012
0,622 3,8 0,07 2690 80 0,020
U12 0,010
0,546 3,3 0,07 110 8 2880 120 0,023
U13 0,011
0,609 3,7 0,08 110 8 3220 130 0,025
U mean 0,011
0,578 3,5 0,075 3050 120 0,024
L12 0,022
1,348 8,1 0,10 15 8 970 80 0,13
L13 0,022
1,379 8,3 0,10 15 8 990 90 0,15
L mean 0,022
1,364 8,2 0,1 980 80 0,14
GPL 1.2 0,011
0,738 4,4 0,08 70 5 1550 Not exp2
GPL 4F 0,014
0,826 5,0 0,09 70 5 1730 Not exp2
GPL 4G 0,012
0,833 5,0 0,08 70 5 1750 Not exp2
GPLmean
0,012
0,799 4,8 0,08 1680
GPL98 0,006
0,043 0,26 0,008 70 5 90 1303/1104 0,074/0,063
1. Box distribution. 2. Samples stored in lab and therefore not exposed to de-icing agents. Results shown for comparative reasons. 3. Total chloridecontent 98-05-06. 4. Total chloride content 98-10-11. Approximately 20 g/m² leaked out of the concrete during summer and autumn.
The three cores from Södertälje Bridge contained different amount of chloride ions. Sample Sö10 and Sö13, drilled from themiddle of the right lane of the two south-bound lanes, had both the higher chloride content than Sö15 (Paulsson, 1997) eventhough sample Sö15 was drilled from a construction joint in the overlay, see figure 10. The microclimate was somewhat differentfor sample Sö15 than for the other samples due to the salt-spreading procedures, the build up of snow and the flow direction ofthe de-icing water on the surface of the overlay. The salt spreading technique used on Södertälje Bridge was mainly wettedNaCl that almost immediately sticks to the overlay. The amount of NaCl spread to the location where core Sö15 was drilled may,therefore, be low and so also the amount of chloride ions absorbed.

25
Figure 10. Schematic description of the NaCl spreading procedures and the microclimates on Södertälje Bridge (concreteflat slab on concrete columns).
The only sample in the first absorption test stored in-situ until a couple of days before testing, was sample GPL98. The RH wasapproximately 90 % and the degree of capillary saturation was approximately 80 %. If the 6 h absorption for core GPL98 is usedin the calculations the outcome is different. The amount of chlorides absorbed in each cycle was only 0,26 g, see example 2. Thetotal amount of chloride ions absorbed after five years in service with 70 salt applications per year would then be 90 g/m² (nowash out). This is somewhat less than the actual chloride content in the concrete overlay where also the wash out mechanism ispresent.
yearper occasionssalt ofNumber
years life, Service
kg/m,absorbed ions chloride ofamount Total
kg/dm water,icing-slush/dein ion concentration Chloride
kg/m absorbed, ions chloride ofAmount
kg/m absorbed, water ofAmount
where
kg/m109026,0705
g/m1026,0106043,0
2abstot
3conc
2abs
2abs
23absabstot
233concabsabs
==
=
=
=
=
⋅=⋅⋅=⋅⋅=
⋅=⋅⋅=⋅=−
−−
N
Age
Cl
Cl
Cl
W
ClNAgeCl
ClWCl
2 EXAMPLE
The total amount of chloride ions present in the overlay at one location after five de-icing seasons was 132 g/m² in May 1998and 108 g/m² in October 1998. This indicates that the amount of chloride ions washed out during summer and autumn wasapproximately 24 g/m². If this amount is assumed to be representative for a normal year and the effect of the wash out is takeninto account, the total chloride content in the overlay would be (less than) zero, which of course is wrong, see example 3.However, the summer of 1998 was quite rainy in Stockholm and the rinsing effect may have been larger than the average year.
2pres
23pres
kg/m overlay, in thepresent ions chloride ofamount Total
kg/m010))245(90(
=
<⋅⋅−= −
Cl
where
Cl
3 EXAMPLE
Sö15Sö10 andSö13Construction joint in
overlay
NaClNaCl
Snow pilesoccasionally
1 4 42
Bondedconcreteoverlay
Concreteflat slab

26
A simple calculation can be made from the measured (at two occasions) total chloride content in the overlay, see example 4. Theeffect of the wash out of chloride ions, based on the measurements, is incorporated.
cycleeach in absorbed is water icing-de kg/m 0,11/mdm 0,116
0,66
g/dm 6 is water absorbed in thecontent chloride theIf
concrete by the absorbed is cycleg/m 66,070
46
occasions icing-de 70in concrete by the absorbed isyear g/m 46 2224
concrete in the staysyear g/m 225
110
periodsout wash 5 and periods icing-de 5after concrete in thepresent g/m 110
periodeach duringout washedis ions) (chloride g/m 24 whereperiodsout wash 5
223
3
2
2
2
2
2
==
=
=+
=
4 EXAMPLE
The calculated amount of de-icing water absorbed in each cycle in example 4 was in the same order as the amount of waterabsorbed by sample GPL98 in the CWD-test outdoors (the amount varied between 0,078-0,095 kg/m², see Paper 8). Thisindicates that the amount of chloride ions absorbed by a concrete overlay could be fairly estimated with the proposed method.
In the last column in table 7, the ratios between the amount of chloride ions spread on the overlays and the amount present inthe overlays are given. The ratios vary considerably and there are uncertainties in the amount chloride ions spread. Theabsorption ratio may partly be coupled to the w/b-ratio of the overlay. The hypothesis is supported by the fact that the twobridges with the highest w/b-ratios (Bjurholm Bridge and Långhals Bridge) had the highest absorption ratios. The concreteoverlay on Bjurholm Bridge was porous due to insufficient consolidation, which has been shown by Clear (1976) to increase theamount of chloride ions absorbed. However, since the amount of de-icing agents used is low, the total amount of chloride ionswas low.
The de-icing agent used on Bjurholm Bridge was sand mixed with NaCl (15 kg/m³). The bridge is located in the coldestenvironment in the investigation and the overlay may be covered with a thin layer of snow intermixed with NaCl and sandduring long periods. It was shown in Paper 1 that the duration of the exposure played an important part in the chlorideabsorption process. If the overlay at Bjurholm Bridge is covered with slush during long periods of the winter, the observed highabsorption rate may be explained. The high absorption rates at Bjurholm Bridge (average speed 70 km/h in the winter) andLånghals Bridge (40 km/h) may also be due to the small amount of traffic and the relatively low speed. Bjurholm Bridge has alsooften snow-walls along the railings, which may further decrease the removal rate of the debris from the overlay since the snow-walls may hinder the debris from being transported away from the overlay.
Estimation of amount of chloride ions absorbed based on the CWD-test
If instead the amount of water absorbed in the CWD-test was used (October values), the amount of chloride ions absorbeddecreased significantly (except for sample GPL98), see table 8. Two different assumptions were used in table 8. First, all chlorideions absorbed were assumed to stay in the concrete and secondly 50 % of the chloride ions absorbed were assumed to bewashed out.
The first assumption lead to an overestimation of the amount of chloride ions absorbed for the bridges where de-icing agentswere frequently used. On the other hand, on Långhals Bridge, where de-icing agents were seldom used, the estimated amountscoincided with the measured amounts. One reason may be that the number of salt applications used in the calculations was lessthan in reality. If the number of salt applications was increased from 15 to 30 per year (which is a small increase in absolutenumbers) the results from Långhals Bridge would be similar to the other bridges in the investigation.
The calculated amount of chloride ions absorbed using the second assumption was fairly similar to the amounts present in theoverlay for all bridge except Långhals Bridge and core Sö15 (samples Sö15a and Sö15b). The anomalies for core Sö15 may bedue to the effects of different microclimate on the bridge, see figure 9. If for simplicity, the amount of chloride ions reaching thezone where core Sö15 was drilled, was estimated to 50 % of the amount reaching the other two samples, the calculated amount isclose to the measured amount of chloride ions. The proposed method, taking the effect of the wash out in consideration, maypredict the amount of chloride ions absorbed fairly accurate.

27
Table 8. Estimated amount of chloride ions absorbed due to CWD and total chloride content in the samples
Sample 6 habs.CWDkg/m²
Cl-
abs.g/m²
Numberof saltapplic.per year
Chlorideabsorbedg/m²year
Age
year
Total Cl-
abs.g/m²
Total Cl-
abs. 50 %wash outg/m²
Total Clmeasuredg/m²
Total Clmeasuredg/m² year
Sö10 0,117 0,70 120 84 7 590 300 210 30Sö13 0,100 0,60 120 72 7 500 250 170 24Sö15a 0,137 0,82 120 99 7 690
(340)340(170)
150 21
Sö15b 0,140 0,84 120 101 7 690(340)
340(170)
150 21
Mean 0,124 0,74 89 620 310 170 24M1B 0,116 0,70 20 14 9 120 60 50 6M2B 0,109 0,65 20 13 9 120 60 50 6Mean 0,113 0,68 14 120 60 50 6Ö11 0,104 0,62 70 44 9 170 80 110 12Ö12 0,101 0,61 70 42 9 160 80 120 13Mean 0,102 0,62 43 160 80 120 12B13 0,145 0,87 30 26 10 260 130 90 9B14a 0,171 1,03 30 31 10 300 150 90 9B14b 0,246 1,47 30 44 10 440 220 90 9Mean 0,187 1,12 34 340 170 90 9V11 0,080 0,48 90 43 8 350 170 80 10V12 0,093 0,56 90 50 8 400 200 70 9Mean 0,087 0,52 46 480 180 80 10U12 0,148 0,89 110 98 8 780 390 120 15U13 0,112 0,67 110 74 8 590 300 130 16Mean 0,130 0,78 86 680 340 120 16L12 0,098 0,59 15 9 8 70 40 80 10L13 0,122 0,73 15 11 8 90 40 90 11Mean 0,110 0,66 10 80 40 80 10GPL 1.2 0,150 0,90 70 63 5 3201 1601 Not exp1 Not exp1
GPL 4F 0,125 0,75 70 53 5 2601 1301 Not exp1 Not exp1
GPL 4G 0,151 0,91 70 63 5 3201 1601 Not exp1 Not exp1
Mean 0,141 0,085 60 300 150GPL98 0,078 0,47 70 33 5 160 80 1302/110
3262/223
1. Samples stored in lab and therefore not exposed to de-icing agents. Results shown for comparative reasons. 2. Total chloride content May 6,1998. 3. Total chloride content Oct 11, 1998. Approximately 20 g/m² has leaked out of the concrete during five months.
Distribution of chloride ions

28
A prediction of the time needed for the threshold value to reach the reinforcement in a de-icing environment based on theabsorption of de-icing water consists of two parts. First, the amount of chloride ions absorbed has to be estimated, which theauthor has shown can be made. Secondly, the distribution of the chloride has to be dealt with. If for simplicity a triangulardistribution is assumed, the service life could easily be calculated, see figure 10a and example 5. The triangular distribution maybe a reasonable approximation if the anticipated service life is long. The triangular distribution is also motivated by the chlorideprofiles from Gullmarsplan Bridge after 4,3 and 4,8 years in service, see figure 10b. Other distribution may of course be used.
Figure 11a. Assumed triangular chloride ion distribution. b. Distribution of chloride ions at Gullmarsplan Bridge after 4,3and 4,8 years.
0
10
20
30
40
50
60
0 0,2 0,4 0,6 0,8 1 1,2 1,4 1,6 1,8 2
Chloride concentration Cl/C (%)
Dep
th (m
m)
GPL981011
GPL980506
Wash out
0
50
100
150
Depth (mm)
0 0,5 1 1,5 2 Cl/C
Real chloride profileAssumed triangular distribution at the top
Reinforcement
X
TV=0,6 %
X-CC
CC
a)
b)
Cs

29
years Life, Service
yearkg/m,yearper absorbed ions chloride ofAmount
kg/m,concretein content Cement
kg/m,absorbed ions chloride ofamount Total
% Cl/C ion,concentrat Surface
m triangle, theofheight
m Cover, Concrete
% Cl/C value,Threshold
where
years 401022100)4,02(2
520136,02 :GPL Example
100)(2
)(10021002
)(
)(
2absyear
3con
2abstot
s
3
2
absyears
con2
absyear
abstot
s
con2
conabstot
s
s
s
==
=
=
==
==
=⋅⋅⋅−⋅
⋅⋅
⋅⋅⋅⋅⋅
==
⋅⋅⋅⋅
=⋅
⋅⋅=
⋅=
=−
−
SL
Cl
C
Cl
C
X
CC
TV
Cl-TVC
CCCCs
Cl
ClSL
-TVC
CCCCsCXCsCl
-TVC
CCCX
X
C
CCX
TV
5 EXAMPLE
The service lives in table 9 have been estimated with the SLC established for each bridge. Södertälje Bridge had shorter servicelives than the other bridges in the investigation mainly due to the large amount of de-icing agents used and the SLC establishedfor flat slabs, se Paper 6. The height of the overlay should be at least 100 mm and a hydrophobic treatment should be consideredwhere the chloride exposure is severe. This would increase the estimated service life from 17 to 50 years to a low total cost anddecrease the annual cost considerably.
The method in example 5 probably underestimates the service life for concrete bridge decks with overlays with w/b-ratios ofapproximately 0,4 or less, where diffusion is the dominating ingress mechanism in the interior part. The low diffusion coefficient(low w/c-ratio and low RH) makes the redistribution of the chloride ions slow and the chloride ingress rate low in the interior partof the overlay. The real service life of the bridge decks is probably longer than given in table 9.
However, the prediction serves as a lower bound for the service life of the bridge deck and method is still useful qualitativelysince it explicitly shows the influence of the surface concentration, threshold value, concrete cover and the amount of chlorideions absorbed. The latter is in turn a function of the absorption properties of the concrete and the salt-exposure (amount andfrequency). The effect of changes can be estimated with the method. This is important since the de-icing procedures in Swedenare currently under debate and large changes have occurred during the last ten years (Swedish Community Association, 1991)and the final de-icing method is still to be found. In Stockholm, the use of saturated NaCl-solutions instead of dry salt hasdecreased the amount of chloride ions spread from 7-12 g/m² to 2-3 g/m². The use of crushed sorted sand without any NaCl hasalso grown rapidly in some areas in Sweden and the supply of chloride ions have there been shut off completely. The servicelife prediction can also easily be updated every ten years by simply taking some new samples close to the previous samples andsee how the chloride absorption rate changes in time.
Table 9. Service lives estimated with triangular chloride ion distribution and the measured average yearly amount ofchloride ions absorbed.
Sample Clabsyear
g/m²yearCs
%TV%
CCmm
Ccon
kg/m³SLyears
Sö10 30 2,0 0,4 83 420 14Sö13 24 2,0 0,4 83 420 18Sö15a 21 2,0 0,4 83 420 21Sö15b 21 2,0 0,4 83 420 21M1B 6 2,0 0,6 116 420 116M2B 6 2,0 0,6 116 420 116

30
Ö11 12 2,0 0,6 71 420 36Ö12 13 2,0 0,6 71 420 33B13 9 2,0 0,6 61 420 41B14a 9 2,0 0,6 61 420 41B14b 9 2,0 0,6 61 420 41V11 10 2,0 0,6 81 440 51V12 9 2,0 0,6 81 440 57U12 15 2,0 0,6 75 450 32U13 16 2,0 0,6 75 450 30L12 10 1,5 0,6 105 375 49L13 11 1,5 0,6 105 375 45GPL98 22 2,0 0,4 136 520 40
The service life of Mälsund Bridge was the longest in the investigation due to the large height of the overlay (and low spread)and the low amount of de-icing agents used on the bridge. Överboda Bridge was exposed to more de-icing agents than MälsundBridge and the amount of chloride ions absorbed was larger for Överboda Bridge. The overlays on the two bridges had identicaldry mixes but different height of the overlays. The service life for Överboda Bridge was 50 % of Mälsund Bridge due to thetougher de-icing exposure and decreased height of the overlay.
Bjurholm Bridge had the smallest height of the overlays in the investigation and the overlay was porous due to insufficientconsolidation. However, since the amount of de-icing agents used was low, the service life was still acceptable. The longservice life for Viktoria Bridge was due to the large concrete cover and the low chloride absorption.
Clear (1976) conducted a test where the chloride ion penetration in a simulated de-icing environment was studied. Concretemixes with w/c-ratios from 0,32 to 0,6 were exposed to 830 daily salt applications outdoors with a water solution, 1,6 l/m², with 18g/l chloride ions. As expected, decreased w/c-ratio resulted in decreased chloride ingress rate and amount of chloride ionsabsorbed. Some of the results are shown in table 10.
Table 10. Total amount of chloride ions absorbed after 830 de-icing cycles (Clear, 1976)
w/c Consolidation%
Totalchloridecontent1
g
Chloride absorbed ineach cycle2
g/m²
Water absorbedin each cycle3
kg/m²
Cover needed tolast 830 salt cyclesmm
0,32 98 140 0,17 0,009 360,32 94 280 0,34 0,019 860,4 98 180 0,21 0,012 440,5 98 370 0,45 0,025 730,6 98 430 0,52 0,029 931. Calculated by the author. 2. Calculated by the author. 3. Calculated by the author. The chloride content in the water was 18 g/dm³.
The total amount of chloride ions in the properly consolidated overlay (w/c-ratio 0,32) was in same order as for SödertäljeBridge, Överboda Bridge and Umeå Bridge with fairly similar total number of de-icing cycles. Clear (1976) wetted the concreteevery day meanwhile the CWD-tests let the concrete dry out during 66 h. All together was 24 kg/m² of chloride ions applied andthe absorption ratio varied between 0,006 to 0,018, i.e. considerably less than in table 13. This could be due to the shorterduration of the drying time.
The consolidation was found to have a significant effect on the chloride ingress. Properly consolidated concrete with a w/c-ratio of 0,32 was found to resist the chloride ingress better than concrete with a w/c-ratio of 0,4. However, if the consolidationwas done inadequately the mix with w/c-ratio 0,32 had significantly less resistance to corrosion than the mix with w/c-ratio 0,5.Al-Khaja (1997) made similar observations. The observations may confirm the results obtained by the author, that improperconsolidation increases the amount of de-icing water absorbed and, therefore, also the amount of chloride ions absorbed.
Estimation of amount of chloride ions absorbed based on the indoor CWD-test
Repairs with bonded concrete overlays are often used for parking facilities and they are, therefore, briefly commented here.Indoor heated parking facilities have been proven to be vulnerable to chloride induced corrosion (ACI, 1985a) and ACI (1985b)suggests that extra concern is needed for structures exposed to CWD in a chloride environment. The environment in heated

31
parking facilities can be both hot and dry, especially during the winter when the moisture content in the air outdoors is low.These conditions increase the amount of water (chloride ions) absorbed in each cycle, and possible also the chlorideconcentration in the absorbed water since some of the de-icing water may evaporate. The amount of chloride ions washed outof the concrete is also low due to the lack of precipitation.
A simple estimation of the amount of chloride ions that might be absorbed at a frequent used indoor parking spot is showed inexample 6. It is assumed (based on rough measurements) that the parking spot receives 1 kg de-icing water/slush at eachoccasion de-icing agents are used. The chunks of slush that builds up behind the wheels are later deposited on the parkingspot. If the slush is assumed to have a chloride content of 6 g/l, the average chloride concentration per weight of cement in theentire concrete deck after 25 years in service (60 de-icing occasions per year) would be approximately 1,3 %. Chloride ionconcentrations of similar magnitude or higher have also been found in parking structures in Sweden after 25 years in service(Kjellser, 1997, and Kjellser, 1998). The observation indicates that the simple calculation may predict magnitude of the chlorideabsorption reasonably accurately.
3con
con
abstot
23absabstot
233concabsabs
2abs
kg/m,concretein content Cement
m slab,deck parking theofheight
% cement, of per weightion concentrat Chloride/
m,spot parking ofLength
m spot, parking of Width
kg ),(estimatedoccasion icing-de andspot parkingper water icing-slush/de ofAmount
where
/%3,13502,0
90,0/
kg/m90,0106,06025
kg/m 106,01061,0
kg/m1,052
1
=
==
==
=
≈⋅
=⋅
=
=⋅⋅⋅=⋅⋅=
⋅=⋅⋅=⋅=
=⋅
=⋅
=
−
−−
C
h
CCl
L
B
Slush
CClCh
ClCCl
ClNAgeCl
ClWCl
LB
SlushW
6 EXAMPLE
An interesting preventive measure has been adopted for a parking facility in Gothenburg. The owner of the garage installedequipment to rinse of the bottom and the wheels on cars that entered the parking facility. The rinse was for free for the carowner but the cost for the garage owner was counteracted by less chloride ions entering the garage. The car owners were alsosatisfied. The example shows that other measures than water proofing and low w/c-ratios can be useful.
Effect of hydrophobic treatments
A hydrophobic treatment can be an effective method to decrease to chloride uptake in the exterior part of the concrete. Thetreatment may also decrease chloride ingress rate behind the absorption zone since less chloride ions will be present in theabsorption zone. Al-Gahtani et. al. (1999) concluded that both a silane and a siloxane treatment decreased the amount of waterabsorbed during CWD with approximately 50 %, which would at least double the service life for the overlays. Basheer et. al.(1998) also showed that silane treatment was effective in reducing the amount of chloride ions absorbed during both pondingand cyclic wetting and drying. Bush et. al. (1997) showed that a silane treatment was effective in decreasing the amount of waterand chloride ions absorbed. Bush et. al. (1997) also compared a smooth finish with a tine finish (with larger exposed area) andconcluded that a tine finish increased the amount of absorbed water and chloride ions. This indicates that it is the increase ofthe exposed surface that is responsible for the increased amount of water and chloride ions absorbed by the concrete. They alsoconcluded that the skid resistance was unaffected by the silane treatment which makes it suitable for concrete overlays. Thewear could also decrease if the time of wetness for the surface is decreased (Karlsson, 1999).
CHLORID INGRESS INTO SOLID AND CRACKED CONCRETE (PAPER 4 AND 9)
The SC established (Papers 1 and 9) were used with numerical methods to solve Fick’s second law of diffusion to evaluate theeffect of different SC that varied in time. Both solid and cracked concrete was studied (Paper 9). The apparent diffusioncoefficients were established with a least square algorithm using several accurate chloride profiles from two overlays. Concretewith fairly similar compositions in fairly similar environments but from different bridges had similar least square fit DC using the

32
established SC. The observation indicates that the approach yield similar results for similar bridges, i.e., the approach isconsistent.
The following conclusions are based on numerical extrapolations from measurements on five to ten years old concrete overlays.The chloride ingress rate was clearly affected by the different SC studied but the differences decreased with the duration of theexposure. The wash out of chloride from the top part of concrete overlays due to melting snow and rain observed in field couldbe simulated fairly accurately. Chloride ions accumulated at the soffit of the bridge deck and the effect was larger for thin oldconcrete bridge decks than for thick ones. The DC in the old concrete did not significantly affect the chloride ingress rate if theoverlay was 100 mm thick or more. However, the effect increased for thin overlays and thin old bridge decks.
The calculated mean amount of chloride ions that penetrated into the overlay was in the same order as measured. Stopping theuse of de-icing agents was beneficial up to 40 to 50 years. However, after 50 years of exposure the amount of chloride ions in theoverlay was so large that a shut off of the supply at the wear surface did not significantly decrease the ingress rate of thethreshold value (0,6 % Cl/C). This imply that a decrease of amount de-icing agents used should first be considered for relativeyoung bridges since the effect will be larger than for older bridges. In Sweden, many bridges along a certain part of a road havesimilar age (Racutanu, 1998) since the road was often build during only a couple of years. To change the de-icing procedures forbridges with a certain age may, therefore, be a realistic option.
Cracks affected the ingress rate considerably but the effect was not too severe if some cover to the reinforcement wasremaining. The effect of the SC on the ingress rate of the 0.6 % front (threshold value) was limited for cracked concrete, too.However, if the old concrete was incorporated (increased DC in lower part of the specimen) the ingress rate of the 0,6 % frontwas high. The fit with the measured chloride profiles from cracked concrete was not so bad and the prediction overestimated theingress rate in the top part, i.e., the prediction was on the conservative side.
ALTERNATIVE MATERIAL AS REINFORCEMENT
There are several possibilities to decrease or eliminate the main problems related to corrosion of repaired concrete bridge decks.Use of corrosion resistant or slow-corroding materials is one of them. There are several types of non- or slow-corroding materialon the market today but epoxy coated regular steel and stainless steels are the most common in practice even though differentcomposite materials are available.
Epoxy coated reinforcement
The main concerns with epoxy coated reinforcement are the price for the installed reinforcement, which could be 150 % higherthan for regular re-bars, the sensitivity to handling on the construction site (no rough handling, little rain and UV-radiation etc.)and the behaviour of the coating at cracks. If the epoxy coating is worn down by displacements in the crack, the protection maybe lost at the location where it is really needed. Weyers et. al. (1998) concluded that epoxy-coated reinforcement was not cost-effective.
Epoxy coated reinforcement has been used in several countries during some years and the experiences have been both good(Pettersson and Sederholm, 1990) and bad (Manning, 1996). Manning (1996) discusses the advantages and the disadvantagesof epoxy-coated reinforcement and also provides information regarding the history of the use of the development of epoxy-coated reinforcement in North America.
Walker (1998) concluded that epoxy coated reinforcement could be easily damaged in the construction process and that thereduced bond between concrete and epoxy coated reinforcement increased the widths of flexural cracks. He, therefore,suggested that epoxy coated reinforcement should not be used. The decreased stiffness of the member in turn (author’s remark)could increase the displacements in the crack during the service life and increase wear of the epoxy coating. Matta (1998) hadsimilar experiences as Walker (1998). Matta (1998) further concluded that the equipment and procedures for transportation,storage, bending, cutting and installation of epoxy coated reinforcement were often the same as for black reinforcement eventhough epoxy-coated reinforcement needs to be handled with more care that black steel. This fact resulted in damages of thecoatings, both visible and invisible, that seldom were repaired. The repairs of the epoxy layer could also be hazardous for thelabourers.
Stainless steel
Stainless steels are, on the other hand, easy to handle, do not invoke any new hazardous procedures for the workers and thecorrosion protection is probably adequate at cracks. The price of the material is today approximately 200 % higher than the pricefor conventional reinforcement. It is, therefore, a bit more expensive to use than epoxy coated reinforcement if equal amount of

33
steel is used in the structure and the cost for the careful handling of the epoxy-coated bars is excluded. However, manystainless steels have higher tensile strength and yield strength than regular and epoxy-coated reinforcement and if the highertensile strength is considered the cost of using stainless steel will be reduced if increased crack widths can be accepted.
Some of the regular reinforcement used in most new bridges in Sweden is needed to meet the demand on small crack widths setby the Swedish Bridge Code (Bro 94). The ultimate load capacity could often be secured with less reinforcement. Ekman (1997)showed that if the maximum crack widths could be increased the amount of reinforcement could be decreased with 50 % forsome bridges in de-icing environments. If the maximum allowed crack widths were increased due to the use of stainless steel, thecost of using stainless steel would be lowered substantially since less reinforcement would be needed. The cost of installing thereinforcement would also decrease markedly since the last 20 to 30 % of the regular reinforcement cost a lot more to install (perunit), mainly due to lack of space in the formwork, than the first 70 to 80 %.
Matta (1998) concluded that if epoxy coated reinforcement should be used strict control and supervision of all work werenecessary. The extra cost should be added to material cost and (author’s remark) the total cost of using epoxy coatedreinforcement and stainless steel could in practice be fairly similar. However, the probability that the structure will get itsanticipated service life will probably increase with the use of stainless steel (less sensitive to mistakes) and this option may,therefore, be a better alternative than using epoxy coated reinforcement.
The blue prints could also be simpler and cheaper to produce. The blue prints could also be easier to use at the constructionsite. The design would be simpler and cheaper since the calculation of crack widths (live loads, shrinkage and temperature) andtemperature calculations for the fresh concrete could be simplified (or eliminated). The total cost for using stainless steel (atleast selectively) in repairs or in new bridges may, therefore, not increase at all compared to the use of regular reinforcement. Ifan increased safety margin is included in the cost comparison, the extra cost for using stainless steel compared to conventionalsteel may be accepted. The author strongly supports the selective use of stainless steel for both repairs and for new structures.Two examples will be given later.
There are also environmental concerns. The environmental impact of the bridge may decrease if only half the amount of thereinforcement is needed. The w/c-ratio of the concrete may also be increased and the cement content in the concrete decreasedsince less resistance to carbondioxid and chloride ions is needed. In fact, the entire bridge may be allowed to carbonate andexplicitly designed to carbonate fast. This could decrease the impact of the carbondioxid exhaust from the manufacturing ofcement to approximately 50 %.
The use of stainless steel as reinforcement is increasing, especially in harsh environment. The long-term properties have beenquestioned by many and reports of the long-term properties are scarce. However, McGregor (1998) reported that stainless steel(316, austenitic, tensile strength 520 MPa, thermal expansion 17·10-6 (°C)-1 (Sakumoto et. al., 1996)) used as reinforcement withonly 20 mm of concrete cover showed no signs of corrosion or other damages after 20 years in service in a severe marineenvironment. Conventional reinforcement (black steel) with similar cover in adjacent members in the same environment hadspalled badly. This clearly indicates the superior corrosion resistance of stainless steel in the long term. McGregor did notreport any problems with the larger thermal expansion than conventional steel. However, there are also stainless steels withsimilar thermal expansion as conventional steel.
Johnsson (1999) reported that so-called acid-proof stainless steel (18/8/3) were unaffected after ten years exposure in coastalareas with spray of seawater. The test specimens were partly cast into concrete and partly exposed to the outdoorsenvironment, i.e., the type of exposure a re-bar would experience in cracked concrete. This clearly indicates that there arestainless steels available today that can sustain corrosion in cracked concrete.
The risk of galvanic corrosion between stainless steel and regular reinforcement is negligible for reinforcement in concrete(Sandberg et. al., 1996). The steel types could even be welded together.
Repair methods with stainless steel
There are several failure mechanisms for the deck and some of them have been discussed in Paper 6. Two of the failuremechanisms and the precautions to avoid them are discussed below.
Failure due to negative momentThere is a simple method to decrease the risk of failure due to negative moment (tensile forces in upper reinforcement). Thecause of failure is probably corrosion in the upper reinforcement in the old concrete bridge deck initiated by chloride ions. Theattack will be concentrated to reflective cracks caused by construction joints in the old deck and the attack will thereforeprobably be local.

34
If the upper reinforcement in the old bridge deck is “replaced” with stainless steel reinforcement (or other “non”-corrodingreinforcement) in the bonded overlay, the negative moment capacity can be secured to a reasonable cost, see figure 12. Theincreased height of the deck (effective depth of new reinforcement) due to the bonded overlay lowers the amount of steelneeded to maintain the moment capacity. The cost for using enough stainless steel in the overlay to “replace” the oldreinforcement with respect to negative moment capacity for Viktoria Bridge was more or less the same as using 60 kg/m³ steelfibre in the concrete mix. The reinforcement in the old deck had a tensile strength of 410 MPa. The amount of stainless steelneeded (both transversal and longitudinal direction included) was only approximately 6 kg/m² (4 to 8 kg/m²) if stainless steelwith a tensile strength of 590 MPa was used. The risk of corrosion below the reflective cracks in the overlay decreases too sincethe stainless reinforcement in the overlay decreases the crack width and, therefore, decrease the ingress rate of water, oxygen,carbondioxid and chloride ions (Schiessel and Raupach, 1998).
Figure 12. Bending negative moment.
Failure due to positive momentThe main problem for some of the repaired concrete bridge decks was corrosion of the lower reinforcement due to carbonationof the bottom part of the deck (the soffit). Many bridge decks in Sweden have reached a stage where repair of this type ofdamages is urgent. There are several options available but if the carbonation front has reached the reinforcement all concretesurrounding the concrete must be removed and new concrete installed (Fagerlund 1980). This type of repair is troublesome andcostly and the bridge deck may have to be closed for traffic.
A cathodic protection system may be used instead and there are several structures in Sweden today where cathodic protectionsystems are installed and perform satisfactorily (Berntsson et. al., 1995, Sederholm, 1994). However, cathodic protection mayneed regular maintenance and adjustment (Camitz and Pettersson, 1990) since the system itself generates changes inside theconcrete, which has to be considered until the system has stabilised. Daily and seasonal temperature and moisture variations inthe concrete may also create some problems with cathodic protection systems.
The propagation period for corrosion of the lower reinforcement in the concrete bridge deck can be extended (some crosssection may be lost) due to the increased effective height (40 to 60 %) of the bridge deck after that the overlay has beeninstalled, see figure 13. The loss of some bond due to spalling may merely increase the deflections (Cabrera, 1996) but theappearance of the soffit might be bad. There will also be a risk that pieces of the concrete will fall and cause damages on manand properties. However, the effect of the propagation stage on the service life is only minor since the corrosion probablypropagates fast due to the high w/c-ratio (0,5-0,65), fair supply of oxygen and that the RH varies between 88 and 92 % (Paper 8)in the lower part of the bridge deck.
If the soffit is treated with a silane or siloxan, the RH in concrete might be lowered and the corrosion rate decreased. This may bean effective alternative to prolong the propagation stage (Karlsson, 1999). However, there is always problematic to apply anagent to a soffit. Many soffit are only accessible with the help of a mobile crane and the work does not have to hinder the flowof traffic on the bridge but possible the traffic under the bridge. The exposure time for many silane or siloxan treatments needsto be at least a couple of hours but preferably 24 hours (Swedish County Association, 1997). The effect of the treatment is alsodependent on the moisture state of the concrete.
The consequences of the use of silane or siloxane should always be investigated closely. The use may increase the carbonationrate and decrease the initiation period. Chloride ions bound in the concrete may also be released by the carbonation processand the risk of chloride initiated corrosion may be unaltered even though the chloride supply at the surface is shut off or at leastdecreased.
Bonded concrete overlayExisting water jetted concrete bridge deck
170 mm 260 mm The effective depth mayincrease with 40 to 60 %
Use enough stainless steel (6 kg/m²) in the overlay to secure themoment capacity even though “middle” reinforcement is lost due tocorrosion
170 mm 210 mm The effective depthincreaseswith 20 to 30 %
>50 mm

35
Figure 13. Bending (positive) moment. The lower reinforcement may corrode due to carbonation or chloride ingress in thebottom part of the old concrete bridge deck.
However, the positive moment capacity of the deck provided by the lower reinforcement may be restored by using the newoverlay and install new reinforcement (stainless steel) in the overlay, see figure 14. The idea is to use the old upperreinforcement as lower reinforcement for the composite bridge deck and to add enough stainless steel at the right location in theoverlay to secure adequate positive moment capacity. The new bonded overlay (often strength grade K50 or more) will handlethe compressive stresses.
A simple calculation of the moment capacity of the bridge deck on Viktoria Bridge before the repair served as reference valuesfor the two principle moments (positive longitudinal and transversal, i.e., tensile stresses in the lower reinforcement) in the deck.The lower reinforcement was neglected (considered to be lost) and the moment capacity was restored with help of the overlay(K50) and stainless steel with a characteristic tensile strength of 590 MPa (Falkland, 1997). The calculations showed that for abonded overlay with a height of 110 mm, 10 kg/m² stainless reinforcement is needed (diameter 10 mm, s-125 mm in twodirections) to restore the moment capacity of the deck in both directions. This will not add any extra weight to the bridge decksince the isolation, protective concrete and asphalt wear course are removed. Less stainless steel will be needed if either thestainless steel is positioned further down in the overlay or (and) if the height of the overlay is increased but the latter will alsoincrease the weight of the deck.
However, increased weight can be compensated by using reduced safety factors for the permanent loads if the true dimensionsand densities of the materials are used (Brite/Euram, 1997). A reduction of the load factor from 1,35 to 1,15 may allow the overlayto be increased from 100 to 150 mm. The most cost-effective solution can be established for each bridge deck but it is out of thescope for this work.
Figure 14. Bending positive moment. The lower reinforcement may corrode due to carbonation or chloride ingress in thebottom part of the old concrete bridge deck. Stainless reinforcement is placed in the overlay and used with the concreteoverlay.
There are stainless steels that can sustain a chloride concentration of up to 5 % per weight of cement (BHB Material, 1994, andSandberg, 1995). The highest chloride concentration per weight of cement in the surface during a winter in Stockholm was 3 %(Paper 9). It is therefore likely that corrosion would never occur in the overlay. The accuracy of the estimated service life for therepaired bridge decks may also increase since one of the degeneration processes (maybe the most important) may beoverlooked. Increased accuracy may (alone) justify an eventual extra cost of using stainless steel.
Use enough stainless steel (10 kg/m²) in the overlay to secure themoment capacity even though lower reinforcement is lost due tocorrosion
110 mm 80 mm
Use the old upperreinforcement as lowerreinforcement

36
CONCLUSIONS
Repair with water-jetting and bonded concrete overlays is a reliable and versatile repair method for concrete bridge decks. Theoverlay and the eventual reinforcement can be tailor made to give the repaired bridge deck the needed functions on mostbridges to a competitive cost.
The production stage is crucial for bonded overlays. The water-jetted surface has to be cleaned carefully both immediately afterthe water-jetting and just prior placement of the overlay in order to achieve a strong bond, which is fundamental for a durablerepair. The bond was unaltered or had increased after approximately ten years in service and the service life with respect tobond is long, probably at least fifty years.
Most damages (cracks) found on the overlays after ten years in service could also been found ten days after the overlay wasplaced. These (shrinkage) cracks can be avoided using proper curing procedures. The main drawback with cracks is that theyincrease the chloride ingress rate. The use of stainless steel in the overlay may further improve the effectiveness of the methodand substantially decrease the impact of any mistake at the production stage and thereby increase the service life of the bridgedeck and decrease the annual cost.
The resistance to wear and rutting was adequate for concrete overlays in the investigation. Simple adjustments of the design ofthe repair could prolong the service life with respect to rutting for overlays with high traffic volumes and narrow lanes withoutincreasing the annual cost.
Expansion joints should be designed and maintained so that a smooth transition on to the bridge is possible. Uneven expansionjoints may increase the dynamic factor considerably.
The salt-freeze-thaw resistance was good or very good for the overlays in the investigation. Deterioration due to frost was not aproblem even though the yearly number of salt-freeze-thaw cycles on the wear surface could be as high as 20.
A probabilistic approach should be used in service life predictions with respect to chloride initiated corrosion. In order to do so,the distribution of the parameters in the prediction method needs to be quantified.
The height of the concrete overlays was fairly normal distributed. Documentation of the real height of the overlay by thecontractor is a simple and cheap way of increasing the accuracy of the predicted service life.
Different service life criterion could be used on different members depending on the consequences of a failure. Secondary loadcarrying statically indeterminate members should have higher service life criterion than primary statically determinate loadcarrying members.
The so-called moving boundary method may predict the ingress of the chosen threshold value accurately. The method is easy,cheap and fairly insensitive to however performs the service life prediction since nothing has to be “guessed”. However, alarger study is needed to investigate if the method works. If so, the method will simplify service life predictions of existingstructures.
The total amount of chloride ions absorbed could be estimated by establishing the CWD-properties under relevant conditionsand the average chloride content in the de-icing water. The service life could also be estimated if a triangular (or other)distribution was assumed. However, the triangular distribution probably under-estimated the service life.
The chloride content in surface water and in the wear surface of the concrete varied in both time and space domain. Theenvironment and the concrete surface clearly interacted. Chloride ions accumulated fast in the concrete surface during coldperiods when the surface was covered with a chloride contaminated slush, but a large part of the accumulated chloride ions waslater washed out of the surface due to melting snow and rain.
The chloride ingress was slow for solid parts of the overlay and limited in the cracked parts. The service life was approximately80 till 100 year for solid parts and 40 to 80 years for the cracked parts. However, the service life ought to be prolonged bytreating the relatively few cracks with a hydrophobic treatment.
An overall repair and maintenance plan should always be made before the repair works start. This would force the engineerdesigning the repairs to consider the regular maintenance that all structures need. The maintenance could then be simplified by

37
adjusting details so that certain measures could be taken at later stages of the bridge decks’ service life to a low cost and withlittle disturbance to traffic.
RECOMMENDATIONS
Durability of concrete structures is a field that has been subjected to intensive research the last twenty years. However, theresearch has mainly been focused on the concrete material and not on the performance of the in-situ structures. The newconcrete mixes have sometimes caused problem in-situ with workability, early loss of water etc. The concrete mixes developed inlaboratory have not always produced durable structures in-situ, mainly due to workability problems and shrinkage cracking.Many mixtures have been found to be sensitive to early loss of water, elevated temperatures, delays at the construction site etc.
The main error in the durability strive has been the lack of understanding (or neglecting) that durability of a concrete structure(member) is not only a concrete material matter but also involves reinforcement, design, production technique and maintenanceplan, see figure 15 and Somerville (1992), Neville (1998) and Walker (1998) for a further discussions. The expected service life,the cost and the environmental impact are also parts of the durability issue.
Figure 15. Factors involved in the durability of (repaired) concrete structures.
Concrete
The material properties of concrete can be “tailor made” to meet certain demands both in laboratory and in-situ but the total costfor using concrete increases rapidly the more concrete mixes each concrete plant has to be able to deliver. The risk for errors, asdelivering the wrong concrete, may also increase. The amount of pre-testing and the number of parameters investigated for eachconcrete mix seem to be ever increasing as the knowledge of concrete increases. The cost for developing each new concrete mixis, therefore, also increasing. To exemplify: Radocea (1998) concluded that since every change in the silica fume and/or superplasticizer (SP) content would alter the chemical shrinkage of the concrete mix, every new mix had to be tested with respect tochemical shrinkage. The author agrees with Radocea that the relevant parameters for a concrete mix that is to be used should betested rigorously. However, the number of mixes used may have to be reduced in order to keep the costs down. The overallresult may otherwise be that concrete may be too expensive to use as a building material in the future.
Reinforcement
The author believes that the use of the current Swedish codes in most cases will produce concrete structures with theprescribed service life if the production is done with care, i.e., the concrete is dense and well cured and the reinforcement hasthe prescribed cover without using the tolerances systematically. If the environment is very aggressive, other precautions thandecreased w/b-ratio and increased cover can be taken. Non (or slow)-corroding reinforcement is a versatile alternative since theconcrete and the cover used on the structure may be unaltered. It may be a lot easier and cheaper to control that for example
Durability
Concretew/c-ratio
Mineral additivesChemical additives
AggregateSuper plasticizer
DesignBeam/Arch
Post-tensioningEnd-beam
Expansion jointConstruction joint
Aesthetic
ProductionCover (tolerances)
CompactionCuring
Maintenance planImpregnation
Sideways movement of trafficLevel of expansion joint
CleaningInspection
Service book
ReinforcementBlack steel
Stainless steelSteel fibres
Non-metallic materialNo reinforcement
Existing structureType of damage
Extent of damage
CostsExpected service life Environment

38
stainless steel has been installed in certain zones before the casting, than to control that the right concrete mix has been used atthe right location and that the concrete has developed the prescribed properties.
The same discussion may also hold for concrete covers. The use of wrong covers (for some reason almost always too smallcovers) is often believed to be due to mismatch between spacers and due to wrong interpretation of blue prints. The latter mayalso cause problems if two different steel qualities are to be used. However, the concrete construction industry has earlierworked with different steel qualities in the same structure for over 50 years in Sweden. It is also a lot easier to control thatstainless steel is installed (visible inspection) than to control (physical measurements) that the right covers have been obtainedand that the prescribed concrete properties have been obtained (often destructive testing which also may harm the structure).The total cost for using 10 to 20 % of stainless steel may therefore not be higher than for using special concrete and differentcovers to achieve the same service life.
Another important question is how the probability that the structures will get its prescribed service life is affected by the use ofdifferent measures. When a road agency purchase a structure, the buy incorporates a probability (even though seldommentioned or considered) that the designed and built structure will get the right properties (strength, durability etc.). Theprobability is an important part of the buy and how different strategies (stainless steel or decreased w/b-ratio in limited zones forexample) affects the probability should also be considered in economical terms before an alternative is chosen. The authorbelieves that keeping the production simple and easy to control in combination with regular non-announced inspections (notself-control) is a good way to achieve durable structures. The use of non (or slow)-corroding reinforcement in certain elements(end-beams, columns in the splash zone or exposed to splash of de-icing water) is also recommended.
Design
Buildability is an important feature of a structure (Somerville, 1992). The public demand on more eye pleasing structure havelead to slender, curved shapes often with relief in-prints (which may infer on the covers and gather water, chlorides and debris).These structures may be hard to build with the prescribed tolerances on concrete covers etc. Aesthetic considerations aretoday important (and should be in many cases) but the main task for the structure is to carry loads with an adequate safety levelunder its service life to a low total cost and low environmental impact. The influence of changes in the concrete composition foraesthetics (colouring etc.) on the durability parameters are often well documented before the new material is used, i.e., theknowledge of the material is, as often, good. However, the total influence of different geometry, in-prints etc. on the durability isprobably seldom considered. Bush (1997) showed that relief in-prints increased the amount of water and chloride ions absorbed.A more unified approach is needed in the future to make sure that new concrete structures meet the public demands on safety,aesthetics and cost.
The choice of structural system may also have an effect of the durability of the structure. In Sweden, old concrete arch bridgeshave been noticed to be durable even though less cover and higher w/c(b)-ratios were used than today. There are probablyseveral reasons to the observed good durability but the use of an arch (designed properly) to carry load does not induce cracksin the concrete arch due to self-weight. Moment from light live loads as cars may neither induce cracks but large vehicles willpossible cause the arch to crack. However, these cracks will probably close or at least have their widths decreased when theload is removed. The risk of corrosion may, therefore, be less than for regular concrete beams, which may crack due to dead loadand where the cracks may be open during its service life.
The development of concrete with compressive strength over 100 MPa that can be used in “normal” production has opened forseveral “new” concepts. Pre-cast concrete arch bridges with a span of 40 to 50 m where the full benefits of the high compressivestrength (no stability problems) can be used, is today a realistic solution. Interesting work in this field has been performed byAlmlöf (1998) and Redha (1998). They both concluded that if a two-hinged arch were divided into two similar parts, the partscould be handled at the plant, transported on regular roads without weight and length restrictions and erected fast at theconstruction site. The total cost for the bridge may be less than for an ordinary bridge. The horizontal forces induced by thearches could either be handled by the foundation or by tension rods below the road passing under the bridge.
Production
The importance and the influence of the production stage have to some extent been neglected by researchers even though weshould not fully depend on perfect workmanship (Somerville, 1992). A study was made by Stewart (1997) who concluded thatthe curing procedure in-situ was far from adequate. Only half of the investigated construction sites showed good curingprocedures. The consolidation of the concrete was done with better care than the curing but 13 % of the construction sitesreported lack of consolidation. Both curing and consolidation was found to be highly dependent on the skill and the vigilanceof the workers. The negative influence of lack of curing and/or consolidation on the durability of a concrete member needs nofurther comment today. Stewart also concluded that the costs associated with serviceability problems (large deflections etc.)were higher than costs associated to complete failures since the latter was scarce.

39
Bad curing procedures may be just as bad as no curing procedures. Matta (1998) showed that the use of wet hessians was goodcuring practice as long as the hessians were kept wet but if the hessians were allowed to dry they may actually remove waterfrom the concrete and if hessians were used they had to be continuously wet. Austin and Robins (1997) concluded thatconcrete mixes containing silica fume were especially sensitive to poor curing during the two first days after casting. The waterpermeability could increase with as much as 75 % if proper curing procedures were not used during the first two days.
The author strongly suggests that any contractor without a reference concrete overlay to show should be forced to perform atest section. The purpose is two-fold. First, it would give the owner of the bridge an opportunity to see if the contractor iscapable of producing smooth, well-cured riding surfaces. Secondly, it would give the contractor a chance to try and, ifnecessary, alter his production technique without any risk. The owner should always consider to have and inspector at allimportant and sensitive castings. The inspector should document all actions taken and make sure that adequate equipment andprocedures are used. The cost for the inspector is low compared to the costs for any non-documented errors in the productionthat may decrease the service life considerably. The information is valuable even though the contractor can not be maderesponsible for the errors since it is better to know if and where eventual problems are located.
The collaboration between the ready-mix plant and the contractor must be improved in the future. The contractor shoulddescribe how he wishes the fresh concrete to behave to the ready-mix plant and the discussion should start from there. It is thecontractor's need that is of primary concern. When the two parts have agreed and tested the concrete the contractor should notbe allowed to alter anything in the mix. If the concrete in one delivery (one truck) is too stiff, the concrete should immediately bedischarged since the ready-mix plant has not delivered the proper material. SP should not be added (if not by personnel from theready-mix plant) to the mix hoping that the concrete will get better workability since the freeze-thaw resistance of the concretemay be altered. The responsibilities between the two parts (contractor and ready-mix plant) will also be unclear if the contractormodifies the concrete and any claims from the owner may be hard to address properly.
Paulsson (1995) observed that concrete mixes were often modified by adding SP to the mix at the construction site byunauthorised and non-skilled workers. The general opinion on the construction sites was that the increased dosage of SP didnot alter any of the hardened concrete’s properties. This has clearly been demonstrated to be wrong.
Gagné et. al. (1996) showed that the dosage of SP affected almost every property of the hardened concrete. High dosage of SPin concrete mixes without silica fume (which may occur in steel fibre reinforced concrete) increased the internal bleeding of theconcrete. The bond to the aggregates was therefore reduced and the properties affected by the bond, e.g., flexural strength andwear resistant, were negatively affected. The freeze-thaw resistance could also decrease for non-air-entrained concrete. Theeffect of high SP dosage on concrete mixes containing silica fume was a lot less than for concrete without silica fume mainlybecause the silica fume decreased the separation for concrete mixes with high slump (> 220 mm).
Levio and Holt (1997a and 1997b) showed that the early shrinkage could increase as much as six times if the SP dosage wasincreased from 0,5 % to 1,5 %. The risk of shrinkage cracking could increase considerably if the SP dosage was increased. Theexample is just one of many where lack of knowledge in the production stage may have caused durability problems. Anotherproblem may be the freeze-thaw resistance of the concrete when SP dosage is increased without testing. The interactionbetween the air entraining agent and the type and dosage of SP used must always be tested in advance (Peterson, 1986).Peterson (1986) conducted an interesting investigation of the in-situ freeze-thaw resistance of thirteen new bridges in Sweden.He concluded that the spread was large but that the median values of the parameters commonly used to characterise an air-voidsystem met the demands from the regulations. However, at least 50 % of the bridges had only a fair air-void system. In thefreeze-thaw tests 20 % of the samples lost more material than 1,2 kg/m² which is inadequate. In most cases the air content wasproper put the specific surface was too low, i.e., the air pores were too large. This may be a result of unstable air pore systems inthe concrete. Some of the observed deviations from very good freeze-thaw resistance of in-situ samples from concrete overlaysin this investigation (Paulsson, 1997) may partly be due to varying SP dosage at the production.
How does the concrete industry avoid these errors in the future? Is really self-control the right way? The author believes thatcontrol, maybe in combination with fines, and increased collaboration between all parts involved could be one method todecrease the number of errors and their impact. The steel construction industry has also processes, which are of fundamentalimportance for the structural performance and the durability of steel structures. Welding is of major concern and the control isalso rigorous. Painting and surface treatments are important to achieve the durability needed. Booth these two processes aresensitive to workmanship but the steel construction industry seems to be able to control the situation. Is it not about time forthe concrete construction industry to show that it can handle its difficulties without increasing the cost?
Existing structure

40
Durability of a repaired concrete structure also involves the durability aspects of the existing structure. Its behaviour and futuredeterioration mechanisms must be investigated before any repair measures are considered. It may be so that other deteriorationmechanisms may start to affect the member in shorter time than the service life of the repairs. Could these deteriorationmechanisms be dealt with at the same time as the more urgent damages? This may save money and avoid (decrease) thedisturbance of the traffic at a later stage.
Maintenance plan
The maintenance plan is an important document (Somerville, 1992). There are several purposes with a maintenance plan. Thebasic purpose is obvious, i.e., to clearly show what type of maintenance is needed and at which intervals. This makes it possibleto estimate the total cost for keeping the structure in service for a certain service life, which is another purpose with the plan.
A third reason, which often is neglected in the design, is that by establishing a maintenance plan the engineers designing therepairs are forced to consider and prepare for how the future maintenance should be performed. The engineers are also forced toconsider and estimate the rate and the effect of different deterioration mechanisms and to design and detail the structure so thatthe maintenance work can be accomplished as simple and cheap as possible. Small changes in design and detailing before thestructure is built (repaired) may save considerably amount of money at later stages. The engineers could even make simpleproposals on how any damages due to “wear and tear” could be repaired.
A fourth reason for the maintenance plan is to highlight the need for certain actions for the road keeping authorities during theservice life of the bridge. Many repairs are nothing but delayed maintenance but if a “service book” is delivered with the bridgethe risk of neglected maintenance may decrease. The road keeping authority should then be forced to sign every year that theservice book is fulfilled. The service book could also make the predictions for financial needs for the road keeping authority forevery year easier. The service book could also be used to document all other measures taken. The cause of the damage, thestrategy with the repair and the final outcome of the repair (compressive and bond strength, concrete cover etc.) should alwaysbe documented.
Expected service life
The expected service life for a damaged bridge is important to evaluate closely before any other measures are taken. Forstructures in need of repair the expected service life could be anything from one year to 120 years or more. If a bridge may bereplaced in 20 years the repair work should at least provide the needed durability for 20 years. Any extra service life created bymore expensive repair work has to be questioned since it may not be needed.
However, the history has taught us that many infrastructures are kept in service longer and with larger loads than expected atthe design stage. The reconstruction of existing infrastructures is often hard due to practical reasons as disturbance of roadusers and high cost and the replacement is, therefore, often postponed time after time. An extra cost at the repair work may beworth it, since longer service life than the anticipated will often be considered in the end even for repaired structures. If the latterapproach is used, it should be explicitly notified in the repair document (and in the service book).
Costs
The possibility to quantify the annual cost for a certain structure (new or repaired) is one of the main reasons (but seldomcommented) to conduct service life predictions. There is always a competition for economical resources between different needsin the society. This is mainly positive (author’s remark) since it forces different groups, representing different needs, to thinktwice.
The maintenance plan and the service life prediction serve as basis for the estimation of the annual cost of a structure (repair).The entire realistic cost, based on true performance of different bridge elements and water-proofing systems (Racutanu, 1998),including cost for disturbance of road users and people living next to the structure, should be used. This is necessary in orderto make fair comparisons and to take full advantages of for example stainless steel.
Environment
The growing environmental concern is currently creating new standards for most parts of the society, including theconstruction industry. What was wrong a decade ago might be right today. A lot has happened but the author believes that thelarge changes are still to come for the construction and concrete industry.
The trouble for the concrete industry is that the current practice to design durable bridges has increased the amount of cement(low w/c-ratio and large concrete covers) and steel (small crack widths) used. Both the use of cement and steel has impact onthe environment since the manufacturing of the materials consume large quantities of energy. The limestone used in the cement

41
manufacturing releases carbondioxid, which may increase the so-called green house effect (Malhotra, 1999). However, thereleased carbondioxid can be bound again since concrete exposed to air carbonates and the process may fairly quick for dryconcrete with high w/c-ratios if the structure is designed (Silfwerbrand and Paulsson, 1999) to carbonate fast. The main (only)problem with the carbonation is that the passive film on black reinforcement is broken down and that this removes theprotection for corrosion for the embedded steel. However, if stainless steel is used the problem with carbonation is eliminated. Iffurther, the maximum crack widths is increased due to the superior resistance to corrosion of stain less steel the amount ofreinforcement can decrease with as much as 50 % (Ekman, 1997). The concrete cover may also be reduced, which saves concreteand decreases the dead load of the structure, which in turn further decreases the need for material.
A repair may be beneficial for the environment if the alternative is to tear down the structure and build a new one. The use ofnatural resources and the amount of wasted material (and the total amount of transported material) can be less for the repair thanfor the replacement alternative. If the annual price is the same for the two alternatives the repair might be chosen if theenvironmental impact is less. There are also techniques developed that can make the use of re-cycled aggregates easier anddecrease the cement content in concrete, see for example Silfwerbrand and Paulsson (1999), Paulin (1998) and Holm and Said(1998) and more innovations will come in the future.
FURTHER RESEARCH
The long-term effects of different repeated maintenance measures need to be evaluated closely. The cost and the environmentalimpact should of course be part of the studies in order to be relevant for practical use. The measures could be hydrophobictreatments and rinsing of (parts of) structures a couple of times during the de-icing season.
Fatigue due to strains caused by impact from uneven transition zone between road and bridge and uneven expansion joint(Paulsson, 1997) is a field that needs to be investigated. Uneven expansion joints may cause larger dynamic load factors thanstated in codes.
The overall economic and environmental impact of using non-corroding reinforcement or structures without internalreinforcement needs to be quantified in order to meet the public demand on cost- and resource effective structures with lowmaintenance and disturbance of road users. The focus on environmental friendly structures will increase in the near future.
Pre-cast (match-cast) post-tensioned concrete deck panels with bonded concrete overlays placed on girders may be aninteresting alternative. The use of post-tensioning is interesting since the inspection and replacement of reinforcement is easy ifthe system is designed the proper way.
A large investigation of different structures in de-icing environment need to be conducted in order to evaluate if the movingboundary method can be used to predict the ingress of a threshold value.
How do chloride profiles change beyond 35 or 40 years? Research in this area would increase the knowledge on how thechloride ingress proceeds at later stages. A simple approach could be to find a member that have been exposed to a certainenvironment for say 35 years and monitor the ingress and the micro-climate during the next five to ten years.

42
REFERENCES
ACI, 1985a“Corrosion of metals in concrete”, ACI Committee 222, ACI Journal, Vol. 82, No. 1, January-February 1985, pp. 3-32.
ACI, 1985b“State-of-the-art report on parking structures”, ACI Committee 362, ACI Journal, Vol. 82, No. 4, July-August 1985, pp. 544-578.
Al-Gahtani, S., S., Ibrahim, M., Maslehuddin, M., and Almusallam, A., A., 1999“Performance of concrete surface treatment systems”, Concrete International, Vol. 21, No. 1, January 1999, pp. 64-68.
Al-Khaja, W., A., 1997“Influence of temperature, cement type and level of concrete consolidation on chloride ingress in conventional and highstrength concrete”, Construction and Building Materials, Vol. 11, No. 1, 1997, pp. 9-13.
Almlöf, M., 1999“Technical, esthetical and economical possibilities for the use of pre-cast concrete arch bridges”, Master Thesis No. 117,Department of Structural Engineering, Royal Institute of Technology, Stockholm, Sweden, 1999, 44 pp. (In Swedish).
Austin, S., A., and Robins, P., J., 1997“Influence of early curing on the sub-surface permeability and strength of silica fume concrete”, Magazine of ConcreteResearch, 1997, Vol. 49, No. 178, March, pp. 23-34.
Basheer, L., Cleland, D., J., and Long, A., E., 1998“Protection provided by surface treatments against chloride induced corrosion”, Materials and Structures, Vol. 31, No. 209,August-September 1998, pp. 459-464.
Berglund, M., 1999Swedish National Road Administration, Luleå, Personal communication.
Berntsson, L., Johansson, M., Ljungqvist, L., and Åhman, P., 1995“Cathodic protection of concrete structures - Description and results from long term test”, Report 9508, FoU-WEST,Gothenburg, 56 pp. (In Swedish).

43
BHB Material, 1994“The Swedish Concrete Handbook – Material”, 2nd edition, AB Svensk Byggtjänst and Cementa AB, Stockholm, 1994, 1127 pp.(In Swedish).
Brite/Euram project 4062, 1997“The residual service life of reinforced concrete structures”, Manual for Assessment of Residual Service Life of ReinforcedConcrete Structures and List of Publications from the Project, Edited by Fagerlund, Report TVBM-7117, September 1997,University of Lund, Lund Institute of Technology, 318 pp.
Bush, T., D., Kamel, Jr., A., A., and Kalluri, P., A., 1997“Influence of field variables on laboratory performance of silane treated concrete”, ACI Materials Journal, V. 94, No. 3, May-June 1997, pp. 193-202.
Butler, A., 1997“Capillary absorption by concrete”, Concrete, Vol. 31, No. 7, July/August 1997, pp. 23-25.
Cabrera, J., G., 1996“Deterioration of concrete due to reinforcement steel corrosion”, Cement & Concrete Composites, 18 (1996), pp. 47-59.
Camitz, G., and Pettersson, K., 1990“Corrosion protection of steel embedded in concrete - Phase 1”, Off-print 3:90, Swedish Cement and Concrete ResearchInstitute, Stockholm, 1990, 70 pp. (In Swedish)
Clear, K., C., 1976“Time-to-corrosion of reinforcing steel in concrete slabs. V. 3: Performance after 830 daily salt applications”, Report No. FHWA-RD-76-70, Federal Highway Administration, Washington, D.C., 1976, 64 pp.
Covino, B., S., Cramer, Jr., S., D., Holocomb, G., R., Bullard, S., J., and Laylor, H., M., 1999“Postmorten of a failed bridge”, Concrete International, Vol. 21, No. 2, February 1999, pp. 39-45.
Ekman, M., 1997“Cracks in concrete structures and their influence on the durability”, Licentiate thesis, Bulletin No. 30, Department of StructuralEngineering, Royal Institute of Technology, Stockholm, Sweden, 1997, 102 pp.
Fagerlund, G., 1996“Calculations of the service life of concrete structures - Overview and examples”, Report TVBM-3070, Division of BuildingMaterial, University of Lund, Lund Institute of Technology, 124 pp. (In Swedish).
Fagerlund, G., and Svensson, O., 1980“Durability of repair system of concrete balconies”, Report No. 2:80, Swedish Cement and Concrete Research Institute,Stockholm, 1980, 264 pp. (In Swedish)
Falkland, M., A., 1997Avesta Sheffield AB (Valbruna), Avesta, Sweden, Personal communication.
Gagné, R., Boisvert, A., and Pigeon, M., 1996“Effect of superplasticizer dosage on mechanical properties, permeability and freeze-thaw durability of high-strength concreteswith and without silica fume”, ACI Materials Journal, V. 93, No. 2, March-April 1996, pp. 111-120.
Grace, N., F. and Abdel-Sayed, G., 1996“Double tee and CFRP/GFRP bridge System”, Concrete International, V. 18, No. 2, February 1996, pp. 39-44.
Halford, M., 1997“Chicago beach resort development, Dubai”, Concrete, Vol. 31, No. 7, July/August 1997, pp. 30-33.
Hoff, G., C., 1985

44
“Use of steel fiber reinforced concrete in bridge decks and pavements”, US-Sweden joint seminar (NSF-STU) on Steel FibreConcrete, Swedish Cement and Concrete Research Institute, Stockholm, 3-5 June 1985, Edited by Shah S., P., and Skarendahl, Å.,pp. 68-108.
Hildingson, O., 1989“Chloride- and moisture transport in concrete bridge columns”, Report No. 89033, Swedish Cement and Concrete ResearchInstitute, Stockholm, 1989, 61 pp. (In Swedish).
Holm, J., and Said, W., 1998“The use of the technique of lifting and lowering to construct dry and crack-free concrete slabs for residential housing”, MasterThesis No. 104, Royal Institute of Technology, Department of Structural Engineering, Chair of Structural Design and Bridges,Stockholm, Sweden, 1998, 92 pp. (In Swedish).
Ingvarsson, H. and Westerberg, B., 1986“Operation and maintenance of bridges and other bearing structures - State of the art. Report and R and D needs”,Transportforskningsberedningen, TFB Stencil 42, Stockholm 1986, 116 pp.
Johansson, L., Sundbom, S., and Woltze, K., 1989“Permeability - Tests and influence on the durability of concrete”, Report No. 2:89, Swedish Cement and Concrete ResearchInstitute, Stockholm, 1989, 65 pp. (In Swedish)
Johnsson, T., 1999“Fastening element for roofing material – Results after ten years field exposure”, Bygg & teknik , No. 2, 1999, pp. 41-42. (InSwedish).
Justnes, H., 1998“A review of chloride binding in cementitous systems”, Nordic Concrete Research, No. 21, 1/1998, pp. 48-63.
Karlsson, F., 1999Personal communication, Stockholm Konsult AB, Stockholm, Sweden, March 1999.
Kjellser, O., 1997“Quality assessment of parking structure in Gothenburg”, Swedish Cement and Concrete Research Institute, Stockholm, ReportNo. 97090, 1997-10-14, 13 pp. (In Swedish).
Kjellser, O., 1998“Condition assessment, UTLANDIA”, Swedish Cement and Concrete Research Institute, Stockholm, Report No. 98026, 1998-03-11, 20 pp. (In Swedish).
Krus, J., 1996“Environment- and function-induced degradation of concrete structures”, Doctoral Thesis, Bulletin No.18, Department ofStructural Engineering, Royal Institute of Technology, Stockholm, Sweden, 1996, 16 pp. (In Swedish).
Levio, M. and Holt, E., 1997a“Early age autogenous volume changes of concrete”, Hands out, ACI Spring Convention, Seattle, April 6-11th 1997.
Levio, M. and Holt, E., 1997b“Autogenous volume changes at early ages”, Self-desiccation and it’s importance in concrete technology, Proceedings,International research seminar in Lund, Sweden, June 10th 1997, Edited by B. Persson and G. Fagerlund, pp. 88-98.
Ma, Z., Baishya, M., C. and Cook, R., L., 1996“Polymer-injection/ultrasonic pulse-echo system for bridge deck repair”, Concrete International, V. 18, No. 3, March 1996, pp.39-41.
Malhotra, V., M., 1999“Making concrete greener with fly ash”, Concrete International, V. 21, No. 5, May 1999, pp. 61-66.
Mallet, G., P., 1992“Repair of Concrete Bridges”, State of the Art Review, Transport Research Laboratory, Thomas Telford Services Ltd., 194 pp.

45
Mangat, P., S., and Gurusamy, K., 1987a“Pore fluid composition under marine exposure of steel fibre reinforced concrete”, Cement and Concrete Research, Vol. 17,1987, pp. 734-742.
Mangat, P., S., and Gurusamy, K., 1987b“Chloride diffusion in steel fibre reinforced marine concrete”, Cement and Concrete Research, Vol. 17, 1987, pp. 385-396.
Manning, D., G., 1996“Corrosion performance of epoxy-coated reinforcing steel: North American experience”, Construction and Building Materials,Vol. 10, No. 5, 1996, pp. 349-365.
Matta, Z., 1998“Concrete practices in the arabian gulf region”, Concrete International, Vol. 20, No. 7, July 1998, pp. 51-52.
Matushima, M., Tsutsumi, T., Seki, H., and Matsui, K., 1998 “A study of the application of reliability theory to the design of concrete cover”, Magazine of Concrete Research, 1998, Vol.50, No. 1, March, pp. 5-16.
McCarter, W., J., Emerson, M., and Ezrim, H., 1995“Properties of concrete in the cover zone: Developments in the monitoring techniques”, Magazine of Concrete Research, 1995,Vol. 47, No. 172, Sept., pp. 243-251.
McGregor, I., D., 1998“White precast stainless reinforced concrete formwork: 20 years on”, Proceedings, The Institution of Civil Engineers, Structuresand Buildings, Vol. 128, Issue 2, May 1998, pp. 211-218.
Nagataki, S., Otsuki, N., Wee., and Nakashita, K., 1993“Condensation of Chloride Ion in Hardened Cement Matrix Materials and on Embedded Steel Bars”, ACI Materials Journal, V.90, No. 4, July-August 1993, pp. 323-332.
Neville, A., 1998.“Concrete technology - An essential element of structural design”, Concrete International, Vol. 20, No. 7, July 1998, pp. 39-41.
Nilsson, L., O., Poulsen, E., Sandberg, P., Sorensen, H., E., and Klinghoffer, O., 1996“HETEK Chloride penetration into concrete, State-of-the-art”, The Danish Road Directorate, Copenhagen, Report No. 53, 1996,151 pp.
Paroll, H., and Nykänen, E., 1999“Measurement of relative humidity and temperature in new concrete vs. laboratory samples”, Proceedings, Nordic ConcreteResearch Meeting, Reykjavik, Island, 1999, pp. 116-118.
Parrot, L., J., 1991“Factors influencing relative humidity in concrete”, Magazine of Concrete Research, 1991, Vol. 43, No. 154, Mar., pp. 45-52.
Parrot, L., J., 1992“Water absorption in cover concrete”, Materials and Structures, Vol. 25, No. 149, June 1992, pp. 284-292.
Paulin, J., 1998“Construction of concrete slabs using a lifting and lowering technique-Full scale tests and evaluation of a new technique”,Master Thesis No. 101, Royal Institute of Technology, Department of Structural Engineering, Chair of Structural Design andBridges, Stockholm, Sweden, 1998, 69 pp. (In Swedish).
Paulsson, J., 1995“Repair of a heavily trafficked concrete flat slab with bonded steel fibre reinforced concrete”, Master Thesis No. 31, Departmentof Structural Engineering, Royal Institute of Technology, Stockholm, Sweden, 1995, 84 pp. (In Swedish).
Paulsson, J., 1996a

46
“Bonded concrete overlays - Measurements and analysis of wear and rutting on four bridges 1987-1995”, Report No. 35,Department of Structural Engineering, Royal Institute of Technology, Stockholm, Sweden, 1996, 65 pp. (In Swedish).
Paulsson, J., 1996b“Bonded concrete overlays - Measurements and analysis of wear and rutting on four bridges 1987-1995”, Betong, No. 3,September 1996, pp. 33-36. (In Swedish).
Paulsson, J., 1997“Effects of repairs on the remaining life of concrete bridge decks”, Licentiate Thesis, Bulletin No. 27, Department of StructuralEngineering, Royal Institute of Technology, Stockholm, Sweden, 1997, 238 pp.
Paulsson, J. and Silfwerbrand, J., 1995“Repair of a heavily trafficked concrete flat slab with bonded steel fibre reinforced concrete”, Betong, No. 2, May 1995, pp. 22-27. (In Swedish).
Petersson, P., E., 1986“Salt freeze-thaw resistance of new concrete bridges”, ByggSverige, No. 4, 1986, pp. 30-35. (In Swedish).
Petersson, Ö. and Silfwerbrand, J., 1993“Thin concrete inlays on concrete roads”, Proceedings 5th International Conference on Concrete Pavement Design andRehabilitation, Purdue University, West Lafayette, Indiana 47907, USA, April 20-22, 1993, pp. 255-260.
Petersson, Ö. and Silfwerbrand, J., 1994“Swedish experience with and recommendations for thin concrete overlays on old concrete roads”, Proceedings 7th InternationalSymposium on Concrete Roads, Vienna, 3-5 October, 1994, V. 2-3, pp. 35-40.
Pettersson, K., 1996,“Service life of concrete structures - In a chloride environment”, Report No. 3:96, Swedish Cement and Concrete ResearchInstitute, Stockholm, 1996, 63 pp. (In Swedish)
Pettersson, K., and Sederholm, B., 1990,“Epoxy coatings for corrosion protection of reinforcing steel in concrete structures - A literature review”, Off-print 2:90, SwedishCement and Concrete Research Institute, Stockholm, 1990, 35 pp. (In Swedish).
Punkki J. and Sellevold E. J., 1994“Capillary suction in concrete: Effects of drying procedure”, Nordic Concrete Research, No.15, 2/1994, pp. 59-74.
Racutanu, G., 1998“The real life of concrete structures”, Licentiate thesis, Bulletin No. 36, Department of Structural Engineering, Royal Institute ofTechnology, Stockholm, Sweden, 1997, 300 pp. (In Swedish).
Radocea, A., 1998“Autogenous volume change of concrete at early age”, Magazine of Concrete Research, 1998, Vol. 50, No. 2, June, pp. 107-117.
Redha, S., 1998“Pre-cast concrete arch bridges”, Master Thesis No. 98, Department of Structural Engineering, Royal Institute of Technology,Stockholm, Sweden, 1998, 49 pp. (In Swedish).
Sandberg, P., 1995“Critical evaluation of factors affecting chloride initiated corrosion in concrete”, Licentiate Thesis, Report TVBM-3068, Divisionof Building Materials, University of Lund, Lund Institute of Technology, Lund, Sweden, 116 pp.
Sandberg, P., Petterson, K., Arup, H., and Tuutti, K., 1996“Cost-effective design of high performance concrete structures in saline environment”, Concrete Repair, Rehabilitation andprotection, Edited by R. K. Dihr and M. R. Jones, E&FN Spon, London 1996, pp. 779-789.
Schiessel, P., and Raupach, M., 1997“Laboratory studies and calculations on the influence of crack width on chloride-induced corrosion of steel in concrete”, ACIMaterials Journal, V. 94, No. 1, January-February 1997, pp. 56-62.

47
Sakumoto, Y., Nakazato, T., and Matsuzaki, A., 1996“High-temperature propertis of stainless steel for building structures”, Journal of Structural Engineering, Vol. 122, No. 4, April1996, pp. 399-406.
Sederholm, B., 1994“Cathodic protection of the steel reinforcement in different concrete structures - Influence of climatic factors”, SwedishCorrosion Institute, KI Report 1994:2, 48 pp. (In Swedish).
Silfwerbrand, J., 1987“Theoretical and experimental study of strength and behaviour of concrete bridge decks”, Doctoral Thesis, Bulletin No. 149,Department of Structural Mechanics and Engineering, Royal Institute of Technology, Stockholm, Sweden, 1987, 16 pp.
Silfwerbrand, J., 1990“Improving concrete bond in repaired bridge deck”, Concrete International, V. 12, No. 9, September 1990, pp. 61-66.
Silfwerbrand, J., and Paulsson-Tralla, J., 1999“Reducing shrinkage cracking and curling in slabs on grade using a new lifting and lowering technique”. Accepted in Aug. 1999for publication in Concrete International.
Somerville, G., 1992“The design life of structures”, Blackie and Son Ltd, Glasgow 1992, 264 pp.
Stewart, M., 1997“Concreteing workmanship and its influence on serviceability reliability”, ACI Material Journal, Vol. 94, No. 6, November-December 1997, pp. 501-509.
Swedish Bridge Code, 1994Bro 94, Report 1994:1-1994:9, Swedish National Road Administration, Borlänge, Sweden, 1994.
Swedish County Association, 1991“The salt-strangler”, Report, Svenska Kommunförbundet, 1991, 52 pp. (In Swedish).
Swedish County Association, 1997“Treat me well - Impregnation as protection of concrete from water and salt and grafitti”, Report, Svenska Kommunförbundet,Stockholm 1997, 64 pp. (In Swedish).
Swedish National Road Administration, 1995“Simplified guidelines for the road keeping in the winter time” (Lathund för tolkning av Drift 96) Swedish National RoadAdministration, 1995, 9 pp. (In Swedish).
Syed Ehtesham Hussain, Ahmad S. Al-Gahtani, and Rasheeduzzafar, 1996“Chloride threshold for corrosion of reinforcement in concrete”, ACI Materials Journal, V. 94, No. 6, November-December 1996,pp 534-538.
Tietz, 1998“Risk analysis – Uses and abuses”, The Structural Engineer, Vol. 76, No. 20, October 1998, pp. 395-401.
Volkvein, A., 1991“Untersuchen über das Eindringen von Wasser und Chlorid in Beton”, Heft 1/1991, Baustoffinstitut, Technische UniversitätMünchen, 120 pp. (In German).
Walker, H., C., 1998“Parking structure durability”, Concrete International, Vol. 20, No. 7, July 1998, pp. 53-54.
Weast, 1973“Handbook of Chemistry and Physics, 54th edition 1973-1974”, The Chemical Rubber Company, CRC Press, USA.

48
Weyers, R., E., Pyc, W., and Sprinkel, M., M., 1998“Estimating the service life of epoxy-coated reinforcing steel”, ACI Materials Journal, V. 95, No. 5, October-November 1998, pp546-557.
Wilk, W., 1980“Bruckendeckbeläge in Beton im Verbund mit der Fahrbahnplatte”, Mitteilungen der Betonstrassen AG Wildegg, Switzerland,Report No. 122, June 1980, pp. 2-9. (In German).