serum lipid profile in oral precancer and cancer: a ... lipid profile in oral precancer and cancer...
TRANSCRIPT

Original Research
Serum lipid profile in oral precancer and cancer...Garg D et al Journal of International Oral Health 2014; 6(2):33-39
Received: 10th August 2013 Accepted: 15th December 2013 Conflict of Interest: None
Source of Support: Nil
Serum lipid profile in oral precancer and cancer: a diagnostic or prognostic marker?Deepanshu Garg1, M K Sunil2, Param Pal Singh3, Neetu Singla4, S R Ashwini Rani5, Beant Kaur1
33
Contributors:1Post Graduate Student, Department of Oral Medicine &Radiology, Guru Nanak Dev Dental College and ResearchInstitute, Sunam, Punjab, India; 2Professor & Head, Departmentof Oral Medicine & Radiology, Guru Nanak Dev Dental Collegeand Research Institute, Sunam, Punjab, India; 3AssociateProfessor, Department of Oral Medicine & Radiology, GuruNanak Dev Dental College and Research Institute, Sunam,Punjab, India; 4Senior Lecturer, Department of Oral Medicine &Radiology, Guru Nanak Dev Dental College and ResearchInstitute, Sunam, Punjab, India; 5Senior Lecturer, Department ofOral Medicine & Radiology, School of Dental Sciences,KIMSDU, Maharashtra, India.Correspondence:
Dr. Deepanshu Garg. Department of Oral Medicine &Radiology, Guru Nanak Dev Dental College and ResearchInstitute, Sunam, Punjab, India. Phone: +91 – 9463667664.Email: [email protected] to cite the article:Garg D, Sunil MK, Singh PP, Singla N, Rani SR, Kaur B. Serumlipid profile in oral precancer and cancer: a diagnostic orprognostic marker? J Int Oral Health 2014;6(2):33-9.Abstract:Background: Changes in lipid profile have been associated withmalignancy because of their key role in the maintenance theintegrity of the cell membrane. This study evaluated thealterations in serum lipid profile in untreated patients of oralsubmucus fibrosis (OSMF), oral leukoplakia, and oral lichenplanus and proven cases of oral cancer with respect to healthycontrols.Materials & Methods: In this case control study, 20 clinicallyand histopathologically proven patients of oral precancer andoral cancer each were compared with 20 healthy controls. Inthese groups, serumlipids including:
(i) Total cholesterol.(ii) Triglycerides (TGL).(iii) High density lipoprotein cholesterol (HDL), low density
lipoprotein cholesterol (LDL) and very low densitylipoprotein cholesterol (VLDL) were analyzed.
Results: Decrease in plasma total cholesterol, triglycerides,HDL, LDL, VLDL in the subjects with the oral precancer andoral cancer as compared to the controls was statisticallysignificant. There was also decrease in plasma levels of TGL andVLDL in oral cancer subjects as compared to precancer subjects.Thus, it was found that there is an inverse relationship betweenplasma lipid levels and patients.Conclusion: Post operative morbidity was increasing along withmore operating time and increase in the depth of mandibularthird molar impaction.
Key Words: head cancer, leukoplakia, lichen planus, lipid profile,neck cancer, oral submucus fibrosis
IntroductionIn recent years, head and neck cancer has become one ofthe major causes of morbidity and mortality.1 Oralcarcinoma is one of the most prevalent cancers and is oneof the 10 most common causes of death. So, earlier thecancer is diagnosed, better is the outcome.2 Oral cancer isusually preceded by lesions which are non-cancerous tobegin with and which have therefore been termed asprecancerous.2 A variety of premalignant lesions andconditions having malignant potential includes mainlyleukoplakia, erythroplakia, oral lichen planus, oralsubmucous fibrosis.Biochemical studies in evaluation of cancer have shownthat various substances alter quantitatively in the serumduring tumor development and are referred to as tumormarkers. So, if the biochemical changes occur even beforefrank cancer has occurred, we can predict even in oralprecancerous lesions and conditions whether a particularindividual is at risk or not.3-5
Cholesterol is an amphipathic lipid and it is an essentialstructural component of all cell membranes and of theouter layer of plasma lipoproteins. It is present either asfree cholesterol or combined with a long-chain fatty acid,as cholesterylesterin tissues and in plasma lipoprotein.6
Fundamentally the development of a malignancy requiresthe uncontrolled and excessive proliferation of cells.7 Theserapidly forming cells need many basic components wellabove the normal limits which are used in physiologicalprocess. One such component which forms major cellmembrane components essential for various biologicalfunctions including cell division and growth of normal andmalignant tissues is lipids. Lipid stores are diminished dueto increased use of lipids by this rapidly dividing cells.8,9
So, this study was undertaken to evaluate whetheralterations in serum cholesterol levels have a diagnostic orprognostic role in early diagnosis and treatment of oralpremalignant and malignant lesions.

Serum lipid profile in oral precancer and cancer...Garg D et al Journal of International Oral Health 2014; 6(2):33-39
34
Graph 1: Number of patients and the gender distribution included in the study.
0
5
10
15
20
25
30
35
40
GROUP I
20
FEMALES, GROUP I, 5FEMALES, GROUP II, 3
MALES, GROUP I, 15
Table 1: Showing Intergroup Comparison for Serum Cholesterol Level between Cancer Group, Precancer Groupand Control Group.
GROUPS N Mean(mg%)
Std. Deviation Std.Error
F value p value Significance
Group I 20 194.41 24.76 5.5329.366 0.000 Significant
DifferenceGroup II 20 189.45 18.14 4.05Group III 20 231.85 12.47 2.79
Materials and MethodsA hospital based study was conducted in 60 individualswho visited the Department of Oral Medicine andRadiology, from Guru Nanak Dev Dental College andResearch Institute, Sunam, India. 20 clinically diagnosed
and histologically proven oral cancer and 20 with oralprecancer were included in this study. 20 healthyindividuals, who had no complaint or any major illness inthe recent past, were included in the study as controls.Written consent was taken from the patients for the same.Signs, symptoms, and detailed history including habits,histopathology, and extended lipid profile estimation wererecorded in all patients.Blood samples of overnight fasting were collected in plainvials. Serum was collected after centrifugation and storedat 80°Cuntil analyzed. Plasma levels of cholesterol,triglycerides, and HDL were calculated by using des kitsobtained from Erba Diagnostics, Mannheim. Statisticalanalysis was performed.
ResultsThe study comprised of 60 patients who were divided into3 groups. In Group I (precancer group), total number ofpatients were 20 out of which 5 were females and 15 malesubjects. In Group II (cancer group) total number of
patients was20 out of which 3 were females and 17 malesubjects. In Group III (control group), total number ofpatients were 20 out of which 6 were females and 14 malesubjects. (Graph 1)In total of 60 patients, Group I (pre cancer group)included subjects in the age group of 20-70 years. Group II(cancer group) included subjects in the age group of 35-70years. Group III (control group) included subjects in theage group of 30-72 years.Intergroup Comparison for Serum Cholestrol Level inGroup I (Precancer Group), Group II (Cancer Group)and Group III (Control Group)
Serum lipid profile in oral precancer and cancer...Garg D et al Journal of International Oral Health 2014; 6(2):33-39
34
Graph 1: Number of patients and the gender distribution included in the study.
GROUP IIGROUP III
2020
FEMALES, GROUP I, 5FEMALES, GROUP II, 3 FEMALES, GROUP III, 6
MALES, GROUP I, 15
MALES, GROUP II, 17 MALES, GROUP III, 14
Table 1: Showing Intergroup Comparison for Serum Cholesterol Level between Cancer Group, Precancer Groupand Control Group.
GROUPS N Mean(mg%)
Std. Deviation Std.Error
F value p value Significance
Group I 20 194.41 24.76 5.5329.366 0.000 Significant
DifferenceGroup II 20 189.45 18.14 4.05Group III 20 231.85 12.47 2.79
Materials and MethodsA hospital based study was conducted in 60 individualswho visited the Department of Oral Medicine andRadiology, from Guru Nanak Dev Dental College andResearch Institute, Sunam, India. 20 clinically diagnosed
and histologically proven oral cancer and 20 with oralprecancer were included in this study. 20 healthyindividuals, who had no complaint or any major illness inthe recent past, were included in the study as controls.Written consent was taken from the patients for the same.Signs, symptoms, and detailed history including habits,histopathology, and extended lipid profile estimation wererecorded in all patients.Blood samples of overnight fasting were collected in plainvials. Serum was collected after centrifugation and storedat 80°Cuntil analyzed. Plasma levels of cholesterol,triglycerides, and HDL were calculated by using des kitsobtained from Erba Diagnostics, Mannheim. Statisticalanalysis was performed.
ResultsThe study comprised of 60 patients who were divided into3 groups. In Group I (precancer group), total number ofpatients were 20 out of which 5 were females and 15 malesubjects. In Group II (cancer group) total number of
patients was20 out of which 3 were females and 17 malesubjects. In Group III (control group), total number ofpatients were 20 out of which 6 were females and 14 malesubjects. (Graph 1)In total of 60 patients, Group I (pre cancer group)included subjects in the age group of 20-70 years. Group II(cancer group) included subjects in the age group of 35-70years. Group III (control group) included subjects in theage group of 30-72 years.Intergroup Comparison for Serum Cholestrol Level inGroup I (Precancer Group), Group II (Cancer Group)and Group III (Control Group)
Serum lipid profile in oral precancer and cancer...Garg D et al Journal of International Oral Health 2014; 6(2):33-39
34
Graph 1: Number of patients and the gender distribution included in the study.
MALES
FEMALES
TOTAL
Table 1: Showing Intergroup Comparison for Serum Cholesterol Level between Cancer Group, Precancer Groupand Control Group.
GROUPS N Mean(mg%)
Std. Deviation Std.Error
F value p value Significance
Group I 20 194.41 24.76 5.5329.366 0.000 Significant
DifferenceGroup II 20 189.45 18.14 4.05Group III 20 231.85 12.47 2.79
Materials and MethodsA hospital based study was conducted in 60 individualswho visited the Department of Oral Medicine andRadiology, from Guru Nanak Dev Dental College andResearch Institute, Sunam, India. 20 clinically diagnosed
and histologically proven oral cancer and 20 with oralprecancer were included in this study. 20 healthyindividuals, who had no complaint or any major illness inthe recent past, were included in the study as controls.Written consent was taken from the patients for the same.Signs, symptoms, and detailed history including habits,histopathology, and extended lipid profile estimation wererecorded in all patients.Blood samples of overnight fasting were collected in plainvials. Serum was collected after centrifugation and storedat 80°Cuntil analyzed. Plasma levels of cholesterol,triglycerides, and HDL were calculated by using des kitsobtained from Erba Diagnostics, Mannheim. Statisticalanalysis was performed.
ResultsThe study comprised of 60 patients who were divided into3 groups. In Group I (precancer group), total number ofpatients were 20 out of which 5 were females and 15 malesubjects. In Group II (cancer group) total number of
patients was20 out of which 3 were females and 17 malesubjects. In Group III (control group), total number ofpatients were 20 out of which 6 were females and 14 malesubjects. (Graph 1)In total of 60 patients, Group I (pre cancer group)included subjects in the age group of 20-70 years. Group II(cancer group) included subjects in the age group of 35-70years. Group III (control group) included subjects in theage group of 30-72 years.Intergroup Comparison for Serum Cholestrol Level inGroup I (Precancer Group), Group II (Cancer Group)and Group III (Control Group)

Serum lipid profile in oral precancer and cancer...Garg D et al Journal of International Oral Health 2014; 6(2):33-39
35
Graph 2: Showing Intergroup Comparison for Serum Cholesterol Level between Cancer Group, Precancer Group andControl Group.
050
100150200250
GROUP I
194.41
SERUM CHOLESTEROL LEVELS
Table 2: Showing Intergroup Comparison for Serum Triglyceride Level between Cancer Group, Precancer Groupand Control Group.
GROUPS N Mean(mg%)
Std. Deviation Std.Error
F value p value Significance
Group I 20 165.22 50.26 11.2313.420 0.000 Significant
DifferenceGroup II 20 130.70 41.98 9.38Group III 20 192.90 7.27 1.63
Graph 3: Showing Intergroup Comparison for Serum Triglyceride Level between Cancer Group, Precancer Group andControl Group.
0
50
100
150
200
GROUP I
165.22
SERUM TRIGLYCERIDE LEVELS
Serum cholesterol levels were 194.41mg% in the oralprecancer group, 189.45 mg% in oral cancer group and231.85 mg% in the control group according to Table 1.(Graph 2) The difference in serum cholesterol levelsbetween Group I and Group II are statisticallyinsignificant. (p = 0.474) whereas both Group I and GroupII show a statistically significant lower value than Group III(p=0.000).Intergroup Comparison for Serum Triglyceride Level inGroup I (Precancer Group), Group II (Cancer Group)and Group III (Control Group)Serum triglyceride levels were found to be 165.22 mg% in
the oral precancer group, 130.70 mg% in the subjects withoral cancer and 192.90 mg% in the control groupaccording to Table 2. (Graph3) The serum Triglyceridelevels were statistically significantly lower in the oral cancergroup as compared to the oral precancer group. (p =0.024). Also, both Group I and Group II show statisticallysignificant difference in serum TGL levels with Group III(p=0.020, p=0.000).Intergroup Comparison for Serum HDL Level in Group I(Precancer Group), Group II (Cancer Group) and GroupIII (Control Group)
Serum lipid profile in oral precancer and cancer...Garg D et al Journal of International Oral Health 2014; 6(2):33-39
35
Graph 2: Showing Intergroup Comparison for Serum Cholesterol Level between Cancer Group, Precancer Group andControl Group.
GROUP I GROUP II GROUP III
194.41 189.45 231.85
SERUM CHOLESTEROL LEVELS
SERUM CHOLESTEROLLEVELS
Table 2: Showing Intergroup Comparison for Serum Triglyceride Level between Cancer Group, Precancer Groupand Control Group.
GROUPS N Mean(mg%)
Std. Deviation Std.Error
F value p value Significance
Group I 20 165.22 50.26 11.2313.420 0.000 Significant
DifferenceGroup II 20 130.70 41.98 9.38Group III 20 192.90 7.27 1.63
Graph 3: Showing Intergroup Comparison for Serum Triglyceride Level between Cancer Group, Precancer Group andControl Group.
GROUP I GROUP II GROUP III
165.22 130.7192.9
SERUM TRIGLYCERIDE LEVELS
SERUM TRIGLYCERIDELEVELS
Serum cholesterol levels were 194.41mg% in the oralprecancer group, 189.45 mg% in oral cancer group and231.85 mg% in the control group according to Table 1.(Graph 2) The difference in serum cholesterol levelsbetween Group I and Group II are statisticallyinsignificant. (p = 0.474) whereas both Group I and GroupII show a statistically significant lower value than Group III(p=0.000).Intergroup Comparison for Serum Triglyceride Level inGroup I (Precancer Group), Group II (Cancer Group)and Group III (Control Group)Serum triglyceride levels were found to be 165.22 mg% in
the oral precancer group, 130.70 mg% in the subjects withoral cancer and 192.90 mg% in the control groupaccording to Table 2. (Graph3) The serum Triglyceridelevels were statistically significantly lower in the oral cancergroup as compared to the oral precancer group. (p =0.024). Also, both Group I and Group II show statisticallysignificant difference in serum TGL levels with Group III(p=0.020, p=0.000).Intergroup Comparison for Serum HDL Level in Group I(Precancer Group), Group II (Cancer Group) and GroupIII (Control Group)
Serum lipid profile in oral precancer and cancer...Garg D et al Journal of International Oral Health 2014; 6(2):33-39
35
Graph 2: Showing Intergroup Comparison for Serum Cholesterol Level between Cancer Group, Precancer Group andControl Group.
SERUM CHOLESTEROLLEVELS
Table 2: Showing Intergroup Comparison for Serum Triglyceride Level between Cancer Group, Precancer Groupand Control Group.
GROUPS N Mean(mg%)
Std. Deviation Std.Error
F value p value Significance
Group I 20 165.22 50.26 11.2313.420 0.000 Significant
DifferenceGroup II 20 130.70 41.98 9.38Group III 20 192.90 7.27 1.63
Graph 3: Showing Intergroup Comparison for Serum Triglyceride Level between Cancer Group, Precancer Group andControl Group.
SERUM TRIGLYCERIDELEVELS
Serum cholesterol levels were 194.41mg% in the oralprecancer group, 189.45 mg% in oral cancer group and231.85 mg% in the control group according to Table 1.(Graph 2) The difference in serum cholesterol levelsbetween Group I and Group II are statisticallyinsignificant. (p = 0.474) whereas both Group I and GroupII show a statistically significant lower value than Group III(p=0.000).Intergroup Comparison for Serum Triglyceride Level inGroup I (Precancer Group), Group II (Cancer Group)and Group III (Control Group)Serum triglyceride levels were found to be 165.22 mg% in
the oral precancer group, 130.70 mg% in the subjects withoral cancer and 192.90 mg% in the control groupaccording to Table 2. (Graph3) The serum Triglyceridelevels were statistically significantly lower in the oral cancergroup as compared to the oral precancer group. (p =0.024). Also, both Group I and Group II show statisticallysignificant difference in serum TGL levels with Group III(p=0.020, p=0.000).Intergroup Comparison for Serum HDL Level in Group I(Precancer Group), Group II (Cancer Group) and GroupIII (Control Group)

Serum lipid profile in oral precancer and cancer...Garg D et al Journal of International Oral Health 2014; 6(2):33-39
36
Table 3: Intergroup Comparison for Serum HDL Level between Cancer Group, Precancer Group and ControlGroup.
GROUPS N Mean(mg%)
Std. Deviation Std.Error
F value p value Significance
Group I 20 44.40 3.48 0.7814.011 0.000
SignificantDifferenceGroup II 20 43.50 2.01 0.45
Group III 20 47.46 1.50 0.33
Graph 4: Showing Intergroup Comparison for Serum HDL Level between Cancer Group, Precancer Group and ControlGroup.
4042444648
GROUP I
44.4
Table 4: Showing Intergroup Comparison for Serum LDL Level between Cancer Group, Precancer Group andControl Group.
GROUPS N Mean(mg%)
Std. Deviation Std.Error
F value p value Significance
Group I 20 115.70 20.75 4.6421.849 0.000
SignificantDifferenceGroup II 20 119.65 13.94 3.12
Group III 20 145.80 10.46 2.34
Graph 5: Showing Intergroup Comparison for Serum LDL Level between Cancer Group, Precancer Group and ControlGroup.
0
50
100
150
GROUP I
115.7
Serum HDL levels were found to be 44.40 mg% ± 3.48 inthe oral precancer group, 43.50 mg% ± 2.01 in the subjects
with oral cancer and 47.46 mg% ± 1.50 in the controlgroup according to Table 3. (Graph 4) The serum HDLlevels were statistically significantly lower in the oralprecancer and oral cancer group as compared to thecontrol group (p = 0.001, p = 0.000). The difference in
serum cholesterol levels between Group I and Group IIwere statistically insignificant (p = 0.324).
Intergroup Comparison for Serum LDL Level in Group I(Precancer Group), Group II (Cancer Group) and GroupIII (Control Group)
Serum lipid profile in oral precancer and cancer...Garg D et al Journal of International Oral Health 2014; 6(2):33-39
36
Table 3: Intergroup Comparison for Serum HDL Level between Cancer Group, Precancer Group and ControlGroup.
GROUPS N Mean(mg%)
Std. Deviation Std.Error
F value p value Significance
Group I 20 44.40 3.48 0.7814.011 0.000
SignificantDifferenceGroup II 20 43.50 2.01 0.45
Group III 20 47.46 1.50 0.33
Graph 4: Showing Intergroup Comparison for Serum HDL Level between Cancer Group, Precancer Group and ControlGroup.
GROUP I GROUP II GROUP III
44.4 43.547.46
SERUM HDL LEVEL
SERUM HDL LEVEL
Table 4: Showing Intergroup Comparison for Serum LDL Level between Cancer Group, Precancer Group andControl Group.
GROUPS N Mean(mg%)
Std. Deviation Std.Error
F value p value Significance
Group I 20 115.70 20.75 4.6421.849 0.000
SignificantDifferenceGroup II 20 119.65 13.94 3.12
Group III 20 145.80 10.46 2.34
Graph 5: Showing Intergroup Comparison for Serum LDL Level between Cancer Group, Precancer Group and ControlGroup.
GROUP I GROUP II GROUPIII
115.7 119.65 145.8
SERUM LDL LEVELS
SERUM LDL LEVELS
Serum HDL levels were found to be 44.40 mg% ± 3.48 inthe oral precancer group, 43.50 mg% ± 2.01 in the subjects
with oral cancer and 47.46 mg% ± 1.50 in the controlgroup according to Table 3. (Graph 4) The serum HDLlevels were statistically significantly lower in the oralprecancer and oral cancer group as compared to thecontrol group (p = 0.001, p = 0.000). The difference in
serum cholesterol levels between Group I and Group IIwere statistically insignificant (p = 0.324).
Intergroup Comparison for Serum LDL Level in Group I(Precancer Group), Group II (Cancer Group) and GroupIII (Control Group)
Serum lipid profile in oral precancer and cancer...Garg D et al Journal of International Oral Health 2014; 6(2):33-39
36
Table 3: Intergroup Comparison for Serum HDL Level between Cancer Group, Precancer Group and ControlGroup.
GROUPS N Mean(mg%)
Std. Deviation Std.Error
F value p value Significance
Group I 20 44.40 3.48 0.7814.011 0.000
SignificantDifferenceGroup II 20 43.50 2.01 0.45
Group III 20 47.46 1.50 0.33
Graph 4: Showing Intergroup Comparison for Serum HDL Level between Cancer Group, Precancer Group and ControlGroup.
SERUM HDL LEVEL
Table 4: Showing Intergroup Comparison for Serum LDL Level between Cancer Group, Precancer Group andControl Group.
GROUPS N Mean(mg%)
Std. Deviation Std.Error
F value p value Significance
Group I 20 115.70 20.75 4.6421.849 0.000
SignificantDifferenceGroup II 20 119.65 13.94 3.12
Group III 20 145.80 10.46 2.34
Graph 5: Showing Intergroup Comparison for Serum LDL Level between Cancer Group, Precancer Group and ControlGroup.
SERUM LDL LEVELS
Serum HDL levels were found to be 44.40 mg% ± 3.48 inthe oral precancer group, 43.50 mg% ± 2.01 in the subjects
with oral cancer and 47.46 mg% ± 1.50 in the controlgroup according to Table 3. (Graph 4) The serum HDLlevels were statistically significantly lower in the oralprecancer and oral cancer group as compared to thecontrol group (p = 0.001, p = 0.000). The difference in
serum cholesterol levels between Group I and Group IIwere statistically insignificant (p = 0.324).
Intergroup Comparison for Serum LDL Level in Group I(Precancer Group), Group II (Cancer Group) and GroupIII (Control Group)

Serum lipid profile in oral precancer and cancer...Garg D et al Journal of International Oral Health 2014; 6(2):33-39
37
Table 5: Showing Intergroup Comparison for Serum VLDL Level between Cancer Group, Precancer Group andControl Group.
GROUPS N Mean(mg%)
Std. Deviation Std.Error
F value p value Significance
Group I 20 32.65 9.05 2.0215.004 0.000 Significant
DifferenceGroup II 20 26.15 8.40 1.88Group III 20 38.58 1.45 0.32
Graph 6: Showing Intergroup Comparison for Serum VLDL Level between Cancer Group, Precancer Group and ControlGroup.
0
10
20
30
40
GROUP I
32.65
Serum LDL levels were found to be 115.70 mg % in thesubjects with oral precancer, 119.65 mg% in the subjectswith oral cancer and 145.80 mg% in the control groupaccording to Table 4. (Graph 5) Serum LDL levels werefound to be statistically significantly lower in oralprecancer group and oral cancer group as compared to thecontrol group. (p = 0.000). The difference in serum LDLlevels between the subjects with oral cancer and those withoral precancer was statistically insignificant (p = 0.484).
Intergroup Comparison for Serum VLDL Level in Group I(Precancer Group), Group II (Cancer Group) and GroupIII (Control Group)Serum VLDL levels were found to be 32.65 mg% ± 9.05 inthe subjects with oral precancerous lesion group, 26.15mg% ± 8.39 in the subjects with oral cancer and 38.58mg% ± 1.45 in the control group according to Table 5.(Graph 6) Serum VLDL levels were found to bestatistically significantly lower in the oral precancer groupand oral cancer group as compared to the control group. (p= 0.006, p = 0.000). Also, the serum VLDL levels werestatistically significantly lower in the oral cancer group ascompared to the oral precancer group (p = 0.020).All these above values are compared in single graphicalrepresentation (Graph 7).
DiscussionCholesterol which is an amphipathic lipid is an essentialstructural component of all cell membranes and of theouter layer of plasma lipoproteins. It is present either asfree cholesterol or combined with a long-chain fatty acid,as cholesterylesterin tissues and in plasma lipoprotein. It issynthesized from acetyl-CoA in many tissues and isultimately eliminated as cholesterol or bile saltsfrom thebody. In the circulation, lipoprotein transports free
cholesterol and it readily equilibrates cholesterol in otherlipoproteins and in membranes.3,10-12
Head and neck cancer is one of the major causes ofmorbidity and mortality and habit of tobacco consumptionis a known etiological factor for development of oralprecancerous disease and head and neck cancer. Patientswho suffer from oral precancerous conditions show asignificant tendency to develop cancer. Free radicals andreactive oxygen species are generated from tobaccocarcinogens which are responsible for high rate ofoxidation / per oxidation of polyunsaturated fatty acids. Itresults in greater utilization of lipids including totalcholesterol, lipoproteins and triglycerides for newmembrane biogenesis. Cells fulfill these requirementseither from circulation, or by synthesis through
Serum lipid profile in oral precancer and cancer...Garg D et al Journal of International Oral Health 2014; 6(2):33-39
37
Table 5: Showing Intergroup Comparison for Serum VLDL Level between Cancer Group, Precancer Group andControl Group.
GROUPS N Mean(mg%)
Std. Deviation Std.Error
F value p value Significance
Group I 20 32.65 9.05 2.0215.004 0.000 Significant
DifferenceGroup II 20 26.15 8.40 1.88Group III 20 38.58 1.45 0.32
Graph 6: Showing Intergroup Comparison for Serum VLDL Level between Cancer Group, Precancer Group and ControlGroup.
GROUP I GROUP II GROUP III
32.65 26.1538.58
SERUM VLDL LEVEL
SERUM VLDL LEVEL
Serum LDL levels were found to be 115.70 mg % in thesubjects with oral precancer, 119.65 mg% in the subjectswith oral cancer and 145.80 mg% in the control groupaccording to Table 4. (Graph 5) Serum LDL levels werefound to be statistically significantly lower in oralprecancer group and oral cancer group as compared to thecontrol group. (p = 0.000). The difference in serum LDLlevels between the subjects with oral cancer and those withoral precancer was statistically insignificant (p = 0.484).
Intergroup Comparison for Serum VLDL Level in Group I(Precancer Group), Group II (Cancer Group) and GroupIII (Control Group)Serum VLDL levels were found to be 32.65 mg% ± 9.05 inthe subjects with oral precancerous lesion group, 26.15mg% ± 8.39 in the subjects with oral cancer and 38.58mg% ± 1.45 in the control group according to Table 5.(Graph 6) Serum VLDL levels were found to bestatistically significantly lower in the oral precancer groupand oral cancer group as compared to the control group. (p= 0.006, p = 0.000). Also, the serum VLDL levels werestatistically significantly lower in the oral cancer group ascompared to the oral precancer group (p = 0.020).All these above values are compared in single graphicalrepresentation (Graph 7).
DiscussionCholesterol which is an amphipathic lipid is an essentialstructural component of all cell membranes and of theouter layer of plasma lipoproteins. It is present either asfree cholesterol or combined with a long-chain fatty acid,as cholesterylesterin tissues and in plasma lipoprotein. It issynthesized from acetyl-CoA in many tissues and isultimately eliminated as cholesterol or bile saltsfrom thebody. In the circulation, lipoprotein transports free
cholesterol and it readily equilibrates cholesterol in otherlipoproteins and in membranes.3,10-12
Head and neck cancer is one of the major causes ofmorbidity and mortality and habit of tobacco consumptionis a known etiological factor for development of oralprecancerous disease and head and neck cancer. Patientswho suffer from oral precancerous conditions show asignificant tendency to develop cancer. Free radicals andreactive oxygen species are generated from tobaccocarcinogens which are responsible for high rate ofoxidation / per oxidation of polyunsaturated fatty acids. Itresults in greater utilization of lipids including totalcholesterol, lipoproteins and triglycerides for newmembrane biogenesis. Cells fulfill these requirementseither from circulation, or by synthesis through
Serum lipid profile in oral precancer and cancer...Garg D et al Journal of International Oral Health 2014; 6(2):33-39
37
Table 5: Showing Intergroup Comparison for Serum VLDL Level between Cancer Group, Precancer Group andControl Group.
GROUPS N Mean(mg%)
Std. Deviation Std.Error
F value p value Significance
Group I 20 32.65 9.05 2.0215.004 0.000 Significant
DifferenceGroup II 20 26.15 8.40 1.88Group III 20 38.58 1.45 0.32
Graph 6: Showing Intergroup Comparison for Serum VLDL Level between Cancer Group, Precancer Group and ControlGroup.
SERUM VLDL LEVEL
Serum LDL levels were found to be 115.70 mg % in thesubjects with oral precancer, 119.65 mg% in the subjectswith oral cancer and 145.80 mg% in the control groupaccording to Table 4. (Graph 5) Serum LDL levels werefound to be statistically significantly lower in oralprecancer group and oral cancer group as compared to thecontrol group. (p = 0.000). The difference in serum LDLlevels between the subjects with oral cancer and those withoral precancer was statistically insignificant (p = 0.484).
Intergroup Comparison for Serum VLDL Level in Group I(Precancer Group), Group II (Cancer Group) and GroupIII (Control Group)Serum VLDL levels were found to be 32.65 mg% ± 9.05 inthe subjects with oral precancerous lesion group, 26.15mg% ± 8.39 in the subjects with oral cancer and 38.58mg% ± 1.45 in the control group according to Table 5.(Graph 6) Serum VLDL levels were found to bestatistically significantly lower in the oral precancer groupand oral cancer group as compared to the control group. (p= 0.006, p = 0.000). Also, the serum VLDL levels werestatistically significantly lower in the oral cancer group ascompared to the oral precancer group (p = 0.020).All these above values are compared in single graphicalrepresentation (Graph 7).
DiscussionCholesterol which is an amphipathic lipid is an essentialstructural component of all cell membranes and of theouter layer of plasma lipoproteins. It is present either asfree cholesterol or combined with a long-chain fatty acid,as cholesterylesterin tissues and in plasma lipoprotein. It issynthesized from acetyl-CoA in many tissues and isultimately eliminated as cholesterol or bile saltsfrom thebody. In the circulation, lipoprotein transports free
cholesterol and it readily equilibrates cholesterol in otherlipoproteins and in membranes.3,10-12
Head and neck cancer is one of the major causes ofmorbidity and mortality and habit of tobacco consumptionis a known etiological factor for development of oralprecancerous disease and head and neck cancer. Patientswho suffer from oral precancerous conditions show asignificant tendency to develop cancer. Free radicals andreactive oxygen species are generated from tobaccocarcinogens which are responsible for high rate ofoxidation / per oxidation of polyunsaturated fatty acids. Itresults in greater utilization of lipids including totalcholesterol, lipoproteins and triglycerides for newmembrane biogenesis. Cells fulfill these requirementseither from circulation, or by synthesis through
Serum lipid profile in oral precancer and cancer...Garg D et al Journal of International Oral Health 2014; 6(2):33-39
38
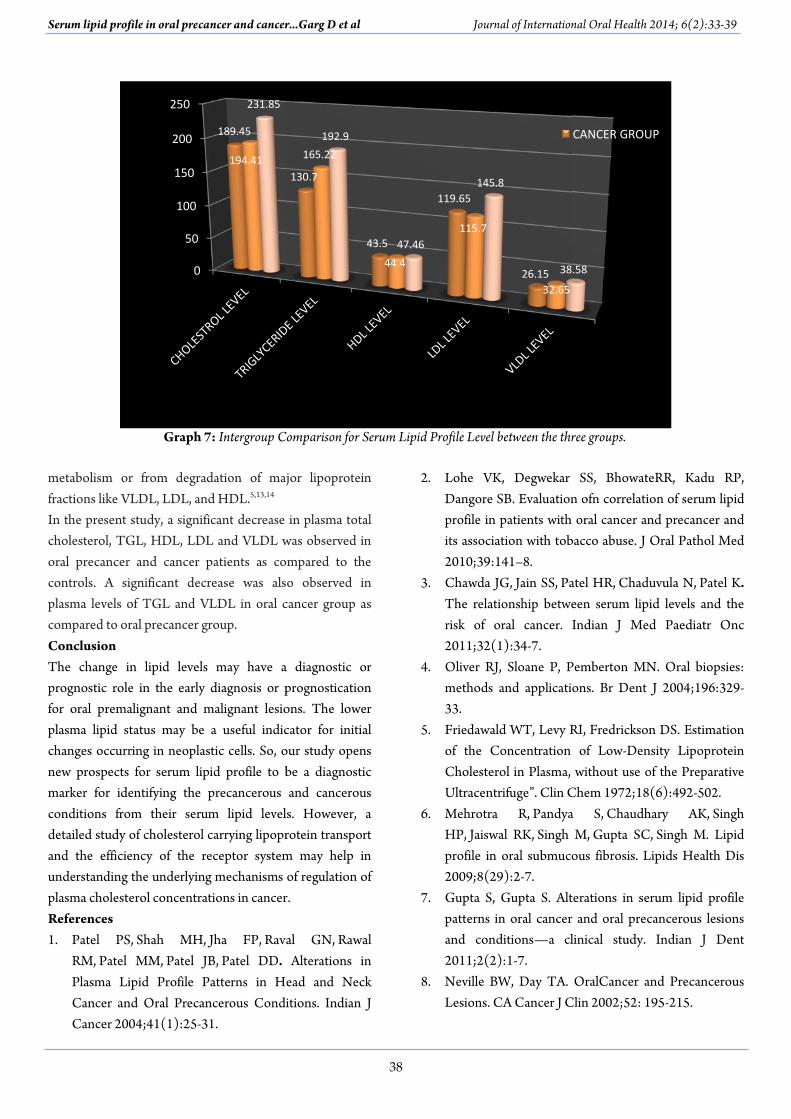
Graph 7: Intergroup Comparison for Serum Lipid Profile Level between the three groups.
0
50
100
150
200
250
189.45
130.7194.41
231.85
metabolism or from degradation of major lipoproteinfractions like VLDL, LDL, and HDL.5,13,14
In the present study, a significant decrease in plasma totalcholesterol, TGL, HDL, LDL and VLDL was observed inoral precancer and cancer patients as compared to thecontrols. A significant decrease was also observed inplasma levels of TGL and VLDL in oral cancer group ascompared to oral precancer group.ConclusionThe change in lipid levels may have a diagnostic orprognostic role in the early diagnosis or prognosticationfor oral premalignant and malignant lesions. The lowerplasma lipid status may be a useful indicator for initialchanges occurring in neoplastic cells. So, our study opensnew prospects for serum lipid profile to be a diagnosticmarker for identifying the precancerous and cancerousconditions from their serum lipid levels. However, adetailed study of cholesterol carrying lipoprotein transportand the efficiency of the receptor system may help inunderstanding the underlying mechanisms of regulation ofplasma cholesterol concentrations in cancer.References1. Patel PS, Shah MH, Jha FP, Raval GN, Rawal
RM, Patel MM, Patel JB, Patel DD. Alterations inPlasma Lipid Profile Patterns in Head and NeckCancer and Oral Precancerous Conditions. Indian JCancer 2004;41(1):25-31.
2. Lohe VK, Degwekar SS, BhowateRR, Kadu RP,Dangore SB. Evaluation ofn correlation of serum lipidprofile in patients with oral cancer and precancer andits association with tobacco abuse. J Oral Pathol Med2010;39:141–8.
3. Chawda JG, Jain SS, Patel HR, Chaduvula N, Patel K.The relationship between serum lipid levels and therisk of oral cancer. Indian J Med Paediatr Onc2011;32(1):34-7.
4. Oliver RJ, Sloane P, Pemberton MN. Oral biopsies:methods and applications. Br Dent J 2004;196:329-33.
5. Friedawald WT, Levy RI, Fredrickson DS. Estimationof the Concentration of Low-Density LipoproteinCholesterol in Plasma, without use of the PreparativeUltracentrifuge”. Clin Chem 1972;18(6):492-502.
6. Mehrotra R, Pandya S, Chaudhary AK, SinghHP, Jaiswal RK, Singh M, Gupta SC, Singh M. Lipidprofile in oral submucous fibrosis. Lipids Health Dis2009;8(29):2-7.
7. Gupta S, Gupta S. Alterations in serum lipid profilepatterns in oral cancer and oral precancerous lesionsand conditions—a clinical study. Indian J Dent2011;2(2):1-7.
8. Neville BW, Day TA. OralCancer and PrecancerousLesions. CA Cancer J Clin 2002;52: 195-215.
Serum lipid profile in oral precancer and cancer...Garg D et al Journal of International Oral Health 2014; 6(2):33-39
38
Graph 7: Intergroup Comparison for Serum Lipid Profile Level between the three groups.
130.7
43.5
119.65
26.15
165.22
44.4
115.7
32.65
231.85
192.9
47.46
145.8
38.58
CANCER GROUP
metabolism or from degradation of major lipoproteinfractions like VLDL, LDL, and HDL.5,13,14
In the present study, a significant decrease in plasma totalcholesterol, TGL, HDL, LDL and VLDL was observed inoral precancer and cancer patients as compared to thecontrols. A significant decrease was also observed inplasma levels of TGL and VLDL in oral cancer group ascompared to oral precancer group.ConclusionThe change in lipid levels may have a diagnostic orprognostic role in the early diagnosis or prognosticationfor oral premalignant and malignant lesions. The lowerplasma lipid status may be a useful indicator for initialchanges occurring in neoplastic cells. So, our study opensnew prospects for serum lipid profile to be a diagnosticmarker for identifying the precancerous and cancerousconditions from their serum lipid levels. However, adetailed study of cholesterol carrying lipoprotein transportand the efficiency of the receptor system may help inunderstanding the underlying mechanisms of regulation ofplasma cholesterol concentrations in cancer.References1. Patel PS, Shah MH, Jha FP, Raval GN, Rawal
RM, Patel MM, Patel JB, Patel DD. Alterations inPlasma Lipid Profile Patterns in Head and NeckCancer and Oral Precancerous Conditions. Indian JCancer 2004;41(1):25-31.
2. Lohe VK, Degwekar SS, BhowateRR, Kadu RP,Dangore SB. Evaluation ofn correlation of serum lipidprofile in patients with oral cancer and precancer andits association with tobacco abuse. J Oral Pathol Med2010;39:141–8.
3. Chawda JG, Jain SS, Patel HR, Chaduvula N, Patel K.The relationship between serum lipid levels and therisk of oral cancer. Indian J Med Paediatr Onc2011;32(1):34-7.
4. Oliver RJ, Sloane P, Pemberton MN. Oral biopsies:methods and applications. Br Dent J 2004;196:329-33.
5. Friedawald WT, Levy RI, Fredrickson DS. Estimationof the Concentration of Low-Density LipoproteinCholesterol in Plasma, without use of the PreparativeUltracentrifuge”. Clin Chem 1972;18(6):492-502.
6. Mehrotra R, Pandya S, Chaudhary AK, SinghHP, Jaiswal RK, Singh M, Gupta SC, Singh M. Lipidprofile in oral submucous fibrosis. Lipids Health Dis2009;8(29):2-7.
7. Gupta S, Gupta S. Alterations in serum lipid profilepatterns in oral cancer and oral precancerous lesionsand conditions—a clinical study. Indian J Dent2011;2(2):1-7.
8. Neville BW, Day TA. OralCancer and PrecancerousLesions. CA Cancer J Clin 2002;52: 195-215.
Serum lipid profile in oral precancer and cancer...Garg D et al Journal of International Oral Health 2014; 6(2):33-39
38
Graph 7: Intergroup Comparison for Serum Lipid Profile Level between the three groups.
32.65
38.58
CANCER GROUP
metabolism or from degradation of major lipoproteinfractions like VLDL, LDL, and HDL.5,13,14
In the present study, a significant decrease in plasma totalcholesterol, TGL, HDL, LDL and VLDL was observed inoral precancer and cancer patients as compared to thecontrols. A significant decrease was also observed inplasma levels of TGL and VLDL in oral cancer group ascompared to oral precancer group.ConclusionThe change in lipid levels may have a diagnostic orprognostic role in the early diagnosis or prognosticationfor oral premalignant and malignant lesions. The lowerplasma lipid status may be a useful indicator for initialchanges occurring in neoplastic cells. So, our study opensnew prospects for serum lipid profile to be a diagnosticmarker for identifying the precancerous and cancerousconditions from their serum lipid levels. However, adetailed study of cholesterol carrying lipoprotein transportand the efficiency of the receptor system may help inunderstanding the underlying mechanisms of regulation ofplasma cholesterol concentrations in cancer.References1. Patel PS, Shah MH, Jha FP, Raval GN, Rawal
RM, Patel MM, Patel JB, Patel DD. Alterations inPlasma Lipid Profile Patterns in Head and NeckCancer and Oral Precancerous Conditions. Indian JCancer 2004;41(1):25-31.
2. Lohe VK, Degwekar SS, BhowateRR, Kadu RP,Dangore SB. Evaluation ofn correlation of serum lipidprofile in patients with oral cancer and precancer andits association with tobacco abuse. J Oral Pathol Med2010;39:141–8.
3. Chawda JG, Jain SS, Patel HR, Chaduvula N, Patel K.The relationship between serum lipid levels and therisk of oral cancer. Indian J Med Paediatr Onc2011;32(1):34-7.
4. Oliver RJ, Sloane P, Pemberton MN. Oral biopsies:methods and applications. Br Dent J 2004;196:329-33.
5. Friedawald WT, Levy RI, Fredrickson DS. Estimationof the Concentration of Low-Density LipoproteinCholesterol in Plasma, without use of the PreparativeUltracentrifuge”. Clin Chem 1972;18(6):492-502.
6. Mehrotra R, Pandya S, Chaudhary AK, SinghHP, Jaiswal RK, Singh M, Gupta SC, Singh M. Lipidprofile in oral submucous fibrosis. Lipids Health Dis2009;8(29):2-7.
7. Gupta S, Gupta S. Alterations in serum lipid profilepatterns in oral cancer and oral precancerous lesionsand conditions—a clinical study. Indian J Dent2011;2(2):1-7.
8. Neville BW, Day TA. OralCancer and PrecancerousLesions. CA Cancer J Clin 2002;52: 195-215.

Serum lipid profile in oral precancer and cancer...Garg D et al Journal of International Oral Health 2014; 6(2):33-39
39
9. Nayak P, Nayak S, Darafsh MD. Alteration in plasmalipid profile in precancerous conditions. J Nepal DentAssoc 2010;11(1):40-5.
10. Bouquot JE, Whitaker BS. Oral leukoplakia- rationalefor diagnosis and prognosis of its clinical subtypes orphases. Quintessence Int 1994;25:133-40.
11. Axell T, Holmstrup P, Kramer IR, Pindborg JJ, ShearM. International seminar on oral leukoplakia andlesions related to tobacco habits. Community DentOral Epidemiol 1984;12:145-54.
12. Hong WK, Endicott J, Itri LM, Doos W, BatsakisJG, Bell R, et al. 13-cis-retinoic acid in the treatment oforal leukoplakia. N Engl J Med 1986;315 (24):1501-5.
13. McCarthy P, Shklar G. Keratinizing lesions of the oralmucosa in Diseases of the oral mucosa, 2nded.Philadelphia, USA:Lea and Febiger; 1980. p. 182-202.
14. World health organization collaborating centre fororal precancerous lesions. Definition of oralleukoplakia and related lesions: an aid to studies onoral precancer. Oral Surg Oral Med Oral Pathol1978;46:518-39.