serena illig, daria gushchina, boris dewitte, nadia ayoub
TRANSCRIPT

HAL Id: hal-00280344https://hal.archives-ouvertes.fr/hal-00280344
Submitted on 2 Apr 2021
HAL is a multi-disciplinary open accessarchive for the deposit and dissemination of sci-entific research documents, whether they are pub-lished or not. The documents may come fromteaching and research institutions in France orabroad, or from public or private research centers.
L’archive ouverte pluridisciplinaire HAL, estdestinée au dépôt et à la diffusion de documentsscientifiques de niveau recherche, publiés ou non,émanant des établissements d’enseignement et derecherche français ou étrangers, des laboratoirespublics ou privés.
The 1996 Equatorial Atlantic warm event: origin andmechanisms
Serena Illig, Daria Gushchina, Boris Dewitte, Nadia Ayoub, Yves Du Penhoat
To cite this version:Serena Illig, Daria Gushchina, Boris Dewitte, Nadia Ayoub, Yves Du Penhoat. The 1996 EquatorialAtlantic warm event: origin and mechanisms. Geophysical Research Letters, American GeophysicalUnion, 2006, 33 (9), pp.L09701. �10.1029/2005GL025632�. �hal-00280344�

The 1996 equatorial Atlantic warm event: Origin and mechanisms
S. Illig,1 D. Gushchina,2 B. Dewitte,1 N. Ayoub,1 and Y. du Penhoat1
Received 28 December 2005; revised 1 March 2006; accepted 16 March 2006; published 2 May 2006.
[1] We investigate the interannual warm event thatoccurred in the equatorial Atlantic in boreal spring-summer 1996. The role of local coupled air-seainteractions versus Tropical Pacific remote forcing isanalysed using observations and ensemble experiments ofan intermediate coupled model of the Tropical Atlantic.Results show that the persistent anomalous cold conditionsin the Tropical Pacific over 1995–96 were favorable to thegrowth of the local air-sea interactions that led to the 1996warming in the equatorial Atlantic. Based on the estimationof the changes in the Walker circulation over the Pacificand Atlantic for the meteorological reanalyses and thecoupled model, a mechanism of Pacific-Atlantic equatorialconnection is proposed to explain this particular warmepisode. Citation: Illig, S., D. Gushchina, B. Dewitte,
N. Ayoub, and Y. du Penhoat (2006), The 1996 equatorial
Atlantic warm event: Origin and mechanisms, Geophys. Res.
Lett., 33, L09701, doi:10.1029/2005GL025632.
1. Introduction
[2] The Equatorial Atlantic (EA) interannual variabilitycan be explained by local air-sea interactions, maintainedand/or triggered by either external stochastic forcing[Zebiak, 1993] or coherent remote forcing mostly originat-ing from the Tropical Pacific (TP) [Delecluse et al., 1994;Illig and Dewitte, 2006]. An atmospheric equatorial tele-connection that operates through changes in the Walkercirculation cells in both basins plays a fundamental role[Wang, 2002]. How those changes in the zonal equatorialatmospheric circulation take place may provide insights onhow interannual events develop in the EA.[3] In boreal spring-summer 1996, while the eastern TP
was under cold/neutral conditions, the EA ocean wentthrough anomalous warm conditions (Figure 1). Handohand Bigg [2000] (hereinafter referred to as HB00) suggestthat this warm event, followed by cold conditions in 1997,was the signature of the Atlantic equatorial mode [Zebiak,1993; Latif and Grotzner, 2000; Wang, 2002], initiated byintense Wind Stress Anomalies (WSA) in the western EA infall 1995. These would have been caused by local atmo-spheric variability in the Tropical American convectioncenter, possibly remotely forced by the TP variability. Here,in light of HB00’s results, we further investigate therespective role of local air-sea interactions and TP remoteforcing during this particular warm event by analyzingobservations, meteorological reanalyses and ensemble sim-ulations of an intermediate coupled model of the EA.
Focusing on the atmospheric teleconnection pattern in1995–96, a triggering mechanism of the EA 1996 warmingis then proposed.
2. Data and Model
[4] Our analysis is based on weekly averaged data of theReynolds Sea Surface Temperature (SST) [Reynolds andSmith, 1994], and T/P and ERS1/2 altimetric Sea Level (SL)[Le Traon et al., 1998]. The daily NCEP/NCAR reanalysisfields [Kalnay et al., 1996] are used as an estimation of theatmospheric anomalous conditions.[5] Our Tropical Intermediate coupled Model for Atlantic
Climate Studies (TIMACS) is designed such that air-seacoupling is explicitly taken into account in the EA, whileobserved SST forcing is prescribed elsewhere. The oceaniccomponent consists of the EA 6 baroclinic mode OceanLinear Model (OLM) developed by Illig et al. [2004], inwhich a mixed layer model similar to Zebiak [1993] isembedded. The atmospheric component is the global Quasi-equilibrium Tropical Circulation Model (QTCM) fromNeelin and Zeng [2000]. An extensive description ofTIMACS components, spin-up and coupling procedures isgiven by Illig and Dewitte [2006], where TIMACS isextensively valided from observations and forced OGCMsimulations over 1982–2001 for monthly-averaged outputs.Here we focus on a shorter period of time and performanalysis on daily-averaged outputs.[6] Observed and simulated interannual anomalies are
estimated with respect to daily climatologies computed overthe 1993–96 period. This period encompasses all the datacovering period and excludes the big 1997/98 ENSO event,which signature could bias our estimation of the interannualanomalies. For a better representation, a 15-day runningmean is applied along the equatorial sections.
3. The EA 1996 Warm Event
[7] Throughout the boreal spring and summer 1996, theEAwent through anomalous conditions [HB00]. In the Gulfof Guinea, oceanic warm conditions took place from early1996 to early autumn 1996 (Figures 1b and 2a): In theeastern EA, a deeper thermocline and a weakened equatorialupwelling led to a less pronounced cold tongue and largerthan normal SL (Figure 1a). This interpretation of observedvariability is supported by the results of the OLM simu-lations (see below). In June 1996, anomalies exceeded1.25�C in SST and 4 cm in SL in ATL3 (20�W–0�E;3�S–N), with spatial structures similar to the coupledequatorial mode described by Zebiak [1993] (Figure 1d).[8] This ocean warming imprints the EA troposphere as
evidenced from the NCEP wind velocity field (Figures 1band 1c): In the low (upper) troposphere, the westerly(easterly) wind anomalies developed along the equator in
GEOPHYSICAL RESEARCH LETTERS, VOL. 33, L09701, doi:10.1029/2005GL025632, 2006
1Laboratoire d’Etudes en Geophysique et Oceanographie Spatiales,Toulouse, France.
2Geographical Faculty, Moscow State University, Moscow, Russia.
Copyright 2006 by the American Geophysical Union.0094-8276/06/2005GL025632
L09701 1 of 5

central and eastern Atlantic (to the west of 10�W), whilenear the African coast and over the Gulf of Guinea, easterlyanomalies appeared at 850 hPa and southern ones at200 hPa. This resulted in low (upper) troposphere anoma-lous convergent inflow (divergent outflow) centered near10�W. This contributed to enhance the convection in thisregion as evidenced by the negative Outgoing LongwaveRadiation Anomalies (OLRA) (Figure 1c), minimum inMay–June 1996. These atmospheric anomalies were asso-ciated with changes in the Atlantic Walker cell as illustratedon Figure 1e, with anomalous ascendingmotions over the EAocean and anomalous descending motions over the neigh-boring continents. This pattern, opposite to the mean zonal-vertical circulation over the Atlantic, corresponds to the wellknownweakened and extended eastward AtlanticWalker cellduring EAwarm conditions [Wang, 2002].
4. Long Equatorial Wave Propagations
[9] Based on observations and a forced ocean model,HB00 identify long-equatorial waves during 1995–96. Asa first step, we verify their scenario and estimate theskills of the OLM to reproduce the observed anomalies in1995–96. The OLM is forced with NCEP WSA over1993–99. Consistently with Illig and Dewitte [2006], themodel simulates realistic weekly SSTA (SLA) in 1995–96 (Figure 2a), with a correlation/RMS difference be-tween simulation and observations of 0.81/0.29�C (0.68/1.58 cm) in ATL3. This variability is associated withinterannual long equatorial wave propagations: The con-tribution of the Kelvin (K) and first meridional Rossby(R1) waves to SLA for the most energetic secondbaroclinic mode [Illig et al., 2004] reveals clear prop-agations (Figures 2c and 2d) associated with distinct windevents. First, a downwelling Kelvin wave (K1) propagateseastward from December 1995 to February 1996 atapproximately 1.3 m/s. It was triggered by strong west-erly WSA occurring near South American coast inOctober–December 1995. This wave reaches the Africancoast in February 1996, where it reflects as westwardpropagating Rossby waves. Then, in spring 1996, addi-tional Kelvin wave packets, triggered by intense westerly
WSA in western and central EA, rise the SL, in con-junction with locally-forced downwelling Rossby wavepackets (C1), triggered by westward propagating negativeWSA in the east (Figure 1a). As pointed out by HB00,this results in overall slow (0.24 m/s) westward-movingSLA with a meridional extension in agreement with asecond baroclinic mode first meridional Rossby wave(Figure 2b). This slow propagating signal also imprintsthe 1996 observed boreal spring-summer SSTA andOLRA (Figures 1b and 1c), which illustrates the impor-tance of local coupled air-sea interactions during the 1996EA warming.[10] Thus, in a forced context, the 1996 EA warming
seems triggered by an equatorial WSA in Fall 1995,possibly remotely forced by the TP variability (HB00).Then, in spring 1996, the growth of the warming isapparently associated with a westward ocean-atmospherecoupled propagation. Since the EA is a region where air-seafeedback contributes as much to SSTA variability as remoteforcing, to further investigate the triggering and the growing
Figure 1. (a) Hovmuller of T/P+ERS SLA. Contour interval (CI) is 2 cm. Arrows: NCEP WSA. (b) Hovmuller ofReynolds SSTA. CI is 0.5�C. Arrows: NCEP 850 mb wind anomalies. (c) Hovmuller of the NCEP OLRA. CI is 5 W/m2.Arrows: NCEP 200 mb wind anomalies. (d) Mean May 1996 Reynold SSTA. CI is 0.5�C. Arrows: NCEP WSA. (e) MeanJune 1996 NCEP zonal-vertical circulation cross section. The sections are averaged between 1�S-N. The vertical barsrepresent the eastern and western boundary positions of the American continent. Arrow scales are in the top right corner ofeach panel.
Figure 2. (a) OLM (Reynolds) ATL3 index in black (grey)line. Unit is �C. (b) June 1996 T/P+ERS meridional sectionat 20�W in plain black. Least mean square fit to thetheoretical 2nd baroclinic-mode R1 mode structure indashed grey. Unit is cm. (c) Hovmuller of simulated Kcontribution to SLA for the 2nd baroclinic mode at 0�N.(d) Hovmuller of simulated R1 contribution to SLA for the2nd baroclinic mode at 3�N. R1 is displayed reverse from46�W to 8�E. CI is 1 cm. Positive values are shaded.
L09701 ILLIG ET AL.: THE 1996 EQUATORIAL ATLANTIC WARM EVENT L09701
2 of 5

of the 1996 EA event, coupled experiments are carried outwith TIMACS over the 1995–96 period.
5. Coupled Experiments
[11] A total of seven model setups (Table 1) are required tointerpret the respective part played by the EA local coupledvariability and the remote sources of variability in therealization of the 1996 EA warm event. Experiments 1–3are atmospheric forced simulations, i.e., with no explicit air-sea interactions in the EA,whereas experiments 4–7 considera full coupling in the EA. The experiments differ by the area ofprescribed interannual SST (outside monthly seasonal SSTare prescribed as boundary condition for QTCM). For all theexperiments, initial conditions are those from TIMACS-CR(Table 1) taken at the 1-Jan-1995. Considering the potentialsensitivity of the results to the atmospheric model internalvariability, for each experiment setup (forced and coupled),61 ensemble member simulations are carried out. Eachensemble member is generated by slightly perturbing theTP SST, so that associated atmospheric disturbances canimpact the EA variability through the model atmosphericbridges. Perturbations are obtained from observed SST fol-lowing Kirtman and Schopf [1998], namely from the differ-ence between the total and the 6-month low-pass filteredSSTA. Note that TIMACS atmospheric interannual anoma-lies are estimated with respect to the ensemble mean of the 61QTCM-CLIM members.[12] TIMACS-CLIM does not simulate any EA warming
over 1995–96 (Figure 3a): the ensemble mean ATL3 indexremains close to zero, suggesting no preconditioning ofTIMACS to reproduce the 1996 EAwarming. Similar resultsare obtained with TIMACS-ATL (not shown). TIMACS-PAC simulates realistic SSTA peaking in May–June 1996(Figure 3b), in agreement with the observations (Figure 2a),with somewhat less amplitude. Similar results are obtainedwith TIMACS-CR (not shown). This demonstrates that theTP conditions in 1995–96 are essential for the generation ofthe EA 1996 warming in TIMACS. Concurrently, the OLMforced by WSA from QTCM-PAC experiment does notallow for reproducing the magnitude of the observed EA1996 warm event (not shown), which confirms that local air-sea interactions within the EA participate to the growth ofthe warm event.[13] As the results of the coupled experiments point out
to the privileged role of the TP in initiating the anomalous1996 event, we focus on the analysis of the possible tele-connection mechanism between the TP and the EA asobserved and simulated by TIMACS.
5.1. Teleconnection Mechanism
[14] From boreal summer 1995 colder than normal con-ditions are observed in the eastern TP (Figure 1b). The
atmospheric Kelvin wave response causes an anomalousWalker circulation pattern over the equatorial Pacific-Atlan-tic (Figures 3c–3f). In the far eastern TP, it is associated witha strong air descent, low troposphere divergent outflow andwesterly wind anomalies to the east of subsidence area. Themodel is in good agreement with the NCEP reanalysis, withhowever different characteristics of the teleconnection pat-tern depending on the model setup (Figures 3d–3f). Notethat a simple vegetation-climate land surface model isembedded in QTCM so that the potential impact of landsurface process feedbacks over South America is consid-ered. The strong midtropospheric anomalous descendingmotion observed over the western part of South America(80�W–75�W) is associated with anomalous divergent low-tropospheric outflow over this region (Figures 3c–3f). Thus,lower-tropospheric westerly wind anomalies develop andreach the western EA in November–December 1995. Theyinduce the WSA (Figure 3a) that force the oceanic Kelvinwave (K1, Figure 2c). Sensitivity experiments withTIMACS indicate that the timing and intensity of theseWSA are critical for the 1996 event to develop, as theyinitiate the warming in the eastern EA (Figures 1a and 2c).[15] Note also that, in QTCM-PAC, where only TP
interannual forcing is considered, the changes in the atmo-spheric circulation described above and associated WSA inend of 1995 are weaker than in QTCM-CR or in NCEP(Figures 3c–3e), whereas results of TIMACS-PAC comparerelatively well to QTCM-CR (Figures 3e–3f). Consistentlywith Su et al. [2005], this illustrates for the Pacific-Atlanticatmospheric bridge, the role of remote local air-sea inter-actions on teleconnection pattern characteristics.
5.2. Waves Sequence and Air-Sea Feedbacks in the EA
[16] We now focus on the growth of the event. The forceddownwelling oceanic Kelvin wave (K1) deepens (rises) the
Table 1. Summary of Numerical Experiments Done
Exp. Name Forced/Coupled Prescribed SSTA
1 QTCM-CLIM Atm. Forced �2 QTCM-PAC Atm. Forced TP3 QTCM-CR Atm. Forced Globe4 TIMACS-CLIM Coupled in EA �5 TIMACS-ATL Coupled in EA Atlantic, except EA6 TIMACS-PAC Coupled in EA TP7 TIMACS-CR Coupled in EA Globe, except EA
Figure 3. (a) SSTA ATL3 indices for the 61 TIMACS-CLIM ensemble members. (b) SSTA ATL3 indices for the61 TIMACS-PAC ensemble members. Unit is �C. The thickline is the ensemble mean. (c)–(f) October 1995 anomalousmid-tropospheric vertical velocity (400-600 mb). CI is1hpa/s. Arrows: 850 mb wind anomalies. Arrow scales arein the top right corner of each panel.
L09701 ILLIG ET AL.: THE 1996 EQUATORIAL ATLANTIC WARM EVENT L09701
3 of 5
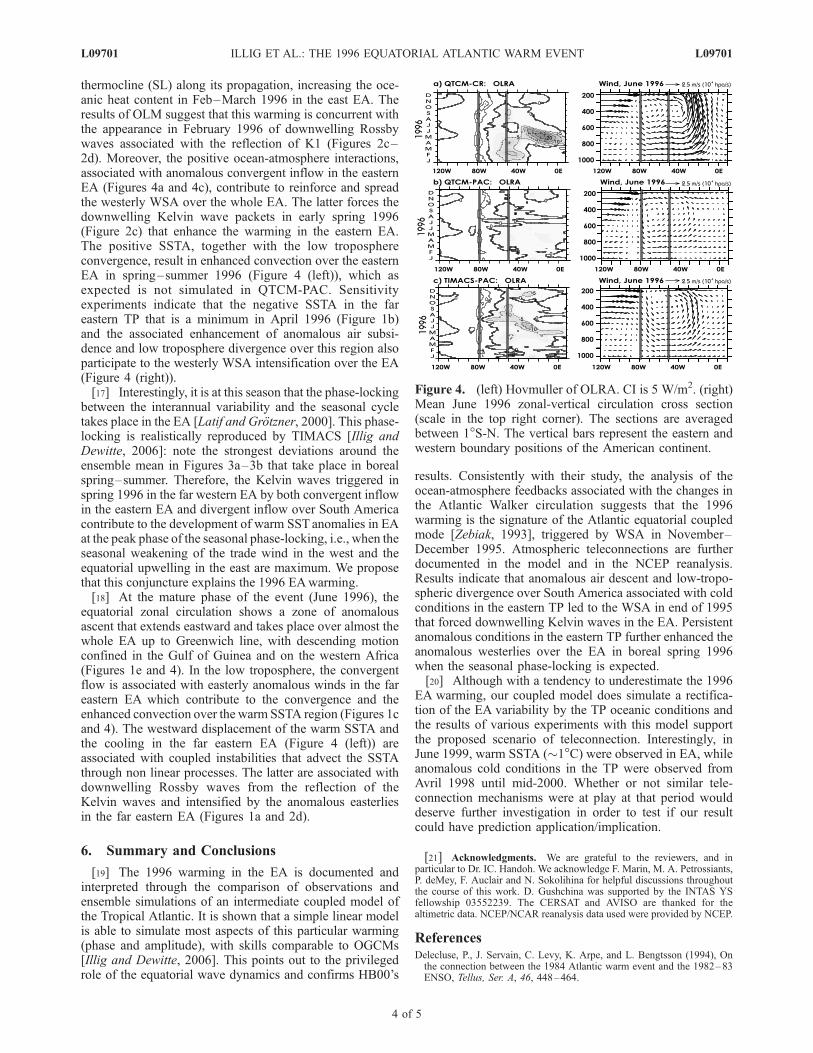
thermocline (SL) along its propagation, increasing the oce-anic heat content in Feb–March 1996 in the east EA. Theresults of OLM suggest that this warming is concurrent withthe appearance in February 1996 of downwelling Rossbywaves associated with the reflection of K1 (Figures 2c–2d). Moreover, the positive ocean-atmosphere interactions,associated with anomalous convergent inflow in the easternEA (Figures 4a and 4c), contribute to reinforce and spreadthe westerly WSA over the whole EA. The latter forces thedownwelling Kelvin wave packets in early spring 1996(Figure 2c) that enhance the warming in the eastern EA.The positive SSTA, together with the low troposphereconvergence, result in enhanced convection over the easternEA in spring–summer 1996 (Figure 4 (left)), which asexpected is not simulated in QTCM-PAC. Sensitivityexperiments indicate that the negative SSTA in the fareastern TP that is a minimum in April 1996 (Figure 1b)and the associated enhancement of anomalous air subsi-dence and low troposphere divergence over this region alsoparticipate to the westerly WSA intensification over the EA(Figure 4 (right)).[17] Interestingly, it is at this season that the phase-locking
between the interannual variability and the seasonal cycletakes place in the EA [Latif and Grotzner, 2000]. This phase-locking is realistically reproduced by TIMACS [Illig andDewitte, 2006]: note the strongest deviations around theensemble mean in Figures 3a–3b that take place in borealspring–summer. Therefore, the Kelvin waves triggered inspring 1996 in the far western EA by both convergent inflowin the eastern EA and divergent inflow over South Americacontribute to the development of warm SST anomalies in EAat the peak phase of the seasonal phase-locking, i.e., when theseasonal weakening of the trade wind in the west and theequatorial upwelling in the east are maximum. We proposethat this conjuncture explains the 1996 EAwarming.[18] At the mature phase of the event (June 1996), the
equatorial zonal circulation shows a zone of anomalousascent that extends eastward and takes place over almost thewhole EA up to Greenwich line, with descending motionconfined in the Gulf of Guinea and on the western Africa(Figures 1e and 4). In the low troposphere, the convergentflow is associated with easterly anomalous winds in the fareastern EA which contribute to the convergence and theenhanced convection over the warm SSTA region (Figures 1cand 4). The westward displacement of the warm SSTA andthe cooling in the far eastern EA (Figure 4 (left)) areassociated with coupled instabilities that advect the SSTAthrough non linear processes. The latter are associated withdownwelling Rossby waves from the reflection of theKelvin waves and intensified by the anomalous easterliesin the far eastern EA (Figures 1a and 2d).
6. Summary and Conclusions
[19] The 1996 warming in the EA is documented andinterpreted through the comparison of observations andensemble simulations of an intermediate coupled model ofthe Tropical Atlantic. It is shown that a simple linear modelis able to simulate most aspects of this particular warming(phase and amplitude), with skills comparable to OGCMs[Illig and Dewitte, 2006]. This points out to the privilegedrole of the equatorial wave dynamics and confirms HB00’s
results. Consistently with their study, the analysis of theocean-atmosphere feedbacks associated with the changes inthe Atlantic Walker circulation suggests that the 1996warming is the signature of the Atlantic equatorial coupledmode [Zebiak, 1993], triggered by WSA in November–December 1995. Atmospheric teleconnections are furtherdocumented in the model and in the NCEP reanalysis.Results indicate that anomalous air descent and low-tropo-spheric divergence over South America associated with coldconditions in the eastern TP led to the WSA in end of 1995that forced downwelling Kelvin waves in the EA. Persistentanomalous conditions in the eastern TP further enhanced theanomalous westerlies over the EA in boreal spring 1996when the seasonal phase-locking is expected.[20] Although with a tendency to underestimate the 1996
EA warming, our coupled model does simulate a rectifica-tion of the EA variability by the TP oceanic conditions andthe results of various experiments with this model supportthe proposed scenario of teleconnection. Interestingly, inJune 1999, warm SSTA (�1�C) were observed in EA, whileanomalous cold conditions in the TP were observed fromAvril 1998 until mid-2000. Whether or not similar tele-connection mechanisms were at play at that period woulddeserve further investigation in order to test if our resultcould have prediction application/implication.
[21] Acknowledgments. We are grateful to the reviewers, and inparticular to Dr. IC. Handoh. We acknowledge F. Marin, M. A. Petrossiants,P. deMey, F. Auclair and N. Sokolihina for helpful discussions throughoutthe course of this work. D. Gushchina was supported by the INTAS YSfellowship 03552239. The CERSAT and AVISO are thanked for thealtimetric data. NCEP/NCAR reanalysis data used were provided by NCEP.
ReferencesDelecluse, P., J. Servain, C. Levy, K. Arpe, and L. Bengtsson (1994), Onthe connection between the 1984 Atlantic warm event and the 1982–83ENSO, Tellus, Ser. A, 46, 448–464.
Figure 4. (left) Hovmuller of OLRA. CI is 5 W/m2. (right)Mean June 1996 zonal-vertical circulation cross section(scale in the top right corner). The sections are averagedbetween 1�S-N. The vertical bars represent the eastern andwestern boundary positions of the American continent.
L09701 ILLIG ET AL.: THE 1996 EQUATORIAL ATLANTIC WARM EVENT L09701
4 of 5
Handoh, I. C., and G. R. Bigg (2000), A self-sustaining climate mode in thetropical Atlantic, 1995–97: Observations and modelling, Q. J. R. Me-teorol. Soc., 126, 807–821.
Illig, S., and B. Dewitte (2006), Role of local coupled equatorial variabilityversus remote ENSO forcing in an intermediate coupled model of thetropical Atlantic, J. Clim., in press.
Illig, S., B. Dewitte, N. Ayoub, Y. du Penhoat, G. Reverdin, P. De Mey,F. Bonjean, and GSE Lagerloef (2004), Interannual long equatorial wavesin the tropical Atlantic from a high resolution OGCMexperiment in 1981–2000, J. Geophys. Res., 109, C02022, doi:10.1029/2003JC001771.
Kalnay, E., et al. (1996), The NCEP/NCAR 40-year reanalysis project, Bull.Am. Meteorol. Soc., 77, 437–471.
Kirtman, B. P., and P. S. Schopf (1998), Decadal variability in ENSOpredictability an prediction, J. Clim., 11, 2804–2822.
Latif, M., and A. Grotzner (2000), The equatorial Atlantic oscillation and itsresponse to ENSO, Clim. Dyn., 16, 213–218.
Le Traon, P. Y., F. Nadal, andN.Ducet (1998), An improvedmappingmethodof multisatellite altimeter data, J. Atmos. Oceanic Technol., 15, 522–534.
Neelin, J. D., and N. Zeng (2000), A quasi-equilibrium tropical circulationmodel-formulation, J. Atmos. Sci., 57, 1741–1766.
Reynolds, R. W., and T. M. Smith (1994), Improved global sea surfacetemperature analyses using optimum interpolation, J. Clim., 7, 929–948.
Su, H., J. D. Neelin, and J. E. Meyerson (2005), Mechanisms for laggedatmospheric response to ENSO SST forcing, J. Clim., 18, 4195–4215.
Wang, C. (2002), Atlantic climate variability and its associated atmosphericcirculation cells, J. Clim., 15, 1516–1536.
Zebiak, S. E. (1993), Air-sea interaction in the equatorial Atlantic region,J. Clim., 6, 1567–1586.
�����������������������N. Ayoub, B. Dewitte, Y. du Penhoat, and S. Illig, LEGOS, 14 avenue
Edouard Belin, F-31401 Toulouse, France. ([email protected])D. Gushchina, Geographical Faculty, Moscow State University, Moscow
119899, Russia.
L09701 ILLIG ET AL.: THE 1996 EQUATORIAL ATLANTIC WARM EVENT L09701
5 of 5