serbia consolidated collection and pension …...vi key staff responsible consolidated collection...
TRANSCRIPT

Report No. 124854 JUNE 25, 2018
SERBIA
Consolidated Collection and Pension Administration Reform Project and
Delivery of Improved Local Services
© 2018 International Bank for Reconstruction and Development / The World Bank 1818 H Street NW Washington DC 20433 Telephone: 202-473-1000 Internet: www.worldbank.org Attribution—Please cite the work as follows: World Bank. 2018. Serbia—Consolidated Collection and Pension Administration Reform Project and Delivery of Improved Local Services. Independent Evaluation Group, Project Performance Assessment Report 124854. Washington, DC: World Bank.
This work is a product of the staff of The World Bank with external contributions. The findings, interpretations, and conclusions expressed in this work do not necessarily reflect the views of The World Bank, its Board of Executive Directors, or the governments they represent.
The World Bank does not guarantee the accuracy of the data included in this work. The boundaries, colors, denominations, and other information shown on any map in this work do not imply any judgment on the part of The World Bank concerning the legal status of any territory or the endorsement or acceptance of such boundaries.
RIGHTS AND PERMISSIONS The material in this work is subject to copyright. Because The World Bank encourages dissemination of its knowledge, this work may be reproduced, in whole or in part, for noncommercial purposes as long as full attribution to this work is given.
Any queries on rights and licenses, including subsidiary rights, should be addressed to World Bank Publications, The World Bank Group, 1818 H Street NW, Washington, DC 20433, USA; fax: 202-522-2625; e-mail: [email protected].

Report No.: 124854
PROJECT PERFORMANCE ASSESSMENT REPORT
SERBIA
CONSOLIDATED COLLECTION & PENSION ADMINISTRATION REFORM
PROJECT
(IDA CREDIT NO.40710)
DELIVERY OF IMPROVED LOCAL SERVICES
(IBRD LOAN NO 75100)
June 25, 2018
Human Development and Economic Management
Independent Evaluation Group

Currency Equivalents (annual averages)
Currency Unit = Serbian dinar (RSD)
2008 $1.00 RSD55.72
2009 $1.00 RSD67.58
2010 $1.00 RSD77.73
2011 $1.00 RSD73.33
2012 $1.00 RSD87.97
2013 $1.00 RSD85.16
2014 $1.00 RSD88.41
2015 $1.00 RSD108.8
Abbreviations
CPS country partnership strategy
CROSO Central Registry of Compulsory
Social Insurance
CSO civil society organization
CSW Center for Social Work
DILS Delivery of Improved Local
Services Project
EU European Union
FSU Fiduciary Services Unit
GDP gross domestic product
HIF Health Insurance Fund
ICR Implementation Completion and
Results Report
ICT information communication
technology
IEG Independent Evaluation Group
IEP Individual Education Plan
IMF International Monetary Fund
ISC intersectoral committees
LSG local self-government
M&E Monitoring and evaluation
MIS management information systems
MOESTD Ministry of Education, Science, and
Technological Development
MOF Ministry of Finance
MOH Ministry of Health
MOLEVSP Ministry of Labour, Employment,
Veterans, and Social Policy
MPALSG Ministry of Public Administration
and Local Self-Government
NES National Employment Services
OECD Organisation for Economic Co-
operation and Development
PAD project appraisal document
PARP Pension Administration Reform
Project
PAYGO pay-as-you-go
PDO project development objective
PHC primary health care
PIO Republic Fund of Pension and
Disability Insurance
PISA Program for International Student
Assessment
PMU project management unit
PPB Project Policy Board
PPAR Project Performance Assessment
Report
PWDs persons with disabilities
SCD Systematic Country Diagnostic
SDR Special Drawing Rights
UCF Unified Collection Report
UNICEF United Nations Children’s Fund
All dollar amounts are U.S. dollars unless otherwise indicated.
Fiscal Year
Government: January 1—December 31
Director-General, Independent Evaluation Ms. Caroline Heider
Director, Human Development and Economic Management Mr. Auguste Tano Kouame
Manager, Corporate and Human Development Ms. Emanuela Di Gropello
Task Manager Mr. Antonio Giuffrida

iii
Contents
Principal Ratings ................................................................................................................. v
Key Staff Responsible........................................................................................................ vi
Preface.............................................................................................................................. viii
Summary ............................................................................................................................ ix
1. Background and Context................................................................................................. 1
The Political and Economic Context .................................................................................. 1
The Demographic Context .............................................................................................. 1
The Role of Local Government in the Delivery of Health, Education, and Social
Protection Services.......................................................................................................... 3
The Pension System ........................................................................................................ 6
2. Consolidated Collection and Pension Administration Reform Project........................... 7
Project Development Objectives..................................................................................... 7
Relevance of Objectives ................................................................................................. 8
Project Design ............................................................................................................. 9
Relevance of Design ................................................................................................. 10
Project Implementation ................................................................................................. 13
Achievement of Objectives ........................................................................................... 14
Objective 1 ................................................................................................................ 14
Objective 2 ................................................................................................................ 16
Efficiency ...................................................................................................................... 19
Ratings .......................................................................................................................... 20
Project Outcome........................................................................................................ 20
Risk to Development Outcome ................................................................................. 20
Bank Performance ..................................................................................................... 20
Borrower Performance .............................................................................................. 21
Monitoring and Evaluation ....................................................................................... 22
3. Delivery of Improved Local Services Project ............................................................... 22
Project Development Objectives................................................................................... 22
Relevance of Objectives ........................................................................................... 23
Project Design ........................................................................................................... 25
Relevance of Design ................................................................................................. 27
Project Implementation ................................................................................................. 32
Significant Changes in the Project ............................................................................ 32

iv
Implementation Experience ...................................................................................... 33
Safeguards Compliance ............................................................................................ 34
Fiduciary Compliance ............................................................................................... 34
Achievement of Objectives ........................................................................................... 35
Objective 1 ................................................................................................................ 35
Objective 2 ................................................................................................................ 38
Objective 3 ................................................................................................................ 41
Efficiency ...................................................................................................................... 42
Ratings .......................................................................................................................... 43
Project Outcome........................................................................................................ 43
Risk to Development Outcome ................................................................................. 43
Bank Performance ..................................................................................................... 44
Borrower Performance .............................................................................................. 45
Monitoring and Evaluation ....................................................................................... 45
4. Lessons .......................................................................................................................... 47
PARP............................................................................................................................. 47
DILS .............................................................................................................................. 48
References ......................................................................................................................... 51
Figures
Figure 1.1. Evolution of GDP and Timeline of the Projects ............................................... 1
Figure 1.2. Serbia’s Demographic Projection ..................................................................... 2
Figure 2.1. The Project Results Chain .............................................................................. 11
Figure 2.2. Total Pension Expenditures as a Share of GDP (percent) .............................. 19
Figure 3.1. The Project Results Chain .............................................................................. 28
Tables
Table 2.1. Financing by Component: Consolidated Collection and Pension
Administration Reform Project ........................................................................................... 9
Table 3.1. Financing by Component: Delivery of Improved Local Services Project ....... 25
Appendixes
Appendix A. Basic Data Sheet.......................................................................................... 55
Appendix B. Monitoring and Evaluation Frameworks ..................................................... 61
Appendix C. List of Persons Met ...................................................................................... 68

v
Principal Ratings
Consolidated Collection and Pension Administration Reform Project
ICR* ICR Review* PPAR
Outcome Moderately satisfactory Moderately satisfactory Moderately satisfactory
Risk to
development
outcome
High High Moderate
Bank
performance
Moderately satisfactory Moderately satisfactory Moderately satisfactory
Borrower
performance
Moderately satisfactory Moderately satisfactory Moderately satisfactory
* The Implementation Completion and Results (ICR) report is a self-evaluation by the responsible global practice. The ICR Review is an intermediate Independent Evaluation Group (IEG) product that seeks to independently validate the findings of the ICR.
Delivery of Improved Local Services
ICR* ICR Review* PPAR
Outcome Moderately satisfactory Moderately satisfactory Moderately satisfactory
Risk to
development
outcome
Moderate Moderate Moderate
Bank
performance
Moderately satisfactory Moderately satisfactory Moderately satisfactory
Borrower
performance
Moderately satisfactory Moderately satisfactory Moderately satisfactory
* The Implementation Completion and Results Report (ICR) is a self-evaluation by the responsible global practice. The ICR Review is an intermediate IEG product that seeks to independently validate the findings of the ICR.
vi
Key Staff Responsible
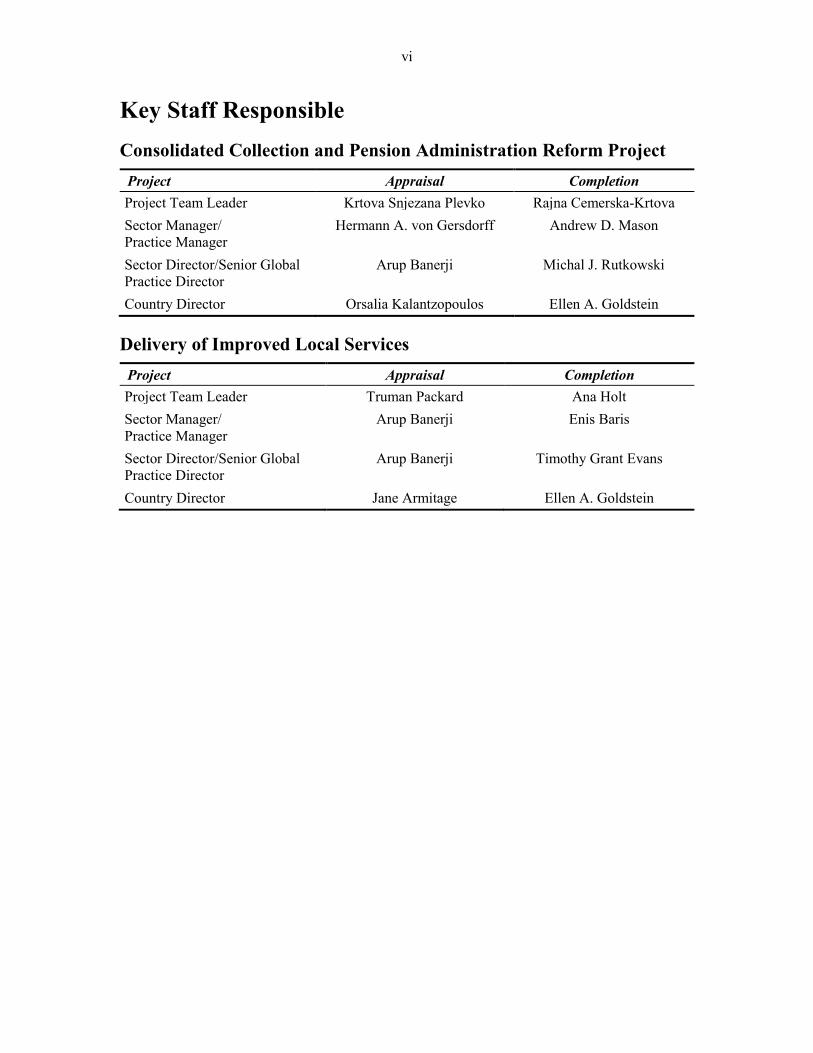
Consolidated Collection and Pension Administration Reform Project
Project Appraisal Completion
Project Team Leader Krtova Snjezana Plevko Rajna Cemerska-Krtova
Sector Manager/
Practice Manager
Hermann A. von Gersdorff Andrew D. Mason
Sector Director/Senior Global
Practice Director
Arup Banerji Michal J. Rutkowski
Country Director Orsalia Kalantzopoulos Ellen A. Goldstein
Delivery of Improved Local Services
Project Appraisal Completion
Project Team Leader Truman Packard Ana Holt
Sector Manager/
Practice Manager
Arup Banerji Enis Baris
Sector Director/Senior Global
Practice Director
Arup Banerji Timothy Grant Evans
Country Director Jane Armitage Ellen A. Goldstein

vii
IEG Mission: Improving World Bank Group development results through excellence in independent evaluation.
About This Report
The Independent Evaluation Group (IEG) assesses the programs and activities of the World Bank for two purposes: first, to ensure the integrity of the World Bank’s self-evaluation process and to verify that the World Bank’s work is producing the expected results, and second, to help develop improved directions, policies, and procedures through the dissemination of lessons drawn from experience. As part of this work, IEG annually assesses 20–25 percent of the World Bank’s lending operations through fieldwork. In selecting operations for assessment, preference is given to those that are innovative, large, or complex; those that are relevant to upcoming studies or country evaluations; those for which Executive Directors or World Bank management have requested assessments; and those that are likely to generate important lessons.
To prepare a Project Performance Assessment Report (PPAR), IEG staff examine project files and other documents, visit the borrowing country to discuss the operation with the government, and other in-country stakeholders, interview World Bank staff and other donor agency staff both at headquarters and in local offices as appropriate, and apply other evaluative methods as needed.
Each PPAR is subject to technical peer review, internal IEG panel review, and management approval. Once cleared internally, the PPAR is commented on by the responsible World Bank country management unit. The PPAR is also sent to the borrower for review. IEG incorporates both World Bank and borrower comments as appropriate, and the borrowers’ comments are attached to the document that is sent to the World Bank’s Board of Executive Directors. After an assessment report has been sent to the Board, it is disclosed to the public.
About the IEG Rating System for Public Sector Evaluations
IEG’s use of multiple evaluation methods offers both rigor and a necessary level of flexibility to adapt to lending instrument, project design, or sectoral approach. IEG evaluators all apply the same basic method to arrive at their project ratings. Following is the definition and rating scale used for each evaluation criterion (additional information is available on the IEG website: http://ieg.worldbankgroup.org).
Outcome: The extent to which the operation’s major relevant objectives were achieved, or are expected to be achieved, efficiently. The rating has three dimensions: relevance, efficacy, and efficiency. Relevance includes relevance of objectives and relevance of design. Relevance of objectives is the extent to which the project’s objectives are consistent with the country’s current development priorities and with current World Bank country and sectoral assistance strategies and corporate goals (expressed in Poverty Reduction Strategy Papers, Country Assistance Strategies, sector strategy papers, and operational policies). Relevance of design is the extent to which the project’s design is consistent with the stated objectives. Efficacy is the extent to which the project’s objectives were achieved, or are expected to be achieved, taking into account their relative importance. Efficiency is the extent to which the project achieved, or is expected to achieve, a return higher than the opportunity cost of capital and benefits at least cost compared with alternatives. The efficiency dimension is not applied to development policy operations, which provide general budget support. Possible ratings for outcome: highly satisfactory, satisfactory, moderately satisfactory, moderately unsatisfactory, unsatisfactory, highly unsatisfactory.
Risk to Development Outcome: The risk, at the time of evaluation, that development outcomes (or expected outcomes) will not be maintained (or realized). Possible ratings for risk to development outcome: high, significant, moderate, negligible to low, and not evaluable.
Bank Performance: The extent to which services provided by the World Bank ensured quality at entry of the operation and supported effective implementation through appropriate supervision (including ensuring adequate transition arrangements for regular operation of supported activities after loan or credit closing, toward the achievement of development outcomes). The rating has two dimensions: quality at entry and quality of supervision. Possible ratings for Bank performance: highly satisfactory, satisfactory, moderately satisfactory, moderately unsatisfactory, unsatisfactory, and highly unsatisfactory.
Borrower Performance: The extent to which the borrower (including the government and implementing agency or agencies) ensured quality of preparation and implementation, and complied with covenants and agreements, toward the achievement of development outcomes. The rating has two dimensions: government performance and implementing agency(ies) performance. Possible Ratings for borrower performance: highly satisfactory, satisfactory, moderately satisfactory, moderately unsatisfactory, unsatisfactory, and highly unsatisfactory.

viii
Preface
This is the Project Performance Assessment Report for two projects implemented in
Serbia.
The Consolidated Collection and Pension Administration Reform Project, P090418, was
approved in May 2005 as a credit for special drawing rights 16.6 million ($25 million
equivalent). Government counterpart financing was planned for $0.4 million. The credit
closed on September 30, 2012, two years after the original completion date.
The Delivery of Improved Local Services Project, P096823 (DILS), was approved by the
World Bank’s Board of Executive Directors in March 2008 with an International Bank
for Reconstruction and Development loan of €32.0 million ($46.4 million equivalent). No
government counterpart was envisaged. The project became effective in March 2009 and
closed in March 2015, 27 months later than planned, with a total execution period from
effectiveness of 72 months (six years).
This report serves an accountability purpose, evaluating the extent to which the
operations achieved their intended outcomes, and to identify lessons that can be used to
enhance similar operations supported by the World Bank.
This report was prepared by Antonio Giuffrida, lead evaluation officer; Dejana Razicilic,
consultant; Hjalte Sederlof, consultant; and Anna Amato, consultant. The assessment is
based on a review of all relevant World Bank documentation (that is, the project appraisal
document, the Implementation Completion and Results Report and the Independent
Evaluation Group (IEG) Implementation Completion and Results Report Review, World
Bank Group country strategies, and relevant sector strategies), and the PPAR mission to
Serbia undertaken by Antonio Giuffrida and Dejana Razicilic from March 6 to March 16,
2018, during which interviews were conducted with government officials and technical
staff, beneficiaries, health service providers, relevant development partners, and other
involved persons.
IEG gratefully acknowledges all those who made time for interviews and provided
documents and information and expresses its gratitude to the World Bank office in
Belgrade for the logistical and administrative support provided to the mission.
Following standard IEG procedures, a copy of the draft Project Performance Assessment
Report was sent to the relevant government officials and agencies for their review and
feedback. No comments were received.

ix
Summary
Following the dissolution of the former Yugoslavia and a series of regional wars, the
Federation of the Republics of Serbia and Montenegro rejoined the World Bank in 2001.
Serbia experienced solid growth during 2000–2008, followed by a series of severe
recessions combined with rapidly rising unemployment and growing public debt over
2008–2014. To improve its growth prospects Serbia embarked on several structural
reforms between 2014 and 2017. As a result, the general government budget turned from
a deficit of 6.6 percent of gross domestic product (GDP) to a surplus of 1.2 percent,
driven both by improved revenue collection and subdued current expenditure.
Government debt, after peaking at 74.6 percent of GDP in 2015, fell to 61.5 percent of
GDP in 2017. Growth fundamentals and prospects are now sound, and the underlying
growth trend is vibrant.
Serbia is at a late stage of demographic transition, characterized by a total fertility rate
well below the population replacement rate, and an aging and shrinking population.
Demographic and population changes have clear implications for the delivery of health,
education, and social assistance services, and for the sustainability of the pension system.
In the meantime, Roma, having a much higher total fertility rate, are going to represent a
growing percentage of the total Serbian population and the future workforce.
Consolidated Collection and Pension Administration Reform Project
When the Consolidated Collection and Pension Administration Reform Project (PARP)
was being prepared, pension expenditure had risen from about 11 percent of GDP in 2001
to almost 16 percent in 2004, generating a yearly deficit of 5.5 percent of GDP and
representing a significant burden on Serbia’s fiscal accounts.
Various parametric reforms had already been introduced to address the structural
imbalances of the pension system stemming from the demographic situation and the
volatile labor market. However, the financial position of the system was not expected to
improve in the short run without additional reforms to improve compliance with
contributions and reduce the administrative costs of the pensions funds.
Objectives and Design
The objectives of the PARP are to (i) develop the framework for the consolidation of
collection of all social contributions and, if feasible, personal income taxes; and to (ii)
improve the effectiveness and efficiency of the pension system through modernizing and
streamlining the institutional capacity in the pension system; improved pension system
administration; developing the capacity for policy identification and analysis; monitoring;
and increased public understanding of the pension system.
The relevance of the objectives is rated high at approval, at project closure, and at the
time of the Independent Evaluation Group mission for this assessment. The project
objectives are highly relevant to the country’s macroeconomic context, as the project
addressed a major concern for Serbia’s fiscal balance. The project also contributes to the
objective of the government and the European Union of ensuring adequate and

x
sustainable pensions systems. The objectives were highly relevant to World Bank Group
strategies with the Serbia both at approval and at completion. Finally, the complex links
between labor force participation in the formal economy and the fiscal sustainability of
the pension system are identified as a medium priority constraint to progress toward the
twin goals in the 2015 Serbia Systematic Country Diagnostic.
The relevance of the design is rated substantial. The project results chain presents clear
and direct links between project activities, outputs, intermediate outcomes, project
development objectives, and the longer-term outcome of ensuring adequate and
sustainable pensions for Serbian population. The first component financed the feasibility
study to define the overall framework for consolidating the collection and reporting of all
social contributions and the establishment of a unified central registry of social
contributions to produce monthly individualized reporting on benefits and collections.
The remaining components contribute to the second objective of increasing the
effectiveness and efficiency of the pension system through the modernization and
streamlining of administration of the pension funds, the improved capacity at the
Ministry of Labor, Employment, Veteran and Social Policy for quantitative actuarial
modeling of pension system analysis and policy development, and better knowledge of
the pension system among the general population.
Project Outcome
The achievement of objective 1 is rated substantial. The objective was rated modest at
the Implementation Completion and Results Report Review, as at that time, neither the
contributions recording and collections system nor the central registry were yet
operational. The central registry is now operational. It allows monthly individualized
reporting and it is the central repository of all information needed by the three
participating social insurance institutions, ending the need for each institution to collect,
verify, and maintain its own database.
The achievement of objective 2 is rated substantial. The Serbia substantially improved
the effectiveness and efficiency of the pension system as measured by the reduction in the
ratio between the overall administrative costs and total pension expenditures, which
contributed to a long-term reduction of total pension expenditure as a percentage of GDP.
The project contributed through the successful introduction of a central registry (see
objective 1) and the effective modernization and streamlining of pension system
administration. However, the project was less successful in enhancing the capacity for
policy identification and analysis.
Efficiency in the use of project resources is rated modest. The project achieved
observable efficiency improvements, some of which are quantifiable. For example, the
project contributed to reduce the operating expenses of the pension system and to
increase pension contribution collection. Additional benefits, but more difficult to
quantify, include the improved fiscal balance, better services to pensioners, and improved
services to tax and social contributions payers. However, shortcomings in implementation
had a negative impact on the overall efficiency of the project. The two-year extension of
the closing date and the fact that the full functionality of the central registry was reached
only in 2014 indicates reduced project efficiency.

xi
Overall, the project outcome is rated moderately satisfactory.
Project Risks and Bank and Borrower Performance
Risk to development outcome is rated moderate. The risks to the improvements achieved
in the collection of social contributions through the unified central registry are low to
negligible. The risks to the improvement achieved in the effectiveness and efficiency of
Serbian public pension are moderate. The fiscal outlook of the pension system is now
positive thanks to additional parametric reforms (changes in contribution and benefit
parameters and eligibility conditions) that have complemented the improvements
achieved under the project.
Overall Bank performance is rated moderately satisfactory. Quality at entry is rated
moderately satisfactory. The World Bank team had extensive experience on pension
reform in transition countries and drew on prior experience in Serbia, where a series of
development policy operations had already begun improving the performance and
sustainability of the pension system. However, key features of the unified central registry
were still open to debate when project implementation started, which reflects insufficient
stakeholder analysis during project preparation. Quality of supervision is rated
moderately satisfactory. The team could carry the policy dialogue—the difficulty of
which should not be underrated—to satisfactory closure. Still, it was not able to
accelerate decision making about the unified central registry.
Finally, borrower performance is rated moderately satisfactory. Government
performance is rated moderately satisfactory, as initially it did not manage effectively the
discussion between the agencies involved in decisions about the framework for the
consolidation of social contributions. However, it showed strong commitment to achieve
the objectives of the project even after completion. Implementing agency performance is
rated moderately satisfactory. The project management unit showed adequate knowledge
and understanding of disbursement policies and procedures regulating use of the loan, but
it could have been more proactive in identifying and overcoming bottlenecks that caused
a two-year delay in project implementation.
Delivery of Improved Local Services Project
The Delivery of Improved Local Services Project (DILS) aimed to improve the local
delivery of health, education, and social assistance services within the framework Law on
Local Self-Government (LSG) Financing, which was approved in July 2006 and was
expected to expand the fiscal autonomy and responsibilities of municipalities.
The health sector was considering transforming the traditional line-item method to
finance primary health care services into a capitation system with a performance-linked
component. Similarly, per-student financing was to be adopted in the education sector. In
the same period, the government was contemplating reform of the operation of the
Disability Fund, which was the main vehicle to finance social services for people with
disabilities. Improving the quality of health, education, and social assistance services was
(and still is) a priority in Serbia. In health, the objective was to introduce a culture
conducive to continuous quality improvements. The Law on the Fundamentals of the

xii
Education System, adopted in 2009, emphasized the need for a more inclusive education
model. A unified social welfare management information system (MIS) was expected to
be designed and implemented to improve the management and administration of social
assistance programs. Finally, the Serbia had joined the Decade of Roma Inclusion and
was committed to reduce the gaps between Roma and the rest of society, including those
related to access to health, education, and social assistance services.
Objectives and Design
The objectives of the project are to “increase the capacity of institutional actors and
beneficiaries to improve access to, and the efficiency, equity and quality of, local delivery
of health, education and social protection services, in a decentralizing environment.” In
the PPAR assessment, the objectives are organized around the three sectors involved:
health, education, and social protection services. Within each sector, project
achievements are assessed independently along the three dimensions of improved
efficiency, quality, and access for vulnerable groups.
The relevance of the objectives is rated high. The pressure for fiscal consolidation that
the government faced at the time of project appraisal makes the objective of improving
the efficiency of health, education, and social assistance services highly relevant. Project
objectives were well aligned to the recently approved Law of LSG Financing and to
national sectoral strategies. The focus on vulnerable groups, such as Roma, contributed to
the commitment made by the Serbia to close the gap between Roma and the rest of
society. Project objectives were also relevant to the World Bank country strategy at the
time of appraisal, as well as to subsequent country strategies. Finally, improved access,
quality, and efficiency in the delivery of health, education, and social assistance services
are identified as key to progress toward achieving the twin goals in Serbia Systematic
Country Diagnostic.
The relevance of the design is rated modest. The design evolved into three separate
projects, managed by three Project Administration Teams located in the three lead
ministries (health, education, and social policies) and a Fiduciary Services Unit (FSU)
established to centralize all procurement, financial management, and disbursement
functions of the project. A Project Policy Board consisting of representatives from the
ministries participating in the execution of the project and from local governments was
established to foster intersectoral coordination. The sector-specific result chains are well
supported by logical arguments and evidence. However, the overall project design is
complex, and has some weaknesses. The large scope of the project—in term of sectors,
dimensions, and beneficiaries involved—weakens the design as the efforts are diluted. As
a result, the impact of the project in some areas was limited.
Project Outcome
The overall achievement of objective 1—increase the capacity of institutional actors and
beneficiaries to improve the efficiency, quality, and access (for vulnerable population
groups) of locally delivered health services, in a decentralized environment—is rated
substantial. The project enhanced the capacity of the sector to improve efficiency
through provider payment reforms in primary health care and through centralized

xiii
procurement of medicine. The project strengthened the capacity of primary health care
institutions to deliver quality health services through the development and adoption of
clinical guidelines and clinical pathways and voluntary accreditation. Project grants were
effective in improving connectivity and the use of information technology at the primary
care level. Finally, the project was successful in enhancing the capacity of the health
system to improve accessibility to health services by Roma populations through the
training and recruitment of health mediators.
The achievement of objective 2—increase the capacity of institutional actors and
beneficiaries to improve the efficiency, quality, and access (for vulnerable population
groups) of locally delivered education services, in a decentralized environment—is rated
substantial. The improvement in the capacity of the education sector to improve
efficiency through financing reforms was modest as the per-student financing formulas
were developed and piloted but not implemented. However, the project was successful in
improving the capacity of schools to deliver better quality and more inclusive education
services. Finally, the project enhanced the capacity of schools and municipalities to
improve access to education to students with special needs and Roma children.
The achievement of objective 3—increase the capacity of institutional actors and
beneficiaries to improve the efficiency, quality, and access (for vulnerable population
groups) of locally delivered social assistance services, in a decentralized environment—
is rated modest. The new operation modality of the Disability Fund enhanced the
transparency and the effectives of resources used to provide social assistance services to
people with disabilities. However, the project did not deliver the enhanced MIS to
improve the efficiency in the delivery of social assistance services.
Efficiency in the use of project resources is rated modest. The project selected potentially
cost-effective interventions based on the international experience and the relevant
academic literature has shown that the activities chosen can improve the use, quality, and
efficiency of locally delivered health, education, and social protection services. However,
only few benefits are quantifiable. For example, the centralized procurement of drugs
supported by the project, contributed to a 27 percent reduction in drug prices, and to a
€25 million per year reduction in pharmaceutical expenditure. In addition, shortcomings
in the implementation have a negative impact on the overall efficiency of the project.
Some activities were implemented only partially, thus the potential benefits did not
materialize. Other activities were implemented with delays that reduced the benefits
generated. Implementation delays resulted in 25 months of extensions that further diluted
the improvements expected from the interventions.
Overall, the project outcome is rated moderately satisfactory.
Project Risks and Bank and Borrower Performance
Risk to development outcome is rated moderate. For most project outcomes, the risk
they will not be maintained in the future is negligible to low. However, selected project
outcomes, notably those related to improvements in access to services for vulnerable
groups, are subject to moderate risks.

xiv
Overall Bank performance is rated moderately satisfactory. Quality at entry is rated
moderately satisfactory. The World Bank supported the borrower in the preparation of
the project with an experienced and extended team that brought international experience
relevant to Serbia. However, it took about 20 months to move from concept review to
approval and some shortcomings were identified in the capacity to monitor progress.
Supervision is rated moderately satisfactory. The World Bank played an important
convening role during project implementation, attempting to bridge barriers between state
ministries and across levels of government. However, the World Bank team could have
more proactive in identifying and rectifying the critical risks and bottlenecks that affected
project implementation.
Finally, borrower performance is rated moderately satisfactory. Government
performance is rated moderately satisfactory. On one hand, the government provided
weak overall policy coordination. On the other hand, middle-level management showed
commitment to the reforms and strong ownership and support from certain reform-
oriented high officials that championed specific themes and activities. Implementing
agency performance is rated moderately satisfactory. The division of labor between the
project’s implementing agencies worked well. However, the Project Administration
Teams were contracted as external consultants under the projects and were paid more
than regular ministry staff. Additionally, the work of the implementing agencies was
negatively affected by political changes that occurred during project implementation, as
changes at the minister level led to changes at the Project Administration Teams in the
three relevant ministries, as well as in the staff of the FSU.
Lessons
Eight lessons that could help improve future World Bank operations are identified. The
first lesson arises from both projects, followed by three lessons from PARP and four
lessons from the DILS project.
• Clarity around the overall vision and data architecture is needed for
successful MIS investments. Several steps are needed to build an MIS: analysis
of the business processes, design of the data architecture, procurement of
hardware and software, installation and testing, and training users. The likelihood
of success in this process is improved if business processes and the underlying
data architecture are well defined. This occurred in the development of the
Central Registry of Compulsory Social Insurance (CROSO). Even if the first step
(the definition of the overall framework) took a long time, it permitted finalizing
of the MIS after project completion. In contrast, the vision of the social assistance
MIS was not well defined, which contributed to the failure of the MIS investment.
Consolidated Collection and Pension Administration Reform Project
• A stakeholder analysis can be a useful tool to identify potential supporters
and resistance when reforms involve several actors. The reform of the social
contribution collection and reporting system involved several parties. A
stakeholder analysis of the participating institutions would have yielded crucial
insights to identify potential reasons for support and resistance, the areas where

xv
cooperation was natural, and where more attention was needed from high-level
officials able to resolve institutional problems.
• The tax administration can be usefully included in the administrative reform
process. Many countries have to consider the role of the tax administration in
collections and compliance—should it be a lead agency, a participant, or a
nonparticipant? Whatever the option chosen, it is important to involve the tax
office early on, not only because of their mandated role as a tax collection agency,
but also because they tend to have the strongest human and technical capacity,
and legal instruments of enforcement at their disposal, and they often have the
strongest political support. In Serbia, CROSO was chosen for the collections
function, but with some difficulty because insufficient attention was paid to
coordinating with the tax authority.
• Rationalizing the social insurance system takes time. In Serbian administrative
reform, the country chose to rationalize the social insurance system information
and contribution flows. Experience from other countries shows that this process
may be slow, sometimes taking one to two years. Therefore, ample time should be
reserved to do the work needed to alter budgets and to conduct strategic planning
to accommodate institutional changes. The potentially most complex and time-
consuming task will be to ensure all past service data are accurate and complete,
and to modernize and automate the key benefit calculation and payment business
processes.
Delivery of Improved Local Services Project
• Multisector projects have the advantage of providing bridge financing that
allows continuity and deepening of reforms policy, but this design feature
may negatively affect other project ratings. DILS was effective in providing
bridge financing that allowed the World Bank to sustain sector support and policy
dialogue in three sectors. However, the wide scope of the project weakened the
capacity of the monitoring and evaluation framework to monitor the complex
causal chains between activities, intermediate outcomes, and objectives. In
addition, this design feature may negatively affect other aspects of project design.
• Activities carried out by entities with a clear institutional status can be better
sustained than those implemented by ad-hoc bodies. DILS activities performed
by permanent government institutions and bodies (such as the department of a
ministry and permanent agencies such as the agencies for accreditation or Institute
of Public Health) were better sustained after project completion than those
undertaken by temporary entities such as ad-hoc committees created under the
project. Another example is the Project Policy Board, which was expected to
provide intersectoral coordination but met only sporadically.
• The employment of contractual staff (consultants) in the project
implementation unit does not build sustainable capacity in the ministries.
DILS established an FSU and three Project Administration Teams in each of the
three leading ministries to manage the project. These were to last only for the
duration of the project and were staffed contractors. The alternative is to involve
regular staff in the administration of the project, who be retained in the ministry at

xvi
the end of the project. The latter solution can both improve buy-in in the
ministries and help strengthen the capacity of the participating ministries.
• Projects that aim at strengthening locally delivered services should ensure
alignment between local functions, capacities, and financing to succeed. DILS
showed that although the project could improve LSG capacity in service
provision, it was not able to change the legal framework related to the
competencies and financing of the LSGs. This misalignment explains the
difficulties in implementing financing reform in the health and education sectors.

1
1. Background and Context
The Political and Economic Context
1.1 Following the dissolution of the former Yugoslavia and a series of regional wars, the
Federation of the Republics of Serbia and Montenegro rejoined the World Bank in 2001.1
Montenegro declared independence after a referendum May 21, 2006, and the Serbia
emerged. Serbia experienced solid growth during 2000–2008, followed by a series of severe
recessions. Over 2008–2014 Serbia’s economy had been hit by three recessions combined
with rapidly rising unemployment and growing public debt. To improve its growth prospects,
Serbia embarked in 2014 on several structural reforms and deep fiscal consolidation. As a
result, between 2014 and 2017, the general government budget went from a deficit of
6.6 percent of gross domestic product (GDP) to a surplus of 1.2 percent, driven both by
improved revenue collection and subdued current expenditure. The growth of government
debt has reversed: after peaking at 74.6 percent of GDP in 2015, it fell to 61.5 percent of
GDP in 2017. Growth fundamentals and prospects are now sound, and the underlying growth
trend remain vibrant, as shown in figure 1.1 (European Commission 2018, 42).
Figure 1.1. Evolution of GDP and Timeline of the Projects
Note: GDP = gross domestic product.
The Demographic Context
1.2 Serbia’s population is aging quickly, as the working-age population is projected to
decline over time, directly affecting the sustainability of the pension system. The total
fertility rate for Serbian population is 1.6 children per mother, well below replacement rate
and one of lowest worldwide. Relative to 2005 (the year of Pension Administration Reform
Project [PARP] approval), total population is projected to fall by 10 percent by 2030, but the
working-age population, defined as age 15–64, is expected to shrink even more, by

2
14 percent, and students, defined as age 5–9, are expected to drop by a 24 percent (Figure
1.2).
Figure 1.2. Serbia’s Demographic Projection
a. 2005: total population 9,186,685
b. 2030: TOTAL POPULATION 8,281,052
Source: https://www.populationpyramid.net.
1.3 In all systems, the living standard of pensioners depends on their ability to consume
goods and services produced by workers. This is true both in a pay-as-you-go (PAYGO)
system and in fully funded schemes.2 In the latter, the transmission mechanism is more
indirect but fundamentally the same: unless worker productivity rises, the output (which is
divided between workers and retirees) will be less. Therefore, the pressure to provide decent
pensions to the growing number of old people in Serbia would translate into higher fiscal
pressure. Without more resources, longer lives require later retirement or smaller benefits.
Therefore, to rebalance the declining working-age population, pensioners must reduce their
aggregated demand for goods and services (adjust to a lower income) or expand the outputs
they provide to the economy, or both. Demand can be reduced by increasing contributions—
therefore reducing average worker consumption—or by reducing benefits. On the supply
side, workers and pensioners can maintain consumption levels if output rises sufficiently to
maintain average per capita consumption. Policy actions then involve measures that increase
output per worker or increase the number of workers. Serbian government has undertaken a
series of such measures through parametric adjustments to the pension scheme. Other actions
may focus on importing labor, raising labor force participation rates, or raising skills to
enhance worker productivity, both of new entrants and of the people already in the labor
market.
1.4 The projected demographic changes will also affect health, education, and social
assistance spending. Health needs increase with age, as well as social assistance spending
related to long-term care, such as disability payments. Health spending will also increase as
older individuals deal with more complex noncommunicable diseases. Education spending
could shrink if schools are consolidated to match the falling number of children. However,

3
education spending may face upward pressure from the need to raise productivity and keep
individuals highly skilled.
1.5 Roma children are a growing percentage of Serbian workforce, thus the need to
increase investment in their human capital. The total fertility rate among the Roma
population was 3.1 in 2014 (SORB and UNICEF 2014). Using the best available estimates of
the Roma population (between 400,000 to 500,000), in the next 15–20 years new labor
market entrants of Roma descent may represent 14–29 percent of total new labor market
entrants in Serbia. Even using the official census estimates, which underestimate the Roma
population,3 Roma would still represent at least 5 percent of new labor market entrants. Thus,
future economic growth and sustainability of the pensions system will depend increasingly
on how Roma children will perform in Serbia labor market. Therefore, there is an economic
argument to be made about investing more in Roma education and health services to enhance
their productivity once they enter in the labor market.
1.6 Around the time the Delivery of Improved Local Services Project (DILS) was under
preparation, Serbia joined international efforts to act for Roma inclusion. In 2005, 12
European countries and several international organizations, including the World Bank and
the Serbia, launched the Decade of Roma Inclusion (Deshbersh le Romengo
Anderyaripnasko, in Romani) with the objective of “closing the unacceptable gaps between
Roma and the rest of society.”4 The Roma Decade focused on education, employment,
health, and housing, and committed governments to also consider the issues of poverty,
discrimination, and gender mainstreaming (Brüggemann and Friedman 2017).
The Role of Local Government in the Delivery of Health, Education, and
Social Protection Services
1.7 DILS aimed to improve the local delivery of health, education, and social assistance
services within a framework of increasing pressure for fiscal consolidation, and greater
involvement of local governments in service delivery (Error! Reference source not f
ound.).
1.8 During DILS preparation, the momentum for decentralization of service delivery in
Serbia was accelerating across all sectors. The delivery of health, education, and social
protection services was primarily a state responsibility. Local self-governments (LSGs) were
responsible for financing some operating costs, such as heating and other utilities that
altogether accounted for approximately 15 percent of total costs. LSGs are able, at their
discretion, to provide additional services beyond those required by national legislation, but
only larger LSGs and richer municipalities (the two aspects usually in parallel) had
discretionary resources to provide additional services. Within this context, the framework
Law on Local Self-Government Financing, approved by parliament in July 2006, was
expected to expand the fiscal autonomy of LSGs and their capacity to determine the use of
resources.

4
Health Services
1.9 Decision-making authority for the provision of primary health care (PHC), including
the ability to appoint PHC directors, was transferred from the state to LSGs in January 2007.
However, LSGs were facing important constraints in assuming these new functions: lack of
financial resources; the structural, financial, and organizational weakness of PHC
institutions; the conventional view that the central government should solve most of the
problems; the limited skills and capacity in most LSGs; insufficient preliminary preparations
for LSGs to take on the new responsibilities; and unclear distinctions between tasks and
competencies at the central and LSGs levels (NALED 2016).
1.10 Financing reform was considered to align financing of PHC services to the increased
role of LSGs.5 Funding for PHC services was based on a line-item historic budget provided
by the Health Insurance Fund (HIF), a payroll tax–financed social health insurance
institution. The HIF was expected to begin implementing a new payment method for PHC
institutions based on capitation with a performance-linked component in 2008.6 The new
payment method was expected to reduce the geographical discrepancies in the allocation of
health funds and to provide incentives for PHC physicians to provide high-quality care that
met the needs and demands of users, since those users could change doctors if their demands
were not met. The country had also developed a nationwide framework for PHC medical
information that was expected to improve standards and business processes.
1.11 The 2009 National Strategy on Quality of Healthcare had an objective to introduce an
internal culture conducive to continuous quality improvement, which included setting up an
accreditation system and an integrated information management system for health. To
provide incentives for reaccreditation and the adoption of clinical guidelines and pathways,
the HIF was planning to introduce additional reimbursements in its fee structure.
1.12 The barriers in accessing health services experienced by vulnerable groups, such as
the Roma population, were important concerns. Barriers that Roma face relate to the lack of
personal documents (identification and health records), health insurance, or a permanent
household address. In addition, many Roma did not complete primary education, live in
poverty, are marginalized, and face stigma and discrimination at many levels. The use of
health mediators was found effective in facilitating the access of inhabitants of Roma
settlements to health care services and other public services in the community (Open Society
Institute 2005).
Education Services
1.13 At the time of DILS preparation, the financing of education was expected to change
because of the Law of Self-Governments Financing, approved in July 2006. The main
educational spending category (salaries for teachers and other staff) was set and paid for by
the state. LSGs were responsible for financing the operating costs of primary and secondary
schools. LSGs were entirely responsible for the financing and provision of preschool
services. LSGs were expected to finance staff salaries using transfers from the state to LSGs
using a per-student financing formula, and to expand their control over the local school
networks.

5
1.14 The failure of the education system to equip youth with the skills and knowledge they
need in the modern labor market was (and still is) a priority issue in Serbia. Young people
who have just completed their education have not sufficiently developed key competencies,
which affects their participation in society and the labor market. The implementation of the
Law on Dual Education and the establishment of a single national qualifications framework
are expected to help reduce this trend. Serbia’s performance in the 2003 and 2006 Program
for International Student Assessment (PISA)7 was weak and statistically significantly below
the international average. In 2003, Serbia performed between 32nd and the 34th place8 out of
the 40 countries on the mathematics scale, between the 33rd and 35th place on the problem-
solving scale, and between the 35th and 37th place on the reading scale (OECD 2003). In
2006, Serbia performed between the 39th and the 44th place out of the 57 countries on the
different science scales (OECD 2006). The 2003 PISA survey also asked principals about
their perceptions of the learning environment. Even though the quality of the physical
infrastructure and educational resources cannot guarantee educational success, principals in
Serbia were likely to report that the low quality of the physical educational resources hinders
instruction (OECD 2003, 27).
1.15 Fostering inclusive education was a priority of the Law on the Fundamentals of the
Education System adopted in 2009.9 Among the most important inclusive education
measures was the introduction of local intersectoral committees (ISCs) and new procedures
for the enrollment of students with special needs in primary education; the promotion of
personalized teaching methodologies and formative pedagogical assessment, through the
introduction of Individual Education Plans (IEPs; IEP1—adapted work program; IEP2—
modified work program; and IEP3—enhanced and expanded program for talented children);
renewal of the special education profession and introduction of inclusive education expert
teams in schools; the transformation of the role of special schools; establishment of the
Inclusion Network and dropout prevention programs in primary and secondary schools in
2013; and the prohibition of discrimination, segregation and all forms of separation that are
not in the child’s best interest.
1.16 The discrimination suffered by Roma children in Serbian education system, as well as
their poor access to education and their poor achievements, have been well documented.
According to the Multiple Indicator Cluster Surveys performed in Serbia in 2010, only
8 percent of children in Roma settlements aged 36–59 months attended organized early
childhood education programs, compared with 44 percent in the general population. The
literacy level of the population in Roma settlements is generally lower than the national
sample (about 77 percent of Roma aged 15–24 years in Roma settlements are literate, versus
over 99 percent in the general population) (SORB and UNICEF 2010).10 At the same time,
Roma children were overrepresented in special schools: approximately 30 percent of children
enrolled in special schools in the 2007–2008 academic year were Roma (Open Society Fund
2010); and the share of Roma children enrolled in special schools was estimated at between
50 and 80 percent (World Bank 2004, 11). A major measure in this respect was the
establishment of the position of pedagogical assistants (also known as Roma teaching
assistants) in the Law on the Fundamentals of the Education System,11 but more bylaws were
needed to regulate their functions.
6
Social Assistance Services
1.17 Serbia, at the time of DILS preparation, had a fully developed social protection
system (even though relatively generous mandatory programs like pensions crowd out
resources for targeted social assistance), but administrative consolidation of social assistance
programs was under consideration. The two main cash benefits programs in Serbia were the
Family Allowance (materijalno obezbeđenje porodice) and the Child Allowance. But,
although Family Allowance was delivered by the Centers for Social Work (CSW),
decentralized agencies affiliated with the Ministry of Labour, Employment, Veteran, and
Social Policy (MOLEVSP), the Child Allowance was delivered directly by LSGs. Under the
overall, decentralization framework, LSGs were expected to assume greater responsibility in
the delivery of these programs to enhance their responsiveness to local needs, even if the
state budget was expected to continue financing them.
1.18 In that period, the country was modernizing the policy and legal framework around
persons with disabilities (PWDs) and, consequentially, was planning to reform the way it
finances the delivery of social assistance services to PWDs.12 It was estimated that 500,000
people with various types of disabilities lived in Serbia at the time of project preparation. The
MOLEVSP Disability Fund, with proceeds from Serbia’s state
1.19 lottery, was the main channel to finance social services to PWDs. However, the fund
provided little community-based support and social inclusion activities for PWDs and the rules
regulating the allocation of funds were not considered transparent. The plan was to reform the
operational rules of the fund to begin allocating resources through competitive and transparent
processes, allowing the selection of the most effective interventions, increasing the share of
funds executed by civil society organizations (CSOs)—including private and community-based
service providers—and enhancing services to PWDs.
The Pension System
1.20 When the Consolidated Collection and PARP was being prepared, pension
expenditure had risen from about 11 percent of GDP in 2001 to almost 16 percent in 2004,
generating a yearly deficit of 5.5 percent of GDP and representing a significant burden on
Serbia’s fiscal accounts.
1.21 Various parametric reforms had already been introduced in Serbia to address the
structural imbalances of the pension system stemming from the deteriorating demographic
situation and the volatile labor markets. The Law on Pension and Disability Insurance
(Pensions Law) and the Law on Compulsory Social Insurance Contributions (Contributions
Law) approved in 2003 and 2004, respectively, introduced major changes in the benefits and
contribution rules: retirement age was increased for both genders, lifetime earnings became
the basis for benefit assessment (instead of the last 10 years), the rate of benefit indexation
was reduced, and the system of disability assessment was revised to curtail unjustified benefit
uptake. In addition, a wage indexed minimum benefit was introduced.
1.22 However, the financial position of Serbian pension system was not expected to
improve in the short run without added reforms improving the revenue side and reducing the
7
administrative costs. The parametric reform measures already introduced were going to affect
future retirees. However, pension expenditures are determined by the stock of beneficiaries.
Thus, it was estimated that the short-term pension deficit could not be solved without
intervening on the revenue side. From this side, less than 60 percent of the labor force
complied fully with contributions. The low level of full compliance with contributions was
considered a critical factor that put at risk the sustainability of the pension funds.
1.23 To reduce underreporting and avoidance of pension contributions, the reporting
model needed improvements. The ability to evade contributions was attributable to the
outdated model of reporting, collecting and enforcing social security contributions as well as
the segregation of the public pension system into three schemes, operated by three
administrative organizations using different information and communication technology
(ICT) platforms and operational procedures. The prompt reporting and recordkeeping of
individualized and verified monthly contribution records was viewed as having significant
potential to improve compliance and make enforcement more effective.
1.24 In addition, Serbian pension system consisted of three separate pension funds, which
could be consolidated to reduce the overall administrative costs. The Employees’ Fund was
the largest pension fund. It collected contributions from about 1.5 million workers, paid
benefits to 1.2 million beneficiaries, and ran a deficit of 5 percent of GDP. The Fund for the
Self-Employed had 250,000 contributors and 44,000 beneficiaries. The Farmers’ Fund had
217,000 beneficiaries, but relied heavily on transfers from the general budget, as
contributions covered only 13 percent of its expenditures.
2. Consolidated Collection and Pension Administration
Reform Project
Project Development Objectives
2.1 The project intended to contribute to the government’s efforts to bring overall fiscal
balance under control. The project development objective (PDO), as stated in the
Development Credit Agreement and project appraisal document (PAD), is to “develop the
framework for the consolidation of collection of all social contributions and, if feasible,
personal income taxes, and to improve the effectiveness and efficiency of the Serbia pension
system, through the modernization and streamlining of the institutional capacity in the
pension system, improved pension system administration, developed capacity for policy
identification and analysis, monitoring and increased public understanding of the pension
system.” The PDO remained unchanged throughout the life of the project. The PPAR
assesses two separate PDOs13:
• PDO1: Develop a framework for the consolidation of collection of all social
contributions and, if feasible, personal income taxes; and
• PDO2: Improve the effectiveness and efficiency of the Republic of Serbia pension
system. The sentences following the word “through” are considered intermediate
outcomes that contribute to this PDO:

8
o The modernization and streamlining of the institutional capacity in the pension
system, and improved pension system administration;
o The improved development of capacity for policy identification, analysis, and
monitoring;
o The increased public understanding of the pension system.
Relevance of Objectives
2.2 The relevance of the objectives is rated high.
2.3 The project objectives are highly relevant to the country’s macroeconomic context.
The project addresses a major fiscal policy in Serbia—credible fiscal consolidation linked to
sustainable growth and convergence with the European Union (EU). It is consistent with the
goals of the EU Stabilization and Association Process, and Serbia’s Poverty Reduction
Strategy, notably in creating a smaller, more manageable and more efficient public sector;
and in improving social protection and access to public services. At the time of project
launch, the government was facing severe fiscal imbalances and public pension expenditures
were a significant burden on the government’s fiscal account, with total expenditures rising
from about 11 percent of GDP in 2001 to almost 16 percent of GDP in 2004, and a deficit of
5.5 percent of GDP (World Bank 2005, 2).
2.4 An efficient public pension system was then, and continues to be, a contributing
factor to achieving better overall fiscal balance, and pension reform therefore remains a
government priority. Parametric changes limiting future pension expenditures already had
been introduced prior to the project. Now the focus was on short-term measures with an early
impact on the revenue side. Subsequent interventions were planned that addressed longer-
term policy planning aspects to gradually achieve a more durable balance in the pension
system.
2.5 Project objectives align with government and EU sector objectives of ensuring
adequate and sustainable pensions systems. The two PDOs contribute to the long-term
objective of an adequate and sustainable pension system by ensuring solidarity and fairness
between and within generations, sound public finances and financial sustainability, and
transparency, adapted to the needs and aspirations of women and men (European
Commission 2015, 3; SIPRU 2017, 4).
2.6 The objectives were highly relevant to the World Bank Group’s strategies for Serbia
both at approval and at completion. The World Bank country assistance strategy for the Serbia
for FY05–07 emphasized the importance of fiscal consolidation, linked to sustainable growth
and convergence with the EU; and within this framework, the need to support a more effective
and efficient public pension system as an important contributing factor to achieve a better fiscal
balance (World Bank 2004). The PDO was also highly relevant to the country partnership
strategy (CPS) for FY08–11 that emphasized the need to reduce pension spending that,
representing over 75 percent of total social protection spending, was crowding out other social
assistance spending (World Bank 2007). Finally, the project continued to align with the World
Bank CPS for FY12–15, for which the major theme was the provision of continued support for
Serbia’s EU accession. One of the two pillars in the CPS addressed efficiency and outcomes of

9
social spending, including a continued focus on helping the government constrain imbalances
in the pension system (the other focused on competitiveness in the economy; World Bank
2011).
2.7 The complex links between labor force participation in the formal economy and the
fiscal sustainability of the pension system are identified as a medium priority constraint to
progress toward the twin goals in Serbia Systematic Country Diagnostic (SCD). The SCD
recognizes that the factors that hinder formal employment or cause underreporting of wages,
have implications for the fiscal sustainability of the overall pension system. It therefore notes
the need for further studies to identify fiscally viable ways of reducing the high minimum
social security contributions that currently represent a strong disincentive to accepting formal
work in Serbia, which in turn affects the collection of pension contributions, and thus the
sustainability of the pension system (World Bank Group 2015c).
PROJECT DESIGN
2.8 To achieve the objectives, the project provided $25 million of International
Development Agency financing under four components. Table 2.1 shows the planned and
actual expenditures by component.
Table 2.1. Financing by Component: Consolidated Collection and Pension
Administration Reform Project
Components
Appraisal Estimate Actual
IDA
($, millions)
Percent of
Total IDA
Gov.
($, millions)
IDA
($, millions)
Percent of
Total IDA
Gov.
($,
millions)
Component 1 9.8 39 0.4 11.4 45 0.1
Component 2 10.0 40 0 10.3 41 0
Component 3 1.7 7 0 1.1 4 0
Component 4 0.7 3 0 2.3 9 0
Physical
contingencies 1.9 8 0 0 0 0
Price
contingencies 1.0 4 0 0 0 0
Total 25 100 0.4 25 100 0.1
Sources: World Bank (2005) and World Bank (2013). Note: Gov. = government; IDA = International Development Association.
2.9 Component 1. Consolidation of Collection and Reporting. This component
supports the first project objective. The component had two parts: (i) an in-depth feasibility
study to enable the government to identify the institutional framework for a new collection
and reporting system, and to develop its detailed design and a procurement plan for
subsequent implementation; and (ii) purchase of equipment and development of specialized
software, and training of staff and contributors in complying with the new requirements.

10
2.10 Component 2. Consolidation and Institutional Strengthening of the PAYGO
Pension Funds. This component supports the second PDO. This component financed the
provision of technical assistance, training of staff, and purchase of equipment to support: (i)
the consolidation and integration of processes for the three PAYGO pension funds; and (ii)
the modernization of their business practices.
2.11 Component 3. Pension Policy Analysis and Development. This component
supports the second PDO. This component had two subcomponents to finance the technical
assistance, training of staff, and equipment to (i) strengthen capacity for policy analysis in
MOLEVSP, the Ministry of Finance (MOF) and the consolidated Republic Fund of Pension
and Disability Insurance (PIO), and design and implement a public information campaign for
the new consolidated pension system; and (ii) support voluntary pension system
development, including strengthening capacity in the National Bank of Serbia for exercising
oversight of private pension providers, and the design and implementation of a public
information campaign about the voluntary pension system.
2.12 Component 4. Project Coordination and Management. This component supports
overall project coordination and management. The component financed the operating costs of
the project management unit (PMU) and annual audits of the project. Project coordination
and management was conducted by the MOLEVSP and MOF. Relevant line ministries and
agencies were charged with preparing terms of reference for consultants and training, and
specifications for the procurement of works and goods. The procurement and financial
management functions were delegated to the PMU in the Serbia Agency for Deposit
Insurance, Rehabilitation, Bankruptcy, and Liquidation.
RELEVANCE OF DESIGN
2.13 The relevance of the design is rated substantial.
2.14 The project results chain presented clear and direct linkages between project
activities, outputs, intermediate outcomes, PDOs, and the longer-term outcome for Serbian
pension system. Activities financed under component 1 were likely to generate outputs that
would allow the project to achieve PDO1. Likewise, activities and outputs under component
1, as well as components 2 and 3, would allow the project to achieve PDO2. Both PDOs
contribute to the longer-term outcomes of supporting a sustainable pension system that
provided adequate pensions by promoting solidarity and fairness, and sound public finances
and transparency (figure 2.1_.

11
Figure 2.1. The Project Results Chain
Source: Independent Evaluation Group elaboration based on World Bank 2015.
2.15 The main outputs under PDO1 were the feasibility study defining the overall
framework for consolidating the collection and reporting of all social contribution and the
establishment of a unified Central Registry of Compulsory Social Insurance (CROSO). The
purpose of CROSO is to act as a central repository of all information needed by Serbia’s
three compulsory social insurance institutions—PIO, the HIF, and the National Employment
Service (NES). Insurance qualification time in services (Unified Registration Form) and
earnings (Unified Collection Report) are required by all three social insurance institutions
when determining eligibility and calculating social insurance benefits.14 Since much of the
data needed by the three institutions is the same, a central registry can eliminate the need for
each institution to collect, verify, and maintain its own database, thereby improving
efficiency, and reducing staffing and other costs. In addition, the new framework would aid
compliance monitoring and controls by establishing insurance status and contribution
liabilities (the contributions base). The unified central registry would also enhance
consistency checks between contributions, expenditures (benefits and administrative costs),
and entitlements.
2.16 The unified central registry was to be introduced in two phases, culminating in the
production of monthly individualized reporting on benefits and collections to reduce
transaction costs for users and improve compliance monitoring. The first stage was the design
of the collections functions, consisting of database development, communications system
requirements, reporting forms, and the related trainings. The second stage was to implement
the central registry, putting in place the new administrative and operational procedures for
social contribution collection and reporting. Finally, the central registry was to provide
individual contribution records (accounts) that would have improved taxpayer awareness and
the individual’s oversight of contribution. It also would enable active workers to assess their
Project InputsIntermediate
OutcomesProject Development
Objectives (PDOs)Outputs
Pension system
administration
modernized,
streamlined and
improvedPDO 2: Improve
the effectiveness
and efficiency of
the Republic of
Serbia pension
system
Component 1- Consolidation
of Collection and Reporting
• Financing of studies
• Purchasing of equipment
• Development of
specialized software
• Training of staff
Component 2 - Consolidation
and Institutional
Strengthening of the PAYGO
Pension Funds
• Technical assistance
• Training of staff
• Purchase of equipment
Component 3 - Pension
Policy Analysis and
Development
• Technical assistance
• Training of staff
• Purchase of equipment
Component 4 - Project
Coordination and
Management
• Operating costs of the
Project Management Unit
• Annual audits of the
project
Capacity for policy
identification and
analysis, and
monitoring improved
Public understanding
of the pension system
improved
- Feasibility study
defining the new
“framework” for the
collection and reporting
of all social contribution
produced
- Central registry of
insured individuals and
contributors created
- Administrative
processes of the three
pension funds
integrated
- Information technology
systems improved
- Human resources
planning improved
- Policy analysis capacity
building activities
implemented at
MLESP, MOF and PIF
- Public information
campaign for the
mandatory pension
system designed and
implemented
Project coordination and
management support
provided at MLESP and
MOF
PDO1: Develop a
framework for the
consolidation of
collection of all
social contributions
and, if feasible,
personal income
tax
Long-term
Outcome
Contribute to
adequate and
sustainable
pensions systems,
by ensuring:
- Adequate
retirement
incomes
- Financial
sustainability of
pension
schemes
- Transparent
pension
schemes,
adapted to
populations
needs and
aspirations
- Monthly reports of
social contributions
produced routinely
- Individual pension
accounts
established

12
expected pension rights and, in turn, adjust their labor supply strategies considering their
individual entitlements.
2.17 The improved effectiveness and efficiency of the pension system (PDO2) was to be
achieved, first, by enhancing the pension system administration and modernizing and
streamlining the pension system. This entailed the consolidation of three pension funds with
regard to (i) their administrative, operational, and organizational aspects; (ii) ICT systems;
and (iii) human resources administration, planning, and benefits. The modernization and
streamlining of the three pension funds has strong and direct links with the improved
effectiveness and efficiency of the overall pension system.
2.18 The improved development of capacity for pension system analysis and policy
development was the second intermediate outcome toward PDO2. Capacity was to be
strengthened in the PIO, MOLEVSP, and MOF by the introduction of analytical tools, such
as pension modeling, and skills to analyze and forecast pension policy. The reasonable
assumption in the underlying theory of change is that Serbian policymakers would become
better equipped to identify and implement future pension reforms to enhance the adequacy
and sustainability of the pension system.
2.19 The project’s design recognized the importance of improving the understanding of the
pension system among the general population to achieve a more effective and efficient
pension system. Public outreach capacity was to be improved, including education
campaigns and regular updates on the rights of participants in the public pension system. A
population conscious of the benefits provided by the pension system would take informed
and appropriate decisions regarding their jobs and careers, which would help the
sustainability of the overall system.
2.20 Finally, the project provided technical assistance to build supervisory capacity in the
central bank (National Bank of Serbia) for overseeing voluntary private pension schemes.
Even though this activity lies outside the strict framework of the public pension system and
the standard functions of a central bank, it was reasonable to assume that a better regulated
and transparent market for private pensions would expand the options available to the
population, thus contributing to PDO2.
2.21 Although project design was relevant to the project objectives and based on a clear
results chain, the decision over where to house the unified registry would turn out to be
contentious. The concerned agencies—the Pension Insurance Fund (PIO), the HIF, the NES,
and the tax administration—all had a vested interest in ensuring that contribution payments
could be collected, tracked, attributed to individuals, and cross-checked against returns and
payments made to the other three institutions. At the same time, these agencies had to give up
some of their earlier—actual or notional—control over the contribution recording and
collection of their own revenue. This generated lengthy discussions to find a solution
acceptable to all parties. Disputes would delay the project’s effective start-up by about three
years until it was decided to create CROSO, a new agency, independent from the existing
stakeholders but servicing each of them.

13
2.22 Under the circumstances, the solution of an independent central agency may well
have been the best choice. What may have been unexpected was the time that it took to settle
the issue. The role of the tax administration remained ambiguous. Tax administrations often
play a significant role in collections and compliance and can become significant players in
shaping the success of an institutional and organizational reform of this scale. In Serbia, it
seems that the tax authority may have been insufficiently involved in shaping the central
registry and the unified administration of contributions records. This situation may have been
shaped in part by a realization by the World Bank team that finding the necessary
interinstitutional cooperation necessary to streamline operations with the tax administration
might be difficult, and that the registry could not (and need not) wait for that situation to be
resolved, especially considering that the project already had gotten off to a slow start.
2.23 The project monitoring and evaluation (M&E) framework was deficient in some
respects. There were no indicators to monitor the consolidation of all other social
contributions (such as health insurance) to reflect the broader objective of consolidating the
collection of all social contributions, and potentially of income taxes. If the consolidation
was limited to pension contributions, it might directly contribute to improving the
effectiveness and efficiency of the pension system, thus it could be considered an
intermediate outcome toward PDO2 rather than a separate PDO. In addition, the M&E
framework did not include indicators to monitor the strengthening of the oversight capacity
of the central bank toward the voluntary pension system.
Project Implementation
2.24 The project was approved in May 2005 and was expected to be completed by
September 2010, but instead ended two years later, on September 30, 2012, after two
extensions of 12 months each.
2.25 Project activities were delayed by internal disagreements about the institutional
framework for consolidating the collection of social contributions (component 1) and by
political events. The political instability worsened existing internal disagreements about the
responsibility for the collections function. A transitional, administrative government was in
charge from January 2007 to July 2008. Once a new government was appointed, it set up a
project steering committee, which appointed a new project director with ready access to
decision-makers to speed implementation. In the meantime, however, other components of the
project were able to go ahead, albeit more slowly than necessary and reflecting not only the
registry debate, but more generally a slow in-country decision-making process as the political
events in the country played out.
2.26 The institutional framework for consolidating the collection of all social contributions
was adopted by the Pension Reform Council only at the end of 2007. The formation of a new
more stable government, improved coordination among the beneficiary institutions, and
intense and frequent dialogue of the World Bank team with the beneficiary institutions
helped to push forward the decision of creating CROSO to service all stakeholders. This
decision was crucial for moving component 1 forward, and led to accelerated commitment of
project funds.

14
Safeguards Compliance
2.27 The Consolidated Collection and PARP did not trigger any World Bank safeguard
policy.
Fiduciary Compliance
2.28 Financial management arrangements were satisfactory throughout project
implementation. Acceptable software was used for project accounting and financial
reporting. The quarterly Interim Financial Reports were sent on time to the World Bank and
were always given positive assessments. The project’s annual financial statements were also
always submitted on time and always produced a “clean opinion.”15 No issues were identified
in the use of the bank accounts designated for the project’s proceeds. The World Bank
supervision missions carried out throughout project implementation did not find any
fiduciary issues and confirmed the adequacy of internal controls and project procedures.
2.29 Procurement arrangements are considered moderately satisfactory. The Deposit
Insurance Agency carried out the procurement activities, although the MOF, MOLESP, and
other stakeholders (tax administration, PIO, HIF, and NES) provided technical assistance and
supervised project procurement processes. The Deposit Insurance Agency had limited
knowledge of the World Bank’s procurement procedures, but as the project progressed, it
developed the skills needed to perform the required procurement functions. The project
included a large ICT component that presented significant technical and procurement
challenges. In this regard, the main success stories under the project were related to ICT
components, such as the development and implementation of the ICT strategy for the
modernization and streamlining Serbian pension system and the creation of the central
registry.
2.30 According to the Regional Vice Presidency, the project complied with World Bank
fiduciary policies.
Achievement of Objectives
OBJECTIVE 1
2.31 Objective 1 was to develop a framework for the consolidation of collection of all
social contributions and, if feasible, personal income tax.
2.32 The achievement of objective 1 is rated substantial. Achievement of the objective
was rated modest in the Implementation Completion and Results Report (ICR) Review, as at
that time, neither the contributions recording and collections system nor the central registry
were yet operational. CROSO is now operational, it allows monthly individualized reporting
and it is the central repository of all information needed by the three participating social
insurance institutions, ending the need for each institution to collect, verify, and maintain its
own database.

15
Outputs
2.33 The first output under PDO1 was the feasibility study to define the institutional
framework for the consolidated collection and reporting of all social contributions. The
feasibility study was adopted by the Pension Reform Council only at the end of 2007.
Therefore, the related intermediate outcome indicator was achieved, two and a half years
after the project was approved by the Board (indicator 2.1, table B.1). As already noted, the
delays in completing the feasibility study were not strictly technical, but primarily related to
the weak government and project institutional arrangements that did not manage to mediate
among the conflicting interests of the stakeholders involved in defining the institutional
framework of the consolidated collection and reporting of all social contributions.
2.34 CROSO was established by law in July 201016 and links several bodies, including the
tax administration, PIO, HIF, NES, the statistical office, the Ministry of Interior, Serbian
Business Registration Agency, and the Ministry of Public Administration. Under the new
framework, the registration of insured persons requires filing a single application in
electronic form directly at the CROSO portal, which is valid for all compulsory social
insurance organizations (PIO, NES, HIF). The unified application is filed by the employer or
an authorized officer of a compulsory social insurance organization.
2.35 CROSO became fully operational only after the project ended, but it continues to
operate as envisaged in the project. Three more years were spent to resolve all technical
issues and to complete the data migration. CROSO became fully operational only in August
2013. The PPAR mission confirmed that it operates as envisaged in the law. CROSO consists
of two registers. The first is for all insured persons with entitlement to future benefits under
the social insurance system. It includes all need information between the insured persons and
the entity or person responsible for payment of insurance contributions. Registration and
changes to this information are provided through a Unified Registration Form application. A
second service history register contains information about contributions declared and paid for
each member and the working time associated with those contributions throughout the
worker’s entire career. Information is provided through a Unified Collection Report, an
online monthly tax return operated by the tax administration where the payer declares social
insurance contributions and personal income tax for each insured person independent of
whether the insured person is registered to that payer via a Unified Registration Form.
Intermediate Outcome
2.36 The key intermediate outcome—regular monthly reporting on pension contributions
paid on an individual basis introduced and individual pension accounts established—was
achieved only after project completion. When the project ended (September 2012), CROSO
was set up but not yet fully operational. Today, CROSO produces individualized reports on
collections on a regular monthly basis (indicator 1.3, table B.1).
Project Development Objective
2.37 The consolidation of the collection functions and the establishment of the unified
CROSO achieved the expected reduction in employers’ reporting burden, measured by fewer
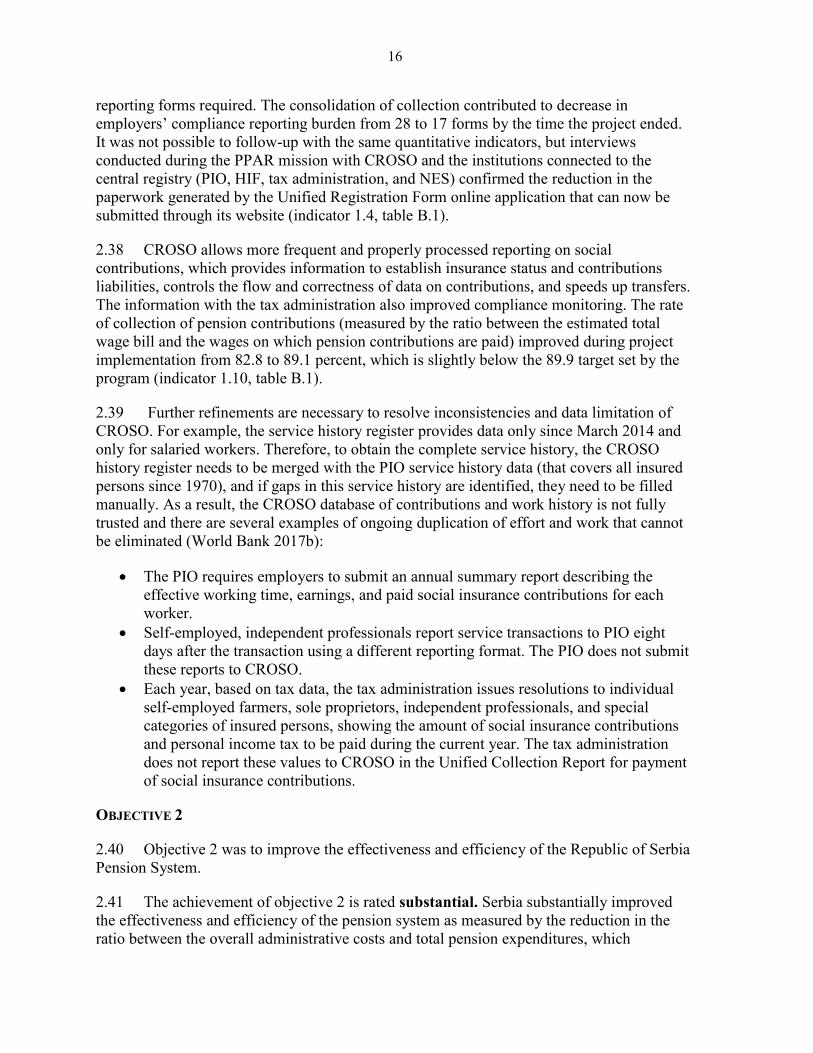
16
reporting forms required. The consolidation of collection contributed to decrease in
employers’ compliance reporting burden from 28 to 17 forms by the time the project ended.
It was not possible to follow-up with the same quantitative indicators, but interviews
conducted during the PPAR mission with CROSO and the institutions connected to the
central registry (PIO, HIF, tax administration, and NES) confirmed the reduction in the
paperwork generated by the Unified Registration Form online application that can now be
submitted through its website (indicator 1.4, table B.1).
2.38 CROSO allows more frequent and properly processed reporting on social
contributions, which provides information to establish insurance status and contributions
liabilities, controls the flow and correctness of data on contributions, and speeds up transfers.
The information with the tax administration also improved compliance monitoring. The rate
of collection of pension contributions (measured by the ratio between the estimated total
wage bill and the wages on which pension contributions are paid) improved during project
implementation from 82.8 to 89.1 percent, which is slightly below the 89.9 target set by the
program (indicator 1.10, table B.1).
2.39 Further refinements are necessary to resolve inconsistencies and data limitation of
CROSO. For example, the service history register provides data only since March 2014 and
only for salaried workers. Therefore, to obtain the complete service history, the CROSO
history register needs to be merged with the PIO service history data (that covers all insured
persons since 1970), and if gaps in this service history are identified, they need to be filled
manually. As a result, the CROSO database of contributions and work history is not fully
trusted and there are several examples of ongoing duplication of effort and work that cannot
be eliminated (World Bank 2017b):
• The PIO requires employers to submit an annual summary report describing the
effective working time, earnings, and paid social insurance contributions for each
worker.
• Self-employed, independent professionals report service transactions to PIO eight
days after the transaction using a different reporting format. The PIO does not submit
these reports to CROSO.
• Each year, based on tax data, the tax administration issues resolutions to individual
self-employed farmers, sole proprietors, independent professionals, and special
categories of insured persons, showing the amount of social insurance contributions
and personal income tax to be paid during the current year. The tax administration
does not report these values to CROSO in the Unified Collection Report for payment
of social insurance contributions.
OBJECTIVE 2
2.40 Objective 2 was to improve the effectiveness and efficiency of the Republic of Serbia
Pension System.
2.41 The achievement of objective 2 is rated substantial. Serbia substantially improved
the effectiveness and efficiency of the pension system as measured by the reduction in the
ratio between the overall administrative costs and total pension expenditures, which

17
contributed to a long-term reduction of total pension expenditure as a percentage of GDP.
The project contributed through the successful introduction of a central registry (see
objective 1) and, although the expected target was exceeded, there is less robust evidence on
the effective modernization and streamlining of pension system administration. However, the
project was less successful in enhancing the capacity for policy identification and analysis.
Intermediate Outcomes
2.42 The project modernized and streamlined the administration of the pension system
through the consolidation of the three pension funds. The consolidation was achieved in two
phases. A first phase was completed in 2008, with the legal and administrative integration of
the three pension funds, followed by financial consolidation in 2010. Actual consolidation of
the funds into one single pension insurance fund was achieved in 2012, at which time a
business strategy was prepared for the following three years, including a new integrated ICT
system. Consolidation is ongoing, and the PIO is now developing its human resource
strategy, as well as making further changes in business processes as CROSO ends the need
for each institution to collect, verify, and maintain its own database. Experience in other
countries shows that the process of rationalizing the social insurance system information and
contribution flows will take time because of the significant number of institutions involved,
because these institutions are managed by multiple ministries, and because of the time
needed to alter budgets and strategic planning to accommodate the institutional changes
needed (Indicators 1.2 and 2.2, table B.1).
2.43 The development of capacity for pension system analysis and policy development fell
short of expectations. The project was to assist the government (the MOLEVSP and the PIO)
in developing a capacity for pension system analysis to support policy development, especially
to understand the longer-term implications of demographic, economic, and policy changes on
the pension system. Key was the development of a quantitative actuarial model and training in
its use (to update assumptions, consider the impact of regulatory changes, and run scenario
analysis). A pension policy unit was set up and given appropriate resources. However, the
authorities opted for developing an in-house modeling instrument, capable of undertaking
short-term financial calculations, but inappropriate for longer-term analysis of either policy
changes or the effects of external shocks (indicator 1.6 and 2.3, table B.1). The reluctance to
explore alternative models may have been influenced by discussions with the World Bank
team, where Serbian authorities have expressed concern over long-term projections done by the
World Bank. Still, it is likely that the discussion with the World Bank will provide useful
inputs into future pension policy considerations in Serbia. Finally, it is worth noting that the
demand for policy analysis was low in the ministry during implementation of the project. This
has changed and Serbia has started to routinely provide the EU information on the adequacy
and sustainability of its pension system as part of its pre-accession commitments.17 The
increased demand for information has enhanced the capacity of MOLEVSP for pension system
analysis and policy development.
2.44 The knowledge of the pension system improved among the general population during
project implementation as a result of the information campaign conducted in the year 2012.
The information campaign also involved web publication of updated monthly data available
to contributors (indicator 1.7 and 2.3, table B.1). A baseline survey conducted in 2008

18
estimated that only 15 percent of the population was informed about the key aspects of the
pension system. The percentage of informed population increased to 56 percent of after the
information campaign, well above the target of 45 percent (indicator 1.9, table B.1).
However, no indicators showed outcomes for increased public awareness or behavior change
as a result of public education campaigns or the provision of updated monthly data on
participants’ rights.
Project Development Objective
2.45 The key project outcome is the improved efficiency and effectiveness of the pension
system measured by the ratio between administrative costs and total pension expenditures.
Over the project implementation period, administrative costs as a percentage of total
expenditures declined by 32 percent from an already modest 2.2 percent in 2005 to
1.5 percent in 2012, which was the target (indicator 1.1, table B.1). Progress continued after
the project was completed and the ratio between PIO administrative expenses and total
pension expenditures has been further reduced to reach 1.1 percent in 2014 and 0.96 percent
in 2015 (World Bank 2017a, 8). The improved efficiency and effectiveness of the pension
system administration has affected the number of annually resolved cases, per case officer,
which increased from 1,560 in 2007 to 1,840 in 2011–2012 (indicator 1.5, table B.1).
2.46 Finally, the overall fiscal sustainability of Serbian pension system has improved. The
long-term sustainability of the system was monitored in the project M&E framework by the
indicator measuring the share of total pension expenditures to GDP. The indicator does not
show any clear trend, also because of the large variation in GDP during the same period
(Figure 2.2). However, total pension expenditures were above the target of 12 percent of
GDP when the project ended in 2012. To cut pension spending, the government undertook
more pension reforms in 2014.18 Those reforms helped decrease pension spending to the
target of 12 percent of GDP by 2016. IMF projections show that pension expenditure is
expected to decrease further to reach 11 percent of GDP by 2022 (indicator 1.8, table B.1).

19
Figure 2.2. Total Pension Expenditures as a Share of GDP (percent)
Source: Eurostat http://appsso.eurostat.ec.europa.eu accessed on April 27, 2018, and IMF 2017, 44. Note: figures after 2017 are projections
Efficiency
2.47 Efficiency in the use of project resources is rated modest.
2.48 The project achieved observable efficiency improvements, some of which are
quantifiable. The project contributed to a reduction of operating expenses as a percentage of
total pension benefits provided from 4 percent to 1.5 percent. The pension contribution
collection rate increased by 10 percent, due to the simplified registration process, improved
collection efforts by the tax administration, and increased public awareness of the importance
of reporting and prompt payment of contributions. Other benefits, more difficult to quantify,
included improved fiscal balance, improved services to beneficiaries, and improved services to
tax and contribution payers.
2.49 However, shortcomings in implementation had a negative effect on the overall
efficiency of the project. The two-year extension of the closing date and the fact that the full
functionality of the CROSO was reached only in 2014 indicate a reduced efficiency. In
addition, the project suffered significant operational and administrative inefficiencies
reflected in the increase in project operating costs from 3 percent of project financing, as
estimated at appraisal, to 9 percent at completion.
12.1
13.512.9 12.5 13.3 12.9
13
1212
11.4 11.211.1 11.1 11
11
0
2
4
6
8
10
12
14
16
2006 2007 2008 2009 2010 2011 2012 2013 2014 2015 2016 2017 2018 2019 2020 2021 2022
Per
cent
of
GD
P %
European Union (25 countries) European Union (15 countries) Republic of Serbia

20
Ratings
PROJECT OUTCOME
2.50 The overall outcome is rated moderately satisfactory. The project’s relevance of
objectives is rated high. Relevance of design is rated substantial. Efficacy of objective 1 is
rated substantial and objective 2 is rated substantial. Efficiency is rated modest.
RISK TO DEVELOPMENT OUTCOME
2.51 Risk to development outcome rating is rated moderate.
2.52 Serbian government has sustained its efforts to complete the framework to
consolidate the collections of all social contributions since project closure. The government
also continued to support CROSO, which became fully operational in August 2013. The
World Bank has also provided additional support and identified opportunities for additional
improvements (World Bank 2017b).
2.53 The government has kept its commitment to build an adequate and sustainable public
pension system. It continues to strive for better fiscal balance and it is converging on the EU
parameter of a sound public pension system. In addition to the support provided by the
project, the government has undertaken other parametric reforms of pensions (such as
changes in contribution and benefit parameters and eligibility conditions) that are already
showing positive results (IMF 2017).
BANK PERFORMANCE
2.54 Bank performance is rated moderately satisfactory.
2.55 Quality at entry is rated moderately satisfactory. The project was strategically
relevant. It aimed at improving the balance between revenues and expenditures through
increased revenue generation in the pension system and, through that, contributing to creating
space for broader fiscal consolidation. Key areas of focus were to reduce the underreporting
of contribution-liable income, rationalize the pension administration, and improve analytical
capacity. To do that, the World Bank drew on prior experience in Serbia where a series of
development policy loans had already begun the process of improving performance and
sustainability in the pension system. The project built on these operations and collaborated
closely with the government team to provide additional assistance through the PARP project.
2.56 However, the basic design features of the unified central registry were still open to
debate when project implementation started, this was a shortcoming of the design. The
experience indicates that rearranging responsibilities across revenue collection and spending
agencies tends to be difficult, and more clarity should have been achieved prior to project
start-up. This shortcoming also reflects insufficient stakeholder analysis during project
preparation. As a result, the project experienced a slow start, was completed after two years
of extension, and the unified central registry become fully operational only after project
completion.

21
2.57 Quality of supervision is rated moderately satisfactory. The World Bank team had
extensive experience on pension reform in transition countries. The team was able to carry
the policy dialogue—the difficulty of which should not be underrated—to satisfactory
closure with most of the institutions in place at project closing or likely to be put into place
within a reasonable period.
2.58 Still, the World Bank was not able to mitigate some of the issues that arose during
implementation. As mentioned in the section on Quality at Entry, the World Bank was not able
to accelerate decision making about the unified central registry. Another shortcoming relates to
capacity building for pension policy identification and analysis. The project delivered the
training for long-term pension modeling to MOLEVSP and PIO staff. However, it would turn
out to be insufficiently integrated into the regular pension policy planning activities of these
institutions. This element had a negative effect on the sustainability of the capacity building
activity.
BORROWER PERFORMANCE
2.59 Borrower performance is rated moderately satisfactory.
2.60 Government performance is rated moderately satisfactory. The project initially had
a weak management structure, which did not effectively manage the discussion between the
agencies involved in deciding the framework for the consolidation of collection of all social
contributions. As a result, the project made little progress during its first year of
implementation. Government oversight of the project was weak during the long political
crisis that followed Kosovo’s unilateral declaration of independence in February 2007.
Project performance improved after a new government was installed in July 2008. A project
steering committee was set up, and a new project director with access to decision-makers was
appointed.
2.61 The government showed commitment to the objectives of the project even after its
completion. The government completed the technical aspects to operationalize the new
framework for the consolidation of collection of all social contributions and the unified
central registry three years after the project was completed. The government is committed to
improving the effectiveness and efficiency of the pension system through reforms to improve
both the revenue and expenditure sides. These reforms have contributed to the overall
improved fiscal outlook of Serbian pension system.
2.62 Implementing agency performance is rated moderately satisfactory. The PMU
showed adequate knowledge and understanding of disbursement policies and procedures
regulating use of the loan. In general, the PMU was assessed as responsive and cooperative
with the World Bank team. This resulted in no delays in financial management-related
disbursements during the project implementation. The credit was 97.98 percent disbursed;
the remaining undisbursed amount of SDR 335,454.08 was canceled on February 13, 2013.
2.63 That said, the implementing agency could have been more proactive to overcome the
project’s bottlenecks. Specifically, the implementing agency could have taken a more active
role in the identification of the institutional framework for a new collection and reporting

22
system. The impasse created a two-year delay in project implementation. Therefore, not all
activities, including CROSO’s operationalization, could be achieved by the time the project
ended.
MONITORING AND EVALUATION
2.64 The M&E framework is rated modest.
2.65 Design. The results framework as presented in the PAD had 10 outcome indicators
and four output indicators. Overall, the indicators were adequate for monitoring progress
toward achieving the two objectives. However, some indicators lacked baseline
measurements, or the baseline value appeared to be incorrectly measured. For example, the
baseline values of the two indicators measuring the long-term pension sustainability and
efficiency (the ratio of administrative costs/pension expenditures and the ratio of pension
expenditures/GDP) were both incorrect and the targets were later revised (World Bank 2005,
25–28 and table B.1).
2.66 A few other indicators were not well defined. For example, the improvement in client
service was to be measured by the number of cases each administrative employee resolved.
Although the indicator was relevant to the project’s objectives, the selected means of
measuring it were not. The number of cases resolved bears little direct relationship to
accessibility and quality of service, although it does relate to the overall PDO of improved
efficiency. Moreover, monitoring requires an exact definition of what constitutes “a case”
and when a case should be considered resolved.
2.67 Implementation. Progress toward achieving the PDO was regularly monitored and
reported in Implementation Status Reports (ISRs). In a few cases, the intention to create
quantitative indicators resulted in target values that were difficult to measure or interpret
meaningfully (such as the progress in administrative consolidation). For instance, progress in
consolidating the three pension funds was measured by percentage of completion (for
example, 30 percent, 50 percent, 70 percent, 100 percent administrative consolidation). Such
target values are not particularly meaningful and might have been better applied as
procedural steps or regulatory milestones.
2.68 Use. The M&E framework was used to monitor project implementation and to
populate the ISRs. The PPAR mission did not find any additional use of the indicators in the
M&E framework.
3. Delivery of Improved Local Services Project
Project Development Objectives
3.1 The objective of the DILS was to “increase the capacity of institutional actors and
beneficiaries to improve access to, and the efficiency, equity and quality of, local delivery of
health, education and social protection services, in a decentralizing environment.” The loan
agreement and the PAD present the same formulation of the objective that remained
unchanged throughout the project.19

23
3.2 The PPAR considers the improvements obtained in the delivery of health, education,
and social protection services as separate PDOs; and within each sector it assesses the
improvement achieved in the capacity of institutional actors and beneficiaries, to improve the
efficiency, quality, and access for vulnerable population groups of locally delivered services.
Regarding equity, since the project aimed at improving access to health, education, and social
assistance services for specific vulnerable population groups (such as the Roma) it is
equivalent to improving equity, therefore the two dimensions (improving access and equity)
are considered jointly in assessing the improved access for vulnerable population groups.20
As a result, the PPAR assesses achievements in the delivery of three types of services
(health, education, and social assistance) according to three specific dimensions (efficiency,
quality, and access for vulnerable population groups):
• PDO1: Increase the capacity of institutional actors and beneficiaries to improve the
efficiency, quality, and access (for vulnerable population groups) of locally delivered
health services, in a decentralized environment.
• PDO2: Increase the capacity of institutional actors and beneficiaries to improve the
efficiency, quality, and access (for vulnerable population groups) of locally delivered
education services, in a decentralized environment.
• PDO3: Increase the capacity of institutional actors and beneficiaries to improve the
efficiency, quality, and access (for vulnerable population groups) of locally delivered
social assistance services, in a decentralized environment.
RELEVANCE OF OBJECTIVES
3.3 The relevance of the objectives is rated high. Project objectives were relevant to the
country situation, national strategies, and international commitments at the time of project
appraisal, as well as to World Bank country strategies for Serbia. The objectives continue to
be relevant currently since project closure and the IEG PPAR mission.
3.4 The pressure for fiscal consolidation that the government was facing at the time of
project appraisal, makes project objectives highly relevant. Health and education spending in
Serbia is comparable, as percentages of GDP, to the other European transition countries at
similar levels of development. However, results in terms of life expectancy, mortality rates,
quality of services, and education attainment, suggested that there were margins for
improving efficiency, quality of services, and access, particularly for the most vulnerable
population groups. Social assistance services, particularly those for PWDs, also had ample
potential for improvements in efficiency, transparency in the allocation of resources, and
overall effectiveness.
3.5 Project objectives were also relevant to the expected expanded role of LSGs in the
delivery of health, education, and social assistance services. Project design was aligned to the
institutional framework set up by the 2006 Law of Local Self-Government Financing that
expanded the responsibilities of LSGs in the delivery of education, health, and social
assistance services sectors, while state ministries moved toward a regulatory and quality
assurance role. Therefore, the project aimed at strengthening the regulatory and oversight
capacities of central government institutions; as well as the capacity of local institutions
directly responsible for the delivery of health, education, and social protection services.
24
3.6 The objectives were well aligned with key national sectoral strategies and their
expected evolution. The objective of improving the quality of health services was aligned to
the 2009 National Strategy for Continuous Quality Improvement and Patient Safety that
aimed to introduce an internal culture conducive to continuous quality improvement. The
project’s support to inclusive education was aligned to the priorities of the Law on the
Fundamentals of the Education System adopted in 2009. Project activities to modernize
social assistance complemented the MOLEVSP’s Social Welfare Development Strategy that
emphasized an expanded LSG role in the provision of social assistance.
3.7 The focus on improving Roma access to key social services contributed to the
commitment made by the government to close the gap between Roma and the rest of society.
Serbia was among the founders and the chair of the Decade of Roma Inclusion in the period
from July 1, 2008, until the end of June 2009. Within the framework of the decade, in 2009,
the Government of Serbia adopted the Strategy for the Improvement of Roma in the Republic
of Serbia 2009–2015, which had the strategic goal to reduce the differences between the
status of the Roma population and the other populations in Serbia.
3.8 Project objectives were relevant to the World Bank country strategy at the time of
appraisal, as well as to later country strategies. When the project was prepared, the objectives
of the DILS were well linked with the World Bank Group country assistance strategy for
Serbia for FY05–07, which emphasized the objective of enhancing efficiency in the public
sector and improving access to public services (World Bank 2004). At approval in 2008, the
project remained highly relevant to the CPS for FY08–11 that renewed World Bank
commitment to support improved health, education, and social assistance services (World
Bank 2007). Finally, the project continued to align with the World Bank CPS for FY12–15,
which continued to stress the need to strengthen sector reforms, to improve the efficiency of
sector spending, and improve the quality of outcomes in health, education, and social
assistance (World Bank 2011).
3.9 The objectives of the DILS—improve access, quality, and efficiency in the delivery
of health, education, and social assistance services—are a priority for progress toward the
twin goals in the Serbia SCD. Specifically, the SCD identified the need to expand access to,
and the quality of, education for all, in particular for marginalized groups, such as Roma
children, as medium priority constraints to achieve reduction in inequity and increase
workforce productivity by improving skills. The improvement of access to health services for
marginalized groups is identified as a priority to reduce disparities and improve the quality of
care and health outcomes. Finally, the SCD assigned a medium priority to the improvement
of the coverage, equity, efficiency, and fiscal sustainability of social assistance programs
(World Bank Group 2015c).
3.10 The project objective, which covered three sectors and several dimensions, was surely
ambitious, but provided continuity and sustainability to World Bank–supported health and
education reforms. In health, DILS provided bridge financing between the First Serbia Health
Project, implemented over 2003–2012, and the Second Serbia Health project that was
approved in February 2014 and that tackled both efficiency and quality of health services.
DILS also sustained World Bank support started under the Education Improvement Project
(executed from 2002 to 2007) and the Inclusive Early Childhood Education and Care,
approved in 2016, that supported education financing and quality improvements reforms.

25
PROJECT DESIGN
3.11 Project activities are organized in five components aimed at improving the capacity of
institutional actors (to state ministries, LSGs, and service providers) to improve the efficiency,
quality, and access for vulnerable population groups of health, education, and social assistance
services. The operation committed $46.4 million of International Bank for Reconstruction and
Development financing to activities organized under five components. Component 1 supported
financing reforms in health and education. Component 2 grouped activities to improve access
to health, education, and social assistance services to vulnerable population groups directed to
state ministries. Component 3 consisted of initiatives to improve quality in the delivery of
health and educational services. Component 4 encompassed capacity building activities
directed to LSG and service providers. Component 5 provided overall support to project
implementation. Table 3.1 shows the planned versus actual expenditures by component.
Table 3.1. Financing by Component: Delivery of Improved Local Services Project
Components
Appraisal Estimate Actual
IBRD
($, millions)
Percent of
Total
IBRD
Gov.
($, millions)
IBRD
($, millions)
Percent of
Total
IBRD
Gov.
($, millions)
Component 1 6.5 14 0 7 15 0
Component 2 11.5 25 0 12.2 26 0
Component 3 7.2 16 0 7.4 16 0
Component 4 16.1 35 0 16.5 36 0
Component 5 2.9 6 0 3.2 7 0
Contingencies 2.1 5 0 0 0 0
Front-end fee 0.1 0 0 0 0 0
Total 46.4 100 0 46.3 100 0
Source: World Bank 2008a, 2015b. Note: Gov. = government; IBRD = International Bank for Reconstruction and Development.
3.12 Component 1. Making Fiscal Decentralization Work. This component financed
goods and technical assistance to develop mechanisms for financing reforms to improve
efficiency in the local delivery of health and educational services:
• Develop new funds-follow-the-user formulas and financing framework so that funds
are allocated to municipalities in a transparent, rational, and predictable way
consistent with their new service delivery responsibilities.
• Provide training and capacity building for sector actors at the state, local, and service
provider levels in applying the new financial framework.
3.13 Component 2. Improving Outreach and Access through Development and
Expansion of Innovations in Service Delivery. This component supported investments in
goods, technical assistance, training (including workshops and study tours), and grants to
LSGs and service providers to identify new approaches and models to improve access to
health, education, and social assistance services to vulnerable population groups:

26
• Grants to local providers (LSGs, PHC centers, schools, CSWs, and nongovernmental
and community organizations) to develop outreach and inclusion services to excluded
groups (such as Roma, internally displaced persons, and refugees).
• Technical assistance to review the operational structure of the Disability Fund.
• Training and technical assistance to LSGs and other local institutions to identify and
implement alternative service delivery arrangements (such as small group homes and
independent/supportive living units) to move people out of social welfare institutions.
• Technical assistance to develop informational material and mechanisms to inform
citizens of their rights and to establish mechanisms to safeguard those rights.
3.14 Component 3. Supporting a New Regulatory, Oversight, and Quality Assurance
Role for state-level ministries. This component financed investments in goods and special
technical services, technical assistance, and grants to enhance the capacity of ministries to
oversee the quality of health and educational service delivery:
• Training for state ministries to shift to a regulatory, oversight, and quality assurance
role.
• Mechanisms to foster and ensure quality, such as the development of structures for
accreditation, licensing, and accountability.
• Regulations and standards for local service delivery, including the specification of the
new roles and responsibilities of municipal staff and service providers in the
decentralized system.
• Accreditation, licensing, and regulatory standards, awarding grants to local service
providers (PHC centers; schools; municipal units responsible for social services and
CSWs) that undertake these activities (some of these grants were expected to finance
minor civil works in PHC centers to improve quality of care).
• Studies and impact evaluation to assess the performance of decentralization in
education, health, and social protection.
3.15 Component 4. Improving Capacity of LSGs and other Local Public Institutions
as Service Providers. This component supported investments in goods (ICT hardware and
software), technical assistance, training, and grants to schools, primary health centers, and
municipal authorities to develop local capacity to manage, plan, and monitor local delivery of
social service:
• Support capacity building tailored to LSGs and other local providers’ needs through
training programs.
• Grants for quality improvements in schools that would mainstream and extend their
use focusing on issues, such as Roma inclusion, and healthy and safe environments
for youth.
• Improve ICT to support policy making, planning, and budgeting of services, as well
as the operation, management, and monitoring of the delivery of social services at
every level of government.
• Support local programs to address environmental health issues per Article 13 of the
Health Care law of Serbia. The focus of the subcomponent was to strengthen

27
information gathering and exchange for issues related to children as an especially
vulnerable group.
3.16 Component 5. Project Implementation Support. The component finances the
Fiduciary Services Unit (FSU), the Project Administration Teams in ministries participating
in the implementation of the project, as well as the project’s front-end fee.
RELEVANCE OF DESIGN
3.17 The relevance of the design is rated modest. The project had a wide scope, as it
covered three sectors. Even if the sector-specific result chains are well supported by logical
arguments and evidence, the overall project design is complex and presents some
weaknesses.
3.18 The design of DILS developed in three, almost independent sectoral projects. The
World Bank team, at the early stage of project preparation, explored an alternative design
that envisaged stronger integration in the delivery of health, education, and social assistance
services at the local level. However, the existing institutional interministerial and
intersectoral coordination mechanisms were not considered adequate for an enhanced
integration in the delivery of services (Figure 3.1). As a result, DILS design evolved into
three separate projects, managed by three Project Administration Teams in the three
ministries participating in the implementation of the project. A FSU was established to
centralize all procurement, financial management, and disbursement functions for the project
and provide implementation supports to the Project Administration Teams.
3.19 A Project Policy Board (PPB) made up of the three lead ministries (health, education,
and social policies), the Ministry of Public Administration and LSGs (MPALSG), the MOF,
and one representative of LSGs was established to foster intersectoral coordination at the
state and LSG levels. The PPB was responsible to monitor project progress, and act as a
forum to coordinate activities (particularly those of a cross-ministerial nature). The PPB was
expected to meet at least twice a year with representatives of the World Bank to review,
agree on, and if necessary, revise planned project activities during project implementation;
regularly resolve disputes; and decide on necessary adjustments.

28
Figure 3.1. The Project Results Chain
Source: Independent Evaluation Group elaboration based on project appraisal document.
3.20 It is possible to identify the specific result chains bringing improvement in the
capacity of institutional actors (to state ministries, LSGs, and service providers) to improve
efficiency, quality, and access for vulnerable population groups of locally delivered health,
education, and social assistance services. Most project activities are related to a specific
dimension within a sector, but few activities contribute to more than one dimension within
the same sector. For example, the improved management information systems (MIS) for
health, education, and social assistance contributes to improving the capacity of institutional
actors to improve both the efficiency and the quality of the services provided. The sector-
specific result chains are presented in the following paragraphs.
3.21 The sector-specific result chains are well supported by logical arguments and
evidence, but the scope of the project diluted efforts in several areas. The large scope of the
project—covering three sectors (health, education, and social assistance) and several
dimensions (efficiency, quality, and access for vulnerable groups) and beneficiaries (central
government, LSGs, and service providers)—weakened the design. This effectively limited
the impact of the project in some areas. For example, project support to improve the delivery
of social assistance focused on enhancing the MIS and the delivery of services to PWDs.
Health Services
3.22 The key intervention of DILS—to enhance the capacity of institutional actors to
improve the efficiency of PHC services—was the implementation of provider payment
reforms to overcome traditional input-based (line-item) financing mechanisms. At the time of
DILS preparation, capitation was the payment method chosen to finance PHC facilities.21
Project InputsProject Development
ObjectivesIntermediate Outcomes
Component 1: Making Fiscal Decentralization Work
• Per-capita formulae and financing framework developed
• Staff trained to apply formulae and financing framework
Component 2: Improving Outreach and Access through Development
and Expansion of Innovations in Service Delivery
• Grants, training and TA to local-level providers for outreach and
inclusion services for disadvantaged groups
• TA to review the Disability Fund
• TA to develop informational material and mechanisms to inform
citizens of their rights and safeguard those rights
Component 3: Supporting a New Regulatory, Oversight and Quality
Assurance Role for State-level Ministries
• TA and training to ministries on regulation, oversight and quality
assurance in local service delivery
• Grants to local-level providers for accreditation, licensing and
accountability
• TA to assess decentralization in education, health and social
assistance
Component 4: Improving Capacity of LSGs and other Local Public
Institutions as Service Providers
• Grants, TA and training to local-level providers for quality
improvements (e.g. Roma inclusion, healthy and safe environment)
• ICT to support policy making, planning, budgeting and delivery of
services
Component 5: Project Implementation Support
• Finance Project Administration Teams
• Fiduciary support
• Front end fee
Health Services:
• Provider payment at PHC level reformed
• Centralized procurement for most
commonly prescribed drugs implemented
• Clinical guidelines and clinical pathways
developed and adopted by healthcare
institutions
• Quality of care at PHC centers enhanced
through project grants for ICT investments,
quality improvement investments and
voluntary accreditation
• Roma health mediators expanded
Education Services:
• Per-capita education formulae developed,
piloted and implemented
• Capacity of schools to participate in quality
assessments enhanced
• Technical specification of the education
MIS adopted
• School attendance of Roma children and of
students with special needs enhanced
• Inter-Sectoral Committees for special
educational needs established
Social Assistance Services:
• MIS system for social assistance institutions
implemented
• Disability Fund reformed (improved grant
operations manual adopted)
• Increase the capacity of
institutional actors and
beneficiaries in order to
improve the efficiency,
quality, and access for
disadvantaged population
groups of locally delivered
health services, in a
decentralized environment.
• Increase the capacity of
institutional actors and
beneficiaries in order to
improve the efficiency,
quality, and access for
disadvantaged population
groups of locally delivered
education services, in a
decentralized environment.
• Increase the capacity of
institutional actors and
beneficiaries in order to
improve the efficiency,
quality, and access for
disadvantaged population
groups of locally delivered
social assistance services, in
a decentralized environment.

29
The HIF was expected to start financing PHC centers in 2008 through block grants, based on
the number of patients registered with each facility and adjusted by risk factors, such as age
and sex. In parallel, a performance-based component was going to be introduced in the
payments to individual PHC medical staff that would be directly linked to the number of
patients registered and the number of services provided.
3.23 Serbia was expected to introduce provider payment reforms for PHC centers, in
tandem with organizational reforms, as many transition countries had already done or tried to
do. Each patient was registered with a PHC doctor, which was the primary point of contact
with the health system. The decision-making capacity of the PHC center directors was to
increase, to allow them to optimize the mix of inputs (including skill mix, equipment, drugs,
and infrastructure) within the available budget, thus enhancing allocative efficiency.22 The
move toward capitation payment with a performance-related component and enhanced
decision-making capacity at facility level followed the general trend of provider payment
reforms for PHC services observed in most transition countries (Langenbrunner, Cashin, and
O’Dougherty 2009).
3.24 Centralized procurement of medicine was to be introduced by DILS to enhance
efficiency in the provision of health services. Serbia had a system where each health facility
procured its own drugs, which generated wide price variation across facilities and
opportunities for corruption( Lewis 2006; UNDOC 2013; UNDP 2015). A World Bank
assessment of the pharmaceutical sector of the Western Balkan countries performed during
the preparation of DILS calculated that potential savings due to generic procurement with
open tenders can reach more than 80 percent for high-volume drugs. (Imasheva and Seiter
2008). The evidence derived from systematic reviews of the literature confirms that
centralized procurement of drugs can achieve direct cost savings (Seidman and Atun 2017).
3.25 DILS strengthened quality assurance mechanisms in health fostering clinical guidelines
and pathways for the most frequent diseases. Clinical guidelines are documents with the aim of
guiding decisions and criteria on diagnosis, management, and treatment in specific areas of
health care. Clinical pathways are tools used to improve quality in health care through the
standardization of care processes based on evidence. A single clinical pathway may refer to
multiple clinical guidelines on several topics in a well-specified context (Matthews 2005). It
has been shown that clinical pathways enhance quality of care, reducing the variability in
clinical practice and improving health outcomes (Rotter, Kinsman, James, and others 2012).
Clinical pathways were to be developed according to the guidelines of the European Pathway
Association.
3.26 The institutional capacity of PHC centers to deliver quality health services was to be
strengthened through project grants for ICT investments, quality improvement investments,
and voluntary accreditation. The logic of the intervention was straightforward. In general, the
mechanism of project grants was chosen to provide to PHC centers the resources and the
incentives to implements the specific activities that would have enhanced their capacity to
deliver quality health services. Specifically, voluntary accreditation grants provided health
care institutions with the resources to go through an external quality improvement process
managed by the Agency for Accreditation of Health Care Institutions of Serbia.23 The quality
improvements investment grants were to be developed jointly by PHC institutions and LSGs

30
to identify and finance investments in infrastructure, equipment, and training to improve
quality of care, including those identified through the accreditation process. In addition, ICT
investment grants were provided to improve the use of information technologies and
connectivity and to finance new hardware, software, and training for local service providers.
3.27 Finally, the project aimed at improving access to health services for the Roma
population through recruiting and financing Roma health mediators. The intervention logic
was straightforward and based on the positive experience already collected in Serbia and
other European countries (Open Society Institute 2005). Health mediators at PHC centers, the
first point of contact with the health system, would facilitate the access of inhabitants of
Roma settlements to health care services and other public services in the community, track
their health status, work to raise awareness of the need for vaccination of children and
emphasize the importance of proper nutrition and hygiene habits.
Education Services
3.28 Financing reforms were expected to enhance the capacity of institutional actors to
improve the efficiency of locally delivered education services. As a direct consequence of the
persistently low fertility rate, the number of pupils enrolled in primary schools declined by
24 percent between 1997 and 2003, and the number of teachers (full time equivalent) had
declined only by half (13.7 percent). The number of children aged 5–9 was expected to shrink
by another 24 percent between 2005 and 2030. The drop in the number of students created the
opportunity for efficiency savings in the education sector, thus contributing to government
fiscal consolidation efforts. In addition, the institutional framework at the time of DILS
appraisal, was expected to enhance the roles of LSGs and schools in the use of education sector
resources. As already experienced in several transition countries, the strategy pursued by the
project was to substitute the historical input-based financing system (that was inflexible and
preserved inefficiency) with per-student financing, where resources were allocated directly to
the school based on the number of students (Coupé and Alonso 2016). In addition,
compensating weights were envisaged in the per-student formula, to correct inequalities across
municipalities. The new financing method would also create an incentive to consolidate the
school network, as an attractive option to generate savings that could, at least partially, be
reinvested in the remaining schools.
3.29 An improved education MIS was envisaged to strengthen the capacity of education
institutions for resource management, planning and results monitoring, and ultimately to
enhance evidence-based decision making. The MIS was expected to link all levels of the
education system: individual schools, regional education administrations, and the federal
Ministry of Education, Science, and Technological Development (MOESTD). By supporting
daily business processes, the information needs of the schools, and producing data on
institutions, the education MIS was envisaged as an effective tool to improve the planning,
management, and accountability of human, physical, and financial resources in the education
sector. DILS was to finance the conceptual design of the education MIS, and the European
Investment Bank was expected to finance its development.
3.30 DILS enhanced the capacity of schools to improve the quality of education services
provided through the support to schools’ participation in international assessments of student

31
performance, such as PISA, Trends in International Mathematics and Science Study, and
Teaching and Learning International Survey. DILS also provided technical assistance to
conduct studies and research on students and school performance at the end of compulsory
education (eighth grade). The logic of the intervention was that, through these activities,
policymakers would get objective measurement of the quality of the national education
system relative to international benchmarking, and improved understanding of the factors
affecting education quality, which would support evidence-based decisions.
3.31 The design of DILS included the provision of school improvement grants to
strengthen their institutional capacity to implement and improve the quality of inclusive
education.24 Inclusive education was a new paradigm being introduced by the Law on the
Fundamentals of the Education System adopted in 2009, but teachers did not have the
necessary skills and schools needed upgraded infrastructure to improve accessibility for
children with disabilities and equipment for children with special needs. School improvement
grants provided the opportunity for schools and their communities to design and implement
school-based improvement projects.
3.32 DILS also provided grants to LSGs to support the design and implementation of local
action plans for Roma education, which included the hiring of pedagogical assistants as a
mechanism to foster Roma inclusion and attainment in the education system. These grants
could also involve intersectoral cooperation with partner institutions (preschool and primary
schools, Roma CSOs, social service providers, and others) in the provision of Roma outreach
programs. Both grant schemes were expected to result in an increased number of children
from vulnerable groups in regular schools.
3.33 DILS also supported the establishment and capacity building of ISCs, responsible for
helping children with special educational needs to access the local education system.25 ISCs
were envisaged to improve cooperation between health, social, and education systems and
local authorities in providing support to children with special educational needs to enter and
stay in the education system. ISC were expected to ensure inclusion of children in
mainstream schools whenever possible, identify and recommend additional support to the
child, monitor realization and implementation of these measures and inform parents about
their child rights.
Social Protection Services
3.34 A unified Social Welfare MIS was to be designed and implemented under DILS to
improve the capacity of institutional actors to improve the efficiency of social assistance
services. The MIS was a first step toward the creation of a single registry for social protection.
It was envisaged as a comprehensive database with the records of all social protection
beneficiaries (approximately 700,000 individuals), with linkages between 256 CSWs and the
MOLEVSP. The MIS would have the following modules: (i) basic records in the CSW; (ii)
case management and record keeping; (iii) social assistance and benefits; (iv) custody cases for
children and adults; (v) adoption cases; (vi) exercise of parental rights; and (g) participation in
court proceedings. The MIS was expected to ensure reliability, quality, transparency, and
availability of data and information exchanged between institutions. MIS use was expected to
improve policy making, ensure a more efficient use of resources, and improve services. For

32
example, it was expected that when operational, the system would reduce the processing time
between the entries of a case to its resolution from 60 to 30 days, as well as provide more
efficient case management and record keeping.
3.35 Additionally, DILS aimed at improving the capacity of the Disability Fund and
service providers to enhance access to, and quality of, local social services provided to
PWDs. At the time of DILS design, LSGs were supposed to take on greater administrative
responsibility for delivering social services to PWDs, and there was interest among
policymakers to expand the role of CSOs and private providers in the provision of social
services. Technical assistance was to be provided to review and reform the structure and
operations of the Disability Fund. Training and added technical assistance was to be provided
to LSGs to identify and implement alternative service delivery arrangements to move
recipients of social welfare (such as elderly needing long-term care) from institutional
settings to small group homes and independent/supportive living units. The envisaged reform
aimed to allocate resources on a project basis, by increasing the share of funds distributed by
competitive review of innovative proposals submitted by CSOs, including private and
community-based service providers. In addition, a smooth transition toward project-based
allocation mechanisms was planned to avoid leaving critical programs for PWDs without
much-needed resources during the transition period.
Project Implementation
SIGNIFICANT CHANGES IN THE PROJECT
3.36 During implementation, the project went through four level 2 restructurings without
producing changes in the PDO, or in the associated outcome indicators and targets.
Therefore, like the ICR and ICR Review, the PPAR uses the standard evaluation
methodology without a split rating.
3.37 The first level 2 restructuring was processed on June 26, 2012, to improve the
project’s M&E framework and to better align project activities with the implementation
arrangements and outcomes. The restructuring included the design and implementation of
communication campaigns among the project’s activities. It added nonconsulting services as
an expenditure category and PWDs to the list of groups named as beneficiaries of grants to
develop outreach services. The project restructuring also simplified the disbursement
schedule and reallocated uncommitted loan proceeds under other categories to facilitate their
use.
3.38 The later three project restructurings extended the closing date for 27 months—from
December 31, 2012, to March 31, 2015. On November 30, 2012, a second level 2
restructuring extended the closing date of the loan by one year to December 31, 2013. On
October 30, 2013, a level 2 restructuring introduced an additional intermediate outcome
indicator to monitor advances on the centralized procurement of pharmaceuticals and
extended the closing date by nine more months, but only for activities implemented by the
Ministry of Health (MOH). The last level 2 restructuring, processed on July 8, 2014,
extended the closing date by six months more to complete the remaining health activities and
use uncommitted loan funds to repair damages that resulted from flooding in May 2014.

33
IMPLEMENTATION EXPERIENCE
3.39 Actions needed to start implementation were completed one year after project
approval—a late start due to frequent changes at the ministerial level. The administrators of
the FSU and the Project Administration Teams in the three ministries were appointed only at
the beginning of 2009. Around the same time, the Designated Account was opened, and all
institutional mechanisms for requesting grant proposals, including a revised grant manual,
were completed. These delays led to project effectiveness on March 10, 2009, exactly one
year after Board approval, and to a slow start of the project’s execution. By June 2010, more
than two years after approval, only 5 percent of loan resources had been disbursed.
3.40 The frequent changes in the political leadership produced frequent shifts in priorities
that could not have been anticipated and that slowed project implementation. Several political
transitions occurred during implementation: there were six governments, involving four
ministers of health, three ministers of education, two ministers of labor and social protection,
along with changes at the level of state secretaries and Assistant Ministers, who were the
officials in charge of coordination of DILS activities in each line ministry. With the change of
the government, policy priorities often changed causing delays or even discontinuation of
certain activities. This was the case with the discontinuation in the decentralization reform that
started in 2009 but which turned toward strong centralization after 2012 and affected the
delivery and quality of local services. The same happened with the social protection unified
information system, which was never rolled out after the development of the technical
proposal, and with the per-student financing formula in education, which was not
mainstreamed after the piloting. These frequent political changes sometimes resulted in radical
changes of top and middle management in line ministries as well as local administration,
resulting in considerable slowing of project implementation.
3.41 Strong ownership and the driving force of certain reform-oriented high officials
proved to be pivotal for the success and sustainability of project results. The state secretary in
the MOESTD was often referred to as a champion of inclusive education and the driving
force of this reform. Likewise, strong ownership by the MOH state Secretary and one
Assistant Minister provided necessary support to strengthen and mainstream the health
mediator program and activities related to the quality of health services (accreditation,
clinical pathways, and others) among other programs. The same applies to the Assistant
Minister who led the reform of the Disability Fund. Conversely, once these individuals, who
were change agents, were no longer at the forefront of the political stage, the institutional
drive for the initiative weakened.
3.42 However, the government provided weak policy coordination. The PPB met only
three times and did not function as planned. Involvement of the MPALSG was limited, with
the consequence that the project was implemented as three separate projects at the national
level with intersectoral cooperation provided on an ad-hoc basis and mostly at the level of the
LSGs and other local agencies.
34
SAFEGUARDS COMPLIANCE
3.43 The project was classified as an environmental category B. The Environmental
Assessment (OP/BP4.01) and Physical Cultural Resources safeguards (OP/BP4.11) were
triggered as some of the grant requests were expected to include minor rehabilitation works
that could pose limited and temporary risks to the environment and physical cultural
resources. A general Environmental Management Framework was prepared as the location of
rehabilitation works was not known at appraisal. The framework required preparation of
environmental management plans for each physical site to address the potential risks
associated with air quality, noise, water quality, solid waste disposal, asbestos, toxic and
hazardous wastes, and medical wastes, in addition to risks to cultural heritage. The
Environmental Management Framework was duly disclosed on the websites of the MOESTD
and the MOH.
3.44 No major issues surfaced with safeguard compliance during project execution. The
World Bank implementation support team routinely included a Safeguard Specialist to
review compliance, and capacity and institutional arrangements, and generally found these
satisfactory. In addition, a qualified safeguards specialist was hired to advise the MOESTD,
the MOH, and the implementing agencies of the rehabilitation works about the
environmental screening process required. By the end of the project, the MOESTD
environmental specialist was no longer available to provide the individual site supervision
reports, thus the preparation of the final environmental compliance report for the educational
rehabilitation work was substantially delayed and submitted by the MOESTD only after all
activities had been concluded in December 2013. However, no issues with safeguard
compliance were found in the MOH or MOESTD rehabilitation work performed under the
project. According to the Regional Vice Presidency, the project complied with the World
Bank safeguards policies.
FIDUCIARY COMPLIANCE
3.45 The FSU, supported by the project administrative teams at MOESTD, MOH, and
MOLEVSP, provided financial management and procurement functions. FSU consolidated
the project procurement plans, managed project accounts, coordinated project audits,
submitted the requests for disbursements, and transferred all required documentation to the
World Bank. The financial management and procurement aspects of the projects were
supervised routinely by World Bank staff. A more detailed assessment of project fiduciary
compliance was carried out at the midterm review of the project.
3.46 Financial management of the project was rated marginally satisfactory, but it improved
to satisfactory when some fiduciary issues that were detected at the MOESTD were resolved.
Quarterly Interim Financial Reports were submitted to the World Bank within due dates and
assessed positively. Transactions reviews and walk-through tests of internal controls were done
and identified no irregularities. Audit reports were received promptly and auditors issued clean
opinions on project financial statements. However, some fiduciary issues stood out toward the
end of 2013, when it became clear that the MOESTD had accumulated large payment arrears.
Most of the pending payments originated from services provided over the last two years under
the previous administration. And the related payments were delayed because of the lost

35
institutional memory due to staff turnover and the general lack of trust that followed the change
in the administration.
3.47 Procurement was usually rated satisfactory, but was sometimes rated only moderately
satisfactory due to problems with the procurement of ICT systems at both the MOLEVSP
and at the MOH. The MOLEVSP initially envisaged a single large ICT procurement process.
However, when it was decided to restructure the procurement process into two contracts,
communication problems between the FSU and the project administrative team at the
MOLEVSP created significant delays. At the MOH, the procurement process for ICT goods
and services was delayed as the lowest bid was presented by a consortium that included a
state company, which was not in compliance with World Bank procurement rules. According
to the Regional Vice Presidency, the project complied with World Bank fiduciary policies.
Achievement of Objectives
OBJECTIVE 1
3.48 Objective 1 was to increase the capacity of institutional actors and beneficiaries to
improve the efficiency, quality, and access (for vulnerable population groups) of locally
delivered health services, in a decentralized environment.
3.49 The overall achievement of objective 1 is rated substantial. The project enhanced the
capacity of the MOH and HIF to improve efficiency through provider payment reforms in
PHC and through centralized procurement of medicines. DILS strengthened the capacity of
PHC institutions to deliver quality health services through the development and adoption of
clinical guidelines and clinical pathways and voluntary accreditation. Project grants provided
improvements in ICT investments. The capacity of LSGs was strengthened by setting up
local health councils—ISCs comprising LSGs, PHC centers, CSOs, and academic
institutions. Finally, the project was successful in enhancing the capacity of the health system
to improve accessibility to health services by Roma populations through the training and
recruitment of health mediators.
Improved Capacity to Enhance Efficiency of Health Services: Substantial
3.50 The project completed the key output of reforming the payment method used at the
PHC level. In addition to the provision of technical assistance to develop the technical aspect
of the payment formula, the project provided extensive training to 500 LSG and PHC staff on
the new payment method. Training was provided to the HIF to prepare for added provider
payment reforms for inpatient services, such as activity reporting based on diagnosis-related
groups.26
3.51 The key outcome indicator—PHC financing allocated according to capitation and
output-based formula—was achieved. The Law on Salaries of Public Servants and
corresponding bylaws adopted in October 2012 provide the legal framework to introduce
capitation payment and performance-related payments (indicator 2.1, table B.2). An output-
based (performance-based) component in PHC payment mechanisms was successfully
introduced, but initially limited to only 2 percent of payments (indicator 1.1, table B.2). This

36
was considered too low to bring changes in behavior (WHO 2010) and it was later increased
to 8 percent by 2015. More refinement of the formula is currently being considered by the
HIF with technical support provided under the World Bank–financed Second Serbia Health
project. However, the transformation of PHC financing into block grants based on capitation
has not been introduced yet, primarily due to reservations on the part of the MOF rather than
for technical capacity. Therefore, PHC managers have little flexibility or incentive to
rationalize staffing and service provision or improve quality (World Bank 2015c, 79).
3.52 DILS also improved the capacity of the HIF to enhance efficiency in the provision of
health services through centralized procurement of pharmaceuticals. With the technical
assistance provided under the program, the HIF set up a centralized procurement mechanism
based on framework agreements for the 50 most frequently dispensed medicines included in
the HIF dispensary (indicator 2.14, table B.2). The centralized procurement system has been
highly effective in reducing both variation and the average price paid by the government to
procure drugs. It contributed to drug price reductions of 27 percent (on average), and to
reducing HIF pharmaceutical expenditure by €25 million per year. The World Bank is
providing additional support to further improve efficiency in the purchasing of
pharmaceuticals and medical products through the Second Serbia Health project.
Improved Capacity to Enhance Quality of Health Services: Substantial
3.53 The project strengthened the capacity of state agencies responsible for quality in the
health sector. Specifically, technical assistance supported the Commission for the
Development and Implementation of Good Clinical Practice Guidelines to develop 31
clinical guidelines that were disseminated to health care professionals through more than 42
workshops. By the end of the project around 50 percent of PHC centers had adopted clinical
guidelines (indicator, 2.7 in table B.2). Technical assistance was also provided to the
Commission for Improvement of Quality and Patient Safety to develop indicators of health
service quality. It also supported the work of various expert commissions aimed at improving
quality in health, such as the Agency for Accreditation of Health Care Institutions. The
Second Health Project is further sustaining the capacity of state agencies responsible for
health care quality in Serbia to develop additional clinical guidelines and clinical pathways.
3.54 During project implementation, 81 PHC institutions were certified to deliver health
services according to high-quality standards for patient care and clinical quality. Therefore,
by the time the project closed, around 51 percent of PHC centers had completed the
accreditation process (indicator, 2.6, table B.2). Since the project closed, 54 more health
institutions had pursued the accreditation process, but some did not renew their accreditation.
Overall, the percentage of PHC institutions with a valid three-year certificate of accreditation
has declined slightly from 40 percent (recorded at project completion) to 35 percent, but still
above the target of 25 percent set at appraisal (indicator 1.6, table B.2).
3.55 The project provided PHC centers with an improved MIS. Grants for informatization
were provided to 158 PHC centers and 4 other health institutions. By the end of the project
nearly 96 percent of Serbia’s PHC centers had a fully operational health MIS. Therefore, the
intermediate outcome indicator measuring the percentage of PHC centers with fully
operational health MIS was achieved, as it surpassed the target of 85 percent (indicator 2.11,

37
table B.2). Further support to strengthen the health sector MIS is provided under the Second
Health Project, which is planning to develop performance dashboards including quality
benchmarks and balanced scorecards to enable managers to monitor performance and
provide feedback to facilities.
3.56 Finally, the project also strengthened the capacity of LSGs to improve quality in
health. At the local level, the project provided training and technical assistance to help set up
local health councils, comprising LSGs, PHC centers, CSOs, and academic institutions. Over
the course of the project 122 local health councils were established and trained out of 145
local government units.
Improved Capacity to Enhance Access to Health Services for Vulnerable Population:
Substantial
3.57 The project delivered extensive training to health staff to improve their capacity to
recognize the needs of vulnerable groups. Extensive training was provided to health
professionals and associated workers in the 42 PHC centers participating in the project, and
to staff from additional centers that had expressed interest. The training covered: (i)
introduction to geriatrics; (ii) prevention of violence against the elderly; (iii) improving
communication with the Roma population and sensitization of health professionals; (iv)
implementation of the Special Healthcare Protocol to protect children from abuse and
neglect; (v) youth-friendly health system; and (vi) partnership for health. In total about 2,000
health professionals were trained, reaching the target established at appraisal, thus achieving
the related intermediate outcome indicator (number of medical staff and associates trained to
recognize needs of vulnerable groups; indicator 2.5, table B.2). However, no additional
training for PHC staff to recognize the needs of the vulnerable groups was delivered after the
project closed.
3.58 Fifteen health mediators were recruited or trained under the program to work in PHC
centers to support Roma populations accessing the health system. Thanks to DILS, the total
number of these mediators increased to 75 in 2012, covering 47 percent of LSGs. The role of
health mediators has been maintained since the end of the program and the number has
expanded to 85 in 2018. The mediators facilitate the access of inhabitants of Roma
settlements to health care services and other public services in the community, track their
health status, work to raise awareness of the need for vaccination of children, and emphasize
the importance of proper nutrition and hygiene habits. They provide health care institutions
with a better understanding and insight into the situation of Roma settlements (WHO 2015).
3.59 The enhanced capacity to recognize the needs of vulnerable groups improved access
to health services for the Roma population. A total of 30,018 Roma children received
vaccinations through the health mediators supported by the project, exceeding the related
outcome indicator (the target was 18,795 Roma children vaccinated through the mediators;
indicator 1.5, table B.2). The health mediators continued with their outreach programs and by
2018 35,107 Roma children were immunized. Health mediators provided additional services
to Roma populations, including processing 2,340 personal documents and health cards. They
also facilitated medical examinations for 650 pregnant women and new mothers; 1,496
screening exams for women; 1,144 mammograms; and 58,961 health visits.

38
3.60 Interviews with Roma health mediators conducted through a focus group discussion
during the PPAR mission identified opportunities for improving their role. The figure of the
Roma health mediator was established by the MOH in 2008, and all mediators are now
funded from the state budget, but they are hired under short-term renewable contracts. Thus,
most mediators interviewed complained about the uncertainty deriving from the temporary
contractual arrangements, but also about the low salary and the impossibility of receiving
reimbursement for travel and communication expenses. The National Association of Health
Mediators was established in 2016 to improve their status and quality of their work.
OBJECTIVE 2
3.61 Objective 2 was to increase the capacity of institutional actors and beneficiaries to
improve the efficiency, quality, and access (for vulnerable population groups) of locally
delivered education services, in a decentralized environment.
3.62 The achievement of objective 2 is rated substantial. The improvement in the capacity
of MOESTD to improve efficiency through financing reforms was modest as the per-student
financing formulas were developed and piloted but not implemented. DILS improved the
capacity of schools to deliver quality, inclusive education and of state agencies to monitor
quality of education. Finally, the project was very successful in enhancing the capacity of
schools and LSGs to improve access to education to students with special needs and Roma
children through grants for inclusive education.
Improved Capacity to Enhance Efficiency of Educational Services: Modest
3.63 With the technical assistance provided under the project the per-student financing
formula was developed, which contained compensating weights to correct inequalities across
municipalities. The reform was guided by the wide range of related international best
practices. In late 2009, the Law on the Foundations of the Education system was enacted,
creating the basis for per-student financing for primary and secondary education. Central and
local formulas were developed with the support of international technical assistance provided
under the program (Indicators 2.2 and 2.3, table B.2). Extensive training and workshops to
staff at central and local levels were provided under the program. In the 2011/12 school year,
the per-student formula was piloted in 16 LSGs across the country (10 percent of all
municipalities). During the pilot, the allocation of funds continued on a traditional input
basis, but each municipality received a shadow budget calculated as if the capitation formulas
were in place. Full rollout of the per-pupil financing reform was expected to start the school
year 2014/15, as stipulated by the law.
3.64 However, the per-student financing formulas were never implemented and the
allocation of education funds continued on a traditional input basis. Therefore, even if the
project achieved the related intermediate outcome indicators (improved allocation framework
for equalization funds developed; central and local formulas developed), the related outcome
indicator (central and local per capita funding formulas in the education sector piloted) was
partially achieved. As the central and local per capita funding formulas in the education sector
were piloted using a theoretical shadow budget, but no real piloting of the formulas took place
(indicator 1.2, table B.2).

39
Improved Capacity to Enhance Quality of Educational Services: Substantial
3.65 The project supported the participation of Serbian schools in international student
assessments such as Trends in International Mathematics and Science Study 2011, PISA
2012, and Teaching and Learning International Survey 2013. All schools have undergone an
external evaluation of their performance, thus surpassing the target of 50 percent of schools
(indicator 2.8, table B.2). A total of 23,387 individuals have undergone development training
organized by the project (the target was 23,000 participants; indicator 2.9, table B.2). The
program also provided crucial capacity building for the final exam at the end of primary
education cycle (eighth grade) that was introduced in the school year 2010/11 to assess the
achievements at the end of compulsory education; obtain the certificate of completed
compulsory education; and select students for (upper) secondary education.
3.66 Project funds were used to develop the conceptual design of the improved education
MIS, which was going to be funded by the European Investment Bank. Specifically, the
technical assistance provided under the project (i) performed the system analysis; (ii) made
the system design; and (iii) produced technical specifications for both software and hardware
(the technical specifications for procurement of the improved education MIS). A draft
Rulebook on Integrative Education Information System was also produced. Using the
conceptual design developed during the project, the improved education MIS, called Dositej,
was set up in 2016. It has data on institutions (schools and universities), details of all the
employees of these institutions, information on the curriculum for primary and secondary
schools, information on study programs for faculties, information on the structure of classes
for primary and secondary schools and information on teachers who teach each class, as well
as other vital information for making educational policy. However, more improvements are
needed in the education MIS to link information on access (enrollment and completion rates),
quality (repetition, dropout, learning outcomes), and finances at school level, which would
allow tracking of performance and accountability for teachers and schools (World Bank
2015, p 59).
Improved Capacity to Enhance Access to Educational Services for Vulnerable Population
Groups: Substantial
3.67 The project achieved the targets set in delivering grants to schools and LSGs to
strengthen their capacity to improve access to education services for Roma and children with
special needs. A total of 560 schools received grants for developing and testing inclusive
education programs, violence prevention, and transformation of schools for education of
students with developmental impediments, including very important support to strengthening
inclusive education teams in schools under the activity Strengthening Schools for Inclusive
Education. Fifty-six municipalities received grants for intersectoral activities developed in
cooperation with more than 300 partner institutions aimed at developing local action plans to
improve educational services for Roma children, including support through Roma teaching
assistants (indicator 2.4, table B.2).
3.68 The outcome indicator measuring progress toward inclusion in education shows that
schools receiving project grants made good progress in inclusion, though slightly below the
target. The proportion of children from vulnerable groups (based on Organisation for

40
Economic Co-operation and Development [OECD] classification27) in the schools that received
DILS grants increased from 3.2 percent in the 2008/09 academic year to 6.6 percent in 2012/13
academic year (indicator 1.3, table B.2). Even if the target of 7.5 percent was not attained, this
demonstrates the positive impact of the grants, also considering that the control group achieved
a much more modest improvement from 3.6 percent to 4.11 percent. MOESTD has stopped
using the OECD classification after the end of the project. However, the percentage of children
with IEP1 and IEP2 in primary schools, which provide an alternative indicator of inclusion in
education, has increased from 1.2 percent in 2013/1428 to 2.4 percent 29 in 2016. Thus, even if
the two series of data are not comparable, there are indications that progress in inclusive
education is continuing.
3.69 At the same time, there has been a slow decline in the number of students with
development disabilities enrolled in special schools, which was the expected outcome of
DILS activities aimed at fostering inclusive education. The 2016 the United Nations
Children’s Fund (UNICEF) research on the special schools indicates a decline in the number
of students in special schools and special classes of regular schools from 5,758 in 2009/10 to
3,133 in 2016/17.30 This slow decline is a positive change as it leaves sufficient time and
leeway for all actors to adjust to the changes. The only problem is the dynamics of
fluctuation between the two systems: according to the same UNICEF research a much larger
number of children is passing from mainstream to special schools than the other way around
(10:1). Another positive indicator is the considerable decrease in the percentage of children
in special schools and special classes that are inappropriately classified as Roma students:
from 30 percent of children enrolled in the academic year 2007/08 (Open Society Fund 2010)
to 18 percent in academic year 2013/14 (Pavlović Babić 2017).
3.70 Technical assistance provided by the project contributed to additional achievements
in inclusive education. It helped to update relevant regulatory frameworks, such as the
Rulebook on the Assessment of Additional Educational, Health, and Social Support for
Children and Pupils; the Rulebook on Detailed Instructions for Adoption, Monitoring, and
Revision of IEP; and the Rulebook on the Protocol for Responding to Violence, Abuse, and
Neglect. DILS also supported the Inclusion Network of 14 model schools and 80 experts. A
2013 amendment to the law took a step toward the institutionalization of the network by
introducing the position of external adviser to schools. The project supported the
establishment of 150 ISC and trained 608 ISC members tasked to ensure full enrollment of
all children in the education system. The project achieved the related intermediate outcome
indicator (number of ISCs trained; indicator 2.10, table B.2).
3.71 Pedagogical assistants were significantly strengthened by the project grants. The
assistants were first introduced to support Roma children and later all children with special
educational needs. The Social Inclusion and Poverty Reduction Unit showed that pedagogical
assistants are a significant form of support for children, students, their families, teachers, and
institutions in general, to increase the accessibility of education, prevent dropping out, boost
equal quality education for all children, improve school success and attainment for children,
as well as indicate the harmfulness of discrimination and segregation (SIPRU 2015). Today,
there are 175 pedagogical assistants (in 75 LSGs throughout Serbia) engaged by primary
schools and preschools. There is one assistant per school.

41
3.72 Interviews with pedagogical assistants conducted through a focus group discussion
during the PPAR mission identified opportunities for improving their role. Their contractual
status is still precarious: they are engaged on a temporary basis for the duration of the school
year on school request and pending MOESTD approval. This instability affects motivation
and causes high turnover. Remuneration for the assistants is inadequate as it is set at the
official minimum wage. Another problem is that the profile of the pedagogical assistants is
heterogeneous and, accordingly, their roles in inclusive education vary. There are no
standards for their work, so there is no systemic support for their professional development.
The National Association of Pedagogical Assistants (established in 2014) is struggling to
improve their status and quality of their work.
3.73 To conclude, DILS had a considerable positive impact on the quality of inclusive
education during and shortly after project implementation, particularly when the state
secretary in the MOESTD championed the effort. However, the positive outcome has
declined as the policy focus on inclusive education lost momentum after 2012 (Radó,
Setényi, Petrovic, and others 2016). The extensive training provided under DILS was not
sustained after the project end. Inclusive education is currently hindered by the reduction in
the number of school associates that support students with special needs. The number of
MOESTD staff dedicated to the initiative also has decreased. Interviews with education
experts conducted during the PPAR mission suggest that good inclusive education practices
continued in those schools that had the overall institutional and professional absorption
capacity to apply the know-how gained under DILS, but also the capacity and resources to
maintain the practice on their own.
OBJECTIVE 3
3.74 Objective 3 was to increase the capacity of institutional actors and beneficiaries to
improve the efficiency, quality, and access (for vulnerable population groups) of locally
delivered social assistance services, in a decentralized environment
3.75 The achievement of objective 3 is rated modest. The project successfully enhanced
the capacity of the Disability Fund and service providers to enhance social assistance
services to PWDs. However, the project did not manage to improve the capacity of the
MOLEVSP to improve the efficiency in the delivery of social assistance services through
enhanced MIS.
3.76 The project successfully enhanced the capacity to deliver improved social assistance
services to PWDs. A major achievement of the project was the restructuring of the Disability
Fund. The fund switched to project-based allocation of resources, using competitive and
transparent selection mechanisms based on the quality and relevance of the proposals
submitted. Overall, the new modalities improved the transparency, efficiency, and
effectiveness of social assistance services provided to PWDs. Based on an iterative process, a
new Grant Operations Manual was developed to include clearly defined modalities, criteria,
and procedures for project financing and to monitor fund usage.31 As a result, all Disability
Fund financing to PWDs is now allocated through an equitable, transparent, and evidence-
based process, thus achieving the related outcome indicator (indicator 1.3, table B.2). During
project implementation, the Disability Fund awarded 92 subproject grants to CSOs. All grant
42
projects were implemented by the PWD organization and CSOs. Most were carried out
independently, but eight projects were implemented in partnership with local stakeholders
(LSGs, CSWs, other public institutions at the local level), or other related civic associations.
3.77 However, the project was not successful in improving the capacity of the MOLEVSP
in the delivery of social assistance services. The project provided the technical assistance
necessary to develop the software and hardware specifications. It financed the procurement
of equipment, software and hardware, and the training of 600 CSW staff, achieving the
related intermediate outcome indicator (indicator 2.13, table B.2). The MIS was fully
developed and tested, thus the related intermediate outcome indicator was achieved (indicator
2.12, table B.2). However, later revisions of the Social Assistance Law required adjustments
in the MIS that were not implemented. As a result, the MIS was never fully operational and
did not generate the expected improvement in the capacity of the MOLEVSP to enhance
efficiency in the delivery of social assistance services.
Efficiency
3.78 Efficiency in the use of project resources is rated modest.
3.79 The project selected potentially cost-effective interventions. Experience from other
countries and the evidence available in the literature have shown that the activities chosen
can improve the use, quality, and efficiency of locally delivered health, education, and social
protection services. Some of them are quantifiable, for example, the centralized procurement
of drugs supported by the project, contributed to reducing drug prices, on average, by
27 percent, and to reduce HIF pharmaceutical expenditure by €25 million per year. The
operational rules of the Disability Fund have improved the effectiveness of social services to
PWDs.
3.80 However, shortcomings in the implementation had a negative impact on the overall
efficiency of the project. Some activities were implemented only partially, thus the potential
benefits did not materialize. Other activities were implemented with delays that reduced the
benefits generated. Implementation delays resulted in 25 months of extensions that further
diluted the improvements expected from the interventions.
3.81 In education, financing reforms are still a priority. The need to even out the inequalities
in spending between schools by replacing input-based budgeting with per-student financing
remains. Therefore, the substantial investment made under the project was not good value for
the money.
3.82 The expected efficiency and effectiveness improvements in the provision of social
assistance services to be achieved through the improved MIS did not materialize. The MIS that
should have centralized data management, reduced transaction and processing times, and
improved linkages between the beneficiaries of cash benefits and the providers of social
services was not fully operational. Thus, also in this case the DILS investments was not good
value for the money.

43
Ratings
PROJECT OUTCOME
3.83 The overall outcome is rated moderately satisfactory. The project’s relevance of
objectives is rated high. Relevance of design is rated modest. Objectives 1 and 2 are rated
substantial. However, the achievement of objective 3 is rated modest. Efficiency is also
rated modest.
RISK TO DEVELOPMENT OUTCOME
3.84 Risk to development outcome is rated moderate. For most project outcomes, the risk
they will not be sustained is negligible to low. However, selected project outcomes, notably
those related to improvements in access to services for vulnerable groups are subject to some
risks, which are described in the next paragraphs.
3.85 The Government of Serbia, with support from the World Bank, has sustained the
work that DILS initiated on health financing reforms, centralized procurement of medicine,
and quality improvement. The World Bank–supported Second Health Program is now
continuing to provide technical assistance to support refinements of the performance-based
capitation payments introduced under DILS. In addition, the project is also supporting the
introduction of provider payment reforms for hospital-based services through the phased
implementation of a Diagnosis-Related Group, as well as continuing support for the use of
clinical pathways and accreditation of health facilities.
3.86 However, the legal status of health mediators is still not regulated by relevant
legislation, even if their number has increased over time. Recently, a discussion took place
about whether the mediators should work under the MOLEVSP (rather than under the
MOH), which could further weaken their status. This constitutes a risk for the improvement
in access to health services for the Roma population achieved under the project.
3.87 DILS outcomes related to the improved access to education services for children with
special needs and Roma are considered at low risk, even if government attention to inclusive
education has somehow diminished. UNICEF, the EU, and the World Bank continue to
support inclusive education in Serbia. The latter has approved in 2016 a project supporting
Early Childhood Development, which is supporting inclusive education at the preschool level
through: strengthening Roma CSOs as crucial partners at local level; regulating and
strengthening the position of pedagogical assistants; and continuing grant support schemes to
municipalities for developing outreach to vulnerable families and strengthening inclusive
education.
3.88 Activities managed by entities with a clear institutional status were better sustained
than those implemented by ad-hoc bodies. The ISC, formally responsible for defining and
recommending additional support needed for children with special educational needs, based
on the framework of the 2009 Law on Fundamentals of the Education System, proved to be
more sustainable. On the other hand, activities carried out by instruments created during
project implementation faced significant sustainability challenges after the projects was

44
completed. A strategy to improve the sustainability prospects was to try to institutionalize the
instruments created under DILS. An example is the 2013 amendment of the Law on
Fundamentals of the Education System that introduced the Inclusion Network as an external
adviser to schools.
3.89 The PPAR mission recorded ongoing pressure to revert to previous rules governing
the Disability Fund. The guidelines adopted by the fund to provide grants to CSOs to help
PWDs are still formally followed. However, there is a risk that they might be abandoned to
allow more discretionary use of the money by service providers. Finally, even if the planned
MIS for social assistance was designed but not implemented under DILS, the PPAR mission
documented that the government is still considering introducing an MIS to manage social
assistance benefits, now called the Social Card, as part of the new e-government strategy.
BANK PERFORMANCE
3.90 Bank performance is rated moderately satisfactory.
3.91 Quality at entry is rated moderately satisfactory. The World Bank supported the
borrower in the preparation of the project with a large team that included experienced
specialists from the three Global Practices involved—health, nutrition, and population;
education; and social protection and labor—that brought international experience relevant to
Serbia. The PPAR mission found evidence that the World Bank team provided all the needed
assistance to prepare the project.
3.92 However, the design of the project was overly complex and despite the significant
resources provided by the World Bank, it took about 20 months to move from concept review
to approval. In addition, shortcomings were identified in the M&E framework (see the
Monitoring and Evaluation section). For example, the World Bank conducted a baseline survey
when the government considered shifting from line-item budgets to capitation to establish a
baseline on health sector performance against which the impact of the reforms could be
assessed in a follow-up survey (World Bank 2009). However, the project design did not
include a follow-up survey to assess the impact of the health financing reform on health
services use, quality, cost, and efficiency.
3.93 Supervision is rated moderately satisfactory. The World Bank played an important
convening role during project implementation, trying to bridge barriers between state
ministries and across levels of government. Interviews conducted with government
representatives during the PPAR mission confirmed that knowledge and technical assistance
support provided by the World Bank team was valuable and timely. The presence of World
Bank sector specialists in the country assisted the communication flow with the national
counterparts. The PPAR mission was also reminded of the hands-on support and guidance
provided by the World Bank team on procurement and financial management procedures.
3.94 However, The World Bank team could have been more proactive in identifying and
rectifying the critical risks and bottlenecks that affected project implementation. Various
government actors expressed the opinion that some of the delays could have been avoided if
the World Bank had exercised more pressure on the government for faster decision making.
45
BORROWER PERFORMANCE
3.95 Borrower performance is rated moderately satisfactory.
3.96 Government performance is rated moderately satisfactory. Government
performance is mixed. On the one hand, the government provided weak overall policy
coordination. The high-level PPB, consisting of all government stakeholders (MOESTD,
MOH, MOLESP, MOF, and MPALSG) was not fully functional and met only three times
during the project and the involvement of MPALSG was limited. The PPAR mission
confirmed the ICR findings of insufficient coordination among ministries, among
departments within a ministry, between different tiers of government, and between
government and civil sector representatives.
3.97 On the other hand, middle-level management (assistant minister level), showed
commitment to the reforms. As already indicated, the project had strong ownership and
support from certain reform-oriented high officials that championed specific themes and
activities. These individuals were change agents, who represented the institutional drive for
the reforms supported by the project.
3.98 Implementing agency performance is rated moderately satisfactory. The division of
labor between the implementing agencies—FSU and Project Administration Teams embedded
in the three implementing ministries—worked well. FSU oversaw the financial management
and procurement aspects of the project. The three Project Administration Teams in the MOH,
MOESDT, and MOLEVSP were responsible for supervising the implementation of specific
project activities. The Project Administration Teams were perceived as ministry staff, which
supported ownership and buy-in of the project activities. However, the Project Administration
Teams were contracted as external consultants under the projects and were paid more than the
regular ministry staff. The differences in pay created tension between the consultants and
regular civil servants.
3.99 Additionally, the work of the implementing agencies was negatively affected by
several political changes that occurred during project implementation, as changes at the
minister level led to changes at the Project Administration Teams in the three relevant
ministries, as well as in the staff of the FSU. These changes often resulted in delays because
of the time needed by the new teams to become familiar with the activities of the project in
their respective sectors, and often involved revisions of the operating manual and
procurement plans for the project.
MONITORING AND EVALUATION
3.100 The M&E framework is rated modest.
3.101 M&E design. The M&E framework was comprehensive but had some significant
weaknesses. The data sources were primarily the administrative MIS of the individual
ministries, LSGs, and service providers. Further, DILS project funds had been set aside for
surveys of PHC center and social protection facility users, in the first and final years of the
project, as part of the support for establishing performance monitoring and impact evaluation.
Additionally, the project envisaged financial support for the line ministries to design and

46
implement impact evaluations of, first, the phased implementation of decentralization
(particularly the rollout of new financing formulas and the assumption of key responsibilities
for management of schools and PHCs) and, second, innovations in service delivery to
vulnerable groups, particularly to PWDs. For example, the World Bank conducted a baseline
survey when the government considered shifting from line-item budgets to capitation to
establish a baseline on health sector performance against which the impact of the reforms
could have been assessed in a follow-up survey (World Bank 2009).
3.102 Various shortcomings affected the design of the project M&E framework: lack of
baseline and target values; several indicators reflected intermediate outcomes (outputs) rather
than PDO outcomes; some indicators referred to more than one sector, but it was not clear
which sector was responsible for reporting; some indicators were not fully aligned with the
PDO; and inconsistencies in the specific wording of the indicators among the various
documents (PAD and supplemental letter to the loan agreement; World Bank 2015b, 9). The
M&E framework should have been revised to reflect the actual implementation in each sector
and clearly identify indicators to measure efficiency, quality, access, and equity in respective
sectors both at PDO and intermediate outcome level. Another important learning from the
PPAR interviews was that the project seems to have applied the principle of defining
outcomes based on “what could be measured at that time” instead of using theory of change
logic and then identifying potential proxy indicators that might have given better insight on
policy impact.
3.103 M&E implementation. Monitoring of DILS activities at state and local levels was
planned to use the administrative MIS of the line participating ministries, LSGs, and service
providers, which were expected to be improved during the project. Two evaluations were
carried out, of the Trainings and Grant Programs for Inclusive Education and of the PHC
grants. However, other planned evaluations were not conducted, such as the follow-up survey
to assess the impact of the health financing reform on PHC services use, quality, cost, and
efficiency.
3.104 The M&E framework was revised during project implementation. The first revision
of the project indicators was done after the midterm review in 2011. The project restructuring
in June 2012 revised the M&E to clarify processes and responsibilities for data collection and
reporting. It was clarified which ministry was in charge for each indicator. Baseline and
target values for the indicators in the M&E framework were also defined. Finally, at the
project restructuring of October 30, 2013, an intermediate outcome indicator was added to
monitor progress toward efficiency improvements through the setting up of a centralized
procurement system for pharmaceuticals. The available national M&E system was not
reliable, so the project invested a lot of resources in monitoring, collecting data, and analysis.
For example, MOLESP used the project funds to hire consultants and CSOs to monitor the
selection processes, provide advisory services, and evaluate program and financial
implementation of the projects funded from the Disability Fund.
3.105 The World Bank and Project Implementation Unit teams reported during the PPAR
mission that the collection of data was cumbersome and difficult. With the lack of
dependable MIS in the education and social sectors, the data obtained from the ministries,
government agencies, and national statistical office were not always directly comparable as
47
different methodologies were used. That is why the project opted to monitor a limited
number of PDO indicators and intermediate outcome indicators. The necessary data was
collected from the project beneficiaries. Even at the PPAR phase, time and considerable
effort from various actors were required to collect relevant and comparable data. Some data
could not be compared with the originally collected data because of the different
methodology (for example, the coverage of children from vulnerable groups in primary
education was based on an OECD classification that was no longer in use).
M&E use. Other than informing project performance, the use of M&E data was limited. The
PPB did not perform the expected supervisory function; thus, it was left to the individual
ministries to use the M&E to improve their activities. At the time of DILS, evidence-based
policymaking was just being introduced in Serbia and was not a common or sound practice
and reportedly varied from ministry to ministry. On the positive side, national policy impact
assessments performed outside DILS (particularly in education and health) were used to steer
reforms. Finally, results of the DILS monitoring were used not only to inform the designs of
later World Bank projects in the education and health sector but for the designs of projects
supported by other donors.
4. Lessons
4.1 Eight lessons that could help improve future World Bank operations are identified
and presented below. The first lesson arises from both projects and is followed by three
lessons from PARP and four lessons from the DILS.
4.2 Clarity around the overall vision and data architecture is needed for successful MIS
investments. Several steps are needed to build an MIS: analysis of the business processes,
design of the data architecture, procurement of hardware and software, installation and
testing, and training users. The likelihood of success in this process is improved if business
processes and the underlying data architecture are well defined. This occurred in the
development of CROSO. Even if the first step (the definition of the overall framework) took
a long time, it permitted finalizing of the MIS after project completion. In contrast, the vision
of the social assistance MIS was not well defined, which contributed to the failure of the MIS
investment.
PARP
4.3 A stakeholder analysis can be a useful to identify potential supporters and resistance
when reforms involve several actors. The reform of the social contribution collection and
reporting system involved several parties. A stakeholder analysis of the participating
institutions would have yielded crucial insights to identify potential reasons for support and
resistance, the areas where cooperation was natural, and where more attention was needed
from high-level officials able to resolve institutional problems.
4.4 The tax administration can be usefully included in the administrative reform process.
Many countries have to consider the role of the tax administration in collections and
compliance—should it be a lead agency, a participant, or a nonparticipant? Whatever the
option chosen, it is important to involve the tax office early on, not only because of their

48
mandated role as a tax collection agency but also because they tend to have the strongest
human and technical capacity, and legal instruments of enforcement at their disposal, and
they often have the strongest political support. In Serbia, CROSO was chosen for the
collections function, but with some difficulty because insufficient attention was paid to
coordinating with the tax authority.
4.5 Rationalizing the social insurance system takes time. In Serbian administrative reform,
the country chose to rationalize the social insurance system information and contribution flows.
Experience from other countries shows that this process may be slow, sometimes taking one to
two years. Therefore, ample time should be reserved to do the work needed to alter budgets and
to conduct strategic planning to accommodate institutional changes. The potentially most
complex and time-consuming task will be to ensure all past service data are accurate and
complete, and to modernize and automate the key benefit calculation and payment business
processes.
DILS
4.6 Multisector projects have the advantage of providing bridge financing that allows
continuity and deepening of reforms policy, but this design feature may negatively affect
other project ratings. DILS was effective in providing bridge financing that allowed the
World Bank to sustain sector support and policy dialogue in three sectors. However, the wide
scope of the project weakened the capacity of the M&E framework to monitor the complex
causal chains between activities, intermediate outcomes, and objectives. In addition, this
design feature may negatively affect other aspects of project design.
4.7 Activities carried out by entities with a clear institutional status can be better
sustained than those implemented by ad-hoc bodies. DILS activities performed by permanent
government institutions and bodies (such as the department of a ministry and permanent
agencies such as the agencies for accreditation or Institute of Public Health) were better
sustained after project completion than those undertaken by temporary entities such as ad-hoc
committees created under the project. Another example is the PPB, which was expected to
provide intersectoral coordination but met only sporadically.
4.8 The employment of contractual staff (consultants) in the project implementation unit
does not build sustainable capacity in the ministries. DILS established a FSU and three
Project Administration Teams in each of the three leading ministries to manage the project.
These units were to last only for the duration of the project and were staffed with contractors.
The alternative is to involve regular staff in the administration of the project, who would
remain in the ministry at the end of the project. The latter solution can both improve buy-in
in the ministries and help strengthen the capacity of the participating ministries.
4.9 Projects that aim at strengthening locally delivered services should ensure alignment
between local functions, capacities, and financing to succeed. DILS showed that although the
project could improve LSG capacity in service provision, it was not able to change the legal
framework related to the competencies and financing of the LSGs. This misalignment
explains the difficulties in implementing financing reform in the health and education
sectors.

49
1 The two constituent republics functioned separately throughout the period of the federation, operating under
separate economic policies, as well as using separate currencies.
2 In a PAYGO pension plan, the contributions paid by workers are shared between the retirees. This contrasts with
fully funded pension plans where the individual contributions are saved in a fund and blocked until retirement.
3 Roma in Serbia amount to 147,604 (2.1 percent of the population) according to the 2011 census.
4 Founding international partner organizations of the initiative consisted of the World Bank, the Open Society
Institute, the United Nations Development Programme, the Council of Europe (CoE), CoE’s Development Bank, the
Organization for Security and Co-operation in Europe, the United Nations Human Settlements Programme, the
Office of the United Nations High Commissioner for Refugees, the United Nations Children’s Fund, and the World
Health Organization (WHO).
5 Additional health financing and organizational reforms promoted in Serbia during DILS preparation, but not
related to PHC and LSGs included the introduction of prospective payment system based on Diagnosis-Related
Groups to finance the provision of hospital-based care; the provision of lower-cost (community-based) long-term
care; and a more extensive use of outpatient surgeries.
6 The implementation of capitation payments in PHC was also supported by the European Union with a €5 million
project implemented over 2007–10.
7 PISA is a reliable metric of student ability to perform successfully in economies where knowledge and skills are
needed.
8 Since PISA results are based on samples, it is not possible to report the exact rank order position, but the range of
rank order positions within which the country mean lies with 95 percent likelihood.
9 Official Gazette of the Republic of Serbia, 12/72/2009/09.
10 Only Roma living in Roma settlements are covered by Serbia Multiple Indicator Cluster Surveys.
11 Pedagogical assistants contribute to the learning and social participation of Roma pupils and establish cooperation
between school staff and Roma parents (Starcevic, Dimitrijevic, and Milovanovic 2016).
12 Within a few years Serbia had adopted The Law on Prohibition of Discrimination of Persons with Disability
(April 2006), the 2006–2015 Strategy for Promoting Position of Persons with Disabilities (2017), and had ratified
the United Nations Convention on the Rights of Persons with Disabilities (in July 2009).
13 The ICR and ICR Review arranged the PDOs in the same manner.
14 Specifically, the PIO needs information about the work history of the insured person to determine eligibility and
calculate a pension. The NES uses the data on the status of insured persons (beginning and termination of insurance)
for keeping records of the unemployed persons, as well as data on the total work engagement (years of service) of
the insured person, data on the reason for termination of insurance and data on paid contributions, to determine
eligibility and termination of the right to unemployment benefits. The HIF needs more current data, primarily
confirmation of insurability and payment of insurance, to determine health rights.
15 Reflecting the unqualified opinion of the auditors that project financial statements were accurate, complete, and
produced in accordance with Generally Accepted Accounting Principles.
16 The Law on the Central Registry of Compulsory Social Insurance was published in the Official Gazette No. 30/10
of May 7, 2010, and entered into force on the eighth day after the date of publication, on May 15, 2010.
17 Eurostat requires member states and accession countries to report on indicators defined by the European Commission
in the field of pension: 11 primary indicators, 11 secondary indicators, and 5 context indicators grouped under the
objectives of adequate, sustainable, and modernized pensions (SIPRU 2017, 5).
18 First, it raised the retirement age for women to 65, equalizing it with that of men (with a gradual transition
between 2015 and 2032); introduced actuarial reductions of 0.34 percent of the benefit per month of early retirement
for both men and women; and tightened extended service requirements. Second, it precluded any increases in
pensions before the system reaches a pension expenditure level of 11 percent of GDP. Third, pension benefits were

50
temporarily reduced—by 22 percent for pensions above RSD 25,000 per month and by 3 percent for those above
RSD 40,000.
19 The ICR review considered four distinct PDOs: improve access to, efficiency, equity, and quality of local
delivered health, education, and social protection services, in a decentralized environment.
20 It is worth noting that all indicators measuring access to health, education, and social protection services measure
improvement refer to vulnerable population groups, such as Roma, students with special needs, and people with
disabilities (Indicators 1.3, 1.4, 1.5, 2.4, 2.5, and 2.10 in table B.2).
21 The new payment method chosen for hospital-based services was based on Diagnosis-Related Groups.
22 In the efficiency measurement literature, the allocative efficiency of a production unit is defined as the ratio of
cost efficiency to technical efficiency (Fried, Lovell, and Schmidt 2008).
23 The agency was created in 2008 as an independent government agency with responsibility for quality
improvement and patient safety in health care institutions of Serbia, under the oversight of the Ministry of Health.
The 2005 Health Care Law provides the legal framework for the agency. Its role was further defined by the bylaw
on Accreditation of Health Care Institutions and by the National Strategy for Continuous Quality Improvement and
Patient Safety (both approved in 2009).
24 School improvement grants were adopted in the World Bank–financed Education Improvement Project that was
executed in Serbia from 2002 to 2007. They were assessed positively in empowering local communities to take
responsibility for their schools (World Bank 2008).
25 Previously, children with disabilities were entering the education system through the so-called categorization
committees, which had been tasked with making a diagnosis and recommending a special educational program to
“correct” the defect. The Rulebook on Additional Educational, Medical and Social Support to Children and Pupils,
adopted on the basis of the 2009 Law on Fundamentals of the Education System, regulated the requirements for
assessing the needs for additional educational, medical, or social support to children and pupils, and the composition
and operation of the intersectoral committee responsible for the assessments.
26 DILS support to capitation was complemented by the European Union that provided €5 million to finance the
project Implementation of Capitation Payment in Primary Health Care in Serbia, that was implemented over 2007–
2010 (Venekamp, Makarova, and McGreevy 2010).
27 The OECD classification is as follows: Category A – children with disabilities; B – children with learning
difficulties; C – children from socioeconomically vulnerable groups.
28 Source: Statistical Office of the Republic of Serbia (SORB).
29 Source: Dositej database.
30 The last figure was provided by the MOESTD during the PPAR mission.
31 The Grant Operations Manual was piloted through two projects: sign interpreting service and companion services
for persons with disabilities. The sign interpreting service received worldwide recognition as one of the best projects
for persons with disabilities.

51
References
Baucal, A., and D. Pavlović Babić. 2009. Quality and Fairness of Education in Serbia: Educational
Opportunities of the Poor. Belgrade: Government of the Republic of Serbia and the Institute for
Psychology.
Bjegovic-Mikanovic, V. 2016. “Governance and management of health care institutions in Serbia: An overview
of recent developments.” South Eastern European Journal of Public Health 5. DOI
10.4119/UNIBI/SEEJPH-2016-94.
Brüggemann, C., and E. Friedman. 2017. “The Decade of Roma Inclusion: Origins, Actors, and Legacies.”
European Education 49 (1): 1–9.
Coupé, T., A. Olefir, and J. D. Alonso. 2016. “Class Size, School Size and the Size of the School Network.”
Education Economics 24 (3): 329–351.
European Commission. 2015. Portfolio of EU Social Indicators for the Monitoring of Progress Towards the EU
Objectives for Social Protection and Social Inclusion. Brussels: European Commission.
———. 2018. Serbia 2018 Report. Commission Staff Working Document. Brussels: European Commission.
Fried, H. O., C. K. Lovell, and S. S. Schmidt, eds. 2008. The Measurement of Productive Efficiency and
Productivity Growth. Oxford, U.K.: Oxford University Press.
IMF (International Monetary Fund). 2017. Republic of Serbia, Country Report No. 17/263. Washington, DC:
IMF.
ILO (International Labor Organization). 2009. Pension Reform in Serbia from international and regional
perspectives. Proceedings of the Conference on Pension Reform in Serbia (24–25 September 2009,
Belgrade). Budapest: ILO Subregional Office for Central and Eastern Europe.
Imasheva, A., and Seiter, A. 2008. The Pharmaceutical Sector of the Western Balkan Countries. HNP
Discussion Paper 42827. Washington, DC: World Bank.
Langenbrunner, J., C. Cashin, and S. O’Dougherty, eds. 2009. Designing and Implementing Health Care
Provider Payment Systems: How-To Manuals. Washington, DC: World Bank.
Lazarević, E., and E. Kopas-Vukašinović. 2013. “The Role and Place of Parents of Children with Disabilities in
Inclusive Education in Serbia.” International Journal about Parents in Education, 7(2).
Lewis, M., 2006. “Governance and Corruption in Public Health Care Systems.” Working Paper 78. The Center
for Global Development, Washington, DC.
Macura-Milovanović, S., Pantić, N., and Closs, A. 2012. “The rationale for a wider concept of inclusive
education for teacher education: A case study of Serbia.” Prospects, 42(1): 19–39.
Matthews, D. 2005. “What is a Clinical Pathway?” The Journal of the American College of Dentists 72 (4): 32–
36.
MOESTD (Ministry of Education, Science, and Technological Development). 2012. Strategy for the
Development of Education in Serbia until 2020. Belgrade, Serbia: MOESTD.
NALED (Nacionalna Alijansa za Lokalni Ekonomski). 2016. Istraživanje o zdravstvenoj zaštiti na lokalnom
nivou]. Belgrade, Serbia: NALED. https://www.slideshare.net/NALED/istraivanje-o-zdravstvenoj-
zatiti-na-lokalnom-nivou
OECD (Organisation for Economic Co-operation and Development). 2003. First Results from PISA 2003.
Executive Summary. Paris: OECD.
———. 2006. PISA 2006. Science Competencies for Tomorrow’s World. Volume 1: Analysis. Paris: OECD.
Open Society Institute. 2005. Mediating Romani Health. Budapest, Hungary: Open Society Institute.
52
Open Society Fund. 2010. Roma Children in Special Education in Serbia: overrepresentation,
underachievement, and impact on life. Research on schools and classes for children with
developmental difficulties. Belgrade: Open Society Fund.
Pavlović Babić, D., and A. Baucal. 2013. PISA 2012 First Results: Inspire Me, Support Me. Belgrade, Serbia:
Institute for Psychology.
Pavlović Babić, D. 2017. Special Needs Education in Serbia—The Role and Possibility of IE. Belgrade, Serbia:
Institute for Psychology. Available at
https://www.ht.ut.ee/sites/default/files/se_in_serbia_tartu_19052017.pdf
Radó, P., J. Setényi, D. Petrovic, D. Stankovic, and G. Markovits. 2016. Formative Evaluation of
Implementation of Inclusive Practices in the Education System in Serbia 2009–2014. Belgrade, Serbia:
UNICEF Serbia.
Rajovic, V., and O. Jovanovic. 2013. “The Barriers to Inclusive Education: Mapping 10 Years of Serbian
Teachers’ Attitudes Toward Inclusive Education.” Journal of Special Education and Rehabilitation 14
(3–4): 78–97.
Rotter, T., L. Kinsman, E. James, A. Machotta, J. Willis, P. Snow, and J. Kugler. 2012. “The Effects of Clinical
Pathways on Professional Practice, Patient Outcomes, Length of Stay, and Hospital Costs: Cochrane
Systematic Review and Meta-Analysis.” Evaluation and the Health Professions 35 (1): 3–27.
Seidman, G., and R. Atun. 2017. “Do Changes to Supply Chains and Procurement Processes Yield Cost Savings
and Improve Availability Of Pharmaceuticals, Vaccines or Health Products? A Systematic Review of
Evidence from Low-Income and Middle-Income Countries.” BMJ Global Health 2 (2): e000243.
Serbia, Government of. 2016. Employment and Social Reform Programme in the Process of Accession to the
European Union. Belgrade, Serbia: SIPRU.
SIPRU (Social Inclusion and Poverty Reduction Unit). 2015. Analysis of the Legal Framework and Current
Status and Practice of Pedagogical Assistants. Belgrade: SIPRU.
——. 2017. Monitoring Social Inclusion in the Republic of Serbia: Indicators in the Field of Pensions.
Belgrade, Serbia: SIPRU.
SIPRU (Social Inclusion and Poverty Reduction Unit) and UNICEF (United Nations Children’s Fund). 2014.
Monitoring Framework for Inclusive Education in Serbia. Belgrade, Serbia: SIPRU and UNICEF.
SORB (Statistical Office of the Republic of Serbia) and UNICEF (United Nations Children’s Fund). 2010.
Serbia Multiple Indicator Cluster Survey and Serbia Roma Settlements Multiple Indicator Cluster
Survey, 2010, Final Reports. Belgrade, Serbia: SORB and UNICEF.
———. 2014. Serbia Multiple Indicator Cluster Survey and Serbia Roma Settlements Multiple Indicator
Cluster Survey, 2014, Final Reports. Belgrade, Serbia: SORB and UNICEF.
Starcevic, J., B. Dimitrijevic, and Milovanovic, S.M. 2016. “Rethinking the Role of Pedagogical Assistants:
Establishing Cooperation between Roma Families and Schools in Serbia.” Center for Educational
Policy Studies Journal. Vol. 6(4): 73.
UNODC (United Nations Office on Drugs and Crime). 2013. Business, Corruption and Crime in Serbia: The
Impact of Bribery and Other Crime on Private Enterprise. Vienna: UNODC.
UNDP (United Nations Development Program). 2015. Public Perception of Corruption in Serbia. New York:
UNDP.
Venekamp, D., Makarova, T., and McGreevy, M. 2010. Assessment of International Assistance in Serbian
Health Sector. Final Report. ECORYS Rotterdam: Research and Consulting.
WHO (World Health Organization). 2010. Evaluation of the Organization and Provision of Primary Care in
Serbia. Copenhagen, Denmark: WHO Regional Office for Europe.

53
WHO. 2015. Review and Reorientation of Serbian National Programme for Early Detection of Cervical Cancer
towards Greater Health Equity. Roma Health, Case Study Series 3. Copenhagen, Denmark: WHO
Regional Office for Europe.
World Bank. 2004. Serbia and Montenegro—Country Partnership Strategy, FY05–07. Washington, DC: World
Bank.
———. 2005. “Serbia and Montenegro—Consolidated Collection and Pension Administration Reform
Project.” Project Appraisal Document Report 31655-YU, World Bank, Washington, DC.
———. 2007. Serbia—Country Partnership Strategy, FY08–11. Washington, DC: World Bank.
———. 2008a. “Serbia and Montenegro—Delivery of Improved Local Services Project.” Project Appraisal
Document Report 38921-YF, World Bank, Washington, DC.
———. 2008b. “Yugoslavia, Serbia and Montenegro—Education Improvement Project.” Implementation
Completion and Results Report ICR0000174, World Bank, Washington, DC.
———. 2009. “Serbia—Baseline Survey on Cost and Efficiency in Primary Health Care Centers before
Provider Payment Reforms.” Report 45111-YF. Washington, DC: World Bank.
———. 2011. Serbia—Country Partnership Strategy, FY12–15. Washington, DC: World Bank.
———. 2013. “Serbia and Montenegro—Consolidated Collection and Pension Administration Reform
Project.” Implementation Completion and Results Report ICR2499, World Bank, Washington, DC.
———. 2015a. Serbia—Country Partnership Framework, FY16–20. Washington, DC: World Bank.
———. 2015b. “Serbia—Delivery of Improved Local Services Project.” Implementation Completion and
Results Report ICR2778, World Bank, Washington, DC.
———. 2015c. Serbia—Public Finance Review: Toward a Sustainable and Efficiency Fiscal Policy.
Washington, DC: World Bank.
———. 2015d. Serbia—Systematic Country Diagnostic. Washington, DC: World Bank.
———. 2016. Implementing a Unique Business Identifier in Government: Guidance Note for Practitioners and
Nine Country Case Studies. Washington, DC: World Bank.
———. 2017a. Serbia—Analysis of the Staffing and Expenditures of the Pension Fund of Serbia (PIO).
Restructuring and Right Sizing Project. Vertical Review of Ministry of Labor. Washington, DC: World
Bank.
———. 2017b. Serbia—Review of the Operations of the Central Registry for Mandatory Social Insurance
(CROSO). Restructuring and Right Sizing Project. Vertical Review of Ministry of Labor. Washington,
DC: World Bank.

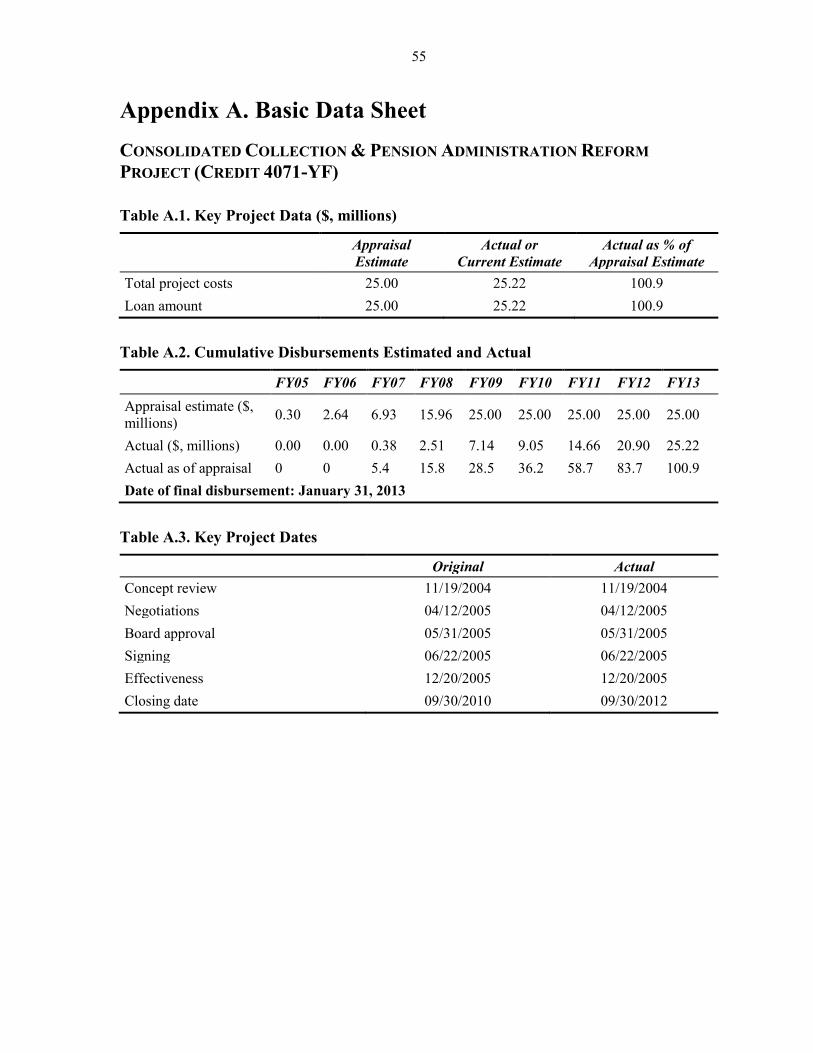
55
Appendix A. Basic Data Sheet
CONSOLIDATED COLLECTION & PENSION ADMINISTRATION REFORM
PROJECT (CREDIT 4071-YF)
Table A.1. Key Project Data ($, millions)
Appraisal
Estimate
Actual or
Current Estimate
Actual as % of
Appraisal Estimate
Total project costs 25.00 25.22 100.9
Loan amount 25.00 25.22 100.9
Table A.2. Cumulative Disbursements Estimated and Actual
FY05 FY06 FY07 FY08 FY09 FY10 FY11 FY12 FY13
Appraisal estimate ($,
millions) 0.30 2.64 6.93 15.96 25.00 25.00 25.00 25.00 25.00
Actual ($, millions) 0.00 0.00 0.38 2.51 7.14 9.05 14.66 20.90 25.22
Actual as of appraisal 0 0 5.4 15.8 28.5 36.2 58.7 83.7 100.9
Date of final disbursement: January 31, 2013
Table A.3. Key Project Dates
Original Actual
Concept review 11/19/2004 11/19/2004
Negotiations 04/12/2005 04/12/2005
Board approval 05/31/2005 05/31/2005
Signing 06/22/2005 06/22/2005
Effectiveness 12/20/2005 12/20/2005
Closing date 09/30/2010 09/30/2012

56
Table A.4. Task Team Members
Name Title Unit
LENDING AND SUPERVISION
Zoran Anusic Senior Economist ECSH3
Tanja Boskovic Consultant ECSPF
Joseph Paul Formoso Senior Finance Officer CTRLA
Carmen F. Laurente Senior Program Assistant ECSHD
Nadejda A. Mochinova Resource Management Officer AFTRM
Marina Petrovic Consultant ECSHD
Gennady Pilch Senior Counsel LEGOP
Snjezana Plevko Senior Economist CFPIR
Anita M. Schwarz Lead Economist ECSH3
Yingwei Wu Senior Procurement Specialist LCSPT
Ivana Aleksić Human Development Specialist ECSH2
Rajna Cemerska-Krtova Operations Officer ECSH3
Olav Rex Christensen Senior Public Finance Specialist HDNED
Aleksandar Crnomarkovic Financial Management Specialist ECSO3
Nikola Kerleta Procurement Specialist ECSO2
Plamen Stoyanov Kirov Senior Procurement Specialist LCSPT

57
Table A.5. Staff Time Budget and Cost for World Bank
Stage or Year of Project
Cycle
Staff Weeks
(no.)
Finance, Including Travel and
Consultant Costs
($, thousands)
LENDING
FY04 N/A 0.00
FY05 40.44 136,059.38
FY06 27.75 70,250.95
Subtotal 68.19 206,310.33
SUPERVISION AND IMPLEMENTATION COMPLETION AND RESULTS REPORT
FY07 12.86 50,316.86
FY08 27.91 76,380.95
FY09 31.93 98,722.48
FY10 29.69 102,991.06
FY11 43.96 133,347.39
FY12 32.79 90,946.24
FY13 7.77 40,023.12
TOTAL 186.91 592,728.10
DELIVERY OF IMPROVED LOCAL SERVICES (LOAN 7510-YF)
Table A.1. Key Project Data ($, millions)
Appraisal
Estimate
Actual or
Current Estimate
Actual as % of
Appraisal
Estimate
Total project costs 46.40 42.16 100
Loan amount 46.40 42.16 91
Cancellation
Table A.2. Cumulative Disbursements Estimated and Actual
FY09 FY10 FY11 FY12 FY13 FY14 FY15 FY16
Appraisal estimate ($,
millions) 8.00 20.00 34.00 46.40 46.40 46.40 46.40 46.40
Actual ($, millions) 0 2.74 8.96 20.32 26.57 35.43 40.26 42.16
Actual as % of
appraisal 0 14 26 44 57 76 87 91
Date of final disbursement: July 31, 2015
Source: Project Portal.

58
Table A.3. Key Project Dates
Original Actual
Concept review 07/21/2006 07/21/2006
Negotiations 12/18/2007 01/30/2008
Board approval 03/18/2008 03/18/2008
Signing 04/11/2008 04/11/2008
Effectiveness 03/10/2009 03/10/2009
Closing date 12/31/2012 03/31/2015
Table A.4. Task Team Members
Name Title Unit
LENDING AND SUPERVISION
Ivana Aleksić Human Development Specialist ECSH2
Nicholay Chistyakov Senior Finance Officer CTRLN
Olav Rex Christensen Senior Public Finance Specialist HDNED
William R. Dillinger Lead Public Sector Management ECSP4
Dominic S. Haazen Lead Health Policy Specialist AFTHW
Nikola Kerleta Procurement Specialist ECSO2
Carmen F. Laurente Senior Program Assistant ECSHD
Tobias Linden Lead Education Specialist SASED
Imelda Mueller Operations Analyst ECSH2
Marina Petrovic Consultant ECSH3
Gennady Pilch Senior Counsel LEGOP
Dena Ringold Lead Economist AFTSW
Maria Laura Sanchez Puerta Senior Economist HDNSP
Pia Helene Schneider Lead Evaluation Officer IEGPS
Hermina Vuković Tasic Program Assistant ECCYU
Juan Diego Alonso Senior Economist LCSHE
Aleksandar Crnomarkovic Sr Financial Management Specialist ECSO3
Michele Gragnolati Sector Leader LCSHD
Ana Holt Health Specialist ECSH1
Marijana Jašarević Operations Analyst ECSH3
Ethan Yeh Economist ECSH1

59
Table A.5. Staff Time Budget and Cost for World Bank
Stage or Year of Project
Cycle
Staff Weeks
(no.)
Finance, including Travel and
Consultant Costs
($, thousands)
LENDING
FY06 16.9 119.78
FY07 90.89 327.97
FY08 51.23 102.20
Total 159.02 549.95
SUPERVISION AND IMPLEMENTATION COMPLETION AND RESULTS REPORT
Total 347.56 1,094.89


Appendix B. Monitoring and Evaluation Frameworks
Table B.1. Consolidated Collection and Pension Administration Reform Project: M&E Framework
Baseline value Target value End value at ICR End value at PPAR
(1) PDO indicators
1.1. Effectiveness of administration improved measured by administrative costs/pension expenditures
Value quantitative or qualitative 2.2% [4%] 1.5% [2.5%] 1.5% 0.96%
Date achieved 2005 — 09/24/2012 2015
Comments at ICR (including % achievement): In 2012, borrower and World Bank teams, to improve international comparability and consistency of this
indicator, agreed to revise the original 2005 baseline figure from 4% to 2.2% (in 2005), and the end target value from 2.5% to 1.5%
Comments at PPAR (including % achievement): The ratio between PIO administrative expenses and total pension expenditures went down to 1.1 percent in
2014 and 0.96 percent in 2015 (World Bank 2017a, 8)
1.2. Progress in administrative consolidation of the three PIOs
Value quantitative or qualitative 0% administrative
consolidation
100% administrative and
financial consolidation
100% administrative and
financial consolidation
Ongoing administrative
consolidation of the three PIOs
Date achieved 01/23/2012 2018
Comments at ICR (including % achievement): In addition to the timely consolidation of the three PIOs, in January 2012, the military fund was also integrated
into the consolidated pension fund, therefore this indicator is overachieved
Comments at PPAR (including % achievement): PPAR mission
1.3. Regular monthly reporting on pension contributions paid on individual basis introduced and individual pension accounts established
Value quantitative or qualitative No monthly reporting
on individual basis; no
individual accounts
Monthly reporting and
individual accounts
functioning
Monthly reporting and
individual accounts
postponed until full
implementation of the CR IS
Monthly reporting and
individual accounts
functioning
Date achieved 09/24/2012 2018
Comments at ICR (including % achievement): Full accomplishment remains dependent on enactment of legislative changes to allow actual launch of the
monthly individualized submission of contribution data and real-time system implementation
Comments at PPAR (including % achievement): PPAR mission
1.4. Reduced reporting burden for employers, measured by fewer reporting forms required
Value quantitative or qualitative 28 types of forms
submitted annually
17 types of forms submitted
annually
17 types of forms submitted
annually
—
Date achieved 09/24/2012
Comments at ICR (including % achievement):
Comments at PPAR (including % achievement): PPAR mission confirmed the reduction in the paperwork generated by the URF online application that can
now be submitted through its website
1.5. Improved client service in the pension system measured by number of resolved cases per employee
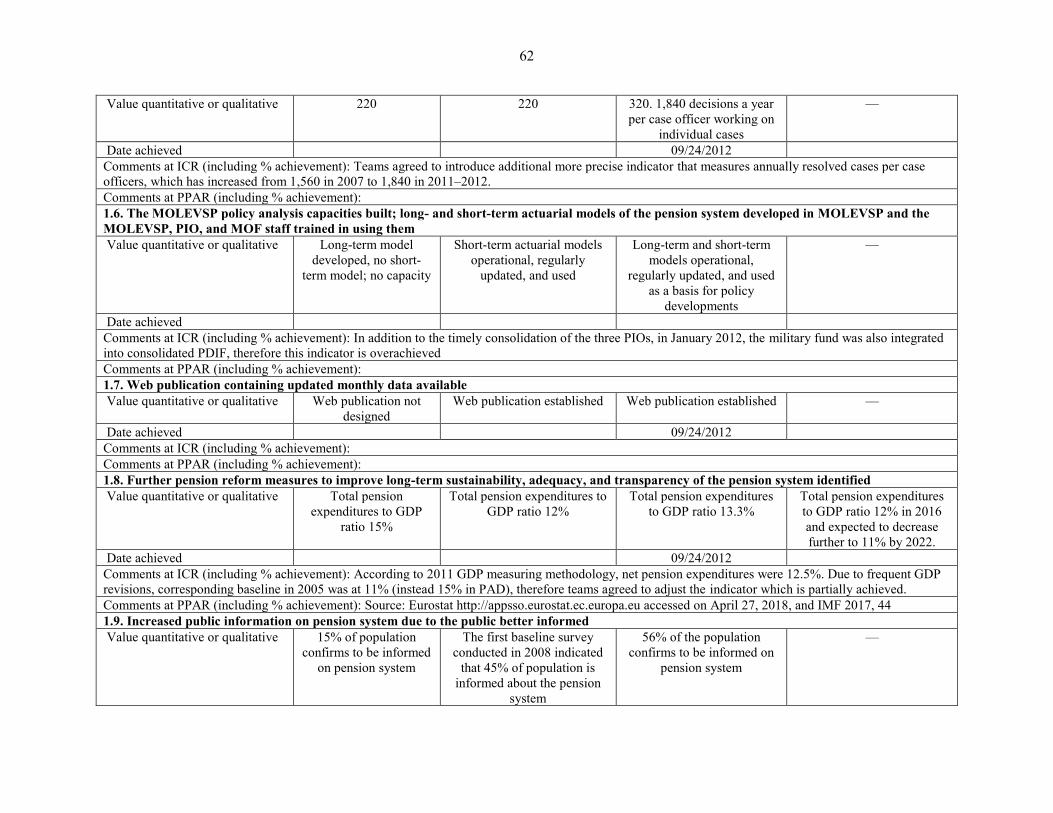
62
Value quantitative or qualitative 220 220 320. 1,840 decisions a year
per case officer working on
individual cases
—
Date achieved 09/24/2012
Comments at ICR (including % achievement): Teams agreed to introduce additional more precise indicator that measures annually resolved cases per case
officers, which has increased from 1,560 in 2007 to 1,840 in 2011–2012.
Comments at PPAR (including % achievement):
1.6. The MOLEVSP policy analysis capacities built; long- and short-term actuarial models of the pension system developed in MOLEVSP and the
MOLEVSP, PIO, and MOF staff trained in using them
Value quantitative or qualitative Long-term model
developed, no short-
term model; no capacity
Short-term actuarial models
operational, regularly
updated, and used
Long-term and short-term
models operational,
regularly updated, and used
as a basis for policy
developments
—
Date achieved
Comments at ICR (including % achievement): In addition to the timely consolidation of the three PIOs, in January 2012, the military fund was also integrated
into consolidated PDIF, therefore this indicator is overachieved
Comments at PPAR (including % achievement):
1.7. Web publication containing updated monthly data available
Value quantitative or qualitative Web publication not
designed
Web publication established Web publication established —
Date achieved 09/24/2012
Comments at ICR (including % achievement):
Comments at PPAR (including % achievement):
1.8. Further pension reform measures to improve long-term sustainability, adequacy, and transparency of the pension system identified
Value quantitative or qualitative Total pension
expenditures to GDP
ratio 15%
Total pension expenditures to
GDP ratio 12%
Total pension expenditures
to GDP ratio 13.3%
Total pension expenditures
to GDP ratio 12% in 2016
and expected to decrease
further to 11% by 2022.
Date achieved 09/24/2012
Comments at ICR (including % achievement): According to 2011 GDP measuring methodology, net pension expenditures were 12.5%. Due to frequent GDP
revisions, corresponding baseline in 2005 was at 11% (instead 15% in PAD), therefore teams agreed to adjust the indicator which is partially achieved.
Comments at PPAR (including % achievement): Source: Eurostat http://appsso.eurostat.ec.europa.eu accessed on April 27, 2018, and IMF 2017, 44
1.9. Increased public information on pension system due to the public better informed
Value quantitative or qualitative 15% of population
confirms to be informed
on pension system
The first baseline survey
conducted in 2008 indicated
that 45% of population is
informed about the pension
system
56% of the population
confirms to be informed on
pension system
—

Date achieved 09/24/2012
Comments at ICR (including % achievement):
Comments at PPAR (including % achievement):
1.10. Improvement in the rate of collection of pension contributions
Value quantitative or qualitative N/A Collection rate improved by
10% substituted by improved
compliance rate p.p. in
comparison to baseline total
comparison rate is 89.9%
Compliance rate improved
by 7.6%
—
Date achieved 09/24/2012
Comments at ICR (including % achievement): Since baseline value was not set, teams agreed on compliance definition—ratio of covered to actual wage bill
the reconstruct the baseline and recalculate current/past year values resulting in baseline 82.8%, and target value at 89.9%
Comments at PPAR (including % achievement):
(2) Intermediate outcome indicators
2.1. Feasibility study completed and the institutional framework for the new system identified
Value quantitative or qualitative No decision on the
institutional and
organizational setting of
the new reporting and
recordkeeping system
for individual
contributions and PIT
New system fully
implemented
Decisions reached
concerning the design of the
new reporting and
recordkeeping system.
—
Date achieved
Comments at ICR (including % achievement): Although feasibility study was adopted by the Pension Reform Council at the end of 2007, and new system
identified, real-time system implementation depends on legislative changes to allow actual launch of monthly individualized submission of contribution data
by taxpayers
Comments at PPAR (including % achievement):
2.2. Pension administration processes streamlined and modernized
Value quantitative or qualitative N/A Administrative integration of
PIOs completed; Reduced
time for responding to clients’
requests
Administrative integration
completed as of January
2008; 78% of cases resolved
within the legal requirement
of 2 months
—
Date achieved
Comments at ICR (including % achievement): Although baseline not set, it was integration of three segregated PIOs and improved client service (percentage
of resolved clients’ requests in two-month response time), set at 55% (2007). Until project closing actual value improved to 78%
Comments at PPAR (including % achievement):
2.3. Actuarial models of the pension system developed and the MOLEVSP and PDI Fund staff trained in using them and developing options for
further policy changes; public knowledge on PAYGO

64
Value quantitative or qualitative Long-term model
developed, no short-
term model; no capacity
Short-term actuarial models
operational, regularly
updated, and used
5 staff members trained, 3
use models in their work
—
Date achieved 09/24/2012
Comments at ICR (including % achievement):
Comments at PPAR (including % achievement):
2.4. PMU staff trained in procurement, disbursement and accounting functions needed for successful implementation of the project PMU staff
trained for monitoring and evaluation of the project
Value quantitative or qualitative 2 staff members trained —
Date achieved 09/24/2012
Comments at ICR (including % achievement): Given that the M&E functions have been performed by the Policy Unit at the MOELVSP, and that the PMU
staff consisted of local consultants hired to perform the fiduciary functions, the limited training of these staff proved sufficient
Comments at PPAR (including % achievement):
Note: — = Not available; ICR = Implementation Completion and Results Report; IEG = Independent Evaluation Group; PDO = project development objective; PPAR = Project Performance Assessment Report.
Table B.2. Delivery of Improved Local Services Project: M&E Framework
Baseline value Target value End value at ICR End value at PPAR
(1) PDO indicators
1.1. Primary health care financing allocated according to capitation- and output-based formula (health, efficiency)
Value quantitative or qualitative PHC providers paid
only by salary
PHC providers paid according
to output-based formula
PHC payment method
includes an output-based
component
PHC payment method
continues to include an
output-based component
Date achieved 06/2012 12/2013 03/2015 2018
Comments at ICR (including % achievement): output-based component was 8 percent of total payments in 2015
Comments at PPAR (including % achievement): Information obtained during the PPAR mission
1.2. Central and local per capita funding formulas in the education sector piloted (education, efficiency)
Value quantitative or qualitative Nonexistent Piloting completed in 15
municipalities
Theoretical piloting started
but actual piloting was not
conducted in any of the
municipalities
No advances in the use of
per capita funding formulas
in the education sector
Date achieved 06/2012 12/2013 03/2015
Comments at ICR (including % achievement): Not Achieved
Comments at PPAR (including % achievement): source: Information obtained during the PPAR mission
1.3. Percent of children from vulnerable groups in project schools (vulnerable groups according to OECD classification: Category A – children with
disabilities; B – children with learning difficulties; C – children from socioeconomically disadvantaged groups) (education, access for vulnerable
groups)
Value quantitative or qualitative 3.2%–3.6% 7.5% 6.56% —
Date achieved 06/2012 12/2013 03/2015

Comments at ICR (including % achievement): Partially Achieved (the actual value achieved reached 8.44% in 2010/11; the final actual value achieved is in
comparison with 4.11% for non-grant schools)
Comments at PPAR (including % achievement): MOESTD has stopped using the OECD classification after the end of the project. The percentage of children
with IEP1 and IEP2 in primary schools (an alternative indicator of inclusive education) has increased from 1.2 percent in 2013/14 to 2.4 percent in 2016
1.4. Percent of MOLEVSP financing allocated for Disabled Peoples Organizations (DOPs), allowing for equal access and improved transparency and
based on results (social assistance, access for vulnerable groups)
Value quantitative or qualitative 20% 100% 100% Continues at 100%
Date achieved 06/2012 12/2013 03/2015
Comments at ICR (including % achievement):
Comments at PPAR (including % achievement): PPAR mission
1.5. Number of Roma children receiving vaccinations through the Roma health mediators (health, access for vulnerable groups)
Value quantitative or qualitative 0 18,795 30,018 —
Date achieved 06/2012 12/2013 03/2015
Comments at ICR (including % achievement): Exceeded
Comments at PPAR (including % achievement):
1.6. Percent of primary health care centers receiving at least a three-year certificate of accreditation (health, quality)
Value quantitative or qualitative 0% 25% 40% 35%
Date achieved 06/2012 12/2013 03/2015
Comments at ICR (including % achievement): Exceeded
Comments at PPAR (including % achievement): Data obtained during the PPAR mission
(2) Intermediate outcome indicators
2.1. Legislative framework allows for capitation- and output-based formula (education and health, efficiency)
Value quantitative or qualitative No legislative
framework
Law passed and bylaw
adopted to enable capitation
Law passed and bylaw
adopted to enable capitation
The legal framework
continues to enable
capitation
Date achieved 06/2012 12/2013 03/2015
Comments at ICR (including % achievement): achieved
Comments at PPAR (including % achievement): Information obtained during the PPAR mission
2.2. Improved allocation framework for equalization funds developed (education and health, efficiency)
Value quantitative or qualitative
No clear methodology
and criteria for
equalization fund
allocation
Framework with
methodology and criteria for
allocation of equalization
funds developed
Framework with
methodology and criteria for
allocation of equalization
funds developed
No advances in the
equalization funds developed
Date achieved 06/2012 12/2013 03/2015
Comments at ICR (including % achievement): achieved
Comments at PPAR (including % achievement): Information obtained during the PPAR mission
2.3. Central and local formulas developed (education, efficiency)

66
Value quantitative or qualitative Nonexistent Formulas developed
Central formulas nearly
completed, local formulas
development initiated
No advances in the per
capita funding formulas in
the education sector
Date achieved 06/2012 12/2013 03/2015
Comments at ICR (including % achievement): Partially achieved
Comments at PPAR (including % achievement): Information obtained during the PPAR mission
2.4. Number of educational institutions (schools and preschools) by type of grants (education, access for vulnerable groups)
Value quantitative or qualitative
0 EIs for schools
without violence
0 EIs for inclusive
education
0 EIs for inclusion of
Roma children
37 EIs for schools without
violence
330 EIs for inclusive
education
196 EIs for inclusion of Roma
children
560 schools o/w 37 EIs for
schools without violence
330 EIs for inclusive
education.
193 EIs for inclusion of
Roma children
—
Date achieved 06/2012 12/2013 03/2015
Comments at ICR (including % achievement): achieved
Comments at PPAR (including % achievement):
2.5. Number of medical staff and associated trained to recognize needs of vulnerable groups (health, access for vulnerable groups)
Value quantitative or qualitative 0 2,000 2,000 —
Date achieved 06/2012 12/2013 03/2015
Comments at ICR (including % achievement): achieved
Comments at PPAR (including % achievement):
2.6. Percent of primary health care centers that have completed quality accreditation process (health, quality)
Value quantitative or qualitative 0% 50% 51% 85%
Date achieved 06/2012 12/2013 03/2015 2018
Comments at ICR (including % achievement): Achieved
Comments at PPAR (including % achievement): Since the project closed, 54 more health institutions had pursued the accreditation process for 135 PHC
centers. Thus, 135/158 = 85%
2.7. Number of PHC centers that have adopted clinical pathways (health, quality)
Value quantitative or qualitative 0% 50% 50% 85%
Date achieved 06/2012 12/2013 03/2015 2018
Comments at ICR (including % achievement): Achieved
Comments at PPAR (including % achievement): as part of the accreditation process PHC adopt clinical pathways
2.8. Number of schools that have undergone a school performance external evaluation (education, quality)
Value quantitative or qualitative 0% 50% 100% —
Date achieved 06/2012 12/2013 03/2015
Comments at ICR (including % achievement): Exceeded
Comments at PPAR (including % achievement):
2.9. Number of training participants among education staff that have undergone development training organized by the project (education, quality)
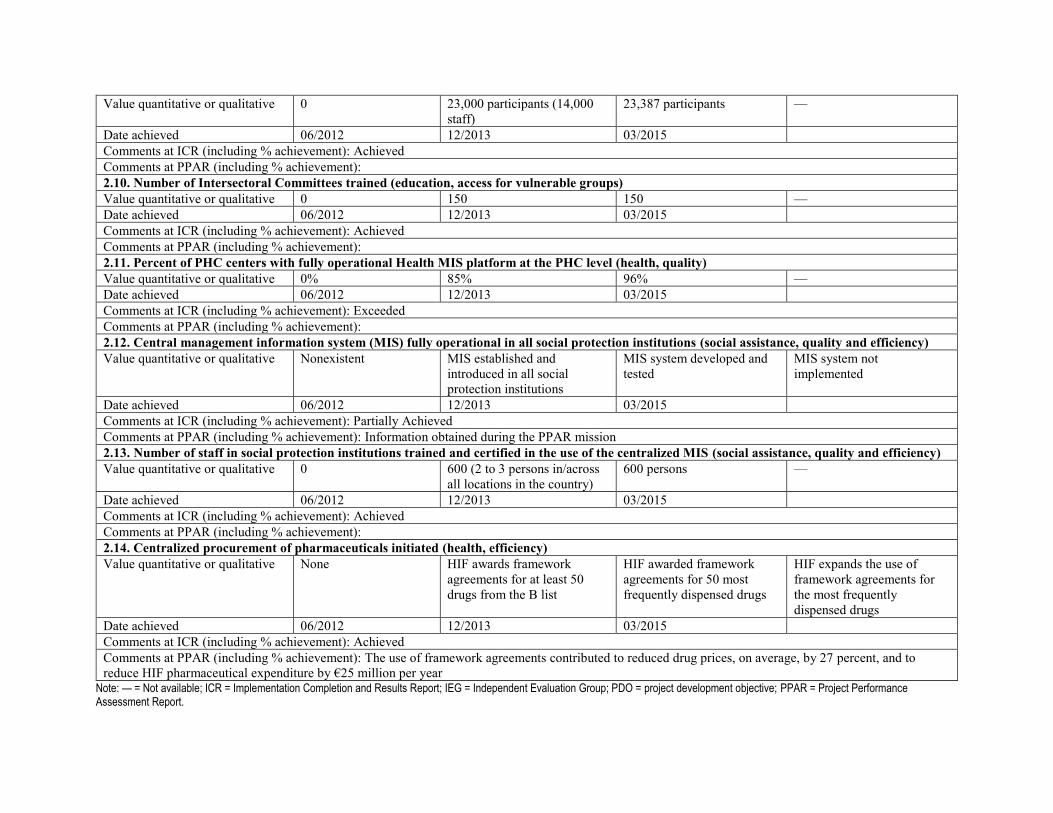
Value quantitative or qualitative 0 23,000 participants (14,000
staff)
23,387 participants —
Date achieved 06/2012 12/2013 03/2015
Comments at ICR (including % achievement): Achieved
Comments at PPAR (including % achievement):
2.10. Number of Intersectoral Committees trained (education, access for vulnerable groups)
Value quantitative or qualitative 0 150 150 —
Date achieved 06/2012 12/2013 03/2015
Comments at ICR (including % achievement): Achieved
Comments at PPAR (including % achievement):
2.11. Percent of PHC centers with fully operational Health MIS platform at the PHC level (health, quality)
Value quantitative or qualitative 0% 85% 96% —
Date achieved 06/2012 12/2013 03/2015
Comments at ICR (including % achievement): Exceeded
Comments at PPAR (including % achievement):
2.12. Central management information system (MIS) fully operational in all social protection institutions (social assistance, quality and efficiency)
Value quantitative or qualitative Nonexistent MIS established and
introduced in all social
protection institutions
MIS system developed and
tested
MIS system not
implemented
Date achieved 06/2012 12/2013 03/2015
Comments at ICR (including % achievement): Partially Achieved
Comments at PPAR (including % achievement): Information obtained during the PPAR mission
2.13. Number of staff in social protection institutions trained and certified in the use of the centralized MIS (social assistance, quality and efficiency)
Value quantitative or qualitative 0 600 (2 to 3 persons in/across
all locations in the country)
600 persons —
Date achieved 06/2012 12/2013 03/2015
Comments at ICR (including % achievement): Achieved
Comments at PPAR (including % achievement):
2.14. Centralized procurement of pharmaceuticals initiated (health, efficiency)
Value quantitative or qualitative None HIF awards framework
agreements for at least 50
drugs from the B list
HIF awarded framework
agreements for 50 most
frequently dispensed drugs
HIF expands the use of
framework agreements for
the most frequently
dispensed drugs
Date achieved 06/2012 12/2013 03/2015
Comments at ICR (including % achievement): Achieved
Comments at PPAR (including % achievement): The use of framework agreements contributed to reduced drug prices, on average, by 27 percent, and to
reduce HIF pharmaceutical expenditure by €25 million per year Note: — = Not available; ICR = Implementation Completion and Results Report; IEG = Independent Evaluation Group; PDO = project development objective; PPAR = Project Performance Assessment Report.

68
Appendix C. List of Persons Met
Name Designation Institution
Mr. Stephen Ndegwa Country Manager World Bank
Ms. Snjezana Plevko Senior Economist, PARP task team
leader World Bank
Mr. Csaba Feher Senior Economist IMF, PARP ICR
author IMF (former World Bank staff)
Mr. Truman G. Packard Lead Economist, DILS task team
leader World Bank
Ms. Ana Holt Senior Health Specialist
DILS task team leader World Bank
Mr. Michele Gragnolati Practice Manager, HNP (DILS task
team leader) World Bank
Ms. Marijana Jašarević
Social Protection Specialist, former
social protection and education
component in DILS
World Bank
Mr. Saša Rikanović Former DILS PCU Coordinator World Bank
Mr. Simo Vuković
Current Second Serbia Health Project
Financing Component Coordinator,
former state secretary MOH during
DILS
World Bank
Mr. Srdjan Svirčev Senior Public Sector Specialist World Bank
Ms. Ivana Aleksić former World Bank staff and DILS
CTL for education World Bank (now British Council)
Mr. Nebojša Tomić Director CROSO
Ms. Dušica Šorgić, Assistant Director CROSO
Ms. Dragana Kalinović Director Pension Insurance Fund
Dr. Aleksandar Milošević Assistant Director Pension Insurance Fund
Ms. Sanja Radojević Škodrić Director Health Insurance Fund Ms. Verica Cvetković Assistant Director Health Insurance Fund Mr. Nemanja Jovicić Assistant Director Health Insurance Fund Mr. Saša Dulić Assistant Director Tax Administration
Žanka Jovanović Collection Department Tax Administration
Goran Nikolić Head at the ICT department Tax Administration
Mihailo Jovanović ICT department Tax Administration
Miško Marković Transformation department Tax Administration
Žanka Jovanović Audit Department Tax Administration
Jasmina Todorović Tax collection department Tax Administration
Mr. Milan Đuretanović Director of Development and ICT National Employment Service
Ms. Snežana Kolaković
Peurača
Head of the Department for the
Insurance Rights in the Case of
Unemployment
National Employment Service
Ms. Tanja Bajić former DILS PCU Health DILS-PMU
Ms. Borislava Maksimović former DILS MOESTD PIU DILS-PMU
Ms. Sanja Miloradović former DILS MOESTD PIU DILS-PMU
Mr. Mihajlo Babin former DILS MOESTD PIU DILS-PMU
Mr. Dušan Stojanović Former DILS MOLESP PIU DILS-PMU
Ms. Danijela Urošević Assistant Minister Ministry of Health
Ms. Vesna Knjeginjić Assistant Minister Ministry of Health
Mr. Dragan Djordjević Health Mediators’ Coordinator Ministry of Health
Ms. Ana Marija Viček State Secretary, pre-university
education
Ministry of Education, Science, and
Technological Development

Name Designation Institution
Ms. Gordana Cvetković Head of Inclusive Education Unit Ministry of Education, Science, and
Technological Development
Mr. Bojan Komnenović
Ex per capita financing DILS
component)
currently Assistant at the Early
Childhood Education and
Development project
Ministry of Education, Science, and
Technological Development
Ms. Vesna Nedeljković
Assistant Minister for Primary
education, ex-director primary school
Mihajlo Petrovic Alas (during DILS)
Ministry of Education, Science, and
Technological Development
Mr. Vladimir Pešić
former Assistant Minister in Ministry
of Labor, Employment, and Social
Policy during DILS
Ministry of Trade, Tourism and
Telecommunications
Ms. Mirjana Kecman Former Head of Department in the
MOLEVSP
Assistant Commissioner for Equality
Protection
Ms. Tanja Tošić Senior Associate Agency for Accreditation of Health
Care Institutions of Serbia
Ms. Marija Mitić Senior Associate Agency for Accreditation of Health
Care Institutions of Serbia
Ms. Gordana Čaprić Deputy Director Institute for Education Quality and
Evaluation
Ms. Olivera Todorović Head of the Centre for Professional
development
Institute for the Improvement of
Education
Ms. Verica Jovanović Acting Director Institute for Public Health Batut
Ms. Milena Vasić
Head of Department for European
Integrations, International
Cooperation, and Project Management
Institute for Public Health Batut
Ms. Dragana Atanasijević Public Health Specialist,
Institute for Public Health Batut
Mr. Ivan Ivanović Head of ICT department Institute for Public Health Batut
Ms. Mirjana Živković Head of centre for analytics, planning,
and organization of health care Institute for Public Health Batut
Ms. Jasmina Tanasić
Head of the Department for Social
Affairs, Secretary of the Health and
Social Policy Committee
Standing Conference of Towns and
Municipalities
Ms. Maja Knežević Romčević Secretary of the Committee for
Education, Culture, Sports, and Youth
Standing Conference of Towns and
Municipalities
Ms. Ivana Maksić Inclusion Coordinator Standing Conference of Towns and
Municipalities
Ms. Svetlana Vlahović Vice president National organization of persons with
disabilities
Ms. Ivanka Jovanović Executive Director National organization of persons with
disabilities
Mr. Božidar Nikolić Teaching Assistant Association of Teaching Assistants
Mr. Nenad Kostić Teaching Assistant Association of Teaching Assistants
Ms. Mersida Bislimi Teaching Assistant Association of Teaching Assistants
Ms. Seada Ajvazović Teaching Assistant Association of Teaching Assistants
Ms. Ceca Ilić Teaching Assistant Association of Teaching Assistants
Mr. Zoran Simonović IT components user then and now Primary Health Centre Savski Venac
Ms. Verica Milatović Jezdić Clinical Pathway coordinator Primary Health Centre Savski Venac
Ms. Manuela Ilić School Principal of the DILS school
grant recipient
Primary School Cirilo i Metodije
Belgrade, Zvezdara
Ms. Radmila Kastratović School Pedagogue of the DILS school
grant recipient
Primary School Cirilo i Metodije
Belgrade, Zvezdara

70
Name Designation Institution
Ms. Tanja Ranković Education Specialist UNICEF
Ms. Jelena Zajeganović-
Jakovljević
Early Childhood Education and
Development project Program
Coordinator
UNICEF
Ms. Irena Radinović Program Manager—Education EU Delegation
Ms. Maja Vuckovic-Krčmar Program Manager—Health EU Delegation
Ms. Mirjana Maksimović Program Manager—Social Inclusion EU Delegation
Mr. Jovan Protic ILO National Coordinator for Serbia International Labour Office
Mr. Nikola Altiparmakov Member of the Fiscal Council Fiscal council of the Republic of
Serbia