sequestration rates, duration, capacity, and … rates, duration, capacity, and saturation:...
TRANSCRIPT
Sequestration Rates, Duration, Capacity, and Saturation: Determining Factors for Current and Future Soil Carbon Stocks
A Joint CASMGS-CSITE Session onSoil Carbon Sequestration:
Science, Technology, and Economics
Third Annual Conference on Carbon Capture & SequestrationArlington, Virginia
May 3-6, 2004
Tris WestEnvironmental Sciences DivisionOak Ridge National Laboratory
Johan SixUniversity of California-Davis &
Colorado State University

I. Introduction to terms• Soil carbon capacity is the amount of carbon held by the
soil in a steady state under a specific management scenario.
• ∆ Soil C capacity =Mean sequestration rate x Sequestration duration
• Duration is:(a) the time period in which rates of soil carbon
accumulation or loss occur until a new steady state is reached (i.e., duration of active sequestration); and
(b) the time period in which soil carbon remains sequestered (i.e., duration of previously sequestered carbon).
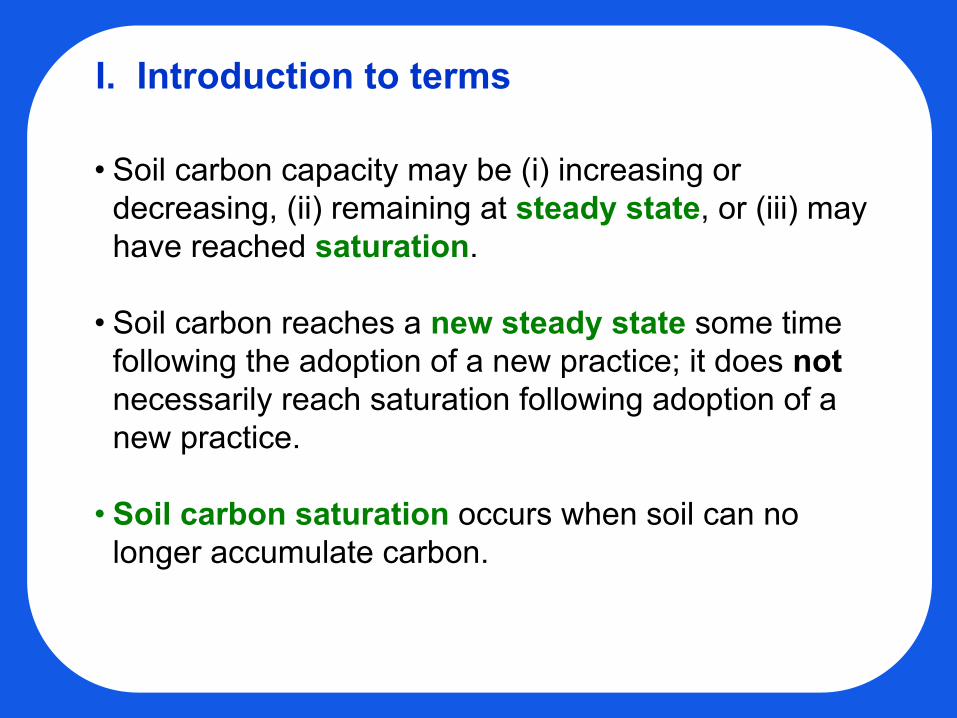
• Soil carbon capacity may be (i) increasing or decreasing, (ii) remaining at steady state, or (iii) may have reached saturation.
• Soil carbon reaches a new steady state some time following the adoption of a new practice; it does notnecessarily reach saturation following adoption of a new practice.
• Soil carbon saturation occurs when soil can no longer accumulate carbon.
I. Introduction to terms
Time
Soil Ccontent
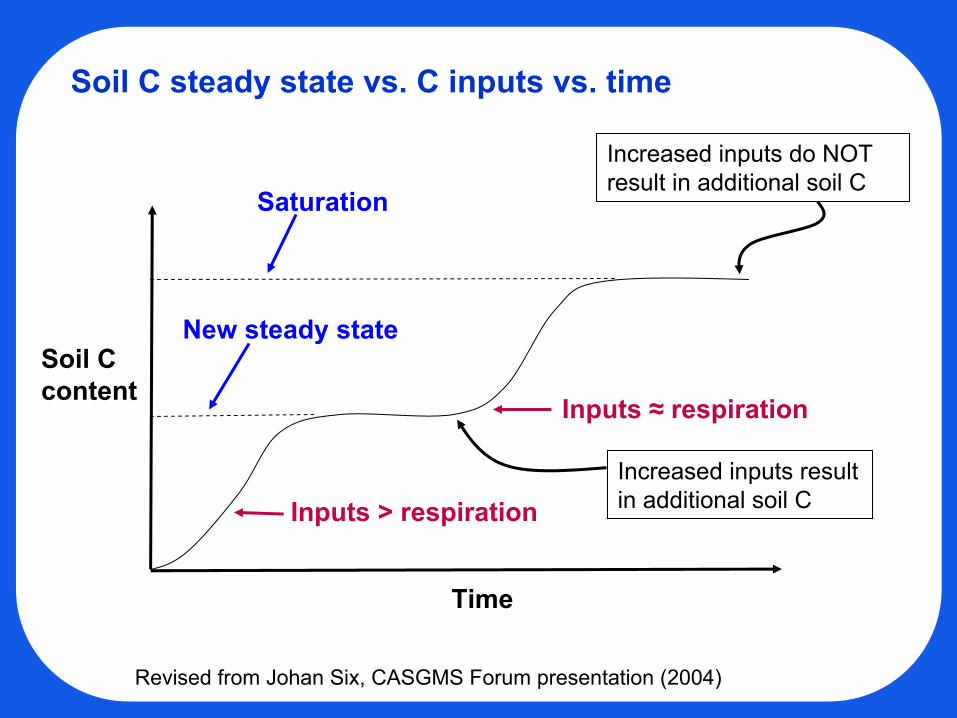
Soil C steady state vs. C inputs vs. time
Inputs > respiration
Inputs ≈ respiration
New steady state
Saturation
Increased inputs result in additional soil C
Increased inputs do NOT result in additional soil C
Revised from Johan Six, CASGMS Forum presentation (2004)

Rates, duration, capacity, and saturation of stored carbon depend on carbon cycle dynamics and carbon sequestration strategies.
SoilCarbon
inputs
outputs
• Fertilize• Irrigate• Weed control• Increase rotation
complexity• Manure application
Increase organicmatter inputs
• Decrease tillage• Increase aggregate
formation (earthworm introduction)
• Increase surface residue / cover crop
Decrease decomposition
and erosion
Temperature; Precipitation;Soil physical and chemical
properties

II. Sequestration rates – brief overview
13 ± 3%
15 ± 3%
10%
CT NT
7 ± 2%U.S.Ogle et al. (2003)
6 ± 2%GlobalWest & Post (2002)
10%Global (temperate)IPCC (1997)
Enhanced residue productionCoverage
Comparison of soil C sequestration rates between IPCC guidelines and two other analyses
IPCC. 1997. Greenhouse Gas Inventory Reference Manual, v. 3.West and Post. 2002. Soil Science Society of America Journal 66:1930-1946.Ogle et al. 2003. Global Change Biology 9:1521-1542.

III. Duration of active soil carbon sequestration
0
50
100
150
200
0 25 50 75 100 125 150Experiment duration (years)
Ann
ual c
hang
e in
SO
C(g
m-2
yr-1
)
Reforestation
05
101520253035
0 25 50 75 100 125 150Experiment duration (years)
Ann
ual c
hang
e in
SO
C (%
) Grassland management
012345678
0 25 50 75 100 125 150Experiment duration (years)
Cropland management
Ann
ual c
hang
e in
SO
C (%
)
Data from West and Post (2002) Data from Conant et al. (2001)
Data from Post and Kwon (2000)

Determining factors represented in Carbon Management Response (CMR) curves
West et al. 2003. Environmental Management (in press).
Ave
rage
cum
mul
ativ
eC
flu
x fro
m s
oil f
ollo
win
g a
chan
ge fr
om C
T to
NT
(%)
-20
-16
-12
-8
-4
0
0 5 10 15 20 25 30Time (years)
Mean95% C.I.
Ave
rage
ann
ual C
flux
from
so
il fo
llow
ing
a ch
ange
fro
m C
T to
NT
(% y
r-1)
-3.0
-2.5
-2.0
-1.5
-1.0
-0.5
0.0
Capacity (sum of initial C stock and the cumulative % change in initial C stock)
Accumulation rate as a function of time
Duration of active carbon accumulation

III. Duration of active soil carbon sequestration
-14-12-10
-8-6-4-20
0 10 20 30 40 50 60 70Years
Ave
rage
cum
ulat
ive
C
accu
mul
atio
n w
ith ro
tatio
n en
hanc
emen
t (%
)
Cropland management
Estimates of cropland improvement derived from West and Post (2002).
Duration of sequestration rates may be longer for changes in inputs (increased residue production) than for changes in outputs (decreased respiration/decomposition).
-16-14-12-10
-8-6-4-20
0 10 20 30 40 50 60 70Years
Mean95% C.I.
Ave
rage
cum
ulat
ive
C
accu
mul
atio
n fo
llow
ing
a ch
ange
from
CT
to N
T (%
)

III. Duration of active soil carbon sequestrationDuration and climate regime
01020304050607080
WarmTemperate
Moist
WarmTemperate
Dry
ColdTemperate
Moist
ColdTemperate
Dry
TropicalDry
Tropicalmoist/wet
All climates
Climate regime
Act
ive
sequ
estr
atio
n du
ratio
n (y
ears
) Cropland management Grassland management

III. Duration of active soil carbon sequestrationDuration and climate regime
020406080
100120140160
WarmTemperate
Moist
WarmTemperate
Dry
ColdTemperate
Moist
ColdTemperate
Dry
TropicalDry
Tropicalmoist/wet
All climates
Climate regime
Act
ive
sequ
estr
atio
n du
ratio
n (y
ears
)
Cropland management Grassland managementForest conversion

Hypothetical scenario consists of (a) deforestation and cultivation of soil using conventional tillage, (b) changing from conventional tillage to no-till, (c) use of conventional tillage for one year, (d) returning to the use of no-till, and (e) abandoning the land and allowing forest conditions to re-establish. From West et al. (2003).
IV. Duration of previously sequestered carbonTerrestrial carbon is expected to remain sequestered until thereis a subsequent change in management.
05
101520253035
0 20 40 60 80 100Time (years)
Deforestation/CTChange to no tillageReforestation
a
b
c
d
e
Cum
ulat
ive
net C
flux
to
the
atm
osph
ere
for a
hy
poth
etic
al s
cena
rio
(% o
f ini
tial s
oil C
)
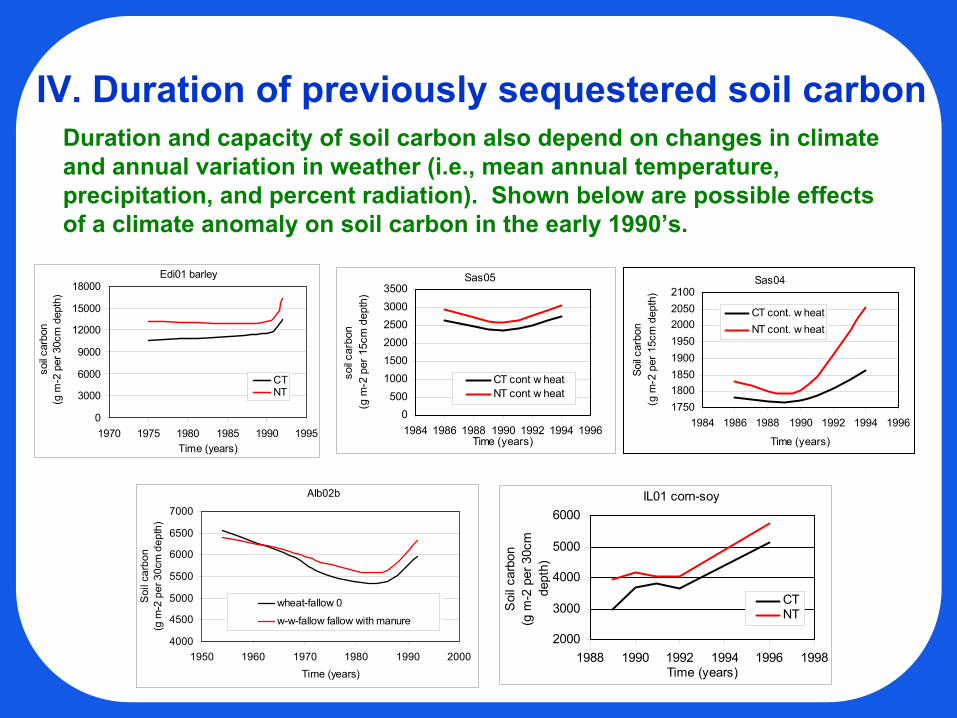
IV. Duration of previously sequestered soil carbonDuration and capacity of soil carbon also depend on changes in climate and annual variation in weather (i.e., mean annual temperature, precipitation, and percent radiation). Shown below are possible effects of a climate anomaly on soil carbon in the early 1990’s.
Sas05
0500
100015002000250030003500
1984 1986 1988 1990 1992 1994 1996Time (years)
soil c
arbo
n(g
m-2
per
15c
m d
epth
)CT cont w heatNT cont w heat
Sas04
17501800185019001950200020502100
1984 1986 1988 1990 1992 1994 1996
Time (years)
Soil c
arbo
n(g
m-2
per
15c
m d
epth
)
CT cont. w heatNT cont. w heat
Alb02b
4000
4500
5000
5500
6000
6500
7000
1950 1960 1970 1980 1990 2000Time (years)
Soi
l car
bon
(g m
-2 p
er 3
0cm
dep
th)
wheat-fallow 0
w-w-fallow fallow with manure
Edi01 barley
0
3000
6000
9000
12000
15000
18000
1970 1975 1980 1985 1990 1995Time (years)
soil c
arbo
n(g
m-2
per
30c
m d
epth
)
CTNT
IL01 corn-soy
2000
3000
4000
5000
6000
1988 1990 1992 1994 1996 1998Time (years)
Soi
l car
bon
(g m
-2 p
er 3
0cm
de
pth)
CTNT

Paustian et al.(1997)
Increase in inputs ~ increase in soil C
V. Soil carbon saturation

Evidence of C saturation in high C soils
V. Soil carbon saturation
Campbell et al. (1991)

Soil carbon may be increased over that in native soils.
Continuous corn under conventional (CT) and no-tillage (NT) management. Results averaged across fertilization treatment rates of 0, 84, 168, and 336 kg N ha-1. From Ismail et al. (1994).
Bluegrass sod CT NT-------Mg C ha-1 (0-30 cm)-------
1970 53.4 53.4 53.41975 53.4 43.3 48.71980 53.4 42.9 48.81989 54.9 55.7 59.9
V. Soil carbon saturation

VI. Duration and saturation in soil C models: Rothamsted Carbon Model
0
50
100
150
200
250
300
0 25 50 75 100 125 150 175 200Years
Tota
l C
(Mg/
ha p
er 2
3cm
dep
th)
140 t/ha manure, 23% clay, wheat/fallow, high DPM/RPM ratio
0102030405060708090
0 25 50 75 100 125 150 175 200Years
Tota
l C(M
g/ha
per
23c
m d
epth
)
No fertilizer or manure, 23% clay, wheat/fallow, high DPM/RPM ratio
0102030405060708090
0 25 50 75 100 125 150 175 200Years
Tota
l C(M
g/ha
per
23c
m d
epth
) No fertilizer or manure, 46% clay, continuous wheat, low DPM/RPM ratio
Decrease in decomp.~20 g m-2 yr-1 for 20yr
0
20
40
60
80
100
0 25 50 75 100 125 150 175 200Years
Tota
l C(M
g/ha
per
23c
m d
epth
)
35 t/ha manure, 23% clay, wheat/fallow, high DPM/RPM ratio
Increase in inputs:~25 g m-2 yr-1 for 200 yr

VII. Summary
• Sequestration potential depends on both the rate of sequestration and the duration of sequestration rates.
• The new carbon capacity represents a new steady state of soil carbon, and not necessarily soil carbon saturation.
• The “ultimate” carbon capacity, based on estimates of soil carbon saturation, may be significantly larger than traditional estimates of sequestration potential and larger than the “natural” capacity.
• Current soil carbon sequestration potentials may be underestimated without fully considering issues of “duration” and “saturation”.

Acknowledgments
Consortium for Research on EnhancingCarbon Sequestration in Terrestrial Ecosystems
OAK RIDGE NATIONAL LABORATORYU.S. DEPARTMENT OF ENERGY