sequestration in carbonate aquifers: rock and brine ... · the injection of co2 into a formation...
TRANSCRIPT

Sequestration In Carbonate Aquifers: Rock and Brine Alterations during Super-Critical CO2 Injection in San Andres Formation, West Texas Gloria S. Garcia-Orrego,KinderMorgan CO2 Company LP.
Waylon House,Texas Tech University;Necip Guven, Texas Tech University, LorneA. Davis, texas Lutheran Univesity
Abstract
The injection of CO2 into a formation changes the physics and chemistry of both the solid matrix and the fluids contained in the formation. The laboratory study reported here investigated how the chemical composition of the natural formation brine and different minerals present in the carbonate formations altered upon CO2 injection under supercritical conditions. The study focused on the alteration of the petrophysical properties of the carbonate reservoir rocks resulting from this interaction of rock, brine and injected CO2. Experiments were performed with two injection volumes. Conventional and Nuclear Magnetic Resonance (NMR) core analyses indicated that that low pore volume of CO2 injection caused substantial reduction in the petrophysical properties of the samples - permeability and porosity. The permeability was reduced by about 50% and the pore volume and porosity by about 25%. In contrast, the injection of a high pore volume of CO2 showed only a slight increase in the petrophysical properties. The static interaction between supercritical CO2 and natural formation brine showed a precipitate formed primarily by calcite, dolomite, gypsum, halite and other mineral salts.
Introduction
One of the most possible options for confining CO2 produced by burning fossil fuels in power plants and for reducing its content in the atmosphere is the sequestration of CO2 in aquifers or formation brine bearings zones. During the injection of supercritical CO2 in a deep aquifer, two broad areas of reaction must be taken into consideration:
1. Dissolution of CO2 into the formation water promotes the increase in bicarbonate and carbonate ions that are able to react with cations dissolved into the aqueous phase. This reaction with formation water produces precipitation of new mineral species called evaporites. 2. Dissolution of CO2 in formation water produces carbonic acid resulting in dissolution (and re-deposition) of minerals within the rock matrix.
Much less is known about sequestration of CO2 under supercritical conditions (1070 psia and 88 ˚F)) in carbonate in comparison to what is known about sequestration in sandstone. Although disposal in carbonate aquifers1 has been found to be less efficient than disposal in sandstone aquifers, the present research was aimed at investigating formation brine acidification with CO2 in carbonate aquifers, where the reactivity of the rock formation is obviously controlled by carbonate minerals. An integrated mineralogical, petrophysical, and experimental study was undertaken in order to evaluate the expected mineral–brine–CO2 reactions in San Andres carbonate formation, utilizing three different approaches: core samples characterization, CO2 flooding tests, and water characterization. Core samples characterization Mineralogical studies were designed to identify important components of the rock. To find the distribution of reactive minerals that could potentially interact in the presence of carbonic acid formed after dissolution of carbon dioxide in the formation brine. Petrophysical studies were carried out to determine the changes of permeability and porosity as a consequence of possible CO2-brine-rock interactions. They were performed before and after CO2 injection in order to compare original and post CO2

treatment petrophysical parameters. Conventional and Neutron Magnetic Resonance (NMR) petrophysical analyses of core were used to evaluate variations in petrophysical properties. Core flooding tests Static precipitation tests were performed to observe precipitation and deposition of new minerals as a function of the brine saturation at supercritical and simulated reservoir conditions. Laboratory core flood experiments were carried out to investigate the interaction of injected CO2 simultaneous with formation brine in the dolomite cores under controlled reservoir conditions (150˚F and 2000 psia). Two types of experiments were conducted. The first experiments had a small volume of CO2/ brine injected at very slow flow rates ((0.1613 cc/min) or 20 Pore Volumes (PV) in 7 days of injection, to simulate conditions in the reservoir bulk. The second sets of experiments were characterized by a large amount of CO2/brine at a high rate to simulate conditions near the injector wellbore (0.982 cc/min) or 120 PV in 7 days of injection. Brine water characterization Samples of formation brine produced from the Permian Basin reservoir were used to run the tests. These samples were analyzed before and after CO2 injection in order to determine any changes in the chemical composition.
Carbon Dioxide in Geological Formations
Sequestration of carbon dioxide in geological formations or aquifers has received special attention from the environmental sciences and from commercial industries. The main studies of sequestration of CO2 in saline aquifer formations will be described in the following paragraphs.
Rochelle et al.2 stated that dry supercritical CO2 appears to cause little reaction with the rock. On the other hand, once CO2 is dissolved and carbonic acid is formed in water, mineral dissolution and precipitation reactions can occur. Holloway 3,4 undertook a project in 1993 for the European Commission. He found that injection of CO2 into a carbonate reservoir leads to dissolution of carbonate minerals in the vicinity of the injection wells, and the formation water becomes carbonate saturated. As pressure decreases or temperature increases, precipitation of carbonate minerals is possible. Therefore, permeability is likely to be increased near the injection point, but may decrease further away deep into the reservoir. He concluded that injection of CO2 into carbonate reservoirs could cause subsidence around the injection site. A number of studies have been carried out to investigate the interactions between CO2/brines and rocks during Enhanced Oil Recovery (EOR) processes. A summary of these studies related to the injection of CO2 into the San Andres formation follows.
Henry et al.5 performed a study which dealt with utilization of composition observation wells in a West Texas CO2 pilot flood. The study explored rock-CO2 interaction and corroborated CO2 solubility parameters in injection and formation brine. An increase in bicarbonate ions in the production water indicated that CO2 was dissolved in the mixed brine (injection and formation brine), forming carbonic acid. Analyses of brine obtained from the pilot area indicated that the dissolved solids and ion concentrations substantially increased in the wells away from the injector when the CO2 flowing through the rock had already been in contact with other portions of the reservoir. Mathis and Sears6 investigated the effect that CO2 flooding had on total porosity variation of a dolomite reservoir. They found that dissolution of dolomite and dissolution of anhydrite are not common during CO2 injection. Hager et al.7 investigated the effects of water-flooding on reservoir properties and producing operations, developing a geochemical model of interactions between water injection/formation brine and rock/ mixture brine. The main purpose of the study was to measure the relation between the mechanical formation damage with dissolution and precipitation of minerals into the reservoir.

Svec and Grigg 8 studied the physical effects of water-alternate-gas (WAG) fluids on carbonate core plugs. The authors found that dissolution of anhydrite and dolomite occurred during CO2 alternate brine flooding process. Back Scattering Electron (BSE) microscopy indicated that there were no major changes in mineralogical composition or structure of the samples observed pre and postflood with CO2. There was no evidence of a new material such as calcite or any other carbonate precipitated into the porous medium as a consequence of CO2 alternated brine flooding.
Carbon Dioxide under Supercritical Conditions
Physical Properties For pure CO2, the critical temperature of carbon dioxide is 88˚F and the critical pressure is 1070 psia. Above the critical point, CO2 exists as a supercritical fluid, which is a gas-like compressible fluid. Physical properties of the CO2 under subsurface conditions (above supercritical conditions) are highly affected. It should be pointed out that the density and viscosity of the CO2 increase rapidly as the pressure increases but decreases with increasing temperature. Density changes from 12.49 to 56.16 lbm/ft3 in a range of pressure from 1000 psia to 3500 psia. Viscosity increases with pressure but decreases with increasing temperature. Viscosity in a range from 1000 psia to 3500 psia varies from 0.05 to 0.1 cc. Chemical Reactions The most important products related to reactions between CO2 and water are called “evaporites,” or chemical sedimentary rocks.9 These rocks are formed when dissolved material in sea water or brackish brine are precipitated as solids. The precipitated solids are formed as a result of chemical weathering dissolving out of sediments, which are placed in solution. Obviously, the principal chemical agent for the weathering process is the saline formation water which carries dissociated H2CO3. The major cations of evaporitic minerals are sodium, potassium, calcium, and magnesium; the major anions involve are chloride, sulfate, and to some extent, carbonate. The role of mineral precipitation as the primary means of reduction of petrophysical properties in a carbonate reservoir during injection of CO2 under supercritical conditions can be explained by the principal physical and chemical properties of the carbonates and sulfates in the presence of CO2. Two possible pathways exist for precipitation of calcite. One pathway is based on anhydrite and/or gypsum dissolution that drives dissolution of dolomite, increasing the calcium concentration into the brine. The other pathway is direct precipitation from the formation brine as a result of the addition of carbonate ions to a saturated solution of CaCO3. The instantaneous reaction between CO2 and saline formation brine forms carbonic acid, which produces dissolution of sulphates, increasing the ionic strength of the brine, and causing the concentration of calcium ions to rise into solution. For that reason, the product [ ][ ]−+ 2
32 COCa increases greatly. Thus, for the solution to maintain equilibrium it must adjust to
obtain a value equal to the equilibrium constant. Consequently, calcite eventually precipitates. The acidic environment created by carbonic acid leads to precipitation of gypsum or anhydrite during injection of carbon dioxide into the saline formation water. Precipitation of gypsum is driven by the increase of sulfate and carbonate ions as a result of anhydrite and dolomite dissolution.
Experimental Methodology
The brine-CO2/rock interaction study10 was integrated with interpretation of the mineralogical characteristics of the geological formation and chemical composition of formation brine, in order to understand the geochemical conditions in deep carbonate rock, when CO2 is injected. Core samples characterization A scanning electron microprobe was used to study the original pore structural and mineralogical composition of several samples of the carbonate formation. Observations of Scanning Electron Microscopy (SEM) and BSE images of the pore system structure of the carbonate formation indicate that the pores and throats are of variable sizes and variable surface

characteristics; However these are predominantly circumscribed by well defined grains of dolomite coated by very fine material formed mainly of calcite, anhydrite and quartz. The same fine material bridges the pore throats. The microscopic observations allow qualitative evaluation of the permeability and porosity of the carbonate formation. The structure of the samples suggested that the permeability and the sizes of the pore throats could be severely reduced either by the movement of the fine material during an injection operation or during the precipitation of material within the small pore throats. The sample was viewed under high magnification in order to observe the relationship between pore and throats.
Brine Characterization The chemical composition of the saline brine used in the experiments in this study was brine produced in the Barry-4 well in the Permian Basin. Initial Preparation of the Samples A total of forty-four (44) horizontally oriented core plug samples were drilled from the full core using a diamond core drill and brine with about approximately 3% NaCl for cooling and lubrication. Core plug samples were one and a half (1 ½) inches diameter and three (3) inches in length. The core plugs were trimmed to form right cylinders using a diamond rimmed saw blade and brine. Each core plug was marked with its respective depth and an identification number. Conventional core analysis was then immediately initiated. A Dean-Stark distillation/extraction apparatus was used to clean the samples. The original fluid was removed using 50% toluene to clean the samples, which removed any hydrocarbon present in the pore spaces. A solution of 50% methanol was used to remove the residual salt from the brine present in the samples. The samples were subsequently removed from the Dean-Stark apparatus and placed in an oven at 158 ˚F (70˚C) to avoid dehydration of the gypsum, which forms integral part of the mineralogical composition of the core samples. The absolute permeability to gas was determined for the core plug samples using a gas permeameter. The permeability of the core was determined using Darcy’s equation:
pALQ
Kc
cggg ∆×
××=
µ…………………………………………………………..…(1)
=gK Gas permeability, mD
=gQ Gas flow rate, cc/min
=gµ Gas viscosity, cp
=cL Core length, cm
=cA Core transversal area =∆p Pressure drop through the core, cm2
The porosity of each sample was determined using Boyle’s law method with helium as the gaseous phase. The total porosity of the cores was calculated by determining the pore volume and the bulk volume as shown in the following equation :
100100 ×−
=×=b
grb
b
pT V
VVVV
φ ……………………………………………..…(2)
The pore volume (Vp) is calculated as the difference between the bulk volume of the core sample (Vb) and the grain volume (Vgr). The bulk volume is measured using either a vernier caliper or a mercury pump. The grain volume is determined using a Phoenix Precision helium porosimeter. Core plug samples were saturated with natural formation brine that had 78,495 ppm of total dissolved solids (TDS). The samples were vacuumed for twenty-four hours initially. Then, they were saturated with saline formation brine for three hours under vacuum conditions.

T2 distribution, pore size distribution NMR measurements were made to better understand the petrophysical link between the T2 distributions obtained from brine saturated cores before and after CO2 injection and to better understand the variations in pore size and petrophysical properties of core samples as a result of any possible geochemical alterations. Porosity determination using nuclear magnetic resonance (NMR) was carried out on core samples saturated with formation brine under vacuum conditions. NMR acquisition was performed on a Maran-2 spectrometer at a frequency of 2 MHZ. Carr-Purcell-Meiboom-Gill (CPMG) pulse sequences were employed with very short inter-echo spacing to minimize the effect of diffusion in the rock’s internal field gradients.11 Low field CPMG data was inverted to obtain a distribution of T2 (transverse
relaxation time) that was used to calculate porosity and observe the variations in the equilibrium nuclear magnetization (Mo) as a consequence of CO2 injection.
Methodology to determine porosity from T2 distribution A comparison of the total equilibrium nuclear magnetization of the core sample (Mo (core)) with the one obtained for the standard solution of nickel chloride (Mo (st)) provided the value of porosity. This is expressed by the following equation.
100V
M
MV
φb(core)
o(core)
o(st)
stNMR ××= ⎟
⎟⎠
⎞⎜⎜⎝
⎛……………………………………………..(3)
T2 distribution from low field CPMG data can be used to estimate the bound water volume or bulk volume irreducible (BVI) and free fluid index (FFI).12 The BVI is associated with small pores that contain non- producible fluids. These small pores have the shortest T2 values in the distribution spectrum. Hence, the pore volume with T2 values shorter than a certain cutoff can be correlated with small pores and with bound water in clays. The free fluid index (FFI) is associated with larger pore spaces.13 Hence a T2 cutoff may be applied to the T2 distribution, which divides the total NMR porosity into BVI and FFI. Close agreement is obtained with cutoff value of 100 milliseconds in the carbonate formations.14 A vertical cutoff of 100 milliseconds on a T2 distribution curve separates the distribution into the BVI (low T2 values) and FFI (high T2 values). A summation of the magnetization below 100 millisecond divided by the total magnetization corresponds to BVI; the summation of the magnetization above 100 milliseconds divided by the total magnetization corresponds to FFI. Petrophysical properties alteration (PPA) The petrophysical properties alteration (PPA) was calculated as function of any of the petrophysical property variation resulting from CO2 injection. The initial petrophysical properties (permeability, pore volume, porosity, and T2 distribution before CO2 flooding were determined for each core plug sample. These petrophysical properties were called initial petrophysical properties (PPi). Then, after cleaning the flooded core plugs, the petrophysical properties were again measured. The result is the final petrophysical property (PPf). The (PPA) is calculated as follows:
i
f
PP
PPPPA = …………………………………………………………….…..…(4)
The termiPP
fPP in Equation 4 represents the fraction of petrophysical property altered after interaction between brine-rock
and CO2. Therefore, the lower the PPA, the higher the impairment of petrophysical property, and vice versa. Core flood set up and procedure Fig. 1 is a schematic diagram of the experimental set up used during CO2 experimental flooding. Distilled water was injected into the core holder around the cores in order to maintain an overburden pressure of about 3000 psia, using a Precision Syringe Isco pump. This overburden pressure ensures a tight fit between the sleeve and the outside of the cores, thus preventing CO2 and brine from passing through the annulus between the sleeve and the outside of the cores.

The brine and CO2 were injected simultaneously into the core holder from two accumulators, one for brine and the other for CO2. After the temperature of the system reached 150˚F, the CO2 pressure was set at 2000 psia by adjusting the flow rate position in the Ruska pump. The equilibrium between CO2 and injection of formation brine is obtained, maintaining the CO2 injection pressure. A Ruska pump was used to inject mineral oil into the accumulators to maintain the injection pressure. The injection rate of the brine and CO2 was based on the capability of the Ruska pump to inject the fluids.
The tests were carried out in two modes: low injection rate and high injection rate. In the low injection rate small volume of CO2/brine was injected at a slow rate to simulate the conditions in the bulk of the reservoir. In the high injection rate, a large volume of CO2/brine was injected at a high injection rate to simulate conditions close to the injector well. During each test, the effluent solution passed through a backpressure regulator (BPR) to maintain the pressure through out the core samples. At the end of the system, the solution passed through a separator in order to collect the brine continuously into an auto-sampler. The effluent brine samples were collected to measure the changes in their chemical composition before and after CO2/brine were injected all the way through dolomite formation core samples. Static Brine Tests A series of static tests were conducted to evaluate the interaction between CO2 and formation brine under supercritical conditions of pressure and temperature of CO2 (1100 psia and 88˚F); and at reservoir pressure and temperature (2000 psia and 150 ˚F). The tests were carried out in the brine with and with out rock samples. A test cell accumulator was filled up with approximately 1000 milliliters of brine. The accumulator was hermetically closed and then it was pressurized with CO2. Fig. 2 depicts the set up used to run the static tests. The brine was left for seven day in order to allow reaction with the CO2. At the end of the tests, the temperature was dropped and the pressure was released into the atmosphere. The cell accumulator was opened and the brine treated with CO2 was centrifuged to obtain solid precipitate. The precipitate was place on a glass slide to be analyzed using XRD and STEM techniques. Brine Chemical characterization The laboratory water analyses were carried out at Trace Analysis Inc., in Lubbock. The most important analyses include specific gravity analysis, total dissolved solid (TDS) and chemical composition analysis. X–Ray Diffraction (XRD) XRD tests were performed to identify the main minerals components of the rock material. XRD analyses provide patterns that allow identification of the minerals that constitute the rock. These analyses were carried out before and after CO2 injection to evaluate the possibility of formation of new material. Both types of analyses were performed in powdered samples and slides. Preparation of the oriented fine sample on slides The following procedures were followed to remove most of the carbonate minerals present in the samples to identify any clay material and fine material in the rock bulk samples. The sample was treated with hydrochloric acid at 0.3 M. The sample was heated to dissolve the carbonates (dolomite, calcite and siderite). The supernatant was centrifuged, decanted and discarded. Then it was washed to obtain the insoluble residue. Centrifugation is the best method to allow the particles to settle. The yield of the process is supernatant, which contains most of the particles of less than 2µm. Successive ultra-centrifuging of the sediments was necessary to obtain the total amount of ultra-fine material. An eye dropper was used to put the suspension on the glass, so that the liquid covered the entire surface of the slide. The sample was left overnight to dry. Imaging Tests The SEM’s images of the core samples before and after CO2 injection at very low pore volume was obtained with a Cameca SX-50 electron microprobe. This device can combine the X-ray elemental analysis of inorganic materials at the micron size scale at medium magnification. Low and moderated magnifications from 62X to 20,000X can be obtained. Additionally, energy-dispersive X-ray spectrometry (EDS) allows qualitative chemical analysis of the observed material.

The cleaned and dried small pieces of core samples were coated with gold before and after injection of CO2. An electrically conducting carbon particle was used to glue the sample of the rock onto the sample holder. A Pelco Model 3 with a gold and palladium target was used in the coating process. The coated sample was placed into the electron microscope and observed at magnifications varied from 100X to 2,000X. Backscattering electron (BSE) images were obtained from polished surface of thin sections with the Cameca SX-50 electron microprobe. These thin sections were impregnated with rhodamine- B2 dye mixed with epoxy. The epoxy- filled pores provided a clear contrast with the dolomite and calcite compounds allowing differentiate the matrix and cementing material. Scanning Transmission Electron Microscopy (STEM) images showed that some sulfates and carbonates are integral part of the precipitate formed by interaction between natural formation brine from Permian Basin and CO2 at different conditions of pressure and temperature. The solid samples observed in the STEM were obtained after centrifugation of the brine sample that interacted with CO2. The supernatant was decanted and discarded. Afterwards, some of the insoluble residue obtained was washed using acetone. The remaining of precipitate was washed with distilled water. Then the liquid was decanted, and the residual solid of the precipitate was put on a specimen support disk, called a grid, approximately 3 mm in diameter. These grids are made of copper. The samples were place into a bell jar vacuum evaporator to cover the specimen with carbon.
Discussion and Results
The experimental laboratory work focused on injection rate, brine composition from the Permian Basin, dolomite core samples. A total of fifteen (15) core samples were selected to be injected simultaneously with brine and CO2 under two injection regimes. The injection tests were designed to detect the effect of CO2/brine on the changes of rock petrophysical properties, and to identify the major mechanisms producing these changes. Low pore volume injection Table 1 summarizes the results of a detailed evaluation of the effects of the CO2/brine injection on permeability, pore volume and porosity of 5 core samples. It should be pointed out that most of the samples show a reduction in permeability of about 50%. An increase of grain volume of about 6% in all the core samples represented a reduction in pore volumes and porosities of about 25%. All five core samples exhibited porosity alteration after CO2/ brine injection. Low injection rate promotes mineral dissolution by weak carbonic acid. The dissolved minerals may have precipitated and occluded the pore throats of the pore spaces. It should be pointed out that a decrease in pore volume and porosity can lead to a decrease in permeabilities. The measurement of T2 distribution of the samples before and after injection of CO2/brine should in principle be indicative of the loss of permeability and porosity once these fluids are in contact with the main mineral components of the porous medium. Table 2 summarizes the main Mo and porosity values calculated on the T2 distribution curves. A comparison between preflood and postflood results with CO2 indicates that the Mo was reduced in all the samples that were displaced at very low injection rate or at low pore volumes. The petrophysical property alteration (PPA) related to NMR porosity was calculated to be from 0.03 to 0.86. This represents a reduction range in porosity from 97% to 13%. The highest reduction in porosity was calculated for samples that were in contact with CO2 for about three (3) months. Table 2 also shows the BVI (small pore sizes) and FFI (large pore sizes) values calculated for the samples injected under very low injection rate or under low pore volume. Significant increase in the small pores (increase in value of BVI) and consequent decrease in the large pores (decrease in value of FFI) were observed after injection of CO2/ brine in the carbonate core samples. The PPA related to BVI indicates that the small pore size amount increased considerably. The values ranged from 14% to 100%. The PPA of FFI indicates a decrease in the big pore size ranging from 0.96 to 0.16, representing a reduction in large

pore sizes from 4% to 84%. Conventional analyses did not show a specific trend to correlate the increase in small pore sizes or the decrease in large pore sizes with permeability or porosity. High pore volume injection The permeability performance for all core samples under injection of high pore volumes of CO2 showed a remarkably similar behavior. The permeability, pore volume and porosity are summarized in Table 3. On average, the petrophysical property alteration related to permeability changed from 1.0 to 1.5, observing a little improvement in permeability after injection of 120 pore volumes of CO2/brine. A notable improvement occurred in pore volume and porosity for all the samples injected under high pore volumes. An enhancement of pore volume was found from 0.5 cc to 3.3 cc. Thus, the porosity increased from 6 % to 36%. T2 distribution for the samples injected at high pore volume was determined before and after injection of CO2/brine. Table 4condenses the total equilibrium nuclear magnetization and porosity results before and after flooding with CO2 of the samples injected at high pore volumes. A detailed evaluation of the Mo shows that, in general, the values were not extensively increased. The porosity values before and after CO2/brine injection are almost the same. Table 4 also summarizes the changes observed in BVI and FFI from T2 distribution. Most the samples presented a very small increment in small pore sizes (BVI) and a reduction in big pore sizes (FFI). In general, the results obtained from these experiments in which CO2/brine were injected at high pore volumes seem to indicate that the petrophysical properties were improved slightly during the tests. The results did not confirm that the carbonic acid enlarged the pores as a consequence of mineral dissolution. Mineralogical composition and structure. XRD powder patterns. All XRD analyses were performed on crushed bulk samples to find the minerals that make up the reservoir rock. Two samples were collected from most of the core samples for the purpose of examining their behavior before and after CO2/brine injection. Figs. 3 presents the diffractograms obtained for the samples before and after CO2/brine injection at very low injection rate or at low pore volumes. The XRD patterns indicated that dolomite and anhydrite peak intensities did not change significantly between post flood and pre flood samples. The behavior in the reflections suggests that the weak acid (H2CO3) formed between brine and CO2 did not cause any dissolution in the sulfate or carbonate minerals present in the samples. There is not apparent reaction among supercritical CO2, brine or the minerals present in the samples; therefore, no new material is observed in the diffraction patterns. In contrast, Fig. 4 shows the patterns derived from powder samples injected at high rate or high pore volumes. The patterns indicated that the samples are predominantly dolomite, and anhydrite with a lesser amount of quartz. Close observations of the samples after treatment with CO2 at high pore volumes did not display any dissolution of either anhydrite or dolomite. It has been stated in the literature8,16 that injection of CO2 into a carbonate reservoir, either limestone or dolomite had produced dissolution of carbonates and sulfates. XRD slide patterns. Fig. 5 depicts XRD diffraction patterns of fine material on the slide samples prior to CO2/ brine injection. They indicated that the dominant minerals in the rock are fine gypsum, anhydrite and quartz. In contrast, XRD diffraction patterns from the slides of fine material obtained after CO2 injection exhibit peaks that are better defined than the peaks observed in the diffraction patterns of original samples, suggesting that an increase in fine material could have occurred in the pore space. Fig. 6 shows the XRD slide patterns of the samples injected at high pore volume shown that the quartz peaks did not show good resolution in the sample postflood, indicating that the quartz was removed from the sample. There is no evidence to support the dissolution of quartz. However, Holloway 4 stated that conditions of high CO2 pressure may cause precipitation of

carbonate cements which may be corrosive and replace detrital grains of quartz. This hypothesis is not yet supported by experimental data. The microscopic structure, the surface and cross- sectional areas of samples were imaged with SEM with working magnification ranged from 100X to 1500X. Figs. 7 and 8 are magnifications of the original sample and the treated sample with CO2. Pore throats are clearly visible among the dolomite grains, which are found with some ultrafine material coating them. Pore sizes vary from 2.5 µm to 5 µm occluded by ultrafine precipitated minerals. Dolomite grain size varies from 10 µm to 40 µm. The aggregates of ultrafine calcite are less than 0.5 µm. The framework of the dolomite grains is covered by ultrafine calcite, and the pore throats are also lined. Calcite was identified in the preflood sample and in the postflood sample through EDS chemical analysis as shown in Figs. 9 and 10. This sample exhibited a reduction in permeability of about 99% and a reduction in pore volume and porosity of 25% at low injection rates. Comparisons between preflood and postflood of the samples under low pore volume injection indicate the presence of ultrafine material formed for the most part by calcite and dolomite in both stages of the samples. However, the postflood sample shows a dolomite network with the interstitial spaces filled with ultrafine material, consisting mainly of particles smaller than 2 µm, which seem to reduce the connections along the pore space; which could be associated with substantial reduction in the petrophysical properties of the sample. BSE imaging (Figs. 11 and 12) was performed on the preflood and postflood sample under high volume injection. Microphotographs of the postflood samples suggest that dissolution of anhydrite (see arrows) may have occurred, creating some small and elongated pores or vugs. It can also be observed that the elongated vugs are filled with very fine calcite and dolomite (oval outline areas for comparison).
Brine chemical Composition The chemical concentration of the initial brine was found in order to evaluate any variation in the concentration of the main cations and anions after interaction with supercritical CO2. For low pore volume injection, Table 5 summarizes the chemical concentration of the ions obtained from analysis of the effluent brine. It can be notices that that there is a representative reduction in TDS, chlorine, and sodium concentrations. The reduction in concentration for these components is calculated to be about 20% of the original value. The calcium concentration decreased from 6.0 g/L to 4.9 g/L, a reduction of 18% from the original concentration. The magnesium concentration was decreased in 14 %, potassium decreased in 20%, and the sulfate ions decreased by 10%. The bicarbonates ions increased by a factor of 2.3 after 48 hours of injection. At the end of the test, a reduction of about 10% took place from the original value. For high volume injection, three effluent chemical concentration analyses were carried out. The results of the laboratory analyses of the brine samples taken during the CO2 floods are summarized in Table 6. The TDS and cation concentrations varied in the same range for all the tests. Furthermore, a similar uniformity in results was observed from test to test. All the effluent brine samples showed the same amount of variation in TDS, chlorine, and sodium about 6%. The level of calcium and sulfate for all the samples was almost constant. Calcium and sulfate decreased in a range from 5% to 9%. Finally, it should be noted that magnesium and bicarbonate were increased. Magnesium showed an increment of about 5%. Bicarbonate ions rose in the first samples of effluent brine after 24 hours of test reaching an increase by a factor of 3. Potassium showed some variation in concentration The pH increased in a range from 2 to 5% in total. An integration of the present results with those obtained from petrophysical analyses, NMR, XRD, and structural changes observed with SEM and BSE suggest that when the brine affected by CO2 is displaced through porous media under a differential pressure, the suspended solids are able to precipitate as a result of any reduction in pressure or increase in temperature. These solids are very small. Consequently, they can be retained easily, bridging and coating the pore space and as a result decreasing the permeability and the porosity.

Also, it was noticed that at the beginning of the tests a significant reduction of calcium, sulfate, and magnesium occurred, followed by an increase in concentration, reaching a constant level at the end of the tests. This pattern could be associated with precipitation of salts from brine at the beginning of the test. Then, dissolution of the rock raised the ion concentrations in the solution. CO2 - brine interaction static tests To evaluate the interaction between supercritical CO2 and brine, several static tests were run. The precipitate formed due to reaction between CO2 and high saline formation brine was examined using the XRD method and the STEM method. The XRD diffraction precipitate patterns shown in Fig. 13 illustrates that the most abundant minerals in the precipitates are formed mainly by gypsum, anhydrite, calcite, aragonite, dolomite and other evaporitic salt minerals. Data from STEM and EDS analyses of the precipitate are consistent with those obtained from XRD. The precipitate analyses (Figures 14 and 15) obtained from the interaction between CO2 and saline brine from Permian Basin under supercritical conditions are comprised mainly of many ultra-fine mineral particles including gypsum, calcite, halite, magnesium sulfate, potassium, and calcium chloride. Supernatant samples obtained from the reaction between CO2/brine/rock were analyzed to investigate the main variations in ion concentrations. Table 5 illustrates the main results obtained for static tests supernatant analyses under supercritical conditions. The brine concentration analyses indicate that the TDS, sodium and chlorine ions decreased by about 3% from the original concentration. Most of the cations decreased except magnesium and potassium, whose levels were stable. Bicarbonate ions increased about eight times from their initial concentration. Calcium and sulfate decreased to a large extent by about 8%. Decrease in calcium and sulfate concentrations suggests that primarily calcite and gypsum were able to precipitate as a result of CO2/ brine interaction. The cation concentration behavior is especially notable because it is a clear indication that salt mineral precipitations took place during the CO2/ brine interaction under supercritical conditions. Some cations and anions decreased as a result of precipitation of some salt minerals as have been identified by XRD and STEM / EDS analyses.
Conclusions
The major reactions observed in this laboratory evaluation were: 1. High reduction in the petrophysical properties, permeability and porosity, was observed under injection of low
pore volumes of CO2/ brine or under very low injection rate. 2. Microscopic observations post CO2/ brine flood demonstrated that the porosity was effectively reduced in some
of the samples as a result of deposition of new material - mainly calcite and gypsum into the pore space. 3. XRD patterns of the original bulk sample confirmed that the mineralogical composition of the formation is
formed mostly by dolomite, anhydrite and lesser amount of quartz. The fine material of the formation is chiefly composed by anhydrite, quartz and some dolomites.
4. XRD patterns of the postflood samples indicated that the dolomite and anhydrite peaks were very defined, indicating that dissolution of these two minerals did not occur.
5. In contrast, the fine material patterns during low injection rate show that deposition of gypsum occurred. It was dehydrated forming bassanite during the treatment of the samples.
6. A little enhancement of the petrophysical properties was observed in samples injected at high pore volumes of injection.
7. After flooding with large amount of CO2/brine, the dolomite and anhydrite peaks of the diffractometer did not show any reduction. Therefore, it can be concluded that dissolution of anhydrite and dolomite did not occur under high injection rate either.
8. The fine material XRD patterns from samples injected under high injection rate suggest dissolution of silica and precipitation of gypsum.
9. The chemical composition analyses of the effluent brine indicate that most of the samples showed reduction in their ion contents. A considerable increment of bicarbonates ions was observed in all the samples as well.

10. In general, it can be concluded that low pore volume of CO2/brine favor the precipitation of new salt minerals that can be trapped into the small pore throats of the samples. In contrast, high injection of CO2/ brine produced dissolution of anhydrite and calcite increasing the bicarbonate, carbonate and calcium ions in the aqueous solution, after dissolution of the minerals, a substantial precipitation of salt minerals might take place, masking the mineral dissolution.

Table 1. Permeability, pore volume and porosity results under low injection rate of CO2/brine Permeability, mD Run
Sample
Before CO2 After CO2 PPA Permeability
Alteration, % 1 4860(1) 3.00 0.02 6x10⁻³ 99.0 1 4861(1) 0.20 0.07 0.35 65.0 2 4868(1) 0.71 0.33 0.46 54.0 2 4878(2) 0.44 0.27 0.60 40.0 4 4871(3) 3.49 2.38 0.68 32.0
Grain volume Pore volume Porosity Run Bulk volume Before
CO2 After CO2
Before CO2
After CO2
PPA Pore volume
Reduction Before
CO2 After CO2
1 82.6 64.6 67.1 17.5 13.1 0.75 25.0 21.3 16.0 1 82.1 66.3 70.0 11.4 8.1 0.71 29.0 14.1 9.9 2 82.9 77.0 78.4 5.9 4.5 0.76 24.0 7.1 5.4 2 82.9 67.1 71.6 14.6 10.1 0.69 31.0 17.8 12.3 4 84.3 66.3 70.0 16.0 12.0 0.77 23.0 21.6 16.2
Table 2. T2 distribution results under low injection rate of CO2/brine
Mo Porosity NMR Run Sample
Before CO2 After CO2 Before CO2 After CO2
PPA Porosity Reduction, %
1 4860(1) 936.84 672.00 7.34 5.27 0.72 28.0 1 4861(1) 1838.38 1529.01 14.50 12.06 0.83 17.0 2 4868(1) 1528.94 48.89 11.95 0.38 0.03 97.0 2 4878(2) 950.17 39.01 7.43 0.30 0.04 96.0 3 4857(4) 2006.83 1596.54 15.91 12.66 0.80 20.0 3 4872(1) 1956.22 1883.41 17.08 16.44 0.96 14.0 4 4857(1) 1873.42 1505.83 14.77 11.88 0.80 20.0 4 4871(3) 1848.683 1638.54 14.20 12.58 0.89 11.0
BVI FFI Run Sample Before CO2
After CO2
PPA BVI
Before CO2
After CO2
PPA FFi
Reduction FFI
1 4860(1) 17.74 39.00 2.20 82.26 61.00 0.74 26.0 1 4861(1) 33.87 50.14 1.50 66.13 49.86 0.75 25.0 2 4868(1) 44.59 91.20 2.10 55.41 8.8 0.16 84.0 2 4878(2) 78.01 89.00 1.14 21.99 11.00 0.50 50.0 3 4857(4) 27.87 45.39 1.63 72.13 54.61 0.76 24.0 3 4872(1) 19.50 23.10 1.19 80.5 76.90 0.96 4.0 4 4857(1) 35.47 47.20 1.33 64.53 52.80 0.82 18.0 4 4871(3) 36.28 65.10 1.79 63.72 34.90 0.55 45.0

Table 3. Permeability, pore volume and porosity results under high injection rate of CO2/brine
Permeability, mD Run Sample Before CO2 After CO2
PPA
Permeability alteration
1 4860(3) 2.60 2.60 1.0 0.0 1 4872 0.50 0.65 1.3 30.0 1 4876(3) 12.89 16.60 1.3 30.0 2 4855(1) 0.167 0.25 1.5 50.0 2 4865(2) 0.200 0.23 1.2 20.0 3 4879(1) 0.400 0.43 1.1 10.0 3 4885(2) 0.250 0.27 1.1 10.0
Grain volume Pore volume Porosity,% Run Sample Bulk Volume Before
CO2
AfterCO2
Before CO2
AfterCO2
PPA Pore
volume Before
CO2
After CO2
PPA Porosity
1 4860 (3) 38.10 33.05 32.48 5.05 5.62 0.98 13 15 1.15 1 4872 67.86 58.05 54.80 9.81 13.06 1.33 14 19 1.36 1 4876 (3) 72.56 43.16 40.13 29.40 32.44 1.10 N/A N/A 1.10 2 4855 (1) 83.46 69.29 68.79 14.17 14.67 1.04 17 18 1.06 2 4865 (2) 82.62 70.26 69.42 12.36 13.20 1.07 15 16 1.07 3 4879 (1) 82.39 66.68 65.36 15.72 17.03 1.08 19 21 1.10 3 4885 (2)** 82.70 74.54 71.09 8.16 11.61 1.42 10 14 1.4
Table 4. T2 distribution results under high injection rate of CO2/brine Mo Porosity NMR Run Sample
Before CO2 After CO2 Before CO2 After CO2 PPA
Porosity 1 4860(3) 1099.94 1087.00 18.7 18.5 1.0 1 4872 976.85 1021.95 4.7 4.8 1.0 1 4876(3) 1489.84 1477.84 29.6 29.6 1.0 2 4855(1) 1327.87 1327.87 23.1 23.1 1.0 2 4865(2) 1239.15 1316.287 23.1 23.1 1.0 3 4879(1) 1760.71 1778.82 31.4 31.4 1.0 3 4885(2) 1372.93 1187.40 24.1 21.0 0.9
BVI FFI Run Sample Before
CO2 After CO2
PPA BVI Before
CO2 After CO2
PPA FFI
1 4860(3) 58.30 59.76 1.03 41.70 40.24 0.96 1 4872 54.90 59.56 1.08 49.10 40.44 0.82 1 4876(3) 22.20 23.20 0.97 77.80 76.80 0.99 2 4855(1) 29.55 29.55 1.00 70.45 70.45 1.0 2 4865(2)* 25.69 42.10 1.64 74.31 57.9 0.77 3 4879(1) 85.27 84.80 0.99 14.73 15.2 1.03 3 4885(2)* 79.53 93.75 1.18 20.47 6.25 0.30

Table 5. Chemical composition of the effluent brine after CO2/brine flooding on core samples under low injection rate Time hrs
TDS g/L
Cl- g/L
Na+-
g/L Ca 2+
g/L −4SO
g/L Mg2+ g/L
K+
g/L −3HCO
mg/L
pH
0 78.51 46.2 18.0 6.00 4.88 1.82 1.51 0.095 6.4 12 79.39 46.7 18.2 6.05 4.60 2.00 1.59 0.250 6.5 48 75.92 44.2 17.7 5.86 4.48 1.93 1.53 0.220 6.7 168 63.69 36.9 14.6 4.90 4.44 1.56 1.20 0.085 6.7
Table 6. Chemical composition of the effluent brine after CO2/brine flooding on Samples under high injection rate Time, hrs TDS
g/L Cl-
g/L Na+
g/L Ca2+
g/L SO4 g/L
Mg2+
g/L K+
g/L HCO3 g/L
pH
0 78.50 46.2 18.0 6.0 4.88 1.82 1.51 0.095 6.4 12 75.75 44.0 18.1 5.77 4.37 1.84 1.52 0.165 6.4 24 72.20 41.7 17.2 5.45 4.34 1.87 1.43 0.215 6.4 36 73.26 42.6 17.5 5.7 4.27 1.56 1.47 0.165 6.5 48 74.81 43.4 17.5 5.89 4.59 1.85 1.44 0.14 6.7 167 74.85 43.5 17.6 5.75 4.47 1.93 1.55 0.05 6.8
Table 7. Chemical concentration of the effluent brine after static treatment with CO2 at supercritical conditions Time, hrs TDS
g/L Na g/L
Cl g/L
Ca g/L
SO4 g/L
Mg g/L
K g/L
HCO3 g/L
pH
0 78.505 46.2 18.0 6.0 4.88 1.82 1.51 0.095 6.4 167 76.300 45.2 17.7 5.5 4.48 1.83 1.51 0.800 6.6
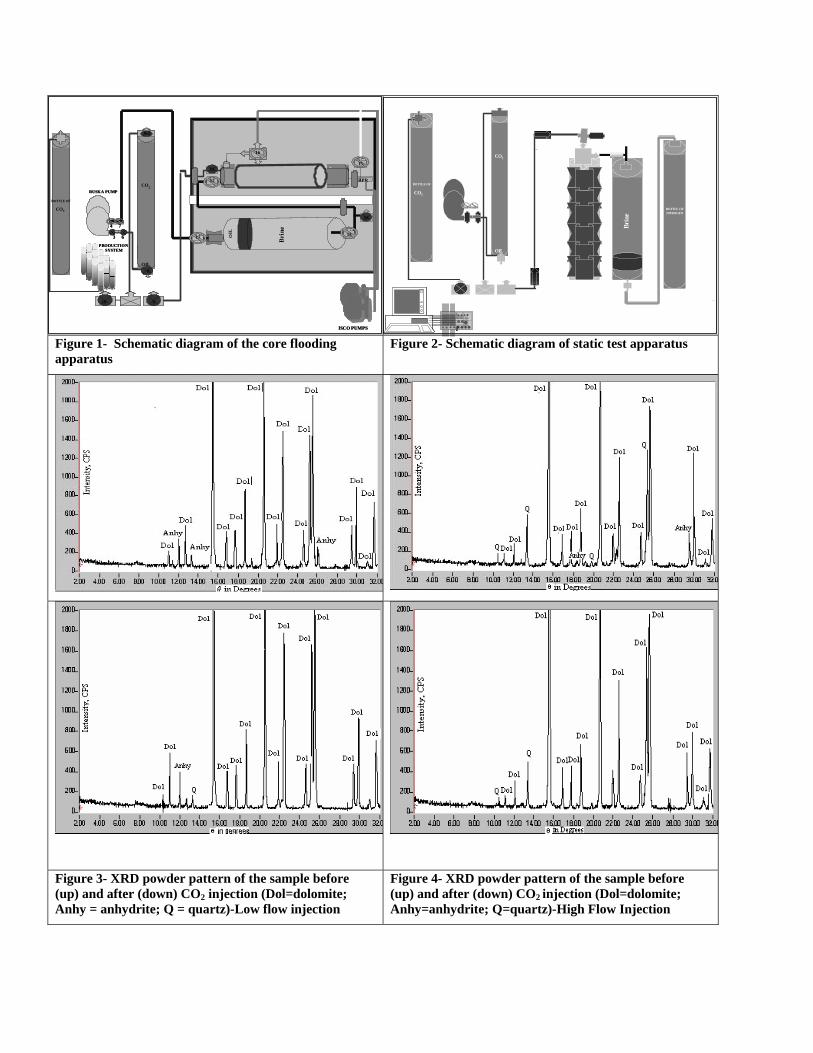
Figure 1- Schematic diagram of the core flooding apparatus
Figure 2- Schematic diagram of static test apparatus
Figure 3- XRD powder pattern of the sample before (up) and after (down) CO2 injection (Dol=dolomite; Anhy = anhydrite; Q = quartz)-Low flow injection
Figure 4- XRD powder pattern of the sample before (up) and after (down) CO2 injection (Dol=dolomite; Anhy=anhydrite; Q=quartz)-High Flow Injection
BOTTLE OF
3 6
CO2
CO2
Bri
ne
BPR
10 9
8.5
11
14
8
17
12
16
OIL
OIL
ISCO PUMPS
4 7
PRODUCTIONSYSTEM
RUSKA PUMP
13
15
BOTTLE OF
3 6
CO2
CO2
Bri
ne
BPR
10 9
8.5
11
14
8
17
12
16
OIL
OIL
ISCO PUMPS
4 7
PRODUCTIONSYSTEM
RUSKA PUMP
13
15
BOTTLE OF
CO2
CO2
Brin
e
OIL
OIL
RUSKA PUMP
BOTTLE OFNITROGEN

Figure 5- XRD slide pattern of the sample before (up) and after (down) CO2 injection (Gyp = gypsum; Anhy = anhydrite; Bass = Bassanite)-Low flow injection
XRD slide pattern of the sample before (up) and after (down) CO2 injection (Dol=dolomite; Anhy=anhydrite; Q= quartz)-High Flow Injection
Figure 7- BSE image of original sample at 500X Figure 8-BSE image of sample treated with CO 2 at
500X
Calcite/Dolomite Calcite
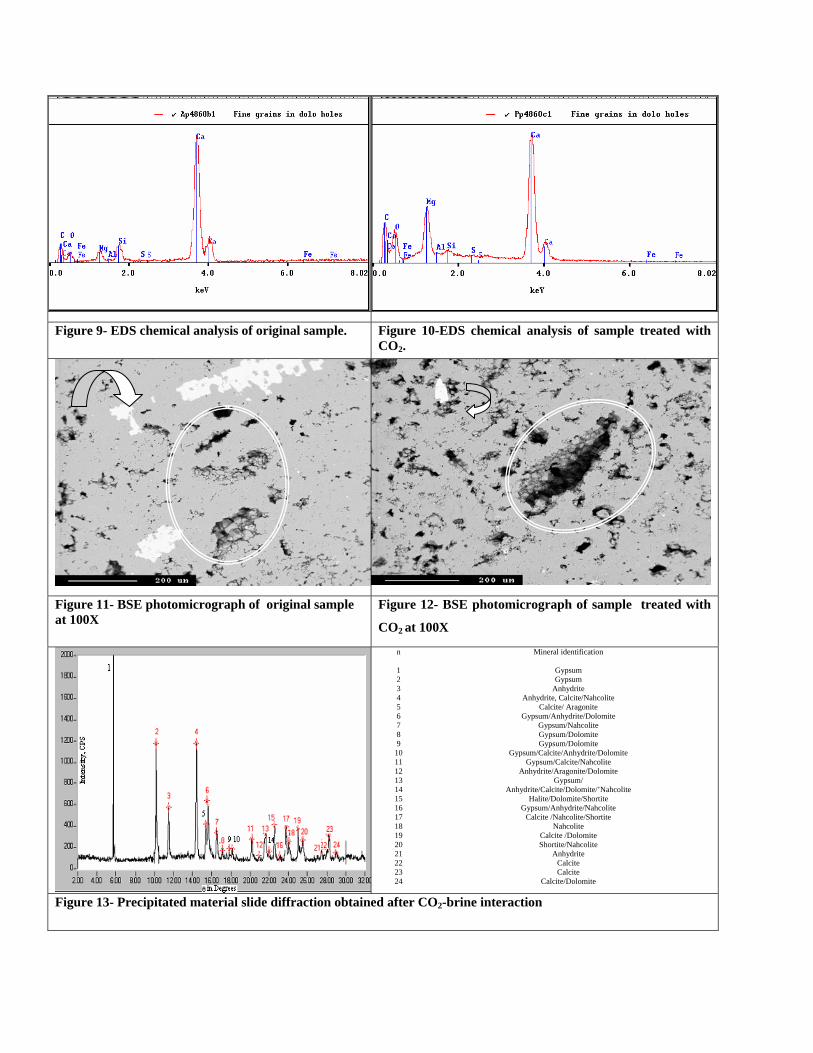
Figure 9- EDS chemical analysis of original sample. Figure 10-EDS chemical analysis of sample treated with CO2.
Figure 11- BSE photomicrograph of original sample at 100X
Figure 12- BSE photomicrograph of sample treated with
CO2 at 100X
n Mineral identification 1 Gypsum 2 Gypsum 3 Anhydrite 4 Anhydrite, Calcite/Nahcolite 5 Calcite/ Aragonite 6 Gypsum/Anhydrite/Dolomite 7 Gypsum/Nahcolite 8 Gypsum/Dolomite 9 Gypsum/Dolomite 10 Gypsum/Calcite/Anhydrite/Dolomite 11 Gypsum/Calcite/Nahcolite 12 Anhydrite/Aragonite/Dolomite 13 Gypsum/ 14 Anhydrite/Calcite/Dolomite/’Nahcolite 15 Halite/Dolomite/Shortite 16 Gypsum/Anhydrite/Nahcolite 17 Calcite /Nahcolite/Shortite 18 Nahcolite 19 Calcite /Dolomite 20 Shortite/Nahcolite 21 Anhydrite 22 Calcite 23 Calcite 24 Calcite/Dolomite
Figure 13- Precipitated material slide diffraction obtained after CO2-brine interaction

`
Figure 14- STEM image and EDS chemical analysis of the precipitated calcite, halite, gypsum and magnesium_ potassium sulfate salts above supercritical conditions

REFERENCES
1. Bachu, S., Gunter, W.D., and Perkins, E.H.: “Aquifer Disposal of CO2: Hydrodynamic and Mineral trapping,”
Energy Conversion and Management (1994) 35, 269-279. 2. Rochelle, C.A., Pearce, J.M., and Holloway, S.: “The Sequestration of Carbon Dioxide: Containment by
Chemical Reaction in the Deep Geosphere,” Chemical Containment of Waste in the Geosphere, Geological Society Special Publication, London (1999) No. 157, 177-129.
3. Holloway, S and Vander Straaten,R.: “ The Jole II Project. The Formation Disposal of Carbon Dioxide,” (1995), 36, No, 6-9, 519-522.
4. Holloway, S.: “An Overview of the Joule II Project: The Formation Disposal of Carbon Dioxide,” Energy Conversion Management (1996), 37, No.6-8, 1149-1154.
5. Henry, R.L., Feather, G.L., and Smith, L.R.: “Utilization of Composition Observation Wells in a West Texas CO2 Pilot Flood,” Paper SPE 9786 presented at the 1981 SPE/DOE Second Joint Symposium on Enhanced Oil recovery, Tulsa OK, and 5-8 April.
6. Mathis, R.L., and Sears, S.O.: “: Effect of CO2 Flooding on Dolomite Reservoir Rock Denver Unit, Wasson (San Andres) Field, TX,” paper SPE 13132 presented at the 1984 in the 59th Annual Technical Conference and Exhibition, Dallas, TX, 16-19 September.
7. Hager, R.C and Hermance, W.C.: “The Effect of Waterflooding on Reservoir Properties and Producing Operations: Applications for Geochemical Model,” paper SPE 1966 presented at the 1989 in the 64th Annual Technical Conference and Exhibition, San Antonio, TX, 8-11 October.
8. Svec, R.K., and Grigg, R.B.: “Physical Effects on WAG Fluids on Carbonate Core Plugs,” paper SPE 71496 presented at the 2001 SPE Annual Technical Conference and Exhibition, New Orleans 30 September and 3-Ocotober.
9. Warren, John K.: Evaporites: Their Evolution and Economics. Blackwell Science Ltd, Oxford, London (1999) 10. Garcia-Orrego, G.S., “Issues of Engineering and Geochemistry in the Sequestration of CO2 in Geological
Formations-Saline Aquifers,” Dissertation Texas Tech, Lubbock, TX (May 2004). 11. Meilboon, S. and Gill, D.: “Modified Spin-echo Method for Measuring Nuclear Relaxation Times,” Scientific
Instrument (1958), 29, 688-691. 12. Mail, A. and Kantzas, A.:” On the Characterization of Carbonate Reservoirs Using Low Field NMR Tools,”
paper SPE 75687 presented at the 2003 SPE Gas Technology Symposium , Calgary Canada, 30 April and 2 May.
13. Coates, G.R., Xiao, L., and Prammer, M.G.: NMR Logging. Principles and Applications, Halliburton Energy Services Publications, Houston (1999).
14. Logan, W.D., Horkowitz, J.P., Laronga, R., and Cromwell, D.W.: “Practical Applications of NMR Logging in Carbonate Reservoir,” Paper SPE 51329 presented at the 1998 Reservoir Evaluation and Engineering, San Antonio, Texas, 3-6 October.
15. Omole, O and Osoba, J.S.: “Carbon Dioxide-Dolomite Rock Interaction during CO2 Flooding Process,” paper Petroleum Society of CIM 83-34-17 presented at the 1983 in the 34th Annual Technical Meeting of the Petroleum Society of CIM held in conjunction with the Canadian Association of Drilling Engineers, Banff, Canada, 10-13 May.