sequence stratigraphy past, present and future; and the
TRANSCRIPT

3722nd Annual Gulf Coast Section SEPM Foundation Bob F. Perkins Research Conference—2002
Sequence Stratigraphy Past, Present and Future,and the Role of 3-D Seismic Data
Posamentier, Henry W. Anadarko Canada Corporation
425 1st Street SWCalgary, Alberta T2P 4V4Canadae-mail: [email protected]
AbstractIn the twenty-five years since the landmark publication of AAPG Memoir 26 and later,
SEPM Special Publication 42, the concepts of sequence stratigraphy have evolved rapidly.This discipline, an outgrowth of seismic stratigraphy, has spread far beyond applications to2-D seismic data alone. Sequence stratigraphy has seen applications embracing data sets rang-ing from biostratigraphic to geochemical to physical oceanographic, and from borehole tooutcrop, and finally, coming full cycle, to 3-D seismic data. Initially the domain of industrygeoscientists, sequence stratigraphy has gained widespread acceptance among geoscientists inall professions, having been recognized as an approach that facilitates integration of a broadrange of disciplines.
The evolution of sequence stratigraphic concepts is far from complete. In particular,recent increased availability of high-quality 3-D seismic coverage promises to provide insightsthat will lead to further fine tuning of sequence concepts. In addition to enhanced 2-D profiles,3-D seismic data afford exceptional plan views of the subsurface that in the past could only beinferred. These plan view images now comprise a fundamental starting point from which geo-logic analyses and interpretation can begin. Such images depict paleo-landscapes, which canbe analyzed using time-honored principles of geomorphology, leading to the development ofthe discipline of seismic geomorphology. When used in conjunction with seismic stratigraphy,seismic geomorphology can significantly enhance sequence stratigraphic interpretations.
The identification of depositional elements such as channels, valleys, shore faces, shelfridges, etc., in plan view, can be integrated with seismic stratigraphic analyses of associatedseismic profiles to calibrate profile reflection patterns and refine analyses of basin fill histo-ries. Systematic seismic geomorphologic analysis of 3-D seismic volumes can bring to lightspatial and temporal relationships of successive depositional systems. Moreover, recognitionof these systems and analyses of their succession can help in the identification of possiblemissing facies tracts. This approach, coupled with direct and indirect recognition of unconfor-mities, comprises an integral aspect of sequence stratigraphic interpretation.
IntroductionSince the 1970s, the concepts of sequence stratigraphy have become widely accepted by
the geological community and have been applied to a broad range of data bases, including con-ventional and high resolution seismic data, wireline logs, outcrops, cores, paleontologic, andgeochemical data. Much has been written recently about sequence stratigraphy, and numerouspapers in the recent literature have applied these concepts or a variation of them (e.g., Einseleet al., 1991; MacDonald, 1991; Posamentier et al., 1993; Dalrymple et al., 1994; Johnson,

Posamentier
38
1994; Weimer and Posamentier, 1993; Saito et al., 1995; Van Wagoner and Bertram, 1995).The sequence stratigraphic approach has been applied to rocks ranging in age from Protero-zoic (Christie-Blick et al., 1988) to the modern (Posamentier et al., 1992).
Modern sequence stratigraphic concepts can be traced to the work of the Europeanstratigraphers who in the late 19th century subdivided sedimentary rocks into discrete unitsseparated by surfaces representing abrupt changes or breaks in sedimentation. These rock suc-cessions were formally defined as unconformity-bounded stages. At about the same time,Suess (1904) introduced and expounded on the concepts of eustasy and global controls onunconformities.
Subsequently, Wheeler and Murray (1957), Wheeler (1959), Weller (1960), and Sloss(1962, 1963), recognized the significance and utility of correlating time synchronous surfacesacross geological sections and further refined these concepts. Their application of chronos-tratigraphy to stratigraphic analysis in many instances yielded better insights than thoseavailable from the more conventional lithostratigraphic approach prevalent among stratigra-phers at that time. Many of the notions that these workers developed can readily be re-cast intowhat we now refer to as sequence stratigraphy.
The approach Wheeler, Weller, and Sloss championed did not take root with the geo-logic community to the extent that modern sequence stratigraphy has, because they weremissing one critical ingredient that did not become available until the late 1960s and 1970s.This ingredient was high-quality, multi-channel seismic reflection data. With these data, geo-scientists could obtain continuous physical stratigraphic images of the subsurface that allowedthem to minimize some of the major leaps of faith previously required of stratigraphic correla-tions. Thus was born modern seismic stratigraphy.
The Past
Seismic stratigraphy involves the stratigraphic interpretation of seismic data. In the land-mark publication AAPG Memoir 26, Peter Vail and his colleagues at Exxon ProductionResearch Co. (Vail et al., 1977) observe that detailed stratigraphic information could be inter-preted from seismic data. In fact, relatively sophisticated stratigraphic insights could begleaned from such data. The fundamental assumption upon which Vail and his colleaguesbased their work is that seismic reflections approximate time correlative surfaces (Vail et al.,1977). They argue that since seismic reflections follow time lines, then seismic data depictstratal architecture, albeit at low resolution. Patterns of stratal discontinuities as defined byseismic reflection terminations are interpreted, and their geologic significance is establishedthrough integration of available borehole data. Seismic facies interpretation is based on obser-vations of seismic reflection terminations as well as reflection character (e.g., continuity,amplitude) from 2-D seismic reflection data (Fig. 1).
These seismic stratigraphic observations suggested that a distinct cyclicity was presentwithin lithologic successions, and moreover, that similar patterns of cyclicity existed withinthe same chronostratigraphic intervals in different sedimentary basins around the world. Theyargued that to account for such apparent global synchroneity of events, a globally effectivecausal mechanism must be active. It was proposed that this mechanism comprised cyclic vari-ations in global sea level; i.e., eustatic cycles. Hence, the first seismic-based global eustaticcurves were published (Vail et al., 1977). At this time also, Pitman (1978) observed that therates of sea-level change exerted significant control on stratal architecture. These global sea-level curves were characterized by cyclicity at several different orders of magnitude. The glo-bal synchroneity of stratigraphic cycles, however, has been the subject of debate in recentyears and remains a matter of some disagreement (Miall, 1992, 1994, 1995).

Sequence Stratigraphy Past, Present and Future, and the Role of 3-D Seismic Data
39
Figure 1. Dip-oriented seismic reflection profile across a delta plain. Toplapping and downlapping reflectionterminations define depositional sequence boundaries in the sense of Vail et al. (1977).
The cyclic deposits that formed the basis for the interpretation of sea-level cyclicitywere referred to as depositional sequences (Mitchum, 1977). The surfaces that were chosen todefine the boundaries of these sequences were stratal discontinuities defined by seismically-expressed reflection terminations (i.e., onlap, downlap, toplap, and erosional truncation).These discontinuities were inferred to represent unconformity surfaces. This approach wasconsistent with the ideas of the early European stratigraphers (e.g., Stille, 1924). Where asequence boundary was traced laterally to a point where no hiatus exists (i.e., the strata areconcordant and conformable) a correlative conformity marked the expression of the sequenceboundary (Mitchum et al., 1977). The emphasis of Vail et al. (1977) was on regional as well asglobal correlations of discrete cyclic stratigraphic units and their relationship to eustaticchange. Less emphasis was placed on lithologic predictions within depositional sequences.
The authors of initial publications on seismic and, later, sequence stratigraphy selectedunconformities and their correlative surfaces to subdivide sediment cycles into depositionalsequences (Vail et al., 1977); such cyclic stratigraphic units were given the name “sequence.”This usage was consistent with that proposed by Sloss (1962), although Sloss’s sequenceswere commonly significantly larger in scale and did not include the notion of the correlativeconformity.
5 km
500 msec
“Depositional Sequence”
Top-DwnOblique

Posamentier
40
The Present
The next quantum jump was the introduction of sequence stratigraphy with the publica-tion of the SEPM Special Publication 42 (Wilgus et al., 1988), wherein the link between thestratal architecture of sequences and relative sea-level change was analyzed (Cross, 1988;Jervey, 1988; Plint, 1988; Posamentier et al., 1988; Posamentier and Vail, 1988). These papersalso argued that sequence stratigraphic concepts, built around the notion of the interaction ofsediment supply and sediment accommodation (i.e., the space available for sediment to accu-mulate) applied not only to conventional seismic scale data but also to smaller-scale data setssuch as outcrop and borehole data (Fig. 2). The applicability of sequence concepts to outcrop,borehole, and core data was subsequently demonstrated in Van Wagoner et al. (1990).
Figure 2. Sequence stratigraphic interpretation of the Panther Tongue Member of the Star Point Formationnear Helper, Utah. The sequence boundary and transgressive surface of erosion are annotated on both the out-crop photo as well as the wireline log. The stratigraphic unit bounded by these two surfaces constitutes part ofa lowstand systems tract.
Panther Tongue SSPanther Tongue SSSBSB
1400 ft1400 ft
1500 ft1500 ft
1600 ft1600 ft
1700 ft1700 ft
1800 ft1800 ft
Master SB?Master SB?
TSETSE
SBSB
TSETSE
40 ft(12 m)
Gamma Ray0 150
Panther Tongue SSPanther Tongue SSSBSB
1400 ft1400 ft
1500 ft1500 ft
1600 ft1600 ft
1700 ft1700 ft
1800 ft1800 ft
Master SB?Master SB?
TSETSEPanther Tongue SSPanther Tongue SS
SBSBSBSB
1400 ft1400 ft
1500 ft1500 ft
1600 ft1600 ft
1700 ft1700 ft
1800 ft1800 ft
Master SB?Master SB?Master SB?Master SB?
TSETSETSETSE
SBSB
TSETSE
40 ft(12 m)
Gamma Ray0 150

Sequence Stratigraphy Past, Present and Future, and the Role of 3-D Seismic Data
41
The focus of sequence stratigraphy shifted more to prediction of lithology using inte-grated data bases, and less towards age model prediction. Subsets of sequences (i.e., systemstracts) were defined and quantitatively related to variations of relative sea level, sediment flux,and physiography (Fig. 3). Many variations on the general sequence stratigraphic theme wererecognized, such as the concept of forced regression and the application of sequence strati-graphic concepts to fluvial deposits and deep-water settings were presented.
Integration of data sets has become the hallmark of sequence stratigraphic analyses (e.g.,Fig. 2). The use of small scale models as well as modern analogs has further improved theunderstanding of how depositional systems evolve under the influence of changing sea leveland sediment flux (Fig. 4).
The Future
Sequence stratigraphy is and always will be grounded in rock data. The comprehensiveintegration of core, outcrop, and borehole data, with seismic data long has proven to yield thebest overall geological interpretations. With the advent of widely available 3-D seismic reflec-tion data geoscientists have been able in many instances to move the accuracy of suchinterpretations to a new and higher level. 3-D seismic volumes yield plan view images of thesubsurface to complement 2-D vertical profiles and consequently bring a different perspectiveto bear on geologic investigations. Plan view images can comprise seismic reflection horizonattributes, such as amplitude, time/depth structure, dip azimuth, dip magnitude, curvature, androughness. Or, they can be of interval attributes such as amplitude distribution, frequency, andseismic waveform facies. Images can be displayed as a two-dimensional map or as a three-dimensional perspective view. These images depict depositional elements in map view and,when interpreted in conjunction with seismic profiles, yield valuable insight as to lithologicdistribution, and temporal and spatial relationships of stratigraphic units. Missing facies tractscan be inferred, and stratigraphic compartmentalization can be predicted. Under certain cir-cumstances, new exploration play types can be identified.
Figure 3. Interrelationships of key parameters associated with basin-fill architecture(Posamentier and Allen, 1999).
SedimentSupply
Tectonics
Paleogeography
ProcessesSedimentary
Eustasy Total Subsidence/Uplift
CrustalCooling
SedimentCompaction
Tectonics Loading
Isostatic Flexural
Stream Piracy
Vegetation FluvialDischarge
Climate
Substrate andProvenanceLithology
EnvironmentalEnergy
Stratigraphic Architecture
RelativeSea Level
Physiography
Climate

Posamentier
42
Horizon Attributes
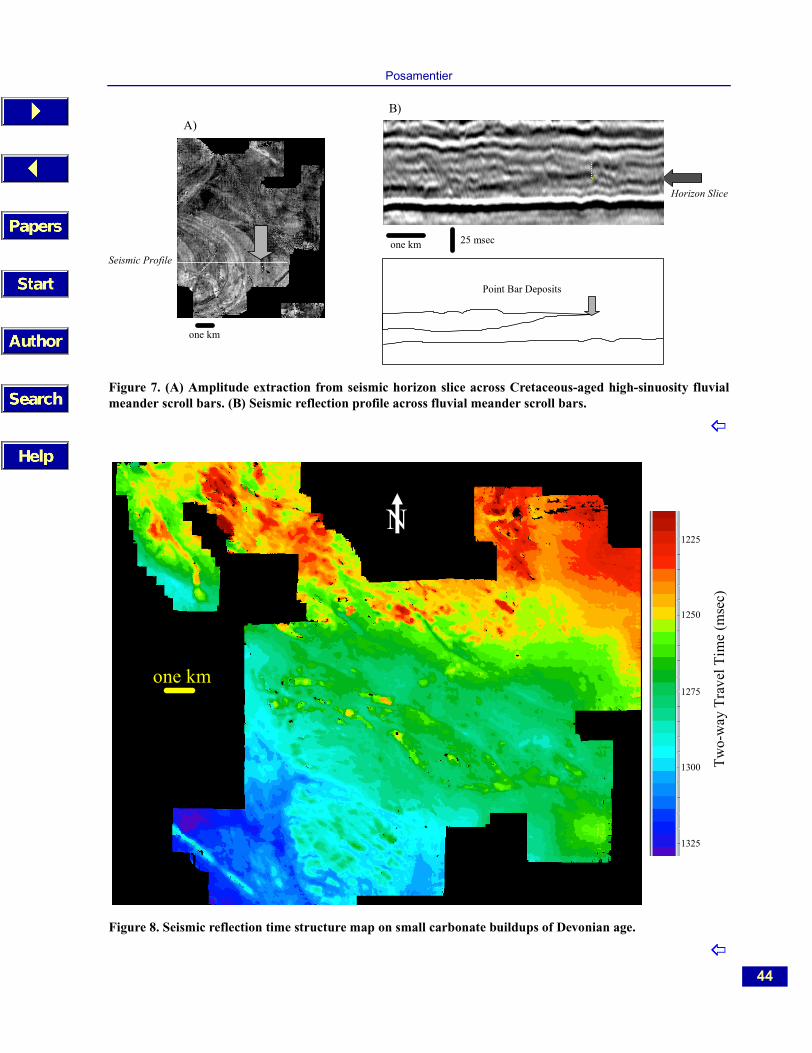
Seismic reflections, or horizons, can be characterized on the basis of their reflectionamplitude and their structure. Reflection amplitude maps represent the seismic response pri-marily to variations of lithology and fluid type, and, to a lesser extent, bed thickness. Wheresharp lithologic edges exist, discrete depositional elements can be imaged (Fig. 5). Deposi-tional elements with gradational edges, such as the trailing edge of a migrating shelf ridge(Fig. 6), are more difficult to identify. Horizon slices, which are produced by flattening on areference horizon and then generating a time slice volume, can yield valuable insights wherediscrete reflections within an interval of interest lack sufficient continuity and therefore can bedifficult to correlate regionally with confidence (Fig. 7).
Time structure maps can effectively recreate the “lay of the land” in the absence of post-depositional tectonic movements, and highlight the relief associated with discretedepositional elements (Fig. 8). The same surface, when examined in 3-D perspective viewcan yield additional insights (Fig. 9). Figure 10 illustrates a section and 3-D perspective viewof an unconformity surface highlighting the presence of a fluvial system there.
Figure 4. Small-scale deltaicsystem illustrating the effectsof “sea-level” fall. When “sealevel” was high, an inner shelfhighstand delta formed;when “sea level” was low, anincised valley linked with anouter shelf delta formed.During time of lowstand, sed-iment bypass characterizedthe inner shelf (fromPosamentier et al., 1992).

Sequence Stratigraphy Past, Present and Future, and the Role of 3-D Seismic Data
43
Figure 5. Network of Cretaceouschannels, southern Alberta,imaged on amplitude extractionfrom seismic horizon slice. Chan-nel edges are well defined inresponse to sharp lithologic con-trasts that characterize the chan-nel fill/over bank contact. Thetiming of channel formation can bedetermined from analysis of cross-cutting relationships.
one km
N
Figure 6. Amplitude extraction of seismic reflectionillustrating shelf ridge characterized by steep,sharply delineated leading edge, and poorly delin-eated trailing edge. Migration direction across thetransgressed sea floor inferred to be from east towest (Posamentier, 2002).
one km
Leading Edge(well-defined)
Trailing Edge(poorly-defined)
N
one kmone km
Leading Edge(well-defined)
Trailing Edge(poorly-defined)
N
Posamentier
44
Figure 7. (A) Amplitude extraction from seismic horizon slice across Cretaceous-aged high-sinuosity fluvialmeander scroll bars. (B) Seismic reflection profile across fluvial meander scroll bars.
Figure 8. Seismic reflection time structure map on small carbonate buildups of Devonian age.
Horizon Slice
one km 25 msec
Point Bar Deposits
one km
A)B)
Seismic Profile
one km
Two-
way
Tra
vel T
ime
(mse
c)
N
1250
1225
1275
1300
1325

Sequence Stratigraphy Past, Present and Future, and the Role of 3-D Seismic Data
45
Figure 9. 3-D perspective view on carbonate buildups shown in Figure 8.
Figure 10. 3-D perspective view (A) and seismic section (B) across base Cretaceous unconformity separatingCretaceous clastic sediments from underlying Paleozoic carbonate sediments, south-central Alberta. Note thefluvial drainage system etched into the Paleozoic carbonates.
N
one km
Cretaceous
Devonian
A)
B)
20 m
sec
one km
N
one km

Posamentier
46
Note that although the presence of an unconformity could be readily determined from thereflection terminations apparent in the section view, the plan view image details the deposi-tional elements that overlie this surface. Analysis of dip magnitude and dip azimuth canemphasize the physiography and the structural grain respectively (Fig. 11). In these images,the dip magnitude map depicts the angle of dip across each 3 x 3 (in-line and cross-line) area,and the dip azimuth map depicts the direction each 3 x 3 area faces, yielding a pseudo-reliefmap. Another view of the same depositional features is illustrated in Figure 12, where surfacecurvature and roughness are shown. Curvature maps describe the magnitude of curvatureacross each 3 x 3 area and the roughness map describes the degree of irregularity across each3 x 3 area. Each of these attributes shows the same features but each highlights differentnuances, the combination of which yields the most robust interpretation.
Figure 11. Dip magnitude (A) and dip azimuth (B) maps on seismic refection at top of carbonate buildupsshown in Figure 8 (compare with Fig. 12).
Figure 12. Reflection curvature (A) and roughness (B) maps on seismic refection at top of carbonate buildupsshown in Figure 8 (compare with Fig. 11).
one km
one km
A) B)
one km
Dip(Degrees)
DipAzimuth
NN 0
9
0
360
180
A) B)
one km
N
one km
N
Cur
vatu
re
0
Conc
ave
upCo
nvex
up
Rou
ghne
ssH
igh
Low

Sequence Stratigraphy Past, Present and Future, and the Role of 3-D Seismic Data
47
When used in conjunction with 2-D profiles, 3-D perspective views (Fig. 13A) can bepowerful tools for interpreting a succession of depositional events. Figure 13 illustrates aPleistocene shelf to slope transition. A shelf edge protuberance can be observed on a time slice(Fig. 13D) and a progradational geometry can be observed on a dip transect (Fig. 13B). Thelinear features oriented parallel to dip (Fig. 13A) are interpreted as mass transport grooves, andtheir presence at the basal boundary of overbank levees (Fig. 13D) suggests that mass transportprocesses were active just prior to levee formation within a single deep-water depositionalepisode.
Interval Attributes
Interval attributes describe the acoustic characteristics of a seismic interval. Two exam-ples of interval attribute maps are illustrated in Figures 14 and 15. Analyses of intervalattributes are especially useful for imaging features that are associated with discontinuous, dif-ficult to correlate seismic reflections. Where seismic reflections are discontinuous, an intervalbracketing potential features of interest can be created using horizontal time slices or horizonslices referenced to more readily interpretable seismic reflections, and then amplitude, fre-quency, waveform attributes and other acoustic characteristics can be analyzed.
Seismic facies mapping using 3-D seismic data bears little resemblance to seismic faciesmapping based on 2-D seismic data (Fig. 16). With 3-D seismic data it is possible, throughneural network algorithms, to classify individual traces into groups (i.e., seismic faciesclasses) based on similar waveform characteristics. Figure 17 illustrates a seismic facies mapof a Miocene distributary channel offshore northwest Java. The facies mapping highlights theheterogeneity of the channel fill. This heterogeneity is subsequently calibrated by boreholeinformation tied to the seismic data. Figure 18 illustrates another seismic facies map of aporosity trend. In this instance, the facies map cannot discriminate between the poor porosityof the eastern part of the trend from the excellent porosity of the western part of the trend. Bothareas belong to the same facies class (i.e., facies class 10). However, mapping the correlationbetween each individual trace with seismic facies class 2 brings out the contrast betweenexcellent and poor porosity facies.
Utility of 3-D-Based Seismic Geomorphological and Stratigraphic Analyses
Prediction of lithology as well as reservoir compartmentalization is greatly enhanced asa result of 3-D seismic analyses. 3-D seismic volumes enable the direct recognition of deposi-tional elements through the integration of plan view images with vertical seismic profiles. Thebest imaging of depositional elements will be at shallow burial depths where seismic resolu-tion is relatively high. With increased depth of burial, seismic resolution diminishes anddepositional elements are progressively more difficult to clearly image. Consequently, seismicgeomorphological and stratigraphic analyses have a dual purpose: (1) well-imaged deposi-tional elements at shallow burial depths provide excellent analogs for more deeply buriedexploration targets, and (2) direct imaging of depositional elements at exploration depths helpmitigate risks associated with prediction of reservoir and seal lithologies. Examples of shal-low-buried analogs are shown in Figure 19.

Posamentier
48
Figure 13. 3-D perspective view of outer shelf and upper slope offshore Louisiana (A), with time slice (D) and vertical profiles (B and C). A linked shelfedge delta and deep-water channel can be observed. The delta is characterized by a shoreline protuberance (D) and clinoform reflection geometry (B).The deep-water system is characterized by a channel-levee complex (C). The grooves at the base of the levee (C) are oriented parallel to dip (A) and areinterpreted to be caused by mass movement processes.
A
A’
12
3
Line 1
Line 2
Line 3100 msec1 km
one km
100 msecA’A
A)
C)D)
B)
Levee
Shoreline Protuberance
N
N
one km
Seaward (Canyon Axis)
2 km

Sequence Stratigraphy Past, Present and Future, and the Role of 3-D Seismic Data
49
Figure 15. Interval attribute map illustrating peak amplitudes from an 80 msec interval across two smallDevonian-aged pinnacle reefs from southern Alberta.
Figure 14. Interval attribute mapillustrating cumulative amplitudesacross a Cretaceous distributary chan-nel in south-central Alberta. Thisattribute is a measure of the ampli-tude strength of an interval and theextent to which the total amplitude isweighted towards the upper or lowerboundary of the interval selected. Thelineaments within the channel areinterpreted as side bars within thechannel. Well data indicates that thechannel is filled with up to 35 m ofsandstone. Two smaller channels canbe observed to crosscut the largerNNW-SSE oriented channel and areinterpreted to be younger in age.
one km
Per c
ent o
f max
imum
am
plitu
de
N 0
38
20
30
10
Am
plitu
de
N
one km
5000
15000
10000
20000

Posamentier
50
Figure 17. Seismic facies map (A) and associated facies classes (B) of a 30 msec interval across a Miocene dis-tributary channel offshore northwest Java. Colors represent facies classes. Facies analysis was conducted alongthe isolated channel trend only. The seismic facies distribution within the channel suggests a heterogenous litho-facies. The fault crossing the channel seems to have had an influence on channel fill as illustrated by the markedchange from predominance of classes 1-3 on the west side of the fault to classes 7-10 on the east side.
Figure 16. Seismic facies map based on 2-Dseismic data from Frigg Field, North Sea(from McGoveny and Radovitch, 1985).
Seismic Facies Classes
A)
B)one km
N
10 msec
Fault

Sequence Stratigraphy Past, Present and Future, and the Role of 3-D Seismic Data
51
Figure 18. (A) Seismic facies map for an interval across a linear porosity trend. Colors represent facies classes.
(B) Map of correlation values between each individual trace and class 2. Hot colors represent high correlation
values; cold colors represent low correlation values. The porosity is better developed on the left side of the lin-
ear trend. However, whereas the seismic facies map does not allow for differentiation of porosity between the
left and right portions of the trend (A), the correlation map does (B), highlighting the highest porosity areas on
the left side of the trend.
Conclusions
Revitalization and continued evolution of sequence stratigraphic concepts will occur
through the integration of such disciplines as seismic geomorphology, seismic stratigraphy,
biostratigraphy, and chemostratigraphy. Because of the inherent flexibility imbedded into the
sequence stratigraphic concepts, sequence stratigraphy remains evergreen and continually
evolving. With the advent of widely available 3-D seismic data, spatial and temporal relation-
ships between depositional elements will become clearer resulting in enhanced geologic
interpretations. The emphasis on plan view imagery enables the development of seismic geo-
morphology as a discipline to be used in conjunction with more classical stratigraphic
analyses. Interpretation techniques such as seismic facies analysis have taken on new signifi-
cance when applied to 3-D seismic volumes. In some instances, sequence stratigraphic models
will be modified and improved (Posamentier, 2001; Posamentier, 2002). In this way, seismic
stratigraphy and sequence stratigraphy will benefit from seismic geomorphological analyses
and will be elevated to new levels. The development of scientific analyses based on new types
of data, which we cannot even now anticipate, assures us that sequence stratigraphy will con-
tinue to evolve and be refined well into the future and remain a backbone for the study of
sedimentary rocks.
A) B)
one km
N

Posamentier
52
Figure 19. (A) Amplitude extraction from seismic time slice of Pleistocene incised valley with fluvial system atbase, offshore northwest Java (Posamentier, 2001). Tributary incised valleys can be observed cutting into asso-ciated interfluve settings. (B) Dip azimuth map of seismic reflection from top of Pleistocene channel-levee com-plex at shallow burial depth in ultra-deep water offshore Borneo, Makassar Strait, Indonesia. Channel andassociated levees with sediment waves can be observed.
five km
A)
B)
five kmN
N
DipAzimuthSeaward
360
0
180

Sequence Stratigraphy Past, Present and Future, and the Role of 3-D Seismic Data
53
ReferencesChristie-Blick, N., J.P. Grotzinger, and C.C. von der Borch, 1988, Sequence stratigraphy in Proterozoic succes-
sions: Geology, v. 16, p. 100-104.Cross, T.A., 1988, Controls on coal distribution in transgressive–regressive cycles, upper Cretaceous, western inte-
rior, U.S.A., in C.K. Wilgus et al., eds., Sea-Level Changes: An Integrated Approach: SEPM Special Publi-cation 42, p. 371-380.
Dalrymple, R.W., B.A. Zaitlin, and R. Boyd, eds., 1994, Incised Valley Systems: Origin and SedimentarySequences: SEPM Special Publication 51, 391 p.
Einsele, G., 1991, Sedimentary Basins; Evolution, Facies, and Sediment Budget: Berlin, Springer-Verlag, 628 p.Jervey, M.T., 1988, Quantitative geological modeling of siliciclastic rock sequences and their seismic expression, in
C.K. Wilgus et al., eds., Sea-Level Changes: An Integrated Approach: SEPM Special Publication 42, p. 47-69.Johnson, S.D., ed., 1994, High Resolution Sequence Stratigraphy: Innovations and Applications, March 28–30,
1994: Abstract Volume, University of Liverpool, U.K., 410 p.MacDonald, D. I. M., 1991, Sedimentation, tectonics and eustasy; sea-level changes at active margins: International
Association of Sedimentologists Special Publication 12, 518 p.McGovney, J.E., and B.J. Radovitch, 1985, Seismic stratigraphy and facies of the Frigg Fan complex, in , O.R. Berg
and D.G. Woolverton, , eds., Seismic Stratigraphy II: an Integrated approach to hydrocarbon exploration:AAPG Memoir 39, p. 139-154.
Miall, A.D., 1992, Exxon global cycle chart: an event for every occasion?: Geology, v. 20, p. 787-790.Miall, A.D., 1994, Sequence stratigraphy and chronostratigraphy: problems of definition and precision in correla-
tion, and their implications for global eustasy: Geoscience Canada, v. 21, p. 1-26.Miall, A.D., 1995, Whither stratigraphy?: Sedimentary Geology, v. 100, p. 5-20.Mitchum, R.M., Jr., 1977, Seismic stratigraphy and global changes of sea level, part 1: glossary of terms used in
seismic stratigraphy, in C.E. Payton, ed., Seismic Stratigraphy—Applications to Hydrocarbon Exploration:AAPG Memoir 26, p. 117-143.
Mitchum, R.M., Jr., P.R. Vail, and J.B. Sangree, 1977, Seismic stratigraphy and global changes of sea level, part 6:stratigraphic interpretation of seismic reflection patterns in depositional sequences, in C.E., Payton, ed.,Seismic Stratigraphy—Applications to Hydrocarbon Exploration: AAPG Memoir 26, p. 117-133.
Pitman, W. C., III, 1978, Relationship between eustacy and stratigraphic sequences of passive margins: GeologicalSociety of America Bull., v. 89, p. 1389-1403.
Plint, A. G., 1988, Sharp-based shoreface sequences and “offshore bars” in the Cardium Formation of Alberta; theirrelationship to relative changes in sea level, in C.K. Wilgus et al., eds., Sea Level Change—An IntegratedApproach: SEPM Special Publication 42, p. 357-370.
Posamentier, H.W., 2001, Lowstand alluvial bypass systems: incised vs. unincised: AAPG Bull., v. 85, p. 1771-1793.Posamentier, H.W., 2002, Ancient shelf ridges—a potentially significant component of the transgressive systems
tract: case study from offshore northwest Java: AAPG Bull., v. 86, p. 75-106.Posamentier, H.W., G.P. Allen, and D.P. James, 1992, High resolution sequence stratigraphy—the East Coulee
Delta: Journal of Sedimentary Petrology, v. 62, p. 310-317.Posamentier, H.W., M.T. Jervey, and P.R. Vail, 1988, Eustatic controls on clastic deposition I—conceptual frame-
work, in C.K. Wilgus et al., eds., Sea Level Change—An Integrated Approach: SEPM Special Publication42, p. 110-124.
Posamentier, H.W., C.P. Summerhayes, B.U. Haq, and G.P. Allen, eds., 1993, Sequence Stratigraphy and FaciesAssociations: International Association of Sedimentologists Special Publication 18, 644 p.
Posamentier, H.W., and P.R. Vail, 1988, Eustatic controls on clastic deposition II—sequence and systems tract mod-els, in C.K. Wilgus et al., eds., Sea Level Change—An Integrated Approach: SEPM Special Publication 42,p. 125-154.
Saito Y., K. Hoyanagi, and M. Ito, eds., 1995, Sequence Stratigraphy—Toward a New Dynamic Stratigraphy: Geo-logical Society of Japan Memoir 45, 249 p.
Sloss, L.L., 1962, Stratigraphic models in exploration: AAPG Bull., v. 46, p. 1050-1057.Sloss, L.L., 1963, Sequences in the cratonic interior of North America: Geological Society of America Bull., v. 74,
p. 93-114.Stille, H., 1924, Grundfragen der Vergleichenden Tektonik: Berlin, Borntraeger, 443 p.Suess, E., 1904, The Face of the Earth, vol. 1 (translated by H.B.C. Sollas): Oxford, U.K., Clarendon Press, 604 p.Vail, P.R., R. M., Mitchum, Jr., and S. Thompson, III, 1977, Seismic stratigraphy and global changes of sea level,
part 3: relative changes of sea level from coastal onlap, in C.E. Payton, ed., Seismic Stratigraphy—Applica-tions to Hydrocarbon Exploration: AAPG Memoir 26, p. 63-81.
Van Wagoner, J.C., and G.T. Bertram, 1995, Sequence Stratigraphy of Foreland Basin Deposits: AAPG Memoir64, 490 p.

Posamentier
54
Van Wagoner, J.C., R.M. Mitchum, Jr., K.M. Campion, and V.D. Rahmanian, 1990, Siliciclastic sequence stratigra-phy in well logs, core, and outcrops: concepts for high-resolution correlation of time and facies: AAPGMethods in Exploration Series 7, 55 p.
Weimer, P., and H.W. Posamentier, 1993, Recent developments and applications in siliciclastic sequence stratigra-phy, in P. Weimer, and H.W. Posamentier, eds., Siliciclastic Sequence Stratigraphy—Recent Developmentsand Applications: AAPG Memoir 58, p. 3-12.
Weller, J.M., 1960, Stratigraphic Principles and Practices: New York, Harper & Brothers, 725 p.Wheeler, H.E., 1959, Unconformity bounded units in stratigraphy: AAPG Bull., v. 43, p. 1975-1977.Wheeler, H.E., and H.H. Murray, 1957, Baselevel control patterns in cyclothemic sedimentation: AAPG Bull., v.
41, p. 1985-2011.Wilgus, C.K., B.S. Hastings, C.G. St. C. Kendall, H.W. Posamentier, C.A. Ross, and J.C. Van Wagoner, 1988, Sea-
Level Changes—An Integrated Approach: SEPM Special Publication 42, 407 p.