sequence stratigraphy and reservoir characterization of
TRANSCRIPT

Graduate Theses, Dissertations, and Problem Reports
2015
Sequence Stratigraphy and Reservoir Characterization of the Sequence Stratigraphy and Reservoir Characterization of the
Middle Devonian Marcellus Formation for a Cored Well in Harrison Middle Devonian Marcellus Formation for a Cored Well in Harrison
County, West Virginia County, West Virginia
Victoria L. Hilliard
Follow this and additional works at: https://researchrepository.wvu.edu/etd
Recommended Citation Recommended Citation Hilliard, Victoria L., "Sequence Stratigraphy and Reservoir Characterization of the Middle Devonian Marcellus Formation for a Cored Well in Harrison County, West Virginia" (2015). Graduate Theses, Dissertations, and Problem Reports. 5805. https://researchrepository.wvu.edu/etd/5805
This Thesis is protected by copyright and/or related rights. It has been brought to you by the The Research Repository @ WVU with permission from the rights-holder(s). You are free to use this Thesis in any way that is permitted by the copyright and related rights legislation that applies to your use. For other uses you must obtain permission from the rights-holder(s) directly, unless additional rights are indicated by a Creative Commons license in the record and/ or on the work itself. This Thesis has been accepted for inclusion in WVU Graduate Theses, Dissertations, and Problem Reports collection by an authorized administrator of The Research Repository @ WVU. For more information, please contact [email protected].
Sequence Stratigraphy and Reservoir Characterization of the Middle Devonian
Marcellus Formation for a Cored Well in Harrison County, West Virginia
Victoria L. Hilliard
Thesis submitted to the
Eberly College of Arts and Sciences
at West Virginia University
in partial fulfillment of the requirements
for the degree of
Master of Science
In
Geology
Timothy Carr, Ph.D., Chair
Jaime Toro, Ph.D.
Thomas Wilson, Ph.D.
Department of Geology and Geography
Morgantown, West Virginia
2015
Keywords: Marcellus Formation; Sequence Stratigraphy; ECS Lithofacies; Total Organic
Carbon; Transgressive – Regressive Sequences; Brittleness
Copyright 2015 Victoria Hilliard

ABSTRACT
Sequence Stratigraphy and Reservoir Characterization of the Middle Devonian Marcellus
Formation for a Cored Well in Harrison County, West Virginia
Victoria L. Hilliard
The Middle Devonian Marcellus Formation is an important unconventional shale play in
North America. It has an approximate aerial extent of 100,000 square-miles and has been
estimated to contain upwards to 489 trillion cubic feet of recoverable gas. Through the advent of
horizontal drilling, in combination with hydraulic fracture simulation, the Marcellus Formation
has been exploited at exponential rates. In order to increase production and drill more profitable
wells, the geology of the Marcellus is being studied in more detail. In particular, geologic
parameters such as geomechanical properties, total organic carbon (TOC), porosity, and
mineralogy could have a direct relationship with the sequence stratigraphy of shale.
To evaluate the geologic parameters that could impact production, core data and well logs
taken from the Goff #55 well were compared to one another. A detailed core description of the
Marcellus Formation was performed on the core taken from the study well, and used to build a
stratigraphic column. The Marcellus Formation was classified into seven lithofacies using
advanced mineralogical logs, core X-ray diffraction (XRD), core X-ray fluorescence (XRF), and
TOC data. Geomechanical properties were calculated using Poisson’s ratio, Young’s modulus,
and mineralogy. The Marcellus Formation was divided into three intervals based on
transgressive- regressive sequences and the associated boundaries by using common and
advanced well logs. Lastly, a regional sequence stratigraphy was developed using approximately
forty wells surrounding the Goff #55 well.

iii
ACKNOWLEDGEMENTS
I would like to express my sincere gratitude to the Geology Department of West Virginia
University for providing funding and support for graduate school. I would like thank my advisor
Dr. Tim Carr for his patience and guidance throughout this research, and for always tolerating
unannounced and repeated pop-ins to your office. I would also like to thank my committee
members Dr. Jaime Toro and Dr. Thomas Wilson for your helpful suggestions on this research
and the invaluable knowledge gained from your courses. Special acknowledgements must be
given to Shuvajit Bhatttacharya and Chloe Wonnell for sharing your advice, knowledge, and
experience. Without realizing it, you both helped revitalize this research every time I visited your
office. Also, thank you Shuvajit for providing the ECS Facies for this study. Special thanks goes
to John Baird for all your help and friendship over the past two years. Thank you for the time
spent talking, bouncing ideas back and forth, patience, and being a great office mate.
Thank you to all my friends for being there for me in so many ways. Most importantly, I
would like to give thanks to my family. I would not be the person I am today if it were not for
your guidance, sacrifices, support, and unending love. Your encouragement and understanding
has given me the courage to reach for my goals and venture forward in life. I would especially
like to thank my sisters for being my rock and best friends in life. Finally, I would like to thank
God for all of the opportunities and experiences he has made possible.

iv
TABLE OF CONTENTS
INTRODUCTION......................................................................................................................... 1
Purpose ....................................................................................................................................... 1
Study Area .................................................................................................................................. 2
Geologic History ........................................................................................................................ 3
Depositional Environment and Sequence Stratigraphy .............................................................. 5
METHODS AND RESULTS ....................................................................................................... 8
Well Logs ................................................................................................................................... 8
Total Organic Carbon (TOC) ............................................................................................. 11
Tops .................................................................................................................................... 13
ECS Lithofacies .................................................................................................................. 15
Geomechanics .................................................................................................................... 18
Physical Core ............................................................................................................................ 21
Regional Sequence Stratigraphy .............................................................................................. 29
DISCUSSION .............................................................................................................................. 36
TOC & Pyrite ........................................................................................................................... 36
Geomechanics .......................................................................................................................... 37
ECS Lithofacies ........................................................................................................................ 39
Marcellus Formation ................................................................................................................ 41
Lower Marcellus................................................................................................................. 43
Middle Marcellus ............................................................................................................... 45
Upper Marcellus ................................................................................................................. 46
Regional Sequence Stratigraphy .............................................................................................. 47
CONCLUSION ........................................................................................................................... 48
REFERENCES ............................................................................................................................ 51
APPENDIX .................................................................................................................................. 55
Core Description....................................................................................................................... 55
TABLE OF FIGURES:
Figure 1. The study area in Harrison County, West Virginia. ....................................................... 3
Figure 2. Tectonic reconstruction of Laurentia’s eastern margin during the Middle Devonian
(385Ma), showing the Appalachian Basin and various structural features. ................................... 4

v
Figure 3. Diagram illustrating the relationship of lithospheric loading, foreland basin subsidence,
and sedimentation into foreland basin. ........................................................................................... 5
Figure 4. Schematic of the Middle Devonian lithostratigraphy of the Catskill delta in the
Appalachian basin ........................................................................................................................... 7
Figure 5. West to East cross-strike schematic diagram of the Catskill delta ................................. 8
Figure 6. Cross section for the Goff #55 well. ............................................................................. 10
Figure 7. Cross plot of computed TOC and core measured TOC ................................................ 11
Figure 8. Relationship between core measured XRD values of TOC and bulk density .............. 12
Figure 9. Relationship between estimated TOC and core measured XRD values of pyrite ........ 12
Figure 10: Sequence stratigraphic model of sea level rise and fall. ............................................ 14
Figure 11: Cross section of the gamma ray log for the Goff #55 study well............................... 15
Figure 12: Workflow utilized to classify lithofacies of the Marcellus Formation. ...................... 17
Figure 13. Graph of the abundance of different lithofacies present in the upper, middle, and
lower Marcellus Formation. .......................................................................................................... 17
Figure 14. Cross plot of the ECS lithofacies versus brittleness, and shaded with TOC estimated
....................................................................................................................................................... 18
Figure 15. Cross plot of Poisson’s Ratio and Young’s Modulus shaded with brittleness
computed using the brittleness average method ........................................................................... 20
Figure 16. Cross plot of Poisson's Ratio and Young's Modulus shaded using brittleness
computed by using the brittleness index method. ......................................................................... 21
Figure 17. The stratigraphic column made from core descriptions ............................................. 26
Figure 18. The scaled stratigraphic column and well logs are plotted next to one another ......... 29
Figure 19. Map of West Virginia showing wells with gamma ray, bulk density, neutron porosity,
or density porosity logs, and cross-section lines ........................................................................... 30
Figure 20. Along strike cross section (A- A') flattened on the top of the Tully Formation ......... 31
Figure 21. Down dip cross section (B- B') flattened on the top of the Lower (L.) Marcellus ..... 32
Figure 22. Down dip cross section (B- B') flattened on the top of the Middle (M.) Marcellus ... 32
Figure 23. Down dip cross section (B- B') flattened on the top of the Upper (U.) Marcellus ..... 33
Figure 24. Down dip cross section (B- B') flattened on the top of the Mahantango.................... 34
Figure 25. Down dip cross section (B- B') flattened on the top of the Tully ............................... 35
Figure 26: Cross-section of the Goff #55 study well ................................................................... 37
Figure 27. Cross plot of Poisson's Ratio and Young's Modulus shaded by ECS Lithofacies...... 39
Figure 28: 2D SEM image taken of the core at 7,122ft ............................................................... 42

vi
Figure 29: 2D SEM image taken of the core at 7,128ft. .............................................................. 43
Figure 30. Photo taken of the core showing pockets of ash ......................................................... 45
TABLE OF EQUATIONS:
Equation 1. Schmoker’s (1993) equation to estimate TOC (Vol. %) .......................................... 11
Equation 2. Poisson’s Ratio (v) equation..................................................................................... 19
Equation 3. Young’s modulus (E) equation ................................................................................ 19
Equation 4. Equation to normalize Poisson’s Ratio .................................................................... 19
Equation 5. Equation to normalize Young’s Modulus ................................................................ 19
Equation 6. Brittleness index (BI) equation ................................................................................ 20

1
INTRODUCTION:
Of all the gas plays in the United States, the Marcellus Formation is the largest. It covers
approximately 100,000 square-miles, six states, and has been estimated to contain 50 to 489
trillion cubic feet (Tcf) of recoverable gas (NETL 2010, 2013). In 2004, Range Resources
Corporation drilled the first economically successful vertical well targeting the Marcellus
Formation by using similar hydraulic fracture stimulation techniques employed in Texas for the
Barnett Shale, and in 2007, completed the first significant horizontal well (Zagorski et al., 2012).
Since that time exploitation of the play has increased exponentially, and has had a profound
impact on the economy.
During its infancy of exploration, shale plays were considered to be and treated as a
homogenous rock with little variation in rock properties. However, after the drilling of many
wells, with varying degrees of success and failure, the new school of thought is that shale
reservoirs are more complex than originally considered. Geologic parameters such as
geomechanical properties, total organic carbon (TOC), porosity, and mineralogy have a direct
relationship with the sequence stratigraphy of shale that was not originally recognized in the
initial phases of exploration. The sequence stratigraphy and associated geologic parameters of
the shale has a significant but poorly understood impact on the recovery potential and production
of the natural gas. The proposed research focuses on the stratigraphy and geologic parameters of
the Marcellus Formation.
Purpose:
The purpose of this thesis research was to evaluate the different shale parameters that
may have had an overall impact on the production of a well targeting the Marcellus Formation,
and develop a regional sequence stratigraphy. The well under investigation was Goff #55 (API=
47-033-05106) located in Harrison County, West Virginia. During the initial year of production,
the Goff #55 well produced 68,627 million cubic feet (mcf) of dry gas (wvges.com).
Often times a well’s core, laboratory data, and well logs are not integrated for further
comparison and related to possible stratigraphic controls. Depositional setting and sequence

2
stratigraphy of the Marcellus was determined through the use of core, whole core high definition
CT scanning, X-ray fluorescence (XRF) data, and high resolution 2D scanning electron
microscope (SEM) imagining. The geomechanical parameters that were evaluated were
Poisson’s ratio and Young’s modulus. The core and lab data was tied back to the well logs, and
the correlation between the different geological parameters and the logs were examined. Lastly,
by using other wells in the area a regional sequence stratigraphy of the Marcellus Formation was
developed.
Study Area:
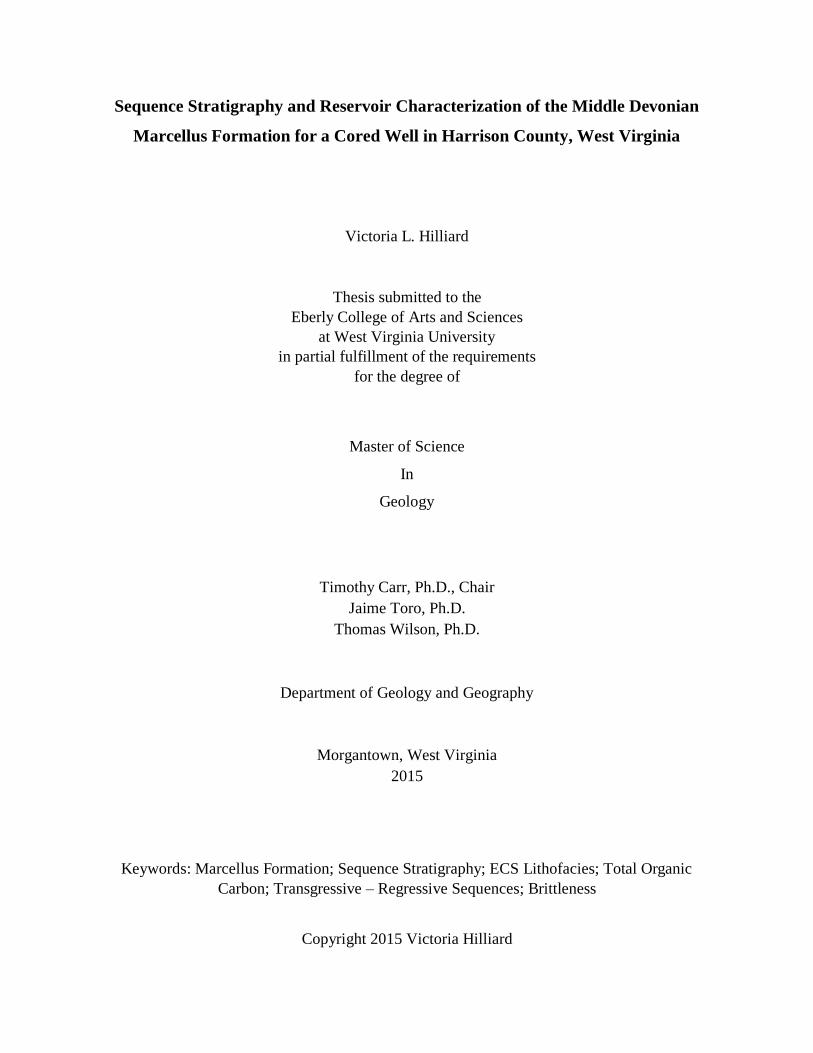
The study area is located in Harrison County, West Virginia (Fig.1). Harrison County is
located within the Allegheny plateau region of the Appalachian basin in northern-central West
Virginia. Structurally, Harrison County is bisected by the slightly northeast to south-west
trending Wolf Summit anticline (WSA); Goff #55, the study well, is positioned along the hinge
of the anticline.
3
Figure 1. The study area in Harrison County, West Virginia is located in the Allegheny plateau
along the Wolf Summit anticline (Modified from geolgy.com).
BACKGROUND:
Geologic History:
The Devonian Marcellus Formation, part of the Hamilton Group, was deposited in the
Catskill delta within the Appalachian basin. The Appalachian basin is an elongate continental
basin that formed on the craton side of the Appalachian orogen (Faill, 1997). The Appalachian
orogeny extends approximately 3,000 kilometers from Newfoundland to Alabama (Faill 1997,
1985). The Appalachian basin extends westward to the Cincinnati arch, Findlay arch and
Algonquin axis (Figure 2) (Faill, 1997).
Harrison County
Explanation

4
Figure 2. Tectonic reconstruction of Laurentia’s eastern margin during the Middle Devonian
(385Ma), showing the Appalachian Basin and various structural features.
(Modified from Blakey, 2010)
The Appalachian basin was a foreland basin that formed as a result of flexural subsidence
induced by lithospheric loading during the Taconic, Acadian, and Alleghanian orogenies
(Mabesoone and Neumann, 2005). The Cincinnati, Findlay, and Algonquin arches are interpreted
to be the foreland peripheral bulge caused by the lithospheric loading (Figure 3) (Castle, 2001).
These arches separated the Appalachian basin from the Illinois and Michigan basins (Faill,
1997). The peripheral bulge and foreland basin migrated westward through time with continued
lithospheric loading and crustal shortening (Ettensohn and Brett, 2002).
The Marcellus Formation was deposited as the basal unit of the Catskill delta during the
Acadian orogeny. The Acadian orogeny is thought to have begun during the Late Silurian to
Early Devonian (421-400 Ma) and to have lasted until the end of the Devonian to Early
Carboniferous (395-350Ma) (Staal, 2009). The prevailing theory is that the orogeny occurred due
to the oblique convergence and subsequent south westward transcurrent movement of the Avalon
terrane along a strike-slip fault (Ettensohn, 1985a). However, there is some evidence that suggest
Illinois Basin
Michigan Basin
New York Promontory
Virginia Promontory
Rheic Ocean
5
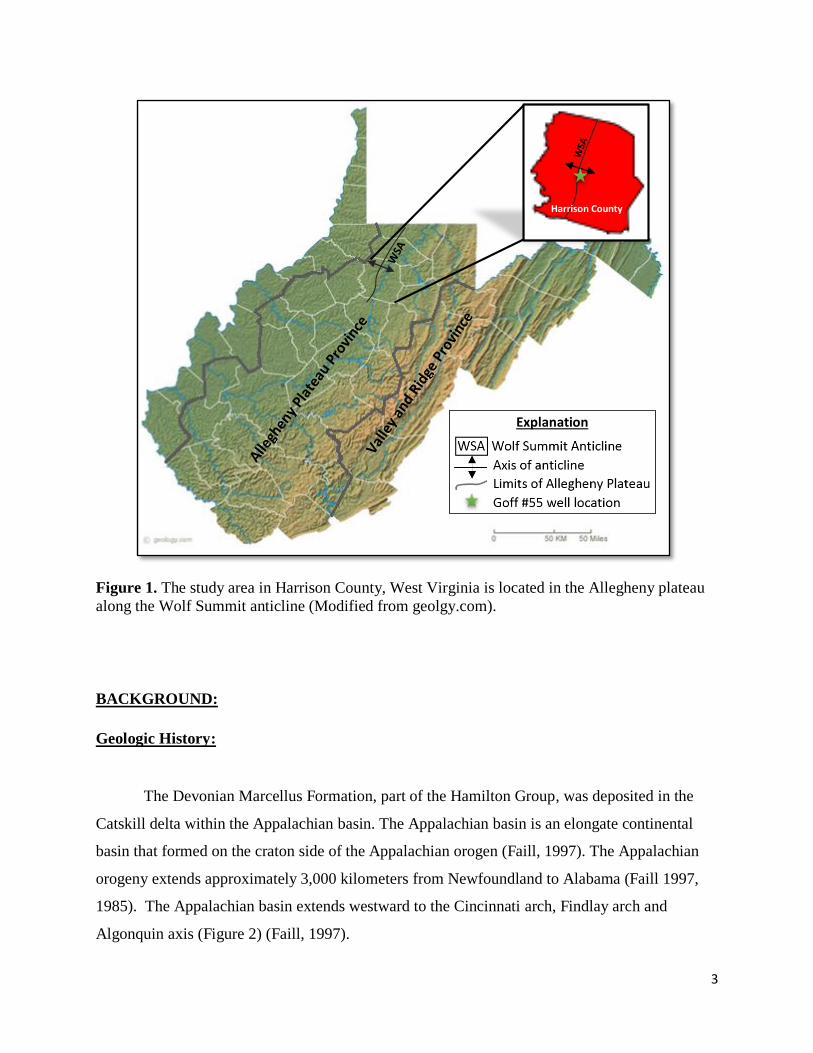
the segmented deformation was a result of flat-slab subduction, similar to that of the modern
Andes (Murphy and Keppie, 2005).
Figure 3. Diagram illustrating the relationship of lithospheric loading, foreland basin subsidence,
and sedimentation into foreland basin. (a) Time 1: Beginning of orogenic activity, subsidence of
the foreland basin, and deposition of black shales. (b) Time 2: Continued flexural relaxation and
basin subsidence with deposition of coarser sediments.
(Ettensohn and Brett, 2002)
Depositional Environment and Sequence Stratigraphy:
The Devonian aged Marcellus Formation is an organic rich, black shale that directly
overlies the fossiliferous, argillaceous limestone of the Devonian Onondaga Limestone (Fig. 4).
The Marcellus Formation is the basal unit of the Hamilton Group, which were the first deposits
of the Catskill delta in the Appalachian basin (Fig. 5) (Ettensohn, 1985a). The upper portion of
the Hamilton Group is composed of the Mahantango Formation, which is a non-organic, gray
shale.
The transition from the Onondaga Limestone to the Marcellus Formation is rather abrupt
across the basin. This indicates that there was a rapid change in environments from shallow
oxygenated waters to deeper suboxic to anoxic bottom waters (Castle, 2011; Lash and Blood,
2014). This dynamic change in lithology is attributed to rapid basin subsidence induced by
lithospheric loading and eustatic sea level rise (Ettensohn, 1985a; Brett et al., 2011).

6
The Catskill delta is Middle- to Late Devonian in age, stretches approximately 800km
from the New York to Virginia promontory, ranges in thickness from 2,400m to 3,000m, and is
composed of five sequences of marine and non-marine facies (Ettensohn, 1985a, 2004;
Woodrow, 1985). The first facies sequence of the Catskill delta is comprised of the Hamilton
Group (Fig. 5) (Ettensohn, 1985a). The paleo-environments and associated processes of the
Catskill delta ranged from subaerial to aqueous and included alluvial fans, alluvial plains,
shoreline, basin margin, and deep basin (Woodrow, 1985). The displacement of the different
environments and associated facies was not only a result of transgression and regression, but also
a result of the interplay between the effects subsidence and accommodation space (Woodrow,
1985; Ettensohn, 1995a; Brett et al., 2011).
In a study by Lash and Engelder (2011) the Marcellus Formation was divided into two
members based on transgressive- regressive sequences. The lower member is the Union Springs
Member which is divided from the upper Oatka Creek Member by the Purcell Limestone
Member (Fig. 4) (Lash and Engelder, 2011). The Union Springs Member has a higher amount of
organic matter than the overlying Oatka Creek Member (Lash and Engelder, 2011). In both
members there is a higher concentration of organic matter associated with the transgressive
system tracts (TST) than in the regressive system tracts (RST) (Lash and Blood, 2014).
Based on the uranium, molybdenum, Fe/Al, and Th/U concentrations and abundant pyrite
framboids it is believed that there was a reducing benthic environment present that facilitated the
preservation of organic matter (Lash and Blood, 2014; Castle, 2011). Anoxic bottom water
conditions may have been a result of high surface water productivity that rained organic matter
down to the ocean floor and caused oxygen consumption to occur at a rate that far exceeded
ocean water mixing (Lash and Blood, 2014). These productive surface waters would have spread
across the area during periods of transgression and broken down to some degree during periods
of regression, thus leading to the higher concentrations of organic matter in TST’s (Lash and
Blood, 2014). The influx of clastic sediment deeper into the basin during periods of regression
could have also facilitated the degradation of organic matter preservation seen in RST’s.
Based on paleomagnetic data, during the Middle Devonian the Appalachian basin was at
a latitude of within 20 degrees of the equator (Kent, 1985). It would have been a warm, wet
subtropical environment with high evaporation rates, and affected by the easterly trade-wind belt

7
(Kent 1985; Ettensohn 1992). This subtropical environment would have promoted erosion and
sedimentation into the basin, stratification of the water column, and high surface water
productivity (Kent, 1985).
Figure 4. Schematic of the Middle Devonian lithostratigraphy of the Catskill delta in the
Appalachian basin from west (basin ward) to east (shelf ward). The Marcellus Formation
(labeled Marcellus Shale) and Mahantango Formation have been further subdivided into
members. Sys = System (Wang and Carr, 2013).

8
Figure 5. West to East cross-strike schematic diagram of the Catskill delta showing the five
facies sequences and the paralic relationship between the proximal delta, distal delta, and basinal
environments. Predominately the proximal delta is composed of clastic sediments, the basinal
delta contains sandy to silty shales with a low organic content, and the basinal environments
have associated organic rich, black shales. Through time, the sequences were displaced westward
and the delta prograded cratonward. (Modified from Ettensohn, 1985a).
METHODS AND RESULTS:
Well Logs:
Petroleum Development Corporation provided conventional and advanced well logs for
the study well. The suites of logs were uploaded into Petra® to aid in the evaluation of the
Marcellus Formation. Conventional well logs included gamma ray, caliper, neutron and density
porosity, resistivity, bulk density, photoelectric factor, etc. The advanced logs included ELAN®
mineralogy as a weight percent and volume percent, Spectrolith® mineralogy, dipole sonic, hole
azimuth, east and north departure, etc.
W E

9
Once uploaded into Petra®, the logs were depth shifted so that they would directly match
up to the physical core. The logs were also corrected for the east and north departures of the well
bore. They were then displayed in cross section view (Fig. 6).
Gamma ray was shaded using “Geo-column” shading so that “hot” zones could easily be
seen. These hot, high gamma ray zones correspond to a TOC rich lithology. Caliper was plotted
and shaded blue if the reading dropped below 7.875 inches. This was done to indicate if drilling
mud was caked along the well bore wall. If the caliper reading was much greater than 7.875
inches then the well bore could have washed out and compromised the integrity other logging
tool’s measurements. Very little mud caking or washouts were present in the Marcellus
Formation in the study well. Bulk density was shaded blue if it dropped below 2.65 g/cc to
indicate probable zones with TOC.
10
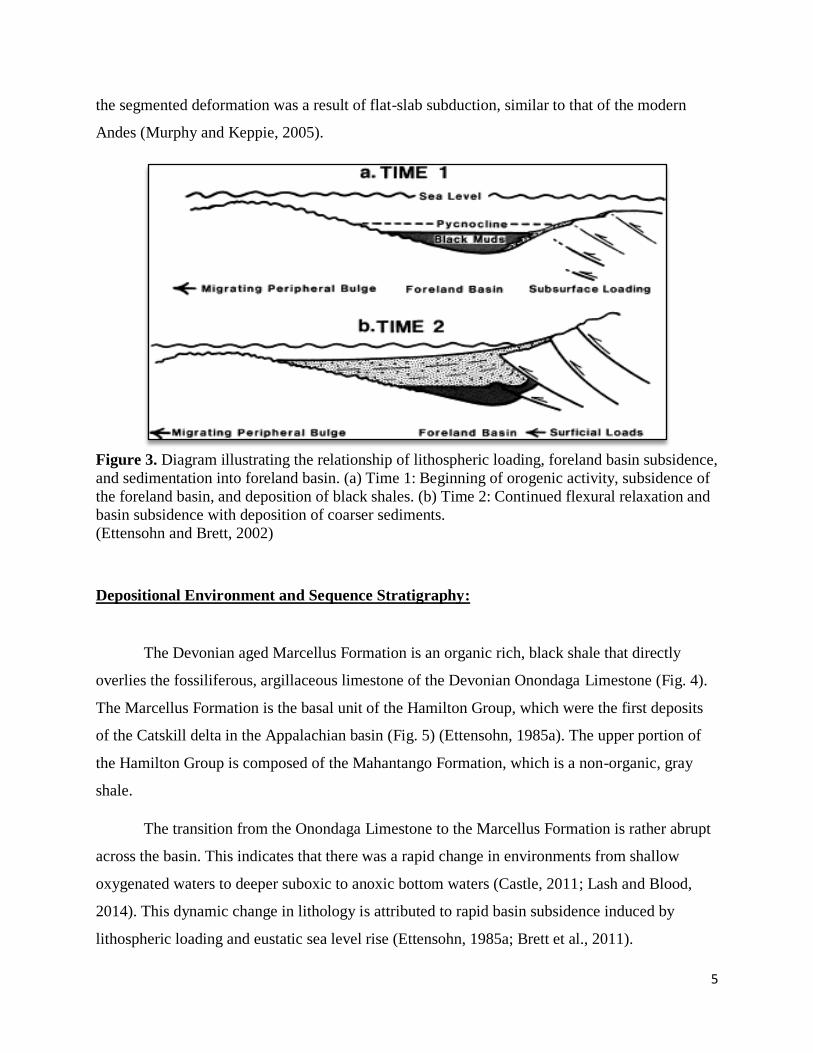
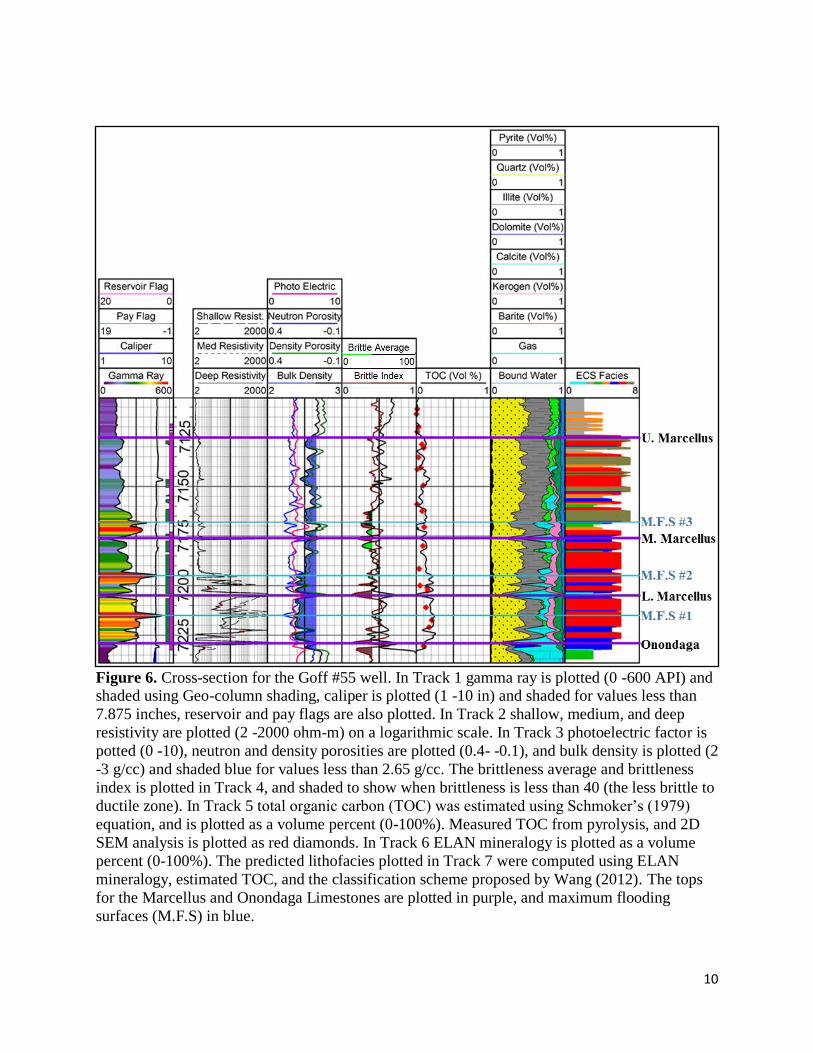
Figure 6. Cross-section for the Goff #55 well. In Track 1 gamma ray is plotted (0 -600 API) and shaded using Geo-column shading, caliper is plotted (1 -10 in) and shaded for values less than
7.875 inches, reservoir and pay flags are also plotted. In Track 2 shallow, medium, and deep
resistivity are plotted (2 -2000 ohm-m) on a logarithmic scale. In Track 3 photoelectric factor is
potted (0 -10), neutron and density porosities are plotted (0.4- -0.1), and bulk density is plotted (2
-3 g/cc) and shaded blue for values less than 2.65 g/cc. The brittleness average and brittleness
index is plotted in Track 4, and shaded to show when brittleness is less than 40 (the less brittle to
ductile zone). In Track 5 total organic carbon (TOC) was estimated using Schmoker’s (1979)
equation, and is plotted as a volume percent (0-100%). Measured TOC from pyrolysis, and 2D
SEM analysis is plotted as red diamonds. In Track 6 ELAN mineralogy is plotted as a volume
percent (0-100%). The predicted lithofacies plotted in Track 7 were computed using ELAN
mineralogy, estimated TOC, and the classification scheme proposed by Wang (2012). The tops
for the Marcellus and Onondaga Limestones are plotted in purple, and maximum flooding
surfaces (M.F.S) in blue.

11
Total Organic Carbon (TOC):
TOC was computed for the study well by Schmoker’s (1979) model, which uses
formation density logs to estimate TOC as a volume percent (Eq. 1). The model accommodates
for calibration bias by using the density from the densest interval of a non-organic, gray shale
zone in each individual well. For the study well, there is an 80.7% correlation between the
computed and the laboratory measured organic-carbon content (Fig. 7). The estimated TOC was
then compared to bulk density (Fig. 8) and pyrite abundance measured from core by x-ray
diffraction (XRD) (Fig. 9).
𝑇𝑂𝐶 (𝑉𝑜𝑙. %) =𝜌𝐵 − 𝜌
1.378=
2.69 − 𝜌
1.378
Equation 1. Schmoker’s (1979) equation to estimate TOC as a volume percent (Vol. %), where
ρB is the density of the densest interval of non-organic, gray shale, and ρ is the bulk density log.
Figure 7. Cross plot of computed TOC using Schmoker's (1979) model and core measured TOC.
The data has a correlation of 80.7% and standard error of 0.045.

12
Figure 8. Relationship between core measured XRD values of TOC and bulk density measured
by well log.
Figure 9. Relationship between estimated TOC and core measured XRD values of pyrite in
volume percent.
Pyrite

13
Tops:
The tops for the formations were chosen primarily based on well logs and crossed
checked with the physical core. The tops were not picked solely based on gamma ray because of
its coarse resolution. The Onondaga and Marcellus formations top picks may vary up to a few
feet from those chosen by the West Virginia Geological Survey and others. Furthermore, the
Marcellus Formation was divided into three zones based on the limestone units that defined the
cyclic completion of transgressive and regressive system tracts.
The contact between the Onondaga Limestone and Marcellus Formation was gradational
over an interval of approximately 4ft (7,232ft -7,228ft) (Fig. 17). The gradational contact
consisted of interlayered limestone and shale. The limestone intervals die out from a few inches
thick, and the shale layers gradually grow from a few centimeters thick to pure shale. The top for
the Onondaga Limestone was picked in the center of the gradation at 7,230ft. This point
corresponded to a large spike in the resistivity, which has the finest resolution of all the well
logs, and a large jump in gamma ray. Based on the ELAN® mineralogical logs, this point is
directly above a dolomite-rich layer (Fig. 6)
The Marcellus Formation top was picked at 7,125ft based on where TOC dropped to 0%
and bulk density increased to 2.65g/cc. This point also marked where resistivity dropped and
remained very low. At this depth, gamma ray dropped and remained below 180API (Fig. 6). This
point and characteristic changes in well logs represented a change from a shale with high TOC to
a nonorganic shale. In core, the lithology changed from a black shale to a pyrite rich gray shale.
The Marcellus Formation was 105ft (32m) thick in the study well, and was divided into
three zones based on major transgressive system tracts (TST) and regressive system tracts (RST).
As sea level rises and falls there is an associated change in lithology and grain size deposition
that occurs (Fig. 10). As sea level falls the shoreline regresses seaward, and shallower water
lithologies and coarser grain sizes are deposited. This characteristic coarsening upward of
lithology in a stratigraphic column is referred to as a RST. As sea level begins to rise the
shoreline transgresses inland, and finer grain lithologies are deposited. This characteristic fining
upward of lithologies in a stratigraphic column is referred to as a TST. If a location was at a
depth less than or at wave base then the transition from regression to transgression will be

14
preserved in the lithologic record as an erosional contact. The erosional surface is the
transgressive surface of erosion (TSE). However, if the location was at a depth greater than wave
base and no erosion occurred then the point is a correlative conformity (Catuneanu et al., 2009).
There was no erosional contact seen in the study well, and the change from an RST to TST was
marked by a correlative conformity.
Figure 10: Sequence stratigraphic model of sea level rise and fall. RST= Regressive system
tract; TST= Transgressive system tract; MFS= Maximum flooding surface.
(Modified from Catuneanu et al., 2009)
The gamma ray log was used to divide the Marcellus Formation into three main units
based on completions of transgressive- regressive (T-R) sequences (Fig. 11). The picks were
then crossed checked with finer resolution logs and core. If needed the pick would be moved
slightly up or down for better placement.
A TST was present at the base of the formation as the lithology changed from a very
fossiliferous, shallow water deposited limestone (Onondaga Limestone) into a very fine grained,
organic, black silty shale with an increasing gamma ray signature. The first highest peak of the
gamma ray was marked as the maximum flooding surface (M.F.S) #1. The gamma ray log
immediately dropped after the peak. The drop in gamma ray was associated with a coarsening of
lithology, and the lowest point, which is carbonate rich, was chosen to mark the correlative
conformity (Fig. 6). The correlative conformity is the top for the lower (L.) Marcellus.
The same method of picking T-R sequences was used to pick tops for the M.F.S #2,
middle (M.) Marcellus, and M.F.S #3. The Marcellus Formation top remained the same,

15
however, it was renamed the upper (U.) Marcellus. The RST associated with the T-R sequence of
the U. Marcellus interval does not stop at the U. Marcellus top. It continues until further up the
stratigraphic record into the overlying Mahantango Formation.
Figure 11: Cross section of the gamma ray log for the Goff #55 study well. The gamma ray log
was used to divide the Marcellus Formation into three units based on transgressive-regressive
sequences.
ECS Lithofacies:
Shale lithofacies were computed using the techniques and procedures defined by Wang
(2012), and utilized advanced ELAN mineralogical logs and core data. There are seven predicted
lithofacies present: gray mudstone, carbonate interval, gray mixed shale, gray siliceous shale,
16
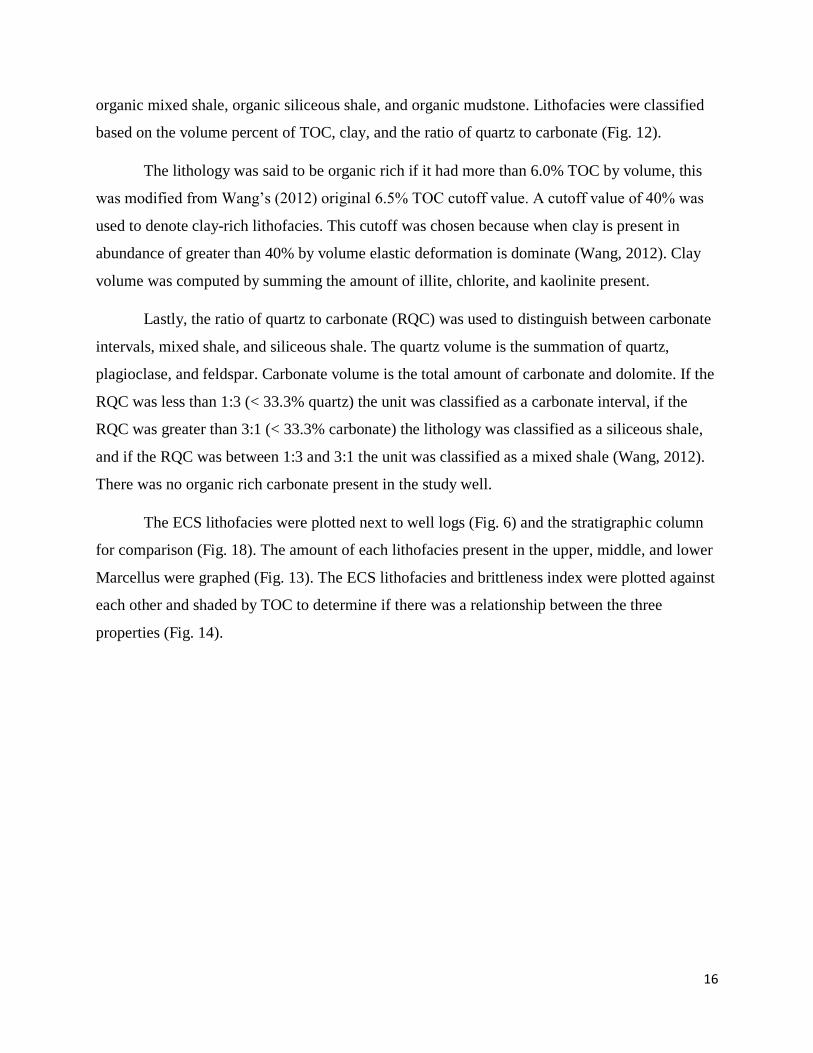
organic mixed shale, organic siliceous shale, and organic mudstone. Lithofacies were classified
based on the volume percent of TOC, clay, and the ratio of quartz to carbonate (Fig. 12).
The lithology was said to be organic rich if it had more than 6.0% TOC by volume, this
was modified from Wang’s (2012) original 6.5% TOC cutoff value. A cutoff value of 40% was
used to denote clay-rich lithofacies. This cutoff was chosen because when clay is present in
abundance of greater than 40% by volume elastic deformation is dominate (Wang, 2012). Clay
volume was computed by summing the amount of illite, chlorite, and kaolinite present.
Lastly, the ratio of quartz to carbonate (RQC) was used to distinguish between carbonate
intervals, mixed shale, and siliceous shale. The quartz volume is the summation of quartz,
plagioclase, and feldspar. Carbonate volume is the total amount of carbonate and dolomite. If the
RQC was less than 1:3 (< 33.3% quartz) the unit was classified as a carbonate interval, if the
RQC was greater than 3:1 (< 33.3% carbonate) the lithology was classified as a siliceous shale,
and if the RQC was between 1:3 and 3:1 the unit was classified as a mixed shale (Wang, 2012).
There was no organic rich carbonate present in the study well.
The ECS lithofacies were plotted next to well logs (Fig. 6) and the stratigraphic column
for comparison (Fig. 18). The amount of each lithofacies present in the upper, middle, and lower
Marcellus were graphed (Fig. 13). The ECS lithofacies and brittleness index were plotted against
each other and shaded by TOC to determine if there was a relationship between the three
properties (Fig. 14).

17
Figure 12: Workflow utilized to classify lithofacies of the Marcellus Formation.
(Modified from Wang, 2012)
Figure 13. Graph of the abundance of different lithofacies present in the upper, middle, and
lower Marcellus Formation.

18
Figure 14. Cross plot of the ECS lithofacies versus brittleness computed using the brittleness
index method, and shaded with volume percent TOC estimated using Schmoker’s (1979)
method.
ECS Lithofacies Chlorite Illite Calcite Pyrite Quartz TOC Brit
Carbonate Interval 2.8 12.6 64.1 0.8 16.8 1.2 15.0
Gray Mudstone 9.6 35.1 2.0 0.6 44.1 2.5 43.0
Gray Mixed Shale 4.8 21.6 34.9 0.8 32.4 2.7 32.3
Gray Siliceous Shale 7.2 29.6 5.0 0.7 48.1 4.4 47.8
Organic Mixed Shale 1.9 20.0 29.1 1.6 29.8 12.6 35.0
Organic Siliceous Shale 3.9 29.4 3.3 2.2 41.7 15.9 47.0
Organic Mudstone 6.9 39.5 0.3 1.9 35.1 10.5 38.6
Table 1. ECS Lithofacies’ average mineralogy as a volume percent and average estimated
brittleness (Brit) computed by the brittleness index method.
Geomechanics:
While there is no universally accepted definition for brittleness, it can be generally
defined as the rock’s ability to crack or fracture with minimal or no plastic flow (Glossary of

19
Geology, 1960; Wang and Gale, 2009). The primary controls on brittleness include TOC,
diagenesis, lithology, texture, fluid type, effective stress, temperature, and rock strength
(references within Wang and Gale, 2009; Wells, 2004). For this research, brittleness was
calculated using the brittleness average method proposed by Grieser and Bray (2007), and the
brittleness index method proposed by Wang and Gale (2009).
The brittleness average method computes brittleness from Poisson’s Ratio (Eq. 2) and
Young’s Modulus (Eq. 3) by normalizing and averaging both components (Eq. 4- 5) (Grieser and
Bray, 2007). Poisson’s Ratio is the amount a stretching a material will undergo due shortening/
compression. Young’s Modulus relates to the stiffness of a material. A low Poisson’s Ratio and
high Young’s Modulus is associated with brittle materials, and the opposite is true for ductile
materials (Grieser and Bray, 2007). Figure 15 is the cross plot of Poisson’s Ratio and Young’s
Modulus shaded with the brittleness computed using the brittleness average method.
𝑣 =[0.5 × (𝐷𝑇𝑆/𝐷𝑇𝐶)2 − 1]
(𝐷𝑇𝑆𝐷𝑇𝐶)
2
− 1
Equation 2. Poisson’s Ratio (v) equation, where DTS is the shear sonic log and DTC is the
compressional sonic log.
𝐸 = 2 × (13400 × 𝐷𝑒𝑛𝑠 ÷ 𝐷𝑇𝑆2) × (1 + 𝑣)
Equation 3. Young’s modulus (E) equation, where Dens is the rock density (g/cc).
𝑣𝑏𝑟𝑖𝑡𝑡𝑙𝑒𝑛𝑒𝑠𝑠 =𝑣 − 𝑣𝑚𝑎𝑥
𝑣𝑚𝑎𝑥 − 𝑣𝑚𝑖𝑛× 100 =
𝑣 − 0.34
0.14 − 0.34× 100
Equation 4. Equation to normalize Poisson’s Ratio, where vmax and vmin are the minimum and
maximum Poisson’s Ratio measured.
𝐸𝑏𝑟𝑖𝑡𝑡𝑙𝑒𝑛𝑒𝑠𝑠 =𝐸 − 𝐸𝑚𝑖𝑛
𝐸𝑚𝑖𝑛 − 𝐸𝑚𝑎𝑥× 100 =
𝐸 − 2.5
6 − 2.5× 100
Equation 5. Equation to normalize Young’s Modulus, where Emax and Emin are the minimum
and maximum Young’s Modulus measured.
The brittleness index method computes brittleness as a function of mineralogical
composition (Eq. 6) (Wang and Gale, 2009). The equation proposed by Wang and Gale (2009)
was adapted from Jarvie et al. (2007) equation to include dolomite and TOC. TOC will increase

20
ductility while dolomite, in addition to quartz, will increase brittleness (Wang and Gale, 2009).
The brittleness computed by the brittleness index method is overlaid on the cross plot of
Poisson’s Ratio and Young’s Modulus in Figure 16.
𝐵𝐼 =𝑄𝑡𝑧 + 𝐷𝑜𝑙
𝑄𝑡𝑧 + 𝐷𝑜𝑙 + 𝐶𝑎 + 𝐶𝑙 + 𝑇𝑂𝐶
Equation 6. Brittleness index (BI) equation, where Qtz is quartz, Dol is dolomite, Ca is calcite,
Cl is clay, and TOC is total organic carbon.
Figure 15. Cross plot of Poisson’s Ratio and Young’s Modulus shaded with the brittleness
computed using the brittleness average method.

21
Figure 16. Cross plot of Poisson's Ratio and Young's Modulus shaded using brittleness
computed by using the brittleness index method.
Physical Core:
The physical core was obtained from the core annex at the West Virginia Geological &
Economic Survey, located off Mont Chateau Road in Morgantown, West Virginia. The depths of
the core taken extended from 7,123ft – 7,235.75ft (112ft). These depths extend from two feet
above the inferred Marcellus and Mahantango contact, and eight feet below the inferred contact
between the Marcellus and Onondaga Limestone. The contacts were inferred from the well logs.
The core, which was partitioned into three-foot sections and placed in plastic bags inside
cardboard boxes, was taken back to the laboratory. The boxes were laid out on tables in order of
depth. Each plastic bag is marked with the core number, box/ bag number, and the upper and
lower most depths at their corresponding end of the bag. At the end of each box is a lime green
label with the company name, well name, field name, county and state, top and bottom depths of
the core in the box, core number, and the box number. Each bag was checked to insure that it

22
corresponded with the box it was contained in. In the two cases where the bags were in the
wrong box, they were moved to the correct box.
In order to ensure a more accurate description, a damp sponge was used to clean the
driller’s mud off of the flat faced side of the core. Along the left side of the core there is a
vertical red line, the pieces of the core were checked to ensure that the red line was facing the
left. If the line was on the opposite side, the piece would be flipped. By doing this, it ensured that
every piece of the core was oriented in the correct vertical direction and not upside down. Also,
every foot along the left side of the core is a yellow mark and the corresponding depth. These
marks were used to help better constrain the depth measurements by placing a 12-inch ruler
between them.
The rocks present in the interval of core that was described are predominately silty shales
and some limestone intervals. The term silty shale was used as a general classification for the
fine grained, siliciclastic rock composed predominately of silt-sized (1/16- 1/256mm) and clay
sized (<1/256mm) particles (Boggs, 2012). If the unit was determined to be a limestone, it was
classified according to depositional textures. The limestone was classified as a wackestone if it
was a mud supported carbonate rock with more than 10% of the grains 0.3- 2mm in size, and a
packstone if it was a grain supported, muddy carbonate rock (Boggs, 2012).
The core was described based on its physical characteristics. The main characteristics
include color, bedding thickness, the presence or absence of rugosity along bedding planes, and
dips of the beds. Bedding thickness was described as slabby (10- 30cm thick), flaggy (1- 10cm
thick), and laminated (<1cm thick). While exact rose-compass orientation of the dip could not be
given, the unit was said to be dipping to the right or left based on true vertical and the red line to
the left.
The core was also described based on the presence of calcite and pyrite. Hydrochloric
acid was used to test for the presence of calcite. The abundance of calcite ranged from non-
calcareous to very calcareous, and was based on the degree of effervescence. The acid was
immediately wiped off with a damp sponge following the test. The abundance of pyrite was
determined based on visual inspection, and had the same ranged from non-pyritic to very pyritic.
If applicable, calcite and pyrite would be described as concretions, nodules, laminae, or relative
crystal size.
23
Fractures were described based on orientation, thickness, length, shape, and open versus
filled. The orientation was described in general terms of vertical, sub-vertical, horizontal, sub-
horizontal, parallel or perpendicular to bedding, and if a dip could be estimated to the right or left
it would be given. If the strike of the fracture was no relatively perpendicular to view, but rather
parallel (trending left and right) then this would be specifically stated in the description. If the
fracture was filled, the specific mineral filling the fracture would be determined.
Other properties described include the presence of fossils, ash beds, slickensides, and
potential burrows. Fossils were described based on the abundance, the type or skeletal fragments
if too broken, and if there were part of a turbidity sequence or strictly located along bedding
planes. Ash beds were described based on color, texture, and size. A note was made if
slickensides were present along bedding planes. Burrows were described based on abundance,
color, and mineralogical composition. If a section of core was missing, this was noted.
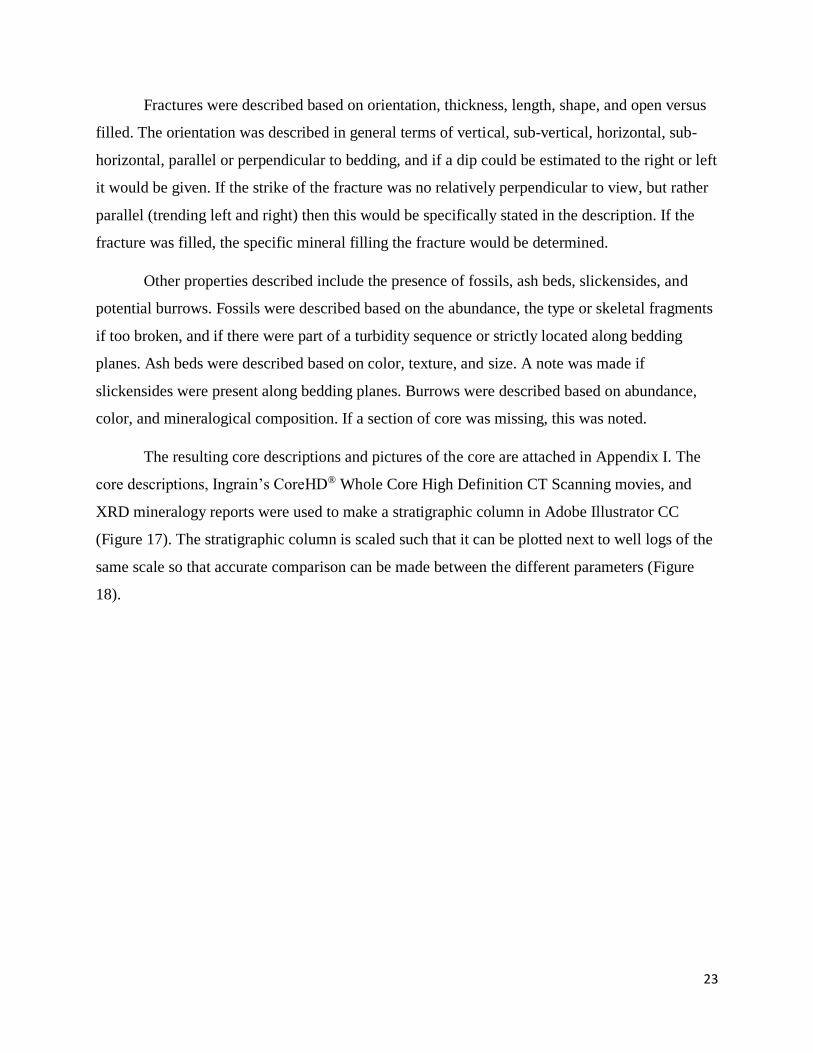
The resulting core descriptions and pictures of the core are attached in Appendix I. The
core descriptions, Ingrain’s CoreHD® Whole Core High Definition CT Scanning movies, and
XRD mineralogy reports were used to make a stratigraphic column in Adobe Illustrator CC
(Figure 17). The stratigraphic column is scaled such that it can be plotted next to well logs of the
same scale so that accurate comparison can be made between the different parameters (Figure
18).

24

25

26
Figure 17. The resulting stratigraphic column made using core descriptions, Ingrain’s CoreHD®
Whole Core High Definition CT Scanning movies, and XRD mineralogy reports. The tops for
Upper (U.), Middle (M.), and Lower (L.) Marcellus and Onondaga are plotted in purple. The
tops for the maximum flooding surfaces (M.F.S) 1 -3 are plotted in blue.

27

28

29
Figure 18. The scaled stratigraphic column and well logs are plotted next to one another for easy
comparison of the different parameters. In Track 1 gamma ray is plotted (0-600 API) and shaded
using Geo-column shading. Total organic carbon (TOC) was estimated using Schmoker’s (1979)
equation, and is plotted as a volume percent (0-100%). Measured TOC from pyrolysis, and 2D
SEM analysis is plotted as black diamonds. Arrows representing transgressive system tracts
(TST) and regressive system tracts (RST) are next to the gamma ray log. The stratigraphic
column, depth scale, and core color column are plotted between tracks one and two. In Track 2
ELAN mineralogy plotted as a volume percent (0-100%). The predicted lithofacies plotted in
Track 3 were computed using ELAN mineralogy, estimated TOC, and the classification scheme
proposed by Wang (2012). The brittleness average and brittleness index is plotted in Track 4,
and shaded to show when brittleness is less than 40 (the less brittle to ductile zone). The
Marcellus and Onondaga Limestone tops are plotted in purple, and maximum flooding surfaces
(M.F.S) in blue.
Regional Sequence Stratigraphy:
A regional sequence stratigraphy was developed surrounding the study well using
available well log data from approximately 40 wells. The gamma ray log was the primary log
used to develop the sequence stratigraphy. If available, correlation was aided by bulk density,
neutron porosity, and density porosity. Gamma ray was the primary log used due to the fact that
it was the only log available for most wells in the area.
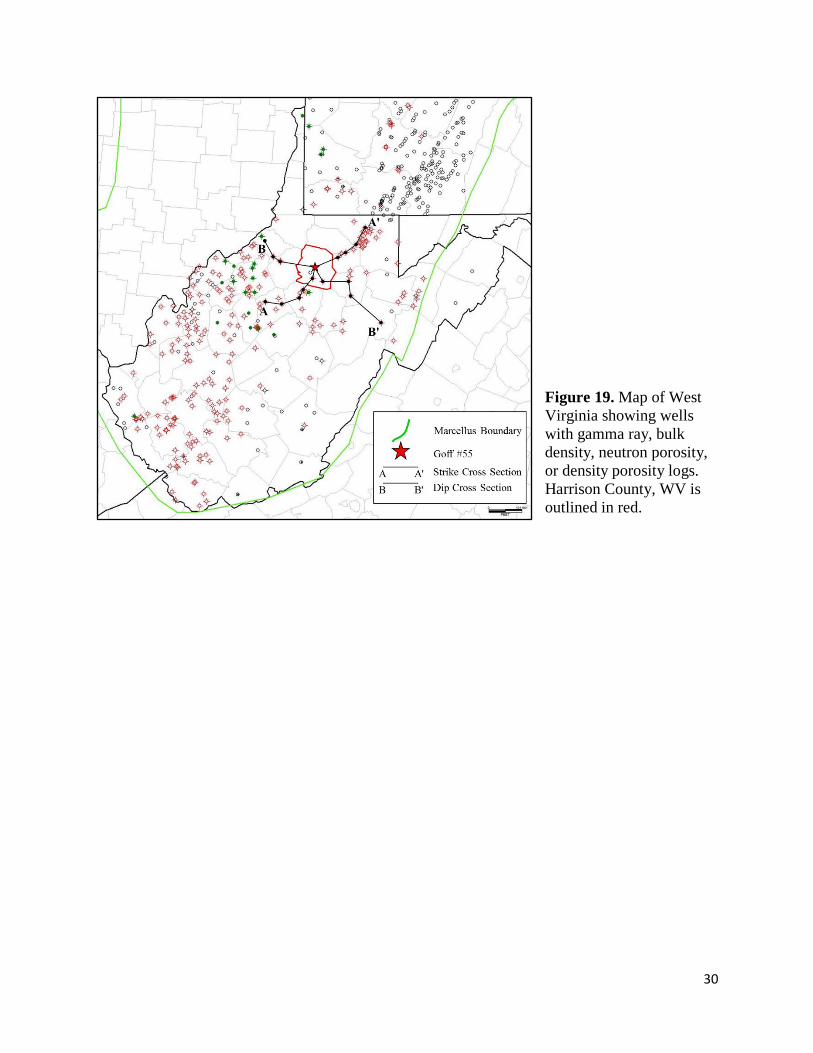
The tops chosen for the Goff #55 well were extrapolated to surrounding wells. Map 1
displays the well location of wells with any of the fore mentioned logs in West Virginia. The
tops correlated across the area were for the Onondaga Limestone, the three tops picked for the
Marcellus Formation based on T-R sequences, and the tops for the Mahantango and Tully
formations. A finer scale sequence stratigraphy for only Harrison County, WV could not be
developed due to the scarcity of wells with available logs. Therefore, a coarser scale sequence
stratigraphy was developed for Harrison County and the surrounding counties in north central
and mid-central West Virginia (Fig. 19- 25).
30
Figure 19. Map of West
Virginia showing wells
with gamma ray, bulk
density, neutron porosity,
or density porosity logs.
Harrison County, WV is
outlined in red.

31
Figure 20. Along strike cross section (A- A') flattened on the top of the Tully Formation. The cross section extends from 25 feet above the Tully
Formation to 25 feet below the Onondaga Limestone top. The Goff #55 well is denoted by the red star.

32
Figure 21. Down dip cross section (B- B') flattened on the top of the lower (L.) Marcellus. The cross section extends from 25 feet above the L.
Marcellus top to 25 feet below the Onondaga Limestone top. The Goff #55 well is denoted by the red star.
Figure 22. Down dip cross section (B- B') flattened on the top of the middle (M.) Marcellus. The cross section extends from 25 feet above the middle
Marcellus top to 25 feet below the Onondaga Limestone top. The Goff #55 well is denoted by the red star.
33
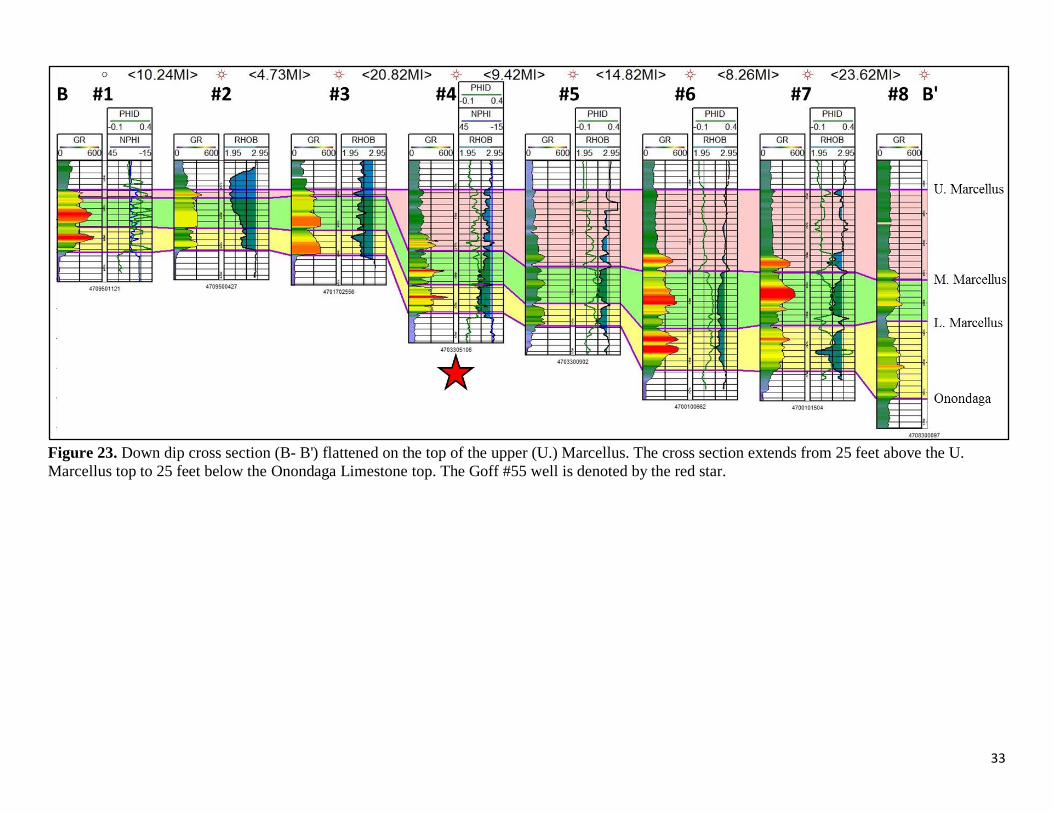
Figure 23. Down dip cross section (B- B') flattened on the top of the upper (U.) Marcellus. The cross section extends from 25 feet above the U.
Marcellus top to 25 feet below the Onondaga Limestone top. The Goff #55 well is denoted by the red star.
34
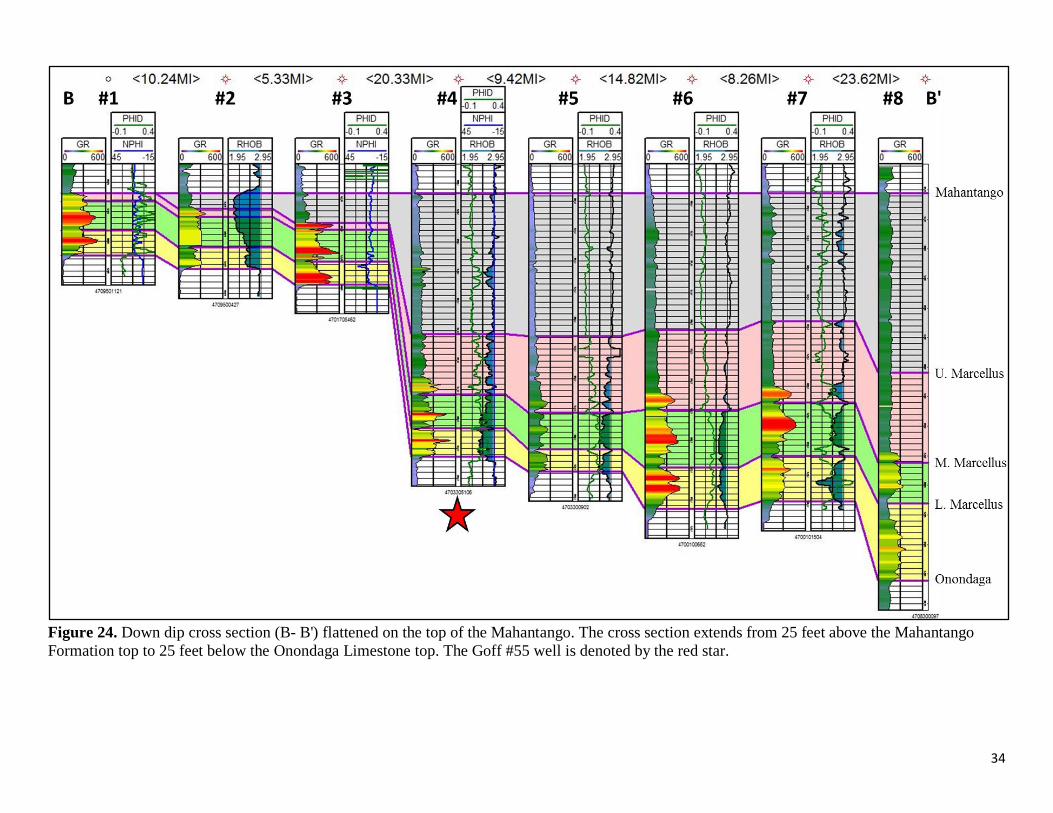
Figure 24. Down dip cross section (B- B') flattened on the top of the Mahantango. The cross section extends from 25 feet above the Mahantango
Formation top to 25 feet below the Onondaga Limestone top. The Goff #55 well is denoted by the red star.

35
Figure 25. Down dip cross section (B- B') flattened on the top of the Tully. The cross section extends from 25 feet above the Tully Formation top to
25 feet below the Onondaga Limestone top. The Goff #55 well is denoted by the red star.

36
DISCUSSION:
TOC & Pyrite:
Overall, the Marcellus Formation’s organic richness increases with depth. The lower
Marcellus is the most organically rich interval in the formation. The amount of TOC present in
the formation was estimated using the density log, and had an 81% correlation with the
laboratory measured TOC values (Fig. 7). This is a significant enough correlation that the
derived values can be used as an accurate representation of the amount of organic matter present
for the formation.
In the cross section of Goff #55 the bulk density log was shaded to show when the
density dropped below 2.65g/cc (Fig. 6). This was done because of the inverse relationship that
exists between TOC and the density of sedimentary rock. TOC drops to almost zero once rock
density reaches 2.65g/cc or higher (Fig. 8). The outlier present in the data may have been due to
errors during laboratory testing, well log measurement, or a reflection of the resolution limits of
the density tool. This relationship can be used as a quick visual proxy for the presence of organic
matter, but must not be used as the sole proxy for TOC.
There is a direct relationship between TOC and pyrite (Fig. 9). Based on XRD values
taken from the core there was an 80% correlation between pyrite and TOC. The presence of
pyrite in shale is indicative of a reducing benthic environment which is preferable for organic
matter preservation (Lash and Blood, 2014; Castle, 2001). This relatively strong and direct
correlation indicates that preservation was mostly due to the dysoxic to anoxic conditions. Some
of the lack of correlation could be due to increased clastic influx into the basin causing organic
matter degradation and/or dilution (Lash and Blood, 204). This clastic influx model would
explain points where there are high amounts of pyrite present but low amounts of TOC (Fig. 9).
These points could also be explained by a decrease of productivity in surface water due to a lack
of nutrients. There is also the possibility of pyrite replacement occurring after burial and not
being intimately related to the depositional environment.
In addition to the relationship pyrite had with TOC, there was also a strong relationship
between Pyrite and the T-R sequences (Fig. 26). The pyrite mineralogical log could be used to

37
assist in separating the Marcellus Formation into different units based on T-R sequences. Pyrite
abundance would increase during a RST and fall during a TST. This indicates that when sea
level rose during the RST there would be stronger reducing conditions present. Bottom water
anoxia was possibly enhanced when sea level rose due to the decreased ability for the water
column to mix.
Geomechanics:
When comparing the cross plots for the brittleness average method (Fig. 15) and
brittleness index (Fig. 16) method there was a noticeable discrepancy in brittleness between the
two methods for the Tully and Onondaga limestones. For the brittleness average method, the
Figure 26: Cross-section of the
Goff #55 study well. Plotted in
Track 1 is the reservoir (Res) flag,
pay flag, caliper log shaded for
values less than 7.875 inches, and
gamma ray log. In Track 2 are core
measured TOC values (volume %)
plotted as red diamonds, and the
estimated TOC log. In Track 3 is
the mineralogical log of pyrite in
volume percent (VPYR). In Track
4 is the mineralogical log of
chlorite in volume percent
(VCHL).

38
Tully and Onondaga limestones were characterized as brittle (Fig. 15). However, the brittleness
index method classified the two limestone formations as ductile to less brittle (Fig. 16). These
two methods also conflicted for the smaller carbonate rich layers present within the Marcellus
Formation. From the Poisson’s Ratio and Young’s Modulus cross plot shaded with the ECS
Lithofacies it is clear that this discrepancy is predominately in the carbonate intervals and gray
mixed shales (Fig. 27). The characterization of brittleness for the other lithofacies have a better
correlation between the two methods.
When the two logs are plotted against one another using the same scaling there are
similarities that are not readily noticeable in the cross plots (Fig. 18). Ignoring the fore
mentioned contradiction between the two methods for the calcite intervals, they generally predict
similar brittleness for the other facies throughout the Marcellus Formation. The two methods
crisscross, overlap, and stay within a few units of each another. The best example of this
agreement between the two methods is from 7,163 -7,170ft (Fig. 18). Both methods are
predicting the interval to be ductile, and both curves have a very similar shape. From 7,124 -
7,143ft the curves do not overlap but rise and fall with relative unison with one another.
There were two organic siliceous shale intervals, at 7,173ft and 7,180ft, that the
brittleness average method estimated to be ductile while the brittleness index method predicted
the intervals to be brittle (Fig. 18). While most siliceous shale is brittle because of the increase in
silica these two intervals also have a fair amount of chlorite. Chlorite and illite are the two clay
minerals decomposed by the Spectrolith® mineralogical log. Intervals and wells with high
amounts of chlorite are harder to fracture and worse producers due to an increase in ductility
induced by the chlorite minerals. Therefore, the characterization of these two intervals as ductile
by the brittleness average method may not be completely inaccurate. Laboratory testing is
needed to either confirm or reject the results for these intervals.

39
Figure 27. Cross plot of Poisson's Ratio and Young's Modulus shaded by ECS Lithofacies.
ECS Lithofacies:
The shale lithofacies computed the using the ELAN mineralogical logs are not as fine
scaled as the actual core description, but serve as an accurate representation of the reservoir for
the purpose of drilling or fracturing. In some ways they prove more beneficial than the
descriptions of the physical core. When describing the core it is difficult to tell when a shale
becomes more siliceous rich vs mudstone rich and the ratio between quartz to carbonate. The
ECS lithofacies also tie the mineralogy with TOC so the organic rich intervals are easily
discernable.
The relationship between the ECS lithofacies and the stratigraphic column were
consistent with one another (Fig. 18). The ECS lithofacies cannot resolve the limestone beds less
than a foot and a half, but it does classify these beds and the surrounding shale as mixed shale
lithofacies. The areas of the core that were described as shale and moderately to very

40
effervescent in the presence of diluted hydrochloric acid were also characterized as mixed shale
ECS lithofacies. The gray shale facies, which are non-organic, corresponded to shale intervals of
the physical core that were described as having a grayish color.
Hydrocarbons associated with organic matter and increased brittleness due to silica
content and lower amounts of clay and carbonate minerals make intervals with abundant organic
siliceous shale a primary completion target in the Marcellus Formation (Fig. 14) (Wang, 2012;
Singh, 2008). The organic siliceous shale lithofacies had an average TOC of 16%. This was the
highest TOC average of all the lithofacies; of the three organic facies it had the highest predicted
average brittleness (47%) (Fig. 14). The only facies that had a higher estimated brittleness than
the organic siliceous shale was the gray siliceous shale. This is to be expected since the presence
of organic matter serves to increase ductility.
Organic mixed shale lithofacies had the second highest average organic content (12.6%).
However, out of the seven facies the organic mixed shale had the third lowest estimated
brittleness (35%) (Fig. 14). The two facies with a lower estimated brittleness were the gray
mixed shale and carbonate intervals, respectively. The increased presence of calcite decreases the
brittleness of a rock. The organic mixed shale is a secondary target because the increased
abundance of carbonate is not as conducive to the propagation of fractures as the silica in the
organic siliceous shale.
The organic mixed shale’s counterpart, the gray mixed shale facies, was less brittle
because of increased calcite abundance and clay minerals (particularly chlorite). When compared
to the organic mixed shale, the gray mixed shale had a 6% increase in clay and calcite, a 10%
decrease in TOC, and 1.5% increase in quartz (Table 1). This indicates that calcite and clay have
a greater effect on brittleness than TOC. This was the only facies where the non-organic facies
was predicted to be less brittle than the organic.
Of the three organic facies the organic mudstone had the lowest estimated TOC (10.5%),
and it had an estimated brittleness of 39%. While the organic mudstone facies had over 40% clay
minerals, it also had a fair amount of quartz (35%) which contributed to its brittleness (Table 1).
It had more quartz than either the mixed shale facies or the carbonate intervals, which, in
addition to the lack of calcite, is why it was estimated to be more brittle than those two

41
lithofacies. The gray mudstone was estimated to have a higher brittleness than the organic
mudstone because of a greater abundance of quartz and less organic matter.
The gray siliceous and mixed shales are not completion targets due to very low amounts
of organic material, averaging 4.4% and 2.7% respectively. However, they could serve to
stimulate fracture growth and connect the borehole to the primary targets (Wang, 2012). The
carbonate intervals are not conducive to fracture propagation, and can be utilized to control
fracture growth. Due to high clay content, increased ductility, and minimal amounts of TOC
(2.5%) the gray mudstone should be avoided.
The upper, middle, and lower Marcellus had varying percentages of the different
lithofacies present (Fig. 13). These changes agreed accordingly with a T-R sequence model. The
lower and middle Marcellus were the most similar with little difference in lithofacies
percentages. The upper Marcellus was the most different and diverse in facies.
Marcellus Formation:
The Marcellus to Tully Formation is one large, 2nd order T-R sequence. The organic rich
shale of the Marcellus Formation is the TST, and the coarsening upward through the upper half
of the Marcellus Formation, the Mahantango Formation, and to the fossiliferous limestone of the
Tully Formation is the RST. Unlike Lash and Engelder’s (2011), this study divided the Marcellus
Formation into three 3rd order T-R sequences instead of two (Fig. 11). The T-R sequences
formed as a result of the interplay between sea level change, flexural subsidence, and sediment
supply.
The discrepancy in the amount of 3rd order cycles within the Marcellus Formation may be
due top placement. There is some debate amongst scientist as to where exactly the Marcellus
Formation ends and the Mahantango Formation begins. While both formations are shale, the
Mahantango is characterized as a non-organic shale as opposed to the organic rich Marcellus
Formation. This characterization of the two formations was yielded to when choosing the top for
the Marcellus Formation.
While some chose to place the Marcellus formation top directly on the last hot shale
gamma ray signature, this study chose to place it at the point where there was no longer any

42
indication of TOC present. By choosing this placement method there was a clear third T-R
sequence present in the Marcellus Formation. When the top was compared to core it directly
correspond to a point immediately below a shale that was heavily burrowed. These burrows
indicate that the water column had become oxygenated enough to support organisms, and
ultimately destroy the preservation potential of organic matter.
When two 2D scanning electron microscope (SEM) images within a few feet on either
side of the Marcellus Formation top were compared there was a noticeable difference in the rock
lithology (Fig. 28 & 29). The main difference was the lack of pyrite framboids and organic
matter present in the SEM image of the Mahantango Formation. Pyrite framboids are present in
reducing environments, therefore, the lack of them further serves as an indication of an
oxygenated water column.
Figure 28: 2D SEM image taken of the core at 7,122ft. The sample was taken from the
Mahantango Formation, and located approximately 3ft (1m) above the Marcellus Formation Top.
OM
Interparticulate
pore Clay

43
Figure 29: 2D SEM image taken of the core at 7,128ft. The sample was taken from the
Marcellus Formation, and located approximately 3ft (1m) below the Marcellus Formation Top.
Lower Marcellus:
In the basin, the lower Marcellus is typically the better producing interval and more
highly targeted for drilling. It had the highest estimated TOC average at 18.7% by volume. The
explanation for the increased production can be sought after by examining the ECS Lithofacies
and their stacking patterns. The lower Marcellus was composed of 66% organic siliceous shale,
30% organic mixed shale, and 4% carbonate intervals (Fig. 13). The carbonate interval was at the
very top of the lower Marcellus at the end of the RST (Fig. 18). There are only seven facies
changes present in the lower Marcellus; the facies are clumped together. Most of the organic
siliceous shale is in the middle to upper portion of the unit. There is a 10ft and 6ft section of
organic siliceous shale separated by a 0.5ft interval of organic mixed shale. This half foot
interval of organic mixed shale is a calcite concretion, and is not thick enough to truly affect
fracture propagation. Therefore, it can be ignored and the two sections of organic siliceous shale
can be considered one thick, continuous interval. The two organic mixed shale intervals at the
base sandwich a 2.5ft thick organic siliceous shale. The organic mixed shale intervals are
estimated to be ductile and would hinder fracture growth.
OM
Pyrite
Interparticulate
pore
Pore Clay

44
As previously mentioned, in the study well the transition from the Onondaga Limestone
to the Marcellus Formation was gradational over an interval of four feet. The gradation was
composed of interlayered beds of limestone and shale that eventually gave way to shale. The
depositional environment during that time alternated between sub- to anoxic waters and
oxygenated waters. The limestone was deposited during oxygenated periods where there was
enough oxygen to support organisms. The thinning of the limestone beds and thickening of the
shale beds indicate that the basin was becoming more prone to suboxic conditions. This was
probably caused by the deepening of the basin to a depth where the destruction of reducing
conditions is not as easily accomplished and would require greater fluctuations in sea level.
When examined in core, the shale throughout the lower Marcellus was black and there
were centimeter scale pockets of ash present (Fig. 30). These little pockets of ash were
commonly light gray with yellow staining and gritty in texture. They were more resistant to
compaction than the surrounding shale and resulted in the shale breaking along bedding planes
parallel to the ash. Finding pockets of ash and thin ash beds in the Marcellus Formation is not an
uncommon occurrence in the basin. It has been theorized that the deposition of ash in the basin
helped fuel productivity in the water column and bottom water anoxia (Ettensohn, 1985a). In the
study well, most of the ash is found in the lower Marcellus and corresponds to the highest levels
of TOC. The only other ash found in the well was located in the middle Marcellus interval
directly below the MFS and a peak in TOC (Fig. 18).
A B

45
Figure 30. A) Image of ash pockets from top looking down on bedding plane. B) Side view of
ash pocket with breakage along shale beds parallel to ash.
There were few natural fractures found in the lower Marcellus. The ones that were
present were generally located on either side of the calcite concretions, and were calcite filled
(Fig. 17). The shale was differentially compacted around the concretion, and had slickensides
along the bedding planes. The shale on either side of the limestone layers at 7,206ft and 7,223ft
have inclined bedding planes. The dip of the bedding gradually dies out and becomes horizontal
as distance from the limestone layers increase.
Middle Marcellus:
The middle Marcellus was composed of 68% organic siliceous shale, 26% organic mixed
shale, 4% gray mixed shale, and 2% carbonate intervals (Fig. 13). It had an average estimated
TOC abundance of 14% by volume. The carbonate interval was at the base of the unit and the
gray mixed shale was in the upper portion of the unit (Fig. 18). The two gray mixed shales where
located directly beneath a calcite concretion and on top of a very calcite rich shale. While the
facies composition of the middle Marcellus was very similar to the lower Marcellus there were
eleven facies changes. The facies were more broken up and thinner than those in the lower
Marcellus. There were four organic siliceous shale intervals mostly separated from one another
by organic mixed shale of a 1.5 -3ft thick. The organic mixed shale intervals are estimated to be
ductile. Due to their thicknesses and presence throughout the entire interval, fracture propagation
would not be as easily achieved as in the lower Marcellus.
The middle Marcellus only had one centimeter scale pocket of ash. There was an
increased abundance of visible pyrite. In the middle Marcellus there are intervals of medium
gray shale present that were not seen in the lower Marcellus (Fig. 18). Based on the ECS facies
and TOC estimation, the medium gray shale at 7,183ft was due to a lack of organic matter. The
medium gray shale at 7,193ft was a result of an increased abundance of calcite. There were very
few natural fractures present in the interval. There were some located around the calcite
concretion at 7,182ft, and two at the very top of the middle Marcellus in the very calcitic shale
that marked the end of the RST. The fracture were only a few centimeters to couple of inches
long, generally calcite filled, and perpendicular to bedding.

46
Upper Marcellus:
The upper Marcellus was the most different out of the three Marcellus Formation
intervals. There was a lot more of the gray shale intervals and organic mudstone present than
found in the other two zones. There was only 39% organic siliceous shale and 9% organic mixed
shale. There was 29% organic mudstone, 13% gray siliceous shale, 7% gray mixed shale, and
3% gray mudstone present in the interval (Fig. 13). The facies are all intermixed and do not have
a repeated pattern. A possible explanation for the mixed facies of the upper Marcellus is an
overall shallowing of the basin and closer proximity to land during deposition. A shallower basin
would accommodate rapid changes in benthic conditions from non-oxygenated to oxygenated.
There is a lot more gray shale facies in this interval than the other two. These gray shale facies
are in direct contact with the black organic rich shale facies. The sharp contacts indicate a rapid
change in bottom water conditions. There are nine such contacts in the upper Marcellus. These
frequent changes would be more likely to occur in shallower water where stratification of the
water column would more easily be destroyed.
In addition to the frequent, sharp facies changes from black organic rich shales to gray
non-organic rich shales in the upper Marcellus, in the mineralogical logs there is a noticeable
increase in the abundance of chlorite (Fig. 26). Chlorite is a clay mineral that typically forms
from the alteration of terrestrially derived minerals. There are also burrows present at 7,158ft
(Fig. 17). These burrows indicate that the bottom waters were oxygenated for periods of time.
The burrows were later replaced with pyrite mineralization.
There were also, what appear to be debris from small turbidity currents at 7,171ft and
7,142ft (Fig. 17). In these deposits there is shell debris with random orientation, broken
fragments, and gradually changed from very shelly at the base to shells floating in mud over
approximately 2.5ft (Fig. 15). The debris was washed down from shallower water due to
disturbances in the water column possibly caused by large storms. These were the only turbidity
current deposits found in the formation, and both were located upper Marcellus interval. This
further serves as indication that the environment of deposition at this time was in shallower water
and closer to land than the Middle and lower Marcellus intervals.

47
While hard to see, the upper Marcellus had visible pyrite throughout the interval. The
pyrite was typically present in the form of very small sparkles that could only be seen when the
core surface was damp. There were some very thin, discontinuous, parallel to bedding fractures
with pyrite mineralization from 7,150- 7,155ft and 7,160- 7,161ft (Fig. 17). From 7,152- 7,155
approximately 50% of the thin, discontinuous, parallel to bedding fracture were filled with
calcite mineralization. The fractures from 7,150- 7,155ft were associated with a mixture organic
mudstone, organic mixed shale, and gray siliceous shale facies. There were some larger natural
fractures from 7,143- 7,148ft (Fig. 18). These fractures were a couple inches in length, had a
lightning bolt shape, perpendicular to bedding, and calcite mineralization. The lithology in this
interval was predominately organic siliceous shale.
Based on the estimated TOC log, the upper Marcellus has an average of 9.3% TOC by
volume. This is the lowest of all three Marcellus Formation intervals. The lower amount of TOC,
mixed lithologies and greater abundance of mudstone makes the upper Marcellus the poorest
interval for production. In contrast, the high amount of TOC, lack of variation in facies, and
limited facies changes makes the lower Marcellus the best target for production.
Regional Sequence Stratigraphy:
Two cross-sections that were chosen to represent the regional sequence stratigraphy were
chosen to show how the formations change along strike (A-A') (Fig. 20) and down dip (B-B')
(Fig. 21- 25). Along strike subsidence, and thus accommodation space, was greater to the
northeast (Fig. 20). The Mahantango and Tully formations on lap on top of the Marcellus
Formation, thin towards the southeast, and eventually pinch out. The Marcellus Formation also
thins gradually towards the southeast, but pinches out further to the southeast than the Tully and
Mahantango formations. Of the three Marcellus Formation intervals, the upper Marcellus thinned
the most.
The down dip cross section (B- B') was flattened on each horizon from the L. Marcellus
to the Tully formation to evaluate how subsidence changed over time, and to remove the effects
of faulting that occurred during the deposition of the Mahantango and Tully formations (Fig. 21-
25). At the end of deposition of the lower Marcellus the greatest subsidence was towards the east
at well #6 followed by wells #4 and #5 (Fig. 21). Subsidence continued to occur in wells #6- 8 at

48
an appreciable amount more than the wells to the west by the end of middle Marcellus deposition
(Fig. 22).
When the down dip cross section was flattened on the U. Marcellus there was discernable
increase in subsidence and accommodation space in wells #4 and #5 (Fig. 23). Well #4 is the
Goff #55 study well. Wells #4- 8 continued to be more greatly affected by subsidence through
time to the end of the Tully Formation (Fig. 24 & 25). Wells #2- 3 also begin to be more effected
by subsidence after the deposition of the U. Marcellus. When flattened on the Mahantango
Formation possible faulting could be seen between well #6 and well #7 (Fig. 24). Well #7 was
displaced higher and this displacement becomes more pronounced in Figure 25 when flattened
on the Tully Formation. Displacement could also be seen between well #4 and #5 in Figure 25.
The formations become thinner up dip to the west. As seen previously in the along strike
cross section, the Mahantango and Tully formations on lap the Marcellus Formation. The
Mahantango Formation pinched out between well #2 and #1 (Fig. 25). The Tully Formation was
gradually thinning to a point of pinching out.
The study well was located in an area that received a moderate amount of
accommodation space and along the slope leading down towards the deeper parts of the basin.
The wells located further east would have been closer to the convergent boundary and would
have underwent greater flexural subsidence. They would have also begun deepening first. The
wells further east, closer to the orogeny, would have also receiver greater amounts of terrestrial
clastic influx. This dilution could explain the repressed gamma-ray signature of well #8 in the B-
B' cross-section.
CONCLUSIONS:
The Marcellus Formation was successfully divided into three intervals using a T-R
sequence stratigraphic approach. These intervals were correlated across the region to other wells
in the area. They were 3rd order T-R sequences that were largely controlled by sea level change.
They were part of an overarching 2nd order T-R sequence that was most likely strongly
controlled by flexural subsidence induced by lithospheric loading, with sea level change being of
secondary importance.

49
The large scale T-R sequence extends from the base of the Marcellus to the Tully
Formation. The lower Marcellus and TST of the middle Marcellus comprise the TST portion of
the large scale T-R sequence. The RST of the middle Marcellus, upper Marcellus, Mahantango,
and Tully formations make up the RST of the large T-R sequence. Pockets of ash are only found
in the TST portion of the T-R sequence. The presence of ash indicates that there was active
volcanism occurring along the eastern margin due to convergence. The absence of ash in the
RST portion indicates that there was a stoppage in volcanic activity and decreased convergence.
Therefore, flexural subsidence would have decreased a substantial amount. Decreased flexural
subsidence would cause a TST deposition.
The black, organic rich shale of the Marcellus Formation was deposited in a reducing
benthic environment. This was confirmed by the strong correlation between TOC and pyrite.
However, the correlation was not strong enough for bottom water anoxia to be the sole reason for
organic matter accumulation. Accumulation would have also been intimately related to overall
productivity in the upper water column and clastic influx into the basin. Based on the
relationship TOC had with the ash pockets, productivity in the water column may have been
fueled partially by the ash. The direct relationship that pyrite had with the TST’s and RST’s of
the Marcellus intervals indicate that fluctuations in sea level played a major role in the oxygen,
or lack thereof, in the bottom waters. The relationship was strong enough such that a
mineralogical log of pyrite abundance could be used to help aid in the separation of a black shale
into T-R sequences.
The ECS facies developed using the advanced mineralogical logs provided an accurate
representation of the formation. While the scale was larger than that of the core descriptions, it
did generally account for the different lithologies. These facies were more quickly made than a
core description, and could quantify the ratio of quartz to carbonate and TOC in a way that core
descriptions cannot. The ECS lithofacies is an accurate representation of the well for the
purposes of drilling, and the characterization of the reservoir can be trusted without the extra
expenditure on core. However, the core is much more useful for finer scale details that can be
used to decipher the history and depositional environment of the Marcellus Formation.
Of the ECS facies, the organic siliceous shale and organic mixed shale had the highest
average TOC, respectively, and classified as brittle. These two facies are the primary targets in
50
the basin due to these characteristics. They were largely found, with the same relative
abundance, in the lower and middle Marcellus intervals in the study well. The abundance of
these facies in the lower half of the Marcellus was a main factor in the large amount of first year
production of the study well.
The Goff #55, in Harrison County, WV was situated in an area that was dipping not only
down dip but also along strike. The basin was dipping along strike due to the diminishing effects
of flexural subsidence. In both cross sections the Tully and Mahantango formations pinch out
against the Marcellus, and the upper Marcellus has thinned the most of the three Marcellus
intervals. This type of on lapping and pinching out is to be expected due to the large T-R
sequence. The lower Marcellus was deposited in a deeper more wide spread environment, while
the later formations were deposited in shallower, gradually more restricted environments.

51
REFERENCES:
Blakey, R., 2010, Middle Devonian (385Ma), North American Paleogeography.
http://www2.nau.edu/rcb7/globaltext2.html, accessed October 13, 2014.
Boggs, Sam, Jr. Principles of Sedimentology and Stratigraphy. 5th ed. Upper Saddle River, NJ:
Pearson Prentice Hall, 2012. Print.
Castle, J.W., 2001, Appalachian basin stratigraphic response to convergent-margin structural
evolution: Basin Research, v. 13, p. 397-418.
Catuneanu, O., and others, 2009, Towards the standardization of sequence stratigraphy. Earth
Science Reviews 92, p. 1-33. http://dx.doi.org/10.1016/j.earscirev.2008.10.003
Dennison, J., 1985, Catskill Delta shallow marine strata, in Woodrow, D.L., and Sevon, W.D.,
eds., The Catskill Delta: Geological Society of America special paper 201, p. 91-106.
Ettensohn, F.R., 1985a, The Catskill Delta complex and the Acadian orogeny: A model, in
Woodrow, D.L., and Sevon, W.D. (Eds.): The Catskill Delta: Geological Society
America special paper 201, p. 39–49.
Ettensohn, F.R., 1985b, Controls on development of Catskill Delta complex basin-facies, in
Woodrow, D.L., and Sevon, W.D., (Eds.): The Catskill Delta: Geological Society of
America Special Paper 201, p. 65-77.
Ettensohn, F.R., 1992, Controls on the origin of the Devonian-Mississippian oil and gas shales,
east-central United States: Fuel, v. 71, p. 1487-1492.
Ettensohn, F.R., and Brett, C.E., 2002, Stratigraphic evidence from the Appalachian Basin for
the continuation of the Taconian orogeny into Early Silurian time: Physics and Chemistry
of the Earth, Parts A/B/C, v. 27, p. 279-288.
Ettensohn, F.R., 2004, Modeling the nature and development of major Paleozoic clastic wedges
in the Appalachian Basin, USA: Journal of Geodynamics, v. 37, p. 657-681.
Faill, R.T., 1985, The Acadian orogeny and the Catskill Delta, in Woodrow, D. L., and Sevon,
W.D., (Eds.): The Catskill Delta: Geological Society of America Special Paper 201, p.
15-37.
Faill, R.T., 1997, A Geologic History of the Northern-Central Appalachians, Part 2: The
Appalachian Basin from the Silurian through the Carboniferous: American Journal of
Science, v. 297, p. 729-761.
Glossary of Geology and Related Sciences, Amer. Geology. Inst., 1960, Washington D.C.
52
Grieser, W., and Bray, J., 2007, Identification of production potential in unconventional
reservoirs. SPE Paper: 106623.
Jarvie, D. M., R. J. Hill, T. E. Ruble, and R. M. Pollastro, 2007, Unconventional shale-gas
systems: The Mississippian Barnett Shale of North-Central Texas as one model for
thermogenic shale-gas assessment: AAPG Bulletin, 91, 475–499,
doi:10.1306/12190606068.
Kent, D.V., 1985, Paleocontinental setting for the Catskill Delta, in Woodrow, D.L., and
Sevon, W.D., (Eds.): The Catskill Delta: Geological Society of America Special Paper
201, p. 9-14.
Lash, G.G., and Engelder T.J., 2011, Thickness trends and sequence stratigraphy of Middle
Devonian Marcellus Formation, Appalachian Basin: Implications for Acadian foreland
basin evolution. AAPG Bulletin, 95, 61–103.
Lash, Gary G., and Blodd, David R., 2014, Organic matter accumulation, redox, and diagenetic
history of the Marcellus Formation, southwestern Pennsylvania, Appalachian basin.
Marine and Petroleum Geolgoy 57, p. 244-263.
http://dx.doi.org/10:1016/j.marpetgeo.2014.06.001.
Lazar, R.K., Bohacs, J.H., S. Macquaker, and J. Schieber, 2010, Fine-grained Rocks in Outcrops:
Classification and Description Guidelines, in Schieber, J., Lazar, R., and Bohacs, K. eds.,
Sedimentology and stratigraphy of shale: American Association Petroleum Geologists
2010 Annual Convention in New Orleans Field Guide for Post-Convention Field Trip 10,
p. 3-14.
Mabesoone, Jannes M. and Neumann, Virginio H., 2005, Cyclic Development of Sedimentary
Basins. (pp. 139-172). Elsevier. Online version available at:
http://app.knovel.com/hotlink/toc/id:kpCDSB0001/cyclic-development-sedimentary/
cyclic-development-sedimentary.
Murphy, J.B., and Keppie, J.D., 2005, The Acadian Orogeny in the Northern Appalachians,
International Geology Review, 47:7, 663-687, DOI:10.2747/0020-6814.47.7.663
Mullen, M. J., Roundtree, R., & Turk, G. A., 2007, A Composite Determination of Mechanical
Rock Properties for Stimulation Design (What to Do When You Don’t Have a Sonic
Log): Society of Petroleum Engineers. doi:10.2118/108139-MS.
NETL, 2010, Projecting the Economic Impact of Marcellus Shale Gas Development in West
Virginia: A preliminary Analysis Using Publicly Available Data. Anthony M.
Zammarilli.
NETL, 2013, Modern Shale Gas Development in the United States: An Update.
53
News and Information About Geology and Earth Science. Digital image. Geology.com: News
and Information for Geology & Earth Science. Web. 15 Oct. 2014.
Passey, Q.R., S. Creaney, J.B. Kulla, F.J. Moretti, and J.D. Stroud, 1990, A practical model for
organic richness from porosity and resistivity logs. AAPG Bulletin, v. 74, p. 1777-1794.
Rickman, R., Mullen, M., Petre, E., Grieser, B., and Kundert, D., 2008, A practical use of shale
petrophysics for simulation design optimization: All shale plays are not clones of the
Barnett Shale. SPE paper 115258.
Schmoker, J. W., 1981, Determination of organic-matter content of Appalachian shales from
gamma-ray logs. AAPG Bulletin, v. 65, p.1285-1298.
Singh, P., 2008, Lithofacies and sequence stratigraphic framework of the Barnett Shale: Ph.D.
dissertation, ConocoPhillips School of Geology and Geophysics: The University of
Oklahoma.
Slatt, R. M., Philp, P. R., Abousleiman, Y., Singh, P., Perez, R., Portas, R., Marfurt, K. J.,
Madrid-Arroyo, S., O’Brien, N., Eslinger, E. V., and Varuch, E. T., 2012, Pore-to-
regional-scale Integrated Characterization Workflow for Unconventional Gas Shales, in
J. A. Breyer, ed., Shale Reservoirs- Giant Resources for the 21st Century: AAPG Memoir
97, p. 127-150.
Staal, C.R., Whalen, J.B., Vaquero, P.V., Zagorevski, A., and Rogers, N., 2009,
Pre-Carboniferous, episodic accretion-related, orogenesis along the Laurentian margin of
the northern Appalachians, in Murphy, J.B., Keppie., J.D., and Hynes, A.J., (Eds.):
Ancient Orogens and Modern Analogues: Geological Society, London, Special Paper
327, p. 271-316. DOI: 10.1144/SP327.13
Wang, Guochang. "Black Shale Lithofacies Prediction and Distribution Pattern Analysis of
Middle Devonian Marcellus Shale in the Appalachian Basin, Northeastern U.S.A." Order
No. 3530347 West Virginia University, 2012. Ann Arbor: ProQuest. Web. 22 Aug. 2015.
Wang, F. P., and J. F. W. Gale, 2009, Screening criteria for shale-gas systems: Gulf Coast
Association of Geological Societies Transactions, 59, 779–793.
Wang, Guochang, and Carr, Timothy R., 2012, Methodology of organic-rich shale lithofacies
identification and prediction: A case study from Marcellus Shale in the Appalachian
basin: Computers &Geosciences, v. 49, p. 151-163.
Wells, F., 2004, A New Method to Help Identify Unconventional Targets for Exploration and
Development Through Integrative Analysis of Clastic Rock Property Fields: Houston
Geological Society Bulletin, October issue, p. 35-49.
WVGES O&G Record Reporting System. West Virginia Geological and Economic Survey,
http://www.wvgs.wvnet.edu/oginfo/pipeline/pipeline2.asp, accessed Feb. 03, 2015.

54
Woodrow, D. L., 1985, Paleogeography, paleoclimate, and sedimentary processes of the Late
Devonian Catskill Delta, in Woodrow, D.L., and Sevon, W.D., (Eds.): The Catskill Delta:
Geological Society of America Special Paper 201, p. 51-63.
Zagorski, W. A., Wrightstone, G. R., Bowman, D. C., 2012, The Appalachian Basin Marcellus
Gas Play: Its History of Development, Geologic Controls on Production, and Future
Potential as a World-class Reservoir, in J.A. Breyer ed., Sale Reservoirs- Giant
Resources for the 21st Century: AAPG Memoir 97, p. 172-200.
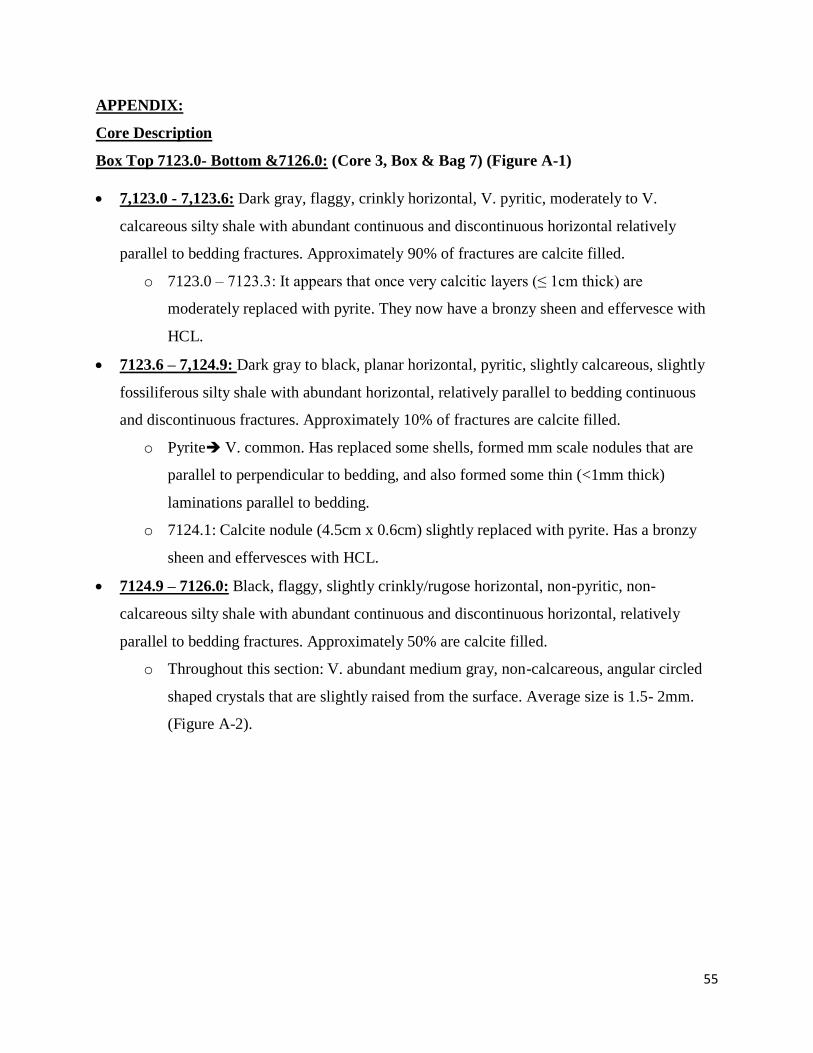
55
APPENDIX:
Core Description
Box Top 7123.0- Bottom &7126.0: (Core 3, Box & Bag 7) (Figure A-1)
7,123.0 - 7,123.6: Dark gray, flaggy, crinkly horizontal, V. pyritic, moderately to V.
calcareous silty shale with abundant continuous and discontinuous horizontal relatively
parallel to bedding fractures. Approximately 90% of fractures are calcite filled.
o 7123.0 – 7123.3: It appears that once very calcitic layers (≤ 1cm thick) are
moderately replaced with pyrite. They now have a bronzy sheen and effervesce with
HCL.
7123.6 – 7,124.9: Dark gray to black, planar horizontal, pyritic, slightly calcareous, slightly
fossiliferous silty shale with abundant horizontal, relatively parallel to bedding continuous
and discontinuous fractures. Approximately 10% of fractures are calcite filled.
o Pyrite V. common. Has replaced some shells, formed mm scale nodules that are
parallel to perpendicular to bedding, and also formed some thin (<1mm thick)
laminations parallel to bedding.
o 7124.1: Calcite nodule (4.5cm x 0.6cm) slightly replaced with pyrite. Has a bronzy
sheen and effervesces with HCL.
7124.9 – 7126.0: Black, flaggy, slightly crinkly/rugose horizontal, non-pyritic, non-
calcareous silty shale with abundant continuous and discontinuous horizontal, relatively
parallel to bedding fractures. Approximately 50% are calcite filled.
o Throughout this section: V. abundant medium gray, non-calcareous, angular circled
shaped crystals that are slightly raised from the surface. Average size is 1.5- 2mm.
(Figure A-2).
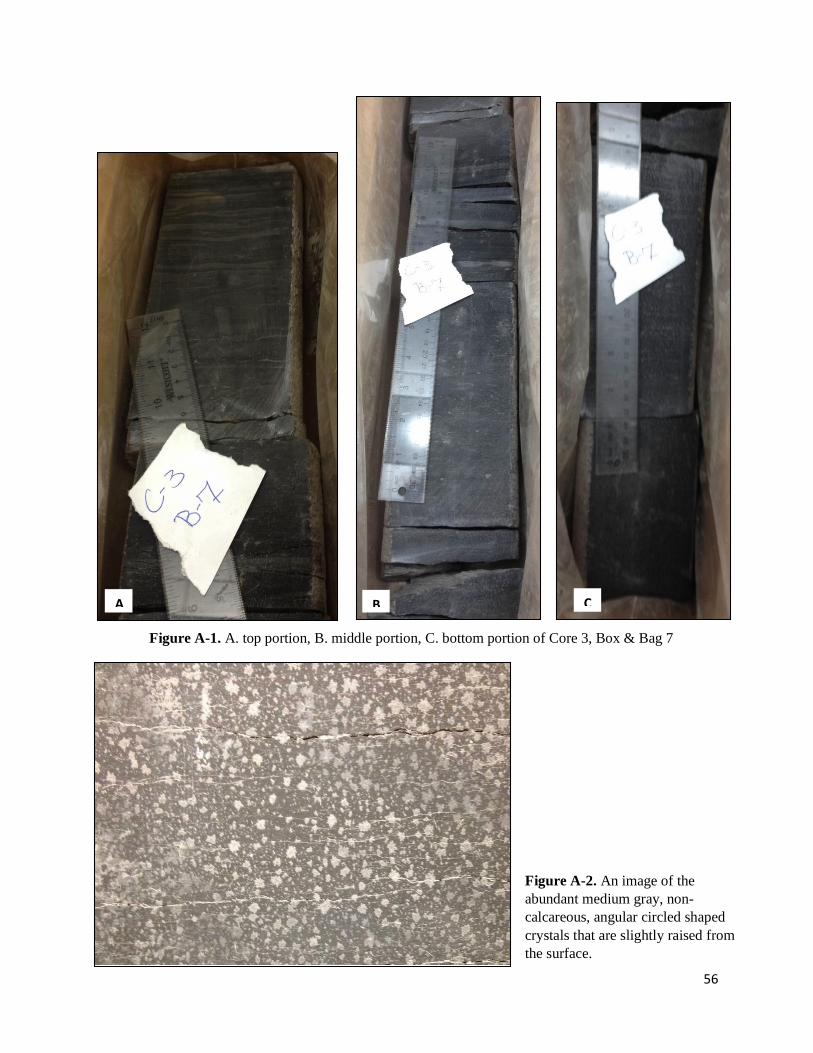
56
Figure A-1. A. top portion, B. middle portion, C. bottom portion of Core 3, Box & Bag 7
Figure A-2. An image of the
abundant medium gray, non-
calcareous, angular circled shaped
crystals that are slightly raised from
the surface.
A B C

57
Box Top 7126.0 – Bottom 7129.0: (Core 3, Box & Bag 8) (Figure A-3)
7126.0 - 7129.0: Black, flaggy, bedding planes transitions from slightly crinkly at 7126.0 to
planar at 7129.0, horizontal, non-calcareous, non-pyritic silty shale with abundant horizontal,
relatively parallel to bedding, continuous and discontinuous fractures.
o Throughout this section: abundant medium gray, non-calcareous, angular circled
shaped crystals that are slightly raised from the surface. Average size is < 1mm.
o 7128.75: Mineralogy (Wt.%): 37% Silica, 60% Clay, 3% Carbonate.
Box Top 7129.0 – Bottom 7132.0: (Core 3, Box & Bag 9) (Figure A-4)
7129.0 – 7130.7: Missing (7130.5: TOC= 4.46 Wt. %)
7130.7 – 7132.0: From 7130.7 to 7131.0 black and from 7131.0 to 7132.0 dark gray, flaggy,
planar horizontal bedding, non-calcareous, non- to slightly pyritic silty shale with abundant
horizontal, relatively parallel to bedding, continuous and discontinuous fractures.
o Throughout this section: abundant medium gray, non-calcareous, angular circled
shaped crystals that are slightly raised from the surface. Average size is < 1mm. Also,
these crystals are still common but not quite as abundant in the dark gray shale versus
the black shale.
Box Top 7132.0 – Bottom 7133.8: (Core 3, Box & Bag 10) (Figure A-4)
7132.0 – 7133.8: Dark gray to black, flaggy, planar horizontal bedding, non-calcareous, non-
pyritic silty shale with abundant horizontal, parallel to bedding, continuous and
discontinuous fractures.
o Throughout this section: abundant medium gray, non-calcareous, angular circled
shaped crystals that are slightly raised from the surface. Average size is much < 1mm.
**Note: no core/sample recovered for 7133.8 – 7134.0**

58
Figure A-3.
Picture of Core 3,
Box & Bag 8
Figure A-4.
Picture of Core 3,
Box & Bag 9
Figure A-5.
Picture of Core 3,
Box & Bag 10

59
Box Top 7134.0 – Bottom 7137.0: (Core 4, Box & Bag 1) (Figure A-6)
7134.0 – 7137.0: Dark gray to black, flaggy, planar horizontal, non-calcareous, non- to V.
slightly pyritic from 7134.0 to 7136.0 and slightly pyritic from 7136.0 to 7137.0 silty shale
with abundant horizontal, relatively parallel to bedding, continuous and discontinuous
fractures from 7134.0 to 7136.5.
o 7135.3: Mineralogy (Wt.%): 36% Silica, 63% Clay, 1% Carbonate.
Box Top 7137.0 – Bottom 7140.0: (Core 4, Box & Bag 2) (Figure A-7)
7137.0 – 7139.0: Black, flaggy, planar horizontal, non-calcareous, non- to slightly pyritic
silty shale with abundant horizontal, relatively parallel to bedding, continuous and
discontinuous fractures.
o V. slightly pyritic- can barely see bronze sparkles reflecting when moved in light and
at 7138.45 there is a <1mm thick, continuous bronzy, pyrite lamination.
7139.0 – 7140.0: Missing
Box Top 7140.0 – Bottom 7143.0: (Core 4, Box & Bag 3) (Figure A-8)
7140.0 – 7140.7: Missing (7140.5: TOC= 2.55 Wt. %)
7140.7 – 7142.5: Possible turbidity current.
o 7140.7 – 7142.1: Black, fossiliferous silty shale with planar horizontal bedding at
7140.7 that grades down to dark gray with crinkly/rugose bedding at 7142.1, flaggy,
calcareous/ fossiliferous, non-pyritic wackestone.
Fossiliferous- abundance of seashells increases vertically with depth, and
includes brachiopods ( ) and fossil fragments.
7141.25: Mineralogy (Wt. %) 32% Silica, 49% Clay, 19% Carbonate.
o 7142.1 – 7142.5: Dark gray, flaggy, planar to slightly crinkly/rugose horizontal,
decreasing vertically with depth from V. calcareous to slightly calcareous.
Calcareous- no visible shells/ skeletal fragments. From 7142.1 to 7142.25
there entire layers are wavy and medium gray due to laminations
(wackestone), as the depth increases to from 7142.25 to 7142.5 the
laminations gradually become short, discontinuous, V. thin (<0.5mm),
medium gray laminations.

60
7142.5 – 7142.8: V. dark gray to black, flaggy, planar horizontal, V. slightly calcareous, non-
pyritic silty shale.
o V. slightly calcareous- barely bubbles with HCL, and I can see little white specs.
7142.8 – 7143.0: Black, flaggy, planar horizontal, non-calcareous, V. slightly pyritic silty
shale.
Figure A-6.
Picture of Core 4,
Box & Bag 1
Figure A-7.
Picture of Core 4,
Box & Bag 2
Figure A-8.
Picture of Core 3,
Box & Bag 3
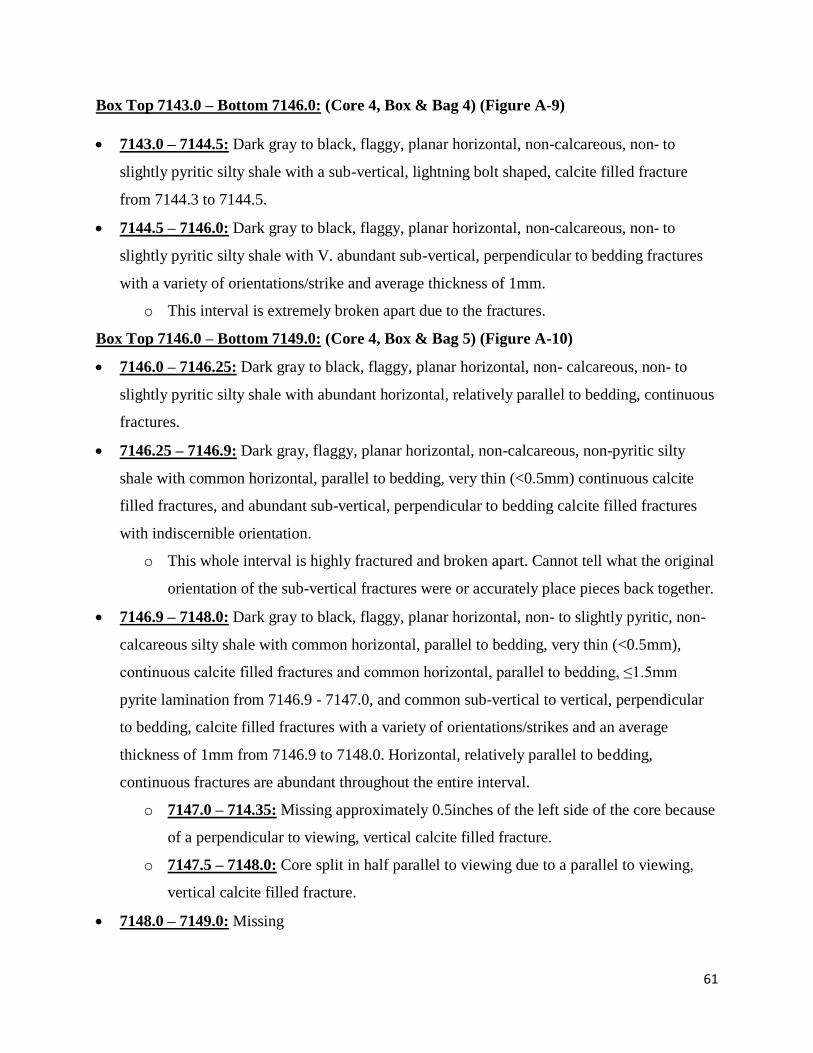
61
Box Top 7143.0 – Bottom 7146.0: (Core 4, Box & Bag 4) (Figure A-9)
7143.0 – 7144.5: Dark gray to black, flaggy, planar horizontal, non-calcareous, non- to
slightly pyritic silty shale with a sub-vertical, lightning bolt shaped, calcite filled fracture
from 7144.3 to 7144.5.
7144.5 – 7146.0: Dark gray to black, flaggy, planar horizontal, non-calcareous, non- to
slightly pyritic silty shale with V. abundant sub-vertical, perpendicular to bedding fractures
with a variety of orientations/strike and average thickness of 1mm.
o This interval is extremely broken apart due to the fractures.
Box Top 7146.0 – Bottom 7149.0: (Core 4, Box & Bag 5) (Figure A-10)
7146.0 – 7146.25: Dark gray to black, flaggy, planar horizontal, non- calcareous, non- to
slightly pyritic silty shale with abundant horizontal, relatively parallel to bedding, continuous
fractures.
7146.25 – 7146.9: Dark gray, flaggy, planar horizontal, non-calcareous, non-pyritic silty
shale with common horizontal, parallel to bedding, very thin (<0.5mm) continuous calcite
filled fractures, and abundant sub-vertical, perpendicular to bedding calcite filled fractures
with indiscernible orientation.
o This whole interval is highly fractured and broken apart. Cannot tell what the original
orientation of the sub-vertical fractures were or accurately place pieces back together.
7146.9 – 7148.0: Dark gray to black, flaggy, planar horizontal, non- to slightly pyritic, non-
calcareous silty shale with common horizontal, parallel to bedding, very thin (<0.5mm),
continuous calcite filled fractures and common horizontal, parallel to bedding, ≤1.5mm
pyrite lamination from 7146.9 - 7147.0, and common sub-vertical to vertical, perpendicular
to bedding, calcite filled fractures with a variety of orientations/strikes and an average
thickness of 1mm from 7146.9 to 7148.0. Horizontal, relatively parallel to bedding,
continuous fractures are abundant throughout the entire interval.
o 7147.0 – 714.35: Missing approximately 0.5inches of the left side of the core because
of a perpendicular to viewing, vertical calcite filled fracture.
o 7147.5 – 7148.0: Core split in half parallel to viewing due to a parallel to viewing,
vertical calcite filled fracture.
7148.0 – 7149.0: Missing

62
Figure A-9. Picture of Core 4, Box & Bag 4.
A. Top portion. B. Bottom Portion.
Figure A-10. Picture of Core 4,
Box & Bag 5
A B

63
Box Top 7149.0 – Bottom 7152.0: (Core 4, Box & Bag 6) (Figure A-11)
7149.0 – 7149.7: Missing (7149.5: TOC= 4.28 Wt. %)
7149.7 – 7152.0: Dark gray and black, flaggy, planar horizontal, non-calcareous, slightly
pyritic silty shale.
o Pyrite- Very short, very thin (<0.5mm), hard to see, parallel to bedding, discontinuous
pyrite laminae throughout. Continuous, parallel to bedding, 1- 1.5mm thick pyrite
laminations at 7150.5 and two at 7151.4.
Box Top 7152.0 – Bottom 7155.0: (Core 4, Box & Bag 7) (Figure A-12)
7152.0 – 7155.0: Dark gray to black, flaggy, planar horizontal, non- to slightly calcareous,
very slightly pyritic silty shale.
o Pyrite & Calcite- Two millimeter scale nodules in the interval, and very faint/ hard to
see discontinuous, parallel to bedding pyrite and calcite laminations.
Box Top 7155.0 – Bottom 7158.0: (Core 4, Box & Bag 8) (Figure A-13)
7155.0 – 7156.9: Very dark gray to black, flaggy, planar horizontal, non-calcareous, non- to
very slightly pyritic silty shale.
o 7156.4- Pyrite nodule (1cm wide x 4.5mm thick).
o 7156.85 – 7156.9: Dark gray, flaggy, crinkly/rugose horizontal, calcareous, non-
pyritic silty shale.
7156.9 – 7157.5: Missing
7157.5 – 7158.0: Dark gray, flaggy, crinkly/rugose horizontal, very calcareous, moderately
to very pyritic silty shale.
o There appears to be a high abundance of burrows present that have been replaced
with pyrite. Due to the abundance it is not possible to tell if they are fizzing in the
presence of acid or if it is the shale. When dry the burrows have a medium gray
coloration, however when damp they are very dark brown/bronze due to pyrite
(Figure A-13B).

64
Figure A-11.
Picture of Core 4,
Box & Bag 6.
Figure A-13. Picture of Core 4, Box & Bag 8.
A. Top portion. B. Bottom Portion and possible burrows.
Figure A-12.
Picture of Core 4,
Box & Bag 7.
A B

65
Box Top 7158.0 – Bottom 7161.0: (Core 4, Box & Bag 9) (Figure A-14)
7158.0 – 7159.7: Missing (7159.0: TOC= 0.58 Wt. %)
7159.7 – 7161.0: Dark gray to black, flaggy, planar, horizontal, non-calcareous, slightly to
moderately pyritic silty shale with occasional very thin (<0.5mm) continuous and
discontinuous calcite laminations.
o Pyrite- short (<0.5cm long), very thin (<0.5mm) discontinuous pyrite laminations
common throughout the interval and some millimeter scale pyrite nodules at the base
of the unit.
Box Top 7161.0 – Bottom 7164.0: (Core 4, Box & Bag 10)
(Missing Entire Box)
7162.45: Mineralogy (Wt.%): 32% Silica, 57% Clay, 11% Carbonate.
Box Top 7164.0 – Bottom 7167.0: (Core 4, Box & Bag 11) (Figure A-15)
7164.0 – 7167.0: Black, flaggy, planar horizontal, non- to slightly calcareous, slightly to
moderately pyritic silty shale. Pyrite is present as very small, hard to see crystals throughout
the interval, and five millimeter scale nodules from 7166.0 to 7166.6. At 7166.6 there is an
almost perfect cubic (0.5cm x 0.5cm) pyrite crystal. At 7166.0 is a thin (approximate 0.5mm
thick), continuous, parallel to bedding calcite lamination. At 7164.25 is a medium gray
calcite concretion (3.8cm wide x 2.3cm thick). Shale is differentially compacted around the
concretion and exhibits slickensides along bedding planes.
Box Top 7167.0 – Bottom 7170.0: (Core 4, Box & Bag 12) (Figure A-16)
7167.0 – 7167.5: Black, flaggy, planar horizontal, slightly calcareous, non-pyritic silty shale
with common faint, discontinuous, very thin (<0.5mm) calcite laminations.
7167.5 – 7168.2: Black, flaggy, planar curved, slightly to moderately calcareous, non-pyritic
silty shale differentially compacted around a medium gray, slightly pyritic around the edges,
calcite concretion (8.5cm wide x 3.2cm thick) at 7167.85. The shale’s calcite concentration
increases closer to the concretion, and bedding planes near the calcite concretion exhibit
slickensides. There are abundant medium gray, discontinuous, relatively parallel to bedding,
calcite laminations 1 inch on either side of the calcite concretion. On 0.2 feet of either side of
the concretion are calcite filled, thin (≤1mm), dipping approximately 45° fractures.
o The top and base of this interval correspond to the upper and lower limits of
differential compaction.

66
7168.2 – 7168.7: Black, flaggy, planar horizontal, non-calcareous, very pyritic silty shale.
The pyrite is gold in coloration and form thin (<1mm), continuous and discontinuous,
horizontal, parallel to bedding lamination that are on average separated by 2 to 5 millimeters.
7168.7 – 7168.95: Black, flaggy, planar horizontal, non-calcareous, non-pyritic silty shale.
7168.95 – 7170.0: Missing
Figure A-14.
Picture of Core 4,
Box & Bag 9.
Figure A-15.
Picture of Core 4,
Box & Bag 11.
Figure A-16.
Picture of Core 4,
Box & Bag 12.

67
Box Top 7170.0 – Bottom 7173.0: (Core 4, Box & Bag 13) (Figure A-17)
7170.0 – 7170.7: Missing (7170.5: TOC= 4.71 Wt. %)
7170.7 – 7171.25: This whole sequence is a turbidity current. Essentially grades from a
wackestone at the base to a very calcareous silty shale at the top.
o 7170.7 – 7170.9: Dark gray, flaggy, slightly wavy sub-horizontal, slightly calcareous,
non-pyritic, slightly fossiliferous silty shale.
o 7170.9 – 7171.05: Medium gray, flaggy, wavy sub-horizontal, moderately to very
calcareous, non-pyritic, fossiliferous silty shale.
o 7171.05 – 7171.25: Light gray at base (0.5cm thick) and medium gray throughout the
rest of the interval, flaggy, wavy/crinkly sub-horizontal, fossiliferous, very
argillaceous limestone (wackestone).The unit becomes less argillaceous with depth
and skeletal fragments become highly abundant.
7171.25 – 7171.45: Black, flaggy, planar horizontal, non- to slightly calcareous, non-pyritic
silty shale. Calcite is in the form of very thin (<0.5mm), discontinuous, parallel to bedding
laminations.
7171.45 – 7172.05: Black, flaggy, planar horizontal to sub-horizontal, non- to slightly
calcareous, non-pyritic silty shale differentially compacted around 12 medium gray with a
bronze sheen, non-calcareous, pyritic concretions that range in size from 0.5cm to 4cm in
length and ≤12mm thick. Extending laterally from the sides of the concretion are 2mm or less
thick lamination of pyrite. Due to the medium gray coloration of the concretions and bronze
sheen, these were probably calcite concretions that were replaced with pyrite.
o Along the exposed/separated bedding planes in this interval are brachiopod shells.
These surfaces are slightly calcareous.
7172.05 – 7173.0: Black, flaggy, planar horizontal, non-calcareous, slightly pyritic silty sale.
Pyrite is in the form of small (<2mm), hard to see bronze and gold crystals throughout the
interval.

68
A
B C
D
Figure A-17. Picture of Core 4, Box & Bag 13 and features within that section. A. The upper portion of
the core. B. The lower section of the core (continuing from where picture A stopped). C. A zoomed in
image of the turbidity current. D. Image of seashells along bedding planes (location indicated by red
arrow in image A).

69
Box Top 7173.0 – Bottom 7176.0: (Core 4, Box & Bag 14) (Figure A-18)
7173.0 – 7175.9: Black, flaggy, planar horizontal, non-calcareous, non- to slightly pyritic
silty shale.
7175.9 – 7176.0: Dark gray to black, flaggy, planar horizontal, slightly calcareous, non-
pyritic silty shale
Box Top 7176.0 – Bottom 7179.0: (Core 4, Box & Bag 15) (Figure A-19)
7176.0 – 7176.6: Black, flaggy, planar horizontal, non-calcareous, slightly pyritic silty shale
with a sub-vertical, thin (<1mm), bronze, pyrite filled fracture from 7176.5 to 7176.6.
7176.6 – 7178.1: Medium gray, flaggy to slabby, crinkly/rugose horizontal, very calcareous,
non-pyritic silty shale to very argillaceous wackestone with light gray, 3- 4mm thick,
parallel to bedding, calcite laminations at the top and base of the unit. From 7176.6 to 7177.5
is a thin (<1mm), sub-vertical, calcite filled fracture.
7178.1 – 7179.0: Black, flaggy, planar sub-horizontal (dipping 8-10° to the right), non-
calcareous, moderately pyritic silty shale. The pyrite in this interval forms continuous,
parallel to bedding, bronze laminations that are 0.5cm thick at 7178.2 and 1.2cm thick at
7178.45.
Box Top 7179.0 – Bottom 7182.0: (Core 4, Box & Bag 16) (Figure A-20)
7179.0 – 7 180.7: Missing (7180.0: TOC= 3.98 Wt. %)
7180.7 – 7182.0: Black with dark gray in middle (0.3ft), flaggy, planar sub-horizontal
(dipping ~8° to the right at top of the unit and increasing a ~15° dip at the base), non-
calcareous, non- to very slightly pyritic silty shale with a 1mm thick, subvertical, calcite
filled fracture from 7181.8 to 7182.0.

70
Figure A-18.
Picture of Core 4,
Box & Bag 14.
Figure A-19.
Picture of Core 4,
Box & Bag 15.
Figure A-20.
Picture of Core 4,
Box & Bag 16.

71
Box Top 7182.0 – Bottom 7185.0: (Core 4, Box & Bag 17) (Figure A-21)
7182.0 – 7182.6: Medium gray, slightly pyritic, argillaceous, calcite concretion with a black,
non-calcareous, non-pyritic silty shale differentially compacted around the concretion. Along
the outer edge of the concretion, within the shale, is a >1mm thick, very pyritic, calcite filled
fracture dipping at ~60°.
7182.6 – 7183.0: Black, flaggy, planar sub-horizontal (dipping ~15° to the left), non-
calcareous, non-pyritic silty shale that has been cross cut by the very pyritic, calcite filled
fracture from above. There are slickensides present along the bedding planes at 7182.6.
o This unit was extremely broken apart and was pieced together as best as possible.
The left inch or so of the core is missing or in smaller pieces spread throughout
the box.
7183.0 – 7185.0: Black with a dark gray interval from 7183.35 to 7183.7, flaggy, planar sub-
horizontal (dipping ~15°- 20° to the left), non-calcareous, very slightly pyritic silty shale.
Pyrite is in the form several (5) millimeter scale nodules.
Box Top 7185.0 – Bottom 7188.0: (Core 4, Box & Bag 18) (Figure A-22)
7185.0 – 7186.4: Black, flaggy, planar sub-horizontal (dipping ~10° to the left), non-
calcareous, non- to slightly pyritic silty shale. Pyrite is in the form of very thin to thin
(<0.5mm - <1mm), continuous and discontinuous, parallel to bedding laminations, and is
most common from 7185.75 to 7185.95. Elsewhere in the interval, there is little to no pyrite
present.
7186.4 – 7188: Black with three 0.15ft thick dark gray layers from 7187.25 to 7188.0,
flaggy, planar horizontal, non-calcareous, non- to very slightly pyritic silty shale
differentially compacted (0.1ft) around a medium gray with a slightly bronzy sheen, pyritic,
argillaceous, calcite concretion at 7187.2 that is 4in wide and 1.5inches thick. Pyrite is
slightly present throughout the concretion (causing the bronzy sheen), and forms a thin
lamination along the inside of the concretion. Pyrite is present in the silty shale as very thin
(<0.5mm), hard to see, discontinuous laminations.

72
18
Figure A-21. Picture of Core 4, Box & Bag 17.
A. The upper portion of the core. B. The lower
portion of core (continuing from where picture
A stopped).
Figure A-22. Picture of Core 4, Box & Bag
18. A. The upper portion of the core. B. The
lower portion of core (continuing from where
picture A stopped).
A B A B

73
Box Top 7188.0 – Bottom 7191.0: (Core 4, Box & Bag 19) (Figure A-23)
7188.0 – 7190.0: Very dark gray and black, flaggy, planar horizontal, non-calcareous, non-
to very slightly pyritic silty shale. Pyrite is present in this interval in the form of a few (6)
millimeter to centimeter scale nodules. The size is 1cm wide by 2mm thick.
7190.0- 7191.0: Missing
Box Top 7191.0 - Bottom 7193.9: (Core 4, Box & Bag 20) (Figure A-24)
7191.0 – 7191.7: Missing (7191.5: TOC= 1.7 Wt. %)
7191.7 – 7193.3: Black, flaggy, planar horizontal, non-calcareous, non- to very slightly
pyritic silty shale. The pyrite in this interval is in the form of four millimeter scale nodules,
and one faint laminae.
7193.3 – 7193.9: Dark gray to black, flaggy, planar horizontal, slightly to moderately
calcareous, non-pyritic silty shale.
Box Top 7194.0 – Bottom 7197.0: (Core 5, Box & Bag 1) (Figure A-25)
7194.0 – 7197.0: Black, flaggy, planar horizontal and curved (at 7195.0 to 7195.2 and
7196.1), non-calcareous, non- to slightly pyritic silty shale with a light to medium gray with
yellow staining, grainy/gritty, fibrous, circular (15mm x 15mm) ash pocket at 7196.0. Pyrite
is present in the form of faint, hard to see, discontinuous, parallel to bedding laminations,
millimeter scale nodules, and one 1cm thick, continuous, parallel to bedding lamination at
7195.7.
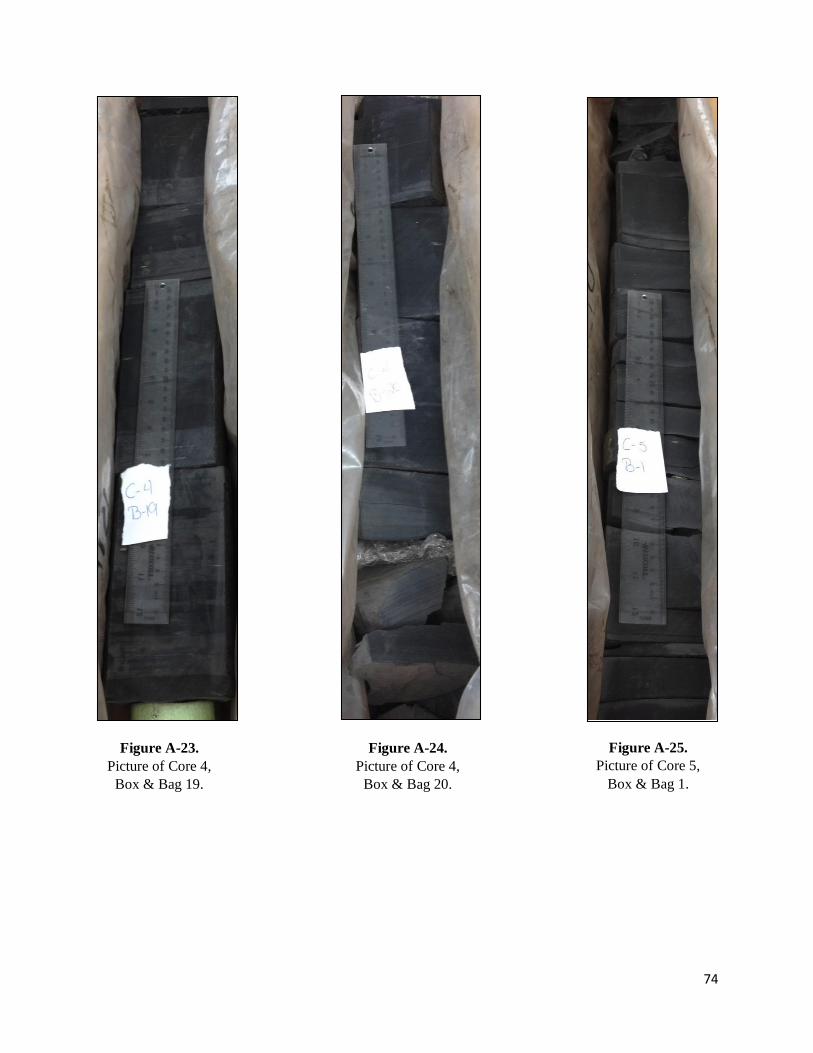
74
Figure A-23.
Picture of Core 4,
Box & Bag 19.
Figure A-24.
Picture of Core 4,
Box & Bag 20.
Figure A-25.
Picture of Core 5,
Box & Bag 1.

75
Box Top 7197.0 – Bottom 7200.0: (Core 5, Box & Bag 2) (Figure A-26)
7197.0 – 7198.8: Black, flaggy, planar horizontal, non-calcareous, very slightly pyritic silty
shale. Pyrite is in the form of very small, hard to see crystals throughout the interval.
7198.8 – 7199.7: Missing
7199.7 – 7200.0: Medium gray, non-pyritic, argillaceous calcite concretion. To the left of the
core this medium gray unit has a curved vertically/circular edge and the rock is a dark gray,
non-calcareous, non-pyritic silty shale. There is a very thin (<0.5mm), dipping ~60° to the
right, calcite filled fracture from 7199.7-7199.9. There are two sub-horizontal, non-parallel to
bedding, continuous fractures.
Box Top 7200.0 – Bottom 7203.0: (Core 5, Box & Bag 3) (Figure A-27)
7200.0 – 7200.7: Missing (7200.0: TOC= 2.21 Wt. %)
7200.7 – 7202.0: Black, flaggy, planar horizontal, non-calcareous, moderately pyritic silty
shale. Very thin (<0.5mm), continuous and discontinuous, parallel to bedding, pyrite
lamination with less than 2mm spacing can be seen when interval is damp.
o 7201.1: Mineralogy (Wt.%): 42% Silica, 56% Clay, 2% Carbonate.
7202.0 – 7202.7: Missing (7202.5: TOC= 6.85 Wt. %)
7202.7 – 7203.0: Black, flaggy, planar horizontal, non-calcareous, moderately pyritic silty
shale. Thin (<1mm), continuous and discontinuous, parallel to bedding, pyrite laminations
with less than 2mm in spacing present throughout interval.
Box Top 7203.0- Bottom 7206.0: (Core 5, Box & Bag 4) (Figure A-28)
7203.0 – 7203.5: Black, flaggy, planar sun-horizontal (dipping to the right ~15°), non-
calcareous, slightly to moderately pyritic silty shale. Pyrite is in the form of very thin
(<0.5mm), hard to see unless damp, continuous and discontinuous, parallel to bedding
laminations with an average vertical separation of 2- 4mm, and one pyrite nodule (15mm
wide x 2mm thick).
7203.5 – 7204.0: Black, flaggy, planar sub-horizontal (dipping to the right ~15°), very
slightly calcareous, non-pyritic silty shale.
7204.0 – 7204.5: Black, flaggy, planar sub-horizontal (dipping to the right ~15°), non- to
very slightly calcareous, slightly to moderately pyritic silty shale. Pyrite is in the form of
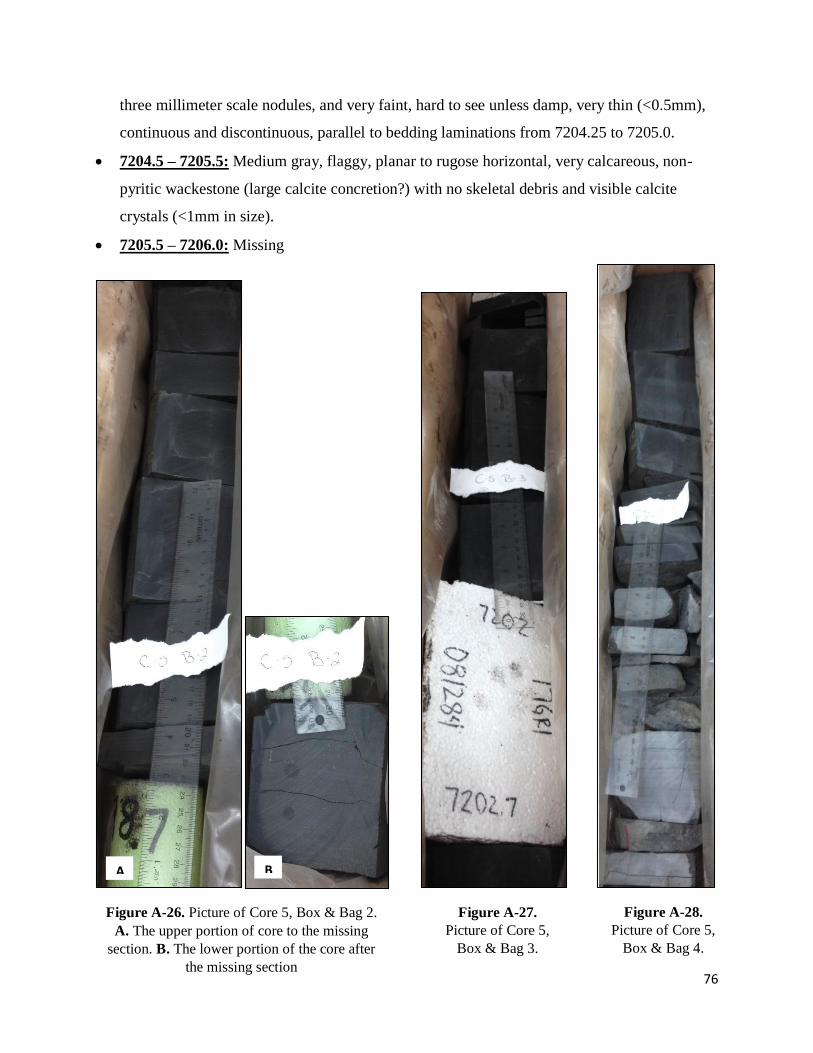
76
three millimeter scale nodules, and very faint, hard to see unless damp, very thin (<0.5mm),
continuous and discontinuous, parallel to bedding laminations from 7204.25 to 7205.0.
7204.5 – 7205.5: Medium gray, flaggy, planar to rugose horizontal, very calcareous, non-
pyritic wackestone (large calcite concretion?) with no skeletal debris and visible calcite
crystals (<1mm in size).
7205.5 – 7206.0: Missing
Figure A-26. Picture of Core 5, Box & Bag 2.
A. The upper portion of core to the missing
section. B. The lower portion of the core after
the missing section
Figure A-27.
Picture of Core 5,
Box & Bag 3.
Figure A-28.
Picture of Core 5,
Box & Bag 4.
A B

77
Box Top 7206.0 - Bottom 7209.0: (Core 5, Box & Bag 5) (Figure A-29)
7206.0 – 7207.0: Medium gray, flaggy, rugose horizontal, very calcareous, non-pyritic
except from 7206.85-7207.0 very pyritic, wackestone (large calcite concretion?) with no
skeletal debris and visible calcite crystals (<1mm in size). From 7206.85 to 7207.0 pyrite is
in the form of thick (2mm and 6mm) continuous, parallel to bedding, laminations. At 7207.0
there is an abrupt contact with the underlying unit.
7207.0 – 7207.35: Black, flaggy, planar horizontal, non-calcareous, slightly pyritic silty shale
with a light to medium gray, with yellow staining, grainy/gritty, fibrous ash pocket at
7207.35 that is oval in shape (4cm wide x 3cm long x 1.3cm thick). The bedding
immediately adjacent to the ash has slickensides. A much smaller ash pocket is present
however it is still embedded in the shale. The pyrite in this interval is in the form of very thin
(<0.5mm) hard to see, continuous and discontinuous, parallel to bedding, laminations.
7207.35 – 7207.7: dark gray, flaggy, planar to crinkly horizontal, moderately calcareous,
non-pyritic silty shale. This interval was broken into a lot of chunks.
7207.7 – 7209.0: Black, flaggy, planar horizontal, non- to slightly calcareous, non- pyritic
silty shale with light to medium gray, with yellow staining, grainy/gritty, fibrous ash at
7208.0. There are four ash pockets on this surface that average in size 18mm long by 16mm
wide and <3mm thick. The calcite in this interval is present as very faint, very thin
(<0.5mm), discontinuous and continuous, parallel to bedding laminations.
Box Top 7209.0 – Bottom 7212.0: (Core 5, Box & Bag 6) (Figure A-30)
7209.0 – 7209.8: Black, flaggy, planar horizontal, non- to very slightly calcareous, slightly
pyritic silty shale. Pyrite is present in the form of faint, very thin (<0.5mm), continuous and
discontinuous, parallel to bedding, laminations.
7209.8 – 7210.8: Missing
7210.8 – 7211.0: Black, flaggy, planar horizontal, non- to slightly calcareous, slightly pyritic
silty shale. Pyrite is present in the unit as millimeter scale nodules and one 3cm wide by 3mm
thick nodule.
7211.0 – 7211.7: Missing (7211.0: TOC= 5.91 Wt. %)
7211.7 – 7212.0: Black, flaggy, planar horizontal, non-calcareous, non-pyritic silty shale
with slickensides present at 7211.7.

78
Box Top 7212.0 – Bottom 7215.0: (Core 5, Box & Bag 7) (Figure A-31)
7212.0 – 7215.0: Black, flaggy, planar horizontal, non-calcareous, very slightly pyritic silty
shale with a medium gray, argillaceous, moderately pyritic, calcite concretion from 7214.0 to
7214.6. The shale within 0.2ft of the concretion is differentially compacted around the
concretion, has slickensides along bedding planes, and is moderately calcareous. The pyrite
is present as very small (<0.5mm), hard to see crystals from 7212.0 to 7213.9, and there are
several (9) millimeter scale nodules from 7214.6 – 7215.0.
Box Top 7215.0 – Bottom 7218.0: (Core 5, Box & Bag 8) (Figure A-32)
7215.0 – 7218.0: Black, flaggy to slabby, planar horizontal, non- to slightly calcareous (from
7217.0 to 7218.0), non-pyritic silty shale with light to medium gray, with yellow staining,
gritty/grainy, fibrous ash at 7216.1 and 7215.85 and have an average size of 5mm wide X
5mm long X 2mm thick. There are very small (<0.5mm) pyrite crystals next to the ash. At
7217.2 there are two sub-vertical (dipping ~40°), calcite filled fractures <1mm thick and 5-
6cm long.
o 7217.4: Mineralogy (Wt.%): 44% Silica, 33% Clay, 23% Carbonate.

79
Figure A-29.
Picture of Core 5,
Box & Bag 5.
Figure A-30.
Picture of Core 5,
Box & Bag 6.
Figure A-31.
Picture of Core 5,
Box & Bag 7.
Figure A-32.
Picture of Core 5,
Box & Bag 8.

80
Box Top 7218.0 – Bottom 7221.0: (Core 5, Box & Bag 9) (Figure A-33)
7218.0 – 7220.0: Black, flaggy, planar horizontal, non-calcareous, non- to slightly pyritic
silty shale with light to medium gray, with yellow staining, grainy/gritty, fibrous ash at
7219.25. Pyrite is present as millimeter scale nodules throughout the interval, and thin
(<1mm), continuous and discontinuous, parallel to bedding laminations.
7220.0 – 7221.0: Missing
Box Top 7221.0 – Bottom 7224.0: (Core 5, Box & Bag 10) (Figure A-34)
7221.0 – 7221.7: Missing (7221.0: TOC= 8.03 Wt. %)
7221.7 – 7222.6: Dark gray, flaggy, planar sub-horizontal (dipping to the right ~10°), non-
calcareous grading to moderately calcareous with depth, very slight pyritic silty shale.
7222.6 – 7224.0: Medium gray, flaggy, very crinkly/rugose horizontal, wackestone (calcite
concretion?).
Box Top 7224.0 – 7227.0: (Core 5, Box & Bag 11) (Figure A-35)
7224.0 – 7225.0: Black, planar sub-horizontal (dipping to the left ~10° to ~15°), non-
calcareous to slightly calcareous, non-pyritic silty shale with slickensides along bedding
planes throughout the interval, and a lightning bolt shaped, vertical, calcite filled fracture that
is 1mm thick x 7cm long, and spanning 4mm at 7224.8.
7225.0 – 7227.0: Black, flaggy, planar sub-horizontal (dipping to the left ~8° to ~10°), non-
calcareous, non- pyritic silty shale with slickensides along bedding planes throughout the
interval, and two lightning bolt shaped, vertical, calcite filled fractures at 7225.2 (2mm thick
x 3.5cm long, spanning 4cm) and at 7225.75 (1mm thick x 1.5cm long, spanning 5mm).
There is light to medium gray, with yellow staining, grainy/gritty, fibrous ash at 7226.25
(cannot get measurements because within beds) and at 7226.8 (2cm wide x 2.5cm long
x3.5cm thick).

81
Figure A-33.
Picture of Core 5,
Box & Bag 9.
Figure A-34.
Picture of Core 5,
Box & Bag 10.
Figure A-35. Picture of
Core 5, Box & Bag 11.
A. Image of the entire
core from 7224.0 –
7227.0’. B. Image of
ash pockets (location
indicated by red arrow
in image A). A
B

82
Box Top 7227.0 – 7230.0: (Core 5, Box & Bag 12) (Figure A-36)
7227.0 – 7227.45: Dark gray, flaggy, planar horizontal, non-calcareous, slightly pyritic silty
shale with slickensides along bedding parting at very top of the interval, and a sub-vertical,
1mm thick x 1.5cm long, calcite filled fracture.
7227.45 – 7227.7: Missing
7227.7 – 7228.6: From 7227.7 to 7227.9 is a dark gray, flaggy, planar horizontal, slightly
calcareous, non-pyritic silty shale. From 7227.9 to 7228.2 is a medium to dark gray, flaggy,
planar horizontal, very calcareous, non-pyritic wackestone. The calcite is present as a very
high abundance of continuous, medium to thin (<2mm), continuous, parallel to bedding
laminations. The lamination compose 70- 80% of this interval. 7228.2 to 7228.6 is a dark
gray, flaggy, planar horizontal, moderately calcareous, non-pyritic silty shale. The calcite is
present as thin (<1mm), continuous and discontinuous, parallel to bedding, laminations, and
compose ~30- 40% of this interval. At 7228.35 are two, medium gray, sub-horizontal
burrows. The contacts between these three units/intervals are abrupt/sharp.
7228.6 – 7228.8: Medium gray, very calcareous, non-pyritic, argillaceous wackestone with
no visible skeletal debris and sharp contacts above and below the interval.
7228.8 – 7228.9: Dark gray to black, flaggy, planar sub-horizontal (dipping ~10- 15° to the
right), moderately calcareous, non-pyritic silty shale. Calcite is present in the form of
medium gray, thin (<1mm), discontinuous, parallel to bedding laminations.
7228.9 – 7229.9: Missing
7229.9 – 7230.0: Interbedded limestone and silty shale with ~70% being limestone.
Limestone is medium gray and interbedded with discontinuous dark gray, wavy, beds of silty
shale. There are skeletal fragments (≤1mm in length) throughout.
Box Top 7230.0 – Bottom 7233.0: (Core 5, Box & Bag 13) (Figure A-37)
This box is alternating silty shale and argillaceous limestone beds.
7230.0 – 7230.7: Missing (7230.5: TOC= 4.37 Wt. %)
7230.7 – 7231.24: Interbedding of dark gray silty shale with medium gray, laminated to
flaggy, crinkly horizontal, argillaceous wackestone.
7231.24 – 7231.53: Missing

83
7231.53 – 7232.5: Interbedding of silty shale and argillaceous wackestone with flaggy,
horizontal bedding.
7232.5 – 7233.0: Medium gray, flaggy, crinkly horizontal, fossiliferous, argillaceous
wackestone. There are an abundance of crinoid fossils present. There is some interbedding of
dark gray, thick (>2mm) laminations of silty shale.
Box Top 7233.0 – 7235.75: (Core 5, Box & Bag 14) (Figure A-38)
Onondaga Limestone
Medium gray, flaggy, crinkly/rugose horizontal, very fossiliferous, argillaceous wackestone.
The fossils consist of crinoids, bryozoan, brachiopods, and corals. The 7233.0 to 7233.4
section is missing.

84
Figure A-36.
Picture of Core 5,
Box & Bag 12.
Figure A-37.
Picture of Core 5,
Box & Bag 13.
Figure A-38.
Picture of Core 5,
Box & Bag 14.

85