sequence characterization of goat tlr genes -...
TRANSCRIPT

RESULTS
48
RESULTS
Sequence characterization of goat TLR genes
4.1. Isolation and quantification of RNA
Total RNA was extracted from different tissues of goat and used for cDNA
synthesis to amplify goat TLR4 and TLR8 genes for cloning and sequencing. The RNA
extracted by TRIzol method was further purified using RNeasy MinElute Clean-up kit
(Qiagen). The concentration and purity of RNA was measured by Nanodrop (ND1000).
The concentration and optical density (OD) ratio at 260 and 280nm of RNA isolated from
different tissues was estimated, the values for which have been given in Table 4.1. The
RNA concentration in different tissues was found to be between 564.4 ng/µl (heart) to
4984 ng/µl (intestine). For all the samples except for intestine the 260/280 ratio was
around 1.9 to 2.0, indicating good quality RNA without any RNA contamination and
suitable for further use.
Table. 4.1. Concentration and Purity of RNA isolated from goat tissues.
Tissue Conc.(ng/µl) 260/280nm
Liver 4983 1.9
Lungs 4284 1.9
Kidney 3844 2.0
Skin 1082 2.0
Ovary 3513 2.0
Placenta 4876 1.9
Spleen 4975 1.87
Lymph node 4446 1.9
Heart 564.4 2.0
Mammary gland 1292 2.0
Intestine 4984 1.8
Skeletal muscle 2881 2.0
4.2. Reverse Transcription-Polymerase Chain Reaction (RT-PCR)
cDNA was synthesized using RevertAid™ First Strand cDNA Synthesis Kit (MBI,
Fermentas). This kit is designed for preparation of full-length first strand cDNA from
RNA templates. The kit relies on a genetically engineered version of the Moloney Murine
Leukemia Virus Reverse Transcriptase (RevertAid™ M-MuLV RT) with low RNaseH
activity. This allows the synthesis of full-length cDNA from long templates (up to 13 kb).
cDNA was synthesized from various RNA samples using Oligo(dT)18 primers,
helping in synthesis of larger cDNA fragments for multiple genes from the same reaction.
4

RESULTS
49
The cDNA synthesized from the same reaction was further utilized for full gene
amplification as well as real-time PCR analysis of both TLR4 and TLR8 genes of goat.
4.3. PCR amplification
Complete coding regions corresponding to goat TLR4 and TLR8 were amplified
from the cDNA synthesized from RNA of spleen tissue by using single primer pair
covering the complete ORF. Amplified products were checked by using 1.5% agarose gel
electrophoresis. Specific PCR products of expected sizes of goat TLR4 and TLR8 gene
were obtained in the amplification reactions. The full length amplified PCR products were
purified by using QIAquick PCR purification kit (Qiagen). After purification, the obtained
products were found to be free from primer dimers or any nonspecific amplification (Fig.
4.1).
(a) (b)
Fig. 4.1. Ethidium bromide stained agarose gel showing the purified PCR products
of (a) TLR4 (2.5Kb) and (b) TLR8 (3.2 Kb) genes of goat.
4.4. Cloning of goat TLR4 and TLR8 genes
4.4.1. Ligation of PCR products
The kit purified PCR products of goat TLR4 and TLR8 genes were ligated in
pGEM®
-T Easy Vector (Promega) by using manufacturer‟s instructions. The ligated
recombinant plasmid DNA having goat TLR4 and TLR8 inserts were used to transform
CaCl2 treated competent E. coli DH5-α cells. Recombinant clones were identified by
blue/white i.e. „lac Z‟ selection system. Blue colonies were indicating the non-recombinant
clones, where as white colonies were recombinant ones (Fig. 4.2). Most of the colonies
obtained from the transformation experiment were white, which indicated good ligation
and transformation efficiency.
TLR4 ORF
1Kb ladder
TLR8 ORF
1Kb ladder

RESULTS
50
Fig.4.2. LB-agar plate showing recombinant (white) and non-recombinant (blue)
colonies.
4.4.2. Confirmation of recombinant clones
Plasmid DNA isolated from four white colonies each of TLR4 and TLR8 genes
were screened to confirm the recombinant plasmid having insert of desired gene by
different methods described below.
Plasmid isolation from transformed cells
Plasmid DNA was isolated from the recombinant clones by alkali lysis method, as
well as kit (Qiagen Midi Prep) using manufacturer‟s instructions and was checked by 1%
agarose gel electrophoresis. Good quality plasmid was obtained without any contamination
of genomic DNA or RNA.
PCR from culture and plasmid
PCR was carried out directly from the culture of white colonies as well as plasmid
DNA isolated from white colony cultures using the gene specific primers. PCR products
were runned on 1.5% agarose gel which showed the presence of TLR4 and TLR8 inserts in
all the four clones screened with the insert of 2582 bp size for TLR4 and 3238 bp for
TLR8 genes, when run along with 1 kb molecular marker (Fig. 4.3 a,b).
(a) (b)
Fig. 4.3. Ethidium bromide stained agarose gel confirming the inserts of (a) TLR4
(2.5 kb) and (b) TLR8 (3.2 kb) by PCR of recombinant clones.
TLR4
ORF
1Kb ladder
TLR8 ORF
1Kb ladder
Non-recombinant blue
colonies
Recombinant
white colonies

RESULTS
51
Restriction enzyme digestion
The presence of correct size insert in the recombinant plasmid was further
confirmed by restriction endonuclease digestion method. After single digestion with EcoRI
restriction enzyme the products were checked on 2% agarose gel, which confirmed the
presence of recombinant clones by release of insert of specific size. Digestion with EcoRI
resulted in release of TLR4 fragment from the recombinant plasmid vector and yielded two
fragments of approximately 2.5 kb insert and 2.8 kb vector (Fig. 4.4a). Similarly, digestion
of TLR8 with EcoRI resulted in the release of 2 fragments (3.2 kb insert and 2.8 kb
Vector) (Fig. 4.4 b).
(a) (b)
Fig. 4.4. Agarose gel showing EcoRI digested products of cloned Goat TLR4 (a) Lane
1: Restriction digested product, Lane 2: Uncut recombinant plasmid DNA,
Lane3: 1 Kb DNA ladder and TLR8 (b) Lane 1: Uncut recombinant plasmid
DNA, Lane 2: Restriction digested product, Lane3: 1 Kb DNA ladder.
Confirmation by Sequencing
Recombinant plasmids having TLR4 and TLR8 gene inserts were further
confirmed by sequencing from both ends by using M13 (forward and reverse) universal
primers. The sequencing of recombinant plasmids also confirmed the presence of TLR4
and TLR8 gene inserts on the basis of homology shown with reported TLR4 and TLR8
genes after BLASTN analysis. After confirmation, recombinant plasmids were subjected
to full length sequencing which was carried out by primer walking/internal gene specific
primers.
4.5. Sequence analysis of goat TLR4
Sequence Characterization
Different overlapping fragments of goat TLR4 gene sequences generated by
internal primers were assembled into 2664 bp long contig, which included 2526
nucleotides long coding sequence (CDS) along with 108 bp long partial 5‟UTR of and 29
TLR 4kb
1Kb ladder
Uncut
plasmid Vector
TLR4 ORF
1Kb ladder
Uncut
plasmid
TLR8 ORF
Vector
1 kb
ladder

RESULTS
52
Fig. 4.6. Tertiary Structure visualized by PyMole
(Red- signal peptide, Green-TM, Yellow –TIR).
bp long 3‟UTR. The sequence was submitted to NCBI (GenBank accession no. JF825527).
The predicted open reading frame (ORF) of goat TLR4 gene was translated into protein
and was found to be 841 amino acids long. Secondary structure of goat TLR4 protein was
analysed by using CLC Main Workbench5 showing presence of 46 alpha-helices and 16
beta-sheets (Table 4.2).
Domain structure analysis
Amino acid sequence of goat TLR4 protein was further analyzed by using online
program Simple Modular Architecture Research Tool (SMART), which revealed amino
acids 1-629 to be lying in ectodomain, out of which amino acids 1-25 were part of
signaling peptide, amino acid 630-819 were found in cytoplasmic domain containing TIR
domain (674-819) as shown in Fig. 4.5. The ectodomain of goat TLR4 displayed different
regions, which included 13 leucine-rich repeats (LRRs), one leucine rich repeat of C-
terminal domain (LRRCT), one transmembrane domain and a conserved toll/interleukin-1
receptor domain (TIR) with their respective amino acid positions.
Fig. 4.5. Predicted domain structure of goat TLR4 by SMART analysis.
Tertiary structure of goat TLR4
Insilico translation of predicted coding
DNA sequence of goat TLR4 when subjected
to the online tool Modeller for the prediction of
tertiary structure, distinctive horseshoe shaped
structure was formed, this structure was formed
by the repeating amino acid sequence, termed as
“leucine-rich repeats”. The different functional
domains have been distinguished by different
colors, shown in (Fig. 4.6.). The structure was
found to be similar as that of the structure
reported for the human and mouse TLR4.
Cytoplasmic TIR domain
Trans membrane domain Signal peptide
Ectodomain (LRR)

RESULTS
53
Comparison of goat TLR4 with other livestock species
The nucleotide sequence of caprine TLR4 gene was compared on the basis of
alignment, percent similarity, phylogeny and secondary structures with other reported
livestock species. Goat TLR4 was found to have 2526 nucleotides long ORF, like other
livestock species except in horse, which was 2532 nucleotides long (Table 4.2).
Phylogenetic analysis on the basis of nucleotides and amino acid, showed goat being
placed closest to sheep (Fig. 4.7). The protein structure domains predicted by SMART
analysis was compared with other livestock species, which showed goat and sheep having
the similar domain structures (Fig. 4.8). The secondary structure of different livestock
species was predicted and the number of α-helices and β-sheets are shown in (Table 4.2),
which showed goat, cattle, buffalo and sheep having almost similar secondary structures
whereas, non-ruminant species pig showed higher number of beta strands as compared to
other species.
The SMART structure of goat TLR4 when compared with other livestock species
showed almost similar structure among the ruminant species but in non-ruminant species
the position of some LRRs varied. Prediction of different functional domains based on the
predicted amino acid sequences was attempted in goat in comparison to other livestock
species by aligning them altogether. The signal peptide was found to be conserved among
the ruminant species with some variation in non-ruminant species. The LRRs (1-4) were
also found to be conserved among the ruminants with some variations in non-ruminants.
LRR5 was more similar in goat and sheep as compared to cattle and buffalo, where they
shared the amino acid changes with horse and pig. Again, LRRs (6-10) were found to be
conserved among the ruminants, but LRR11 was found to be conserved between goat and
sheep in comparison to buffalo, cattle, horse and pig. LRR12, 13 and C-terminal LRR were
again found to be conserved among the ruminants as compared to non-ruminants, followed
by TIR domain (Fig. 4.9). Overall the results indicate that the ligand specificity in
ruminants may be conserved as compared to non-ruminants.
Fig. 4.7. Phylogenetic analysis of goat TLR4 nucleotides after alignment with other
livestock species.

RESULTS
54
Fig. 4.8. SMART analysis of goat TLR4, comparison of its domain structures with other
livestock species (variations are shown in boxes).
Table 4.2. Comparison of goat TLR4 gene structural attributes with other livestock
species.
Species ORF Amino
acid
CDS identity
(%) with goat
Amino acid identity
(%) with goat
Alpha-
Helices
Beta-
Sheets Accession no.
Goat 2526 841 - - 46 16 JF825527
Buffalo 2526 841 95.9 93.8 45 15 HQ343416
Cattle 2526 841 96.1 94.5 42 15 NM_174198.6
Sheep 2526 841 99.1 98.5 44 16 NM_001135930
Pig 2526 841 85.6 79.4 47 26 GQ503242
Horse 2532 843 83.3 77.6 49 15 NM_001099769
Buffalo
Cattle
Goat
Pig
Sheep
Horse

RESULTS
55
Goat MMARARRAAALIPAMAILSCLRTESWDPCVQVVPNISYQCMELNLYKIPDNIPVSTEMLD
Sheep -MARARRAAALIPAMAILSCLRTESWDPCVQVVPNISYQCMELNLYKIPDNIPMSTEMLD
Buffalo MMARARLAAALIPATAILSCLRTESWDPCVQVVPNISYQCMELNLYKIPDNIPISTKMLD
Cattle MMARARLAAALIPATAILSCLRTESWDPCVQVVPNISYQCMELNLYKIPDNIPISTKMLD
Pig MIPRIRLAVATIPAMAFLSCLRSESWDPCVQVVPNISYQCMELNFYKIPDNIPTSVKILD
Horse MMPPTRLAGTLIPAMAFLSCLRPESWDPCVQVVPNTTYQCMDLNLYKIPENIPTSTKELD
:. * * : *** *:*****.************ :****:**:****:*** *.: **
Goat LSFNYLRHLGSHNFSRFPELQVLDLSRCEIKIIEDNTFQGLNHLSTLILTGNPIQSLAWG
Sheep LSFNYLRHLGSHNFSRFPELQVLDLSRCEIKIIEDNTFQGLNHLSTLILTGNPIQSLAWG
Buffalo LSFNYLRHLGSHNFSSFPELQVLDLSRCEIKIIEDDTFQGLNHLSTLILTGNPIQSLAWG
Cattle LSFNYLRHLGSHNFSSFPELQVLDLSRCEIKIIEDDTFQGLNHLSTLILTGNPIQSLAWG
Pig LSFNYLSHLDSNSFSSFPELQVLDLSRCEIQTIDDDAYQGLNYLSTLILTGNPIQSLALG
Horse LSFNPLKELGSHSFSNFPELQVLDLSRCEIEMIEDDAYQGLNHLSTLILTGNPIRSLALG
**** * .*.*:.** **************: *:*:::****:***********:*** *
Goat AFSGLSSLQKLVAVETNLVSLDDFPIGHLKTLKELNVAHNFIHSFKLPEYFSNLPNLEHL
Sheep AFSGLSSLQKLVAVETNLVSLDDFPIGHLKTLKELNVAHNFIHSFKLPEYFSNLPNLEHL
Buffalo AFSGLSSLRKLVAVETNLVSLHDFPIGHLRALKELNVAHNFIHSFKLPEYFSNLPNLEHL
Cattle AFSGLSSLQKLVAVETNLVSLNDFPIGHLKNLKELNVAHNFIHSFKLPEYFSNLPNLEHL
Pig AFSGLPSLQKLVAVETNLASLEDFPIGHLKTLKELNVAHNHIHSFKLPEYFSNLPNLEHL
Horse AFSGLSSLQTLVAVETKLSSLEKFPIGHLKTLKELNVAHNLIHSFKLPEYFSKMPNLEHL
*****.**:.******:* **..******: ********* ***********::******
Goat DLSNNKIQNIYYEDVKVLHQMPLLNLSLDLSLNPLEFIEPGTFKEIKLNGLTLRSNFNSS
Sheep DLSNNKIQNIYYEDVKVLHQMPLLNLSLDLSLNPLEFIEPGTFKEIKLNGLTLRSNFNSS
Buffalo DLSNNKIQNIYYEDVKVLHQMPLLNLSLALSLNPLDFIEPGTFKEIKLNGLTLRSNFNSS
Cattle DLSNNKIQNIYYEDVKVLHQMPLLNLSLDLSLNPLDFIEPGTFKEIKLNGLTLRSNFNSS
Pig DLSKNKIENIYHEHLQVLHQVPLLNLSLDLSLNPLNFIEPGAFNKIRLNGLTLRSNFNSS
Horse DLSNNKIQNISHEDLRVLHQMPLLNLSLDLSLNPLEFIQPDAFKEIKLHKLTLRSNFDSI
***:***:** :*.::****:******* ******:**:*.:*::*:*: *******:*
Goat YVMKTCIQGLAGLKINRLVLGEFKNERKLQKFDRSCLEGLCNLTIEQFRIAYLNKFSR-N
Sheep DVMKTCIQGLAGLKINRLVLGEFKNERKLQKFDRSCLEGLCNLTIEQFRIAYLSKFSW-N
Buffalo HVMKTCIQGLAGLKTNRLVLGEFKNERKLQRFDRSFLEGLCNLTIEQFRIAYLDKFSG-D
Cattle HVMKTCIQGLAGLKTNRLVLGEFKNERKLQRFDRSFLEGLCNLTIEQFRIAYLDKFSG-D
Pig DVMKTCIQGLAGSKINQLVLGEFKNERNLESFDKSVLEELCNLTLEQFRIAHFGEFPD-D
Horse DVMKSCIQGLAGLKVNRLVLGEFKNERKLERFDTSALRGLHNLTIEEFRLAYIDNYSSKD
***:******* * *:**********:*: ** * *. * ***:*:**:*::.::. :
Goat DTDLFNCLANVSMISLLSIPLGSLQALLKDFRWQHLEMINCDFDKFPALELRSLKKFVFT
Sheep DTDLFNCLANVSVISLLSISLGSLQALLKDFRWQHLEMINCDFDKFPALKLRSLKKFVFT
Buffalo DTDLFNCLANVSVISLLSISLGSLQALLKDFRWQHLEIINCDFDKFPALKLSSLKKFVFT
Cattle DTDLFNCLANVSVISLLSISLGSLQALLKDFRWQHLEIINCDFDKFPALKLSSLKKFVFT
Pig VSDLFNCLANASVISLLSLNLRGLEALPNDFRWQHLEVVNCKLKQFPALKFNSLKKFVFK
Horse SIDLLNCLADISKISLVSLDLGNLKDFPKGFGWQDFELVNCRIEGFPTLELTSLKRLVFT
**:****: * ***:*: * .*: : :.* **.:*::** :. **:*:: ***::**.
Goat DNKDVSSFTKTELPSLQYLDLKRNHLSFKTCCSHTDFGTTNLKHLDLSFNDVITLSSNFM
Sheep DNKDVSTFTKTELPSLQYLDLKRNHLSFKSCCSHTDFGTTNLKHLDLSFNDVITLGSNFM
Buffalo DNKDISTFTEFQLPSLQYLDLKRNHLSFKGCCSHTDFGTTNLKHLDLSFNDVITLGSNFM
Cattle DNKDISTFTEFQLPSLQYLDLKRNHLSFKGCCSHTDFGTTNLKHLDLSFNDVITLGSNFM
Pig DNKHMHTFTEINLPNLQFLDLSGNHLSFKGCCSHNEFGTTKLKHLDLSFNEIITMKSNFM
Horse SNKDMKSFNEVKLPSLEFLDLSRNRLSFKSCCSEADLKTTRLKHLDLSFNDVISMSSNFM
.**.: :*.: :**.*::***. *:**** ***. :: **.*********::*:: ****
Goat GLEQLEHLDFQHSTLKQINAFSTFLSLRNLRYLDISYTNIRIVFHGIFTGLVSLQTLKMA
Sheep GLEQLEHLDFQHSTLKQINAFSTFLSLRNLRYLDISYTNIRIVFHGIFTGLVSLQTLKMA
Buffalo GLEQLEHLDLQHSTLKQINAFSAFLSLRNLRYLDISYTNIRIVFHGIFTGLVSLQTLKMA
Cattle GLEQLEHLDFQHSTLKQINAFSAFLSLRNLRYLDISYTNIRIVFHGIFTGLVSLQTLKMA
Pig GLEQLEYLDFQHSSLKQANDFSIFLSLRNLHYLDISYTNIHVVFRGIFAGLVSLQTLKMA
Horse GLEQLEHLDFQHSTLKQASDFPVFLSLKNLRYLDISYTNTRVVFHGIFDGLVSLQVLKMA
******:**:***:*** . *. ****:**:******** ::**:*** ******.****
Goat GNSFQNNLLPDIFTELTNLTILDLSKCQLEQVSWTAFHSLPSLQVLNMSHNKLLSLDTFL
Sheep GNSFQNNLLPDIFTELTNLTILDLSKCQLEQVSWAAFHSLPSLQVLNMSHNKLLSLDTFL
Buffalo GNSFQNNLLPDIFTELTNLTVLDLSKCQLEQVAQTAFHSLSSLQVLNMSHNKLLSLDTFL
Cattle GNSFQNNLLPDIFTELTNLTVLDLSKCQLEQVAQTAFHSLSSLQVLNMSHNKLLSLDTFL
Pig GNSFQNNLLPDVFTDLTNLILLDLSKCQLEQVSQRAFHSLPRLQVLNMSHNRLLFLDTLP
Horse GNSFKDNFLPNIFREMTNLTTLDLSKCNLEQVSQEAFCLLPRLRVLNMSHNNLLFLDMLP
****::*:**::* ::*** ******:****: ** *. *:*******.** ** :
Signaling Sequence (1-25)
LRR 1 (77-100)
LRR 3 (149-173)
LRR 4 (174-200) LRR 5 (201-225)
LRR 6 (372-393) LRR 7 (398-420)
LRR 8 (421-442) LRR 9 (446-469)
LRR 10 (470-494) LRR 11 (495-518) LRR 12 (519-542)
LRR 2 (100-124)

RESULTS
56
Goat YEPLHSLRILDCSFNRITASKEQELRSLPRNLTWLNLTQNEFACVCEHQSFLQWVKDQRQ
Sheep YEPLHSLRILDCSFNRITASKEQELRNLPRNLTWLNLTQNEFACVCEHQSFLQWVKDQRQ
Buffalo YEPLHSLRILDCSFNRIMASKEQELQNLPRSLTWLNLTQNAFACVCEHQSFLQWVKDQRQ
Cattle YEPLHSLRILDCSFNRIMASKEQELQNLPRSLTWLNLTQNAFACVCEHQSFLQWVKDQRQ
Pig YKPLHSLRILDCSYNLIVASKEQELQHLPRSLAFLNLTKNDFSCACEHQTFLQWVKDQKQ
Horse YKPLHSLQILDCSFNRIVAFKWQELQHFPSSLASLNLTQNDFACVCEYQSFLQWVKDQRQ
*:*****:*****:* * * * ***: :* .*: ****:* *:*.**:*:********:*
Goat LLVGAEQMMCAEPLDVKDMPVLGFRNATCQMSKTIISVSVVTVLLVSVVGVLVYKFYFHL
Sheep LLVGAEQMMCAEPLDVKDMPVLGFRNATCQMSKTIISVSVVTVLLVSVVGVLVYKFYFHL
Buffalo LLVGAEQMMCAEPLDMEDMPVLSFRNATCQLSKTIISVSVVTVLLVSVVGVLVYKFYFHL
Cattle LLVGAEQMMCAEPLDMEDMPVLSFRNATCQLSKTIISVSVVTVLLVSVVGVLVYKFYFHL
Pig LLVGAEQMVCTQPLEMQDLPVLSFRNATCQISEAVISASVLTFLLVSVAGILVYKFYFHL
Horse LLVEVEHLVCAIPLQMRGMPVLGFNNATCQISKTIVGGSVFSILMVSVIAVLVYKFYFHL
*** .*:::*: **::..:***.*.*****:*::::. **.:.*:*** .:*********
Goat MLLAGCKKYGRGESTYDAFVIYSSQDEAWVRNELVKNLEEGVPPFQLCLHYRDFIPGVAI
Sheep MLLAGCKKYGRGESTYDAFVIYSSQDEAWVRNELVKNLEEGVPPFQLCLHYRDFIPGVAI
Buffalo MLLAGCKKYGRGESTYDAFVIYSSQDEDWVRNELVKNLEEGVPPFQLCLHYRDFIPGVAI
Cattle MLLAGCKKYGRGESXYDAFVIYSSQDEDWVRNELVKNLEEGVPPFQLCLHYRDFIPGVAI
Pig LLFVGCKKYGRGESTYDAFVIYSSQDEDWVRNELVKNLEEGVPPFHLCLHYRDFIPGVAI
Horse MLLAGCKKYGRGESIYDAFVIYSSQDEDWVRNELVKNLEEGVPPFQLCLHYRDFIPGVAI
:*:.********** ************ *****************:**************
Goat AANIIQEGFHKSRKVIVVVSQHFIQSRWCIFEYEIAQTWQFLSSRAGIIFIVLQKLEKSL
Sheep AANIIQEGFHKSRKVIVVVSQHFIQSRWCIFEYEIAQTWQFLSSRAGIIFIVLQKLEKSL
Buffalo AANIIQEGFHKSRKVIVVVSQHFIQSRWCIFEYEIAQTWQFLSSRAGIVFIVLQKLEKSL
Cattle AANIIQEGFHKSRKVIVVVSQHFIQSRWCIFEYEIAQTWQFLSSRAGIIFIVLQKLEKSL
Pig AANIIQEGFHKSRKVIVVVSQHFIQSRWCIFEYEIAQTWQFLRSHAGIIFIVLQKLEKSL
Horse AANIIQEGFHKSRKVIVVVSQHFIQSRWCIFEYEIAQTWQFLSSRAGIIFIVLHKLEKSL
****************************************** *:***:****:******
Goat LRQQVELYRLLNRNTYLEWEDSVLGRHVFWRRLRKALLAGKPRSPEGTADAETNPQEATTST-
Sheep LRQQVELYRLLNRNTYLEWEDSVLGRHVFWRRLRKALLAGKPRSPEGTADAETNPQEATTST-
Buffalo LRQQVELYRLLSRNTYLEWEDSVLGRHVFWRRLRKALLAGKPTSPEGTADAETNAQEVTTST-
Cattle LRQQVELYRLLSRNTYLEWEDSVLGRHVFWRRLRKALLAGKPQSPEGTADAETNPQEATTST-
Pig LRQQVELYRLLSRNTYLEWEDSVLGRHIFWRRLKKALLDGKPWSPEGTEDSESNQHDTTAFT-
Horse LRQQVELYRLLNRNTYLEWEDSVLGRHIFWRRLRKALLDGKPWSPAGTADAAESRQHDAETST-
***********.***************:*****:**** *** ** ** *: . :. : :
Fig. 4.9. Comparison of the domain architecture of goat, buffalo, cattle, sheep, pig
and horse TLR4 protein sequence. The domains were predicted using the
SMART program (Schultz et al., 1998). LRR- leucine-rich repeat; NT—N-
terminal repeat; CT—C-terminal repeat; TIR—toll/interleukin-1 receptor
domain.
4.7 Sequence analysis of goat TLR7 gene
Sequence characterization
A total of 3.4 kb long sequence data of caprine TLR7 gene was generated by
sequencing of seven overlapping PCR amplicons ranging from 424 to 1186 bp. The
sequence obtained was submitted to GenBank and Accession No. GU289401 was assigned
to the sequence. ORF of Caprine TLR7 was 3150 nucleotides long coding for 1049 amino
acids long protein, similar to sheep. Comparison of goat TLR7 genomic sequence with
cattle TLR7 genomic sequence reported in Ensemble (ENSBTAT00000029895) showed
goat TLR7 ORF limiting to exon3 only, different from cattle. The predicted amino acids
LRR 13 (543-566) LRR CT (579-629)
TIR (674-819)
TM (635-657)

RESULTS
57
Fig. 4.11. Tertiary Structure visualized by PyMole
(Red- signal peptide, Green-Extracellular domain,
Magenta –TIR)
were subjected to CLC Main workbench5 for the determination of secondary structure
which showed the presence of 39 alpha-helices and 40 beta-sheets (Table 4.3).
Domain Structure analysis
Amino acid sequence of goat TLR7 protein was further analyzed by using online
program Simple Modular Architecture Research Tool (SMART), which revealed amino
acids 1-853 to be lying in ectodomain, amino acids (837-853) were the part of low
complexity region, amino acids 854-1046 were found in cytoplasmic domain containing
TIR domain (887-1033) (Fig 4.10). The ectodomain of goat TLR7 displayed different
regions, which included 20 leucine-rich repeats (LRRs), one leucine rich repeat each of C-
terminal domain (LRRCT) and N-terminal domain (LRRNT) respectively, one low
complexity region and a conserved toll/interleukin-1 receptor domain (TIR) with their
respective amino acid positions represented below (Fig. 4.10).
Fig. 4.10. Predicted domain structure of goat TLR7 by SMART analysis.
Tertiary structure of goat TLR7
The translation of predicted coding
DNA sequence of TLR7 of goat when
subjected to the online tool Modeller for the
prediction of tertiary structure, distinctive
horseshoe shaped structure was formed, this
structure was formed by the overlapping of
“leucine-rich repeats”. The different
functional domains have been distinguished
by different colors, shown in (Fig. 4.11).
Ectodomain LRRs
Low complexity region
Cytoplasmic TIR domain

58
Comparison of goat TLR7 with other livestock species
The extensive homology of goat TLR7 nucleotide sequence with that of sheep and
cattle also corresponded with extensive homologies of the deduced amino acids among
these species (Table 4.3). When phylogenetic analysis was carried out, as expected goat
shared the closest phylogenetic relationship with sheep followed by cattle and buffalo (Fig.
4.12). All the ruminant species branched off separately from other non-ruminants, whereas
among other livestock species, pig was closer to ruminant species than horse. The
secondary structure analysis showed little variation in the number of alpha and beta- sheets
in ruminants as compared to non-ruminants.
The domain structures of TLR7 gene for goat, sheep, cattle, buffalo, pig, horse
were predicted (Fig.4.13) and goat TLR7 structure was found similar to that of pig, cattle
and sheep, which consisted same numbers of extracellular domains with leucine-rich
repeats (LRRs), a transmembrane domain and cytoplasmic TIR, Toll-interleukin-1 receptor
domain. Other domains with high inter-species conservation included the N and C-
terminal cysteine-flanked LRRs and the transmembrane domains.
A number of amino acid changes were observed in different functional domains of
TLR7 of goat compared to the sequences of other species. Predicted amino acid sequence
of caprine TLR7 showed a total of four and 17 amino acid changes compared to that of
ovine and cattle sequences, respectively. The TIR domain was found to be conserved
among ruminant species goat, sheep, buffalo and cattle. One amino acid change, His34Cys
in the TIR domain was found to be ruminant specific as compared to other species
compared. Phylogenetic analysis based on nucleotide sequence of TIR domain showed
results similar to whole TLR7 gene sequence analysis, four ruminant species grouping
together. However, among four ruminant species, differentiation was more in goat and
sheep clustering little apart from each other as well as cattle and buffalo.The numbers of
LRR motifs in goat TLR7 were found to be similar to sheep but higher than cattle among
ruminants. Transmembrane (TM) domain was also absent in all the livestock species
except for pig (Fig. 4.13).
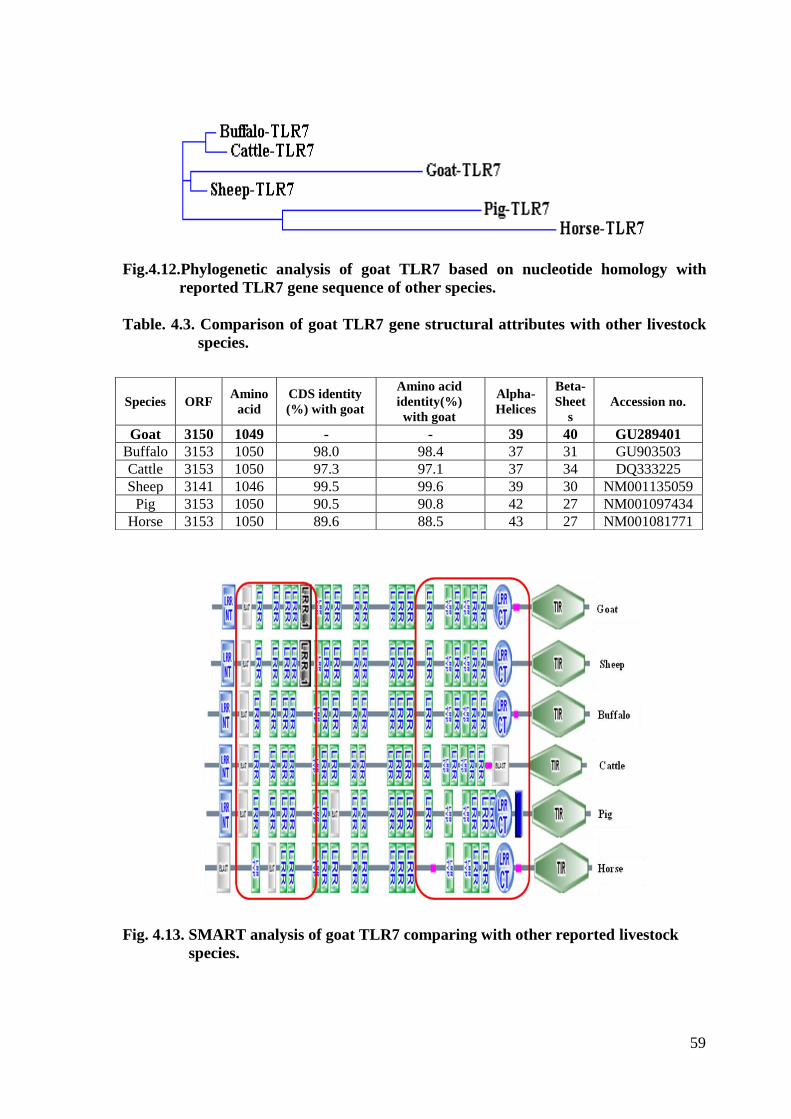
59
Fig.4.12.Phylogenetic analysis of goat TLR7 based on nucleotide homology with
reported TLR7 gene sequence of other species.
Table. 4.3. Comparison of goat TLR7 gene structural attributes with other livestock
species.
Fig. 4.13. SMART analysis of goat TLR7 comparing with other reported livestock
species.
Species ORF Amino
acid
CDS identity
(%) with goat
Amino acid
identity(%)
with goat
Alpha-
Helices
Beta-
Sheet
s
Accession no.
Goat 3150 1049 - - 39 40 GU289401
Buffalo 3153 1050 98.0 98.4 37 31 GU903503
Cattle 3153 1050 97.3 97.1 37 34 DQ333225
Sheep 3141 1046 99.5 99.6 39 30 NM001135059
Pig 3153 1050 90.5 90.8 42 27 NM001097434
Horse 3153 1050 89.6 88.5 43 27 NM001081771
60
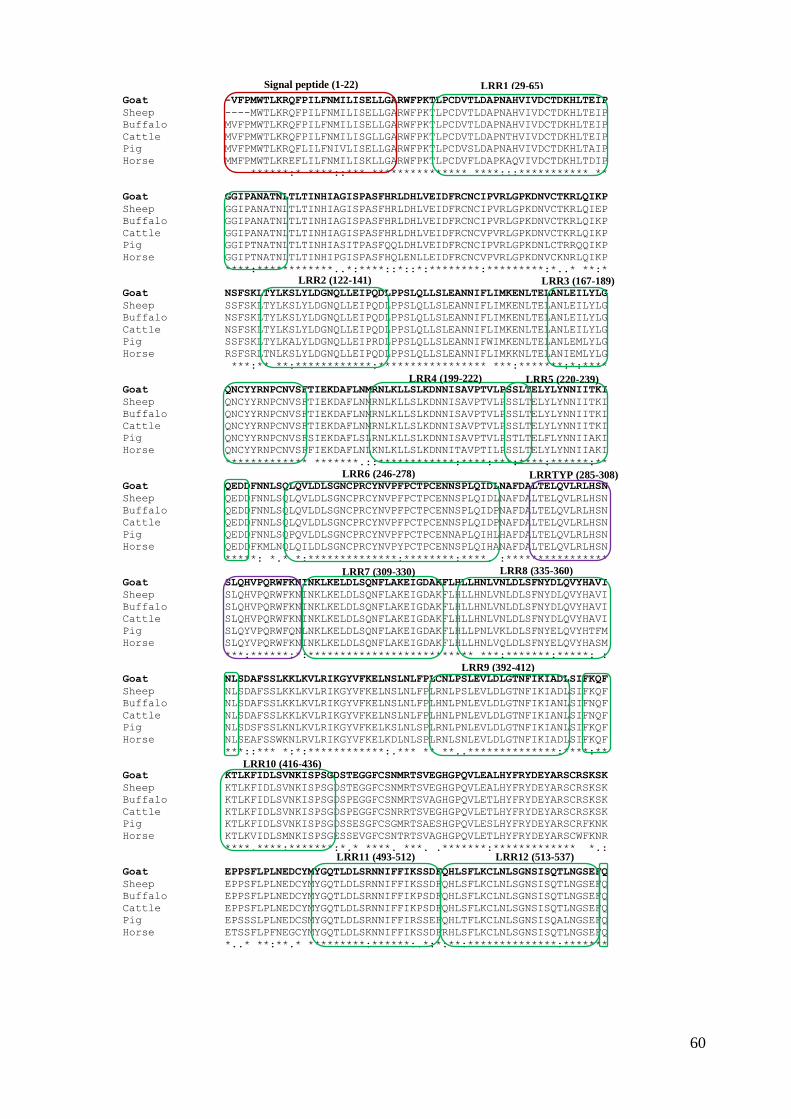
Goat -VFPMWTLKRQFPILFNMILISELLGARWFPKTLPCDVTLDAPNAHVIVDCTDKHLTEIP
Sheep ----MWTLKRQFPILFNMILISELLGARWFPKTLPCDVTLDAPNAHVIVDCTDKHLTEIP
Buffalo MVFPMWTLKRQFPILFNMILISELLGARWFPKTLPCDVTLDAPNAHVIVDCTDKHLTEIP
Cattle MVFPMWTLKRQFPILFNMILISGLLGARWFPKTLPCDVTLDAPNTHVIVDCTDKHLTEIP
Pig MVFPMWTLKRQFLILFNIVLISELLGARWFPKTLPCDVSLDAPNAHVIVDCTDKHLTAIP
Horse MMFPMWTLKREFLILFNMILISKLLGARWFPKTLPCDVFLDAPKAQVIVDCTDKHLTDIP
******:* ****::*** *************** ****:::*********** **
Goat GGIPANATNLTLTINHIAGISPASFHRLDHLVEIDFRCNCIPVRLGPKDNVCTKRLQIKP
Sheep GGIPANATNLTLTINHIAGISPASFHRLDHLVEIDFRCNCIPVRLGPKDNVCTKRLQIEP
Buffalo GGIPANATNLTLTINHIAGISPASFHRLDHLVEIDFRCNCIPVRLGPKDNVCTKRLQIKP
Cattle GGIPANATNLTLTINHIAGISPASFHRLDHLVEIDFRCNCVPVRLGPKDNVCTKRLQIKP
Pig GGIPTNATNLTLTINHIASITPASFQQLDHLVEIDFRCNCIPVRLGPKDNLCTRRQQIKP
Horse GGIPTNATNLTLTINHIPGISPASFHQLENLLEIDFRCNCVPVRLGPKDNVCKNRLQIKP
****:************..*:****::*::*:********:*********:*..* **:*
Goat NSFSKLTYLKSLYLDGNQLLEIPQDLPPSLQLLSLEANNIFLIMKENLTELANLEILYLG
Sheep SSFSKLTYLKSLYLDGNQLLEIPQDLPPSLQLLSLEANNIFLIMKENLTELANLEILYLG
Buffalo NSFSKLTYLKSLYLDGNQLLEIPQDLPPSLQLLSLEANNIFLIMKENLTELANLEILYLG
Cattle NSFSKLTYLKSLYLDGNQLLEIPQDLPPSLQLLSLEANNIFLIMKENLTELANLEILYLG
Pig SSFSKLTYLKALYLDGNQLLEIPRDLPPSLQLLSLEANNIFWIMKENLTELANLEMLYLG
Horse RSFSRLTNLKSLYLDGNQLLEIPQDLPPSLQLLSLEANNIFLIMKKNLTELANIEMLYLG
***:** **:************:***************** ***:*******:*:****
Goat QNCYYRNPCNVSFTIEKDAFLNMRNLKLLSLKDNNISAVPTVLPSSLTELYLYNNIITKI
Sheep QNCYYRNPCNVSFTIEKDAFLNMRNLKLLSLKDNNISAVPTVLPSSLTELYLYNNIITKI
Buffalo QNCYYRNPCNVSFTIEKDAFLNMRNLKLLSLKDNNISAVPTVLPSSLTELYLYNNIITKI
Cattle QNCYYRNPCNVSFTIEKDAFLNMRNLKLLSLKDNNISAVPTVLPSSLTELYLYNNIITKI
Pig QNCYYRNPCNVSFSIEKDAFLSLRNLKLLSLKDNNISAVPTVLPSTLTELFLYNNIIAKI
Horse QNCYYRNPCNVSFFIEKDAFLNLKNLKLLSLKDNNITAVPTILPSSLTELYLYNNIIAKI
************* *******.::************:****:***:****:******:**
Goat QEDDFNNLSQLQVLDLSGNCPRCYNVPFPCTPCENNSPLQIDLNAFDALTELQVLRLHSN
Sheep QEDDFNNLSQLQVLDLSGNCPRCYNVPFPCTPCENNSPLQIDLNAFDALTELQVLRLHSN
Buffalo QEDDFNNLSQLQVLDLSGNCPRCYNVPFPCTPCENNSPLQIDPNAFDALTELQVLRLHSN
Cattle QEDDFNNLSQLQVLDLSGNCPRCYNVPFPCTPCENNSPLQIDPNAFDALTELQVLRLHSN
Pig QEDDFNNLSQPQVLDLSGNCPRCYNVPFPCTPCENNAPLQIHLHAFDALTELQVLRLHSN
Horse QEDDFKMLNQLQILDLSGNCPRCYNVPYPCTPCENNSPLQIHANAFDALTELQVLRLHSN
*****: *.* *:**************:********:****. :****************
Goat SLQHVPQRWFKNINKLKELDLSQNFLAKEIGDAKFLHLLHNLVNLDLSFNYDLQVYHAVI
Sheep SLQHVPQRWFKNINKLKELDLSQNFLAKEIGDAKFLHLLHNLVNLDLSFNYDLQVYHAVI
Buffalo SLQHVPQRWFKNINKLKELDLSQNFLAKEIGDAKFLHLLHNLVNLDLSFNYDLQVYHAVI
Cattle SLQHVPQRWFKNINKLKELDLSQNFLAKEIGDAKFLHLLHNLVNLDLSFNYDLQVYHAVI
Pig SLQYVPQRWFQNLNKLKELDLSQNFLAKEIGDAKFLHLLPNLVKLDLSFNYELQVYHTFM
Horse SLQYVPQRWFKNINKLKELDLSQNFLAKEIGDAKFLHLLHNLVQLDLSFNYELQVYHASM
***:******:*:************************** ***:*******:*****: :
Goat NLSDAFSSLKKLKVLRIKGYVFKELNSLNLFPLCNLPSLEVLDLGTNFIKIADLSIFKQF
Sheep NLSDAFSSLKKLKVLRIKGYVFKELNSLNLFPLRNLPSLEVLDLGTNFIKIADLSIFKQF
Buffalo NLSDAFSSLKKLKVLRIKGYVFKELNSLNLFPLHNLPNLEVLDLGTNFIKIANLSIFNQF
Cattle NLSDAFSSLKKLKVLRIKGYVFKELNSLNLFPLHNLPNLEVLDLGTNFIKIANLSIFNQF
Pig NLSDSFSSLKNLKVLRIKGYVFKELKSLNLSPLRNLPNLEVLDLGTNFIKIANLSIFKQF
Horse NLSEAFSSWKNLRVLRIKGYVFKELKDLNLSPLRNLSNLEVLDLGTNFIKIADLSIFKQF
***::*** *:*:************:.*** ** **..**************:****:**
Goat KTLKFIDLSVNKISPSGDSTEGGFCSNMRTSVEGHGPQVLEALHYFRYDEYARSCRSKSK
Sheep KTLKFIDLSVNKISPSGDSTEGGFCSNMRTSVEGHGPQVLEALHYFRYDEYARSCRSKSK
Buffalo KTLKFIDLSVNKISPSGDSPEGGFCSNMRTSVAGHGPQVLETLHYFRYDEYARSCRSKSK
Cattle KTLKFIDLSVNKISPSGDSPEGGFCSNRRTSVEGHGPQVLETLHYFRYDEYARSCRSKSK
Pig KTLKFIDLSVNKISPSGDSSESGFCSGMRTSAESHGPQVLESLHYFRYDEYARSCRFKNK
Horse KTLKVIDLSMNKISPSGESSEVGFCSNTRTSVAGHGPQVLETLHYFRYDEYARSCWFKNR
****.****:*******:*.* ****. ***. .*******:************* *.:
Goat EPPSFLPLNEDCYMYGQTLDLSRNNIFFIKSSDFQHLSFLKCLNLSGNSISQTLNGSEFQ
Sheep EPPSFLPLNEDCYMYGQTLDLSRNNIFFIKSSDFQHLSFLKCLNLSGNSISQTLNGSEFQ
Buffalo EPPSFLPLNEDCYMYGQTLDLSRNNIFFIKPSDFQHLSFLKCLNLSGNSISQTLNGSEFQ
Cattle EPPSFLPLNEDCYMYGQTLDLSRNNIFFIKPSDFQHLSFLKCLNLSGNSISQTLNGSEFQ
Pig EPSSSLPLNEDCSMYGQTLDLSRNNIFFIRSSEFQHLTFLKCLNLSGNSISQALNGSEFQ
Horse ETSSFLPFNEGCYMYGQTLDLSKNNIFFIKSSDFRHLSFLKCLNLSGNSISQTLNGSEFQ
*..* **:**.* *********:******:.*:*:**:**************:*******
Signal peptide (1-22) LRR1 (29-65)
LRR2 (122-141) LRR3 (167-189)
LRR4 (199-222) LRR5 (220-239)
LRR6 (246-278) LRRTYP (285-308)
LRR7 (309-330) LRR8 (335-360)
LRR9 (392-412)
LRR10 (416-436)
LRR11 (493-512) LRR12 (513-537)

61
Goat PLVELKYLDFSNNRLDLLYSTAFEELHNLEVLDISSNSHYFQSEGITHMLNFTKNLKVLK
Sheep PLVELKYLDFSNNRLDLLYSTAFEELHNLEVLDISSNSHYFQSEGITHMLNFTKNLKVLK
Buffalo PLVELKYLDFSNNRLDLLYSTAFEELHNLEVLDISSNSHYFQSEGITHMLNFTKNLKVLK
Cattle PLVELKYLDFSNNRLDLLYSTAFEELHNLEVLDISSNSHYFQSEGITHMLNFTKNLKVLR
Pig PLVELKYLDFSNNRLDLLHSTAFEELRNLEVLDISSNSHYFQSEGITHMLDFTKNLKVLK
Horse PLVELKYLDFSNNRLDLLYSTAFEELRNLEVLDISSNSHYFQSEGITHMLNFTKNPKVLR
******************:*******:***********************:**** ***:
Goat KLMMNYNDIATSTSRTMESESLQILEFRGNHLDILWRDGDNRYLKFFKNLLNLEELDISE
Sheep KLMMNYNDIATSTSRTMESESLQILEFRGNHLDILWRDGDNRYLKFFKNLLNLEELDISE
Buffalo KLMMNYNDIATSTSRTMESESLQILEFRGNHLDILWRDGDNRYLKFFKNLLNLEELDISE
Cattle KLMMNYNDIATSTSRTMESESLQILEFRGNHLDILWRDGDNRYLKFFKNLLNLEELDISE
Pig KLMMNNNDIATSTSTTMESESLRILEFRGNHLDILWRDGDNRYLKFFKNLHKLEELDISE
Horse KLMMNNNDISTSTSRTMESESLTILEFRGNHLDVLWKDGDNRYLKFFKNLLNLKELDISE
***** ***:**** ******* **********:**:************* :*:******
Goat NSLSFLPLGVFDSMPPNLKTLSLAKNGLKSFSWKGLQSLKNLETLDLSFNQLKTVPERLS
Sheep NSLSFLPLGVFDSMPPNLKTLSLAKNGLKSFSWKGLQSLKNLETLDLSFNQLKTVPERLS
Buffalo NSLSFLPLGVFDSMPPNLKTLSLAKNGLKSFSWEKLQSLKNLETLDLSFNQLKTVPERLS
Cattle NSLSFLPLGVFDSMPPNLKTLSLAKNGLKSFSWERLQSLKNLETLDLSFNQLKTVPERLS
Pig NSLSFLPSGVFDGMPPNLKTLSLAKNGLKSFNWGKLQYLQNLETLDLSYNQLKTVPERLS
Horse NSLSFLPPGVFESMPPNLKTLYLVNNKFKSFNWGKLQLLKNLETLDLSYNQLRTVPERLS
******* ***:.******** *.:* :***.* ** *:********:***:*******
Goat NCSRSLKKLILKNNQIRCLTKYFLQGAFQLRHLDLSSNKIQVIQKTSFPENVLNNLNILF
Sheep NCSRSLKKLILKNNQIRCLTKYFLQGAFQLRHLDLSSNKIQVIQKTSFPENVLNNLNILF
Buffalo NCSRSLKKLILKNNQIRCLTKYFLQGAFQLRHLDLSSNKIQVIQKTSFPENVLNNLNILF
Cattle NCSRSLKKLILKNNQIRCLTKYFLQGAFQLRHLDLSSNKIQVIQKTSFPENVLNNLNILF
Pig NCSRSLKKLILKNNEIRNLTKYFLQDAFQLRHLDLSSNKIQVTQKTSFPENVLNNLQILF
Horse NCSRSLKKLILKNNQIRRLTKYFLQDAFQLRYLDLSSNKIQIIQKSSFPENVLNNLDMLL
**************:** *******.*****:*********: **:**********::*:
Goat LHHNRFLCNCDAVWFVWWVNHTEVTIPYLATDVTCMGPGAHKGQSVVSLDLYTCELDLTN
Sheep LHHNRFLCNCDAVWFVWWVNHTEVTIPYLATDVTCMGPGAHKGQSVVSLDLYTCELDLTN
Buffalo LHHNRFLCNCDAVWFVWWVNHTEVTIPYLATDVTCMGPGAHKGQSVVSLDLYTCELDLTN
Cattle LHHNRFLCNCDAVWFVWWVNHTEVTIPYLATDVTCMGPGAHKGQSVVSLDLYTCELDLTN
Pig LHHNRFLCNCDAVWLVWWVNHTEVTIPFLATDVTCMGPGAHKGQSVVSLDLYTCELDLTN
Horse LHRNRFLCTCDAVWFVWWVNHTEVTIPYLATDVTCTGPGAHKGQSVVSLDLYTCELDLTN
**:*****.*****:************:******* ************************
Goat FILFSLSISAILSLMMITTANHLYFWDVWYSYHFCKAKIKGYRRLISPNSCYDAFIVYDT
Sheep FILFSLSISAVLSLMMITTANHLYFWDVWYSYHFCKAKIKGYRRLISPNSCYDAFIVYDT
Buffalo FILLSLSISAVLSLMMITTANHLYFWDVWYSYHFCKAKIKGYRRLISPNSCYDAFIVYDT
Cattle FILFSLSISAVLSLMMITIANHLYFWDVWYSYHFCKAKIKGYRRLISPNSCYDAFIVYDT
Pig FVLFSLSLSAVLFLIVITIANHLYFWDVWYSYHFCKAKIKGYQRLISPNSCYDAFIVYDT
Horse LILFSLSMSMALFLMVVTTANHLYFWDVWYSYHFCKAKIKGYQRLTLTDSCYDAFIVYDT
::*:***:* * *:::* ***********************:** .:***********
Goat KDPAVTEWVLDELVAKLEDPREKCFNLCLEERDWLPGQPVLENLSQSIQLSKKTVFVMTD
Sheep KDPAVTEWVLDELVAKLEDPREKCFNLCLEERDWLPGQPVLENLSQSIQLSKKTVFVMTD
Buffalo KDPAVTEWVLDELVAKLEDPREKCFNLCLEERDWLPGQPVLENLSQSIQLSKKTVFVMTD
Cattle KDPAVTEWVLDELVAKLEDPREKCFNLCLEERDWLPGQPVLENLSQSIQLSKKTVFVMTD
Pig KDPAVTEWVLDELVAKLEDPREKHFNLCLEERDWLPGQPVLENLSQSIQLSKKTVFVMTD
Horse KDPAVTEWVLDELVAKLEDPREKHFNLCLEERDWLPGQPVLENLSQSIQLSKKTVFVMTD
*********************** ************************************
Goat KYAKTENFKIAFYLSHQRLMDEKVDVIILIFLEKPLQKSKFLQLRKRLCGSSVLEWPTNP
Sheep KYAKTENFKIAFYLSHQRLMDEKVDVIILIFLEKPLQKSKFLQLRKRLCGSSVLEWPTNP
Buffalo KYAKTENFKIAFYLSHQRLMDEKVDVIILIFLEKPLQKSKFLQLRKRLCGSSVLEWPTNP
Cattle KYAKTENFKIAFYLSHQRLMDEKVDVIILIFLEKPLQKSKFLQLRKRLCGSSVLEWPTNP
Pig KYAKTEKFKIAFYLSHQRLMDEKVDVIILIFLEKPLQKSKFFQLRKRLCGSSVLEWPTNP
Horse KYAKTENFKIAFYLSHQRLIDEKVDVIILIFLEKPLQKSKFLQLRKRLCGSSVLEWPRNP
******:**********************************:*************** **
Goat QAHPYFWQCLKNALATDNHVTYSQVFKETA
Sheep QAHPYFWQCLKNALATDNHVTYSQVFKETA
Buffalo QAHPYFWQCLKNALATDNHVTYSQVFKETA
Cattle QAHPYFWQCLKNALATDNHVTYSQVFKETA
Pig QAHPYFWQCLKNALATDNHVTYSQVFKETA
Horse QAHPYFWQCLKNALATDNHVTYSQVFKETV
*****************************.
Fig. 4.14. Comparison of the domain architecture of goat, buffalo, cattle, sheep, pig
and horse TLR7 protein sequence. The domains were predicted using the
SMART program (Schultz et al., 1998). LRR- leucine-rich repeat; NT—N-
terminal repeat; CT—C-terminal repeat; LC- Low complexity; TIR—
toll/interleukin-1 receptor domain.
TIR domain (887-1033)
LRR13 (538-564) LRR14 (592-615)
LRRTYP (646-669)
LRR15 (671-690) LRRTYP (695-718)
LRR16 (719-738) LRR17 (743-764)
LRRCT (780-831) LC (837-853)

62
Prediction of different functional domains based on the predicted amino acid
sequences was attempted in goat in comparison to other livestock species by aligning them
altogether. The signal peptide was found to be conserved among the ruminant species with
some variation in non-ruminant species. The LRR (1-6) were also found to be conserved
among the ruminants with some variations in non-ruminants. LRRTYP was more similar
in goat and sheep as compared to cattle and buffalo, where they shared the amino acid
changes with horse and pig. Again, LRRs (7,8) were found to be conserved among the
ruminants, but LRR9 was found to be conserved between goat and sheep in comparison to
buffalo, cattle, horse and pig. LRR10 was also conserved within ruminants as compared to
non-ruminant species, LRR11 was also found to be more similar in sheep and goat as
compared to other species. LRR12-17 and C-terminal LRR and 2 LRR_TYP were again
found to be conserved among the ruminants as compared to non-ruminants, followed by
low complexity region and TIR domain (Fig. 4.14). Overall the results indicate that the
ligand specificity in ruminants may be conserved as compared to non-ruminants.
4.8. Sequence analysis of goat TLR8 gene
Sequence characterisation
Recombinant plasmid of goat TLR8 was sequenced by primer walking and
sequence was assembled into 3238 nucleotides long contig by using SeqMan program of
Lasergene software. In the assembled mRNA sequence, TLR8 gene ORF was identified
with the help of EditSeq program. It showed goat TLR8 ORF to be 3102 nucleotides long,
coding for 1033 amino acids, with partial 5‟UTR of 90 bp and 3‟UTR of 45 bp, which was
submitted to NCBI (GenBank accession no. HM769860).
Domain Structure analysis
Further, SMART analysis revealed amino acids, 1-817 lying in ectodomain, out of
which amino acids 1-18 were part of signal peptide, amino acids 818-840 being part of the
transmembrane region of TLR8 and amino acids 841-1033 were found in the cytoplasmic
domain containing TIR (871-1017), as shown in Fig. 4.15. The ectodomain of goat TLR8
had different regions, which included 15 leucine-rich repeats (LRR), 3 leucine rich repeats
of typical subfamily (LRR-TYP), one leucine rich repeat of C-terminal domain (LRRCT),
one transmembrane domain and a conserved toll-interleukin1-receptor (TIR) domain.
Secondary structure prediction of the protein sequence carried out using CLC Main
Workbench, which revealed goat TLR8 amino acid sequence having 41 alpha-helices and
33 beta-sheets (Table 4.4).

63
Fig. 4.16. Tertiary structure visualized by PyMole
(Red- signal peptide, Green-TM, Yellow-TIR)
Fig. 4.15. Predicted domain structure of goat TLR8 by SMART analysis, showing
different functional domains.
Tertiary structure prediction of TLR8 gene of goat
Insilico translation of predicted coding
DNA sequence of TLR8 of goat, when subjected
to the online tool Modeller for the prediction of
tertiary structure, the distinctive horseshoe shaped
structure was observed. This structure was formed
by the overlapping of repeating amino acid
sequence, termed a “leucine-rich repeats”. The
different functional domains could be
distinguished by different colors (Fig. 4.16).
Comparison of goat TLR8 with other livestock species
When nucleotide sequence of goat TLR8 was compared, with other livestock
species, goat TLR8 was found to have same ORF of 3102 nucleotides long, except pig
(3087 nucleotides) and horse (3117 nucleotides) as given in Table 4.4. Phylogenetic
analysis both at nucleotide and amino acid level showed goat being placed closer to
buffalo, then to cattle, sheep, pig and horse. Horse was again placed most distant from the
other livestock species Fig. 4.17.
The prediction of different functional domains in the goat TLR8 gene was carried
out by online software SMART, results of which were further compared to other reported
livestock species. All the ruminant species shared almost the similar domain structure but
the non-ruminant species pig and horse varied in the number of LRRs and their positions
in the structure (Fig. 4.18).
Ectodomain LRRs
Cytoplasmic TIR domain
Trans membrane domain Signal peptide

64
Fig. 4.17. Phylogenetic analysis of goat TLR8 based on comparison with other
livestock species.
Fig. 4.18. SMART analysis of goat TLR8 and its comparison with predicted
structures of other reported livestock species (Domain variations are
shown in boxes).
Table 4.4. Comparison of goat TLR8 characteristics with other livestock species.
Species
ORF
lengt
h
No. of
amino
acids
Nucleotide (%)
identity with
goat
Amino acid (%)
identity with goat
Alpha-
Helices
Beta-
Sheets Accession no.
Goat 3102 1033 - - 41 33 HM769860
Buffalo 3102 1033 99.1 98.5 43 35 GQ499855
Cattle 3102 1033 98.1 97.0 2 38 EF583902
Sheep 3102 1033 97.8 96.8 4 33 NM_001135929
Pig 3087 1028 84.0 79.3 5 34 AB258452
Horse 3117 1038 81.8 77.2 43 28 EF090622

65
Goat MTLRFLLLTSLFLLISDSCEFFTEASYPRSYPCDVKNENGSFIAECNSRRLQEVPQTVDK
Buffalo MTLRFLLLTSLFLLISDSCEFFTEASYPRSYPCDVKNENGSFIAECNSRRLQEVPQTVDK
Cattle MTLHFLLLTSLFLLISDSCEFFTEASYPRSYPCDVKNENGSFIAECNGRRLQEVPQTVDK
Sheep MTLHFLLLTSLFLLISDSCEFFTEASYPRSYPCDVKNKNGSFIAECNSRRLQEVPQTVDK
Pig MTLHFLLLTCLFLLIPDSCEFFTGANYSRSYPCDERKENGSVIAECNNRQLQEVPRRVGN
Horse MILQPLLLTCLFLIISDSCEFFTETNYSRSYPCDEKRENVSVIAECNDRRLEEVPQTVGK
* *: ****.***:*.******* :.*.****** :.:* *.*****.*:*:***: *.:
Goat DVTEVDLSDNFITRITNESFQGLQNLTKINLNHNAKSQ---SGNPAVKKAMTITDGAFLN
Buffalo DVTEVDLSDNFITQITNESFQGLQNLTKINLNHNAKSQ---SGNPAVKKAMTITDGAFLN
Cattle DVTEVDLSDNFITRVTNESFQGLQNLTKINLNHNAKSQ---SGNPAVKKAMTITDGAFLN
Sheep AVTEVDLSDNFITRITNESFQGLQNLTKINLNHNAKSQ---SGNPAVKKAMTITYGAFLN
Pig YVTELDLSDNFIRRITNESFQGLQNLTKINLNHNAKLW---PQS---ENGMTITDGAFLN
Horse YVTELDLSDNFIIHITNESFQGLQNLTKINLNHNGKARSQNENPDVNKNGMNITDGAFLN
***:******* ::*******************.* ::.*.** *****
Goat LKHLRELLLEDNQLQQIPAGLPESLKKLSLIQNNIITLTKKNTSGLGNLESLYLGWNCYF
Buffalo LKHLRELLLEDNQLQQIPAGLPESLKKLSLIQNNIITLTKKNTSGLGNLESLYLGWNCYF
Cattle LKHLRELLLEDNQLQQIPAGLPESLKKLSLIQNNIITLTKKNTSGLGNLESLYLGWNCYF
Sheep LKHLRELLLEDNQLQEIPAGLPESLKELSLIQNNIITLTKKNTSGLGNLERLYLGWNCYF
Pig LHHLRELLLEDNQLREIPTGLPESLRELSLIQNKIILLNTKNMFGLRKLESLYLGWNCYF
Horse LQNLRELLLEDNQLDKIPTGLPGSLRELSLIQNRITSVTKKNTSGLMNLEYLYLGWNCYF
*::*********** :**:*** **::******.* :..** ** :** *********
Goat A--CDKKFSIENGAFQNLTKLKVLSLSFNPLHSVPPSLPSSLTELYLSNTHIGNVSEEDF
Buffalo A--CDKKFTIENGAFQNLTKLKVLSLSFNPLHSVPPSLPSSLTELRLSNTHIGNVSEEDF
Cattle A--CDKKFTIENGAFQNLTKLKVLSLSFNPLHSVPPSLPSSLTELYLSNTHIGNVSEEDF
Sheep A--CNKKFSIENGAFQNLTKLKVLSLSFNPLHSVPPSLPSSLTELYLSNTHIGNVSEEDF
Pig T--CNETFIIDEGAFENLTNLKVLSLSFNTLYRVPPKLPSSLTKLYLSNTKIRNINQEDF
Horse GNICNKTFDIEDGTFERLTNLKVLSLSFNNLSHVPPKLPNSLRELYLSNTKIKNITQEDF
*::.* *::*:*:.**:********* * ***.**.** :* ****:* *:.:***
Goat KELSNLRVLDLSGNCPRCFNAPFPCVPCQGGASIQIHPLAFQTLTQLRYLNLSSTSLRKV
Buffalo KELSNLRVLDLSGNCPRCFNAPFPCVPCQGGASIQIHPLAFQTLTQLHYLNLSSTSLRKV
Cattle KELSNLRVLDLSGNCPRCFNAPFPCVPCQGDASIQIHPLAFQTLTQLRYLNLSSTSLRKV
Sheep KELSNLRVLDLSGNCPRCFNAPFPCVPCQGGASIQIHPLAFQTLTQLRYLNLSSTSLRKV
Pig KGLENLRVLDLSGNCPRCFNAPFPCNPCPGDASIQIHPLAFRYLTELRYLNLSSTSLRRI
Horse KELRNLTVLDLSGNCPRCFNAPFPCTPCERDSSIQIHPLAFQDLTELRYLNLSSTSLRKV
* * ** ****************** ** .:*********: **:*:**********::
Goat PASWFDNMHNLKVLDLEFNYLMDEIASGEFLTKLPSLEILDLSYNYELKKYPQYTNISKN
Buffalo PASWFDNMHNLKVLDLGFNYLMDEIASGEFLTKLPSLEILDLSYNYELKKYPQYINISKN
Cattle PASWFDNMHNLKVLDLEFNYLMDEIASGEFLTKLPSLEILDLSYNYELKKYPQHINISKN
Sheep PASWFDNMHNLKVLDLEFNYLMDEIASGEFLTKLPSLEILDLSYNYELKKYPQYINISKN
Pig PATWFENLHHLKVLHLEFNYLMDEIASGEFLAKLPSLEILDLSYNYEQKKYPQYINISHY
Horse PAIWFDNMHHLKVLHLEFNYLVQEIASGEFLTKLPSLEILDLSFNYIVTKYPKYIEISPN
** **:*:*:****.* ****::********:***********:** .***:: :**
Goat FSKLISLQMLHLRGYVFQELRKKDFNPLRHLSNLTTINLGVNFIKQIDFSIFPWFPNLKI
Buffalo FSKLISLQMLHLRGYVFQELRKKDFNPLRHLSNLTTINLGVNFIKQIDFSIFPWFPNLKI
Cattle FSKLISLQMLHLRGYVFQELRMEDFEPLRHLSNLTTINLGVNFIKQIDFSIFQWFPNLKI
Sheep FSKLISLQMLHLRGYVFQELRRKDFKPLQHLSNLTTINLGVNFIKQIDFSIFHWFPNLKI
Pig FANLTSLQILHLRAYVFQELRKEDFQPLRNLLHLKFINLGINFIKQIDFTIFSEFSNLSI
Horse FSNLTSLQILHLRGYVFQEVRKEHFRPLMSLSNLKTINLGVNFIKQIDFTFFQHFPNLTV
*::* ***:****.*****:* :.*.** * :*. ****:********::* *.**.:
Goat IYLSENRISPLVSDTEQHDANGTSFQGHILKRRSADIQFDPHSNFYHDTRPLIKTECSRL
Buffalo IYLSENRISPLVSDTEQHDANGTSFQSHILKRRSADIQFDPHSNFYHNTRPLIKTECSRL
Cattle IYLSENRISPLVSDTEQHDANGTSFQSHILKRRSADIQFDPHSNFYHNTRPLIKTECSRL
Sheep VYLSENRISPLVSDTEQHDANGTFFQSHILKRRSADIQFDPHSNFYHNTHPLIKTECSRL
Pig IYLSENRISPLVNNTGQKNGDRPSFQSHVLKPRSATPKFDPHSNFYHNTKPLIKPQCSRY
Horse IYLSENRISPLVNDSLQNYTNGSAFQSHILKRRSADFEFNPHSNFYHNTNPLIKPQCTAY
:***********.:: *: : . **.*:** *** :*:*******:*.****.:*:
Goat GNALDLSLNSISFIGVNQFQDFGNISCLNLSSSGNGQVLNGTEFSRLSGIKYLDLTNNRL
Buffalo GNALDLSLNSIFFIGVNQFQDFGNISCLNLSSNGNGQVLNGTEFSRLSGIKYLDLTNNRL
Cattle GNALDLSLNSIFFIGVNQFKDFGNISCLNLSSNGNGQVLNGTEFSCLSGIKYLDLTNNRL
Sheep GNALDLSLNSIFFIGVNQFKDFGNISCLNLSSNGNGQVLNGTEFSRLSGIKYLDLTNNRL
Pig GKALDLSLNSIFFIGPNQFEAFKDIACLNLSSNGNGQVLHGSEFSHLPGIKYLDLTNNRL
Horse GKALDLSLNSIFFIGQKQFKAFHDIACLNLSSNGIGQPLHGTEFSAVPHIKYLDLTNNRI
*:********* *** :**: * :*:******.* ** *:*:*** :. **********:
Signal Sequence (1-18)
LRR 1 (59-80)
LRR 3 (163-192)
LRR 5 (238-256)
LRR_TYP 4 (193-
213)
LRR 6 (279-302)
LRR 7 (303-322) LRR 8 (329-353)
LRR 9 (386-409)
LRR 10 (410-432)
LRR 11 (522-542)
LRR_TYP 2 (118-141)

66
Goat DFDDDAAFSELPLLEVLDLSYNAHYFRIAGVTHRLGFIEHLTNLRVLNLSNNDIFTLTET
Buffalo DFDDDAAFSELPLLEVLDLSYNAHYFRIAGVTHRLGFIEHLTNLRVLNLSNNDIFTLTET
Cattle DFDDDAAFSELPLLEVLDLSYNAHYFRIAGVTHRLGFIEHLTNLRVLNLSNNDIFTLTET
Sheep DFDDDAAFSELPLLEVLDLSYNAHYFRIAGVTHRLGFIEHLTNLRVLNLSNNDIFTLTET
Pig DFDDDAAFSELPLLEVLDLSYNSHYFRIAGVTHRLGFIQNLPQLRVLNLSHNSIFTLTET
Horse DFDDDNALRELPELEVLDFSYNAHYFRIAGVTHRLGFIQNLTQLRVLNLSHNSIYTLTEY
***** *: *** *****:***:***************::*.:*******:*.*:****
Goat QLKSASLGELVFSGNRLDLLWNAQDVRYWQIFQNLTNLTRLDLARNNLRHISSQAFLNLP
Buffalo QLKSASLGELVFSGNRLDLLWNAQDVRYWQIFQNLTNLTRLDLARNNLRHISSQAFLNLP
Cattle QLKSASLGELVFSGNRLDLLWNAQDVRYWQIFQNLTNLTRLDLARNNLRHISSQAFLNLP
Sheep QLKSASLGELVFSGNRLDLLWNAQDVRYWQIFQNLTNLTRLDLARNNLQHISSQAFLNLP
Pig YLKSTSLKELVFSGNRLDLLWNAQDDRYWQIFKNLSTLTHLDLSSNNLQHIPSEAFLNLP
Horse NMNSMSLEELVFSGNRLDLLWNAEDRRYRKIFKCLRNLTRLDLSFNNLQHIPDEAFLNLP
::* ** ***************:* ** :**: * .**:***: ***:**..:******
Goat RTLTDLYINDNMLNFFNWSLLEYFPYLRLLDLSGNQLFSLTNSLSTFASSLETLLLSGNR
Buffalo RTLTDLYINDNMLNFFNWSLLEYFPYLRLLDLSGNQLFFLTNSLSTFASSLETLLLSGNR
Cattle RTLTDLYINDNMLNFFNWSLLEYFPHLRLLDLSGNQLFFLTNSLSTFASSLETLLLSRNR
Sheep RTLTDLYINDNMLNFFNWSLLEYFPHLRLLDLSGNQLFFLTNSLSTFASSLETLLLSRNR
Pig QTLTELYISDNRLNFFNWSLLQQFPNLTLLDLSGNELSFLTDSLSKFTTSLQTLILRQNR
Horse QNLTELYINDNRLHFFNWTLLQHFPHLHLLDLSRNKLSSLTNNLSKFSPSLRTLLLSQNK
:.**:***.** *:****:**: ** * ***** *:* **:.**.*:.**.**:* *:
Goat ISHLPSDFLSGASSLIHLDLSSNQLKMLNRSTFETKTATRLTVLELGSNPFDRTCDFGDF
Buffalo ISHLPSDFLSGASSLIHLDLSSNQLKMLNRSTFETKTATKLTVLELGSNPFDCTCDFGDF
Cattle ISHLPSDFLSGASSLIHLDLNSNQLKMLNRSTFETKTATKLTVLELGGNPFDCTCDLGDF
Sheep ISHLPSDFLSGASSLIHLDLSSNQLKMLNRSTFETKTATKLTILELGSNPFDCTCDFGDF
Pig ISYLPSGLLSEASSLTHLDLSSNQLKMVNISKLHAKTTTNLAILKLDRNPFDCTCDIRDF
Horse ISHLPSGFFSEASGLIHLDLRFNRLKMINKTTLQTKTTINLAVLELGGNPFDCTCDIGDF
**:***.::* **.* **** *:***:* :.:.:**: .*::*:*. **** ***: **
Goat REWMDGNLNVRIPGLTDVICASPGDQEGKSIVSLDLTTCVSDTIAAIFCFLTFSVTISVM
Buffalo REWMDGNLNVRIPRLTDVICASPGDQGGKSIVSLDLTTCVSDTIAAIFCFLTFSVTISVM
Cattle LEWMDRNLNVRVPRLTDVICASPGDQEGKSIVSLDLSTCVSDTIAAIFCFLTFSVTISVM
Sheep REWMDRNLNVRVPRLTDVICASPGDQEGKSIVSLDLTTCVSDTIAAIFCFLTFSVTISVM
Pig RKWMDENLKVTIPRLTDVICASPGDQRGRSIVSLELTTCVSDTIAAIICFFTFFVTSTVM
Horse RRWMDENLNIAIPRLADVICASPGDQRGKSIVSLELTTCVSDAIAAILCFFTFFITVTVM
.*** **:: :* *:********** *:*****:*:*****:****:**:** :* :**
Goat LAALAHHWFYWDAWFIYHVCLAKVKGYRSLSTSQTFYDAYISYDTKDASVTDWVINELRF
Buffalo LAALAHHWFYWDAWFIYHVCLAKVKGYRSLSTSQTFYDAYISYDTKDASVTDWVINELRF
Cattle LAALAHHWFYWDAWFIYHVCLAKVKGYRSLSTSQTFYDAYISYDTKDASVTDWVINELRF
Sheep LAALAHHWFYWDAWFIYHVCLAKVKGYRSLSTSQTFYDAYVSYDTKDASVTDWVINELRF
Pig LVALAHHWFYWDAWFIYHVCLAKVKGYRSLPTSQTFYDAYVSYDTKDASVTDWVMNELRF
Horse LAALAHHWFYWDVWFIYHMCLAKIKGYRSLSTSQTFYDAYVSYDTKDASVTDWVINELRF
*.**********.*****:****:******.*********:*************:*****
Goat HLEESEDKNVLLCLEERDWDPGLAVIDNLMQSINQSKKTIFVLTKKYAKNWNFKTAFYLA
Buffalo HLEESEDKNVLLCLEERDWDPGLAVIDNLMQSINQSKKTIFVLTKKYAKNWNFKTAFYLA
Cattle HLEESEDKNVLLCLEERDWDPGLAIIDNLMQSINQSKKTIFVLTKKYAKNWNFKTAFYLA
Sheep HLEESEDKNVLLCLEERDWDPGLAIIDNLMQSINQSKKTIFVLTKKYAKNWNFKTAFYLA
Pig HLEESEGKNVLLCLEERDWDPGLAIIDNLMQSINQSKKTIFVLTKKYAKNWNFKTAFYLA
Horse HLEESEEKNVLLCLEERDWDPGLAIIDNLMQSINQSKKTIFVLTKKYAKNWNFKTAFYLA
****** *****************:***********************************
Goat LQRLMEENMDVIVFILLEPVLQHSQYLRLRQRICKSSILQWPDNPKAEGLFWQSLKNVVL
Buffalo LQRLMEENMDVIVFILLEPVLQHSQYLRLRQRICKSSILQWPDNPKAEGLFWQSLKNVVL
Cattle LQRLMEENMDVIVFILLEPVLQHSQYLRLRQRICKSSILQWPDNPKAEGLFWQSLKNVVL
Sheep LQRLMEENMDVIVFILLEPVLQHSQYLRLRQRICKSSILQWPDNPKAEGLFWQSLKNVVL
Pig LQRLMDENMDVIVFILLEPVLQHSQYLRLRQRICKSSILQWPDNPKAEGLFWQSLKNVVL
Horse LQRLMDENMDVIVFILLEPVLQHSQYLRLRQRICKSSILQWPDNPKAEGLFWQSLKNVVL
*****:******************************************************
Goat TANDSRYNNLYVNSIKQY
Buffalo TANDSRYNNLYVNSIRQY
Cattle TANDSRYNNLYVNSIKQY
Sheep TANDSRYNNLYVNSIKQY
Pig TENDSRYNSLYVNSIK--
Horse TENNSRYNNLYVDSIKQY
* *:****.***:**:
Fig. 4.19. Comparison of the domain architecture of goat, buffalo, cattle, sheep, pig
and horse TLR8 protein sequence. The domains were predicted using the
SMART program (Schultz et al., 1998). LRR- leucine-rich repeat; NT—N-
terminal repeat; CT—C-terminal repeat; TIR—toll/interleukin-1 receptor
domain.
LRR 12 (576-599)
LRR_TYP -13 (630-653)
LRR 14 (679-702)
LRR 15 (704-726) LRR 16 (728-750)
LRR CT 17 (764-815) TM (818-840)
TIR (871-1017)

67
The amino acid sequence of goat TLR8 was subjected to the SMART online
programme for the prediction of different functional domains in goat, by aligning them
with other livestock species. The signal peptide was found to be conserved among the
ruminant species with some variation in non-ruminant species. The LRRs (1-4) were also
found to be conserved among the goat, buffalo and cattle but with some variation found in
sheep and non-ruminants. Again, LRRs (5-7) were found to be conserved among the
ruminants but LRR8 was different in goat as compared to other ruminant and non-
ruminant species. LRR9 was found to be conserved among the ruminants but LRR10
showed variation in sheep as compared to goat, cattle and buffalo. LRRs (11-13) were
found to be conserved among goat, sheep and cattle and LRR14 was found to be different
in goat as compared to other species. LRRs (15-17) showed little variation, but
transmembrane region and TIR domain were found to be almost conserved in all the
ruminant species (Fig. 4.19).
4.9. Characterization of TLR8 5’-upstream region
Nucleotide sequence of PCR products, representing 5‟-upstream region of goat
TLR8 gene in overlapping fragments were assembled into 1.01 kb contig and submitted to
NCBI GenBank (Accession Number JQ911705). When compared with other livestock
species, the nucleotide sequence of goat TLR8 showed a maximum homology of 88% with
cattle and relatively low level of homology was observed with rest of the species. When
the sequence based phylogenetic analysis was carried out, goat shared the closest place
with cattle, as compared to other reported species (Fig. 4.20).
Fig. 4.20. Nucleotide sequence based phylogenetic analysis of 5’-upstream of TLR8
gene comparing goat with other species.
When the goat TLR8, 5‟-upstream region was compared with that of cattle it showed
the maximum variability in the region start codon to 808 nucleotides upstream.
Transcription factor binding sites analysis in goat TLR8 revealed presence of total 70
potential sites, located at different recognition sequences. Whereas, in cattle a total of 76
putative binding sites were found (Fig. 4.21). Important factors like PU-1, which is an
68
essential binding factor that regulates both cytokine-dependent proliferation and
differentiation of granulocyte/macrophage progenitors was found to be present in 5‟UTR
sequence of goat TLR8 as compared to cattle where it was found to be absent. Another
important factor C/EBP, which has been classified in six different classes and is said to be
involved in different cellular responses, such as control of cellular proliferation, growth
and differentiation, metabolism, and in immunity was found to present in both goat and
cattle in different forms in TLR8 sequence. Another major factor GATA-1, which is
important in erythroid development, was found to be present in goat and cattle both.
Binding factor ETS, implicated in the development of different tissues as well as cancer
progression was found to be present in goat but not in cattle. Activator Protein-1 (AP-1)
was found to be present in both goat and cattle TLR8 sequence.
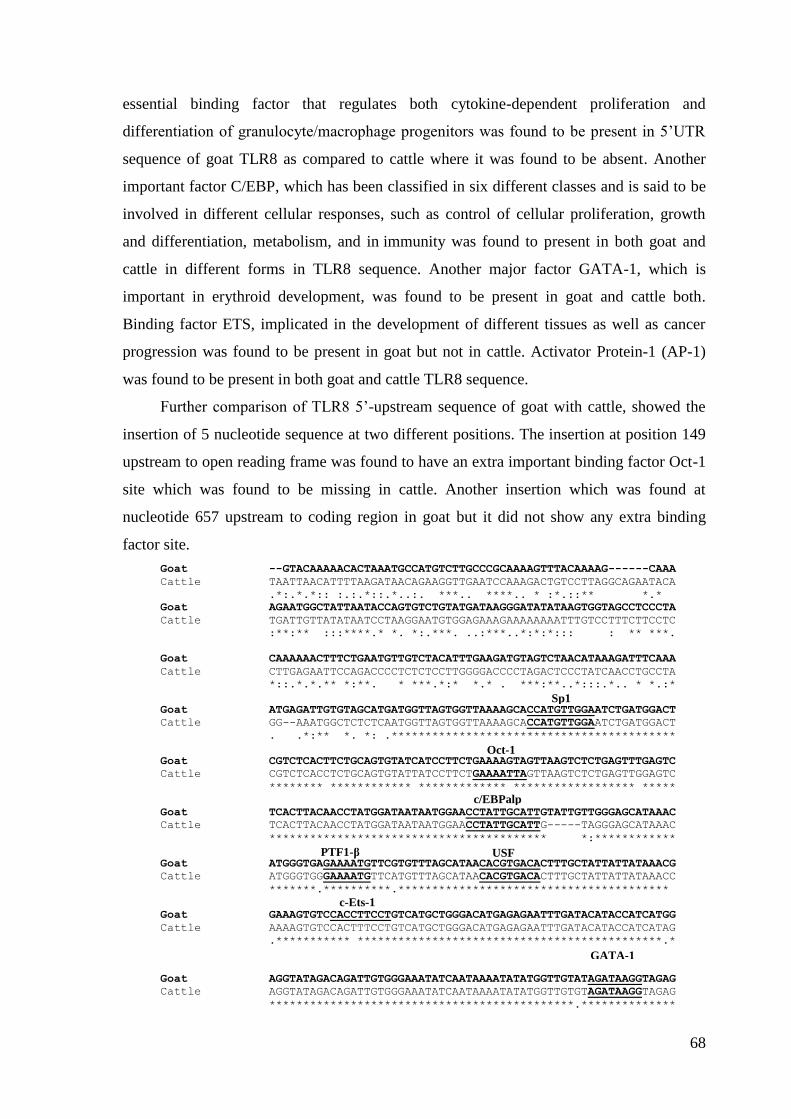
Further comparison of TLR8 5‟-upstream sequence of goat with cattle, showed the
insertion of 5 nucleotide sequence at two different positions. The insertion at position 149
upstream to open reading frame was found to have an extra important binding factor Oct-1
site which was found to be missing in cattle. Another insertion which was found at
nucleotide 657 upstream to coding region in goat but it did not show any extra binding
factor site.
Goat --GTACAAAAACACTAAATGCCATGTCTTGCCCGCAAAAGTTTACAAAAG------CAAA
Cattle TAATTAACATTTTAAGATAACAGAAGGTTGAATCCAAAGACTGTCCTTAGGCAGAATACA
.*:.*.*:: :.:.*::.*..:. ***.. ****.. * :*.::** *.*
Goat AGAATGGCTATTAATACCAGTGTCTGTATGATAAGGGATATATAAGTGGTAGCCTCCCTA
Cattle TGATTGTTATATAATCCTAAGGAATGTGGAGAAAGAAAAAAAATTTGTCCTTTCTTCCTC
:**:** :::****.* *. *:.***. ..:***..*:*:*::: : ** ***.
Goat CAAAAAACTTTCTGAATGTTGTCTACATTTGAAGATGTAGTCTAACATAAAGATTTCAAA
Cattle CTTGAGAATTCCAGACCCCTCTCTCCTTGGGGACCCCTAGACTCCCTATCAACCTGCCTA
*::.*.*.** *:**. * ***.*:* *.* . ***:**..*:::.*.. * *.:*
Goat ATGAGATTGTGTAGCATGATGGTTAGTGGTTAAAAGCACCATGTTGGAATCTGATGGACT
Cattle GG--AAATGGCTCTCTCAATGGTTAGTGGTTAAAAGCACCATGTTGGAATCTGATGGACT
. .*:** *. *: .******************************************
Goat CGTCTCACTTCTGCAGTGTATCATCCTTCTGAAAAGTAGTTAAGTCTCTGAGTTTGAGTC
Cattle CGTCTCACCTCTGCAGTGTATTATCCTTCTGAAAATTAGTTAAGTCTCTGAGTTGGAGTC
******** ************ ************* ****************** *****
Goat TCACTTACAACCTATGGATAATAATGGAACCTATTGCATTGTATTGTTGGGAGCATAAAC
Cattle TCACTTACAACCTATGGATAATAATGGAACCTATTGCATTG-----TAGGGAGCATAAAC
***************************************** *:************
Goat ATGGGTGAGAAAATGTTCGTGTTTAGCATAACACGTGACACTTTGCTATTATTATAAACG
Cattle ATGGGTGGGAAAATGTTCATGTTTAGCATAACACGTGACACTTTGCTATTATTATAAACC
*******.**********.****************************************
Goat GAAAGTGTCCACCTTCCTGTCATGCTGGGACATGAGAGAATTTGATACATACCATCATGG
Cattle AAAAGTGTCCACTTTCCTGTCATGCTGGGACATGAGAGAATTTGATACATACCATCATAG
.*********** *********************************************.*
Goat AGGTATAGACAGATTGTGGGAAATATCAATAAAATATATGGTTGTATAGATAAGGTAGAG
Cattle AGGTATAGACAGATTGTGGGAAATATCAATAAAATATATGGTTGTGTAGATAAGGTAGAG
*********************************************.**************
c-Ets-1
GATA-1
c/EBPalp
Oct-1
PTF1-β USF
Sp1

69
Goat AGACTCTAGCTTGGAAATCTTGAAGGATGGCCTAGTAGAAGCTGGATCTGGACTCTCCTT
Cattle AGACTCTGGCTTGGAAATCTTGAAGGATGGCCTAGTAGAAGCTGGATCTGGACTCTCCTT
*******.****************************************************
Goat GGGGCTGGCCAGAGTTTCCTTGAGTTATGCTAATAGATTGAAGCAAAAGACATATACCTT
Cattle GGGGCTGGCCAGCGTTTCCTTGAGTTATGCTAATAGACTGAAGCAACAGACATATACCTT
************.************************ ********.*************
Goat GCTCTGCTATAGGTCTGGCATGAACCATAGCCAGGATCCAATATCAGGCCCCCTGTGATG
Cattle GCTCTGCTATAGGTCTGGCATGAACCATAGCCAGGATCCAACATCAGGCCCCCTGTGATG
***************************************** ******************
Goat GTGGGGCATCTTGATGTGTGCTTCTGCCAAAGCTTTTCAGGTTTTCTTGTCATCACATCT
Cattle GTGGGGCATCTTGCTGTGTGCTTCTGCCAAAGCTTTCCATGTTTTCTTGTCATCACATCT
*************.********************** ** ********************
Goat CAGATAGCTTCATCTTTTGCTTCTTTGAACATCAGGAAGCTGAACAGGGT-GAAAACTAA
Cattle CAGATAACTTCATCTTTTGCTTCTTTGAACATCAAGAAACTGAACAGGGTGAAAAACTAA
******.***************************.***.*********** .********
Goat AACCATTCTGAACTTAACTTACTGCACTTTCTTTAACTGTTCAGAGAACTCCTACTTCAG
Cattle AACCATTCTG-----AACTTACTGCAATTTCTTTAACCGTTCAGAGAACTCCTACTTCAG
********** ***********.********** **********************
Goat AACTCATTCAAAGTATGATCAAAGCACTGTGAATTTCATCCTGAAATGCCTAGAAAATAT
Cattle AACTCATTCAAAGTATGGTCAAAGCACTGCGAATTTCATCCTGAAATGCCTAGAAAATAC
*****************.*********** *****************************
Goat TGCCAGTCTAACATTGTGACTCCACTTTGATTTTCCTTAGGAAAACATGACCCTTCACTT
Cattle TGCCAGTCTAACATTGTGACTCTACTTTGATTTTCCTTAGGAAAACATGACCCTTCACTT
********************** *************************************
Fig. 4.21. Alignment of 5’-upstream sequence of goat TLR8 showing variable putative
transcription factor binding sites as compared to cattle.
4.10. Comparative structure analysis of goat TLR genes
Total length of three TLR genes varied from each other with bacterial LPS binding
TLR4 being 841 amino acids, whereas viral ligand recognizing TLR7 was 205 amino acids
longer than TLR4 and 13 amino acid longer than TLR8 respectively. Another viral ligand
recognizing gene TLR8 was 192 amino acids longer than TLR4 and was found to be of
1033 amino acids. The variation in length was mainly in the ligand binding LRR
ectodomain region. The length of transmembrane, intracellular and TIR domains was
almost similar in these genes (Table 4.5).
Table 4. 5. Comparison of domain structure lengths of goat TLR4 and TLR8 genes.
Gene Amino
acids length
Extracellular
domain
Trans-
membrane
Intracellular
domain
TIR
domain
TLR4 841 1-634 635-657 658-841 674-819
TLR7 1046 1-853 - 854-1046 887-1033
TLR8 1033 1-817 818-840 841-1033 871-1017
PU.1
AP-1
Oct-1
TBP
NF-1
YY1
ISGF-3
Sp1
Sp-1
GCN
c/EBP beta
ORF

70
To compare goat TLR4, TLR7 and TLR8 gene sequences generated in this study,
they were analyzed for phylogeny by comparing with other seven reported goat TLR gene
sequences, following NJ algorithm with 1000 bootstrap re-sampling. Viral TLRs 7, 8 and 9
were clustered together under a single clade while the other major gene sub-family
including TLRs 1, 2, 6 and 10 clustered together (Fig. 4.22). TLRs 3, 4 and 5 of goat were
found to be clustering as singletons. Within the TLR1 gene family, TLRs 1 and 6 were
found to be closer with 100% bootstrap value. Interestingly, TLRs 1, 2, 6 and 10 of goat
clustered separately within the same clade indicating, the higher sequence similarity
between them rather than their respective TLRs of goat. Similarly, within TLR7 gene sub-
family (TLRs 7, 8 and 9), members were found to be closely related.
In order to know the unambiguous relationship of goat among different ruminant
species and to avoid the confounding effect of distantly related species, multi-dimensional
scaling (MDS) analysis was performed. MDS analysis reduces the dimension of data and
allows visualization of relationship among subjects in a two or three dimensional
geometric space. In the present study, pair-wise amino acid differences were calculated
among the four ruminant species viz. goat, sheep, cattle, buffalo which were utilized to
draw the 2D MDS plot. Buffalo and goat were found to be closely related only with
respect to TLR4, while TLR8 was found in separate dimension. TLR8 of buffalo and
sheep whereas were in the same dimensions (4.23).In TLR7 also the buffalo and goat were
in different dimensions as same as for the other viral TLR i.e. TLR8 while cattle and
buffalo shared the same dimension.

71
Fig. 4.22. Phylogenetic analysis of different goat TLRs following NJ algorithm, to
delineate the grouping of TLR4, TLR7 and TLR8 compared to other
reported TLR genes.
Fig. 4.23. Multidimensional scaling plot of pair-wise differences among TLR4, TLR7
and TLR8 of different ruminant species compared to goat.
Goat TLR6
Goat TLR1
Goat TLR10
Goat TLR2
Goat TLR5
Goat TLR4
Goat TLR3
Goat TLR9
Goat TLR 8
Goat TLR7
0.1

72
Polymorphism analysis of goat TLR genes
4.11. DNA isolation
Genomic DNA was isolated from the blood samples collected from the different
breeds of goat. The quality of genomic DNA was checked after running the samples in
0.6% submerged agarose gel. Good quality of DNA was ascertained with concentration of
DNA, sufficient for further experiments (Fig. 4.24 a). Quantity and quality of DNA was
also estimated spectrophotometrically using Nanodrop (ND-1000), which again showed
good quality DNA free from proteins and RNA with ratio of OD260/OD280 around 1.8 for
all the samples. The working concentration of genomic DNA was prepared by diluting
stock to approximately 80 ng/µl, which was further checked on 0.6% agarose gel (Fig.
4.24 b).
Fig. 4.24a. Gel picture showing goat grand stock genomic DNA runned in 0.6%
agarose gel.
Fig. 4.24b. Gel picture showing working concentration of goat genomic DNA in 0.6%
agarose gel.
For the screening of polymorphism in caprine TLR4, TLR7 and TLR8 genes, a
panel of 24 DNA samples representing 12 different goat breeds was prepared. The primers
were used to amplify the complete coding and parts of noncoding regions as well as 5‟-
upstream sequences. Presence of synonymous/non-synonymous SNPs in different domains
of the TLRs was revealed by SMART analysis. After developing the genotyping protocols
for selected SNPs, they were screened in large goat populations and allelic and genotypic
frequencies were determined.
4.12. Identification of SNPs in goat TLR4 gene
For the screening of polymorphism in goat TLR4 gene, a total of nine primer sets
were designed covering entire coding region from exon1 to exon3. Fragments were
amplified from genomic DNA (Fig. 4.25) and sequenced. Assembled sequence of goat
TLR4 was 3755 nucleotides in length and submitted to NCBI (GenBank accession number
JN786600). For gene structure analysis genomic sequence was aligned with previously

73
published goat TLR4 mRNA sequence (Accession no. JF825527) and found to be having a
total of three exons as reported in other livestock species. Goat TLR4 exon1 consisted of
both partial 5‟UTR and CDS of 93 nucleotides, exon2 with full coding region consisted of
167 nucleotides and maximum coding region was present in exon3, which spread across
2266 nucleotides with CDS and partial 3‟UTR. Genomic organization of goat TLR4 with
their exon and intron boundaries is shown in Fig 4.26. Comparative sequence analysis of
goat TLR4 in 12 breeds revealed 27 polymorphic sites, including two in 5‟UTR, two in
exon1, one in intron1, one in exon2, maximum 20 in exon3 and one in 3‟UTR (Table 4.6).
Upon further analysis it was observed that out of these 27 SNPs, 25 were found to be
transitional changes and the rests two were transversions. The allele frequency of each
SNP in total 24 animals was also calculated and shown in Table 4.6.
Fig. 4.25. PCR amplification of goat TLR4 gene in overlapping fragments. Products
are shown with 100 bp marker in agarose gel.
Fig. 4.26. TLR4 gene structure in goat, designed from genomic DNA sequencing.

74
Table 4.6. Polymorphic nucleotide sites detected in goat TLR4 gene by comparative
sequence analysis of 12 goat breeds with their allele frequencies.
* Position of SNP w.r.t. Goat submitted sequence Acc. No. JN786600
Nucleotide Amino acid Transversion/ transition Region Domain Allele frequencies
31 G >A Transition 5‟UTR G 0.16
A 0.84
134 C>T Transition C 0.75
T 0.25
364 T>C Transition EXON-1
T 0.75
C 0.25
370 C>A Transversion
C 0.84
A 0.16
449T>C Transition INTRON-1
T 0.84
C 0.16
772G>A 54Val>Ile Transition EXON-2
G 0.87
A 0.13
2049C>T 368Thr>Ile Transition EXON-3 LRR C 0.79
T 0.21
2112C>G 389Thr>Ser Transversion LRR
C 0.84
G 0.16
2189A>G 415Ser>Gly Transition LRR
A 0.77
G 0.23
2227 G>A Transition
G 0.70
A 0.30
2447 C>T Transition C 0.88
T 0.12
2602 T>C Transition
T 0.23
C 0.77
2616C>T 557Thr>Met Transition
LRR
C 0.75
T 0.25
2640A>G 565Arg>Gln Transition LRR
A 0.86
G 0.14
2655G>A 570Asn>Ser Transition LRR G 0.77
A 0.33
2668A>G Transition A 0.86
G 0.14
2834 A>C 630Met>Leu Transition LRR A 0.75
C 0.25
2862 T>C Transition T 0.65
C 0.35
2876C>T Transition C 0.18
T 0.82
2900 A>G Transition G 0.29
A 0.80
2913 G>A Transition G 0.73
A 0.27
2926A>G Transition A 0.66
G 0.34
2941C>T Transition C 0.91
T 0.09
3090A>C Transition A 0.60
C 0.40
3301A>G Transition A 0.95
G 0.05
3411G>A 822Arg>Gln Transition TIR G 0.80
A 0.20
3493 G>A Transition 3‟UTR G 0.66
A 0.34

75
Effect of amino acid changes in TLR4 on structure and function-PolyPhen analysis
In goat TLR4 a total of 27
polymorphic sites were observed, out
of which 9 changes were found to be
non-synonymous. Thinking that these 9
non-synonymous changes might have
an impact on the functionality and
structure of the coded protein, all the 9
non-synonymous amino acid changes
were subjected to online tool
PolyPhen2. It revealed all the changes
to be benign without any possible
damaging effect, with the sensitivity
score near 1 and specificity between 0.5
to 1(Fig. 4.27).
Effect of amino acid changes- predicted structure
Nine non-synonymous SNPs found in goat TLR4 were also analysed for their
effect on structure predicted by Modeller software. Out of these nine amino acid changes,
two were non-polar to non-polar, two polar to polar, three polar to non-polar and two
positively charge to polar. Tertiary structure of goat TLR4 was predicted using homology
model (crystal structure of the human TLR4-human MD-2-E.coli LPS Ra complex, PDB-
3FXI) to predict the effect of these amino acid changes on the structure. There were two
polar to non-polar variations Thr368IIe and Ser415Gly, showing structural changes in
ectodomain region (LRR) of goat TLR4. Other two variations, which were positively
charged amino acid to polar Arg565Gln in LRR domain and Arg822Gln in TIR domain
also showed effect on protein‟s secondary structure. Structure was also predicted including
all the nine amino acid changes possible, to see the effects on structure compared to
overall native structure of the goat TLR4 (Fig. 4.28).
Fig. 4.27. Non-synonymous SNPs with their sensitivity
and specificity score (Polyphen2) of goat
TLR4 gene.

76
Fig. 4.28. Effect of various non-synonymous amino acid changes found in goat TLR4
on its structure as predicted by Modeller and PyMol software.
At position Thr 368 Ile
( (
T368I
TIR
TM
At position Val 54 Ile
( (
V54I
TIR
TM
At position Thr 389 Ser
( (
T389S
TIR
TM
At position Ser 415 Gly
( (
TIR
TM
S 415 G
T 557 M
TIR
TM
At position Thr 557 Met
( (
At position Arg 565 Gln
( (
R565Q
TIR
TM
At position Asn 570 Ser
( (
N 570 S TIR
TM
At position Met 630 Leu
M 630 L TIR
TM
At position Arg 830 Gln
( (
R 830 Q TIR
TM
Native structure of Goat TLR4
( (
TIR
TM
Effect of all non-synonymous
TIR
TM

77
Genotyping of goat TLR4 SNPs by PCR-RFLP
ApeKI restriction enzyme based PCR-RFLP technique was developed for
genotyping of the polymorphic nucleotide site 2112 C>G, within the coding region of the
caprine TLR4 lied in the LRR domain. PCR-RFLP helped in the determination of
frequency distribution for two alleles (C, G) and three genotypes (C/C, G/G, C/G) in 165
goat samples representing 5 breeds. The DNA restriction fragments corresponding to C/C,
G/G, C/G genotypes were: 463 bp; 396 bp, 67 bp and 463 bp, 396 bp and 67 bp
respectively (Fig. 4.29). The genotypic and allelic frequencies of ApeKI variants are listed
in Table 4.7. Different goat breeds analysed, demonstrated the variation in proportion of
genotype frequencies. Out of these 5 breeds screened, Barbari and Jamunapari were found
to have the zero genotype frequency for GG genotype, whereas Kanniadu, Black Bengal
and Sirohi were found to have mixed frequencies of all the three genotypes.
(a) (b)
(c)
Fig.4.29. (a) Chromatogram showing variation in nucleotide at position 2112 C>G,
(b) Designing of PCR-RFLP using NEB cutter programme, (c) EtBr stained
2% Agarose gel showing all the three genotypes C/C, G/G, C/G, in goat
TLR4 gene across different breeds, using ApeKI restriction enzyme.
C/G C/C G/G C/C C/G

78
Table 4.7. Genotype and allelic frequencies of goat TLR4 SNP 2112 C>G, across
different breeds.
4.13. Identification of SNPs in goat TLR7 gene
For the screening of polymorphism in goat TLR7 gene, a total of seven primer sets
were designed covering the entire coding region. Fragments were amplified from genomic
DNA (Fig.4.30.) and sequenced. By sequence analysis of 24 animals, total 22 SNPs were
identified in the transcribed region of the goat TLR7 gene, which resulted into nine
haplotypes which has been named as Hap1-Hap9 with the highest frequency of Hap-1 of
0.542 and the lowest one being 0.021 which was shared by four different haplotypes Hap
6-Hap9 (Fig. 4.31). Since numbers of animals taken per breed were just two, breed-wise
haplotype frequencies could not be calculated. Two transversional and 20 transitional
changes were observed and seven out of 19 SNPs in the coding region, were found to be
non-synonymous type, from which, some of the SNPs were present in the functional
domains of goat TLR7 gene (Table 4.8).
Fig. 4.30. Goat TLR7 amplified into 7 different PCR framents for SNP detection.
Breed Total no of
Samples
No. of genotype Genotype frequency Allele frequency
GG G/C CC GG G/C CC G C
Kanniadu 40 16 14 10 0.40 0.35 0.25 0.58 0.43
B. Bengal 40 4 16 20 0.10 0.40 0.50 0.30 0.70
Sirohi 29 2 16 11 0.07 0.55 0.38 0.34 0.66
Barbari 28 0 11 17 0.00 0.39 0.61 0.20 0.80
Jamunapari 28 0 16 12 0.00 0.57 0.43 0.29 0.71
Total 165 22 73 70 0.13 0.44 0.42 0.35 0.65

79
Table 4.8. Polymorphism in goat TLR7 gene with their positions and domains.
*Positions as per Accession No. GU289401
Nucleotide Amino acid
Transition/Transversion Domain Allele frequencies
19 C>T Transition C 0.93
T 0.07
123 T>C Transition LRRNT T 0.97
C 0.03
130 G>A 44 Ala>Thr Transition LRRNT G 0.97
A 0.03
279C>T Transition C 0.97
T 0.03
377 C>T 127 Thr>Met Transition LRR C 0.89
T 0.11
813 C>G Transversion Pfam LRR_1 C 0.97
G 0.03
845T>C 282 Leu>Pro Transition T 0.97
C 0.03
885 C>T Transition LRR_TYP C 0.97
T 0.03
1137 C>T Transition C 0.97
T 0.03
1177 T>C 393 Cys>Arg Transition LRR T 0.97
C 0.03
1340 T>G 448 Met>Arg Transversion T 0.97
G 0.03
1722 T>C Transition T 0.97
C 0.03
1938 C>T Transition LRR_Typ C 0.97
T 0.03
2082 A>G Transition A 0.77
G 0.30
2310 C>T Transition C 0.97
T 0.03
2325 A>G Transition A 0.97
G 0.03
2548 A>G 850 Ile>Val Transition Low Complexity
Region
A 0.97
G 0.03
2731 C>T Transition TIR Domain C 0.97
T 0.03
2802 T>C 935Leu>Ser Transition TIR Domain T 0.97
C 0.03
3276 C>T Transition C 0.93
T 0.07
3349 A>G Transition A 0.97
G 0.03
3371 G>A Transition G 0.97
A 0.03

80
Fig.4.32. Non-synonymous SNPs with their
sensitivity and specificity score in
goat TLR7 (Polyphen2)
Fig. 4.31. Haplotypes observed and their frequencies in goat TLR7 gene.
Effect of amino acid changes on structure and function-PolyPhen analysis
In goat TLR7 a total of 22 polymorphic sites were
observed, out of which 7 changes were found to be
non-synonymous. To see the effect of these 7 non-
synonymous changes on the structure and function of
the coded protein, all the 7 non-synonymous amino
acid changes were subjected to online tool
PolyPhen2. It revealed two of the changes at
positions 127 Thr/Met and 935Leu/Ser to be possible
damaging ones with the sensitivity score near to 0.9
and specificity was also 0.9, and rest five changes
being benign without any possible damaging effect,
with the sensitivity score near 1 and specificity
between 0.5 to 1 (Fig. 4.32). These damaging amino
acids changes also showed their effects on the structure
of the protein as predicted by Modeller and PyMol software (Fig. 4.33). One of the
damaging amino acid changes 935Leu/Ser was found to be in the TIR domain and another
127Thr/Met was in one of the LRR domains. Another amino acid change which did not
showed any damaging effect on protein structure by PolyPhen but predicted model showed
breakage of structure was 393Cys/Arg.
Hap1
Hap2
Hap3
Hap4
Hap5
Hap6
Hap7
Hap8
Hap9
Haplotype
frequency

81
Fig. 4.33. Effects of non-synonymous amino acid changes due to polymorphism in
goat TLR7, on its structure as predicted by Modeller and PyMol software.
44 Ala>Thr
44 A>T
TM
127 Thr>Met
127 T>M
TIR
282 Leu>Pro
282 L>P
TIR
850 IIe>Val
850 I>V TIR
935 Leu>Ser
935 L>S
TM
393 Cys>Arg
393 C>R
TIR
448 Met>Arg
448 M>R
TIR

82
4.14. Polymorphism in goat TLR8 gene
For the detection of SNPs in the goat TLR8 gene, DNA sample of twelve animals
representing twelve breeds were amplified in eight overlapping fragments, covering 3488
nucleotides long region encompassing single exon, adjoining upstream and downstream
sequences (Fig. 4.34 a and b). Assembled sequence was submitted to GenBank (Accession
number JF825528). Goat TLR8 gene sequence comparison revealed presence of only four
SNPs and all were found to be synonymous (Table 4.9). They were found to be present in
different functional domains of the gene. Two out of these four SNPs were found to be
within LRR domains and one each was in transmembrane and TIR domain. Further
analysis showed all the changes to be transitional in nature.
Fig. 4.34.a. Goat TLR8 amplified into 8 different PCR framents for SNP detection.
Fig. 4.34.b. Genomic organization of goat TLR8.
Table 4.9. Polymorphism in goat TLR8 gene with their position and domain.
*Position as per accession JF825528.
SNP Amino acid Transition/
Transversion
Domain Genotyping
protocol
Allele
frequencies
2388A>G Thr747Thr Transition LRR HpyCH4V A 0.80
G 0.20
2463T>C Phe772 Phe Transition LRRCT T 0.84
C 0.16
2607A>G Ala820 Ala Transition Transmembrane HpyCH4IV A 0.71
G 0.79
3038T>C Met964 Met Transition TIR T 0.59
C 0.41
G/G
A/G
83
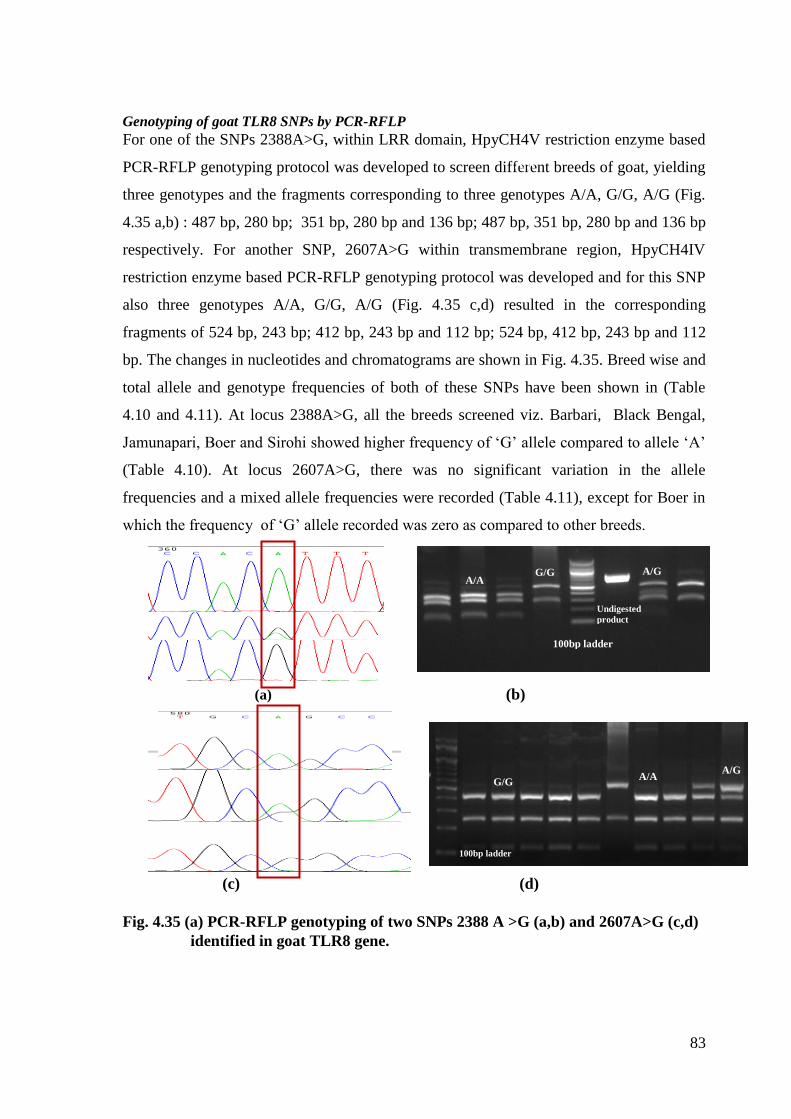
Genotyping of goat TLR8 SNPs by PCR-RFLP
For one of the SNPs 2388A>G, within LRR domain, HpyCH4V restriction enzyme based
PCR-RFLP genotyping protocol was developed to screen different breeds of goat, yielding
three genotypes and the fragments corresponding to three genotypes A/A, G/G, A/G (Fig.
4.35 a,b) : 487 bp, 280 bp; 351 bp, 280 bp and 136 bp; 487 bp, 351 bp, 280 bp and 136 bp
respectively. For another SNP, 2607A>G within transmembrane region, HpyCH4IV
restriction enzyme based PCR-RFLP genotyping protocol was developed and for this SNP
also three genotypes A/A, G/G, A/G (Fig. 4.35 c,d) resulted in the corresponding
fragments of 524 bp, 243 bp; 412 bp, 243 bp and 112 bp; 524 bp, 412 bp, 243 bp and 112
bp. The changes in nucleotides and chromatograms are shown in Fig. 4.35. Breed wise and
total allele and genotype frequencies of both of these SNPs have been shown in (Table
4.10 and 4.11). At locus 2388A>G, all the breeds screened viz. Barbari, Black Bengal,
Jamunapari, Boer and Sirohi showed higher frequency of „G‟ allele compared to allele „A‟
(Table 4.10). At locus 2607A>G, there was no significant variation in the allele
frequencies and a mixed allele frequencies were recorded (Table 4.11), except for Boer in
which the frequency of „G‟ allele recorded was zero as compared to other breeds.
(a) (b)
(c) (d)
Fig. 4.35 (a) PCR-RFLP genotyping of two SNPs 2388 A >G (a,b) and 2607A>G (c,d)
identified in goat TLR8 gene.
A/A
100bp ladder
Undigested
product
A/A G/G A/G
100bp ladder
G/G A/A
A/G
100bp ladder

84
Table 4.10. Genotype and allelic frequencies of goat TLR8 gene SNP 2388 A>G,
across different breeds.
Table 4.11. Genotype and allelic frequencies of goat TLR8 gene SNP 2607A>G,
across different breeds.
Haplotype analysis of goat TLR4 and TLR8
When the haplotype count among the goat TLR4 and TLR8 gene was carried out on the
basis of genotyping data recorded for all the breeds screened, a total of 42 animals were
found to be common in all the three SNPs genotyped and sharing a total of 9 haplotypes
with in them (Table 4.12). A major haplotype found was “AGC” with 20 animals sharing
this haplotype among them with a frequency of 0.476. Another major haplotype found was
“AGS” with 11 animals sharing this haplotype with a frequency of 0.262. Four minor
haplotypes “GAS, GGC, RRC, AGG” were found with a frequency of 0.238 shared by
four different animals. The haplotype “GAC” was shared by 2 animals with a frequency of
0.0476 and other haplotype which was shared by 3 animals was “RGC”. Using principal
Co-ordinate analysis based on haplotype frequencies, three different goat breeds Barbari,
Jamunapari and Black Bengal could be easily classified into distinct breed clusters (Fig.
4.36).
Breed Total no. of
Samples
No. of Genotype Genotype Frequency Allele Frequency
AA AG GG AA AG GG A G
Barbari 31 22 4 5 0.71 0.13 0.16 0.77 0.23
Black Bengal 30 28 2 0 0.93 0.07 0.00 0.97 0.03
JamunaPari 11 8 3 0 0.73 0.27 0.00 0.86 0.14
Boer 8 8 0 0 1.00 0.00 0.00 1.00 0.00
Total 80 66 9 5 0.83 0.11 0.06 0.88 0.12
Breed Total no. of
Samples
No. of Genotype Genotype Frequency Allele Frequency
GG AG AA GG AG AA G A
Barbari 28 23 1 4 0.82 0.04 0.14 0.84 0.16
Black Bengal 30 30 0 1.00 0.00 0.00 1.00 0.00
Jamunapari 15 15 0 0 1.00 0.00 0.00 1.00 0.00
Boer 7 6 1 0 0.86 0.14 0.00 0.93 0.07
Sirohi 15 13 1 1 0.87 0.07 0.07 0.90 0.10
Total 95 87 3 5 0.92 0.03 0.05 0.93 0.07

85
Table 4.12. Haplotypes and frequency distribution of goat TLR4 and TLR8 SNPs
among different breeds.
Fig. 4.36. Haplotype distribution based classification of three breeds of goats. JAM-
Jamunapari, BB- Black Bengal, BAR- Barbari by principal co-ordinate
analysis.
4.15. Tissue distribution of goat TLR genes
Quantitative real-time PCR was used to examine the TLRs expression in various
goat tissues. Relative expression was analyzed by calculating normalized Ct (threshold
cycle) values of all the three TLR genes against the housekeeping gene RPS15. Expression
of all the three TLRs was observed in all the tissues included in the present study viz.:
liver, lungs, kidney, skin, ovary, spleen, lymph node, heart, mammary gland, intestine,
skeletal muscle. Higher the ∆Ct value, lower will be the expression as it represents the
difference between mean Ct values of housekeeping and the reference gene. To ensure the
specific product without any non-specific amplification, dissociation curve analysis was
carried out for each gene which showed a single peak (Fig. 4.37) and efficiency of real-
time-PCR was also confirmed by running housekeeping gene with ten folds diluted cDNA,
Haplotype No. of haplotype Frequency of haplotype
AGS 11 0.262
AGC 20 0.476
GAS 1 0.0238
GGC 1 0.0238
GAC 2 0.0476
RGC 3 0.0714
RRC 1 0.0238
AGG 1 0.0238
RGS 2 0.0476
Total 42 1.000
B
B

86
resulting in single line curve having a slope of 3.5 and efficiency of 1.9 (Fig. 4.38). The
house keeping gene RPS15 showed stable expression across all the tissues with very small
variation (Table 4.14).
The highest expression of both TLR4 and TLR8 genes of goat was found in kidney
followed by spleen, lungs, lymph node, mammary gland and the lowest expression was
seen in intestine, heart and skin (Table 4.14). Intestine showed lowest expression of both
the genes. The highest expression of TLR7 gene was found in liver followed by kidney,
spleen, lungs and ovary and the lowest expression was seen in skeletal muscle, Intestine,
skin, heart.
Table 4.14. Real-time PCR based expression profiling, showing ∆Ct values of TLR4,
TLR7 and TLR8 genes.
Tissues RPS15
(Ct)
TLR4
(Ct)
TLR7
(Ct)
TLR8
(Ct)
∆Ct
TLR4
∆Ct
TLR7
∆Ct
TLR8
Liver 27.13 25.76
21.66
26.48 -1.37
-5.47
-0.64
Lungs 27.08 22.37
25.49
24.52 -4.71
-1.59
-2.56
Kidney 27.22 21.30
24.065
23.64 -5.91
-3.155
-3.57
Skin 27.01 29.61
30.17
27.87 2.59
3.155
0.85
Ovary 27.58 25.77
26.165
26.86 -1.81
-1.42
-0.72
Spleen 27.32 22.23
24.685
24.19 -5.09
-2.635
-3.12
Lymph node 26.98 24.12
25.73
24.35 -2.85
-1.25
-2.63
Heart 27.285 31.54
35.17
27.87 4.25
7.885
0.58
Mammary
gland 26.98 24.65
26.02
26.98 -2.33
-0.965
-0.005
Intestine 27.27 34.26
28.85
31.84 6.99
1.58
4.57
Skeletal
muscle 27.33 25.31
28.59
28.52 -2.02
1.255
1.18
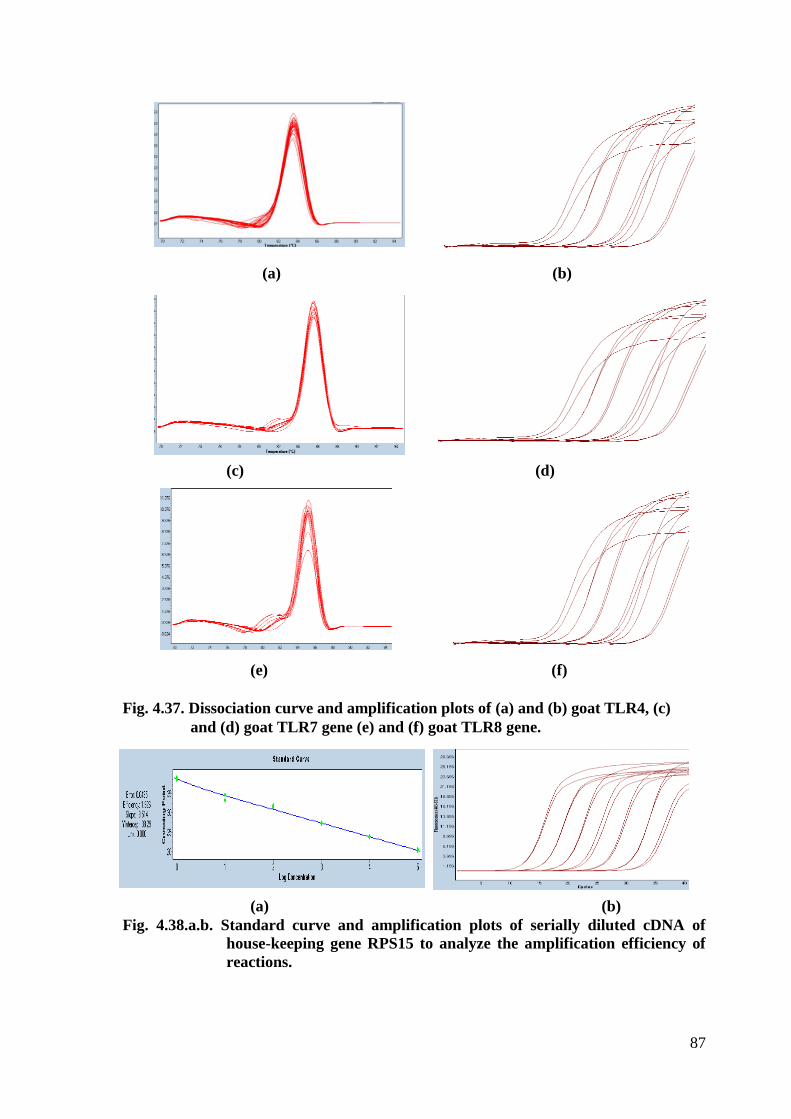
87
(a) (b)
(c) (d)
(e) (f)
Fig. 4.37. Dissociation curve and amplification plots of (a) and (b) goat TLR4, (c)
and (d) goat TLR7 gene (e) and (f) goat TLR8 gene.
(a) (b)
Fig. 4.38.a.b. Standard curve and amplification plots of serially diluted cDNA of
house-keeping gene RPS15 to analyze the amplification efficiency of
reactions.

88
Cloning and expression in prokaryotic expression vector
4.16. Amplification of TIR domain of goat TLR4 and TLR8 and preparation of
vector
The TIR domain sequence of both the genes was used for designing of primers and
further amplification was done by employing the primers having the restriction sites for
HindIII and BamHI restriction enzymes at both the ends to facilitate directional cloning.
The amplified TIR domain of both TLR4 and TLR8 goat genes were then purified and
quantified by running in 1.5% agarose gel. The prokaryotic vector (pQE30) was also
digested by using the same enzymes, whose sequences have been incorporated in primers.
After digestion vector was purified and was quantified by running in gel (Fig. 4.39). After
the quantification the restriction enzyme digested PCR products and the purified vector
were ligated and transformed in SG13009 strain of E. coli. This expression vectors doesn‟t
allow the color selection of clones, so the precaution was taken at the time of digestion.
(a) (b)
Fig. 4.39. Ethidium bromide stained 1.5% Agarose gel showing Digested (a) pQE30,
TLR4 (498bp) and (b) pQE30, TLR8 (485bp) DNA.
4.17. Confirmation of recombinant clones
Plasmid DNA isolated from four white colonies for each of TLR4 and TLR8 TIR
domain cloned and transformed E.coli cells, and were screened to confirm recombinant
plasmid having insert of both the genes by different methods described below.
10
0b
p la
dd
er
Undigested
pQE30
10
0b
p l
ad
der
Undigested
pQE30
Digested
pQE30
Digested
TIR domain
of TLR8
Digested
pQE30
Digested
TIR domain
of TLR4
10
0b
p l
ad
der
Undigested
pQE30

89
Plasmid isolation from transformed cells
Plasmid DNA was isolated from the recombinant clones by alkali lysis as well as
kit purification (Qiagen Midi prep), using manufacturer‟s instructions and was checked by
1% agarose gel electrophoresis. Good quality plasmid was obtained without any
contamination of genomic DNA or RNA.
PCR of recombinant plasmid
PCR was carried out directly from the isolated recombinant plasmid DNA using
TLR4 and TLR8 gene specific primers. PCR products were runned on agarose gel
electrophoresis showing the presence of TIR domains of TLR4 and TLR8, with the insert
of approximately 500 bp size for each gene as expected, when runned along with 100 bp
molecular size marker (Fig. 4.40).
(a) (b)
Fig. 4.40. Confirmation of positive clones having TIR domains of (a) TLR4 (498 bp)
(b) TLR8 (485 bp) by plasmid PCR.
Confirmation by restriction enzyme digestion
The presence of correct size insert in the recombinant plasmids was also confirmed
by restriction endonuclease digestion. After double digestion with HindIII and BamHI
restriction enzymes the products were checked on 2% agarose gel, which confirmed the
presence of recombinant clones (Fig. 4.41). Digestion with HindIII and BamHI restriction
enzymes resulted in the release of TLR4 fragment from the plasmid vector and yielded two
fragments of approximately 498 bp insert and 3.4 kb vector (Fig 4.41 a). Similarly,
digestion of TLR8 with the same enzymes resulted in the release of 2 fragments of 485 bp,
and 3.4 kb (Fig. 4.41 b).
100bp
ladder 100bp
ladder
485bp
Insert
498bp
insert
M
M

90
(a) (b)
Fig.4.41. Confirmation of positive clones by restriction enzyme digestion using
HindIII and BamHI enzyme: (a) TLR4, (b) TLR8.
4.18. Characterization of expressed proteins on SDS-PAGE
The positive clones thus confirmed were induced for expression of cloned TIR
domains by using different concentrations of IPTG and the culture was pelleted at different
time intervals, the pelleted culture was mixed with Laemmli‟s sample buffer and incubated
in boiling water for 15 min, before it was loaded on 16% SDS-PAGE gel. The expressed
protein bands of approximately 17.5 KDa size for TLR4 (Fig. 4.42) and 17 KDa for TLR8
were characterized and confirmed by running a molecular size marker along with it (Fig.
4.43).
Undigested
Plasmid
Digested Plasmid
1K
b l
ad
der
498bp
3.4Kb
Undigested
Plasmid
Digested plasmid
1K
b l
ad
der
3.4Kb
485bp

91
Fig. 4.42. SDS-PAGE analysis of expressed TIR domain of goat TLR4 after IPTG
induction of recombinant plasmid vector pQE and harvested at different
interval.
Fig. 4.43. SDS-PAGE analysis of expressed TIR domain of goat TLR8 after IPTG
induction of recombinant plasmid vector pQE harvested at different
intervals.
INDUCED UNINDUCED
INDUCED UNINDUCED
O/N 5hr 0hr M 0hr 5hr O/N pQE
17.5KDa
30KDa