sequence analysis -- lecture 15 signatures motifs footprints · sequence analysis -- lecture 15...
TRANSCRIPT

Sequence Analysis -- lecture 15
motifssignatures& footprints
2
How to find motifs, signatures, footprintsMEMEGibbs samplingK-means clusteringsupervised learning
Comparing methodsROC
What to do about low complexity regions: Repeats, Satellites and the role of Transposable Elements in creating them.
masking repeatsnull models for repeat alignmentword HMMs for repeats

Why are there Motifs?Selective pressure for:structure -- protein motifs folding units
fibrous proteins coiled coils transmembrane helicesfunction -- protein motifs
active sitebinding motifssignal sequences
expression -- DNA motifs transcription regulation chromatin binding

Zinc finger motif x x x x x x x x x x x x C H x \ / x x Zn x x / \ x C H x x x x x x x x x x
C-x(2,4)-C-x(3)-[LIVMFYWC]-x(8)-H-x(3,5)-H
two Cystines separated by 2 or 4 residues
Loop must be length 12. 4th position in loop must be hydrophobic
two Histidines separated by 3 or 5 residues
Example: selection for structure

ER targeting sequence[KRHQSA]-[DENQ]-E-L
N-glycosylationN-{P}-[ST]-{P}
Tyrosine phosphorylation[RK]-x(2)-[DE]-x(3)-Y or [RK]-x(3)-[DE]-x(2)-Y
C-{DENQ}-[LIVM]-x
C-terminal prenylation
Example: selection for function

What if you don’t know the pattern?
How do you find it?
6

Transcription factor binding siteExample: selection for expression
We know that upsteam of every gene that expresses in the presence of lysine, there must be a signal for a transcription factor (TF). But we don’t know which TF and we don’t know where it binds.

Transcription factor binding site
NOTE: It’s palindromic in this case. Palindromy in TF footprints (binding sites) is due to the symmetry of the TFs, which are almost invariably dimeric.
Example: selection for expression
This is what we want to find
a pattern, motif, signature, footprint.

Where is it, and ... what am I looking for??
How do we, simultaneously, find the motif and the locations of the motif in a set of sequences?
MEMEmotif elucidation by expectation/maximization
...or...
• T. L. Bailey & C. Elkan, "Fitting a mixture model by expectation maximization to
discover motifs in biopolymers", ISMB, 2:28--36, 1994
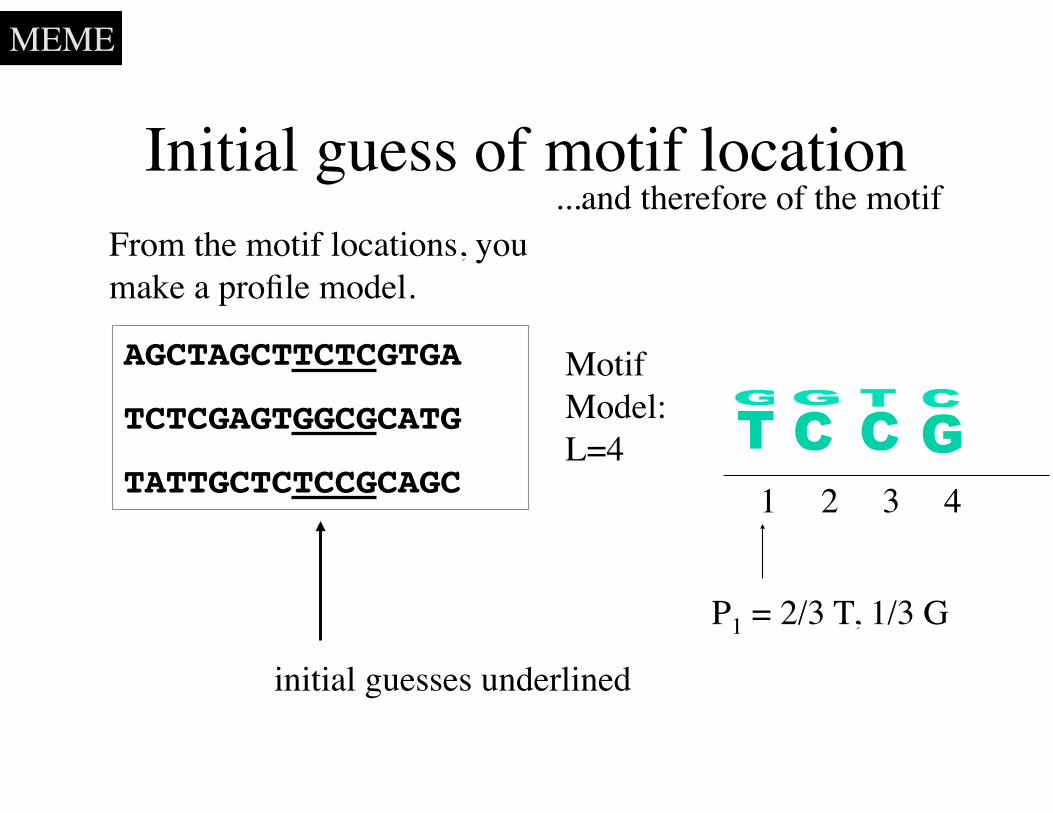
Initial guess of motif location
AGCTAGCTTCTCGTGA
TCTCGAGTGGCGCATG
TATTGCTCTCCGCAGC
From the motif locations, you make a profile model.
TMotif Model:L=4
1 2 3 4
C C G
initial guesses underlined
P1 = 2/3 T, 1/3 G
MEME
...and therefore of the motif

Calculate the probability score for each position
AGCTAGCTTCTCGTGA
From the profile model and the sequence, get probability scores.
1 2 3 4 5 6 7 8 9 10 11 12 13 14 15 16
P = P1(A)P2(G)P3(C)P4(T)=(0)(.33)(.67)(0.)=0.
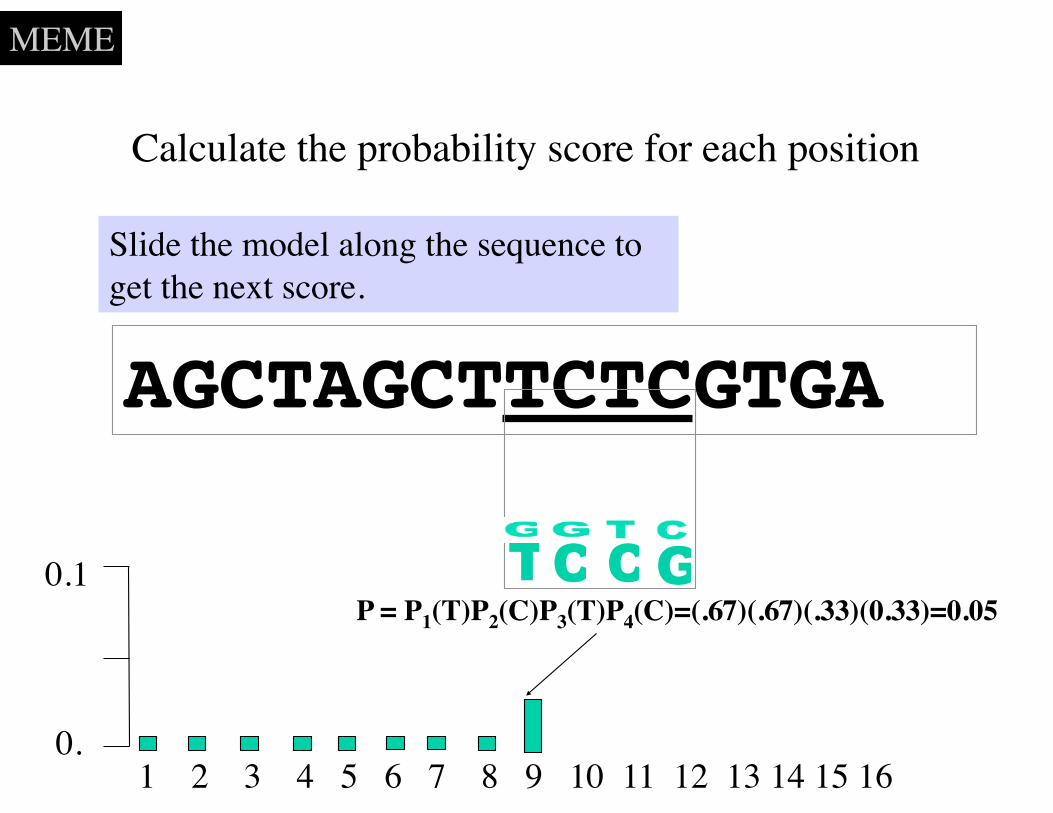
MEME
TC CG

Calculate the probability score for each position
AGCTAGCTTCTCGTGA
Slide the model along the sequence to get the next score.
1 2 3 4 5 6 7 8 9 10 11 12 13 14 15 16
P = P1(G)P2(C)P3(T)P4(A)=(.33)(.67)(.33)(0.)=0.
MEME
TC CG

Calculate the probability score for each position
AGCTAGCTTCTCGTGA
Slide the model along the sequence to get the next score.
1 2 3 4 5 6 7 8 9 10 11 12 13 14 15 16
P = P1(C)P2(T)P3(A)P4(G)=(.0)(.0)(.0)(0.67)=0.
MEME
TC CG
Calculate the probability score for each position
AGCTAGCTTCTCGTGA
Slide the model along the sequence to get the next score.
1 2 3 4 5 6 7 8 9 10 11 12 13 14 15 16
P = P1(T)P2(C)P3(T)P4(C)=(.67)(.67)(.33)(0.33)=0.05
0.
0.1
MEME
TC CG

Calculate the probability score for each position
AGCTAGCTTCTCGTGA
Slide the model along the sequence to get the next score.
1 2 3 4 5 6 7 8 9 10 11 12 13 14 15 16
P = P1(G)P2(T)P3(G)P4(A)=(.33)(.0)(.0)(0.0)=0.
MEME
TC CG

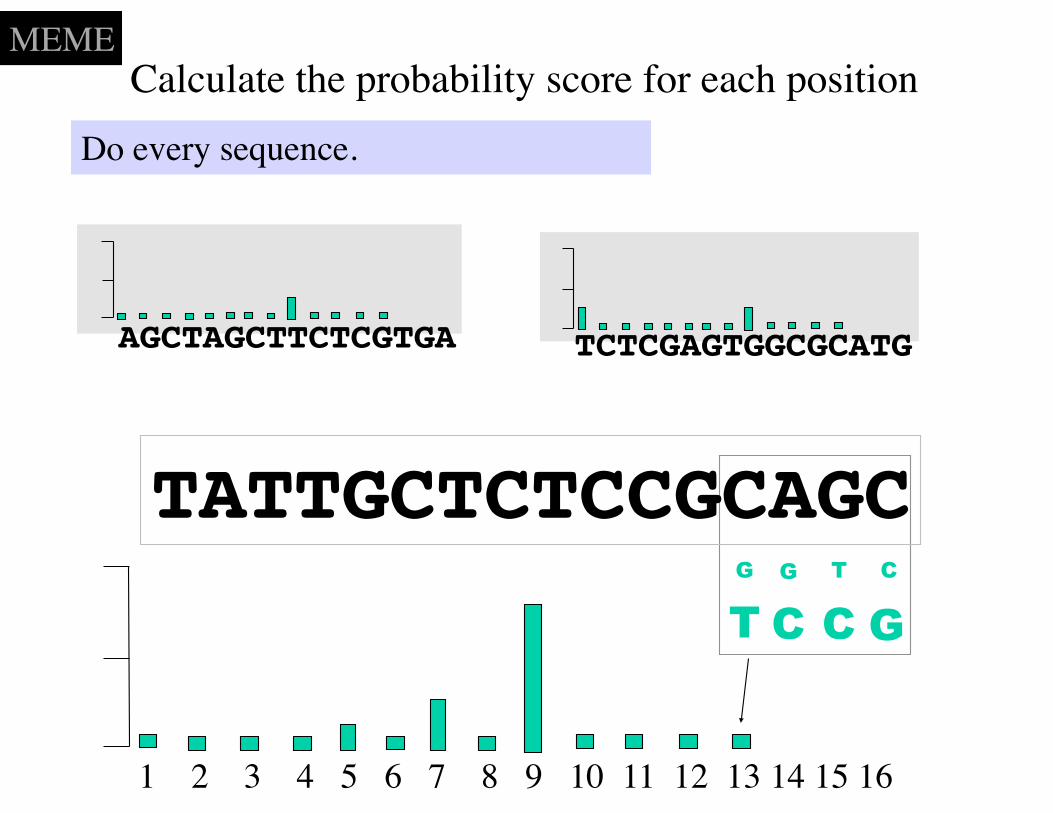
Calculate the probability score for each position
AGCTAGCTTCTCGTGA
Do every sequence.
1 2 3 4 5 6 7 8 9 10 11 12 13 14 15 16
TCTCGAGTGGCGCATG
MEME
TC CG
Calculate the probability score for each position
AGCTAGCTTCTCGTGA
Do every sequence.
1 2 3 4 5 6 7 8 9 10 11 12 13 14 15 16
TG G
C CT
GC
TCTCGAGTGGCGCATG
TATTGCTCTCCGCAGC
MEME
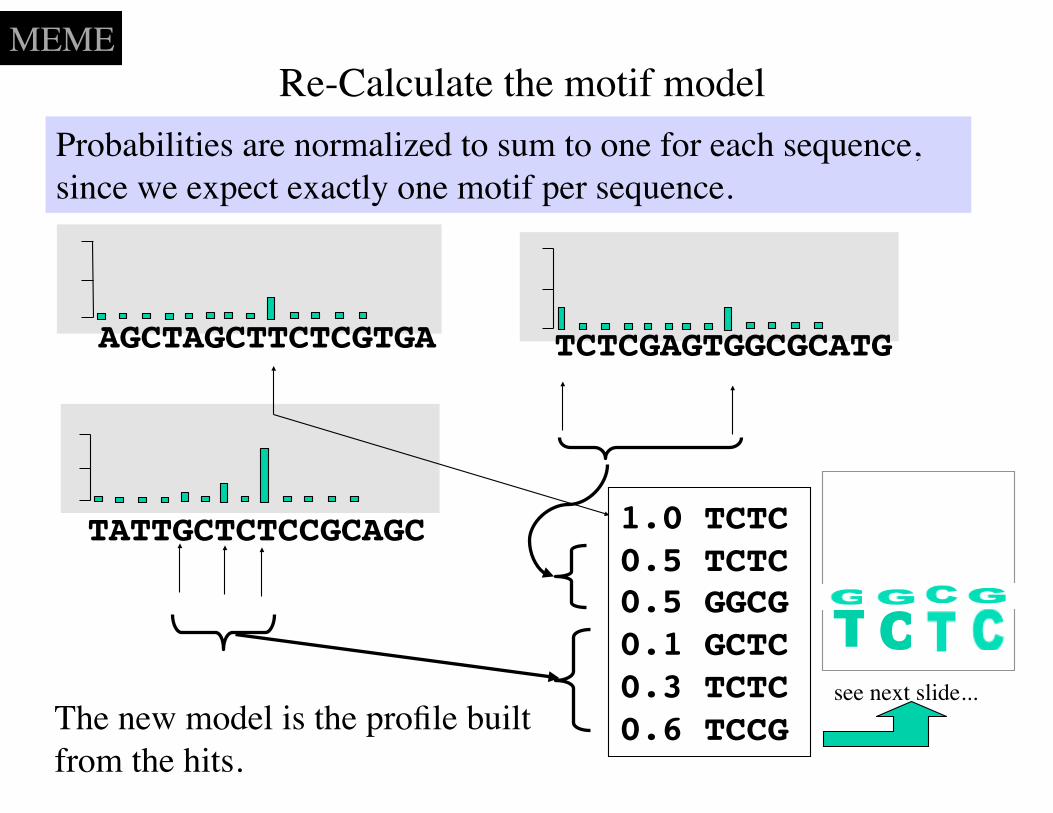
Re-Calculate the motif model
AGCTAGCTTCTCGTGA TCTCGAGTGGCGCATG
TATTGCTCTCCGCAGC 1.0 TCTC 0.5 TCTC 0.5 GGCG0.1 GCTC0.3 TCTC0.6 TCCG
Probabilities are normalized to sum to one for each sequence, since we expect exactly one motif per sequence.
The new model is the profile built from the hits.
MEME
see next slide...
TC
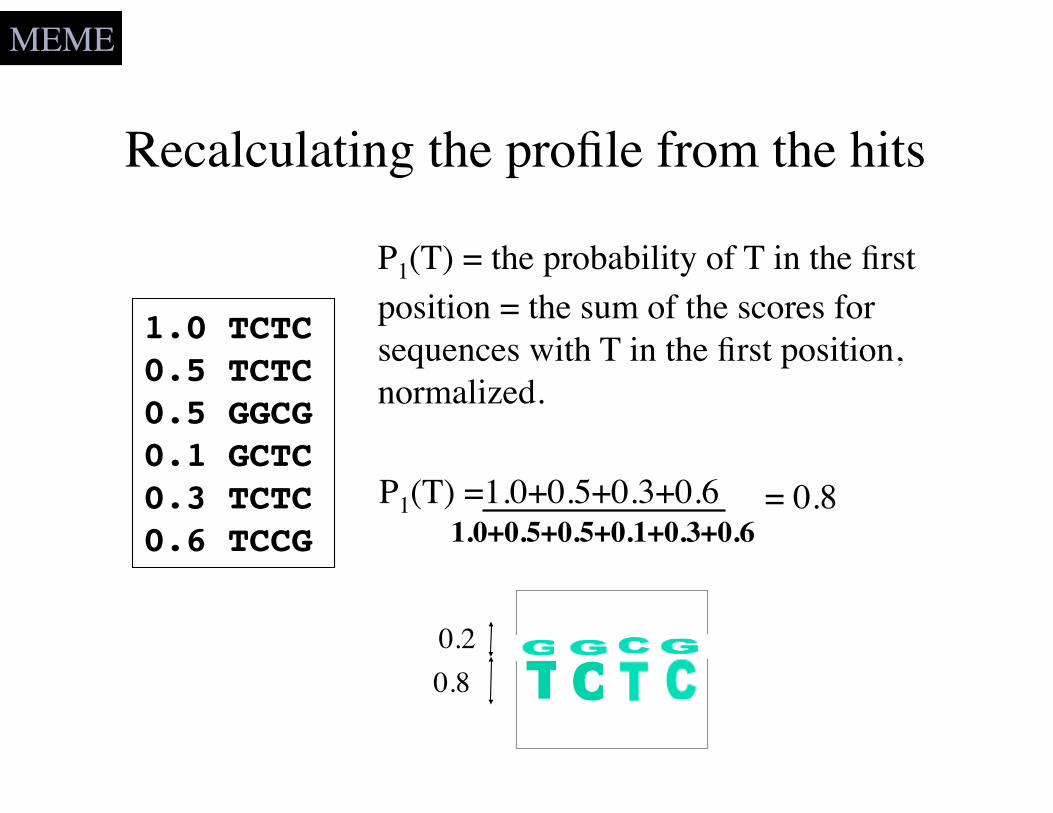
Recalculating the profile from the hits
1.0 TCTC 0.5 TCTC 0.5 GGCG0.1 GCTC0.3 TCTC0.6 TCCG
P1(T) = the probability of T in the first position = the sum of the scores for sequences with T in the first position, normalized.
P1(T) =1.0+0.5+0.3+0.61.0+0.5+0.5+0.1+0.3+0.6
= 0.8
0.80.2
MEME
TC

Do it again: Re-Calculate the probability scores
AGCTAGCTTCTCGTGA TCTCGAGTGGCGCATG
TATTGCTCTCCGCAGC 1.0 TCTC 0.9 TCTC 0.1 GGCG0.1 GCTC0.6 TCTC0.3 TCCGThe new model is the profile built
from the hits.
using the refined model
MEME
TC
TC

...and again, until converged.
AGCTAGCTTCTCGTGA TCTCGAGTGGCGCATG
TATTGCTCTCCGCAGC 1.0 TCTC 1.0 TCTC 0.0 GGCG0.0 GCTC0.95 TCTC0.05 TCCG
TG
G
CC
TG
C
MEME
TC

EM converges on the conserved pattern if the initial guess was not too far off.
TG
G
CC
TG
C
If the true motif was not one of the initial guesses, or some combination of the initial guesses, then EM would never find the true motif.
A summary of the exercise:
MEME
AGCTAGCTTCTCGTGA
TCTCGAGTGGCGCATG
TATTGCTCTCCGCAGC
TCTCTC CG
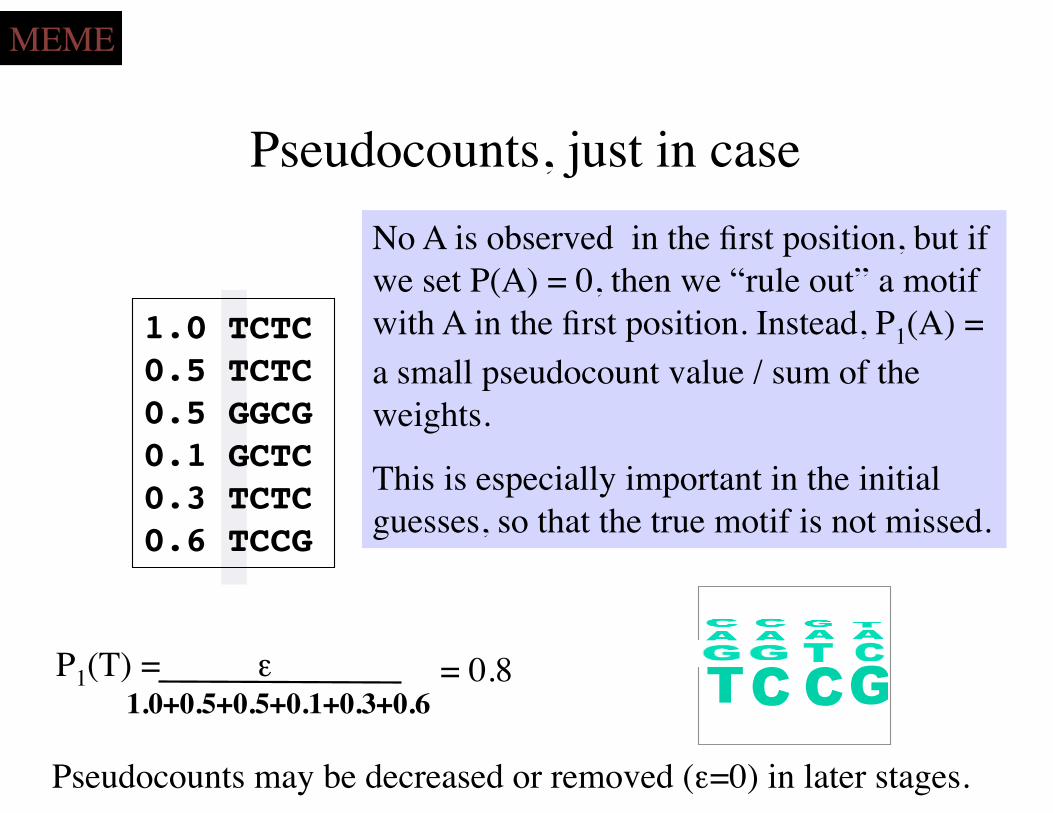
Pseudocounts, just in case
1.0 TCTC 0.5 TCTC 0.5 GGCG0.1 GCTC0.3 TCTC0.6 TCCG
No A is observed in the first position, but if we set P(A) = 0, then we “rule out” a motif with A in the first position. Instead, P1(A) = a small pseudocount value / sum of the weights.
This is especially important in the initial guesses, so that the true motif is not missed.
P1(T) = ε1.0+0.5+0.5+0.1+0.3+0.6
= 0.8
MEME
Pseudocounts may be decreased or removed (ε=0) in later stages.
TC CG

Gibbs SamplingStochastic version of MEME.
GIBBS
Radius of convergence is wider than MEME. Doesn’t need to start with one correct guess.

AGCTAGCTTCTCGTGA
TCTCGAGTGGCGCATG
TATTGCTCTCCGCAGC
score
aligned position
Slide first sequence through the motif window, calculate score.
GIBBS
keep scoring window fixedmove sequence
Expectation stepStart from random alignment. Select window size and position. Slide one sequence through window. Calculate scores.

Expectation step
AGCTAGCTTCTCGTGA
TCTCGAGTGGCGCATG
TATTGCTCTCCGCAGC
score
aligned position
GIBBS
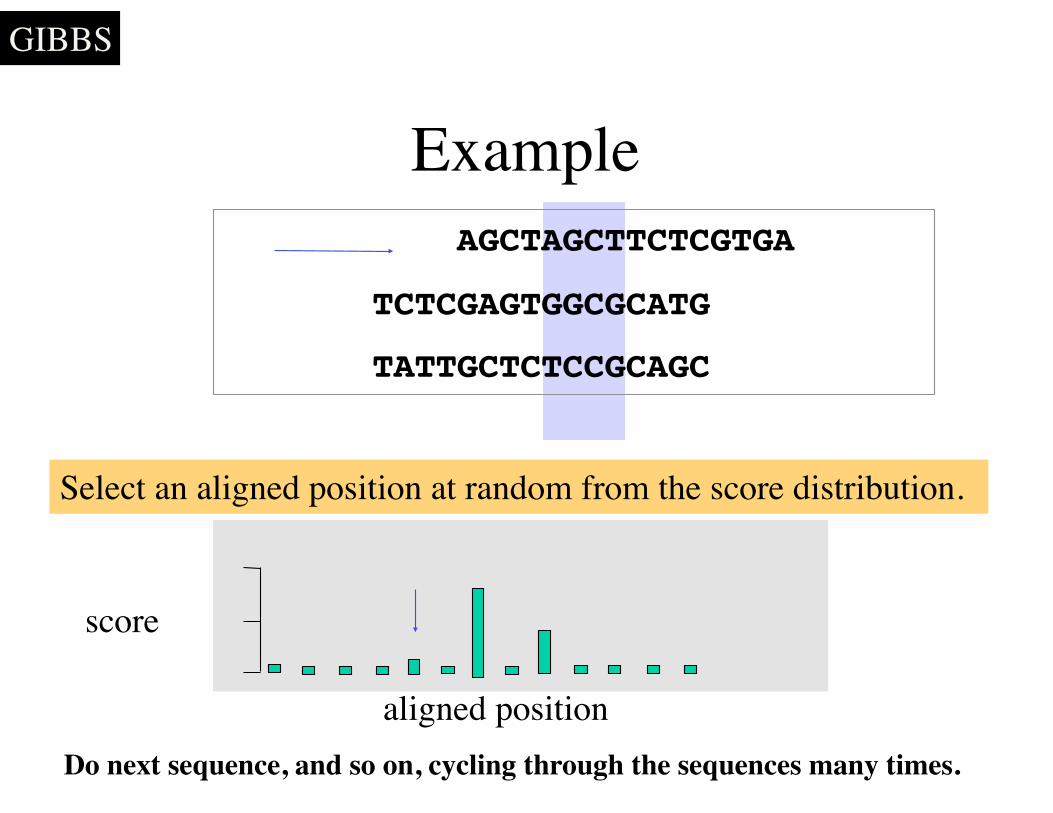
Example AGCTAGCTTCTCGTGA
TCTCGAGTGGCGCATG
TATTGCTCTCCGCAGC
score
aligned position
GIBBS
Select an aligned position at random from the score distribution.
Do next sequence, and so on, cycling through the sequences many times.

Example AGCTAGCTTCTCGTGA
TCTCGAGTGGCGCATG
TATTGCTCTCCGCAGC
score
aligned position
GIBBS
Select an aligned position at random from the score distribution.
Do next sequence, and so on, cycling through the sequences many times.

Convergence is when there are no more changes.
AGCTAGCTTCTCGTGA
TCTCGAGTGGCGCATG
TATTGCTCTCCGCAGC
GIBBS
Exactly one segment is aligned to the motif region at each step.

Gibbs SamplingStochastic version of MEME.
(1) Choose length and initial (or random) guesses of motif locations.
(2) Sum the motif profile (w/ or w/o pseudocounts/noise) from the current motif positions.
(3) Remove one sequence. Calculate probability scores for each possible motif position.
(4) Randomly choose a motif position from the probability distribution.
(5) Repeat (2)-(4) until convergence.
GIBBS
Radius of convergence is wider than MEME. Doesn’t need to start with one correct guess.

What is Expectation/Maximization ?
EM is any method that iterates between an “expectation” step and a “maximization” step. Starting with a statistical model and a set of data.
•Expectation Calculate the expected values for the parameters of the model, using the current model and the data.
•Maximization Replace the parameters of the model with their expected values.
MEME is an EM algorithm. Gibbs sampling is not.

I-sites : Finding motifs within protein sequences
HDFPIEGGDSPMQTIFFWSNANAKLSHGY CPYDNIWMQTIFFNQSAAVYSVLHLIFLT IDMNPQGSIEMQTIFFGYAESA ELSPVVNFLEEMQTIFFISGFTQTANSD INWGSMQTIFFEEWQLMNVMDKIPS IFNESKKKGIAMQTIFFILSGR PPPMQTIFFVIVNYNESKHALWCSVD PWMWNLMQTIFFISQQVIEIPS MQTIFFVFSHDEQMKLKGLKGA
Short, recurrent sequence patterns may exist in different protein because they are required to initiate folding
Non
-hom
olog
pro
tein
s
recurrent sequence
Is is a recurrent structure?Bystroff C & Baker D. (1998). Prediction of local structure in proteins using a library of sequence-structure motifs. J Mol Biol 281, 565-77.
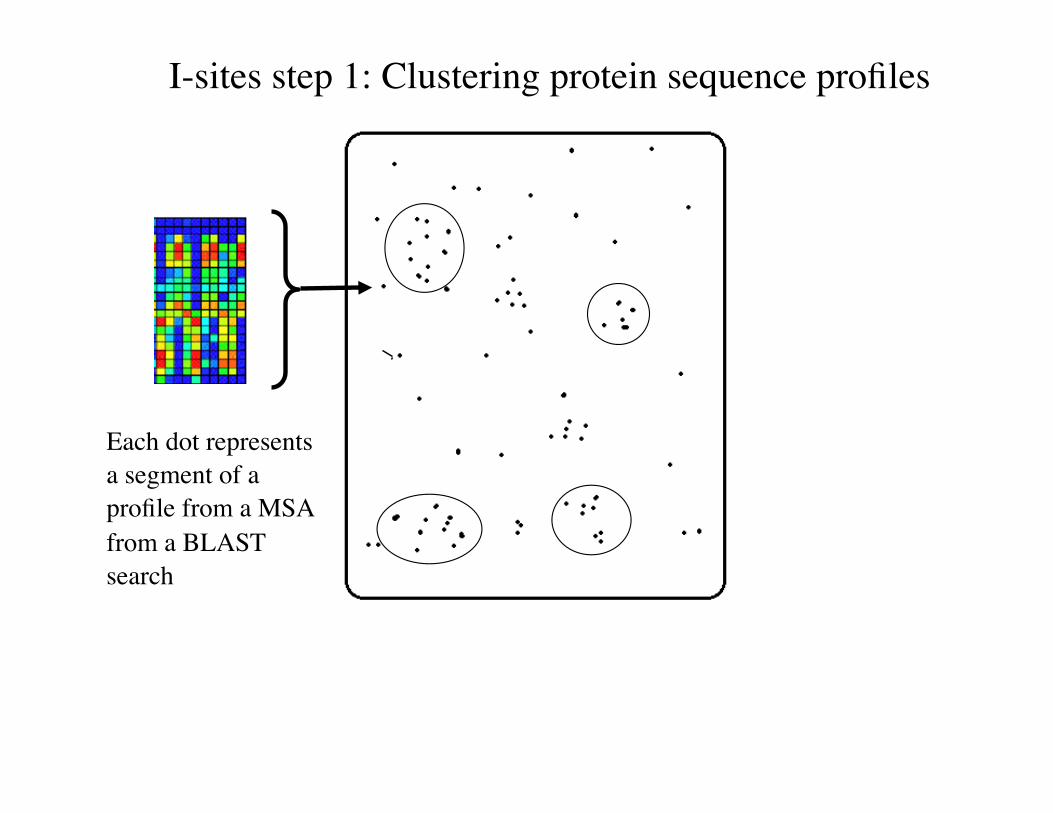
I-sites step 1: Clustering protein sequence profiles
Each dot represents a segment of a profile from a MSA from a BLAST search
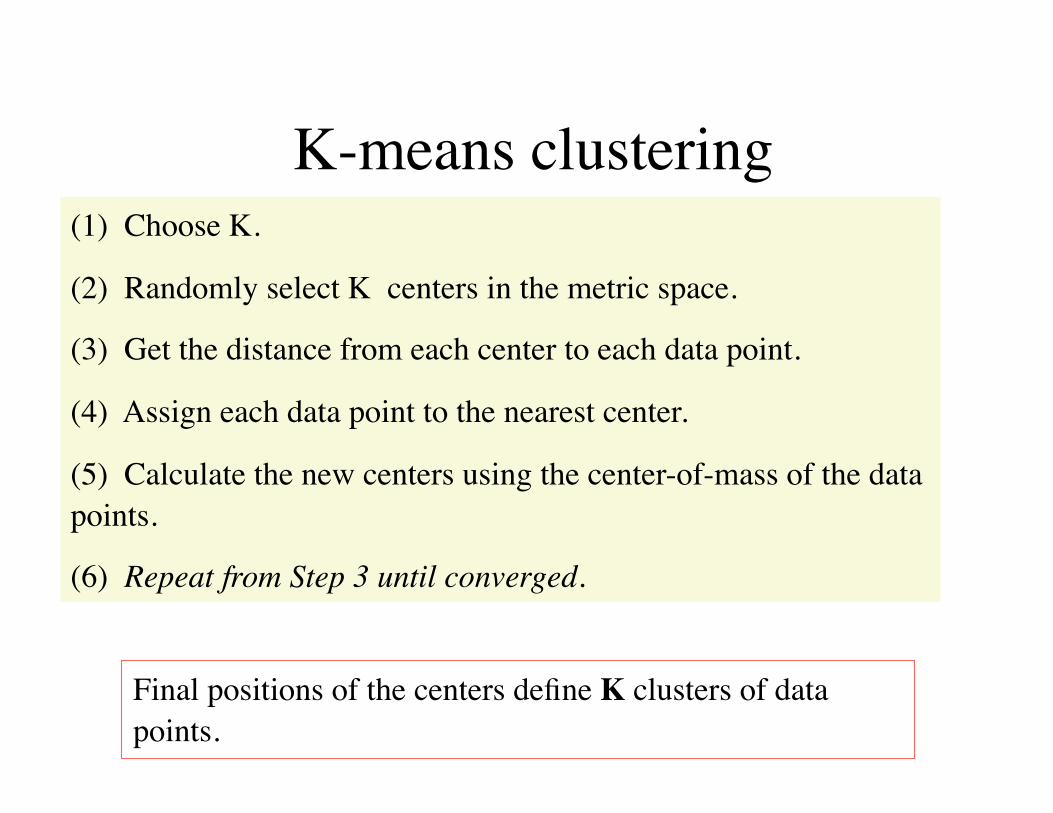
K-means clustering(1) Choose K.
(2) Randomly select K centers in the metric space.
(3) Get the distance from each center to each data point.
(4) Assign each data point to the nearest center.
(5) Calculate the new centers using the center-of-mass of the data points.
(6) Repeat from Step 3 until converged.
Final positions of the centers define K clusters of data points.
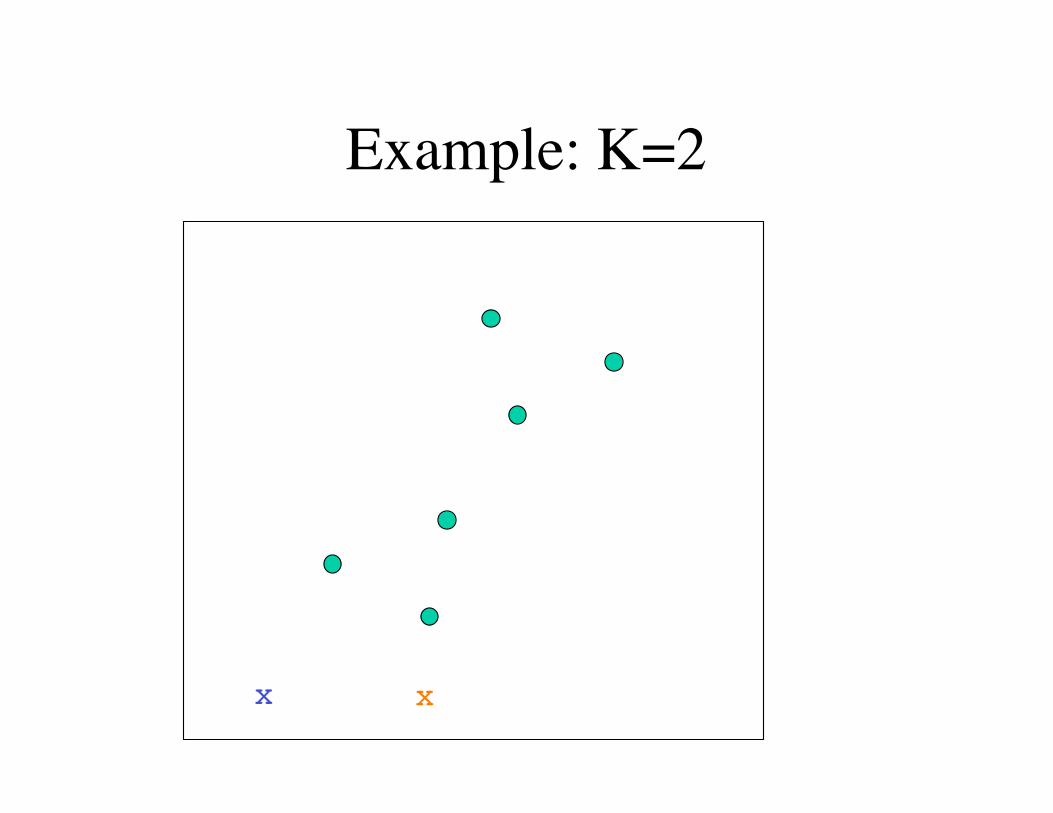
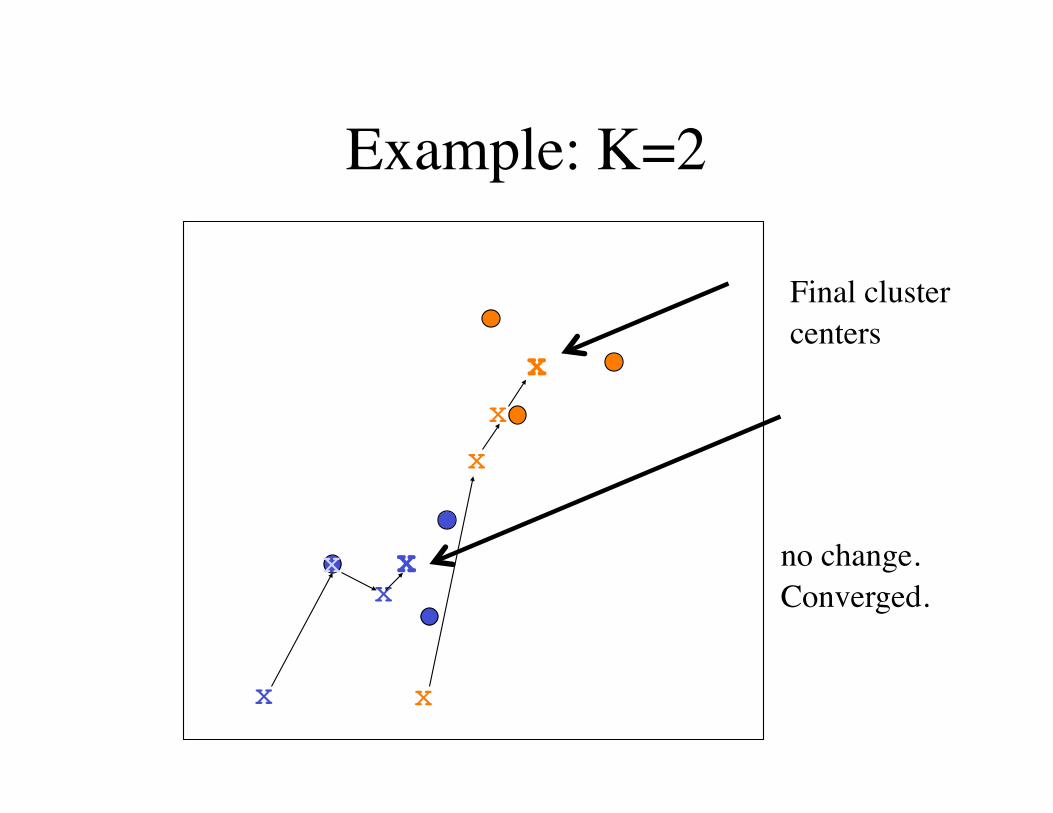
Example: K=2
x x

Example: K=2
x x

Example: K=2
x x
x
x

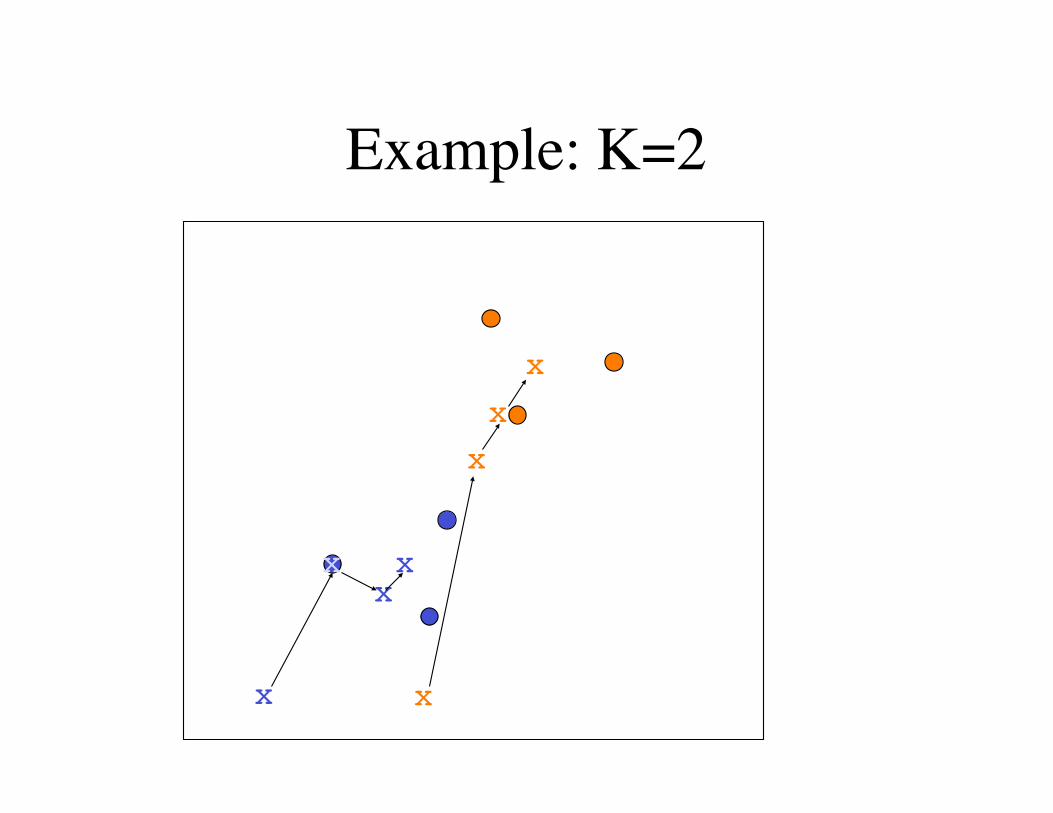
Example: K=2
x x
x
x

Example: K=2
x x
x
x
x
x

Example: K=2
x x
x
x
x
x
Example: K=2
x x
x
x
x
xx
x
Example: K=2
x x
x
x
x
xx
x
no change.Converged.
Final cluster centers

K-means clustering
(1) Requires knowledge of K, the number of classes
(2) Requires the objects to exist in a “metric space”.
(3) Stochastic. Depends on the starting points.

Distance/similarity metrics for profiles. We tried them all.
(1) Manhattan, or City-Block metric (a distance metric)
D( p, q) = P pij( ) − P qij( )amînoacidsi
∑positions
j
∑
(2) Entropy (a similarity metric) NOTE: not symmetrical!
S(p,q) = pij log qij( )amînoacidsi
∑positions
j
∑
(3) Correlation (a similarity metric)
S(p,q) =
pij − p( ) qij − q( )amînoacidsi
∑positions
j
∑
pij − p( )2 qij − q( )2amînoacidsi
∑positions
j
∑amînoacidsi
∑positions
j
∑=
pij − p( ) qij − q( )amînoacidsi
∑positions
j
∑
σ pσ q
D( p, q) = LLR pij( )LLR qij( )amînoacidsi
∑positions
j
∑(4) Dpq (similarity metric)

I-sites step 2: Supervised learning
training set
Search the database for the 400 nearest
neighbors
sequence profile
nearest neighbors
remove all cluster members that do not
conform with the paradigm
Supervised learning finds predictive correlations between two spaces (sequence space and structure space)
We want this profile to predict...
…as long as it is consistent with this
structure.

diverging type-2 turn
Serine hairpin
Proline helix C-cap alpha-alpha corner glycine helix N-cap
Frayed helix
Type-I hairpin
I-sites: Results
Amino acids arranged from non-polar to polar
Backbone angles: ψ=green, φ=red

How do you compare two predictive models?
Accuracy = percent of the predictions that are correct, of the ones that were made.
Coverage = number of possible predictions that were actually predicted.
Confidence = a score to sort the predictions. A more confident prediction should be a more accurate one.
≠null
=null
+ –
T+
T-
F-
F+
Accuracy = T+/(T+ + F+)
Coverage = T+/(T+ + F-)
OK. But accuracy depends on coverage
OK. But coverage depends on accuracy
Does the confidence of a prediction match its accuracy?

False positive rate
A more detailed description of the method is the rate of false positive predictions, which can be a function of the score.A better method has a lower false positive rate.
To calculate, sort the scores and assign T or F to each score. The false positive rate for each score is the percent of the false scores that are above that score.
false positive = Type 1 error = error of the first kind
number of false positives above x fpr(x) = ––––––––––––––––––––––––––––––
total number of false positives
(FPR does not provide one handy number.)

Receiver Operator Characteristic (ROC)
•A way to describe the whole set of scores with a single number.
•Each score has a T or F.
•Sort the scores.
•Starting from the highest scoring, draw a vector up for a true, to the right for a false.
•Calculate ROC = the normalized area under this curve.
•If all of the true scores are greater that the greatest false score, then ROC = 1.0.
• 0.≤ROC≤1.

ROC score0.990 T0.978 F 0.972 T0.966 T0.951 T0.902 F 0.880 F 0.811 F 0.803 F 0.792 T0.766 F 0.751 F 0.723 F 0.696 F 0.688 T0.666 F 0.651 F 0.623 F 0.596 F 0.488 T
Sort the scores, for each score move up one if it is true, right one if it is false.
The area under the curve, divided by the total, is the ROC score. 0 ≤ ROC ≤ 1.
number of falses
num
ber o
f tru
es

In class exercise: calculate ROC score
0.811 T0.972 T0.766 T0.990 F 0.966 T0.951 F 0.803 F 0.792 F 0.503 F 0.978 T0.478 F
4 T39 F 44 T44 T40 T1 F 39 F 29 F 10 F 44 F 45 T
Which method is better?
Method A Method B

Review
MEME -- deterministic EM algorithm for motif finding, starting with initial guess
Gibbs sampling -- stochastic EM algorithm for motif finding, doesn’t need initial guess
K-means -- unsupervised learning of recurrent patterns, requires a metric space (distance or similarity).
Supervised learning -- EM in two spaces. Expectation in one space, maximization in the other.
ROC -- a method to compare prediction methods.
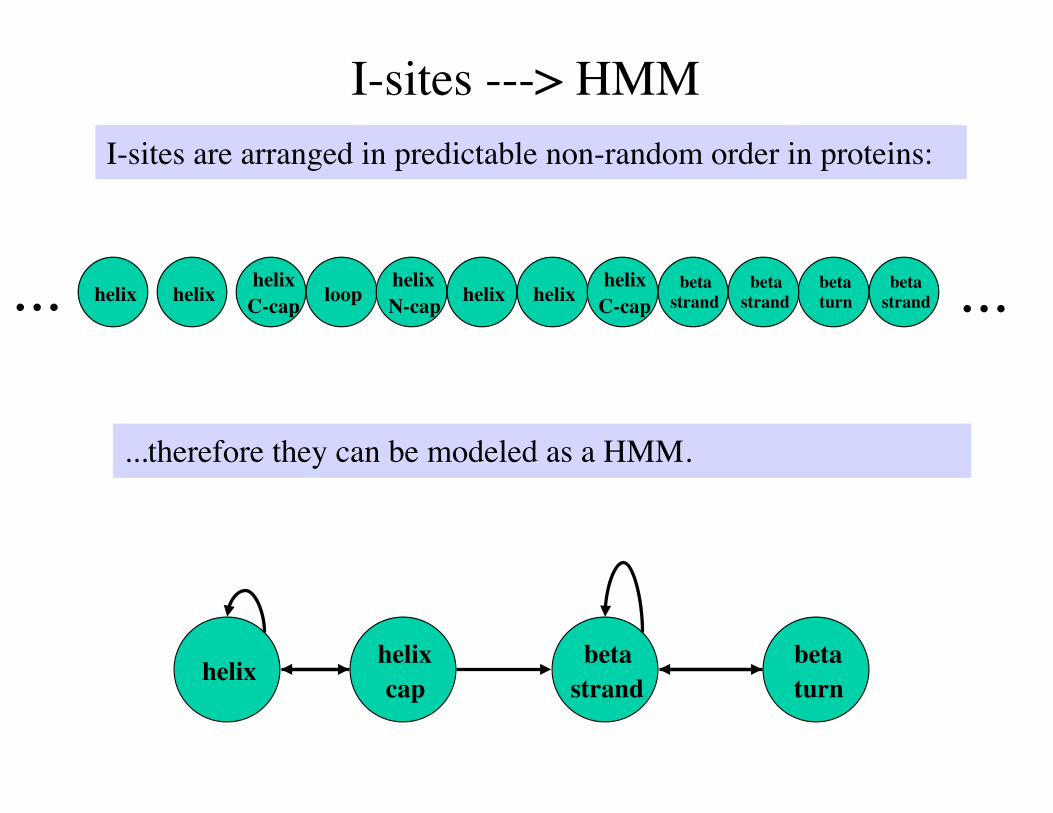
I-sites ---> HMMI-sites are arranged in predictable non-random order in proteins:
helix helix cap
betastrand
betaturn
...therefore they can be modeled as a HMM.
helix betaturn
helixC-cap loop
helixN-cap helixhelix helix
helixC-cap
betastrand
betastrand
betastrand ......

Related motifs, branched model.
φψ
Type-1G α C-cap
Type-2G α C-cap
α helix
Type-2G α C-cap
α helix
Type-1G α C-capstate
topology:
aligned profiles
aligned structures
State-state transitions are defined wherever I-sites have overlaps.
Where the motifs align, we call each positions a state. Where they stop aligning, we split the state path.

I-sites HMM = HMMSTR! Hidden Markov Model for local protein STRucture
HMM of linked I-sites motifs. Each node is one amino acid.
Size of HMM:282 nodes 317 transitions
(Bystroff et al., JMB 2000)
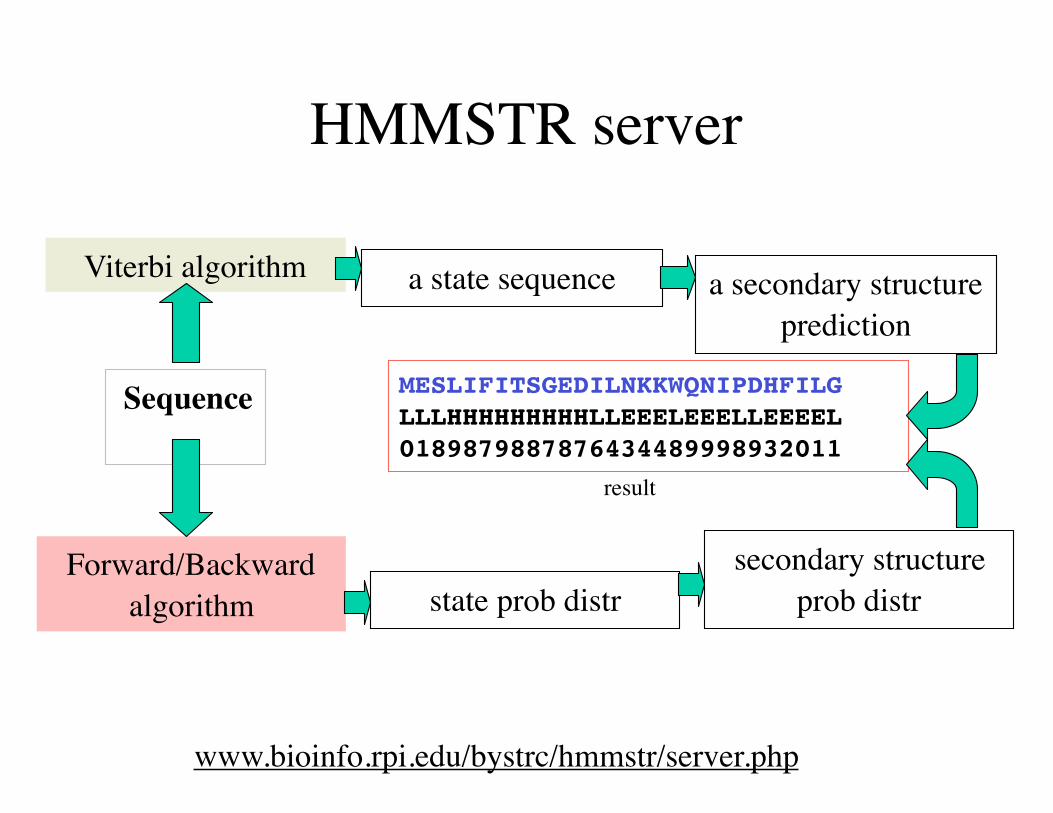
HMMSTR server
www.bioinfo.rpi.edu/bystrc/hmmstr/server.php
Sequence
Viterbi algorithm
Forward/Backward algorithm
a state sequence
state prob distr
a secondary structure prediction
secondary structure prob distr
MESLIFITSGEDILNKKWQNIPDHFILG LLLHHHHHHHHHLLEEELEEELLEEEEL 0189879887876434489998932011
result

Example HMMSTR output. 1 ....,....1....,....2....,....3....,....4....,....5Seq MATVEPETTPTPNPPTTEEEKTESNQEVANPEHYIKHPLQNRWALWFFKNAngles EEEEBHHBBBBBBBBBBHHHHHHHHHHHHBHHEEEEEBHHHBEEEEEEBH confid 55568454657654444888888877777777566666443456677776Sec struct LLLLLLLLLLLLLLLLLHHHHHHHHHHHHLLLLEEELLLLLLEEEEEELL confid 65556777777778887667777666664777445456666445666657Context nnnddddddnnmmmnhh confid 44555555554554477
51 ....,....6....,....7....,....8....,....9....,....0Seq DKSKTWQANLRLISKFDTVEDFWALYNHIQLSSNLMPGCDYSLFKDGIEPAngles GlBBEEEHHEEEEEHHHHHHHHHHHHHHEEEBHHBBBlBBEEEEBGxBBB confid 74555444344444444477787775545554557887755555542465Sec struct LLLEEEELLLEEELLLLLHHHHHHHHLLEELLLLLLLLLLEEEELLLLLL confid 87634434433333445456666654443435676788764443467655Context hhhnnnndddnnn nn nnnn confid 7776656444555 55 5445
This is a helix N-cap motif.This is a beta turn motif.

I-sites/HMMSTR graphical output
58
Review
Why are there motifs in proteins?
What does MEME do?
How is Gibbs sampling different from MEME?
What kind of data can be clustered using K-means?
What is supervised learning? How is it different from machine learning?
What kind of data goes into a ROC score?

Repeats, Satellites & Transposable
Elements

Transposable elements: junk dealers
Barbara McClintock Transposase, transposasome
Transposable elements “jumping genes” lead to rapid germline variation.
“Out standing in her field”

Excision of transposon may leave a “scar”.
TR TRIR IR
cruciform structure
repaired DNA with copied TR and added IR
TR=tandem repeatIR=inverted repeat

Millions of years of accumulated TE “scars”
Some genomes contain a large accumulation of transposon scars.
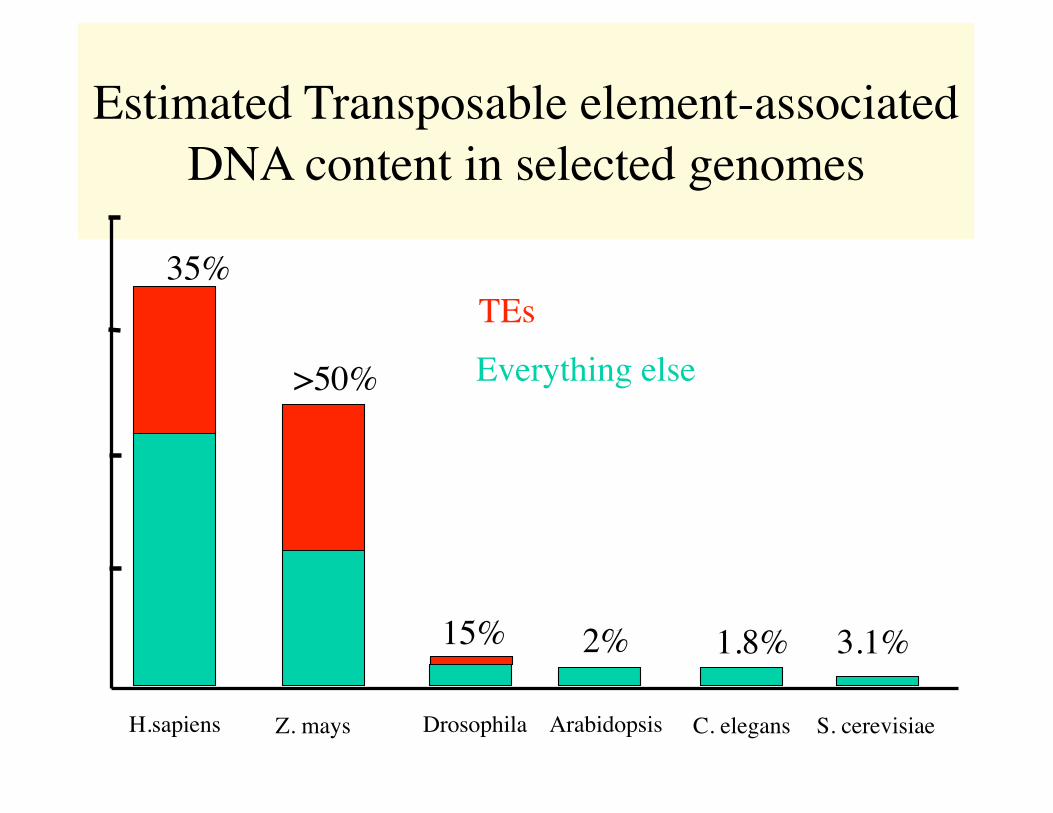
Estimated Transposable element-associated DNA content in selected genomes
H.sapiens Z. mays Drosophila Arabidopsis C. elegans S. cerevisiae
Everything elseTEs
35%
>50%
2%15% 1.8% 3.1%
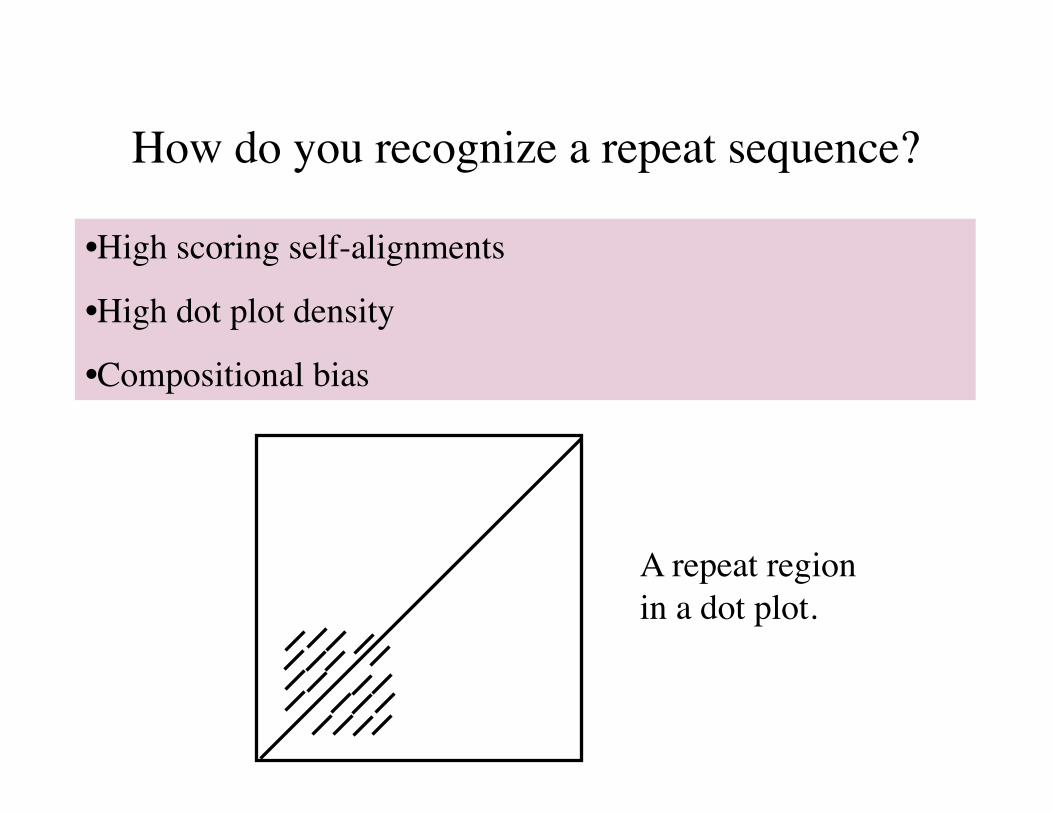
How do you recognize a repeat sequence?
•High scoring self-alignments
•High dot plot density
•Compositional bias
A repeat region in a dot plot.
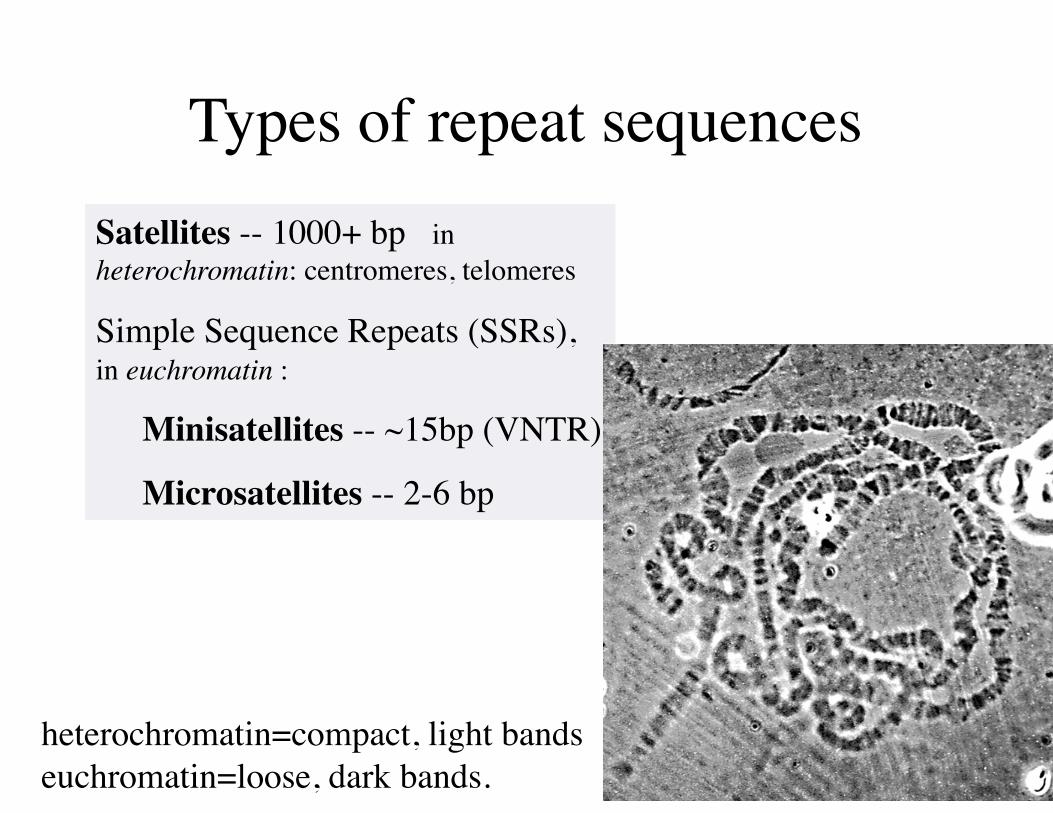
Types of repeat sequencesSatellites -- 1000+ bp in heterochromatin: centromeres, telomeres
Simple Sequence Repeats (SSRs), in euchromatin :
Minisatellites -- ~15bp (VNTR)
Microsatellites -- 2-6 bp
heterochromatin=compact, light bandseuchromatin=loose, dark bands.
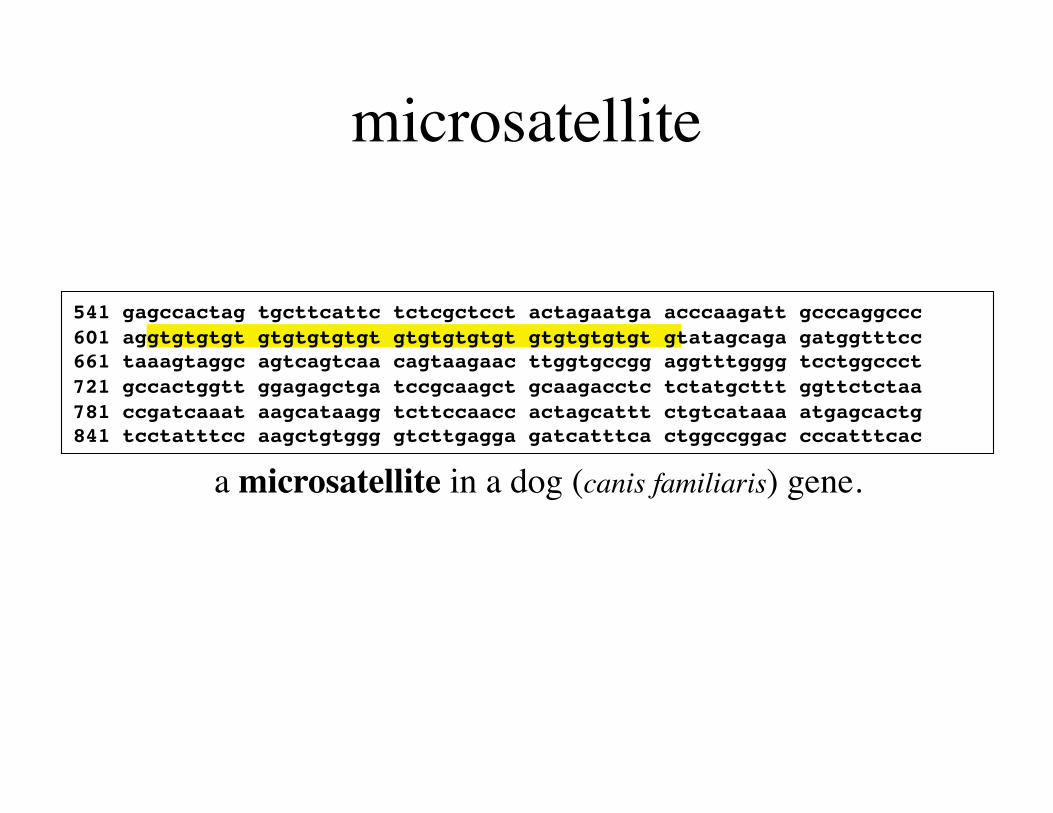
microsatellite
541 gagccactag tgcttcattc tctcgctcct actagaatga acccaagatt gcccaggccc 601 aggtgtgtgt gtgtgtgtgt gtgtgtgtgt gtgtgtgtgt gtatagcaga gatggtttcc 661 taaagtaggc agtcagtcaa cagtaagaac ttggtgccgg aggtttgggg tcctggccct 721 gccactggtt ggagagctga tccgcaagct gcaagacctc tctatgcttt ggttctctaa 781 ccgatcaaat aagcataagg tcttccaacc actagcattt ctgtcataaa atgagcactg 841 tcctatttcc aagctgtggg gtcttgagga gatcatttca ctggccggac cccatttcac
a microsatellite in a dog (canis familiaris) gene.

Minisatellite1 tgattggtct ctctgccacc gggagatttc cttatttgga ggtgatggag gatttcagga
61 tttgggggat tttaggatta taggattacg ggattttagg gttctaggat tttaggatta 121 tggtatttta ggatttactt gattttggga ttttaggatt gagggatttt agggtttcag 181 gatttcggga tttcaggatt ttaagttttc ttgattttat gattttaaga ttttaggatt 241 tacttgattt tgggatttta ggattacggg attttagggt ttcaggattt cgggatttca 301 ggattttaag ttttcttgat tttatgattt taagatttta ggatttactt gattttggga 361 ttttaggatt acgggatttt agggtgctca ctatttatag aactttcatg gtttaacata 421 ctgaatataa atgctctgct gctctcgctg atgtcattgt tctcataata cgttcctttg
This 8bp tandem repeat has a consensus sequence AGGATTTT,
but is almost never a perfect match to the consensus.

ACRONYMS for satellites and transposonsSSR Short Sequence RepeatSTR Short Tandem RepeatVNTR Variable Number Tandem RepeatLTR Long Terminal RepeatLINE Long Interspersed Nuclear ElementSINE Short Interspersed Nuclear ElementMITE Miniature Inverted repeat Transposable Element (class III TE)TE Transposable ElementIS Insertion SequenceIR Inverted RepeatRT Reverse TranscriptaseTPase TransposaseAlu 11% of primate genome (SINE)LINE1 14.6% of human genomeTn7,Tn3,Tn10,Mu,IS50 transposons or transposable bacteriophageretroposon=retrotransposon
Class I TE, uses RT.Class II TE, uses TPase.Class III TE, MITEs*
*Cl,ass III are now merged with Class II TEs.
fun with bioinformatics jargon

Is there an evolutionary advantage of repeat sequences?
Repeat sequences are prone to
(1) locally: errors in replication
(2) non-locally: homologous recombination
Errors in replication (polymerase slippage) can lead to a change in the reading frame, eliminating a STOP codon, adding one, or translating to a different sequence entirely.
Neisseriae Gonorrheoae evades the human immune system by randomly, periodically (weeks) changing the reading frame of the pilin surface antigen protein, aided by a 4-base microrepeat.

(How) do you align repeat sequences?
B: Dynamic Programming with special EVD. Align just like any other sequence, but using a special null model to assess the significance of the alignment score. Use EVD to fit random scores.
Remember: Low complexity sequences will have high-scoring alignments randomly. For example:
ATTTATATAATTAATATATAAATATAATAAATAT aligned to
TATTATATATATATATATATTATATATATATATA
Random score is likely to have >50% identity!
A: Don’t align. Mask them out instead.

www.repeatmasker.org
Annotation Results SW perc perc perc query position in query matching repeat position in repeat score div. del. ins. sequence begin end (left) repeat class/family begin end (left) ID Overlap
194 10.5 2.6 0.0 chr1 1031265 1031302 (244491545) + C-rich Low_complexity 3 41 (0) 624 0 238 26.4 0.7 0.7 chr1 1031638 1031782 (244491065) + (TG)n Simple_repeat 1 145 (0) 625 0 298 29.0 2.1 0.0 chr1 1031794 1031886 (244490961) + (CGTG)n Simple_repeat 3 97 (0) 626 0 255 23.1 1.8 1.8 chr1 1031900 1032062 (244490785) + (TG)n Simple_repeat 1 163 (0) 627 0 1864 13.8 0.0 0.7 chr1 1032330 1032614 (244490233) + AluJo
Compares your seqeunce to a curated library of known repeats to a query sequence: Returns: (1) Location and type of each repeat, and/or
(2) Query sequence with repeats masked (set to “N”)
Ariana Smit, Phil Green

The most naive null model
What is a good model for random alignments of low-complexity/repeat sequences?
REMINDER: Significance is what matters! [ What is the likelihood of getting a score at “random”. ] Getting e-values requires a model for random scores.These scores are fit to a EVD. Using the EVD equation, we can convert a score to a e-value.
Simplest null model (1) Composition-biased model.Generate random sequences based on composition. Align them. Get scores. Fit the scores to the EVD.
A,C,G,T
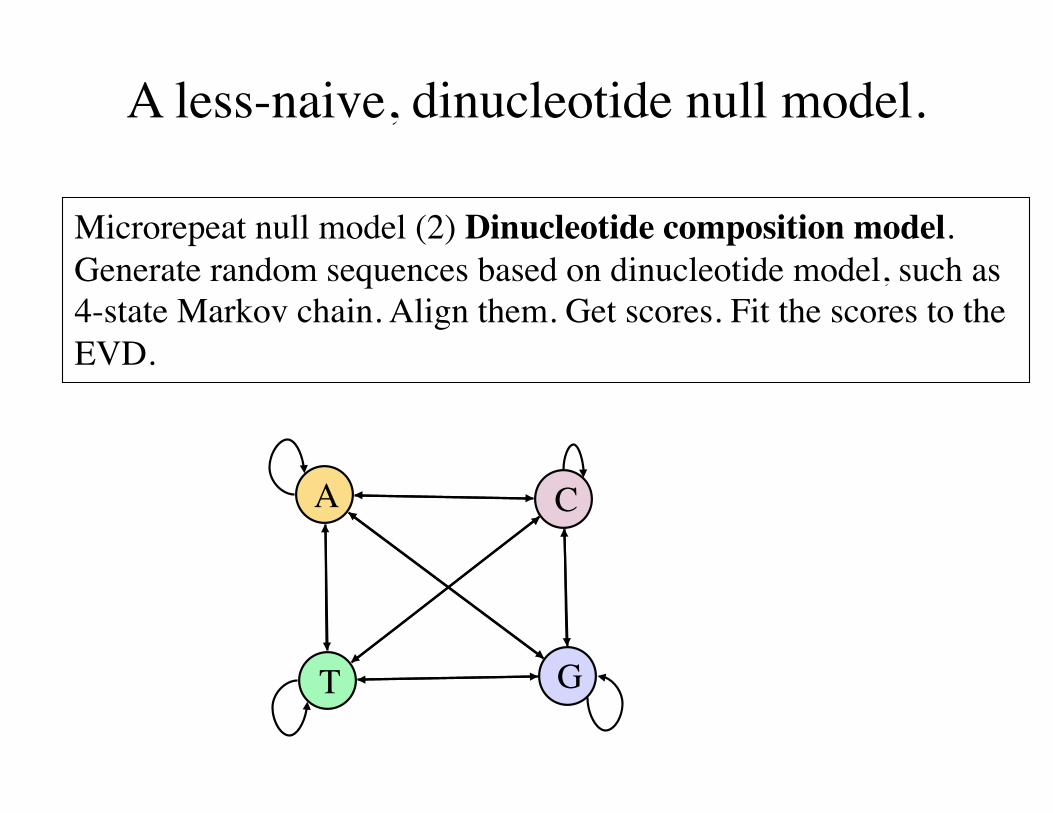
A less-naive, dinucleotide null model.
Microrepeat null model (2) Dinucleotide composition model.Generate random sequences based on dinucleotide model, such as 4-state Markov chain. Align them. Get scores. Fit the scores to the EVD.
A C
GT

Microrepeat null model (3) Trinucleotide composition model.Generate random sequences based on dinucleotide model, such as 16-state HMM. Align them. Get scores. Fit the scores to the EVD.
A C GT A C GT
A C GT A C GT
after A after C
after Gafter T
Only the arrows into the 4 “after A” states are shown
A smarter, trinucleotide null model

Minirepeat null model (4) Motif model. (Grammatical model.) Repeats are (possibly misspelled) words. Generate sequences. Align them. Get scores. Fit the scores to the EVD.
A G K V T T T H
N
8 character misspelled-word repeat model, with occasional extra character(s).
Null model for aligning specific mini-repeat sequences.

In class exercise: create a HMM for a microsatellite.
•Using Netscape: Go to the NCBI database and download the nucleotide sequence with GenBank identifier (gi) 21912445
•Import it into UGENE.
•Find the microsatellite that starts at around 330. Draw a motif HMM. Use ProSite syntax
•Run your model to generate a random microsatellite sequence.

Transposable element HMM?
begin end
begin end
Complementary base states. Training paired states enforces complementarity.
Inverted repeat
Tandom repeat
Transposase gene
A heirarchical HMM is made by connecting the end and begin states of HMMs.

Constrained training of HMM states is possible.
end1 2 3 48 7 6 5
Inverted repeat
begin
end begin
In expectation/maximization training, we select the new parameters of the model.
In constrained training, we can enforce:
• identical emission probabilities
• complementary emission probabilities
• identical transition probablities.
For example in the maximization step of E/M: (‘ = expected value)
b3(A) = ( b’3(A) + b’6(T) ) / 2