september quarter 2016 market update - reiwa · perth housing and land market perth region...
TRANSCRIPT

September Quarter 2016
market updateQuarterly review of the WA residential property market
SAMPLE

2 MARKET UPDATE | SEPTEMBER QUARTER 2016
Contents REIWA MARKET UPDATE
WA Real Estate Indicators 3
Perth Housing and Land Market 4
Perth Overview 6
Perth Central Sub-Region 8
Perth North-West Sub-Region 16
Perth North East Sub-Region 20
Perth South East Sub-Region 24
Perth South West Sub-Region 28
Perth Rental Report 32
Dwellilng Sales Overview 34
Land Sales Overview 35
Regional WA Real Estate Report 36
Lifestyle Living Summary 46
Macro Growth Rates 50
Economic Overview 51Statistical Concepts and
House Price Measurement 51
Centre SpreadLift-out colour maps
Perth House PricesMedian prices of established house sales for 12 months to September 2016
Regional House PricesMedian prices of established house sales (land less than 1Ha) in major regional centres for12 months to September 2016
EDITOR & ANALYST Lisa Kazalac | Ronak Bhimjiani | Dillon Kanbi COVER PHOTO iStock: Dirk Tacke
PRODUCTION & DESIGN Jan Burt PRINTING Printforce CONTACT REIWA PO Box 8099, Subiaco East 6008 TEL (08) 9380 8222 FAX (08) 9380 8289
SUBSCRIPTION [email protected]
About the REIWA Market UpdateThe Market Update is a quarterly review of the property market in Western Australia and is published by the Real Estate Institute of WA.
While REIWA has full confidence in the data contained in this document, no warranty, guarantee or holding out, either expressed or implied is given and persons or companies who pursue real estate investment or otherwise and act on the basis of this data do so at their own risk.
Issue 102 | © REIWA 2016 | This publication is copyright. Only REIWA members may copy or reproduce any part of this publication without authorisation.
unlocking opportunities Proudly supported by llestpac
The key to real estate is spotting value. Our real estate specialists have
expert industry knowledge to help you with anything from a simple and secure rent
collection system, to the purchase of rent rolls (thanks to our tailored rent roll funding).
So you can spend more time growing your business.
Talk to our WA Real Estate Relationship Manager
about how we can support you:
Aamna Bhatia on 0438 997 675
Or visit http://www.westpac.com.au/business
banking/industries/real-estate/
UI
SAMPLE

SEPTEMBER QUARTER 2016 | MARKET UPDATE 3
Western Australia’s Consumer Sentiment Index has fallen a significant 14.2 per cent in September to 89.2 - the lowest level of the five major states. The decline comes on the back of solid improvements in consumer sentiment in August with WA consumers now concerned about current and near future economic conditions. Economic conditions over the next 12 months was the main reason for the consumer pessimism, although economic conditions over the next five years has seen a boost in confidence. Compared to consumer sentiment levels a year ago, Western Australia is up 2.0 per cent but remains the lowest amongst the states.
According to the latest figures from the Australian Bureau of Statistics (ABS), domestic demand in Western Australia fell 2.5 per cent in the June quarter to $49.6 billion, its lowest level since June quarter 2011 in seasonally adjusted terms. The main factor of the fall is the decline in private capital investment, which was down by 4.9 per cent to $39.2 billion. The good news is household consumption in the state is still growing at a moderate pace at $25.2 billion. Public capital investment also had its strongest quarter on record, up 7.4 per cent to $10.3 billion. State final demand excludes exports and imports, which is Western Australia’s main commodity in international trade, but remains the best representation of the state’s economy. Overall Australia’s economy increased 3.3 per cent at the end of the 2016 financial year, led by Australian Capital Territory (3.8 per cent) and Northern Territory (2.4 per cent).
REIWA MARKET UPDATE WA Real Estate Indicators
WA consumer sentiment moderates in September
WESTERN AUSTRALIA REAL ESTATE INDICATORS - SEPTEMBER QUARTER 2016September Qtr 2016
PreliminaryJune Qtr 2016
Revised% change from
previous quarter% change
from previous year
Median sale price 1Preliminary median house and unit prices and estimated sales volume for current quarter based on a dataset of approximately 70-75% of transactions for the quarter. Median house & land prices for sales less than 1 Ha. Land sales estimates based on approximately 50% of expected transactions for the quarter. Figures are therefore subject to revision.1 Median sales prices are
derived from Landgate sales information & includes sales on lots less than 1 Ha Dwelling Sales for current quarter based on assumption that analysis conducted on 70% sample of data. Land Sales for current & past quarters based on assumption that only ~50% of sales have settled. Due to pre-selling & settlement lags, - final Land Sales figures not available for up to 12 months. Average selling time and sales to listing ratio are taken from REIWA.COM.
2 Buyer type information from the Australian Bereau of Statistics
3 Rental market data from REIWA.COM and member surveys.
4 Building approvals data from the Australian Bureau of Statistics.
5 Finance approvals data from the Australian Bureau of Statistics - latest figure may average for last month of quarter.
6 Interest rate data from Reserve Bank.
7 CPI data from Australian Bureau of Statistics.
* Data as of 3 months to Aug 2016
Houses, Perth $510,000 $532,000 -4.1% -4.1%Houses, Regional WA $348,000 $350,000 -0.6% -7.2%
Units/apartments, Perth $425,000 $410,000 3.7% -1.2%Units/apartments, Regional WA $273,500 $300,000 -8.8% -13.2%
All Dwellings, Perth $495,000 $515,000 -3.9% -4.1%All Dwellings, Regional WA $340,000 $350,000 -2.9% -8.1%
Land, Perth $295,000 $259,500 13.7% 13.2%Land, Regional WA $170,000 $178,000 -4.5% 0.0%
Buyer type 2 (% of total dwellings sold in WA)First home buyer 20.1%* 19.9% 0.2% pts -2.0% ptsTrade-up Buyers 63.4% 61.5% 1.9% pts -2.8% pts
Investor 16.5%* 18.6% -2.1% pts 4.8% pts
Sales 1
Houses, WA 5,206 7,617 -31.7% -34.8%Units/apartments, WA 1,011 1,372 -26.3% -30.9%
Total dwellings WA 6,217 8,989 -30.8% -34.2%Land, WA 899 2,256 -60.2% -69.3%
Average selling days residential property, Perth 69 67 2 days 5 daysSales to listings ratio, Perth 38.7% 62.1% -23.4% pts -26.2% pts
Properties for sale (end of qtr), Perth 14,164 14,134 0.2% -4.9%
Rental Market 3 Vacancy rate, Perth 6.6% 6.0% 0.6% pts 1.0% pts
Median weekly rent $370 $380 -2.6% -7.5%
Construction 4
Building approvals, all dwellings WA 5,219* 5,220 0.0% -26.5%
Finance 5
Home loan approvals, WA (includes refinancing) 20,239* 19,019 6.4% 7.9%
Interest Rates 6 (at quarters end)Official Cash Rate 1.50% 1.75% -0.25% pts -0.5% pts
Standard Variable Bank Home Loan Rate 5.25% 5.40% -0.15% pts -0.2% pts
Consumer Price Index 7
Perth 108.6 108.2 0.4% 0.5%Weighted Average - Eight Capital Cities 109.4 108.6 0.7% 1.3%
65
75
85
95
105
115
125
135
Jan-11M
ar-11M
ay-11Jul-11Sep-11N
ov-11Jan-12M
ar-12M
ay-12Jul-12Sep-12N
ov-12Jan-13M
ar-13M
ay-13Jul-13Sep-13N
ov-13Jan-14M
ar-14M
ay-14Jul-14Sep-14N
ov-14Jan-15M
ar-15M
ay-15Jul-15Sep-15N
ov-15Jan-16M
ar-16M
ay-16Jul-16Sep-16
Index (no.) Consumer Sentiment Index, Western Australia v National
Western Australia National
Source: Westpac-Melbourne Institute
Index WA National
Current month Sep-16 89.2 101.4
Previous month Aug-16 103.9 101.0
Previous year Sep-15 87.5 93.9
Five years ago Sep-11 108.0 96.9
Month Change -14.1% 0.4%
Year Change 1.9% 8.0%
SAMPLE

OV
ER
VIE
WP
ER
TH
RE
GIO
N
4 MARKET UPDATE | JUNE QUARTER 2016
Perth Housing and Land Market PERTH REGION
Multi-residential Dwelling Market The preliminary sales volumes for the multi-residential market for the September quarter are showing sales at 881, compared to a revised June 2016 quarterly figure of 1,203. At the time of publication of the June edition of Market Update, sales volumes were only at 878. This demonstrates a further lift in volumes of around 37 per cent. It can be expected that sales in the multi-residential market will also lift once figures are revised in the next quarter.
The drop off in sales continues to exist for the sixth quarter running and has been on an overall downward trend since the early part of 2013. Sales have decreased in all but one of the sub-regions for the September quarter, with the largest decline coming from the North West sub-region, down approximately 36 per cent against revised June 2016 quarter results.
As was the case until June 2015, the multi-residential median price moved in a tight band of $440-$450,000. However, between the quarters ending March 2016 and June 2016, median prices showed signs of decreasing. For the latest quarter ending September 2016, preliminary multi-residential median prices have lifted by approximately four
per cent to $425,000. The revised June 2016 quarter median is slightly higher at $410,000 from the initially reported $405,500.
The larger Central sub-region has seen median prices increase by around five per cent this quarter. However, the greatest change in multi-residential median prices has occurred in the South East sub-region where the median price has climbed from $247,000 in June 2016 to $285,500 (preliminary September 2016 quarter).
Housing Market A decline in sales activity can be seen within the overall Perth Metro Region as sales turnover has dropped by 32 per cent in the September 2016 quarter compared to revised turnover for the June 2016 quarter. The latest preliminary data continues to show sales volumes retracing further away from the fifteen year long-term average. It is important to note however, that settlements take time to come through, and whilst volumes are low for the September quarter, it can be observed that revised June 2016 quarter data show an increase of approximately 40 per cent in sales activity on preliminary figures.
Looking at the Perth monthly sales chart which uses reiwa.com data (reported sales by REIWA members), it can be seen that sales volumes are continuing to trend downwards on a monthly basis since February 2016. The reiwa.com monthly sales data provides a leading indicator on sales volumes given the nature of the data being reported rather than settled.
Preliminary house sales data shows that all of the sub-regions are lower at the end of the September quarter compared to the June 2016 quarter. The drop-off in volume figures as a whole may be explained by the general sentiment of consumers towards the local economy as well as a recent shift in population trends, with net interstate migration trends reversing and net overseas migration declining from the peaks experienced in 2013.
In the June 2016 Market Update report, the preliminary house median was reported at $520,000, which, as more settlements filtered through, has now been revised to $532,000 on a quarterly basis. The preliminary median house price for the quarter ending September 2016 is $510,000, and it is expected that this will lift as further house sales transactions settle. From a sub-regional perspective,
$425,000
$450,000
$475,000
$500,000
$525,000
$550,000
$575,000
$600,000
0
500
1000
1500
2000
2500
3000
3500
Sep-11 Sep-12 Sep-13 Sep-14 Sep-15 Sep-16
PERTH MONTHLY HOUSE SALES
House SalesMedian House Price
Source: reiwa.com (C)
all have experienced medians decreasing by between one and seven per cent on a quarterly basis. However, on an annual basis (which is more stable measure of the market), medians have fallen by varying amounts between 2.8 and 5.4 per cent.
SAMPLE
OV
ER
VIE
WP
ER
TH
RE
GIO
N
SEPTEMBER QUARTER 2016 | MARKET UPDATE 5
PERTH REGION Perth Housing and Land Market
Seller Sentiment - HousesIn the overall market for the Perth Metro region, the proportion of sellers discounting has decreased to 51.8 per cent during the September 2016 quarter, down 8.8 percentage points. However, when comparing to the same time last year, sellers’ discounting remains at similar levels. In terms of the size of the discount being offered in the market, for the Perth Metro region, on average sellers’ are discounting by 6.7 per cent, a marginal increase of 0.8 percentage points from the June 2016 quarter. This signals that there is still a strong level of competition in the market amongst sellers. In terms of the overall market sentiment for the September 2016 quarter, sentiment towards the market is still negative at the level of -4.0 per cent.
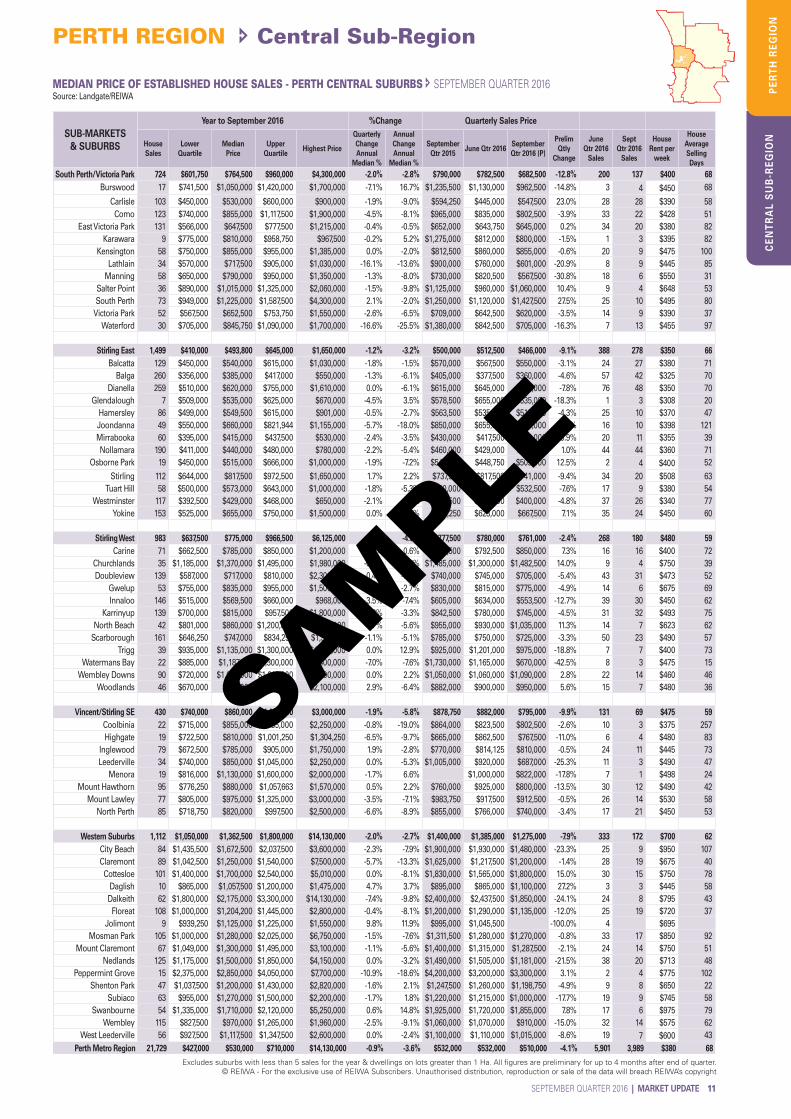
Listing Stock and Selling Days Total listings at the end of the September 2016 quarter were down to 14,170, a decrease of three per cent.
The Perth Metro region saw an increase in average selling days for houses, units and land (aggregated) at 68 days for the September 2016 quarter. Most sub-regions in the Perth Metro region saw an overall increase in average selling days over the quarter. However, on a positive note, the North East sub-region experienced a decrease of 3 days to sit at 69 days for the quarter.
0102030405060708090
100
02,0004,0006,0008,00010,00012,00014,00016,00018,00020,000
Sep-16Sep-14Sep-12Sep-10Sep-08Sep-06
AVE
RA
GE
SELL
ING
DA
YS
LIST
ING
S
Listings - PMRAve Selling Days
FHOGBOOST
PERTH METRO REGION Source: reiwa.com
BUYERS' MARKET
SELLERS'MARKET
SELLERS'MARKET
BUYERS' MARKET
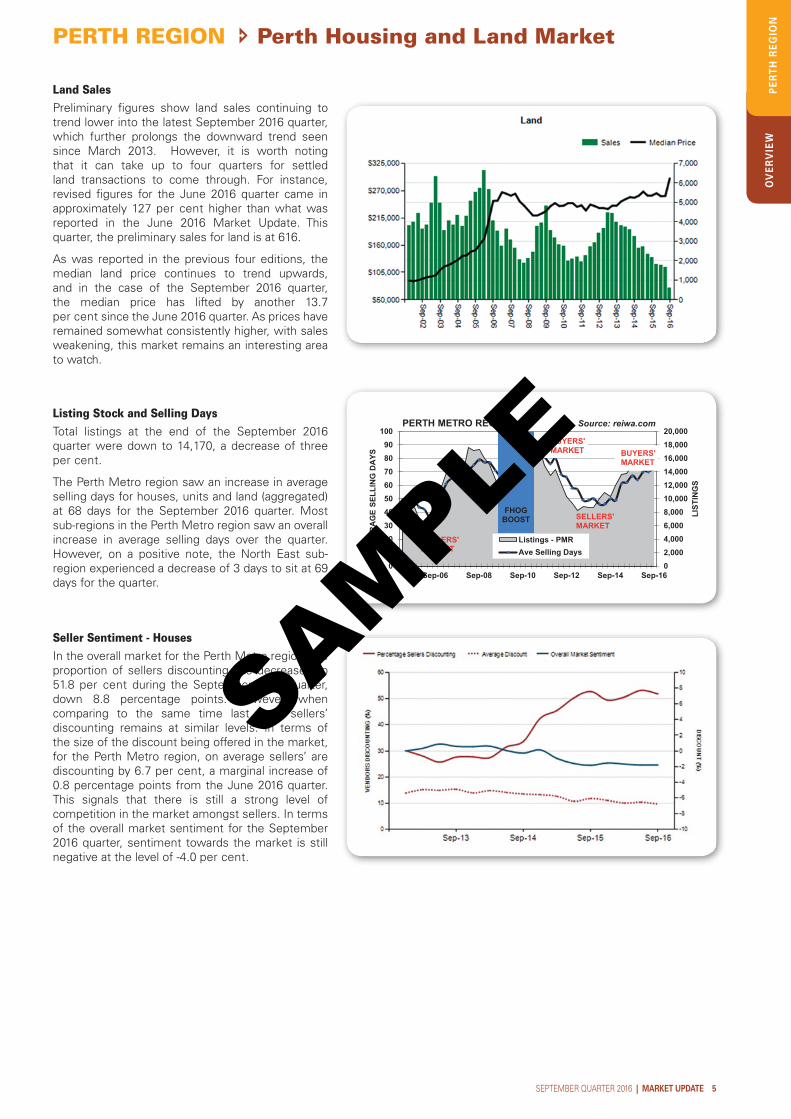
Land SalesPreliminary figures show land sales continuing to trend lower into the latest September 2016 quarter, which further prolongs the downward trend seen since March 2013. However, it is worth noting that it can take up to four quarters for settled land transactions to come through. For instance, revised figures for the June 2016 quarter came in approximately 127 per cent higher than what was reported in the June 2016 Market Update. This quarter, the preliminary sales for land is at 616.
As was reported in the previous four editions, the median land price continues to trend upwards, and in the case of the September 2016 quarter, the median price has lifted by another 13.7 per cent since the June 2016 quarter. As prices have remained somewhat consistently higher, with sales weakening, this market remains an interesting area to watch.
SAMPLE

OV
ER
VIE
WP
ER
TH
RE
GIO
N
Perth Overview PERTH REGION
6 MARKET UPDATE | JUNE QUARTER 2016
SUB-REGIONAL ANALYSISPERTH RESIDENTIAL MARKET YEAR TO SEPTEMBER 2016ANNUAL SALES, MEDIAN & QUARTILE PRICESSource: Landgate/REIWA
Data is for settled and pending sales data for the Year to June 2016 as at 24th October 2016 and may vary from other tables in this publication.Annual volumes are estimates based on 70% dwelling sales sample & 30-35% land sales sample for latest quarter. The Upper Quartile is the value of the bottom of the top 25% of the market - 25% of sales occurred above this price. The Median is the middle value of all sales placed in ascending order fom the cheapest to the most expensive. The Lower Quartile is the value of the top of the bottom 25% of the market - 25% of sales occurred below this price. 50% of sales fall within the values of the Upper and Lower Quartiles.
NORTH WEST
House Sales 4,292
Multi-Res Sales 214
Land Sales 1,257
Upper Quartile $650k $445k $340k
Median $520k $380k $258k
Lower Quartile $440k $340k $215k
Quarterly Change in Annual Median -1.0% -1.3% -0.8%
NORTH EAST
House Sales 2,555
Multi-Res Sales 130
Land Sales 1,031
Upper Quartile $554k $392k $294k
Median $460k $340k $247k
Lower Quartile $407k $310k $212k
Quarterly Change in Annual Median -1.1% n.c. -2.2%
PERTH METRO
House Sales 21,793
Multi-Res Sales 4,591
Land Sales 5,864
Upper Quartile $710k $565k $345k
Median $530k $425k $265k
Lower Quartile $427k $345k $215k
Quarterly Change in Annual Median -0.9% -0.7% 1.9%
CENTRAL
House Sales 8,861
Multi-Res Sales 3,758
Land Sales 932
Upper Quartile $940k $595k $635k
Median $681k $455k $460k
Lower Quartile $515k $365k $330k
Quarterly Change in Annual Median -1.3% n.c. 1.5%
SOUTH WEST
House Sales 3,400
Multi-Res Sales 382
Land Sales 1,441
Upper Quartile $535k $400k $310k
Median $445k $350k $243k
Lower Quartile $370k $270k $196k
Quarterly Change in Annual Median -1.1% 0.3% 1.3%
SOUTH EAST
House Sales 2,685
Multi-Res Sales 107
Land Sales 1,203
Upper Quartile $540k $345k $295k
Median $435k $300k $240k
Lower Quartile $360k $249k $205k
Quarterly Change in Annual Median -1.1% -3.2% n.c.
SAMPLE

OV
ER
VIE
WP
ER
TH
RE
GIO
N
PERTH REGION Perth Overview
SEPTEMBER QUARTER 2016 | MARKET UPDATE 7
PERTH METRO REGION
Year to June 2015
Year to June 2016
March Qtr 2016
June Qtr 2016
Sales% of total sales
Sales% of total sales
Sales% of total sales
Sales% of total sales
HOUSE
Up to $200,000 28 0.1% 49 0.2% 15 0.2% 20 0.5%
$200 - $300,000 562 1.8% 475 1.7% 201 3.3% 173 4.3%
$300 - $350,000 1472 4.6% 1204 4.4% 344 5.7% 266 6.6%
$350 - $400,000 2431 7.6% 2317 8.5% 614 10.2% 435 10.7%
$400 - $450,000 3718 11.7% 3521 12.9% 724 12.1% 574 14.2%
$450 - $500,000 3850 12.1% 3248 11.9% 684 11.4% 487 12.0%
$500 - $550,000 3608 11.3% 2857 10.5% 612 10.2% 426 10.5%
$550 - $600,000 3035 9.5% 2388 8.8% 481 8.0% 283 7.0%
$600 - $650,000 2339 7.3% 1854 6.8% 404 6.7% 259 6.4%
$650 - $700,000 1737 5.5% 1524 5.6% 296 4.9% 201 5.0%
$700 - $800,000 2592 8.1% 2268 8.3% 449 7.5% 303 7.5%
$800 - $900,000 1927 6.1% 1623 6.0% 336 5.6% 194 4.8%
$900 - $1 million 1123 3.5% 920 3.4% 169 2.8% 102 2.5%
$1 - $1.5 million 2251 7.1% 1998 7.3% 446 7.4% 233 5.8%
Over $1.5 million 1155 3.6% 965 3.5% 229 3.8% 94 2.3%
UNIT
Up to $200,000 62 0.8% 54 0.9% 31 2.6% 21 2.4%
$200 - $250,000 224 3.0% 220 3.7% 61 5.1% 40 4.5%
$250 - $300,000 511 6.7% 426 7.2% 102 8.5% 74 8.4%
$300 - $350,000 824 10.9% 768 13.0% 172 14.3% 106 12.0%
$350 - $400,000 1039 13.7% 813 13.7% 204 17.0% 126 14.3%
$400 - $450,000 1123 14.8% 931 15.7% 144 12.0% 129 14.6%
$450 - $500,000 867 11.4% 605 10.2% 109 9.1% 78 8.9%
$500 - $550,000 708 9.3% 484 8.2% 87 7.2% 69 7.8%
$550 - $600,000 556 7.3% 352 5.9% 62 5.2% 56 6.4%
$600 - $700,000 672 8.9% 506 8.5% 84 7.0% 70 7.9%
$700 - $850,000 473 6.2% 329 5.6% 55 4.6% 56 6.4%
$850 - $1 million 207 2.7% 159 2.7% 29 2.4% 21 2.4%
Over $1 million 313 4.1% 276 4.7% 63 5.2% 35 4.0%
VACANT LAND
Up to $150,000 433 3.0% 138 1.4% 41 2.4% 16 2.6%
$150 - $175,000 1033 7.2% 496 5.0% 101 6.0% 25 4.0%
$175 - $200,000 1606 11.2% 1049 10.6% 219 13.0% 61 9.8%
$200 - $225,000 1948 13.5% 1344 13.5% 206 12.2% 59 9.5%
$225 - $250,000 2006 13.9% 1237 12.5% 211 12.5% 56 9.0%
$250 - $275,000 1525 10.6% 1223 12.3% 172 10.2% 49 7.9%
$275 - $300,000 1280 8.9% 1056 10.6% 154 9.2% 66 10.6%
$300 - $350,000 1666 11.6% 1345 13.6% 194 11.5% 74 11.9%
$350 - $400,000 952 6.6% 652 6.6% 95 5.6% 55 8.8%
$400 - $500,000 871 6.1% 502 5.1% 110 6.5% 65 10.4%
$500 - $750,000 728 5.1% 629 6.3% 120 7.1% 73 11.7%
$750 - $1 million 158 1.1% 128 1.3% 22 1.3% 15 2.4%
Over $1 million 185 1.3% 120 1.2% 38 2.3% 10 1.6%
Analysis includes all sales transactions including houses and land on lots > 1 Ha
RESIDENTIAL REAL ESTATE SALES BY PRICE RANGE SEPTEMBER QUARTER 2016Source : Landgate/REIWA
Housing MarketThe preliminary median house price for the September 2016 quarter is $510,000, with the majority of house sales for the quarter sitting within the price range of $400-$500,000. In comparison to the June 2016 quarter, the percentage of transactions within the higher price ranges of $800,000 to greater than $1.5 million are at lower levels for the latest quarter. The $550-$650,000 price range also observed a marginal decline in percentage of sales transactions in comparison to the June 2016 quarter. On the other hand, a greater number of transactions are evident in the lower priced market ($200-$550,000).The higher transactions at the lower end of the market explains the decline of 4.1 per cent in the preliminary median house price for the September quarter.
Land Sales There continues to be a clear positive shift in the percentage of land sales between the $275,000 - $1 Million price ranges. The chart also indicates softening in most of the markets below $275,000. The shift in sales towards the higher end of the market explains the 13.7 per cent increase in the preliminary median land price for the September 2016 quarter.
Multi-residential MarketThe preliminary median unit price is $425,000 for the latest quarter ending September 2016. During this latest quarter, the $400-$450,000 price range saw the most action in terms of sales. On the other hand, during the June 2016 quarter, most sales occurred within the $350-$400,000 price range. The higher end of the market ($500-850,000) also recorded an increase in percentage sales activity in comparison to the June 2016 quarter. In contrast, the lower end of the market below $400,000 recorded a decrease in percentage sales activity in the September 2016 quarter compared to the June 2016 quarter. This explains the improvement of 3.6 per cent in the preliminary median unit price for the September 2016 quarter.SAMPLE

CE
NT
RA
L S
UB
-RE
GIO
N
8 MARKET UPDATE | SEPTEMBER QUARTER 2016
Central Sub-Region PERTH REGIONP
ER
TH
RE
GIO
N
Housing MarketPreliminary data for the September 2016 quarter, show early indications the volume of house sales in the Central sub-region is down by approximately 34 per cent in comparison to the previous quarter. Whilst this decline is more than the June 2016 quarter, REIWA expects revised September quarter data to lift in coming months as more transactions settle. The preliminary figures shows sub-markets including Western Suburbs (down 48 per cent), Vincent/Stirling SE (down 47 per cent), Belmont (down 41 per cent), Stirling West (down 33 per cent), Fremantle (down 32 per cent) and South Perth/Victoria Park (down 32 per cent), all experienced falls in the number of sales by greater than 30 per cent for the September quarter.
Preliminary data has the overall Central sub-region quarterly median for the September quarter down by 6.5 per cent to $645,000 over the revised June quarter median of $690,000. At a sub-market level, the preliminary medians were mixed across the board with drops ranging from -1.9 per cent in Bassendean/Bayswater to -12.8 per cent in South Perth/Victoria Park. The better performing sub-market included: Canning (-0.5 per cent), Stirling West (-2.4 per cent), Belmont (-3.0 per cent) and Melville (-3.9 per cent).
In terms of the change in annual medians, all sub-markets in the Central sub-region have recorded a negative change, with drops recorded from -2.7 per cent in the Western Suburbs to -12.8 per cent in Perth City sub-market. There are a few suburbs in the sub-region that shone a positive light including: Burswood (+16.7 per cent), Swanbourne (+14.8 per cent) and Trigg (+12.9 per cent).
$350,000
$400,000
$450,000
$500,000
$550,000
$600,000
$650,000
$700,000
$750,000
500
1,000
1,500
2,000
2,500
3,000
3,500
4,000
4,500
Sep-16Sep-15Sep-14Sep-13Sep-12Sep-11
HOUSE SALES - CENTRALHOUSE MEDIAN - CENTRALPMR HOUSE MEDIAN
Source: Landgate/REIWAPERTH CENTRAL SUB-REGION
10 Year Ave
$200,000
$300,000
$400,000
$500,000
$600,000
$700,000
500
1,000
1,500
2,000
2,500
3,000
Sep-16Sep-15Sep-14Sep-13Sep-12Sep-11
HOUSE SALES - MIDDLEHOUSE MEDIAN - MIDDLEPMR HOUSE MEDIAN
Source: Landgate/REIWAPERTH MIDDLE SUB-REGION
10 Year Ave
$0
$200,000
$400,000
$600,000
$800,000
$1,000,000
$1,200,000
0
200
400
600
800
1,000
1,200
Sep-16Sep-15Sep-14Sep-13Sep-12Sep-11
HOUSE SALES - INNERHOUSE MEDIAN - INNERPMR HOUSE MEDIAN
Source: Landgate/REIWAPERTH INNER SUB-REGION
10 Year Ave
TOP 10 SUBURBS BY QUARTERLY CHANGE IN PRICE Source: Landgate/REIWA
CENTRAL
Year to September 2016 Quarterly Change
in Annual Median %
House Sales
Median Price Highest Price
Riverton 64 $690,000 $1,900,000 8.9%
Attadale 74 $1,066,250 $4,130,000 7.4%
Bentley 51 $550,000 $750,000 5.3%
East Cannington 67 $520,000 $980,000 4.0%
Alfred Cove 44 $884,000 $1,730,000 3.5%
Woodlands 46 $875,000 $2,100,000 2.9%
Fremantle 62 $846,500 $2,050,000 2.9%
Wilson 81 $550,000 $988,000 2.8%
South Perth 73 $1,225,000 $4,300,000 2.1%
Ascot 31 $770,000 $1,850,000 2.0%
Excludes suburbs with less than 30 sales for the year & dwellings on lots greater than 1 Ha.
The suburbs with the greatest decline in annual change in annual medians include: O’Connor (-28.0 per cent), Waterford (-25.5 per cent), Coolbinia (-19.0 per cent) and Joondanna (-18.0 per cent).
The top three performing suburbs based on quarterly change in annual median include: Riverton (+8.9 per cent) with a median of $690,000, Attadale (+7.4 per cent) with a median of $1,066,250 and Bentley (+5.3 per cent) with a median of $550,000.
SAMPLE

SEPTEMBER QUARTER 2016 | MARKET UPDATE 9
PERTH REGION Central Sub-Region
CE
NT
RA
L S
UB
-RE
GIO
NP
ER
TH
RE
GIO
N
Listing Stock and Selling DaysThe overall stock of house listings in the Central sub-region declined in the September 2016 quarter by 2.1 per cent to 2,573. The middle sub-region contributed the most to the drop in house listings, decreasing by 2.3 per cent over the quarter. The Perth Metro region also saw a decline in house listings but by a smaller magnitude of 0.6 per cent for the quarter.
Average selling days for houses increased in the Central sub-region by three days to 63 days for the quarter and is seven days higher than last year. The only sub-market to record a reduction in average selling days was Canning which now only takes 53 days to sell a house. The Perth Metro Region saw an increase in days on market to 68 days for the quarter.
STOCK OF HOUSE LISTINGS & SELLING DAYS SEPTEMBER QUARTER 2016
SUB-MARKETS & SUBURBSListings at Sept
Quarter 2016House Listings
Quarterly Change
Annual Change
Average Selling Days (p)
Quarterly Change
Annual Change
Inner 1,971 728 -1.5% -13.9% 62 0 2Fremantle 261 121 -6.2% -14.8% 61 -12 5Perth City 473 41 5.1% -10.9% 42 -36 -29
South Perth/Victoria Park 573 257 2.8% -3.0% 68 2 4Vincent 146 51 24.4% -1.9% 53 -2 3
Western Suburbs 518 258 -7.9% -24.3% 62 7 3Middle 3,304 1,845 -2.3% -1.0% 64 4 9
Bassendean/Bayswater 523 297 -2.3% -7.8% 61 3 13Belmont 358 149 -15.3% -5.1% 70 11 12Canning 446 289 -2.7% 5.5% 53 -6 6Melville 558 399 -4.3% -5.9% 73 9 13
Stirling East 821 440 10.0% 7.8% 66 4 6Stirling SE 132 60 7.1% -14.3% 68 3 10Stirling West 466 211 -11.3% 1.0% 59 7 3
Central Sub-Region 5,275 2,573 -2.1% -5.1% 63 3 7Perth Metro Region 14,170 8,649 -0.6% -6.5% 68 3 5
Source: reiwa.com
SUBMARKETS
September Quarter 2016 June Quarter 2016 September Quarter 2015Overall Market
Variance Listing vs Sold
Price
Proportion of Vendors
Discounting
Listing & Sold Price Variance for Discounting
Vendors
Overall Market Variance
Listing vs Sold Price
Proportion of Vendors
Discounting
Listing & Sold Price Variance
for Discounting Vendors
Overall Market Variance
Listing vs Sold Price
Proportion of Vendors
Discounting
Listing & Sold Price Variance for Discounting
Vendors
Central Sub-Region -4.5% 45.3% -7.2% -4.8% 34.8% -7.8% -4.0% 49.0% -6.6%Bassendean/Bayswater -3.5% 53.8% -6.4% -3.6% 58.9% -6.4% -4.0% 46.3% -5.6%
Belmont -4.0% 47.0% -7.4% -3.2% 49.2% -6.0% -4.9% 44.7% -8.3%Canning -3.7% 51.9% -6.2% -4.3% 56.0% -6.7% -3.6% 48.4% -5.5%
Fremantle -3.1% 41.1% -6.0% -3.6% 47.0% -7.3% -3.9% 38.5% -4.5%Melville -4.6% 50.8% -7.9% -5.2% 58.9% -7.2% -3.9% 56.7% -5.9%
Perth City -4.2% 30.0% -4.7% -6.6% 34.8% -10.5% -4.1% 73.9% -5.0%South Perth/Victoria Park -4.6% 39.2% -7.4% -4.5% 47.3% -8.4% -4.1% 51.1% -7.9%
Stirling East -3.6% 51.6% -7.0% -3.6% 52.9% -6.8% -3.6% 56.1% -6.2%Stirling West -3.8% 42.9% -5.5% -4.5% 34.8% -6.5% -3.5% 42.0% -5.7%
Vincent/Stirling SE -3.7% 34.0% -6.0% -3.9% 52.2% -5.6% -4.1% 48.0% -7.4%Western Suburbs -6.5% 33.5% -9.0% -4.8% 34.8% -7.8% -4.9% 44.2% -8.4%Perth Metro Region -4.0% 51.8% -6.7% -3.1% 60.6% -5.9% -3.6% 52.7% -6.1%
SELLER SENTIMENT: HOUSES SEPTEMBER QUARTER 2016 Source: reiwa.com
Seller Sentiment - HousesThe proportion of sellers discounting in the Central sub-region house market has increased again in the September quarter with 45.3 per cent of sellers discounting compared to 34.8 per cent in June quarter (revised) 2016. The sub-markets with the most sellers discounting in the September quarter are Bassendean/Bayswater at 53.8 per cent and Canning at 51.9 per cent. In the Perth Metro Region, the number of sellers discounting has declined to 51.8 per cent from 60.6 per cent (revised) June quarter 2016.
The discount offered by sellers in the Central sub-region is 7.2 per cent for the September quarter, declining from 7.8 per cent in the June 2016 quarter. So whilst there has been an increase in the proportion of sellers discounting, the discount offered has reduced. This may signal, sellers are meeting the market at the time of listing and not having to adjust their prices significantly in order to sell.
SAMPLE

CE
NT
RA
L S
UB
-RE
GIO
N
10 MARKET UPDATE | SEPTEMBER QUARTER 2016
Central Sub-Region PERTH REGIONP
ER
TH
RE
GIO
N
MEDIAN PRICE OF ESTABLISHED HOUSE SALES - PERTH CENTRAL SUBURBS SEPTEMBER QUARTER 2016Source: Landgate/REIWA
SUB-MARKETS& SUBURBS
Year to September 2016 %Change Quarterly Sales Price
House Sales
Lower Quartile
Median Price
Upper Quartile
Highest Price
Quarterly Change Annual
Median %
Annual Change Annual
Median %
September Qtr 2015
June Qtr 2016 September Qtr 2016 (P)
Prelim Qtly
Change
June Qtr 2016
Sales
Sept Qtr 2016
Sales
House Rent per
week
House Average Selling Days
Central Sub-Region 8,835 $515,000 $681,000 $940,000 $14,130,000 -1.3% -5.4% $685,000 $690,000 $645,000 -6.5% 2,429 1,598 $420 63Bassendean/Bayswater 1,010 $480,000 $550,000 $640,000 $2,550,000 -1.5% -8.3% $589,404 $550,000 $539,500 -1.9% 284 192 $395 61
Ashfield 18 $480,000 $500,000 $547,000 $850,000 0.0% 0.0% $526,250 $536,000 $530,000 -1.1% 8 3 $320 19Bassendean 160 $460,000 $515,000 $595,000 $1,500,000 -2.7% -11.2% $580,000 $490,000 $535,000 9.2% 36 25 $380 43
Bayswater 203 $529,500 $600,000 $680,000 $1,245,000 -3.2% -6.3% $670,000 $597,500 $560,000 -6.3% 66 37 $420 55Bedford 70 $530,000 $636,000 $750,000 $1,050,000 -0.2% -2.9% $629,500 $662,500 $579,995 -12.5% 16 14 $370 57
Eden Hill 40 $400,000 $434,750 $485,000 $736,500 -1.2% -8.5% $479,500 $428,750 $450,000 5.0% 12 9 $380 67Embleton 56 $447,500 $506,250 $555,000 $670,000 -0.3% -10.4% $508,000 $520,000 $527,500 1.4% 15 12 $400 61Maylands 95 $548,500 $652,500 $775,000 $2,550,000 -3.2% -6.8% $673,000 $702,500 $601,000 -14.4% 26 17 $400 52
Morley 293 $464,500 $522,500 $580,000 $780,000 -1.4% -6.7% $535,000 $532,500 $520,000 -2.3% 88 59 $390 80Noranda 75 $507,500 $590,000 $638,250 $765,000 -2.5% -6.3% $615,000 $580,000 $560,000 -3.4% 17 16 $420 44
Belmont 501 $440,000 $507,000 $615,000 $1,850,000 -2.5% -7.8% $541,000 $495,000 $480,000 -3.0% 151 89 $360 70Ascot 31 $519,000 $770,000 $930,000 $1,850,000 2.0% -4.3% $695,000 $816,550 $770,000 -5.7% 8 5 $418 79
Belmont 83 $423,500 $485,000 $595,000 $1,008,000 -2.0% -9.3% $519,000 $445,000 $473,750 6.5% 21 14 $360 55Cloverdale 122 $438,000 $480,000 $540,000 $980,000 -3.7% -7.7% $507,500 $496,000 $455,000 -8.3% 38 31 $350 82
Kewdale 90 $455,000 $510,000 $600,000 $950,000 1.0% 1.6% $501,250 $532,000 $506,250 -4.8% 29 14 $360 53Redcliffe 87 $380,000 $473,500 $592,500 $990,000 -5.3% -5.3% $540,000 $423,750 $455,000 7.4% 26 11 $348 79
Rivervale 88 $500,000 $592,500 $668,000 $1,352,500 0.4% -3.7% $561,500 $559,000 $590,000 5.5% 29 14 $397 66
Canning 944 $455,000 $550,000 $692,500 $2,900,000 -0.5% -3.9% $563,000 $552,500 $550,000 -0.5% 256 181 $380 53Bentley 51 $472,750 $550,000 $617,500 $750,000 5.3% 3.3% $498,000 $585,000 $505,000 -13.7% 10 13 $375 62
Cannington 58 $390,000 $430,000 $486,000 $975,000 -1.1% -10.4% $460,000 $430,000 $429,000 -0.2% 21 9 $350 48East Cannington 67 $432,500 $520,000 $610,000 $980,000 4.0% 1.5% $463,000 $511,000 $455,000 -11.0% 18 18 $380 55
Ferndale 54 $420,000 $465,000 $520,000 $625,000 -2.1% -3.9% $500,000 $490,000 $475,000 -3.1% 18 11 $325 45Lynwood 58 $420,000 $450,000 $470,000 $520,000 -0.4% -8.3% $470,000 $450,000 $432,500 -3.9% 17 12 $360 43
Parkwood 70 $400,000 $480,000 $562,000 $760,000 -4.2% -5.9% $524,500 $515,000 $472,500 -8.3% 20 12 $380 47Queens Park 84 $434,500 $467,500 $532,500 $1,100,000 1.0% -2.5% $455,000 $468,000 $489,000 4.5% 21 12 $373 44
Riverton 64 $555,000 $690,000 $778,000 $1,900,000 8.9% 1.8% $618,500 $652,000 $702,500 7.7% 19 14 $370 59Rossmoyne 31 $893,500 $1,140,000 $1,311,500 $2,900,000 -0.5% 0.4% $1,110,000 $1,305,000 $980,000 -24.9% 7 7 $475 53
Shelley 41 $630,000 $825,000 $1,002,500 $2,850,000 -5.5% -4.1% $885,000 $845,000 $704,500 -16.6% 13 10 $390 57St James 74 $455,000 $537,500 $620,000 $1,300,000 -3.2% -9.8% $610,000 $517,500 $535,000 3.4% 17 11 $375 70Willetton 211 $623,700 $700,000 $781,500 $1,180,000 0.0% -4.1% $710,000 $661,000 $739,444 11.9% 57 34 $420 50
Wilson 81 $440,000 $550,000 $640,500 $988,000 2.8% -5.6% $530,000 $612,500 $543,000 -11.3% 18 18 $383 57Fremantle 398 $584,000 $742,500 $1,000,000 $3,070,000 -1.0% -7.2% $760,000 $727,500 $697,500 -4.1% 114 78 $495 61
Beaconsfield 75 $620,000 $705,000 $838,500 $1,600,000 -2.1% -8.4% $795,000 $727,500 $700,000 -3.8% 24 16 $425 57East Fremantle 68 $821,500 $1,085,000 $1,385,000 $3,070,000 -5.7% -10.5% $1,220,000 $1,120,000 $1,060,000 -5.4% 16 13 $563 68
Fremantle 62 $675,000 $846,500 $950,000 $2,050,000 2.9% 5.5% $786,250 $847,500 $787,500 -7.1% 18 8 $495 69Hilton 71 $510,000 $549,500 $605,000 $770,000 -0.1% -4.4% $560,000 $535,000 $541,500 1.2% 23 16 $350 76
North Fremantle 25 $789,500 $975,000 $1,362,500 $2,600,000 0.8% -4.9% $750,000 $960,000 $960,000 0.0% 7 1 $650 59O'Connor 5 $460,000 $475,000 $582,500 $615,000 -7.3% -28.0% $397,500 1 $335 214
Samson 15 $503,500 $566,000 $647,500 $715,000 -8.7% -16.1% $690,500 $620,000 $560,000 -9.7% 3 4 20South Fremantle 38 $780,000 $1,035,000 $1,290,000 $1,750,000 -0.5% 3.9% $1,150,000 $1,045,000 $1,015,000 -2.9% 12 8 $560 57
White Gum Valley 39 $625,000 $700,000 $830,000 $1,200,000 -1.4% -3.4% $702,500 $725,000 $675,000 -6.9% 11 11 $550 33
Melville 1,182 $640,000 $780,000 $995,000 $6,800,000 0.0% -4.3% $760,000 $775,000 $745,000 -3.9% 291 211 $450 73Alfred Cove 44 $675,000 $884,000 $1,075,000 $1,730,000 3.5% 4.0% $712,500 $675,000 $675,000 0.0% 9 5 $600 55Applecross 79 $1,020,000 $1,490,000 $2,137,500 $6,800,000 -0.7% 7.2% $1,407,500 $1,175,000 $1,265,000 7.7% 16 16 $597 102
Ardross 77 $802,000 $960,000 $1,232,500 $2,075,000 -8.6% -0.7% $1,132,500 $1,070,000 $900,000 -15.9% 17 14 $535 70Attadale 74 $772,500 $1,066,250 $1,384,000 $4,130,000 7.4% 4.0% $850,000 $980,000 $1,195,000 21.9% 21 7 $550 69
Bateman 35 $710,000 $778,000 $826,500 $1,270,000 0.0% -4.6% $750,000 $740,000 $710,000 -4.1% 9 5 $450 39Bicton 56 $725,000 $915,000 $1,412,500 $3,500,000 -3.7% -8.3% $965,500 $952,500 $807,500 -15.2% 14 6 $398 49
Booragoon 80 $747,500 $880,500 $988,000 $1,600,000 1.8% 0.5% $807,500 $895,000 $875,000 -2.2% 28 15 $495 37Brentwood 16 $559,500 $684,500 $886,000 $1,200,000 -0.8% 2.9% $650,000 $780,000 $620,000 -20.5% 4 3 $373 28Bull Creek 65 $645,000 $750,000 $870,000 $1,450,000 0.0% -0.7% $683,000 $760,000 $685,500 -9.8% 13 12 $400 70Kardinya 95 $582,500 $653,000 $733,500 $1,200,000 0.2% -4.1% $589,000 $670,000 $607,500 -9.3% 21 20 $400 73Leeming 110 $620,000 $699,000 $780,000 $1,125,000 -0.1% -6.0% $710,000 $722,500 $738,000 2.1% 24 27 $425 85Melville 90 $690,000 $785,000 $900,000 $2,500,000 0.0% -1.9% $760,000 $785,000 $770,000 -1.9% 27 13 $470 85
Mount Pleasant 74 $855,000 $1,128,250 $1,700,000 $5,500,000 -2.7% -1.0% $1,195,000 $1,172,000 $1,110,000 -5.3% 18 15 $480 110Murdoch 24 $649,000 $765,000 $802,500 $950,000 0.0% -0.6% $655,000 $765,000 $760,000 -0.7% 9 5 $290 78
Myaree 26 $635,000 $684,250 $770,000 $1,125,000 -4.4% -9.4% $740,000 $680,000 $640,000 -5.9% 5 5 $438 27Palmyra 102 $545,000 $660,000 $795,000 $1,200,000 -7.0% -7.7% $702,500 $703,500 $650,000 -7.6% 22 21 $405 57Willagee 82 $500,000 $560,000 $630,000 $870,000 -1.5% -8.2% $586,250 $555,000 $548,000 -1.3% 20 13 $380 66
Winthrop 53 $781,500 $850,000 $1,007,500 $1,900,000 0.0% -2.0% $827,500 $865,000 $800,000 -7.5% 14 9 $565 105
Perth City 52 $660,000 $806,250 $980,000 $2,665,000 3.7% -12.8% $770,000 $632,000 $830,000 31.3% 13 11 $438 42East Perth 10 $1,100,000 $1,395,000 $1,800,000 $2,665,000 8.6% 3.7% $1,175,000 $1,800,000 3 $450 41
Perth 30 $665,000 $777,500 $880,000 $1,090,000 1.6% -12.6% $855,000 $710,000 $830,000 16.9% 9 7 $450 40West Perth 12 $538,500 $696,500 $847,500 $1,075,000 1.2% -4.3% $707,000 $538,500 $725,000 34.6% 4 1 $410 15
SAMPLE
SEPTEMBER QUARTER 2016 | MARKET UPDATE 11
PERTH REGION Central Sub-Region
CE
NT
RA
L S
UB
-RE
GIO
NP
ER
TH
RE
GIO
N
MEDIAN PRICE OF ESTABLISHED HOUSE SALES - PERTH CENTRAL SUBURBS SEPTEMBER QUARTER 2016Source: Landgate/REIWA
Excludes suburbs with less than 5 sales for the year & dwellings on lots greater than 1 Ha. All figures are preliminary for up to 4 months after end of quarter.© REIWA - For the exclusive use of REIWA Subscribers. Unauthorised distribution, reproduction or sale of the data will breach REIWA’s copyright
SUB-MARKETS& SUBURBS
Year to September 2016 %Change Quarterly Sales Price
House Sales
Lower Quartile
Median Price
Upper Quartile
Highest Price
Quarterly Change Annual
Median %
Annual Change Annual
Median %
September Qtr 2015
June Qtr 2016 September Qtr 2016 (P)
Prelim Qtly
Change
June Qtr 2016
Sales
Sept Qtr 2016
Sales
House Rent per
week
House Average Selling Days
South Perth/Victoria Park 724 $601,750 $764,500 $960,000 $4,300,000 -2.0% -2.8% $790,000 $782,500 $682,500 -12.8% 200 137 $400 68Burswood 17 $741,500 $1,050,000 $1,420,000 $1,700,000 -7.1% 16.7% $1,235,500 $1,130,000 $962,500 -14.8% 3 4 $450 68
Carlisle 103 $450,000 $530,000 $600,000 $900,000 -1.9% -9.0% $594,250 $445,000 $547,500 23.0% 28 28 $390 58Como 123 $740,000 $855,000 $1,117,500 $1,900,000 -4.5% -8.1% $965,000 $835,000 $802,500 -3.9% 33 22 $428 51
East Victoria Park 131 $566,000 $647,500 $777,500 $1,215,000 -0.4% -0.5% $652,000 $643,750 $645,000 0.2% 34 20 $380 82Karawara 9 $775,000 $810,000 $958,750 $967,500 -0.2% 5.2% $1,275,000 $812,000 $800,000 -1.5% 1 3 $395 82
Kensington 58 $750,000 $855,000 $955,000 $1,385,000 0.0% -2.0% $812,500 $860,000 $855,000 -0.6% 20 9 $475 100Lathlain 34 $570,000 $717,500 $905,000 $1,030,000 -16.1% -13.6% $900,000 $760,000 $601,000 -20.9% 8 9 $445 85
Manning 58 $650,000 $790,000 $950,000 $1,350,000 -1.3% -8.0% $730,000 $820,500 $567,500 -30.8% 18 6 $550 31Salter Point 36 $890,000 $1,015,000 $1,325,000 $2,060,000 -1.5% -9.8% $1,125,000 $960,000 $1,060,000 10.4% 9 4 $648 53South Perth 73 $949,000 $1,225,000 $1,587,500 $4,300,000 2.1% -2.0% $1,250,000 $1,120,000 $1,427,500 27.5% 25 10 $495 80
Victoria Park 52 $567,500 $652,500 $753,750 $1,550,000 -2.6% -6.5% $709,000 $642,500 $620,000 -3.5% 14 9 $390 37Waterford 30 $705,000 $845,750 $1,090,000 $1,700,000 -16.6% -25.5% $1,380,000 $842,500 $705,000 -16.3% 7 13 $455 97
Stirling East 1,499 $410,000 $493,800 $645,000 $1,650,000 -1.2% -3.2% $500,000 $512,500 $466,000 -9.1% 388 278 $350 66Balcatta 129 $450,000 $540,000 $615,000 $1,030,000 -1.8% -1.5% $570,000 $567,500 $550,000 -3.1% 24 27 $380 71
Balga 260 $356,000 $385,000 $417,000 $550,000 -1.3% -6.1% $405,000 $377,500 $360,000 -4.6% 57 42 $325 70Dianella 259 $510,000 $620,000 $755,000 $1,610,000 0.0% -6.1% $615,000 $645,000 $595,000 -7.8% 76 48 $350 70
Glendalough 7 $509,000 $535,000 $625,000 $670,000 -4.5% 3.5% $578,500 $655,000 $535,000 -18.3% 1 3 $308 20Hamersley 86 $499,000 $549,500 $615,000 $901,000 -0.5% -2.7% $563,500 $535,000 $512,000 -4.3% 25 10 $370 47Joondanna 49 $550,000 $660,000 $821,944 $1,155,000 -5.7% -18.0% $850,000 $655,000 $535,000 -18.3% 16 10 $398 121Mirrabooka 60 $395,000 $415,000 $437,500 $530,000 -2.4% -3.5% $430,000 $417,500 $372,000 -10.9% 20 11 $355 39Nollamara 190 $411,000 $440,000 $480,000 $780,000 -2.2% -5.4% $460,000 $429,000 $433,194 1.0% 44 44 $360 71
Osborne Park 19 $450,000 $515,000 $666,000 $1,000,000 -1.9% -7.2% $546,000 $448,750 $505,000 12.5% 2 4 $400 52Stirling 112 $644,000 $817,500 $972,500 $1,650,000 1.7% 2.2% $737,500 $817,500 $741,000 -9.4% 34 20 $508 63
Tuart Hill 58 $500,000 $573,000 $643,000 $1,000,000 -1.8% -5.3% $620,000 $576,000 $532,500 -7.6% 17 9 $380 54Westminster 117 $392,500 $429,000 $468,000 $650,000 -2.1% -4.2% $454,500 $420,000 $400,000 -4.8% 37 26 $340 77
Yokine 153 $525,000 $655,000 $750,000 $1,500,000 0.0% -2.7% $716,250 $623,000 $667,500 7.1% 35 24 $450 60
Stirling West 983 $637,500 $775,000 $966,500 $6,125,000 -0.6% -4.6% $777,500 $780,000 $761,000 -2.4% 268 180 $480 59Carine 71 $662,500 $785,000 $850,000 $1,200,000 1.0% 0.6% $827,500 $792,500 $850,000 7.3% 16 16 $400 72
Churchlands 35 $1,185,000 $1,370,000 $1,495,000 $1,980,000 -0.9% 3.8% $1,485,000 $1,300,000 $1,482,500 14.0% 9 4 $750 39Doubleview 139 $587,000 $717,000 $810,000 $2,300,000 -0.4% -6.9% $740,000 $745,000 $705,000 -5.4% 43 31 $473 52
Gwelup 53 $755,000 $835,000 $955,000 $1,500,000 0.0% -2.7% $830,000 $815,000 $775,000 -4.9% 14 6 $675 69Innaloo 146 $515,000 $569,500 $660,000 $968,000 -3.5% -7.4% $605,000 $634,000 $553,500 -12.7% 39 30 $450 62
Karrinyup 139 $700,000 $815,000 $957,500 $1,800,000 -1.2% -3.3% $842,500 $780,000 $745,000 -4.5% 31 32 $493 75North Beach 42 $801,000 $860,000 $1,200,000 $6,125,000 -1.7% -5.6% $955,000 $930,000 $1,035,000 11.3% 14 7 $623 62
Scarborough 161 $646,250 $747,000 $834,250 $1,927,000 -1.1% -5.1% $785,000 $750,000 $725,000 -3.3% 50 23 $490 57Trigg 39 $935,000 $1,135,000 $1,300,000 $4,575,000 0.0% 12.9% $925,000 $1,201,000 $975,000 -18.8% 7 7 $400 73
Watermans Bay 22 $885,000 $1,187,500 $1,300,000 $2,400,000 -7.0% -7.6% $1,730,000 $1,165,000 $670,000 -42.5% 8 3 $475 15Wembley Downs 90 $720,000 $1,042,000 $1,210,000 $1,800,000 0.0% 2.2% $1,050,000 $1,060,000 $1,090,000 2.8% 22 14 $460 46
Woodlands 46 $670,000 $875,000 $1,140,000 $2,100,000 2.9% -6.4% $882,000 $900,000 $950,000 5.6% 15 7 $480 36
Vincent/Stirling SE 430 $740,000 $860,000 $1,081,000 $3,000,000 -1.9% -5.8% $878,750 $882,000 $795,000 -9.9% 131 69 $475 59Coolbinia 22 $715,000 $855,000 $1,185,000 $2,250,000 -0.8% -19.0% $864,000 $823,500 $802,500 -2.6% 10 3 $375 257Highgate 19 $722,500 $810,000 $1,001,250 $1,304,250 -6.5% -9.7% $665,000 $862,500 $767,500 -11.0% 6 4 $480 83
Inglewood 79 $672,500 $785,000 $905,000 $1,750,000 1.9% -2.8% $770,000 $814,125 $810,000 -0.5% 24 11 $445 73Leederville 34 $740,000 $850,000 $1,045,000 $2,250,000 0.0% -5.3% $1,005,000 $920,000 $687,000 -25.3% 11 3 $490 47
Menora 19 $816,000 $1,130,000 $1,600,000 $2,000,000 -1.7% 6.6% $1,000,000 $822,000 -17.8% 7 1 $498 24Mount Hawthorn 95 $776,250 $880,000 $1,057,663 $1,570,000 0.5% 2.2% $760,000 $925,000 $800,000 -13.5% 30 12 $490 42
Mount Lawley 77 $805,000 $975,000 $1,325,000 $3,000,000 -3.5% -7.1% $983,750 $917,500 $912,500 -0.5% 26 14 $530 58North Perth 85 $718,750 $820,000 $997,500 $2,500,000 -6.6% -8.9% $855,000 $766,000 $740,000 -3.4% 17 21 $450 53
Western Suburbs 1,112 $1,050,000 $1,362,500 $1,800,000 $14,130,000 -2.0% -2.7% $1,400,000 $1,385,000 $1,275,000 -7.9% 333 172 $700 62City Beach 84 $1,435,500 $1,672,500 $2,037,500 $3,600,000 -2.3% -7.9% $1,900,000 $1,930,000 $1,480,000 -23.3% 25 9 $950 107Claremont 89 $1,042,500 $1,250,000 $1,540,000 $7,500,000 -5.7% -13.3% $1,625,000 $1,217,500 $1,200,000 -1.4% 28 19 $675 40Cottesloe 101 $1,400,000 $1,700,000 $2,540,000 $5,010,000 0.0% -8.1% $1,830,000 $1,565,000 $1,800,000 15.0% 30 15 $750 78
Daglish 10 $865,000 $1,057,500 $1,200,000 $1,475,000 4.7% 3.7% $895,000 $865,000 $1,100,000 27.2% 3 3 $445 58Dalkeith 62 $1,800,000 $2,175,000 $3,300,000 $14,130,000 -7.4% -9.8% $2,400,000 $2,437,500 $1,850,000 -24.1% 24 8 $795 43Floreat 108 $1,000,000 $1,204,200 $1,445,000 $2,800,000 -0.4% -8.1% $1,200,000 $1,290,000 $1,135,000 -12.0% 25 19 $720 37
Jolimont 9 $939,250 $1,125,000 $1,225,000 $1,550,000 9.8% 11.9% $995,000 $1,045,500 -100.0% 4 $695Mosman Park 105 $1,000,000 $1,280,000 $2,025,000 $6,750,000 -1.5% -7.6% $1,311,500 $1,280,000 $1,270,000 -0.8% 33 17 $850 92
Mount Claremont 67 $1,049,000 $1,300,000 $1,495,000 $3,100,000 -1.1% -5.6% $1,400,000 $1,315,000 $1,287,500 -2.1% 24 14 $750 51Nedlands 125 $1,175,000 $1,500,000 $1,850,000 $4,150,000 0.0% -3.2% $1,490,000 $1,505,000 $1,181,000 -21.5% 38 20 $713 48
Peppermint Grove 15 $2,375,000 $2,850,000 $4,050,000 $7,700,000 -10.9% -18.6% $4,200,000 $3,200,000 $3,300,000 3.1% 2 4 $775 102Shenton Park 47 $1,037,500 $1,200,000 $1,430,000 $2,820,000 -1.6% 2.1% $1,247,500 $1,260,000 $1,198,750 -4.9% 9 8 $650 22
Subiaco 63 $955,000 $1,270,000 $1,500,000 $2,200,000 -1.7% 1.8% $1,220,000 $1,215,000 $1,000,000 -17.7% 19 9 $745 58Swanbourne 54 $1,335,000 $1,710,000 $2,120,000 $5,250,000 0.6% 14.8% $1,925,000 $1,720,000 $1,855,000 7.8% 17 6 $975 79
Wembley 115 $827,500 $970,000 $1,265,000 $1,960,000 -2.5% -9.1% $1,060,000 $1,070,000 $910,000 -15.0% 32 14 $575 62West Leederville 56 $927,500 $1,117,500 $1,347,500 $2,600,000 0.0% -2.4% $1,100,000 $1,110,000 $1,015,000 -8.6% 19 7 $600 43
Perth Metro Region 21,729 $427,000 $530,000 $710,000 $14,130,000 -0.9% -3.6% $532,000 $532,000 $510,000 -4.1% 5,901 3,989 $380 68
SAMPLE

CE
NT
RA
L S
UB
-RE
GIO
N
12 MARKET UPDATE | SEPTEMBER QUARTER 2016
Central Sub-Region PERTH REGIONP
ER
TH
RE
GIO
N
Multi-Residential Market
In the September quarter, preliminary sales volumes have decreased by similar levels to the preliminary June quarter results, recording a 27 per cent drop in the Central sub-region. A decline in preliminary sales activity has been observed across all sub-markets in the Central sub-region. There are a few suburbs in the Central sub-region which actually recorded an increase in sales activity, these suburbs include: East Fremantle (up 57 per cent), Applecross (up 88 per cent) and Mount Pleasant (up 50 per cent).
For the September quarter, the preliminary quarterly change in the median price was up 4.6 per cent to $455,000 after a revised June quarter quarterly median of $435,000. At a sub-market level, South Perth/Victoria Park was up 10.5 per cent and the Western Suburbs was up 11.3 per cent for the quarter.
The picture looks different though for the Central sub-region’s multi-residential market when considering changes in annual medians. There appears to be a bit more stability in the sub-markets in terms of changes in annual medians with positive growth recorded in the Fremantle sub-market at 4.9 per cent, Vincent/Stirling SE at 1.1 per cent and Western Suburbs at 6.0 per cent. The remaining sub-markets had negative growth. The overall performance of the Central sub-region in the annual change in annual median was -1.5 per cent.
Top performers with more than 30 sales for the quarterly change in the annual median for the September quarter include: Joondanna up 10.6 per cent at $459,000, South Perth up 7.4 per cent at 565,000 and Maylands up 4.2 per cent at $389,500.
TOP 10 SUBURBS BY QUARTERLY CHANGE IN PRICE Source: Landgate/REIWA
CENTRAL
Year to September 2016 Quarterly Change
in Annual Median %
Unit Sales Median Price Highest Price
Joondanna 37 $459,000 $752,000 10.6%
South Perth 152 $565,000 $5,800,000 7.4%
Maylands 192 $389,500 $1,130,000 4.2%
Rivervale 125 $415,000 $1,700,000 2.5%
Burswood 47 $737,000 $1,910,000 2.4%
Como 145 $520,000 $1,300,000 1.7%
Glendalough 31 $310,000 $523,000 1.6%
East Fremantle 43 $610,000 $1,600,000 0.0%
Perth 195 $450,000 $1,210,000 0.0%
West Perth 119 $530,000 $2,300,000 0.0%
Highgate 38 $415,000 $625,000 0.0%
Mount Lawley 93 $410,000 $881,020 0.0%
Excludes suburbs with less than 30 sales for the year & dwellings on lots greater than 1 Ha.
$250,000
$300,000
$350,000
$400,000
$450,000
$500,000
02004006008001,0001,2001,4001,6001,8002,000
Sep-16Sep-15Sep-14Sep-13Sep-12Sep-11
MULTI-RES SALES - CENTRAL
MULTI-RES MEDIAN - CENTRAL
PMR MULTI-RES MEDIAN
PERTH CENTRAL SUB-REGION Source: Landgate/REIWA
10 Year Ave
$250,000
$300,000
$350,000
$400,000
$450,000
$500,000
01002003004005006007008009001,000
Sep-16Sep-15Sep-14Sep-13Sep-12Sep-11
MULTI-RES SALES - MIDDLE
MULTI-RES MEDIAN - MIDDLE
PMR MULTI-RES MEDIAN
PERTH MIDDLE SUB-REGION Source: Landgate/REIWA
10 Year Ave
$200,000
$250,000
$300,000
$350,000
$400,000
$450,000
$500,000
$550,000
$600,000
0
200
400
600
800
1,000
1,200
Sep-16Sep-15Sep-14Sep-13Sep-12Sep-11
MULTI-RES SALES - INNER
MULTI-RES MEDIAN - INNER
PMR MULTI-RES MEDIAN
PERTH INNER SUB-REGION Source: Landgate/REIWA
Listings for the multi-residential market in the Central sub-region lifted in the September quarter to total 2,337, up 2.6 per cent. The stock of unit listings in the Perth Metro Region increased by 1.4 per cent to 3,087 for the quarter.
Average selling days improved for the unit market in the Central sub-region. It now takes 75 days to sell which is an improvement of two days over the quarter.
SAMPLE
SEPTEMBER QUARTER 2016 | MARKET UPDATE 13
PERTH REGION Central Sub-Region
CE
NT
RA
L S
UB
-RE
GIO
NP
ER
TH
RE
GIO
N
MEDIAN PRICE OF ESTABLISHED MULTI-RESIDENTIAL SALES - PERTH CENTRAL SUBURBS SEPTEMBER QUARTER 2016Source: Landgate/REIWA
SUB-MARKETS& SUBURBS
Year to September 2016 %Change Quarterly Sales Price
Unit Sales
Lower Quartile
Median Price
Upper Quartile
Highest Price
Quarterly Change Annual
Median %
Annual Change Annual
Median %
September Qtr 2015
June Qtr 2016
September Qtr 2016
(P)
Prelim Qtly
Change
June Qtr 2016
Sales
Sept Qtr 2016 Sales
Unit Rent per
week
Unit Average Selling Days
Central Sub-Region 3,741 $365,000 $455,000 $595,000 $6,100,000 0.0% -1.5% $455,000 $435,000 $455,000 4.6% 1,003 733 $355 75
Bassendean/Bayswater 286 $320,000 $383,500 $455,000 $1,130,000 2.3% -1.2% $355,500 $375,000 $400,000 6.7% 82 51 $320 103
Bassendean 19 $314,250 $352,000 $395,500 $595,000 -2.1% -7.1% $369,000 $331,750 $402,500 21.3% 6 2 $330 108
Bayswater 27 $316,500 $400,000 $435,000 $500,000 21.2% 29.0% $315,000 $400,000 $368,750 -7.8% 10 2 $330 91
Maylands 192 $320,000 $389,500 $475,000 $1,130,000 4.2% -2.6% $350,000 $375,000 $427,500 14.0% 49 36 $300 63
Morley 30 $371,500 $389,500 $401,500 $565,000 -2.6% -2.6% $432,000 $397,500 $375,000 -5.7% 14 7 $390 127
Belmont 222 $345,000 $403,500 $465,000 $1,700,000 0.9% -1.6% $397,750 $395,000 $406,250 2.8% 67 44 $350 100
Belmont 19 $342,000 $380,000 $467,500 $660,000 -4.3% -7.3% $399,000 $389,000 $470,000 20.8% 8 5 $370 61
Cloverdale 28 $332,500 $384,000 $437,000 $552,000 -2.5% -12.5% $439,000 $345,000 $379,000 9.9% 8 8 $335 103
Kewdale 31 $370,000 $390,000 $420,000 $525,000 -2.3% -2.5% $392,500 $370,000 $369,000 -0.3% 9 4 $355 185
Redcliffe 11 $330,500 $368,000 $397,500 $475,000 -0.3% -9.9% $410,000 $347,500 -100.0% 2 $305 75
Rivervale 125 $347,500 $415,000 $500,000 $1,700,000 2.5% 1.3% $390,000 $411,500 $422,500 2.7% 36 26 $353 71
Canning 109 $330,000 $390,000 $440,000 $1,650,000 0.0% -4.2% $380,000 $371,500 $376,500 1.3% 30 17 $330 81
Bentley 23 $309,500 $372,500 $426,250 $1,190,000 0.1% -8.3% $310,500 $335,000 $372,500 11.2% 9 2 $345 115
Cannington 30 $350,000 $405,000 $437,000 $480,000 -0.7% 1.3% $428,500 $368,500 $291,000 -21.0% 4 3 $330 60
Queens Park 17 $330,000 $330,000 $388,250 $469,000 0.0% -13.2% $372,500 $315,000 $240,000 -23.8% 6 1 $335 88
St James 13 $365,500 $400,000 $482,750 $700,000 5.8% 44.8% $371,000 $405,000 9.2% 3 5 $320 47
Fremantle 199 $439,500 $640,000 $837,500 $2,350,000 -1.5% 4.9% $614,000 $590,000 $522,500 -11.4% 46 45 $380 68
East Fremantle 43 $455,000 $610,000 $770,000 $1,600,000 0.0% -1.1% $560,000 $415,000 $522,500 25.9% 7 11 $365 54
Fremantle 79 $386,000 $560,000 $731,500 $1,750,000 -5.1% 5.3% $563,000 $565,000 $455,000 -19.5% 22 19 $368 81
North Fremantle 52 $633,000 $802,500 $1,450,000 $2,350,000 -0.3% -1.5% $805,000 $662,500 $703,750 6.2% 12 10 $540 73
South Fremantle 14 $660,000 $737,500 $922,500 $1,600,000 -12.3% 8.5% $926,000 $1,017,500 $600,000 -41.0% 2 4 $410 75
Melville 256 $410,000 $480,000 $595,000 $1,900,000 -1.8% -1.0% $517,500 $500,000 $510,000 2.0% 69 53 $360 62
Applecross 48 $515,000 $637,500 $884,500 $1,900,000 -3.8% 6.7% $625,000 $974,500 $580,000 -40.5% 8 15 $450 80
Attadale 21 $555,000 $575,000 $626,250 $1,050,000 1.3% 22.3% $470,000 $620,000 $572,500 -7.7% 6 6 $383 14
Bicton 37 $420,000 $450,000 $539,000 $720,000 -9.1% -7.9% $540,000 $500,000 $425,000 -15.0% 13 6 $325 54
Melville 24 $410,000 $497,000 $560,000 $750,000 -4.2% -15.8% $585,000 $530,000 $487,500 -8.0% 7 6 $475 49
Mount Pleasant 18 $565,000 $662,000 $1,135,000 $1,500,000 7.2% 17.2% $530,000 $967,500 $590,000 -39.0% 2 3 $355 38
Palmyra 58 $400,000 $426,500 $510,000 $640,000 -2.0% -5.2% $465,000 $435,000 $422,000 -3.0% 19 11 $340 60
Perth City 578 $398,000 $495,000 $620,000 $5,000,000 0.7% -3.4% $497,500 $489,000 $495,000 1.2% 154 129 $420 78
East Perth 239 $395,000 $515,000 $740,000 $5,000,000 -0.9% -4.3% $530,000 $520,000 $499,000 -4.0% 63 47 $440 81
Northbridge 25 $439,000 $495,000 $575,000 $1,250,000 0.5% 1.0% $500,000 $575,000 $510,000 -11.3% 3 11 $400 60
Perth 195 $385,000 $450,000 $557,500 $1,210,000 0.0% -6.5% $462,500 $445,000 $450,000 1.1% 54 49 $415 73
West Perth 119 $444,000 $530,000 $607,500 $2,300,000 0.0% 1.9% $510,000 $502,500 $498,000 -0.9% 34 22 $420 87
South Perth/Victoria Park 489 $405,000 $500,000 $670,000 $5,800,000 1.1% -2.9% $493,250 $475,000 $525,000 10.5% 131 90 $350 73
Burswood 47 $520,000 $737,000 $842,500 $1,910,000 2.4% 3.4% $712,500 $640,000 $780,000 21.9% 12 13 $400 106
Como 145 $425,000 $520,000 $640,000 $1,300,000 1.7% 2.0% $491,000 $506,250 $520,000 2.7% 38 23 $350 59
East Victoria Park 35 $291,500 $410,000 $479,500 $680,000 -6.8% -9.3% $450,000 $412,500 $315,000 -23.6% 8 7 $320 39
South Perth 152 $415,000 $565,000 $842,500 $5,800,000 7.4% -1.3% $494,750 $485,000 $715,000 47.4% 45 25 $378 94
Victoria Park 94 $315,000 $442,000 $530,000 $790,000 -2.6% 2.8% $465,000 $422,500 $465,000 10.1% 22 19 $330 44
Stirling East 426 $319,000 $355,000 $418,000 $800,000 -2.7% -7.8% $387,000 $343,750 $350,000 1.8% 116 72 $320 70
Balcatta 36 $338,500 $378,750 $433,500 $500,000 -8.0% -9.8% $434,500 $342,500 $360,000 5.1% 8 7 $370 56
Balga 15 $278,750 $307,000 $314,500 $425,000 0.0% -5.8% $305,500 $304,000 $316,000 3.9% 7 2 $330 97
Dianella 45 $355,000 $390,000 $417,000 $535,000 -3.4% -5.7% $410,000 $364,000 $380,000 4.4% 10 8 $298 66
Glendalough 31 $284,500 $310,000 $369,000 $523,000 1.6% 3.3% $300,000 $368,000 $310,000 -15.8% 11 5 $288 59
Joondanna 37 $367,000 $459,000 $552,500 $752,000 10.6% 11.5% $410,000 $385,000 $463,500 20.4% 8 8 $330 46
Nollamara 40 $340,000 $350,000 $370,250 $510,000 -2.5% -8.5% $367,500 $350,000 $339,000 -3.1% 13 5 $350 83
Osborne Park 71 $282,500 $336,000 $399,000 $600,000 -2.0% -2.6% $373,500 $342,500 $329,000 -3.9% 17 7 $290 126
Tuart Hill 67 $330,000 $370,000 $437,500 $640,000 -2.6% -7.0% $385,000 $365,000 $380,000 4.1% 17 11 $300 38
Westminster 17 $317,500 $330,000 $350,000 $385,000 -2.9% -6.4% $377,500 $320,000 $315,000 -1.6% 7 1 $330 62
Yokine 62 $319,000 $353,250 $440,000 $800,000 -0.1% -7.0% $348,500 $335,000 $322,500 -3.7% 17 16 $290 57
Excludes suburbs with less than 10 sales for the year. All figures are preliminary for up to 4 months after end of quarter© REIWA - For the exclusive use of REIWA Subscribers. Unauthorised distribution, reproduction or sale of the data will breach REIWA’s copyright
SAMPLE

CE
NT
RA
L S
UB
-RE
GIO
N
14 MARKET UPDATE | SEPTEMBER QUARTER 2016
Central Sub-Region PERTH REGIONP
ER
TH
RE
GIO
N
SUB-MARKETS& SUBURBS
Year to September 2016 %Change Quarterly Sales Price
Unit Sales
Lower Quartile
Median Price
Upper Quartile
Highest Price
Quarterly Change Annual
Median %
Annual Change Annual
Median %
September Qtr 2015
June Qtr 2016
September Qtr 2016
(P)
Prelim Qtly
Change
June Qtr 2016
Sales
Sept Qtr 2016 Sales
Unit Rent per
week
Unit Average Selling Days
Stirling West 325 $410,000 $480,000 $585,000 $3,500,000 -2.0% -5.7% $490,000 $489,500 $445,500 -9.0% 96 64 $395 68
Churchlands 21 $377,500 $390,000 $426,000 $1,035,001 -1.3% -8.8% $360,000 $375,000 $385,000 2.7% 3 6 $325 42
Doubleview 23 $352,500 $510,000 $590,750 $649,000 -4.2% -1.9% $502,500 $550,000 $373,000 -32.2% 9 4 $460 99
Innaloo 51 $449,000 $479,000 $511,000 $600,000 -2.0% -4.2% $490,000 $475,000 $440,000 -7.4% 15 15 $425 65
Scarborough 185 $401,500 $490,000 $634,500 $3,500,000 -2.0% -6.7% $500,000 $470,000 $515,000 9.6% 53 32 $380 57
Trigg 11 $467,500 $491,500 $740,000 $781,000 0.0% 5.0% $610,750 $612,500 0.3% 2 2 $435 55
Vincent/Stirling SE 262 $389,000 $455,000 $569,000 $3,550,000 -1.1% 1.1% $445,000 $435,000 $425,000 -2.3% 63 54 $350 64
Highgate 38 $325,000 $415,000 $545,000 $625,000 0.0% -7.6% $455,000 $330,000 $417,500 26.5% 8 10 $385 48
Inglewood 22 $359,000 $442,500 $618,000 $3,550,000 -7.8% 11.0% $407,500 $564,000 $406,000 -28.0% 4 5 $343 68
Leederville 35 $436,000 $513,000 $680,000 $1,250,000 -1.3% -10.0% $545,000 $462,500 $500,000 8.1% 11 9 $395 48
Mount Hawthorn 18 $499,000 $537,000 $572,000 $770,000 -0.9% -1.5% $580,000 $514,500 $539,000 4.8% 4 3 $425 90
Mount Lawley 93 $360,000 $410,000 $502,500 $881,020 0.0% -2.4% $406,200 $392,500 $397,000 1.1% 20 14 $300 57
North Perth 50 $400,000 $480,000 $580,000 $915,000 -1.0% -4.7% $465,000 $435,000 $462,000 6.2% 15 11 $385 88
Western Suburbs 589 $398,750 $580,000 $795,000 $6,100,000 1.8% 6.0% $560,000 $539,000 $600,000 11.3% 149 114 $350 77
Claremont 81 $505,000 $650,000 $840,000 $1,820,000 -2.6% -4.1% $735,000 $620,000 $530,000 -14.5% 18 13 $445 99
Cottesloe 49 $585,000 $785,000 $972,500 $3,570,000 -1.6% -3.2% $928,000 $736,000 $730,000 -0.8% 8 3 $450 107
Crawley 52 $442,500 $792,500 $1,175,000 $4,800,000 -7.3% -0.3% $1,100,000 $787,500 $800,000 1.6% 18 11 $370 40
Daglish 11 $424,000 $622,000 $675,000 $1,351,777 -0.2% 46.4% $557,500 $622,000 $423,000 -32.0% 3 3 $223 55
Floreat 16 $725,000 $978,750 $1,062,500 $1,150,000 -2.1% -12.8% $1,250,000 $690,000 $966,250 40.0% 5 4 $650 122
Jolimont 22 $312,000 $378,000 $535,000 $2,500,000 -1.2% -12.6% $350,000 $375,000 $375,250 0.1% 6 5 $290 67
Mosman Park 29 $312,500 $380,000 $482,000 $1,230,000 1.0% -8.4% $370,000 $382,500 $367,500 -3.9% 10 2 $290 105
Nedlands 23 $475,000 $575,000 $743,000 $2,275,000 1.4% -7.3% $565,000 $572,500 $450,500 -21.3% 6 5 $350 101
Shenton Park 19 $460,000 $535,000 $750,017 $1,300,000 0.0% 24.4% $535,000 $800,000 $300,000 -62.5% 5 1 $390 91
Subiaco 135 $494,000 $600,000 $737,500 $6,100,000 -1.6% -6.3% $654,000 $505,000 $600,000 18.8% 25 31 $418 73
Swanbourne 14 $535,000 $657,500 $930,000 $1,810,000 44.2% -48.2% $456,000 $657,500 14 $800
Wembley 87 $271,000 $320,000 $480,000 $900,000 -1.5% -4.5% $335,000 $315,000 $327,500 4.0% 27 12 $250 64
West Leederville 26 $265,000 $425,000 $635,000 $1,400,000 -5.6% -18.7% $568,500 $425,000 $630,000 48.2% 8 6 $330 44
Perth Metro Region 4,570 $345,000 $425,000 $565,000 $6,100,000 -0.7% -3.2% $430,000 $410,000 $425,000 3.7% 1,203 881 $350 80
Excludes suburbs with less than 10 sales for the year. All figures are preliminary for up to 4 months after end of quarter© REIWA - For the exclusive use of REIWA Subscribers. Unauthorised distribution, reproduction or sale of the data will breach REIWA’s copyright
MEDIAN PRICE OF ESTABLISHED MULTI-RESIDENTIAL SALES - PERTH CENTRAL SUBURBS SEPTEMBER QUARTER 2016Source: Landgate/REIWA
Land MarketThe land market in the Central sub-region is very mixed. Preliminary data for median price in the September quarter indicates an increase of nine per cent to $500,000 from $458,750 on the revised June quarter. Preliminary land sales for the September quarter are currently 146. The June quarter preliminary volumes have increased over the quarter to a revised figure of 272 from the initial 160. So, it is expected a further lift in land sales will occur in coming months. Most of the land sales in the Central sub-region can be found in the sub-markets of Bayswater/Bassendean, Western Suburbs and Stirling East.
In the year to September 2016 the annual change in annual medians is still mixed. The Central sub-region recorded zero growth, with better performers found in Fremantle (up 1.3 per cent), Stirling East (up 6.3 per cent) and Stirling West (up 1.6 per cent).
It is important to note that land sales can take up to 12 months to settle and that the most recent figures provided for the September 2016 quarter will adjust in the future.
TOP 5 SUBURBS BY VOLUMESource: Landgate/REIWA
Year to September 2016 Land Sales Median PriceQuarterly Change in Annual Median
%
Perth Metro Region 5,835 $265,000 1.9%
Central Sub-Region 928 $460,000 1.5%Bayswater 59 $335,000 -2.2%
Dianella 47 $480,000 3.2%
Mount Claremont 44 $685,000 1.9%
East Cannington 39 $322,000 -0.3%
Morley 38 $300,000 -2.3%
$100,000
$150,000
$200,000
$250,000
$300,000
$350,000
$400,000
$450,000
$500,000
$550,000
0
100
200
300
400
500
600
700
800
900
Sep-16Sep-15Sep-14Sep-13Sep-12Sep-11
LAND SALES - CENTRALLAND MEDIAN - CENTRALPMR LAND MEDIAN
PERTH CENTRAL SUB-REGION Source: Landgate/REIWASAMPLE

SEPTEMBER QUARTER 2016 | MARKET UPDATE 15
PERTH REGION Central Sub-Region
CE
NT
RA
L S
UB
-RE
GIO
NP
ER
TH
RE
GIO
N
SUB-MARKETS& SUBURBS
Year to Sep 2016 Year to Sep 2015 Quarterly Sales Price
Land Sales
Median Price
Land Sales
Median Price
Quarterly Change Annual
Median %
Annual Change Annual
Median %
Sept Qtr 2015 June Qtr 2016 Sept Qtr 2016 (P)
Prelim Qtly Change
June Qtr 2016 Sales
Sept Qtr 2016 Sales
Central Sub-Region 928 $460,000 1,085 $460,000 1.5% 0.0% $440,000 $458,750 $500,000 9.0% 272 146
Bassendean/Bayswater 168 $327,500 183 $337,000 -2.8% -2.8% $345,000 $340,000 $310,000 -8.8% 56 22
Bassendean 18 $351,250 24 $404,000 -15.4% -13.1% $527,500 $430,000 $350,000 -18.6% 5 3
Bayswater 59 $335,000 34 $385,500 -2.2% -13.1% $384,500 $340,000 $295,000 -13.2% 19 5
Bedford 10 $400,000 10 $396,000 -0.6% 1.0% $400,000 $405,000 $390,000 -3.7% 5 1
Embleton 15 $271,000 8 $323,500 -1.5% -16.2% $325,000 $271,000 $270,000 -0.4% 5 3
Morley 38 $300,000 52 $320,000 -2.3% -6.3% $317,500 $300,000 $275,000 -8.3% 12 5
Belmont 42 $322,000 60 $389,500 -6.7% -17.3% $369,500 $335,000 $335,000 0.0% 16 9
Cloverdale 15 $295,000 15 $335,000 0.0% -11.9% $282,500 $305,000 $288,000 -5.6% 6 3
Canning 98 $328,500 123 $335,000 -0.5% -1.9% $355,000 $322,500 $460,000 42.6% 28 12
East Cannington 39 $322,000 42 $335,000 -0.3% -3.9% $332,500 $322,500 $259,000 -19.7% 12 3
Fremantle 67 $395,000 79 $390,000 -1.3% 1.3% $553,500 $379,767 $404,000 6.4% 9 10
Beaconsfield 13 $385,000 41 $390,000 -12.0% -1.3% $616,000 $325,000 $320,000 -1.5% 2 1
Hilton 10 $325,000 13 $300,000 0.0% 8.3% $365,000 $305,000 $355,000 16.4% 3 1
White Gum Valley 24 $385,000 6 $418,500 -1.3% -8.0% $455,000 $394,000 4
Melville 104 $568,750 87 $590,000 -0.2% -3.6% $580,000 $511,000 $584,000 14.3% 30 15
Kardinya 11 $425,000 14 $380,000 8.3% 11.8% $352,500 $390,000 $745,000 91.0% 5 3
Melville 18 $515,000 15 $590,000 -8.0% -12.7% $580,000 $460,000 $510,000 10.9% 4 2
Mount Pleasant 10 $745,000 12 $715,000 0.0% 4.2% $648,000 $815,000 $590,000 -27.6% 3 1
Perth City 2 $800,000 2 $2,310,000 0.0% -65.4%
South Perth/Victoria Park 65 $550,000 116 $559,444 6.3% -1.7% $556,944 $495,000 $880,000 77.8% 24 8
Carlisle 14 $362,500 18 $377,750 -1.5% -4.0% $372,500 $365,000 $850,000 132.9% 5 1
Como 19 $625,000 16 $634,000 0.0% -1.4% $719,000 $637,500 $1,353,750 112.4% 8 2
Stirling East 133 $425,000 134 $400,000 0.0% 6.3% $395,000 $395,000 $330,000 -16.5% 28 23
Balga 11 $200,000 36 $235,000 -11.1% -14.9% $298,500 $200,000 $8,333 -95.8% 3 1
Dianella 47 $480,000 22 $427,605 3.2% 12.3% $416,538 $453,000 $517,500 14.2% 7 6
Stirling 21 $500,000 14 $589,500 -13.0% -15.2% $579,000 $526,500 $330,000 -37.3% 6 7
Westminster 11 $240,000 11 $240,000 11.6% 0.0% $197,500 $217,500 2
Yokine 14 $452,500 14 $502,500 1.7% -10.0% $480,000 $460,000 $460,000 0.0% 6 1
Stirling West 113 $523,000 165 $552,000 1.6% -5.3% $555,000 $471,000 $580,000 23.1% 26 25
Doubleview 24 $428,500 15 $445,000 0.8% -3.7% $400,000 $339,000 $620,000 82.9% 9 5
Gwelup 24 $550,000 45 $545,000 -0.4% 0.9% $570,000 $538,500 $580,000 7.7% 4 7
Karrinyup 19 $480,000 27 $521,000 9.1% -7.9% $435,000 $480,000 $775,000 61.5% 5 3
Scarborough 18 $407,500 21 $476,000 -1.8% -14.4% $456,500 $460,000 $419,500 -8.8% 3 4
Vincent/Stirling SE 27 $485,000 27 $525,000 -7.6% -7.6% $548,750 $530,000 $547,500 3.3% 9 4
North Perth 12 $452,500 6 $536,250 -5.7% -15.6% $658,250 $675,000 $445,000 -34.1% 3 1
Western Suburbs 109 $740,000 109 $740,000 -4.2% 0.0% $755,000 $715,000 $705,000 -1.4% 46 18
Cottesloe 18 $1,355,000 14 $1,402,925 -4.4% -3.4% $1,425,000 $5,185,000 $825,000 -84.1% 3 1
Mosman Park 15 $710,000 19 $750,000 0.0% -5.3% $870,000 $672,500 -100.0% 4
Mount Claremont 44 $685,000 2 $1,025,000 1.9% -33.2% $685,000 $697,500 1.8% 27 14
Perth Metro Region 5,835 $265,000 9,872 $263,000 1.9% 0.8% $260,500 $259,500 $295,000 13.7% 1,675 616
Excludes suburbs with less than 10 sales for the year. All figures are preliminary for up to 4 months after end of quarter© REIWA - For the exclusive use of REIWA Subscribers. Unauthorised distribution, reproduction or sale of the data will breach REIWA’s copyright
MEDIAN PRICE OF LAND SALES - PERTH CENTRAL SUBURBS SEPTEMBER QUARTER 2016Source: Landgate/REIWA
SAMPLE

NO
RT
H W
ES
T S
UB
-RE
GIO
N
16 MARKET UPDATE | SEPTEMBER QUARTER 2016
North West Sub-Region PERTH REGIONP
ER
TH
RE
GIO
N
TOP 5 SUBURBS BY VOLUMESource: Landgate/REIWA
Year to September 2016 Land Sales Median PriceQuarterly Change in Annual Median %
Perth Metro Region 5,835 $265,000 1.9%
North West Sub-Region 1,246 $258,000 -0.8%Alkimos 186 $229,000 -0.2%
Landsdale 133 $325,000 -1.5%
Yanchep 124 $208,500 -3.0%
Eglinton 105 $215,000 -1.8%
Clarkson 81 $261,000 0.0%
Land Market Whilst land sales activity in the North West sub-region continues to soften in the quarter, it is important to note that as more transactions settle in the coming months, volumes will lift. After revision, June quarter sales transactions more than doubled to reach 353 from a preliminary 163.
Preliminary data suggests an increase in quarterly median prices for the North West sub-region, up 18 per cent to $295,000 from the June quarter revised median of $250,000. For the year to September 2016, the quarterly change in annual median dropped slightly by 0.8 per cent with the annual change in annual median also slipping 0.8 per cent to $260,000.
Alkimos remains the bestselling suburb in the North West sub-region, recording 186 sales during the year to June 2016. Lansdale recorded 133 sales and Yanchep, Eglinton and Clarkson continue to feature in the top five.
$375,000
$400,000
$425,000
$450,000
$475,000
$500,000
$525,000
$550,000
$575,000
0
250
500
750
1,000
1,250
1,500
1,750
2,000
Sep-16Sep-15Sep-14Sep-13Sep-12Sep-11
HOUSE SALES - NWHOUSE MEDIAN - NWPMR HOUSE MEDIAN
Source: Landgate/REIWAPERTH NORTH WEST SUB-REGION
10 Year Ave
$200,000
$225,000
$250,000
$275,000
$300,000
$325,000
$350,000
0
250
500
750
1,000
1,250
1,500
Sep-16Sep-15Sep-14Sep-13Sep-12Sep-11
LAND SALES - NWLAND MEDIAN - NWPMR LAND MEDIAN
PERTH NORTH WEST SUB-REGION Source: Landgate/REIWA
TOP 10 SUBURBS BY QUARTERLY CHANGE IN PRICE Source: Landgate/REIWA
NORTH WEST
Year to September 2016 Quarterly Change in
Annual Median %
House Sales
Median Price Highest Price
Warwick 47 $578,000 $865,000 3.2%Sinagra 37 $475,000 $575,000 2.3%Beldon 60 $502,000 $870,000 2.2%
Joondalup 85 $540,000 $1,180,000 1.9%Marmion 34 $931,000 $3,750,000 1.7%Kallaroo 67 $785,000 $2,195,000 1.6%
Burns Beach 41 $930,000 $1,500,000 0.8%Duncraig 200 $715,000 $1,680,000 0.7%
Marangaroo 100 $460,000 $735,000 0.4%Padbury 112 $529,750 $1,015,000 0.4%
Excludes suburbs with less than 30 sales for the year & dwellings on lots greater than 1 Ha.
Housing and Multi-residential Markets
Preliminary Sales volumes for the housing market in the North West sub-region have continued their decline throughout the September quarter. Sub-markets that are experiencing the greatest decline in sales activity include Wanneroo South (down 46 per cent), Wanneroo North West (down 45 per cent) and Joondalup South (down 40 per cent).
The lower levels of sales transactions have also impacted the preliminary quarterly change in median price. The sub-region has recorded a drop of 3.8 per cent to $500,000 compared to a revised June quarter median of $520,000.
When considering the annual change in the annual median for the North West sub-region, the market is also experiencing some softening in price levels. The sub-region is down 2.8 per cent and all sub-markets have declined as well.
Turning to performance based on the quarterly change in the annual median, Warwick is on top with a lift of 3.2 per cent to $552,650, followed by Sinagra at 2.3 per cent with $440,000.
Multi-residential sales have followed a similar trend as the housing market, with preliminary sales for the September quarter falling by 36 per cent. The preliminary quarterly change in the median unit price is down marginally by one per cent to $375,000 compared to a revised June quarter median of $370,000. The best performing suburb in the North West sub-region for units is Joondalup with a quarterly change in annual median of 14 per cent.
SAMPLE

NO
RT
H W
ES
T S
UB
-RE
GIO
N
SEPTEMBER QUARTER 2016 | MARKET UPDATE 17
PERTH REGION North West Sub-Region
PE
RT
H R
EG
ION
SUB-MARKETS Listings at
September Quarter 2016
House ListingsQuarterly Change
Annual Change
Average Selling Days (p)
Quarterly Change
Annual Change
Joondalup North 291 223 -4.3% -7.9% 60 -4 -3Joondalup South 368 301 -4.7% -3.2% 54 3 2
Wanneroo North East 332 255 -15.8% -17.5% 67 0 5Wanneroo North West 888 674 0.0% -0.4% 77 0 1
Wanneroo South 321 231 -2.5% -6.5% 71 5 10
North West Sub-Region 2,200 1,684 -4.5% -5.7% 65 1 2Perth Metro Region 14,170 8,649 -0.6% -6.5% 68 3 5
Note: Listings to Dwelling Stock Ratio = Dwelling Listings as a percentage of estimated Dwelling Stock
SUBMARKETS
September Quarter 2016 June Quarter 2016 September Quarter 2015
Overall Market Variance
Listing vs Sold Price
Proportion of Vendors
Discounting
Listing & Sold Price Variance
for Discounting Vendors
Overall Market Variance
Listing vs Sold Price
Proportion of Vendors
Discounting
Listing & Sold Price Variance
for Discounting Vendors
Overall Market Variance
Listing vs Sold Price
Proportion of Vendors
Discounting
Listing & Sold Price Variance
for Discounting Vendors
North West Sub-Region -3.4% 50.7% -5.7% -3.0% 61.4% -5.8% -3.0% 50.3% -5.6%Joondalup North -3.6% 53.2% -6.1% -2.9% 49.7% -5.8% -2.5% 48.4% -5.6%Joondalup South -2.7% 39.2% -5.7% -3.8% 44.7% -5.2% -3.1% 48.8% -5.3%
Wanneroo North East -4.3% 58.9% -5.6% -2.8% 42.5% -7.5% -3.6% 50.0% -5.7%Wanneroo North West -3.0% 55.5% -5.3% -3.2% 59.8% -5.6% -3.1% 56.0% -6.4%
Wanneroo South -3.1% 53.2% -5.6% -3.0% 61.4% -5.8% -2.8% 46.7% -5.3%
Perth Metro Region -4.0% 51.8% -6.7% -3.1% 60.6% -5.9% -3.6% 52.7% -6.1%
Listing Stock and Selling Days Total stock of house listings in the North West sub-region is down by 4.5 per cent for the quarter and 5.7 per cent lower than the same time last year.
All of the sub-markets except Wanneroo North West have shown a drop in the stock of listings for houses. The greatest decline in house listings was in Wanneroo North East down 15.8 per cent for the quarter.
In the North West sub-region, it is still taking more than 60 days to sell a house. The September quarter figure is 65 days for the sub-region and 77 days in the Wanneroo North West sub-market. Compared to the Perth Metro region, the sub-region is on slightly better against a 68 day average.
Seller Sentiment - HousesIn the North West sub-region, the number of sellers discounting their house has decreased to 50.7 per cent in the September quarter, from 61.4 per cent in the June quarter. The North West sub-region has fewer sellers discounting than the Perth Metro region as a whole.
It can be seen that the sub-market in the North West sub-region with the highest number of sellers discounting is Wanneroo North East, with 58.9 per cent of sellers discounting. The average discount that sellers are offering in the sub-region has remained stable at 5.7 per cent in September. The overall sentiment towards the housing market in the sub-region is still pessimistic at -3.4 per cent, however this is more positive than the general Perth metro market at -4.0 per cent.
SELLER SENTIMENT: HOUSES SEPTEMBER QUARTER 2016Source: Landgate/REIWA
STOCK OF HOUSE LISTINGS & SELLING DAYS - NORTH WEST SEPTEMBER QUARTER 2016Source: Landgate/REIWA
SAMPLE
NO
RT
H W
ES
T S
UB
-RE
GIO
N
18 MARKET UPDATE | SEPTEMBER QUARTER 2016
North West Sub-Region PERTH REGIONP
ER
TH
RE
GIO
N
SUB-MARKETS& SUBURBS
Year to September 2016 %Change Quarterly Sales Price
House Sales
Lower Quartile
Median Price
Upper Quartile
Highest Price
Quarterly Change Annual
Median %
Annual Change Annual Median
%
Sept Qtr 2015
June Qtr 2016
Sept Qtr 2016 (P)
Prelim Qtly
Change
June Qtr 2016
Sales
Sept Qtr 2016 Sales
House Rent per week
House Average Selling Days
North West Sub-Region 4,285 $440,000 $520,000 $650,000 $3,750,000 -1.0% -2.8% $523,750 $520,000 $500,000 -3.8% 1,236 756 $380 65Joondalup North 705 $488,750 $570,000 $740,000 $2,075,000 -2.6% -6.8% $614,000 $565,000 $542,000 -4.1% 187 127 $410 60
Burns Beach 41 $785,500 $930,000 $1,110,000 $1,500,000 0.8% 1.6% $915,000 $970,000 $882,500 -9.0% 11 4 $650 109
Connolly 32 $585,000 $665,000 $762,500 $955,000 0.0% -2.9% $668,500 $652,500 $647,500 -0.8% 8 6 $410 56
Currambine 94 $470,000 $527,500 $620,000 $955,000 -0.5% -11.7% $615,000 $529,500 $540,000 2.0% 28 13 $420 66
Edgewater 63 $506,500 $561,000 $627,500 $735,000 0.1% -4.5% $587,500 $605,000 $565,000 -6.6% 12 9 $400 66
Heathridge 109 $432,500 $460,000 $500,000 $660,000 -1.1% -6.0% $482,000 $465,000 $460,000 -1.1% 29 23 $370 43
Iluka 73 $760,000 $850,000 $1,023,750 $2,075,000 -0.4% 1.8% $852,500 $852,500 $819,500 -3.9% 22 9 $600 43
Joondalup 85 $460,000 $540,000 $599,500 $1,180,000 1.9% 0.7% $526,750 $470,000 $527,500 12.2% 31 18 $390 52
Kinross 99 $477,500 $515,000 $548,250 $650,000 0.0% -2.8% $510,000 $510,000 $484,500 -5.0% 23 21 $400 73
Ocean Reef 109 $650,000 $750,000 $870,000 $1,550,000 -1.6% -2.0% $765,000 $700,000 $693,000 -1.0% 23 24 $500 58
Joondalup South 1,349 $525,000 $620,000 $770,000 $3,750,000 -0.6% -2.4% $615,000 $619,500 $606,500 -2.1% 382 230 $430 54
Beldon 60 $460,500 $502,000 $530,000 $870,000 2.2% -0.6% $475,000 $492,000 $485,000 -1.4% 15 17 $375 47
Craigie 106 $435,000 $465,000 $496,000 $615,000 -0.9% -4.6% $470,000 $475,000 $450,000 -5.3% 36 14 $370 35
Duncraig 200 $630,000 $715,000 $817,250 $1,680,000 0.7% 0.7% $700,000 $700,000 $665,000 -5.0% 60 29 $483 47
Greenwood 146 $495,000 $550,000 $610,000 $745,000 -1.8% -1.8% $535,000 $580,000 $510,000 -12.1% 43 27 $393 66
Hillarys 129 $672,500 $820,000 $1,050,000 $2,250,000 -2.9% -3.1% $860,000 $862,500 $743,000 -13.9% 38 15 $535 77
Kallaroo 67 $593,750 $785,000 $952,500 $2,195,000 1.6% 19.1% $677,500 $735,000 $590,000 -19.7% 14 9 $395 59
Kingsley 171 $530,500 $590,000 $650,000 $1,050,000 -1.3% -3.5% $635,000 $582,500 $604,000 3.7% 44 32 $400 60
Marmion 34 $835,000 $931,000 $1,430,000 $3,750,000 1.7% -2.0% $920,000 $910,000 $952,000 4.6% 9 7 $570 61
Mullaloo 80 $645,000 $720,000 $800,000 $2,140,000 0.0% -1.9% $815,000 $707,500 $821,250 16.1% 22 12 $498 67
Padbury 112 $475,000 $529,750 $580,000 $1,015,000 0.4% -5.1% $536,250 $540,000 $545,000 0.9% 33 20 $400 34
Sorrento 95 $771,000 $870,000 $1,200,000 $3,000,000 -5.2% -15.4% $950,000 $1,025,000 $820,000 -20.0% 27 23 $600 61
Warwick 47 $521,000 $578,000 $647,500 $865,000 3.2% -2.0% $552,650 $560,000 $612,500 9.4% 17 4 $430 57
Woodvale 102 $592,000 $640,000 $710,000 $1,017,000 0.0% -6.6% $660,000 $645,500 $665,000 3.0% 24 21 $515 39
Wanneroo North East 676 $430,000 $480,000 $535,000 $1,660,000 -0.8% -3.0% $485,000 $485,000 $460,000 -5.2% 179 130 $393 67
Ashby 47 $455,000 $480,000 $513,000 $676,000 0.0% -3.5% $482,500 $470,000 $472,500 0.5% 21 4 $420 71
Banksia Grove 112 $365,000 $399,500 $453,000 $800,000 -2.3% -4.9% $418,500 $385,000 $380,000 -1.3% 27 31 $360 75
Carramar 87 $470,000 $520,000 $591,500 $1,660,000 -0.1% -1.0% $510,000 $545,000 $495,000 -9.2% 23 18 $445 71
Hocking 78 $460,000 $508,500 $550,000 $730,000 -2.1% -6.7% $535,000 $515,000 $470,000 -8.7% 23 19 $385 50
Pearsall 42 $435,000 $487,500 $540,000 $660,000 -2.3% -1.5% $491,000 $542,500 $444,000 -18.2% 8 9 $390 73
Sinagra 37 $422,750 $475,000 $520,000 $575,000 2.3% -6.3% $440,000 $436,250 $495,000 13.5% 8 5 $370 43
Tapping 115 $485,000 $520,000 $561,250 $880,000 -1.9% -2.1% $537,500 $530,000 $507,500 -4.2% 31 22 $430 57
Wanneroo 158 $410,000 $446,000 $515,000 $1,300,000 0.0% -4.1% $440,000 $445,500 $425,500 -4.5% 38 22 $350 59
Wanneroo North West 976 $377,000 $430,000 $529,000 $1,650,000 -1.4% -4.4% $435,000 $425,000 $410,000 -3.5% 295 164 $340 77
Alkimos 92 $393,000 $450,000 $515,000 $820,000 -1.1% -6.1% $487,000 $386,000 $432,500 12.0% 20 20 $330 81
Butler 173 $368,000 $415,000 $469,000 $614,000 -1.1% -5.3% $435,000 $402,500 $425,000 5.6% 50 30 $330 72
Clarkson 176 $369,750 $415,000 $450,000 $875,000 -1.2% -3.5% $410,000 $418,000 $381,762 -8.7% 68 22 $340 65
Eglinton 12 $411,500 $440,000 $502,500 $660,000 0.9% 7.3% $370,000 $436,000 -100.0% 6 $320
Jindalee 37 $533,500 $660,000 $743,500 $1,025,000 0.0% 2.7% $689,000 $670,000 $629,500 -6.0% 15 4 $359 45
Merriwa 65 $338,000 $355,000 $383,750 $455,000 -1.7% -4.1% $366,000 $340,000 $344,000 1.2% 19 13 $320 75
Mindarie 106 $600,000 $685,000 $850,000 $1,600,000 -1.5% -2.1% $675,750 $755,000 $670,000 -11.3% 31 16 $470 101
Quinns Rocks 135 $385,500 $465,000 $585,000 $1,150,000 -4.6% -9.9% $525,000 $430,000 $431,000 0.2% 35 18 $360 65
Ridgewood 47 $390,000 $415,000 $436,750 $525,000 -0.6% -3.2% $410,000 $395,000 $405,000 2.5% 13 12 $330 45
Two Rocks 28 $329,000 $369,000 $407,500 $780,000 -2.1% -11.1% $405,000 $366,500 $360,000 -1.8% 6 11 $325 75
Yanchep 105 $380,000 $437,500 $501,500 $1,650,000 0.0% 0.6% $405,000 $435,000 $389,250 -10.5% 32 18 $330 115
Wanneroo South 579 $419,000 $480,000 $570,000 $990,000 -2.0% -5.9% $500,000 $485,000 $462,500 -4.6% 193 105 $413 71
Alexander Heights 90 $452,000 $475,000 $513,000 $672,500 -2.1% -4.0% $489,500 $490,000 $450,000 -8.2% 29 17 $430 64
Darch 78 $492,000 $567,500 $637,000 $800,000 -6.2% -8.5% $660,000 $565,000 $482,500 -14.6% 19 18 $450 75
Girrawheen 92 $355,000 $385,000 $420,000 $540,000 -3.7% -7.2% $415,000 $375,000 $370,000 -1.3% 31 11 $300 78
Koondoola 44 $362,250 $380,000 $400,000 $455,000 -5.0% -11.6% $425,000 $390,000 $362,000 -7.2% 16 13 $295 54
Landsdale 118 $520,100 $579,500 $637,500 $983,000 -3.4% -2.9% $610,000 $590,000 $565,000 -4.2% 40 23 $450 81
Madeley 57 $493,500 $580,000 $650,000 $990,000 -6.5% -11.9% $659,750 $583,500 $540,000 -7.5% 18 12 $475 83
Marangaroo 100 $430,000 $460,000 $507,900 $735,000 0.4% -1.1% $450,750 $457,500 $465,000 1.6% 40 11 $380 50
Perth Metro Region 21,729 $427,000 $530,000 710,000 $14,130,000 -0.9% -3.6% $532,000 $532,000 $510,000 -4.1% 5,901 3,989 $380 68
Excludes suburbs with less than 5 sales for the year & dwellings on lots greater than 1 Ha. All figures are preliminary for up to 4 months after end of quarter© REIWA - For the exclusive use of REIWA Subscribers. Unauthorised distribution, reproduction or sale of the data will breach REIWA’s copyright
MEDIAN PRICE OF ESTABLISHED HOUSE SALES - PERTH NORTH WEST SUBURBS SEPTEMBER QUARTER 2016Source: Landgate/REIWA
SAMPLE
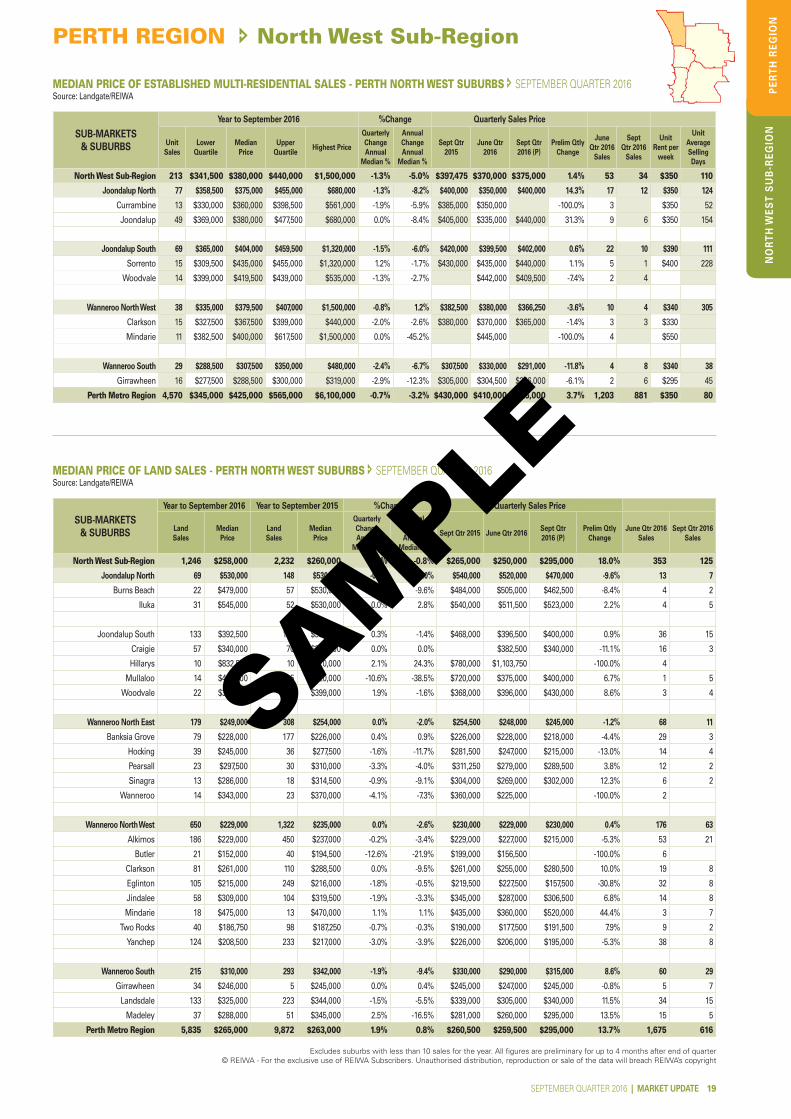
NO
RT
H W
ES
T S
UB
-RE
GIO
N
SEPTEMBER QUARTER 2016 | MARKET UPDATE 19
PERTH REGION North West Sub-Region
PE
RT
H R
EG
ION
SUB-MARKETS& SUBURBS
Year to September 2016 %Change Quarterly Sales Price
Unit Sales
Lower Quartile
Median Price
Upper Quartile
Highest Price
Quarterly Change Annual
Median %
Annual Change Annual
Median %
Sept Qtr 2015
June Qtr 2016
Sept Qtr 2016 (P)
Prelim Qtly Change
June Qtr 2016
Sales
Sept Qtr 2016
Sales
Unit Rent per
week
Unit Average Selling Days
North West Sub-Region 213 $341,500 $380,000 $440,000 $1,500,000 -1.3% -5.0% $397,475 $370,000 $375,000 1.4% 53 34 $350 110
Joondalup North 77 $358,500 $375,000 $455,000 $680,000 -1.3% -8.2% $400,000 $350,000 $400,000 14.3% 17 12 $350 124
Currambine 13 $330,000 $360,000 $398,500 $561,000 -1.9% -5.9% $385,000 $350,000 -100.0% 3 $350 52
Joondalup 49 $369,000 $380,000 $477,500 $680,000 0.0% -8.4% $405,000 $335,000 $440,000 31.3% 9 6 $350 154
Joondalup South 69 $365,000 $404,000 $459,500 $1,320,000 -1.5% -6.0% $420,000 $399,500 $402,000 0.6% 22 10 $390 111
Sorrento 15 $309,500 $435,000 $455,000 $1,320,000 1.2% -1.7% $430,000 $435,000 $440,000 1.1% 5 1 $400 228
Woodvale 14 $399,000 $419,500 $439,000 $535,000 -1.3% -2.7% $442,000 $409,500 -7.4% 2 4
Wanneroo North West 38 $335,000 $379,500 $407,000 $1,500,000 -0.8% 1.2% $382,500 $380,000 $366,250 -3.6% 10 4 $340 305
Clarkson 15 $327,500 $367,500 $399,000 $440,000 -2.0% -2.6% $380,000 $370,000 $365,000 -1.4% 3 3 $330
Mindarie 11 $382,500 $400,000 $617,500 $1,500,000 0.0% -45.2% $445,000 -100.0% 4 $550
Wanneroo South 29 $288,500 $307,500 $350,000 $480,000 -2.4% -6.7% $307,500 $330,000 $291,000 -11.8% 4 8 $340 38
Girrawheen 16 $277,500 $288,500 $300,000 $319,000 -2.9% -12.3% $305,000 $304,500 $286,000 -6.1% 2 6 $295 45
Perth Metro Region 4,570 $345,000 $425,000 $565,000 $6,100,000 -0.7% -3.2% $430,000 $410,000 $425,000 3.7% 1,203 881 $350 80
MEDIAN PRICE OF ESTABLISHED MULTI-RESIDENTIAL SALES - PERTH NORTH WEST SUBURBS SEPTEMBER QUARTER 2016Source: Landgate/REIWA
SUB-MARKETS& SUBURBS
Year to September 2016 Year to September 2015 %Change Quarterly Sales Price
Land Sales
Median Price
Land Sales
Median Price
Quarterly Change Annual
Median %
Annual Change Annual
Median %
Sept Qtr 2015 June Qtr 2016 Sept Qtr 2016 (P)
Prelim Qtly Change
June Qtr 2016 Sales
Sept Qtr 2016 Sales
North West Sub-Region 1,246 $258,000 2,232 $260,000 -0.8% -0.8% $265,000 $250,000 $295,000 18.0% 353 125
Joondalup North 69 $530,000 148 $530,000 -0.9% 0.0% $540,000 $520,000 $470,000 -9.6% 13 7
Burns Beach 22 $479,000 57 $530,000 -1.0% -9.6% $484,000 $505,000 $462,500 -8.4% 4 2
Iluka 31 $545,000 52 $530,000 0.0% 2.8% $540,000 $511,500 $523,000 2.2% 4 5
Joondalup South 133 $392,500 161 $398,000 0.3% -1.4% $468,000 $396,500 $400,000 0.9% 36 15
Craigie 57 $340,000 70 $340,000 0.0% 0.0% $382,500 $340,000 -11.1% 16 3
Hillarys 10 $832,500 10 $670,000 2.1% 24.3% $780,000 $1,103,750 -100.0% 4
Mullaloo 14 $442,500 5 $720,000 -10.6% -38.5% $720,000 $375,000 $400,000 6.7% 1 5
Woodvale 22 $392,500 38 $399,000 1.9% -1.6% $368,000 $396,000 $430,000 8.6% 3 4
Wanneroo North East 179 $249,000 308 $254,000 0.0% -2.0% $254,500 $248,000 $245,000 -1.2% 68 11
Banksia Grove 79 $228,000 177 $226,000 0.4% 0.9% $226,000 $228,000 $218,000 -4.4% 29 3
Hocking 39 $245,000 36 $277,500 -1.6% -11.7% $281,500 $247,000 $215,000 -13.0% 14 4
Pearsall 23 $297,500 30 $310,000 -3.3% -4.0% $311,250 $279,000 $289,500 3.8% 12 2
Sinagra 13 $286,000 18 $314,500 -0.9% -9.1% $304,000 $269,000 $302,000 12.3% 6 2
Wanneroo 14 $343,000 23 $370,000 -4.1% -7.3% $360,000 $225,000 -100.0% 2
Wanneroo North West 650 $229,000 1,322 $235,000 0.0% -2.6% $230,000 $229,000 $230,000 0.4% 176 63
Alkimos 186 $229,000 450 $237,000 -0.2% -3.4% $229,000 $227,000 $215,000 -5.3% 53 21
Butler 21 $152,000 40 $194,500 -12.6% -21.9% $199,000 $156,500 -100.0% 6
Clarkson 81 $261,000 110 $288,500 0.0% -9.5% $261,000 $255,000 $280,500 10.0% 19 8
Eglinton 105 $215,000 249 $216,000 -1.8% -0.5% $219,500 $227,500 $157,500 -30.8% 32 8
Jindalee 58 $309,000 104 $319,500 -1.9% -3.3% $345,000 $287,000 $306,500 6.8% 14 8
Mindarie 18 $475,000 13 $470,000 1.1% 1.1% $435,000 $360,000 $520,000 44.4% 3 7
Two Rocks 40 $186,750 98 $187,250 -0.7% -0.3% $190,000 $177,500 $191,500 7.9% 9 2
Yanchep 124 $208,500 233 $217,000 -3.0% -3.9% $226,000 $206,000 $195,000 -5.3% 38 8
Wanneroo South 215 $310,000 293 $342,000 -1.9% -9.4% $330,000 $290,000 $315,000 8.6% 60 29
Girrawheen 34 $246,000 5 $245,000 0.0% 0.4% $245,000 $247,000 $245,000 -0.8% 5 7
Landsdale 133 $325,000 223 $344,000 -1.5% -5.5% $339,000 $305,000 $340,000 11.5% 34 15
Madeley 37 $288,000 51 $345,000 2.5% -16.5% $281,000 $260,000 $295,000 13.5% 15 5
Perth Metro Region 5,835 $265,000 9,872 $263,000 1.9% 0.8% $260,500 $259,500 $295,000 13.7% 1,675 616
Excludes suburbs with less than 10 sales for the year. All figures are preliminary for up to 4 months after end of quarter© REIWA - For the exclusive use of REIWA Subscribers. Unauthorised distribution, reproduction or sale of the data will breach REIWA’s copyright
MEDIAN PRICE OF LAND SALES - PERTH NORTH WEST SUBURBS SEPTEMBER QUARTER 2016Source: Landgate/REIWA
SAMPLE
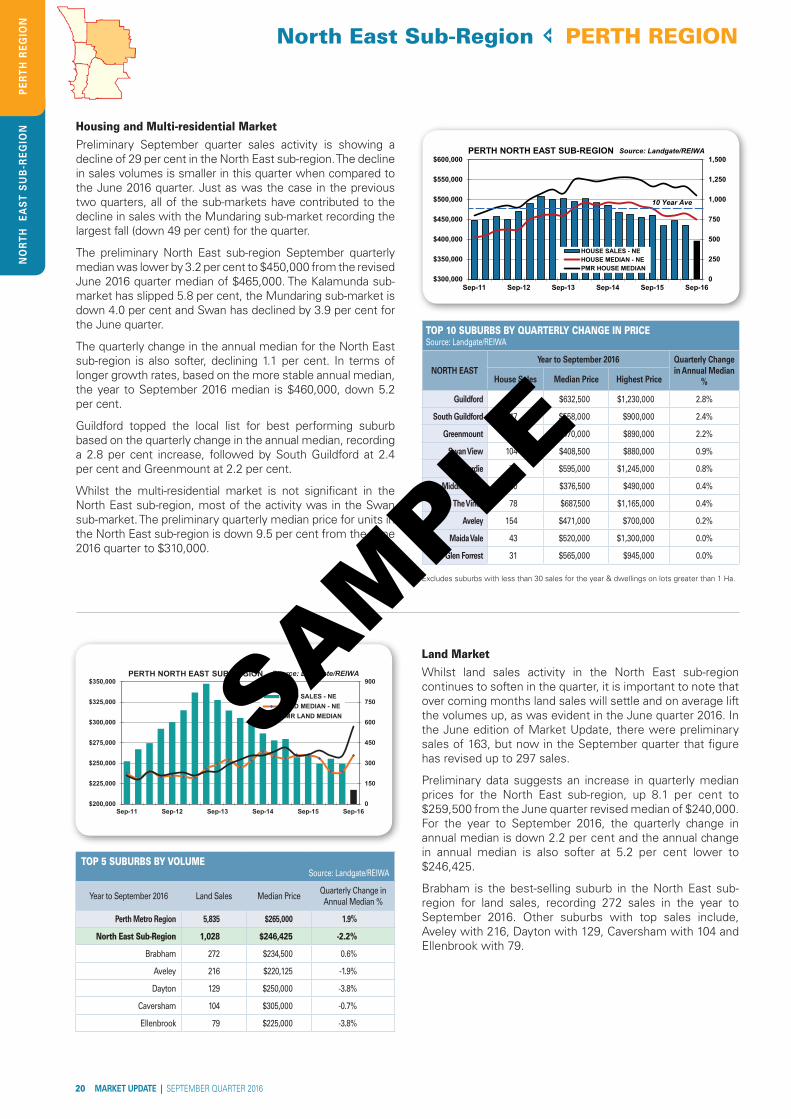
NO
RT
H
EA
ST
SU
B-R
EG
ION
20 MARKET UPDATE | SEPTEMBER QUARTER 2016
North East Sub-Region PERTH REGIONP
ER
TH
RE
GIO
N
TOP 5 SUBURBS BY VOLUMESource: Landgate/REIWA
Year to September 2016 Land Sales Median PriceQuarterly Change in Annual Median %
Perth Metro Region 5,835 $265,000 1.9%
North East Sub-Region 1,028 $246,425 -2.2%
Brabham 272 $234,500 0.6%
Aveley 216 $220,125 -1.9%
Dayton 129 $250,000 -3.8%
Caversham 104 $305,000 -0.7%
Ellenbrook 79 $225,000 -3.8%
Land Market Whilst land sales activity in the North East sub-region continues to soften in the quarter, it is important to note that over coming months land sales will settle and on average lift the volumes up, as was evident in the June quarter 2016. In the June edition of Market Update, there were preliminary sales of 163, but now in the September quarter that figure has revised up to 297 sales.
Preliminary data suggests an increase in quarterly median prices for the North East sub-region, up 8.1 per cent to $259,500 from the June quarter revised median of $240,000. For the year to September 2016, the quarterly change in annual median is down 2.2 per cent and the annual change in annual median is also softer at 5.2 per cent lower to $246,425.
Brabham is the best-selling suburb in the North East sub-region for land sales, recording 272 sales in the year to September 2016. Other suburbs with top sales include, Aveley with 216, Dayton with 129, Caversham with 104 and Ellenbrook with 79.
$300,000
$350,000
$400,000
$450,000
$500,000
$550,000
$600,000
0
250
500
750
1,000
1,250
1,500
Sep-16Sep-15Sep-14Sep-13Sep-12Sep-11
HOUSE SALES - NEHOUSE MEDIAN - NEPMR HOUSE MEDIAN
Source: Landgate/REIWAPERTH NORTH EAST SUB-REGION
10 Year Ave
$200,000
$225,000
$250,000
$275,000
$300,000
$325,000
$350,000
0
150
300
450
600
750
900
Sep-16Sep-15Sep-14Sep-13Sep-12Sep-11
LAND SALES - NELAND MEDIAN - NEPMR LAND MEDIAN
PERTH NORTH EAST SUB-REGION Source: Landgate/REIWA
TOP 10 SUBURBS BY QUARTERLY CHANGE IN PRICE Source: Landgate/REIWA
NORTH EASTYear to September 2016 Quarterly Change
in Annual Median %House Sales Median Price Highest Price
Guildford 32 $632,500 $1,230,000 2.8%
South Guildford 47 $558,000 $900,000 2.4%
Greenmount 43 $470,000 $890,000 2.2%
Swan View 104 $408,500 $880,000 0.9%
Lesmurdie 78 $595,000 $1,245,000 0.8%
Middle Swan 30 $376,500 $490,000 0.4%
The Vines 78 $687,500 $1,165,000 0.4%
Aveley 154 $471,000 $700,000 0.2%
Maida Vale 43 $520,000 $1,300,000 0.0%
Glen Forrest 31 $565,000 $945,000 0.0%
Excludes suburbs with less than 30 sales for the year & dwellings on lots greater than 1 Ha.
Housing and Multi-residential MarketPreliminary September quarter sales activity is showing a decline of 29 per cent in the North East sub-region. The decline in sales volumes is smaller in this quarter when compared to the June 2016 quarter. Just as was the case in the previous two quarters, all of the sub-markets have contributed to the decline in sales with the Mundaring sub-market recording the largest fall (down 49 per cent) for the quarter.
The preliminary North East sub-region September quarterly median was lower by 3.2 per cent to $450,000 from the revised June 2016 quarter median of $465,000. The Kalamunda sub-market has slipped 5.8 per cent, the Mundaring sub-market is down 4.0 per cent and Swan has declined by 3.9 per cent for the June quarter.
The quarterly change in the annual median for the North East sub-region is also softer, declining 1.1 per cent. In terms of longer growth rates, based on the more stable annual median, the year to September 2016 median is $460,000, down 5.2 per cent.
Guildford topped the local list for best performing suburb based on the quarterly change in the annual median, recording a 2.8 per cent increase, followed by South Guildford at 2.4 per cent and Greenmount at 2.2 per cent.
Whilst the multi-residential market is not significant in the North East sub-region, most of the activity was in the Swan sub-market. The preliminary quarterly median price for units in the North East sub-region is down 9.5 per cent from the June 2016 quarter to $310,000.
SAMPLE
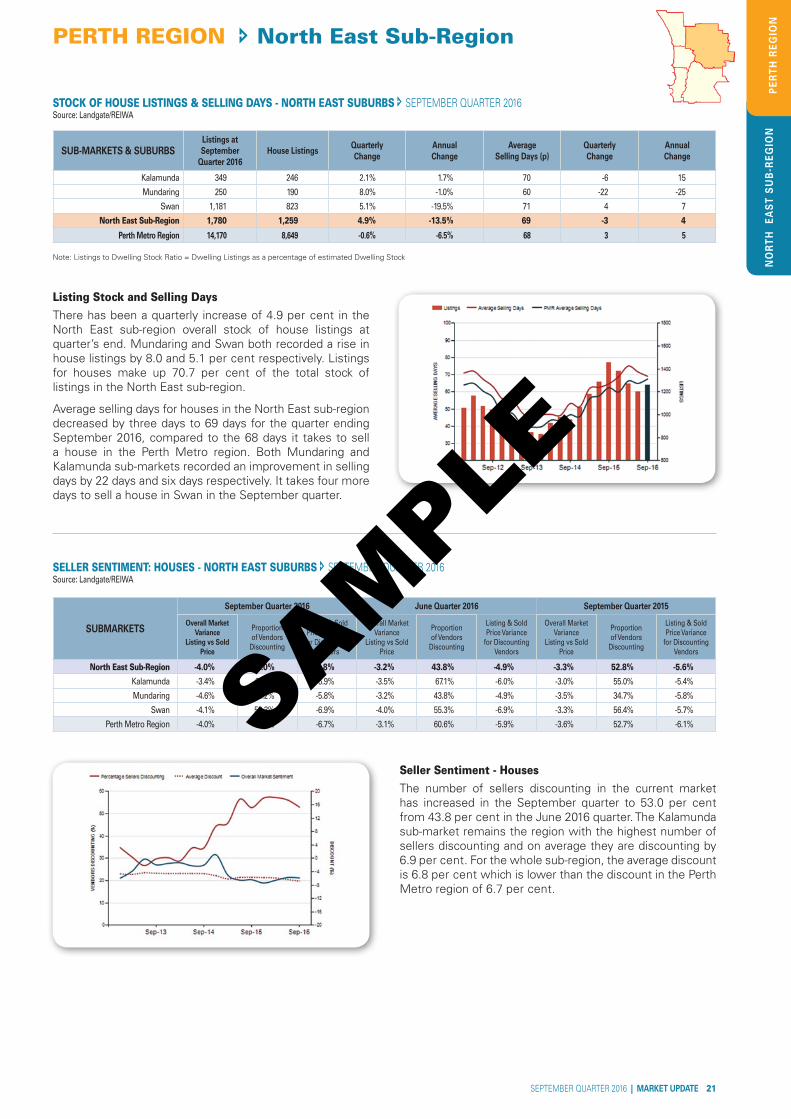
NO
RT
H
EA
ST
SU
B-R
EG
ION
SEPTEMBER QUARTER 2016 | MARKET UPDATE 21
PERTH REGION North East Sub-Region
PE
RT
H R
EG
ION
SUB-MARKETS & SUBURBSListings at September
Quarter 2016House Listings
Quarterly Change
Annual Change
Average Selling Days (p)
Quarterly Change
Annual Change
Kalamunda 349 246 2.1% 1.7% 70 -6 15
Mundaring 250 190 8.0% -1.0% 60 -22 -25
Swan 1,181 823 5.1% -19.5% 71 4 7
North East Sub-Region 1,780 1,259 4.9% -13.5% 69 -3 4
Perth Metro Region 14,170 8,649 -0.6% -6.5% 68 3 5
Note: Listings to Dwelling Stock Ratio = Dwelling Listings as a percentage of estimated Dwelling Stock
SUBMARKETS
September Quarter 2016 June Quarter 2016 September Quarter 2015
Overall Market Variance
Listing vs Sold Price
Proportion of Vendors
Discounting
Listing & Sold Price Variance
for Discounting Vendors
Overall Market Variance
Listing vs Sold Price
Proportion of Vendors
Discounting
Listing & Sold Price Variance
for Discounting Vendors
Overall Market Variance
Listing vs Sold Price
Proportion of Vendors
Discounting
Listing & Sold Price Variance
for Discounting Vendors
North East Sub-Region -4.0% 53.0% -6.8% -3.2% 43.8% -4.9% -3.3% 52.8% -5.6%Kalamunda -3.4% 61.6% -6.9% -3.5% 67.1% -6.0% -3.0% 55.0% -5.4%
Mundaring -4.6% 35.2% -5.8% -3.2% 43.8% -4.9% -3.5% 34.7% -5.8%
Swan -4.1% 53.3% -6.9% -4.0% 55.3% -6.9% -3.3% 56.4% -5.7%
Perth Metro Region -4.0% 51.8% -6.7% -3.1% 60.6% -5.9% -3.6% 52.7% -6.1%
Listing Stock and Selling Days There has been a quarterly increase of 4.9 per cent in the North East sub-region overall stock of house listings at quarter’s end. Mundaring and Swan both recorded a rise in house listings by 8.0 and 5.1 per cent respectively. Listings for houses make up 70.7 per cent of the total stock of listings in the North East sub-region.
Average selling days for houses in the North East sub-region decreased by three days to 69 days for the quarter ending September 2016, compared to the 68 days it takes to sell a house in the Perth Metro region. Both Mundaring and Kalamunda sub-markets recorded an improvement in selling days by 22 days and six days respectively. It takes four more days to sell a house in Swan in the September quarter.
Seller Sentiment - HousesThe number of sellers discounting in the current market has increased in the September quarter to 53.0 per cent from 43.8 per cent in the June 2016 quarter. The Kalamunda sub-market remains the region with the highest number of sellers discounting and on average they are discounting by 6.9 per cent. For the whole sub-region, the average discount is 6.8 per cent which is lower than the discount in the Perth Metro region of 6.7 per cent.
SELLER SENTIMENT: HOUSES - NORTH EAST SUBURBS SEPTEMBER QUARTER 2016Source: Landgate/REIWA
STOCK OF HOUSE LISTINGS & SELLING DAYS - NORTH EAST SUBURBS SEPTEMBER QUARTER 2016Source: Landgate/REIWA
SAMPLE
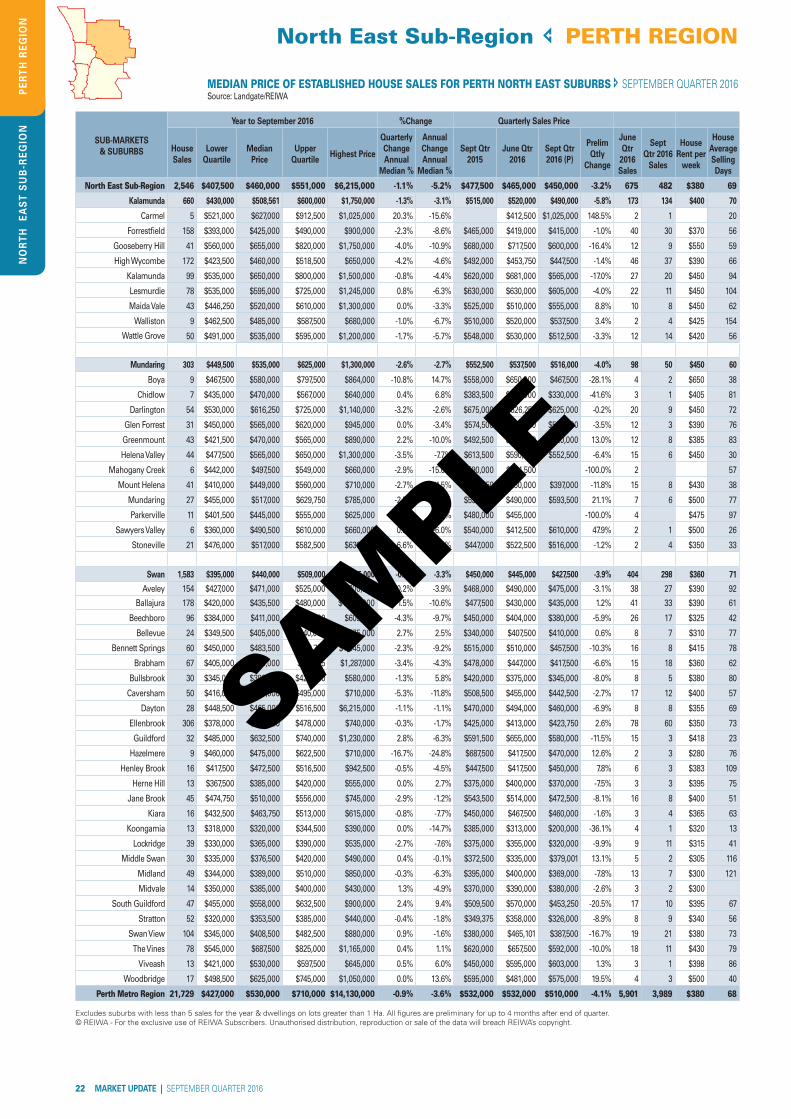
NO
RT
H
EA
ST
SU
B-R
EG
ION
22 MARKET UPDATE | SEPTEMBER QUARTER 2016
North East Sub-Region PERTH REGIONP
ER
TH
RE
GIO
N
SUB-MARKETS& SUBURBS
Year to September 2016 %Change Quarterly Sales Price
House Sales
Lower Quartile
Median Price
Upper Quartile
Highest Price
Quarterly Change Annual
Median %
Annual Change Annual
Median %
Sept Qtr 2015
June Qtr 2016
Sept Qtr 2016 (P)
Prelim Qtly
Change
June Qtr
2016 Sales
Sept Qtr 2016
Sales
House Rent per
week
House Average Selling Days
North East Sub-Region 2,546 $407,500 $460,000 $551,000 $6,215,000 -1.1% -5.2% $477,500 $465,000 $450,000 -3.2% 675 482 $380 69
Kalamunda 660 $430,000 $508,561 $600,000 $1,750,000 -1.3% -3.1% $515,000 $520,000 $490,000 -5.8% 173 134 $400 70
Carmel 5 $521,000 $627,000 $912,500 $1,025,000 20.3% -15.6% $412,500 $1,025,000 148.5% 2 1 20
Forrestfield 158 $393,000 $425,000 $490,000 $900,000 -2.3% -8.6% $465,000 $419,000 $415,000 -1.0% 40 30 $370 56
Gooseberry Hill 41 $560,000 $655,000 $820,000 $1,750,000 -4.0% -10.9% $680,000 $717,500 $600,000 -16.4% 12 9 $550 59
High Wycombe 172 $423,500 $460,000 $518,500 $650,000 -4.2% -4.6% $492,000 $453,750 $447,500 -1.4% 46 37 $390 66
Kalamunda 99 $535,000 $650,000 $800,000 $1,500,000 -0.8% -4.4% $620,000 $681,000 $565,000 -17.0% 27 20 $450 94
Lesmurdie 78 $535,000 $595,000 $725,000 $1,245,000 0.8% -6.3% $630,000 $630,000 $605,000 -4.0% 22 11 $450 104
Maida Vale 43 $446,250 $520,000 $610,000 $1,300,000 0.0% -3.3% $525,000 $510,000 $555,000 8.8% 10 8 $450 62
Walliston 9 $462,500 $485,000 $587,500 $680,000 -1.0% -6.7% $510,000 $520,000 $537,500 3.4% 2 4 $425 154
Wattle Grove 50 $491,000 $535,000 $595,000 $1,200,000 -1.7% -5.7% $548,000 $530,000 $512,500 -3.3% 12 14 $420 56
Mundaring 303 $449,500 $535,000 $625,000 $1,300,000 -2.6% -2.7% $552,500 $537,500 $516,000 -4.0% 98 50 $450 60
Boya 9 $467,500 $580,000 $797,500 $864,000 -10.8% 14.7% $558,000 $650,000 $467,500 -28.1% 4 2 $650 38
Chidlow 7 $435,000 $470,000 $567,000 $640,000 0.4% 6.8% $383,500 $565,000 $330,000 -41.6% 3 1 $405 81
Darlington 54 $530,000 $616,250 $725,000 $1,140,000 -3.2% -2.6% $675,000 $626,250 $625,000 -0.2% 20 9 $450 72
Glen Forrest 31 $450,000 $565,000 $620,000 $945,000 0.0% -3.4% $574,500 $570,000 $550,000 -3.5% 12 3 $390 76
Greenmount 43 $421,500 $470,000 $565,000 $890,000 2.2% -10.0% $492,500 $460,000 $520,000 13.0% 12 8 $385 83
Helena Valley 44 $477,500 $565,000 $650,000 $1,300,000 -3.5% -7.7% $613,500 $590,000 $552,500 -6.4% 15 6 $450 30
Mahogany Creek 6 $442,000 $497,500 $549,000 $660,000 -2.9% -15.0% $590,000 $464,500 -100.0% 2 57
Mount Helena 41 $410,000 $449,000 $560,000 $710,000 -2.7% -11.5% $488,250 $450,000 $397,000 -11.8% 15 8 $430 38
Mundaring 27 $455,000 $517,000 $629,750 $785,000 -2.5% -12.4% $530,500 $490,000 $593,500 21.1% 7 6 $500 77
Parkerville 11 $401,500 $445,000 $555,000 $625,000 -3.3% -11.0% $480,000 $455,000 -100.0% 4 $475 97
Sawyers Valley 6 $360,000 $490,500 $610,000 $660,000 0.0% -6.0% $540,000 $412,500 $610,000 47.9% 2 1 $500 26
Stoneville 21 $476,000 $517,000 $582,500 $630,000 6.6% 6.1% $447,000 $522,500 $516,000 -1.2% 2 4 $350 33
Swan 1,583 $395,000 $440,000 $509,000 $6,215,000 -0.6% -3.3% $450,000 $445,000 $427,500 -3.9% 404 298 $360 71
Aveley 154 $427,000 $471,000 $525,000 $700,000 0.2% -3.9% $468,000 $490,000 $475,000 -3.1% 38 27 $390 92
Ballajura 178 $420,000 $435,500 $480,000 $1,000,000 -1.5% -10.6% $477,500 $430,000 $435,000 1.2% 41 33 $390 61
Beechboro 96 $384,000 $411,000 $450,000 $605,000 -4.3% -9.7% $450,000 $404,000 $380,000 -5.9% 26 17 $325 42
Bellevue 24 $349,500 $405,000 $440,000 $575,000 2.7% 2.5% $340,000 $407,500 $410,000 0.6% 8 7 $310 77
Bennett Springs 60 $450,000 $483,500 $538,750 $1,045,000 -2.3% -9.2% $515,000 $510,000 $457,500 -10.3% 16 8 $415 78
Brabham 67 $405,000 $440,000 $477,125 $1,287,000 -3.4% -4.3% $478,000 $447,000 $417,500 -6.6% 15 18 $360 62
Bullsbrook 30 $345,000 $390,000 $423,000 $580,000 -1.3% 5.8% $420,000 $375,000 $345,000 -8.0% 8 5 $380 80
Caversham 50 $416,000 $450,000 $495,000 $710,000 -5.3% -11.8% $508,500 $455,000 $442,500 -2.7% 17 12 $400 57
Dayton 28 $448,500 $465,000 $516,500 $6,215,000 -1.1% -1.1% $470,000 $494,000 $460,000 -6.9% 8 8 $355 69
Ellenbrook 306 $378,000 $423,750 $478,000 $740,000 -0.3% -1.7% $425,000 $413,000 $423,750 2.6% 78 60 $350 73
Guildford 32 $485,000 $632,500 $740,000 $1,230,000 2.8% -6.3% $591,500 $655,000 $580,000 -11.5% 15 3 $418 23
Hazelmere 9 $460,000 $475,000 $622,500 $710,000 -16.7% -24.8% $687,500 $417,500 $470,000 12.6% 2 3 $280 76
Henley Brook 16 $417,500 $472,500 $516,500 $942,500 -0.5% -4.5% $447,500 $417,500 $450,000 7.8% 6 3 $383 109
Herne Hill 13 $367,500 $385,000 $420,000 $555,000 0.0% 2.7% $375,000 $400,000 $370,000 -7.5% 3 3 $395 75
Jane Brook 45 $474,750 $510,000 $556,000 $745,000 -2.9% -1.2% $543,500 $514,000 $472,500 -8.1% 16 8 $400 51
Kiara 16 $432,500 $463,750 $513,000 $615,000 -0.8% -7.7% $450,000 $467,500 $460,000 -1.6% 3 4 $365 63
Koongamia 13 $318,000 $320,000 $344,500 $390,000 0.0% -14.7% $385,000 $313,000 $200,000 -36.1% 4 1 $320 13
Lockridge 39 $330,000 $365,000 $390,000 $535,000 -2.7% -7.6% $375,000 $355,000 $320,000 -9.9% 9 11 $315 41
Middle Swan 30 $335,000 $376,500 $420,000 $490,000 0.4% -0.1% $372,500 $335,000 $379,001 13.1% 5 2 $305 116
Midland 49 $344,000 $389,000 $510,000 $850,000 -0.3% -6.3% $395,000 $400,000 $369,000 -7.8% 13 7 $300 121
Midvale 14 $350,000 $385,000 $400,000 $430,000 1.3% -4.9% $370,000 $390,000 $380,000 -2.6% 3 2 $300
South Guildford 47 $455,000 $558,000 $632,500 $900,000 2.4% 9.4% $509,500 $570,000 $453,250 -20.5% 17 10 $395 67
Stratton 52 $320,000 $353,500 $385,000 $440,000 -0.4% -1.8% $349,375 $358,000 $326,000 -8.9% 8 9 $340 56
Swan View 104 $345,000 $408,500 $482,500 $880,000 0.9% -1.6% $380,000 $465,101 $387,500 -16.7% 19 21 $380 73
The Vines 78 $545,000 $687,500 $825,000 $1,165,000 0.4% 1.1% $620,000 $657,500 $592,000 -10.0% 18 11 $430 79
Viveash 13 $421,000 $530,000 $597,500 $645,000 0.5% 6.0% $450,000 $595,000 $603,000 1.3% 3 1 $398 86
Woodbridge 17 $498,500 $625,000 $745,000 $1,050,000 0.0% 13.6% $595,000 $481,000 $575,000 19.5% 4 3 $500 40
Perth Metro Region 21,729 $427,000 $530,000 $710,000 $14,130,000 -0.9% -3.6% $532,000 $532,000 $510,000 -4.1% 5,901 3,989 $380 68
Excludes suburbs with less than 5 sales for the year & dwellings on lots greater than 1 Ha. All figures are preliminary for up to 4 months after end of quarter. © REIWA - For the exclusive use of REIWA Subscribers. Unauthorised distribution, reproduction or sale of the data will breach REIWA’s copyright.
MEDIAN PRICE OF ESTABLISHED HOUSE SALES FOR PERTH NORTH EAST SUBURBS SEPTEMBER QUARTER 2016Source: Landgate/REIWA
SAMPLE
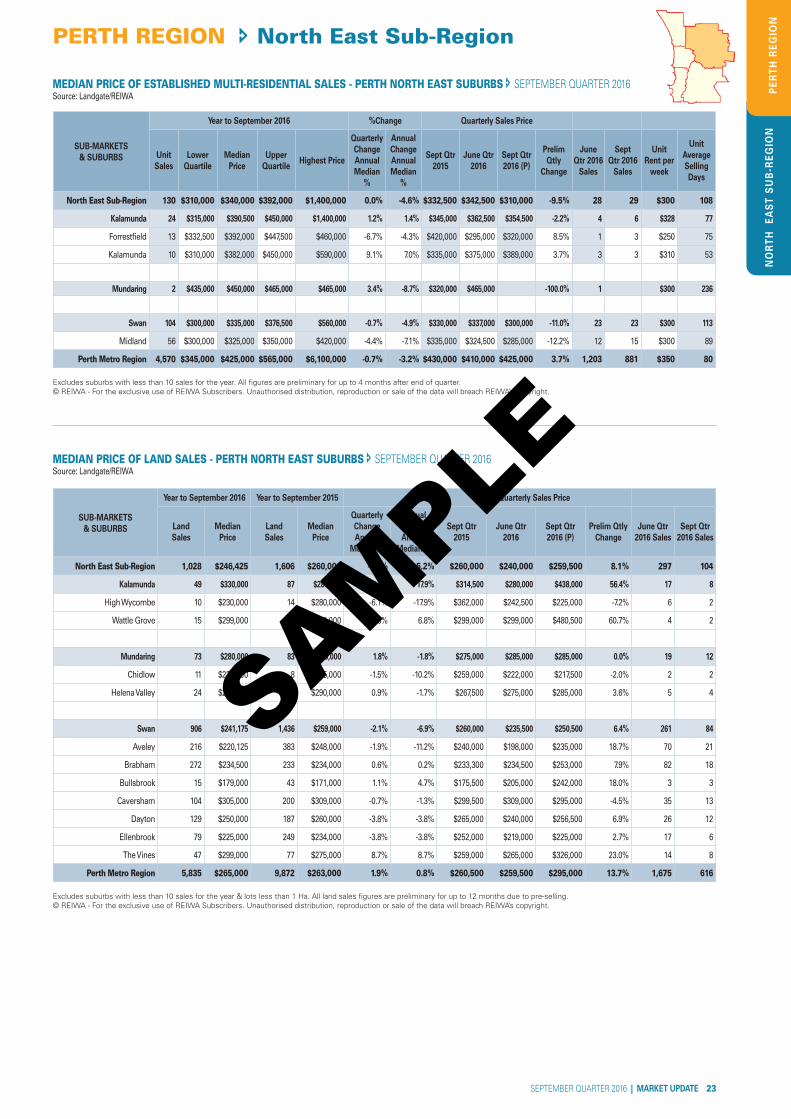
NO
RT
H
EA
ST
SU
B-R
EG
ION
SEPTEMBER QUARTER 2016 | MARKET UPDATE 23
PERTH REGION North East Sub-Region
PE
RT
H R
EG
ION
SUB-MARKETS& SUBURBS
Year to September 2016 %Change Quarterly Sales Price
Unit Sales
Lower Quartile
Median Price
Upper Quartile
Highest Price
Quarterly Change Annual Median
%
Annual Change Annual Median
%
Sept Qtr 2015
June Qtr 2016
Sept Qtr 2016 (P)
Prelim Qtly
Change
June Qtr 2016
Sales
Sept Qtr 2016
Sales
Unit Rent per
week
Unit Average Selling Days
North East Sub-Region 130 $310,000 $340,000 $392,000 $1,400,000 0.0% -4.6% $332,500 $342,500 $310,000 -9.5% 28 29 $300 108
Kalamunda 24 $315,000 $390,500 $450,000 $1,400,000 1.2% 1.4% $345,000 $362,500 $354,500 -2.2% 4 6 $328 77
Forrestfield 13 $332,500 $392,000 $447,500 $460,000 -6.7% -4.3% $420,000 $295,000 $320,000 8.5% 1 3 $250 75
Kalamunda 10 $310,000 $382,000 $450,000 $590,000 9.1% 7.0% $335,000 $375,000 $389,000 3.7% 3 3 $310 53
Mundaring 2 $435,000 $450,000 $465,000 $465,000 3.4% -8.7% $320,000 $465,000 -100.0% 1 $300 236
Swan 104 $300,000 $335,000 $376,500 $560,000 -0.7% -4.9% $330,000 $337,000 $300,000 -11.0% 23 23 $300 113
Midland 56 $300,000 $325,000 $350,000 $420,000 -4.4% -7.1% $335,000 $324,500 $285,000 -12.2% 12 15 $300 89
Perth Metro Region 4,570 $345,000 $425,000 $565,000 $6,100,000 -0.7% -3.2% $430,000 $410,000 $425,000 3.7% 1,203 881 $350 80
Excludes suburbs with less than 10 sales for the year. All figures are preliminary for up to 4 months after end of quarter. © REIWA - For the exclusive use of REIWA Subscribers. Unauthorised distribution, reproduction or sale of the data will breach REIWA’s copyright.
MEDIAN PRICE OF ESTABLISHED MULTI-RESIDENTIAL SALES - PERTH NORTH EAST SUBURBS SEPTEMBER QUARTER 2016Source: Landgate/REIWA
SUB-MARKETS& SUBURBS
Year to September 2016 Year to September 2015 Quarterly Sales Price
Land Sales
Median Price
Land Sales
Median Price
Quarterly Change Annual
Median %
Annual Change Annual
Median %
Sept Qtr 2015
June Qtr 2016
Sept Qtr 2016 (P)
Prelim Qtly Change
June Qtr 2016 Sales
Sept Qtr 2016 Sales
North East Sub-Region 1,028 $246,425 1,606 $260,000 -2.2% -5.2% $260,000 $240,000 $259,500 8.1% 297 104
Kalamunda 49 $330,000 87 $280,000 10.4% 17.9% $314,500 $280,000 $438,000 56.4% 17 8
High Wycombe 10 $230,000 14 $280,000 -6.1% -17.9% $362,000 $242,500 $225,000 -7.2% 6 2
Wattle Grove 15 $299,000 47 $280,000 3.3% 6.8% $299,000 $299,000 $480,500 60.7% 4 2
Mundaring 73 $280,000 83 $285,000 1.8% -1.8% $275,000 $285,000 $285,000 0.0% 19 12
Chidlow 11 $229,000 8 $255,000 -1.5% -10.2% $259,000 $222,000 $217,500 -2.0% 2 2
Helena Valley 24 $285,000 24 $290,000 0.9% -1.7% $267,500 $275,000 $285,000 3.6% 5 4
Swan 906 $241,175 1,436 $259,000 -2.1% -6.9% $260,000 $235,500 $250,500 6.4% 261 84
Aveley 216 $220,125 383 $248,000 -1.9% -11.2% $240,000 $198,000 $235,000 18.7% 70 21
Brabham 272 $234,500 233 $234,000 0.6% 0.2% $233,300 $234,500 $253,000 7.9% 82 18
Bullsbrook 15 $179,000 43 $171,000 1.1% 4.7% $175,500 $205,000 $242,000 18.0% 3 3
Caversham 104 $305,000 200 $309,000 -0.7% -1.3% $299,500 $309,000 $295,000 -4.5% 35 13
Dayton 129 $250,000 187 $260,000 -3.8% -3.8% $265,000 $240,000 $256,500 6.9% 26 12
Ellenbrook 79 $225,000 249 $234,000 -3.8% -3.8% $252,000 $219,000 $225,000 2.7% 17 6
The Vines 47 $299,000 77 $275,000 8.7% 8.7% $259,000 $265,000 $326,000 23.0% 14 8
Perth Metro Region 5,835 $265,000 9,872 $263,000 1.9% 0.8% $260,500 $259,500 $295,000 13.7% 1,675 616
Excludes suburbs with less than 10 sales for the year & lots less than 1 Ha. All land sales figures are preliminary for up to 12 months due to pre-selling.© REIWA - For the exclusive use of REIWA Subscribers. Unauthorised distribution, reproduction or sale of the data will breach REIWA’s copyright.
MEDIAN PRICE OF LAND SALES - PERTH NORTH EAST SUBURBS SEPTEMBER QUARTER 2016Source: Landgate/REIWA
SAMPLE

SO
UT
H E
AS
T S
UB
-RE
GIO
N
24 MARKET UPDATE | SEPTEMBER QUARTER 2016
South East Sub-Region PERTH REGIONP
ER
TH
RE
GIO
N
TOP 5 SUBURBS BY VOLUMESource: Landgate/REIWA
Year to September 2016 Land Sales Median PriceQuarterly Change in Annual Median %
Perth Metro Region 5,835 $265,000 1.9%
South East Sub-Region 1,196 $240,000 0.0%
Piara Waters 222 $284,500 -2.2%
Byford 219 $207,500 1.0%
Hilbert 112 $194,800 -0.1%
Maddington 89 $237,000 -1.3%
Harrisdale 88 $294,000 -0.7%
Land Market Whilst land sales activity in the South East sub-region continues to soften in the quarter, it is important to note that over coming months land sales will settle and on average lift the volumes up, as was evident in the June 2016 quarter. In the June edition of Market Update, we reported land sales of 162, but now in the September quarter that figure has revised up to 340 sales.
Preliminary data suggests stability in quarterly median prices for the South East sub-region remaining at $240,000 with the June quarter revised median. For the year to September 2016, the annual change in annual median is down 2.5 per cent to $240,000.
Piara Waters is the bestselling suburb in the South East sub-region for land sales, recording 222 sales in the year to September 2016. Other suburbs with top sales include, Byford with 219 sales, Hilbert at 112 sales, Maddington with 89 sales and Harrisdale with 88 sales.
$300,000
$350,000
$400,000
$450,000
$500,000
$550,000
$600,000
0
250
500
750
1,000
1,250
1,500
Sep-16Sep-15Sep-14Sep-13Sep-12Sep-11
HOUSE SALES - SEHOUSE MEDIAN - SEPMR HOUSE MEDIAN
Source: Landgate/REIWA PERTH SOUTH EAST SUB-REGION
10 Year Ave
$175,000
$200,000
$225,000
$250,000
$275,000
$300,000
$325,000
$350,000
0
200
400
600
800
1,000
Sep-16Sep-15Sep-14Sep-13Sep-12Sep-11
LAND SALES - SELAND MEDIAN - SEPMR LAND MEDIAN
PERTH SOUTH EAST SUB-REGION Source: Landgate/REIWA
TOP 10 SUBURBS BY QUARTERLY CHANGE IN PRICE Source: Landgate/REIWA
SOUTH EAST
Year to September 2016 Quarterly Change in
Annual Median %
House Sales Median PriceHighest
Price
Camillo 48 $311,000 $445,000 0.3%
Southern River 111 $587,000 $1,175,000 0.2%
Beckenham 88 $449,000 $1,900,000 -0.2%
Maddington 159 $370,000 $1,500,000 -0.4%
Mount Richon 32 $433,000 $822,000 -0.5%
Armadale 183 $310,000 $1,400,000 -0.6%
Roleystone 89 $540,000 $900,000 -0.9%
Langford 47 $414,000 $580,000 -1.0%
Gosnells 230 $358,750 $670,000 -1.0%
Thornlie 262 $445,000 $600,000 -1.1%
Excludes suburbs with less than 30 sales for the year & dwellings on lots greater than 1 Ha.
Housing and Multi-residential Market Preliminary sales in the South East sub-region have decreased by approximately 26 per cent during the September quarter. All three sub-markets of Armadale, Gosnells and Serpentine-Jarrahdale recorded a drop in sales activity of 23 per cent, 26 per cent and 36 per cent respectively.
The preliminary South East sub-region quarterly median is down 1.1 per cent to $430,000 from a revised June quarter median of $435,000. At a sub-market level, all sub-markets fell during the quarter, Armadale (down 2.0 per cent), Gosnells (down 1.2 per cent) and Serpentine-Jarrahdale (down 1.2 per cent).
For the year to September 2016, the quarterly change in the annual median is down 1.1 per cent and the more stable annual change in annual median is also down by 3.3 per cent for the year to $435,000.
The top performing suburbs in terms of quarterly change in annual median in the sub-region include Camillo and Southern River with marginal 0.3 and 0.2 per cent improvements respectively, while the rest recorded marginal declines of up to 1.1 per cent.
Whilst the multi-residential market is not significant in the South East sub-region, most of the activity was in the Gosnells sub-market. The preliminary quarterly median price for units in the South East sub-region is up 15.6 per cent from the September 2016 quarter to $285,500 from a revised June quarter median of $247,500.
SAMPLE

SO
UT
H E
AS
T S
UB
-RE
GIO
N
SEPTEMBER QUARTER 2016 | MARKET UPDATE 25
PERTH REGION South East Sub-Region
PE
RT
H R
EG
ION
Listing Stock and Selling Days The overall stock of house listings in the South East sub-region increased by 0.1 per cent in the September quarter. The sub-market of Gosnells saw a decrease of 7.7 per cent, whilst both Armadale and Serpentine-Jarrahdale increased by 9.8 and 1.8 per cent respectively in stock levels. House listings make up 64 per cent of total stock in the South East sub-region.
Average selling days for houses only increased by six day in the quarter to record 71 days, three day longer to sell houses than the Perth metro market. The Serpentine-Jarrahdale sub-market deteriorated by 27 days in the quarter to reach 94 selling days. It takes 72 days to sell a house in Armadale (up eight days) and 66 days in Gosnells (up by one day).
Seller Sentiment - HousesThe number of sellers discounting in the South East sub-region has increased over the September quarter to 63.7 per cent. This is 2.9 percentage points higher than the same time last year. The average discount offered by sellers in the South East sub-region is 6.6 per cent, an increase on the 6.2 per cent recorded in the June 2016 quarter. The overall market sentiment in the sub-region is still pessimistic but marginally better than the Perth Metro region by 0.1 percentage points.
STOCK OF HOUSE LISTINGS & SELLING DAYS - SOUTH EAST SEPTEMBER QUARTER 2016Source: Landgate/REIWA
SELLER SENTIMENT: HOUSES - SOUTH EAST SEPTEMBER QUARTER 2016Source: Landgate/REIWA
SUBMARKETS
September Quarter 2016 June Quarter 2016 September Quarter 2015
Overall Market Variance
Listing vs Sold Price
Proportion of Vendors
Discounting
Listing & Sold Price Variance
for Discounting Vendors
Overall Market Variance
Listing vs Sold Price
Proportion of Vendors
Discounting
Listing & Sold Price Variance
for Discounting Vendors
Overall Market Variance
Listing vs Sold Price
Proportion of Vendors
Discounting
Listing & Sold Price Variance
for Discounting Vendors
South East Sub-Region -3.5% 63.7% -6.6% -3.2% 61.2% -6.2% -3.3% 60.8% -5.6%
Armadale -3.1% 61.1% -5.6% -3.3% 66.7% -5.8% -3.2% 63.8% -5.9%
Gosnells -3.6% 62.7% -7.3% -3.2% 61.2% -6.2% -3.5% 57.9% -5.4%
Serpentine-Jarrahdale -3.8% 76.2% -6.6% -3.1% 71.6% -5.4% -2.7% 63.9% -5.0%
Perth Metro Region -4.0% 51.8% -6.7% -3.1% 60.6% -5.9% -3.6% 52.7% -6.1%
SUB-MARKETSListings at Sept
Quarter 2016House Listings
Quarterly Change
Annual Change
Average Selling Days (p)
Quarterly Change
Annual Change
Armadale 927 548 9.8% -3.2% 72 8 2
Gosnells 858 615 -7.7% -2.5% 66 1 11
Serpentine-Jarrahdale 281 166 1.8% -4.6% 94 27 17
South East Sub-Region 2,066 1,329 0.1% -3.1% 71 6 8
Perth Metro Region 14,170 8,649 -0.6% -6.5% 68 3 5
Note: Listings to Dwelling Stock Ratio = Dwelling Listings as a percentage of estimated Dwelling Stock
SAMPLE

SO
UT
H E
AS
T S
UB
-RE
GIO
N
26 MARKET UPDATE | SEPTEMBER QUARTER 2016
South East Sub-Region PERTH REGIONP
ER
TH
RE
GIO
N
SUB-MARKETS& SUBURBS
Year to September 2016 %Change Quarterly Sales Price
House Sales
Lower Quartile
Median Price
Upper Quartile
Highest Price
Quarterly Change Annual
Median %
Annual Change Annual
Median %
Sept Qtr 2015
June Qtr 2016
Sept Qtr 2016 (P)
Prelim Qtly
Change
June Qtr 2016
Sales
Sept Qtr 2016
Sales
House Rent per
week
House Average Selling Days
South East Sub-Region 2,678 $360,000 $435,000 $540,000 $3,080,000 -1.1% -3.3% $445,000 $435,000 $430,000 -1.1% 691 512 $350 71
Armadale 1,019 $325,000 $412,500 $525,000 $3,080,000 -0.6% -1.8% $420,000 $415,000 $406,500 -2.0% 250 192 $320 72
Armadale 183 $270,000 $310,000 $345,000 $1,400,000 -0.6% -3.1% $310,000 $315,000 $290,000 -7.9% 41 30 $283 78
Bedfordale 25 $660,000 $725,000 $795,000 $1,100,000 -1.0% -3.3% $745,000 $653,500 $740,000 13.2% 8 7 $500 83
Brookdale 28 $307,500 $322,500 $340,000 $405,000 -2.3% -5.1% $374,000 $330,000 $310,000 -6.1% 5 7 $308 65
Camillo 48 $285,000 $311,000 $350,000 $445,000 0.3% -2.2% $312,500 $302,500 $322,500 6.6% 11 8 $290 110
Champion Lakes 14 $430,000 $470,750 $550,000 $660,000 2.3% 2.7% $455,000 $469,500 $552,500 17.7% 6 3 $425 102
Forrestdale 5 $367,500 $400,000 $520,000 $560,000 1.1% -8.0% $391,000 $225,000 $407,500 81.1% 1 2 $375 98
Harrisdale 115 $460,000 $520,000 $612,500 $3,080,000 -2.8% -7.0% $603,000 $510,000 $530,000 3.9% 31 21 $380 44
Hilbert 32 $326,000 $406,250 $680,000 $899,000 -1.5% -23.3% $402,500 $387,000 $353,500 -8.7% 9 7 $345 88
Kelmscott 128 $315,000 $377,000 $455,000 $780,000 -2.1% -3.3% $394,000 $350,000 $385,000 10.0% 36 21 $280 50
Mount Nasura 54 $360,000 $405,000 $535,000 $700,000 -1.8% -12.0% $430,000 $389,000 $395,000 1.5% 12 11 $415 60
Mount Richon 32 $382,000 $433,000 $532,000 $822,000 -0.5% -11.6% $450,000 $500,000 $445,500 -10.9% 9 4 $330 127
Piara Waters 120 $480,000 $526,000 $600,000 $947,000 -2.6% -4.6% $554,000 $565,000 $505,000 -10.6% 31 23 $400 58
Roleystone 89 $480,000 $540,000 $638,000 $900,000 -0.9% -4.4% $560,000 $600,000 $562,250 -6.3% 13 16 $450 97
Seville Grove 144 $333,750 $385,000 $420,000 $525,000 -1.2% -3.3% $402,500 $385,000 $354,500 -7.9% 37 30 $310 57
Gosnells 1,433 $377,750 $449,000 $550,000 $1,900,000 -0.8% -3.4% $465,000 $445,500 $440,000 -1.2% 372 276 $365 66
Beckenham 88 $410,000 $449,000 $550,000 $1,900,000 -0.2% -3.4% $460,000 $436,500 $490,000 12.3% 32 15 $320 44
Canning Vale 358 $515,000 $580,000 $649,000 $1,385,000 -1.7% -5.2% $595,000 $565,000 $562,000 -0.5% 95 69 $420 64
Gosnells 230 $315,000 $358,750 $407,000 $670,000 -1.0% -5.6% $360,000 $355,000 $327,500 -7.7% 61 45 $300 61
Huntingdale 111 $379,000 $412,000 $452,501 $598,000 -1.9% -7.4% $448,000 $420,000 $420,000 0.0% 25 21 $365 50
Kenwick 50 $320,000 $393,250 $430,000 $1,000,000 -2.9% -2.9% $402,500 $360,000 $329,000 -8.6% 14 7 $340 60
Langford 47 $360,000 $414,000 $449,000 $580,000 -1.0% -3.9% $414,000 $420,000 $376,000 -10.5% 13 8 $310 90
Maddington 159 $330,500 $370,000 $415,000 $1,500,000 -0.4% -4.8% $387,000 $376,000 $372,000 -1.1% 46 31 $310 55
Martin 15 $420,000 $485,000 $586,000 $760,000 0.5% -11.8% $350,000 $630,000 $472,500 -25.0% 2 4 $310 109
Southern River 111 $522,500 $587,000 $650,000 $1,175,000 0.2% -0.8% $567,000 $572,500 $537,000 -6.2% 22 18 $420 116
Thornlie 262 $405,000 $445,000 $485,000 $600,000 -1.1% -3.3% $472,000 $440,000 $435,000 -1.1% 61 58 $355 63
Serpentine-Jarrahdale 226 $390,000 $435,000 $509,000 $1,200,000 0.0% -3.1% $440,000 $425,000 $420,000 -1.2% 69 44 $360 94
Byford 177 $385,000 $425,000 $490,000 $935,000 -1.2% -3.4% $435,000 $420,000 $407,500 -3.0% 57 34 $355 79
Jarrahdale 15 $292,000 $420,000 $633,500 $720,000 -12.5% -21.6% $658,000 $535,000 $285,000 -46.7% 6 3 $490 103
Mundijong 13 $420,000 $442,500 $524,500 $630,000 1.7% 7.8% $412,500 $411,500 $457,500 11.2% 2 2 $490 143
Serpentine 12 $463,000 $512,500 $607,500 $710,000 -4.7% -12.4% $675,000 $380,000 $645,000 69.7% 2 3 $500 73
Perth Metro Region 21,729 $427,000 $530,000 $710,000 $14,130,000 -0.9% -3.6% $532,000 $532,000 $510,000 -4.1% 5,901 3,989 $380 68
Excludes suburbs with less than 5 sales for the year & dwellings on lots greater than 1 Ha. All figures are preliminary for up to 4 months after end of quarter. © REIWA - For the exclusive use of REIWA Subscribers. Unauthorised distribution, reproduction or sale of the data will breach REIWA’s copyright.
MEDIAN PRICE OF ESTABLISHED HOUSE SALES - PERTH SOUTH EAST SUBURBS SEPTEMBER QUARTER 2016 Source: Landgate/REIWA
SAMPLE

SO
UT
H E
AS
T S
UB
-RE
GIO
N
SEPTEMBER QUARTER 2016 | MARKET UPDATE 27
PERTH REGION South East Sub-Region
PE
RT
H R
EG
ION
SUB-MARKETS& SUBURBS
Year to September 2016 %Change Quarterly Sales Price
Unit Sales
Lower Quartile
Median Price
Upper Quartile
Highest Price
Quarterly Change Annual
Median %
Annual Change Annual
Median %
Sept Qtr 2015
June Qtr 2016
Sept Qtr 2016 (P)
Prelim Qtly Change
June Qtr 2016
Sales
Sept Qtr 2016
Sales
Unit Rent per
week
Unit Average Selling Days
South East Sub-Region 107 $249,000 $300,000 $345,000 $1,100,000 -3.2% -6.3% $319,500 $247,000 $285,500 15.6% 22 20 $290 94
Armadale 43 $208,750 $260,000 $292,000 $725,000 -3.7% -15.9% $275,000 $210,000 $282,000 34.3% 13 9 $280 77
Armadale 28 $200,000 $238,250 $282,000 $339,000 -3.5% -24.3% $299,000 $222,000 $200,000 -9.9% 10 5 $275 66
Kelmscott 10 $277,500 $284,000 $300,000 $315,000 1.3% -4.5% $275,000 $242,500 $289,000 19.2% 2 3 $280 60
Gosnells 64 $287,500 $326,250 $365,000 $1,100,000 -4.0% -6.8% $340,000 $315,000 $317,500 0.8% 9 11 $300 105
Beckenham 14 $332,500 $361,750 $380,000 $390,000 -3.9% -4.3% $430,000 $330,000 $332,500 0.8% 2 1 $340 98
Gosnells 23 $273,750 $320,000 $347,000 $1,100,000 -2.3% -2.6% $352,500 $290,000 $296,250 2.2% 5 4 $290 68
Thornlie 13 $262,000 $310,000 $376,500 $450,000 -4.6% -5.3% $325,000 $329,000 $249,000 -24.3% 2 3 $325 106
Perth Metro Region 4,570 $345,000 $425,000 $565,000 $6,100,000 -0.7% -3.2% $430,000 $410,000 $425,000 3.7% 1,203 881 $350 80
Excludes suburbs with less than 10 sales for the year. All figures are preliminary for up to 4 months after end of quarter.© REIWA - For the exclusive use of REIWA Subscribers. Unauthorised distribution, reproduction or sale of the data will breach REIWA’s copyright.
MEDIAN PRICE OF ESTABLISHED MULTI-RESIDENTIAL SALES - PERTH SOUTH EAST SUBURBS SEPTEMBER QUARTER 2016Source: Landgate/REIWA
SUB-MARKETS& SUBURBS
Year to Sepember 2016 Year to Sepember 2016 Quarterly Sales Price
Land Sales
Median Price
Land Sales
Median Price
Quarterly Change Annual
Median %
Annual Change Annual
Median %
Sept Qtr 2015 June Qtr 2016 Sept Qtr 2016 (P)
Prelim Qtly Change
June Qtr 2016 Sales
Sept Qtr 2016 Sales
South East Sub-Region 1,196 $240,000 2,364 $246,200 0.0% -2.5% $240,000 $240,000 $240,000 0.0% 340 93
Armadale 599 $250,000 1,167 $257,000 -2.0% -2.7% $265,000 $237,000 $241,500 1.9% 171 44
Armadale 17 $135,000 13 $310,000 0.0% -56.5% $135,000 $159,000 $229,500 44.3% 5 2
Bedfordale 16 $332,500 16 $342,500 -0.7% -2.9% $335,000 $345,000 -100.0% 3
Champion Lakes 10 $217,000 12 $252,500 -4.8% -14.1% $243,500 $214,500 $209,000 -2.6% 6 3
Harrisdale 88 $294,000 275 $280,000 -0.7% 5.0% $299,000 $290,000 $289,500 -0.2% 23 4
Haynes 68 $210,000 125 $222,000 -2.3% -5.4% $222,500 $209,000 $178,500 -14.6% 20 4
Hilbert 112 $194,800 205 $185,300 -0.1% 5.1% $192,100 $195,000 $186,000 -4.6% 35 9
Piara Waters 222 $284,500 387 $302,000 -2.2% -5.8% $302,250 $295,000 $284,750 -3.5% 60 18
Roleystone 11 $295,000 13 $290,000 0.0% 1.7% $290,000 $295,000 $290,000 -1.7% 3 1
Seville Grove 45 $192,000 96 $234,500 -8.8% -18.1% $210,500 $190,000 $175,000 -7.9% 14 1
Gosnells 316 $275,000 601 $282,000 0.0% -2.5% $277,000 $260,000 $289,000 11.2% 77 28
Beckenham 55 $300,000 107 $280,000 2.4% 7.1% $281,500 $284,500 $322,500 13.4% 20 6
Canning Vale 14 $430,000 34 $312,000 9.6% 37.8% $371,500 $545,000 $444,250 -18.5% 2 2
Gosnells 21 $182,000 50 $236,500 -18.3% -23.0% $235,247 $250,000 -100.0% 6
Huntingdale 16 $282,500 6 $295,000 2.3% -4.2% $283,000 $260,000 $289,000 11.2% 1 2
Maddington 89 $237,000 76 $256,500 -1.3% -7.6% $250,000 $256,000 $240,000 -6.3% 24 7
Martin 29 $265,000 91 $268,000 -1.3% -1.1% $285,000 $279,000 -100.0% 8
Southern River 80 $339,000 216 $325,000 1.2% 4.3% $325,000 $327,500 $335,000 2.3% 12 9
Thornlie 10 $290,000 15 $295,000 -1.7% -1.7% $301,000 $251,500 $400,000 59.0% 4 1
Serpentine-Jarrahdale 281 $205,000 596 $203,500 0.5% 0.7% $200,000 $211,250 $199,000 -5.8% 92 21
Byford 219 $207,500 467 $207,000 1.0% 0.2% $204,000 $212,250 $206,500 -2.7% 72 12
Darling Downs 10 $241,250 33 $216,500 11.2% 11.4% $205,000 $227,500 $242,750 6.7% 3 2
Whitby 47 $192,000 90 $180,000 3.8% 6.7% $181,000 $199,000 $195,000 -2.0% 16 7
Perth Metro Region 5,835 $265,000 9,872 $263,000 1.9% 0.8% $260,500 $259,500 $295,000 13.7% 1,675 616
Excludes suburbs with less than 10 sales for the year & lots less than 1 Ha. All land sales figures are preliminary for up to 12 months due to pre-selling.© REIWA - For the exclusive use of REIWA Subscribers. Unauthorised distribution, reproduction or sale of the data will breach REIWA’s copyright.
MEDIAN PRICE OF LAND SALES - PERTH SOUTH EAST SUBURBS SEPTEMBER QUARTER 2016Source: Landgate/REIWA
SAMPLE

28 MARKET UPDATE | SEPTEMBER QUARTER 2016
South West Sub-Region PERTH REGIONS
OU
TH
WE
ST
SU
B-R
EG
ION
PE
RT
H R
EG
ION
Housing and Multi-residential Market Preliminary sales figures for the September quarter indicate the South West sub-region had weaker sales activity by 26 per cent. Significant drops in sales volumes were felt across all three sub-markets. 26 per cent in Cockburn, 34 per cent in Kwinana and 24 per cent in Rockingham.
The preliminary quarterly median for the South West sub-region is down by 4.4 per cent to $430,000 from a revised June quarter median of $450,000. Sub-markets experienced mixed motion in preliminary quarterly medians with Kwinana and Rockingham in decline by four and 3.6 per cent respectively, whilst Cockburn saw a marginal increase of one per cent.
Looking at the annual median, there were reductions in the annual change in annual medians across all sub-markets, with the sub-region recording a decline of 3.3 per cent to $445,000. Top suburbs in terms of quarterly change in annual median is Coogee at 3.0 per cent, Beeliar at 2.0 per cent and South Lake at 1.1 per cent.
In the multi-residential market, unit sales maintained positive levels of activity in the Cockburn and Kwinana sub-markets with a lift of nine and 75 per cent respectively in September 2016 quarter. The Rockingham sub-markets recorded a drop of 66 per cent in sales activity. The September preliminary quarterly median price is higher by 1.4 per cent to $350,000 over the revised June quarter median of $345,000.
Land Market Whilst preliminary land sales activity in the South West sub-region continues to soften in the quarter it is important to note that over coming months land sales will settle and on average lift the volumes up, as was evident in the June quarter 2016. In the June edition of Market Update, we reported land sales of 162, but now in the June quarter that figure has revised up to 413 sales.
Preliminary data suggests an increase in quarterly median prices for the South West sub-region, up 16.7 per cent to $283,500 from the June quarter revised median of $243,000. For the year to September 2016, the quarterly change in annual median is up by 1.3 per cent, but the annual change in annual median is lower at -2.7 per cent.
Baldivis is the bestselling suburb in the South West sub-region for land sales, recording 325 sales for the year to September 2016. Other suburbs with top sales include, Wellard at 221 sales, Golden Bay at 129, Wandi at 128 sales and Banjup at 76 sales.
$300,000
$350,000
$400,000
$450,000
$500,000
$550,000
$600,000
0
300
600
900
1,200
1,500
1,800
Sep-16Sep-15Sep-14Sep-13Sep-12Sep-11
HOUSE SALES - SWHOUSE MEDIAN - SWPMR HOUSE MEDIAN
Source: Landgate/REIWAPERTH SOUTH WEST SUB-REGION
10 Year Ave
$150,000
$175,000
$200,000
$225,000
$250,000
$275,000
$300,000
$325,000
$350,000
0
200
400
600
800
1,000
1,200
Sep-16Sep-15Sep-14Sep-13Sep-12Sep-11
LAND SALES - SWLAND MEDIAN - SWPMR LAND MEDIAN
PERTH SOUTH WEST SUB-REGION Source: Landgate/REIWA
TOP 10 SUBURBS BY QUARTERLY CHANGE IN PRICE Source: Landgate/REIWA
SOUTH WEST
Year to September 2016 Quarterly Change
in Annual Median %
House Sales Median Price Highest Price
Coogee 42 $750,000 $1,340,000 3.0%
Beeliar 97 $540,000 $2,050,000 2.0%
South Lake 88 $460,000 $568,000 1.1%
Shoalwater 62 $470,000 $1,580,000 1.1%
Munster 66 $580,000 $1,400,000 0.9%
Waikiki 183 $380,000 $825,000 0.5%
Bibra Lake 62 $532,500 $910,000 0.5%
Safety Bay 111 $400,000 $950,000 0.1%
Leda 39 $325,000 $455,000 0.0%
Port Kennedy 179 $400,000 $820,000 0.0%
Singleton 47 $425,000 $795,000 0.0%
Excludes suburbs with less than 30 sales for the year & dwellings on lots greater than 1 Ha.
TOP 5 SUBURBS BY VOLUMESource: Landgate/REIWA
Year to September 2016 Land Sales Median PriceQuarterly Change in Annual Median %
Perth Metro Region 5,835 $265,000 1.9%
South West Sub-Region 1,437 $243,000 1.3%
Baldivis 325 $200,000 -2.0%
Wellard 221 $216,000 -1.8%
Golden Bay 129 $210,000 0.0%
Wandi 128 $279,500 0.0%
Banjup 76 $292,150 -1.2%
SAMPLE
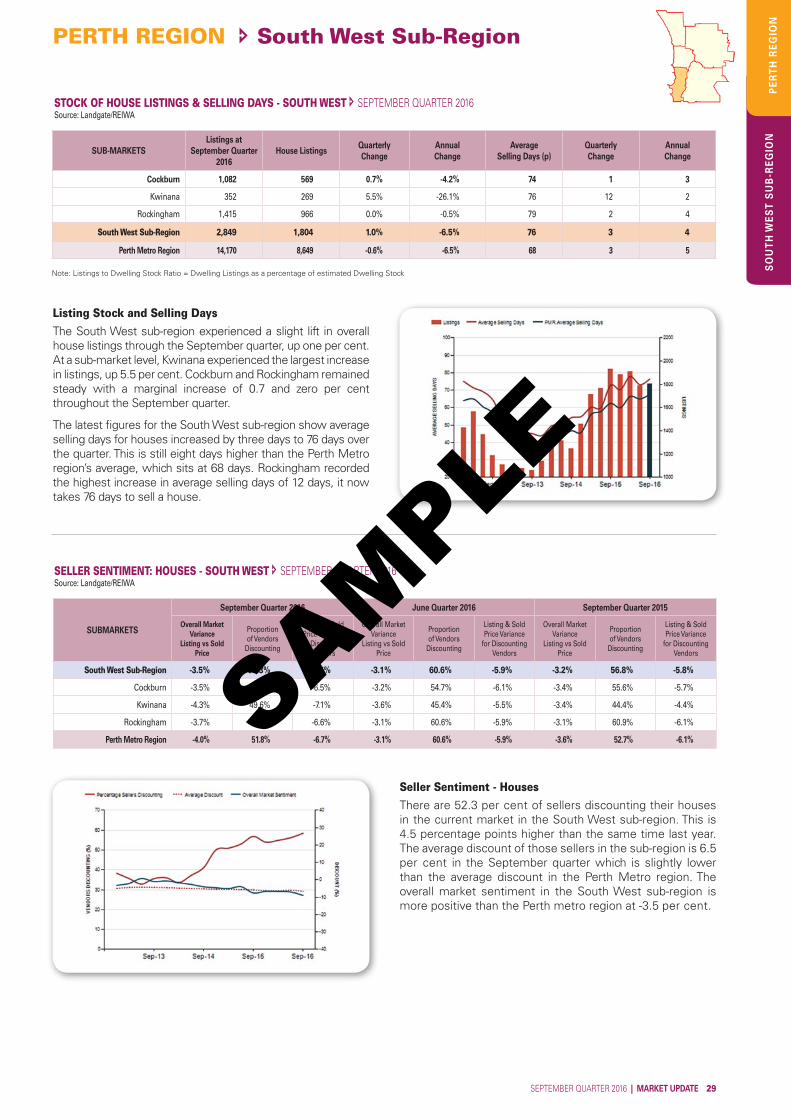
SEPTEMBER QUARTER 2016 | MARKET UPDATE 29
PERTH REGION South West Sub-Region
SO
UT
H W
ES
T S
UB
-RE
GIO
NP
ER
TH
RE
GIO
N
Listing Stock and Selling Days The South West sub-region experienced a slight lift in overall house listings through the September quarter, up one per cent. At a sub-market level, Kwinana experienced the largest increase in listings, up 5.5 per cent. Cockburn and Rockingham remained steady with a marginal increase of 0.7 and zero per cent throughout the September quarter.
The latest figures for the South West sub-region show average selling days for houses increased by three days to 76 days over the quarter. This is still eight days higher than the Perth Metro region’s average, which sits at 68 days. Rockingham recorded the highest increase in average selling days of 12 days, it now takes 76 days to sell a house.
STOCK OF HOUSE LISTINGS & SELLING DAYS - SOUTH WEST SEPTEMBER QUARTER 2016Source: Landgate/REIWA
Seller Sentiment - HousesThere are 52.3 per cent of sellers discounting their houses in the current market in the South West sub-region. This is 4.5 percentage points higher than the same time last year. The average discount of those sellers in the sub-region is 6.5 per cent in the September quarter which is slightly lower than the average discount in the Perth Metro region. The overall market sentiment in the South West sub-region is more positive than the Perth metro region at -3.5 per cent.
SELLER SENTIMENT: HOUSES - SOUTH WEST SEPTEMBER QUARTER 2016Source: Landgate/REIWA
SUBMARKETS
September Quarter 2016 June Quarter 2016 September Quarter 2015
Overall Market Variance
Listing vs Sold Price
Proportion of Vendors
Discounting
Listing & Sold Price Variance
for Discounting Vendors
Overall Market Variance
Listing vs Sold Price
Proportion of Vendors
Discounting
Listing & Sold Price Variance
for Discounting Vendors
Overall Market Variance
Listing vs Sold Price
Proportion of Vendors
Discounting
Listing & Sold Price Variance
for Discounting Vendors
South West Sub-Region -3.5% 52.3% -6.5% -3.1% 60.6% -5.9% -3.2% 56.8% -5.8%
Cockburn -3.5% 52.3% -6.5% -3.2% 54.7% -6.1% -3.4% 55.6% -5.7%
Kwinana -4.3% 49.6% -7.1% -3.6% 45.4% -5.5% -3.4% 44.4% -4.4%
Rockingham -3.7% 65.6% -6.6% -3.1% 60.6% -5.9% -3.1% 60.9% -6.1%
Perth Metro Region -4.0% 51.8% -6.7% -3.1% 60.6% -5.9% -3.6% 52.7% -6.1%
SUB-MARKETSListings at
September Quarter 2016
House ListingsQuarterly Change
Annual Change
Average Selling Days (p)
Quarterly Change
Annual Change
Cockburn 1,082 569 0.7% -4.2% 74 1 3
Kwinana 352 269 5.5% -26.1% 76 12 2
Rockingham 1,415 966 0.0% -0.5% 79 2 4
South West Sub-Region 2,849 1,804 1.0% -6.5% 76 3 4
Perth Metro Region 14,170 8,649 -0.6% -6.5% 68 3 5 Note: Listings to Dwelling Stock Ratio = Dwelling Listings as a percentage of estimated Dwelling Stock
SAMPLE
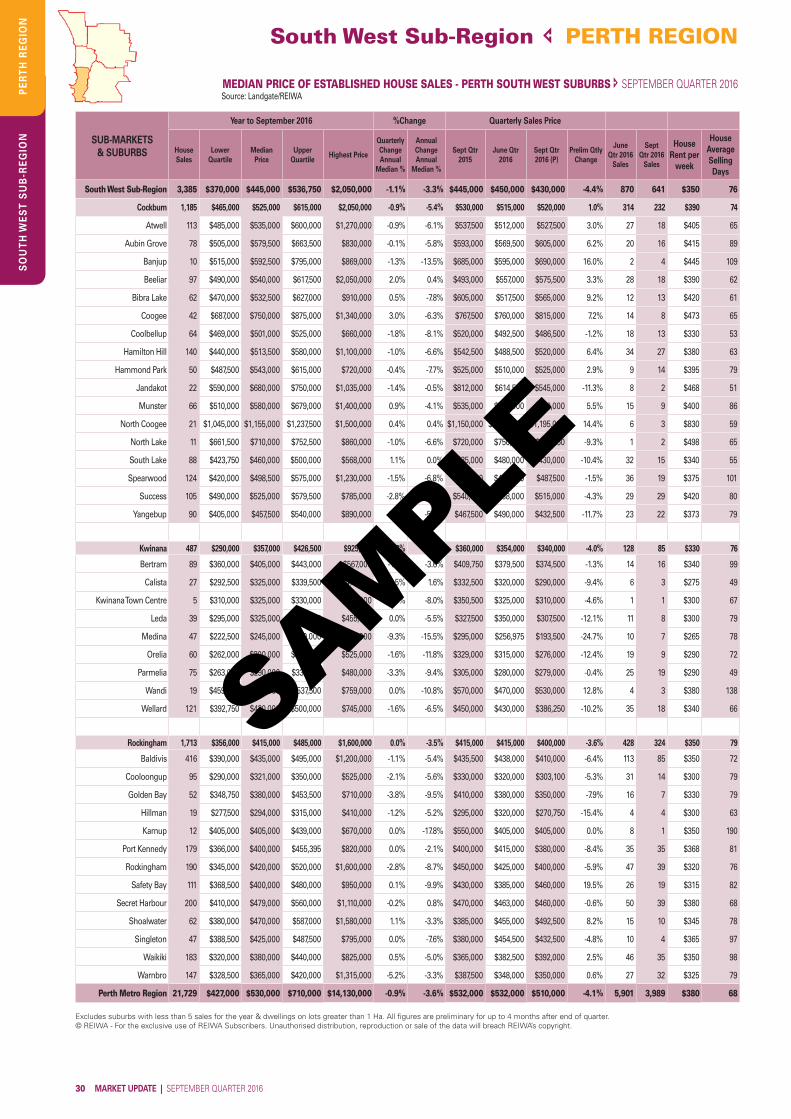
30 MARKET UPDATE | SEPTEMBER QUARTER 2016
South West Sub-Region PERTH REGIONS
OU
TH
WE
ST
SU
B-R
EG
ION
PE
RT
H R
EG
ION
SUB-MARKETS& SUBURBS
Year to September 2016 %Change Quarterly Sales Price
House Sales
Lower Quartile
Median Price
Upper Quartile
Highest Price
Quarterly Change Annual
Median %
Annual Change Annual
Median %
Sept Qtr 2015
June Qtr 2016
Sept Qtr 2016 (P)
Prelim Qtly Change
June Qtr 2016
Sales
Sept Qtr 2016
Sales
House Rent per
week
House Average Selling Days
South West Sub-Region 3,385 $370,000 $445,000 $536,750 $2,050,000 -1.1% -3.3% $445,000 $450,000 $430,000 -4.4% 870 641 $350 76
Cockburn 1,185 $465,000 $525,000 $615,000 $2,050,000 -0.9% -5.4% $530,000 $515,000 $520,000 1.0% 314 232 $390 74
Atwell 113 $485,000 $535,000 $600,000 $1,270,000 -0.9% -6.1% $537,500 $512,000 $527,500 3.0% 27 18 $405 65
Aubin Grove 78 $505,000 $579,500 $663,500 $830,000 -0.1% -5.8% $593,000 $569,500 $605,000 6.2% 20 16 $415 89
Banjup 10 $515,000 $592,500 $795,000 $869,000 -1.3% -13.5% $685,000 $595,000 $690,000 16.0% 2 4 $445 109
Beeliar 97 $490,000 $540,000 $617,500 $2,050,000 2.0% 0.4% $493,000 $557,000 $575,500 3.3% 28 18 $390 62
Bibra Lake 62 $470,000 $532,500 $627,000 $910,000 0.5% -7.8% $605,000 $517,500 $565,000 9.2% 12 13 $420 61
Coogee 42 $687,000 $750,000 $875,000 $1,340,000 3.0% -6.3% $767,500 $760,000 $815,000 7.2% 14 8 $473 65
Coolbellup 64 $469,000 $501,000 $525,000 $660,000 -1.8% -8.1% $520,000 $492,500 $486,500 -1.2% 18 13 $330 53
Hamilton Hill 140 $440,000 $513,500 $580,000 $1,100,000 -1.0% -6.6% $542,500 $488,500 $520,000 6.4% 34 27 $380 63
Hammond Park 50 $487,500 $543,000 $615,000 $720,000 -0.4% -7.7% $525,000 $510,000 $525,000 2.9% 9 14 $395 79
Jandakot 22 $590,000 $680,000 $750,000 $1,035,000 -1.4% -0.5% $812,000 $614,500 $545,000 -11.3% 8 2 $468 51
Munster 66 $510,000 $580,000 $679,000 $1,400,000 0.9% -4.1% $535,000 $550,000 $580,000 5.5% 15 9 $400 86
North Coogee 21 $1,045,000 $1,155,000 $1,237,500 $1,500,000 0.4% 0.4% $1,150,000 $1,045,000 $1,195,000 14.4% 6 3 $830 59
North Lake 11 $661,500 $710,000 $752,500 $860,000 -1.0% -6.6% $720,000 $750,000 $680,250 -9.3% 1 2 $498 65
South Lake 88 $423,750 $460,000 $500,000 $568,000 1.1% 0.0% $435,000 $480,000 $430,000 -10.4% 32 15 $340 55
Spearwood 124 $420,000 $498,500 $575,000 $1,230,000 -1.5% -6.8% $510,000 $495,000 $487,500 -1.5% 36 19 $375 101
Success 105 $490,000 $525,000 $579,500 $785,000 -2.8% -5.8% $540,000 $538,000 $515,000 -4.3% 29 29 $420 80
Yangebup 90 $405,000 $457,500 $540,000 $890,000 -0.5% -5.2% $467,500 $490,000 $432,500 -11.7% 23 22 $373 79
Kwinana 487 $290,000 $357,000 $426,500 $925,000 -0.8% -4.8% $360,000 $354,000 $340,000 -4.0% 128 85 $330 76
Bertram 89 $360,000 $405,000 $443,000 $567,000 -1.2% -3.6% $409,750 $379,500 $374,500 -1.3% 14 16 $340 99
Calista 27 $292,500 $325,000 $339,500 $475,000 -1.5% 1.6% $332,500 $320,000 $290,000 -9.4% 6 3 $275 49
Kwinana Town Centre 5 $310,000 $325,000 $330,000 $330,000 -1.5% -8.0% $350,500 $325,000 $310,000 -4.6% 1 1 $300 67
Leda 39 $295,000 $325,000 $361,750 $455,000 0.0% -5.5% $327,500 $350,000 $307,500 -12.1% 11 8 $300 79
Medina 47 $222,500 $245,000 $300,000 $405,000 -9.3% -15.5% $295,000 $256,975 $193,500 -24.7% 10 7 $265 78
Orelia 60 $262,000 $300,000 $365,000 $525,000 -1.6% -11.8% $329,000 $315,000 $276,000 -12.4% 19 9 $290 72
Parmelia 75 $263,000 $290,000 $338,750 $480,000 -3.3% -9.4% $305,000 $280,000 $279,000 -0.4% 25 19 $290 49
Wandi 19 $459,000 $505,000 $537,500 $759,000 0.0% -10.8% $570,000 $470,000 $530,000 12.8% 4 3 $380 138
Wellard 121 $392,750 $430,000 $500,000 $745,000 -1.6% -6.5% $450,000 $430,000 $386,250 -10.2% 35 18 $340 66
Rockingham 1,713 $356,000 $415,000 $485,000 $1,600,000 0.0% -3.5% $415,000 $415,000 $400,000 -3.6% 428 324 $350 79
Baldivis 416 $390,000 $435,000 $495,000 $1,200,000 -1.1% -5.4% $435,500 $438,000 $410,000 -6.4% 113 85 $350 72
Cooloongup 95 $290,000 $321,000 $350,000 $525,000 -2.1% -5.6% $330,000 $320,000 $303,100 -5.3% 31 14 $300 79
Golden Bay 52 $348,750 $380,000 $453,500 $710,000 -3.8% -9.5% $410,000 $380,000 $350,000 -7.9% 16 7 $330 79
Hillman 19 $277,500 $294,000 $315,000 $410,000 -1.2% -5.2% $295,000 $320,000 $270,750 -15.4% 4 4 $300 63
Karnup 12 $405,000 $405,000 $439,000 $670,000 0.0% -17.8% $550,000 $405,000 $405,000 0.0% 8 1 $350 190
Port Kennedy 179 $366,000 $400,000 $455,395 $820,000 0.0% -2.1% $400,000 $415,000 $380,000 -8.4% 35 35 $368 81
Rockingham 190 $345,000 $420,000 $520,000 $1,600,000 -2.8% -8.7% $450,000 $425,000 $400,000 -5.9% 47 39 $320 76
Safety Bay 111 $368,500 $400,000 $480,000 $950,000 0.1% -9.9% $430,000 $385,000 $460,000 19.5% 26 19 $315 82
Secret Harbour 200 $410,000 $479,000 $560,000 $1,110,000 -0.2% 0.8% $470,000 $463,000 $460,000 -0.6% 50 39 $380 68
Shoalwater 62 $380,000 $470,000 $587,000 $1,580,000 1.1% -3.3% $385,000 $455,000 $492,500 8.2% 15 10 $345 78
Singleton 47 $388,500 $425,000 $487,500 $795,000 0.0% -7.6% $380,000 $454,500 $432,500 -4.8% 10 4 $365 97
Waikiki 183 $320,000 $380,000 $440,000 $825,000 0.5% -5.0% $365,000 $382,500 $392,000 2.5% 46 35 $350 98
Warnbro 147 $328,500 $365,000 $420,000 $1,315,000 -5.2% -3.3% $387,500 $348,000 $350,000 0.6% 27 32 $325 79
Perth Metro Region 21,729 $427,000 $530,000 $710,000 $14,130,000 -0.9% -3.6% $532,000 $532,000 $510,000 -4.1% 5,901 3,989 $380 68
Excludes suburbs with less than 5 sales for the year & dwellings on lots greater than 1 Ha. All figures are preliminary for up to 4 months after end of quarter.© REIWA - For the exclusive use of REIWA Subscribers. Unauthorised distribution, reproduction or sale of the data will breach REIWA’s copyright.
MEDIAN PRICE OF ESTABLISHED HOUSE SALES - PERTH SOUTH WEST SUBURBS SEPTEMBER QUARTER 2016Source: Landgate/REIWA
SAMPLE
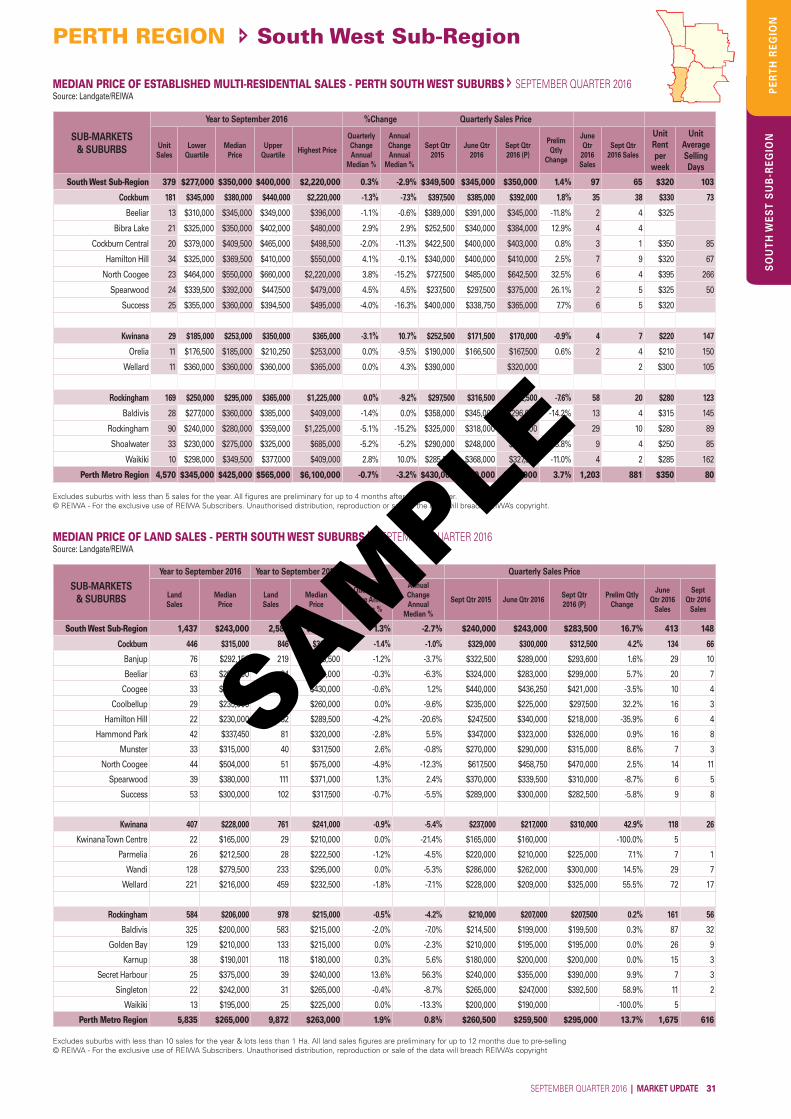
SEPTEMBER QUARTER 2016 | MARKET UPDATE 31
PERTH REGION South West Sub-Region
SO
UT
H W
ES
T S
UB
-RE
GIO
NP
ER
TH
RE
GIO
N
SUB-MARKETS& SUBURBS
Year to September 2016 %Change Quarterly Sales Price
Unit Sales
Lower Quartile
Median Price
Upper Quartile
Highest Price
Quarterly Change Annual
Median %
Annual Change Annual
Median %
Sept Qtr 2015
June Qtr 2016
Sept Qtr 2016 (P)
Prelim Qtly
Change
June Qtr
2016 Sales
Sept Qtr 2016 Sales
Unit Rent per
week
Unit Average Selling Days
South West Sub-Region 379 $277,000 $350,000 $400,000 $2,220,000 0.3% -2.9% $349,500 $345,000 $350,000 1.4% 97 65 $320 103
Cockburn 181 $345,000 $380,000 $440,000 $2,220,000 -1.3% -7.3% $397,500 $385,000 $392,000 1.8% 35 38 $330 73
Beeliar 13 $310,000 $345,000 $349,000 $396,000 -1.1% -0.6% $389,000 $391,000 $345,000 -11.8% 2 4 $325
Bibra Lake 21 $325,000 $350,000 $402,000 $480,000 2.9% 2.9% $252,500 $340,000 $384,000 12.9% 4 4
Cockburn Central 20 $379,000 $409,500 $465,000 $498,500 -2.0% -11.3% $422,500 $400,000 $403,000 0.8% 3 1 $350 85
Hamilton Hill 34 $325,000 $369,500 $410,000 $550,000 4.1% -0.1% $340,000 $400,000 $410,000 2.5% 7 9 $320 67
North Coogee 23 $464,000 $550,000 $660,000 $2,220,000 3.8% -15.2% $727,500 $485,000 $642,500 32.5% 6 4 $395 266
Spearwood 24 $339,500 $392,000 $447,500 $479,000 4.5% 4.5% $237,500 $297,500 $375,000 26.1% 2 5 $325 50
Success 25 $355,000 $360,000 $394,500 $495,000 -4.0% -16.3% $400,000 $338,750 $365,000 7.7% 6 5 $320
Kwinana 29 $185,000 $253,000 $350,000 $365,000 -3.1% 10.7% $252,500 $171,500 $170,000 -0.9% 4 7 $220 147
Orelia 11 $176,500 $185,000 $210,250 $253,000 0.0% -9.5% $190,000 $166,500 $167,500 0.6% 2 4 $210 150
Wellard 11 $360,000 $360,000 $360,000 $365,000 0.0% 4.3% $390,000 $320,000 2 $300 105
Rockingham 169 $250,000 $295,000 $365,000 $1,225,000 0.0% -9.2% $297,500 $316,500 $292,500 -7.6% 58 20 $280 123
Baldivis 28 $277,000 $360,000 $385,000 $409,000 -1.4% 0.0% $358,000 $345,000 $296,000 -14.2% 13 4 $315 145
Rockingham 90 $240,000 $280,000 $359,000 $1,225,000 -5.1% -15.2% $325,000 $318,000 $323,500 1.7% 29 10 $280 89
Shoalwater 33 $230,000 $275,000 $325,000 $685,000 -5.2% -5.2% $290,000 $248,000 $257,500 3.8% 9 4 $250 85
Waikiki 10 $298,000 $349,500 $377,000 $409,000 2.8% 10.0% $285,500 $368,000 $327,500 -11.0% 4 2 $285 162
Perth Metro Region 4,570 $345,000 $425,000 $565,000 $6,100,000 -0.7% -3.2% $430,000 $410,000 $425,000 3.7% 1,203 881 $350 80
Excludes suburbs with less than 5 sales for the year. All figures are preliminary for up to 4 months after end of quarter.© REIWA - For the exclusive use of REIWA Subscribers. Unauthorised distribution, reproduction or sale of the data will breach REIWA’s copyright.
MEDIAN PRICE OF ESTABLISHED MULTI-RESIDENTIAL SALES - PERTH SOUTH WEST SUBURBS SEPTEMBER QUARTER 2016Source: Landgate/REIWA
SUB-MARKETS& SUBURBS
Year to September 2016 Year to September 2016 Quarterly Sales Price
Land Sales
Median Price
Land Sales
Median Price
Quarterly Change Annual
Median %
Annual Change Annual
Median %
Sept Qtr 2015 June Qtr 2016 Sept Qtr 2016 (P)
Prelim Qtly Change
June Qtr 2016
Sales
Sept Qtr 2016
Sales
South West Sub-Region 1,437 $243,000 2,585 $249,700 1.3% -2.7% $240,000 $243,000 $283,500 16.7% 413 148
Cockburn 446 $315,000 846 $318,250 -1.4% -1.0% $329,000 $300,000 $312,500 4.2% 134 66
Banjup 76 $292,150 219 $303,500 -1.2% -3.7% $322,500 $289,000 $293,600 1.6% 29 10
Beeliar 63 $299,000 84 $319,000 -0.3% -6.3% $324,000 $283,000 $299,000 5.7% 20 7
Coogee 33 $435,000 51 $430,000 -0.6% 1.2% $440,000 $436,250 $421,000 -3.5% 10 4
Coolbellup 29 $235,000 30 $260,000 0.0% -9.6% $235,000 $225,000 $297,500 32.2% 16 3
Hamilton Hill 22 $230,000 32 $289,500 -4.2% -20.6% $247,500 $340,000 $218,000 -35.9% 6 4
Hammond Park 42 $337,450 81 $320,000 -2.8% 5.5% $347,000 $323,000 $326,000 0.9% 16 8
Munster 33 $315,000 40 $317,500 2.6% -0.8% $270,000 $290,000 $315,000 8.6% 7 3
North Coogee 44 $504,000 51 $575,000 -4.9% -12.3% $617,500 $458,750 $470,000 2.5% 14 11
Spearwood 39 $380,000 111 $371,000 1.3% 2.4% $370,000 $339,500 $310,000 -8.7% 6 5
Success 53 $300,000 102 $317,500 -0.7% -5.5% $289,000 $300,000 $282,500 -5.8% 9 8
Kwinana 407 $228,000 761 $241,000 -0.9% -5.4% $237,000 $217,000 $310,000 42.9% 118 26
Kwinana Town Centre 22 $165,000 29 $210,000 0.0% -21.4% $165,000 $160,000 -100.0% 5
Parmelia 26 $212,500 28 $222,500 -1.2% -4.5% $220,000 $210,000 $225,000 7.1% 7 1
Wandi 128 $279,500 233 $295,000 0.0% -5.3% $286,000 $262,000 $300,000 14.5% 29 7
Wellard 221 $216,000 459 $232,500 -1.8% -7.1% $228,000 $209,000 $325,000 55.5% 72 17
Rockingham 584 $206,000 978 $215,000 -0.5% -4.2% $210,000 $207,000 $207,500 0.2% 161 56
Baldivis 325 $200,000 583 $215,000 -2.0% -7.0% $214,500 $199,000 $199,500 0.3% 87 32
Golden Bay 129 $210,000 133 $215,000 0.0% -2.3% $210,000 $195,000 $195,000 0.0% 26 9
Karnup 38 $190,001 118 $180,000 0.3% 5.6% $180,000 $200,000 $200,000 0.0% 15 3
Secret Harbour 25 $375,000 39 $240,000 13.6% 56.3% $240,000 $355,000 $390,000 9.9% 7 3
Singleton 22 $242,000 31 $265,000 -0.4% -8.7% $265,000 $247,000 $392,500 58.9% 11 2
Waikiki 13 $195,000 25 $225,000 0.0% -13.3% $200,000 $190,000 -100.0% 5
Perth Metro Region 5,835 $265,000 9,872 $263,000 1.9% 0.8% $260,500 $259,500 $295,000 13.7% 1,675 616
Excludes suburbs with less than 10 sales for the year & lots less than 1 Ha. All land sales figures are preliminary for up to 12 months due to pre-selling© REIWA - For the exclusive use of REIWA Subscribers. Unauthorised distribution, reproduction or sale of the data will breach REIWA’s copyright
MEDIAN PRICE OF LAND SALES - PERTH SOUTH WEST SUBURBS SEPTEMBER QUARTER 2016Source: Landgate/REIWA
SAMPLE
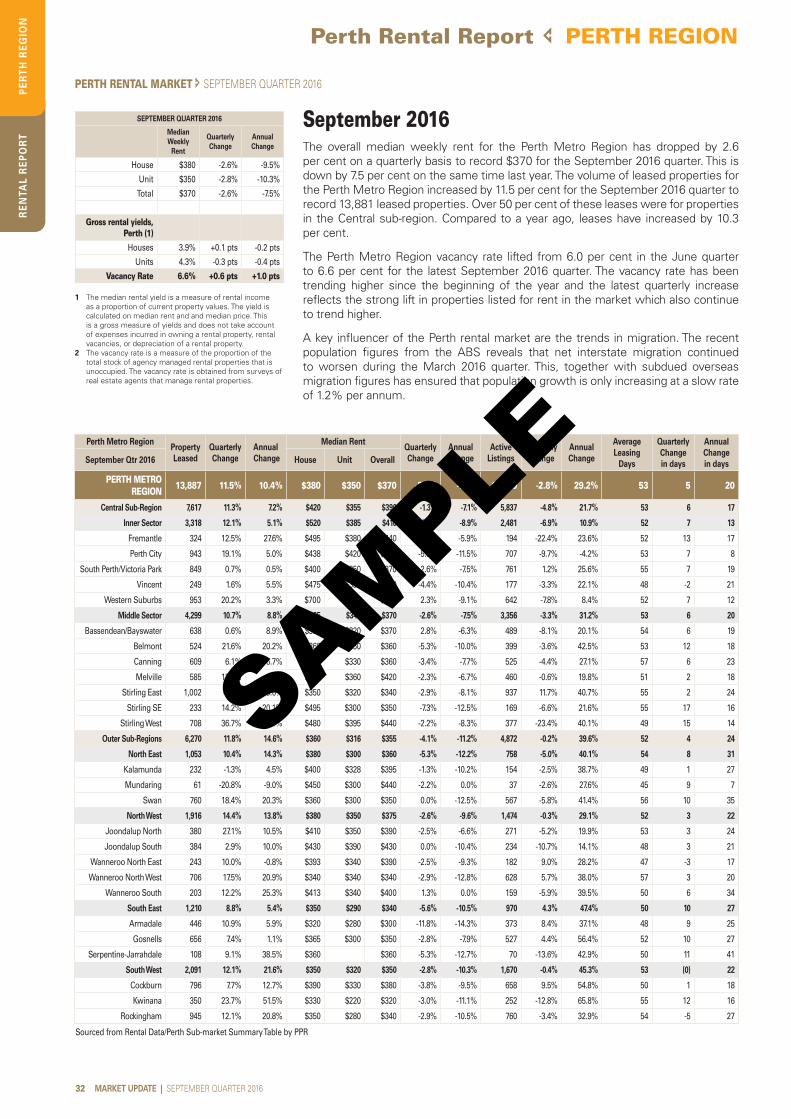
RE
NTA
L R
EP
OR
T
32 MARKET UPDATE | SEPTEMBER QUARTER 2016
Perth Rental Report PERTH REGIONP
ER
TH
RE
GIO
N
September 2016The overall median weekly rent for the Perth Metro Region has dropped by 2.6 per cent on a quarterly basis to record $370 for the September 2016 quarter. This is down by 7.5 per cent on the same time last year. The volume of leased properties for the Perth Metro Region increased by 11.5 per cent for the September 2016 quarter to record 13,881 leased properties. Over 50 per cent of these leases were for properties in the Central sub-region. Compared to a year ago, leases have increased by 10.3 per cent.
The Perth Metro Region vacancy rate lifted from 6.0 per cent in the June quarter to 6.6 per cent for the latest September 2016 quarter. The vacancy rate has been trending higher since the beginning of the year and the latest quarterly increase reflects the strong lift in properties listed for rent in the market which also continue to trend higher.
A key influencer of the Perth rental market are the trends in migration. The recent population figures from the ABS reveals that net interstate migration continued to worsen during the March 2016 quarter. This, together with subdued overseas migration figures has ensured that population growth is only increasing at a slow rate of 1.2% per annum.
SEPTEMBER QUARTER 2016
Median Weekly
Rent
Quarterly Change
Annual Change
House $380 -2.6% -9.5%
Unit $350 -2.8% -10.3%
Total $370 -2.6% -7.5%
Gross rental yields, Perth (1)
Houses 3.9% +0.1 pts -0.2 pts
Units 4.3% -0.3 pts -0.4 pts
Vacancy Rate 6.6% +0.6 pts +1.0 pts
1 The median rental yield is a measure of rental income as a proportion of current property values. The yield is calculated on median rent and and median price. This is a gross measure of yields and does not take account of expenses incurred in owning a rental property, rental vacancies, or depreciation of a rental property.
2 The vacancy rate is a measure of the proportion of the total stock of agency managed rental properties that is unoccupied. The vacancy rate is obtained from surveys of real estate agents that manage rental properties.
PERTH RENTAL MARKET SEPTEMBER QUARTER 2016
Perth Metro RegionProperty Leased
Quarterly Change
Annual Change
Median RentQuarterly Change
Annual Change
Active Listings
Quarterly Change
Annual Change
Average Leasing
Days
Quarterly Change in days
Annual Change in daysSeptember Qtr 2016 House Unit Overall
PERTH METRO REGION 13,887 11.5% 10.4% $380 $350 $370 -2.6% -7.5% 10,709 -2.8% 29.2% 53 5 20
Central Sub-Region 7,617 11.3% 7.2% $420 $355 $390 -1.3% -7.1% 5,837 -4.8% 21.7% 53 6 17
Inner Sector 3,318 12.1% 5.1% $520 $385 $410 -2.4% -8.9% 2,481 -6.9% 10.9% 52 7 13
Fremantle 324 12.5% 27.6% $495 $380 $440 1.7% -5.9% 194 -22.4% 23.6% 52 13 17
Perth City 943 19.1% 5.0% $438 $420 $425 -5.6% -11.5% 707 -9.7% -4.2% 53 7 8
South Perth/Victoria Park 849 0.7% 0.5% $400 $350 $370 -2.6% -7.5% 761 1.2% 25.6% 55 7 19
Vincent 249 1.6% 5.5% $475 $398 $430 -4.4% -10.4% 177 -3.3% 22.1% 48 -2 21
Western Suburbs 953 20.2% 3.3% $700 $350 $450 2.3% -9.1% 642 -7.8% 8.4% 52 7 12
Middle Sector 4,299 10.7% 8.8% $395 $340 $370 -2.6% -7.5% 3,356 -3.3% 31.2% 53 6 20
Bassendean/Bayswater 638 0.6% 8.9% $395 $320 $370 2.8% -6.3% 489 -8.1% 20.1% 54 6 19
Belmont 524 21.6% 20.2% $360 $350 $360 -5.3% -10.0% 399 -3.6% 42.5% 53 12 18
Canning 609 6.1% -6.7% $380 $330 $360 -3.4% -7.7% 525 -4.4% 27.1% 57 6 23
Melville 585 13.2% 7.9% $450 $360 $420 -2.3% -6.7% 460 -0.6% 19.8% 51 2 18
Stirling East 1,002 -0.3% 9.6% $350 $320 $340 -2.9% -8.1% 937 11.7% 40.7% 55 2 24
Stirling SE 233 14.2% 20.1% $495 $300 $350 -7.3% -12.5% 169 -6.6% 21.6% 55 17 16
Stirling West 708 36.7% 13.1% $480 $395 $440 -2.2% -8.3% 377 -23.4% 40.1% 49 15 14
Outer Sub-Regions 6,270 11.8% 14.6% $360 $316 $355 -4.1% -11.2% 4,872 -0.2% 39.6% 52 4 24
North East 1,053 10.4% 14.3% $380 $300 $360 -5.3% -12.2% 758 -5.0% 40.1% 54 8 31
Kalamunda 232 -1.3% 4.5% $400 $328 $395 -1.3% -10.2% 154 -2.5% 38.7% 49 1 27
Mundaring 61 -20.8% -9.0% $450 $300 $440 -2.2% 0.0% 37 -2.6% 27.6% 45 9 7
Swan 760 18.4% 20.3% $360 $300 $350 0.0% -12.5% 567 -5.8% 41.4% 56 10 35
North West 1,916 14.4% 13.8% $380 $350 $375 -2.6% -9.6% 1,474 -0.3% 29.1% 52 3 22
Joondalup North 380 27.1% 10.5% $410 $350 $390 -2.5% -6.6% 271 -5.2% 19.9% 53 3 24
Joondalup South 384 2.9% 10.0% $430 $390 $430 0.0% -10.4% 234 -10.7% 14.1% 48 3 21
Wanneroo North East 243 10.0% -0.8% $393 $340 $390 -2.5% -9.3% 182 9.0% 28.2% 47 -3 17
Wanneroo North West 706 17.5% 20.9% $340 $340 $340 -2.9% -12.8% 628 5.7% 38.0% 57 3 20
Wanneroo South 203 12.2% 25.3% $413 $340 $400 1.3% 0.0% 159 -5.9% 39.5% 50 6 34
South East 1,210 8.8% 5.4% $350 $290 $340 -5.6% -10.5% 970 4.3% 47.4% 50 10 27
Armadale 446 10.9% 5.9% $320 $280 $300 -11.8% -14.3% 373 8.4% 37.1% 48 9 25
Gosnells 656 7.4% 1.1% $365 $300 $350 -2.8% -7.9% 527 4.4% 56.4% 52 10 27
Serpentine-Jarrahdale 108 9.1% 38.5% $360 $360 -5.3% -12.7% 70 -13.6% 42.9% 50 11 41
South West 2,091 12.1% 21.6% $350 $320 $350 -2.8% -10.3% 1,670 -0.4% 45.3% 53 (0) 22
Cockburn 796 7.7% 12.7% $390 $330 $380 -3.8% -9.5% 658 9.5% 54.8% 50 1 18
Kwinana 350 23.7% 51.5% $330 $220 $320 -3.0% -11.1% 252 -12.8% 65.8% 55 12 16
Rockingham 945 12.1% 20.8% $350 $280 $340 -2.9% -10.5% 760 -3.4% 32.9% 54 -5 27
Sourced from Rental Data/Perth Sub-market Summary Table by PPR
SAMPLE

RE
NTA
L R
EP
OR
T
SEPTEMBER QUARTER 2016 | MARKET UPDATE 33
PERTH REGION Perth Rental Report
PE
RT
H R
EG
ION
Rent analysis by bedroom numbers
House Rents Sept Quarter 2016
1-2 Beds 3 Beds 4 Beds 5+ Beds Total
Upper Quartile $360 $410 $495 $795 $450
Median Rent $300 $360 $420 $580 $380
Lower Quartile $275 $320 $370 $475 $330
Unit Rents Sept Quarter 2016
1 Beds 2 Beds 3 Beds 4 Beds5+
BedsTotal
Upper Quartile $315 $375 $410 $495 $795 $450
Median Rent $275 $315 $360 $420 $580 $380
Lower Quartile $223 $280 $320 $370 $475 $330
-
1,000
2,000
3,000
4,000
5,000
6,000
7,000
Sep-13 Mar-14 Sep-14 Mar-15 Sep-15 Mar-16 Sep-16Central Sub-Region North West Sub-RegionNorth East Sub-Region South East Sub-RegionSouth West Sub-Region
PERTH SUB-REGIONAL RENTAL LISTINGS Source: reiwa.com
- 100 200 300 400 500 600 700 800 900
Sep-13 Mar-14 Sep-14 Mar-15 Sep-15 Mar-16 Sep-16Fremantle Perth CitySouth Perth/Victoria Park Vincent/Stirling SEWestern Suburbs
INNER MARKETS RENTAL LISTINGS Source: reiwa.com
The table and graphics illustrate the quarterly and annual change in rental listings grouped into the various sub-regions of the Perth metro region.
The annual increase in rental listings was strongest in the South East sub-region lifting 47 per cent, followed by the South West sub-region at 45%. The overall trend is consistent with what has been noted in the past where in general terms, a consistent upward trend in listings can be seen across most areas.
Rental listings decreased by approximately three per cent at the end of the September quarter to 10,709 listings. However, in comparison to the same time last year, listings are up by 29 per cent. In terms of composition, around 55 per cent of these listings are located in the Central sub-region whilst the remaining 45 per cent are located in the Outer sub-regions.
$150
$200
$250
$300
$350
$400
$450
$500
0.0%
1.0%
2.0%
3.0%
4.0%
5.0%
6.0%
7.0%
S-09 D M-10 J S-10 D M-11 J S-11 D M-12 J S-12 D M-13 J S-13 D M-14 J S-14 D M-15 J S-15 D M-16 J S-16
Vacancy rate (LHS)
Median rent ($/week)
PERTH METROPOLITAN REGION Source: reiwa.com & Member Surveys
3% Equilibrium
Source: reiwa.comPerth Metropolitan Rental ListingsTotal Listings Houses Units
SAMPLE
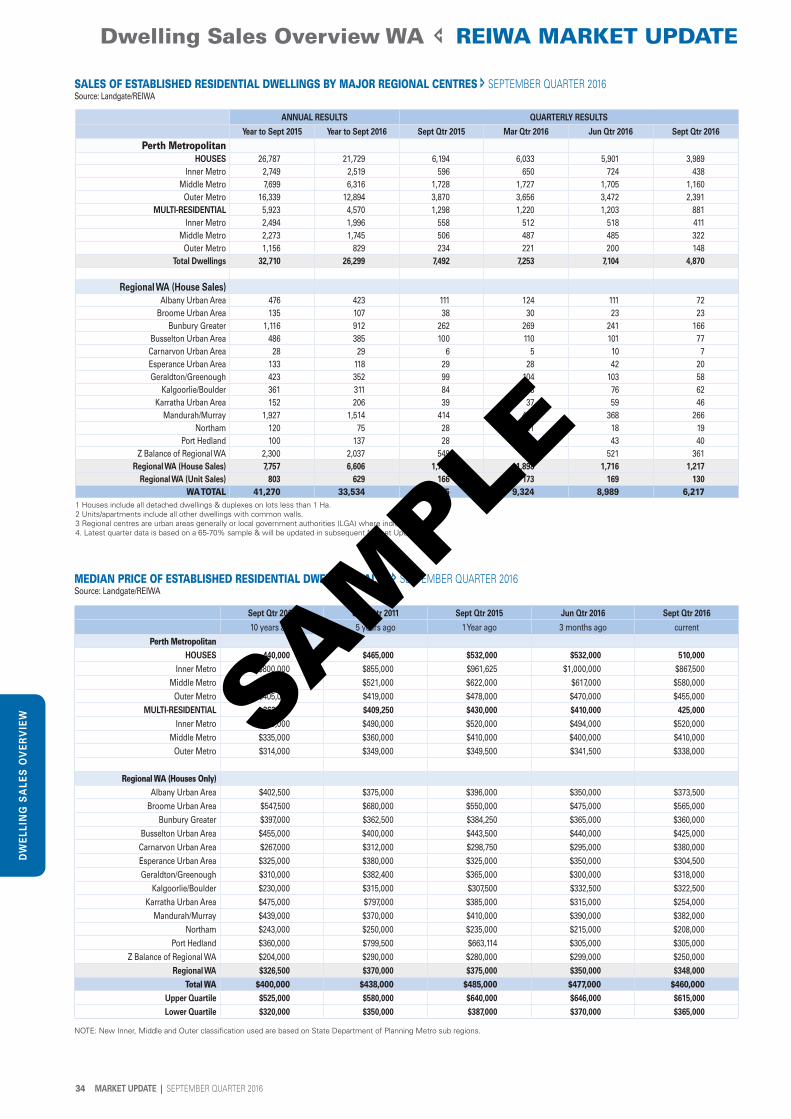
34 MARKET UPDATE | SEPTEMBER QUARTER 2016
ANNUAL RESULTS QUARTERLY RESULTS
Year to Sept 2015 Year to Sept 2016 Sept Qtr 2015 Mar Qtr 2016 Jun Qtr 2016 Sept Qtr 2016
Perth MetropolitanHOUSES 26,787 21,729 6,194 6,033 5,901 3,989
Inner Metro 2,749 2,519 596 650 724 438Middle Metro 7,699 6,316 1,728 1,727 1,705 1,160
Outer Metro 16,339 12,894 3,870 3,656 3,472 2,391MULTI-RESIDENTIAL 5,923 4,570 1,298 1,220 1,203 881
Inner Metro 2,494 1,996 558 512 518 411Middle Metro 2,273 1,745 506 487 485 322
Outer Metro 1,156 829 234 221 200 148Total Dwellings 32,710 26,299 7,492 7,253 7,104 4,870
Regional WA (House Sales)Albany Urban Area 476 423 111 124 111 72
Broome Urban Area 135 107 38 30 23 23Bunbury Greater 1,116 912 262 269 241 166
Busselton Urban Area 486 385 100 110 101 77Carnarvon Urban Area 28 29 6 5 10 7Esperance Urban Area 133 118 29 28 42 20Geraldton/Greenough 423 352 99 104 103 58
Kalgoorlie/Boulder 361 311 84 78 76 62Karratha Urban Area 152 206 39 37 59 46
Mandurah/Murray 1,927 1,514 414 480 368 266Northam 120 75 28 21 18 19
Port Hedland 100 137 28 28 43 40Z Balance of Regional WA 2,300 2,037 549 584 521 361
Regional WA (House Sales) 7,757 6,606 1,787 1,898 1,716 1,217Regional WA (Unit Sales) 803 629 166 173 169 130
WA TOTAL 41,270 33,534 9,445 9,324 8,989 6,2171 Houses include all detached dwellings & duplexes on lots less than 1 Ha.2 Units/apartments include all other dwellings with common walls.3 Regional centres are urban areas generally or local government authorities (LGA) where indicated4. Latest quarter data is based on a 65-70% sample & will be updated in subsequent Market Updates
MEDIAN PRICE OF ESTABLISHED RESIDENTIAL DWELLING SALES SEPTEMBER QUARTER 2016Source: Landgate/REIWA
Sept Qtr 2006 Sept Qtr 2011 Sept Qtr 2015 Jun Qtr 2016 Sept Qtr 2016
10 years ago 5 years ago 1 Year ago 3 months ago current
Perth MetropolitanHOUSES 440,000 $465,000 $532,000 $532,000 510,000
Inner Metro $800,000 $855,000 $961,625 $1,000,000 $867,500Middle Metro $485,000 $521,000 $622,000 $617,000 $580,000
Outer Metro $405,000 $419,000 $478,000 $470,000 $455,000MULTI-RESIDENTIAL 362,000 $409,250 $430,000 $410,000 425,000
Inner Metro $430,000 $490,000 $520,000 $494,000 $520,000Middle Metro $335,000 $360,000 $410,000 $400,000 $410,000
Outer Metro $314,000 $349,000 $349,500 $341,500 $338,000
Regional WA (Houses Only)Albany Urban Area $402,500 $375,000 $396,000 $350,000 $373,500
Broome Urban Area $547,500 $680,000 $550,000 $475,000 $565,000Bunbury Greater $397,000 $362,500 $384,250 $365,000 $360,000
Busselton Urban Area $455,000 $400,000 $443,500 $440,000 $425,000Carnarvon Urban Area $267,000 $312,000 $298,750 $295,000 $380,000Esperance Urban Area $325,000 $380,000 $325,000 $350,000 $304,500Geraldton/Greenough $310,000 $382,400 $365,000 $300,000 $318,000
Kalgoorlie/Boulder $230,000 $315,000 $307,500 $332,500 $322,500Karratha Urban Area $475,000 $797,000 $385,000 $315,000 $254,000
Mandurah/Murray $439,000 $370,000 $410,000 $390,000 $382,000Northam $243,000 $250,000 $235,000 $215,000 $208,000
Port Hedland $360,000 $799,500 $663,114 $305,000 $305,000Z Balance of Regional WA $204,000 $290,000 $280,000 $299,000 $250,000
Regional WA $326,500 $370,000 $375,000 $350,000 $348,000Total WA $400,000 $438,000 $485,000 $477,000 $460,000
Upper Quartile $525,000 $580,000 $640,000 $646,000 $615,000 Lower Quartile $320,000 $350,000 $387,000 $370,000 $365,000
NOTE: New Inner, Middle and Outer classification used are based on State Department of Planning Metro sub regions.
SALES OF ESTABLISHED RESIDENTIAL DWELLINGS BY MAJOR REGIONAL CENTRES SEPTEMBER QUARTER 2016Source: Landgate/REIWA
Dwelling Sales Overview WA REIWA MARKET UPDATED
WE
LLIN
G S
ALE
S O
VE
RV
IEW SAMPLE
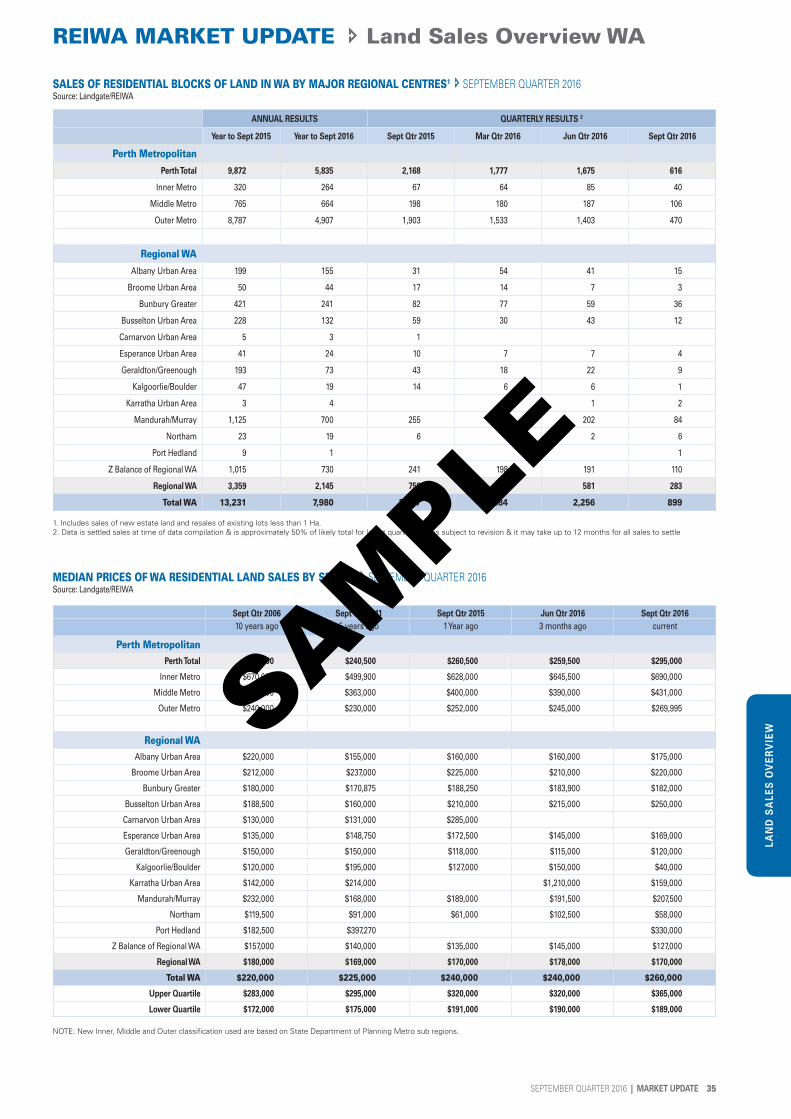
SEPTEMBER QUARTER 2016 | MARKET UPDATE 35
REIWA MARKET UPDATE Land Sales Overview WA
ANNUAL RESULTS QUARTERLY RESULTS 2
Year to Sept 2015 Year to Sept 2016 Sept Qtr 2015 Mar Qtr 2016 Jun Qtr 2016 Sept Qtr 2016
Perth Metropolitan
Perth Total 9,872 5,835 2,168 1,777 1,675 616
Inner Metro 320 264 67 64 85 40
Middle Metro 765 664 198 180 187 106
Outer Metro 8,787 4,907 1,903 1,533 1,403 470
Regional WA
Albany Urban Area 199 155 31 54 41 15
Broome Urban Area 50 44 17 14 7 3
Bunbury Greater 421 241 82 77 59 36
Busselton Urban Area 228 132 59 30 43 12
Carnarvon Urban Area 5 3 1
Esperance Urban Area 41 24 10 7 7 4
Geraldton/Greenough 193 73 43 18 22 9
Kalgoorlie/Boulder 47 19 14 6 6 1
Karratha Urban Area 3 4 1 1 2
Mandurah/Murray 1,125 700 255 198 202 84
Northam 23 19 6 4 2 6
Port Hedland 9 1 1
Z Balance of Regional WA 1,015 730 241 198 191 110
Regional WA 3,359 2,145 759 607 581 283
Total WA 13,231 7,980 2,927 2,384 2,256 899
1. Includes sales of new estate land and resales of existing lots less than 1 Ha. 2. Data is settled sales at time of data compilation & is approximately 50% of likely total for latest quarter. Data is subject to revision & it may take up to 12 months for all sales to settle
Sept Qtr 2006 Sept Qtr 2011 Sept Qtr 2015 Jun Qtr 2016 Sept Qtr 201610 years ago 5 years ago 1 Year ago 3 months ago current
Perth MetropolitanPerth Total $249,500 $240,500 $260,500 $259,500 $295,000
Inner Metro $670,000 $499,900 $628,000 $645,500 $690,000
Middle Metro $328,000 $363,000 $400,000 $390,000 $431,000
Outer Metro $240,000 $230,000 $252,000 $245,000 $269,995
Regional WAAlbany Urban Area $220,000 $155,000 $160,000 $160,000 $175,000
Broome Urban Area $212,000 $237,000 $225,000 $210,000 $220,000
Bunbury Greater $180,000 $170,875 $188,250 $183,900 $182,000
Busselton Urban Area $188,500 $160,000 $210,000 $215,000 $250,000
Carnarvon Urban Area $130,000 $131,000 $285,000
Esperance Urban Area $135,000 $148,750 $172,500 $145,000 $169,000
Geraldton/Greenough $150,000 $150,000 $118,000 $115,000 $120,000
Kalgoorlie/Boulder $120,000 $195,000 $127,000 $150,000 $40,000
Karratha Urban Area $142,000 $214,000 $1,210,000 $159,000
Mandurah/Murray $232,000 $168,000 $189,000 $191,500 $207,500
Northam $119,500 $91,000 $61,000 $102,500 $58,000
Port Hedland $182,500 $397,270 $330,000
Z Balance of Regional WA $157,000 $140,000 $135,000 $145,000 $127,000
Regional WA $180,000 $169,000 $170,000 $178,000 $170,000
Total WA $220,000 $225,000 $240,000 $240,000 $260,000
Upper Quartile $283,000 $295,000 $320,000 $320,000 $365,000
Lower Quartile $172,000 $175,000 $191,000 $190,000 $189,000 NOTE: New Inner, Middle and Outer classification used are based on State Department of Planning Metro sub regions.
SALES OF RESIDENTIAL BLOCKS OF LAND IN WA BY MAJOR REGIONAL CENTRES1 SEPTEMBER QUARTER 2016Source: Landgate/REIWA
MEDIAN PRICES OF WA RESIDENTIAL LAND SALES BY SECTOR SEPTEMBER QUARTER 2016Source: Landgate/REIWA
LAN
D S
ALE
S O
VE
RV
IEWSAMPLE
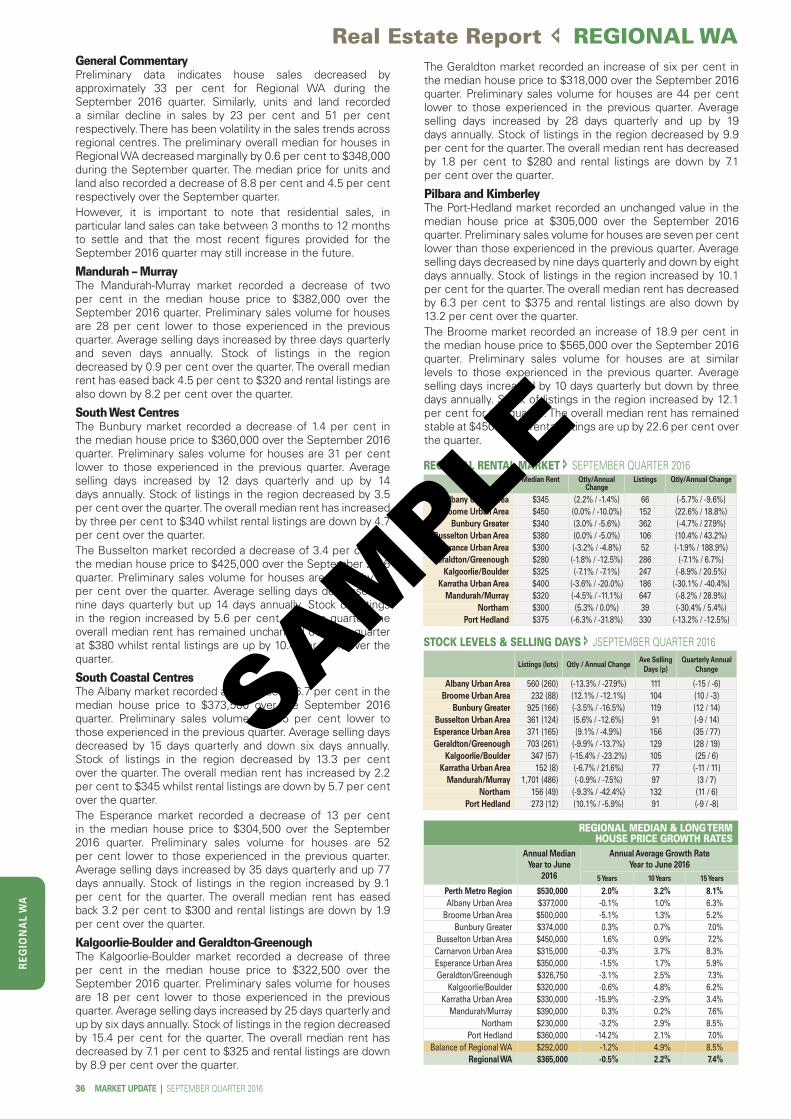
RE
GIO
NA
L W
A
36 MARKET UPDATE | SEPTEMBER QUARTER 2016
Real Estate Report REGIONAL WAGeneral CommentaryPreliminary data indicates house sales decreased by approximately 33 per cent for Regional WA during the September 2016 quarter. Similarly, units and land recorded a similar decline in sales by 23 per cent and 51 per cent respectively. There has been volatility in the sales trends across regional centres. The preliminary overall median for houses in Regional WA decreased marginally by 0.6 per cent to $348,000 during the September quarter. The median price for units and land also recorded a decrease of 8.8 per cent and 4.5 per cent respectively over the September quarter.However, it is important to note that residential sales, in particular land sales can take between 3 months to 12 months to settle and that the most recent figures provided for the September 2016 quarter may still increase in the future.
Mandurah – MurrayThe Mandurah-Murray market recorded a decrease of two per cent in the median house price to $382,000 over the September 2016 quarter. Preliminary sales volume for houses are 28 per cent lower to those experienced in the previous quarter. Average selling days increased by three days quarterly and seven days annually. Stock of listings in the region decreased by 0.9 per cent over the quarter. The overall median rent has eased back 4.5 per cent to $320 and rental listings are also down by 8.2 per cent over the quarter.
South West Centres The Bunbury market recorded a decrease of 1.4 per cent in the median house price to $360,000 over the September 2016 quarter. Preliminary sales volume for houses are 31 per cent lower to those experienced in the previous quarter. Average selling days increased by 12 days quarterly and up by 14 days annually. Stock of listings in the region decreased by 3.5 per cent over the quarter. The overall median rent has increased by three per cent to $340 whilst rental listings are down by 4.7 per cent over the quarter.The Busselton market recorded a decrease of 3.4 per cent in the median house price to $425,000 over the September 2016 quarter. Preliminary sales volume for houses are down by 24 per cent over the quarter. Average selling days decreased by nine days quarterly but up 14 days annually. Stock of listings in the region increased by 5.6 per cent over the quarter. The overall median rent has remained unchanged over the quarter at $380 whilst rental listings are up by 10.4 per cent over the quarter.
South Coastal CentresThe Albany market recorded an increase of 6.7 per cent in the median house price to $373,500 over the September 2016 quarter. Preliminary sales volume are 35 per cent lower to those experienced in the previous quarter. Average selling days decreased by 15 days quarterly and down six days annually. Stock of listings in the region decreased by 13.3 per cent over the quarter. The overall median rent has increased by 2.2 per cent to $345 whilst rental listings are down by 5.7 per cent over the quarter.The Esperance market recorded a decrease of 13 per cent in the median house price to $304,500 over the September 2016 quarter. Preliminary sales volume for houses are 52 per cent lower to those experienced in the previous quarter. Average selling days increased by 35 days quarterly and up 77 days annually. Stock of listings in the region increased by 9.1 per cent for the quarter. The overall median rent has eased back 3.2 per cent to $300 and rental listings are down by 1.9 per cent over the quarter.
Kalgoorlie-Boulder and Geraldton-Greenough The Kalgoorlie-Boulder market recorded a decrease of three per cent in the median house price to $322,500 over the September 2016 quarter. Preliminary sales volume for houses are 18 per cent lower to those experienced in the previous quarter. Average selling days increased by 25 days quarterly and up by six days annually. Stock of listings in the region decreased by 15.4 per cent for the quarter. The overall median rent has decreased by 7.1 per cent to $325 and rental listings are down by 8.9 per cent over the quarter.
STOCK LEVELS & SELLING DAYS JSEPTEMBER QUARTER 2016
Listings (lots) Qtly / Annual ChangeAve Selling
Days (p)Quarterly Annual
Change
Albany Urban Area 560 (260) (-13.3% / -27.9%) 111 (-15 / -6)Broome Urban Area 232 (88) (12.1% / -12.1%) 104 (10 / -3)
Bunbury Greater 925 (166) (-3.5% / -16.5%) 119 (12 / 14)Busselton Urban Area 361 (124) (5.6% / -12.6%) 91 (-9 / 14)Esperance Urban Area 371 (165) (9.1% / -4.9%) 156 (35 / 77)Geraldton/Greenough 703 (261) (-9.9% / -13.7%) 129 (28 / 19)
Kalgoorlie/Boulder 347 (57) (-15.4% / -23.2%) 105 (25 / 6)Karratha Urban Area 152 (8) (-6.7% / 21.6%) 77 (-11 / 11)
Mandurah/Murray 1,701 (486) (-0.9% / -7.5%) 97 (3 / 7)Northam 156 (49) (-9.3% / -42.4%) 132 (11 / 6)
Port Hedland 273 (12) (10.1% / -5.9%) 91 (-9 / -8)
Median Rent Qtly/Annual Change
Listings Qtly/Annual Change
Albany Urban Area $345 (2.2% / -1.4%) 66 (-5.7% / -9.6%)Broome Urban Area $450 (0.0% / -10.0%) 152 (22.6% / 18.8%)
Bunbury Greater $340 (3.0% / -5.6%) 362 (-4.7% / 27.9%)Busselton Urban Area $380 (0.0% / -5.0%) 106 (10.4% / 43.2%)Esperance Urban Area $300 (-3.2% / -4.8%) 52 (-1.9% / 188.9%)Geraldton/Greenough $280 (-1.8% / -12.5%) 286 (-7.1% / 6.7%)
Kalgoorlie/Boulder $325 (-7.1% / -7.1%) 247 (-8.9% / 20.5%)Karratha Urban Area $400 (-3.6% / -20.0%) 186 (-30.1% / -40.4%)
Mandurah/Murray $320 (-4.5% / -11.1%) 647 (-8.2% / 28.9%)Northam $300 (5.3% / 0.0%) 39 (-30.4% / 5.4%)
Port Hedland $375 (-6.3% / -31.8%) 330 (-13.2% / -12.5%)
REGIONAL RENTAL MARKET SEPTEMBER QUARTER 2016
REGIONAL MEDIAN & LONG TERM HOUSE PRICE GROWTH RATES
Annual Median Year to June
2016
Annual Average Growth Rate Year to June 2016
5 Years 10 Years 15 Years
Perth Metro Region $530,000 2.0% 3.2% 8.1%Albany Urban Area $377,000 -0.1% 1.0% 6.3%
Broome Urban Area $500,000 -5.1% 1.3% 5.2%Bunbury Greater $374,000 0.3% 0.7% 7.0%
Busselton Urban Area $450,000 1.6% 0.9% 7.2%Carnarvon Urban Area $315,000 -0.3% 3.7% 8.3%Esperance Urban Area $350,000 -1.5% 1.7% 5.9%Geraldton/Greenough $326,750 -3.1% 2.5% 7.3%
Kalgoorlie/Boulder $320,000 -0.6% 4.8% 6.2%Karratha Urban Area $330,000 -15.9% -2.9% 3.4%
Mandurah/Murray $390,000 0.3% 0.2% 7.6%Northam $230,000 -3.2% 2.9% 8.5%
Port Hedland $360,000 -14.2% 2.1% 7.0%Balance of Regional WA $292,000 -1.2% 4.9% 8.5%
Regional WA $365,000 -0.5% 2.2% 7.4%
The Geraldton market recorded an increase of six per cent in the median house price to $318,000 over the September 2016 quarter. Preliminary sales volume for houses are 44 per cent lower to those experienced in the previous quarter. Average selling days increased by 28 days quarterly and up by 19 days annually. Stock of listings in the region decreased by 9.9 per cent for the quarter. The overall median rent has decreased by 1.8 per cent to $280 and rental listings are down by 7.1 per cent over the quarter.
Pilbara and KimberleyThe Port-Hedland market recorded an unchanged value in the median house price at $305,000 over the September 2016 quarter. Preliminary sales volume for houses are seven per cent lower than those experienced in the previous quarter. Average selling days decreased by nine days quarterly and down by eight days annually. Stock of listings in the region increased by 10.1 per cent for the quarter. The overall median rent has decreased by 6.3 per cent to $375 and rental listings are also down by 13.2 per cent over the quarter.The Broome market recorded an increase of 18.9 per cent in the median house price to $565,000 over the September 2016 quarter. Preliminary sales volume for houses are at similar levels to those experienced in the previous quarter. Average selling days increased by 10 days quarterly but down by three days annually. Stock of listings in the region increased by 12.1 per cent for the quarter. The overall median rent has remained stable at $450 whilst rental listings are up by 22.6 per cent over the quarter.
SAMPLE
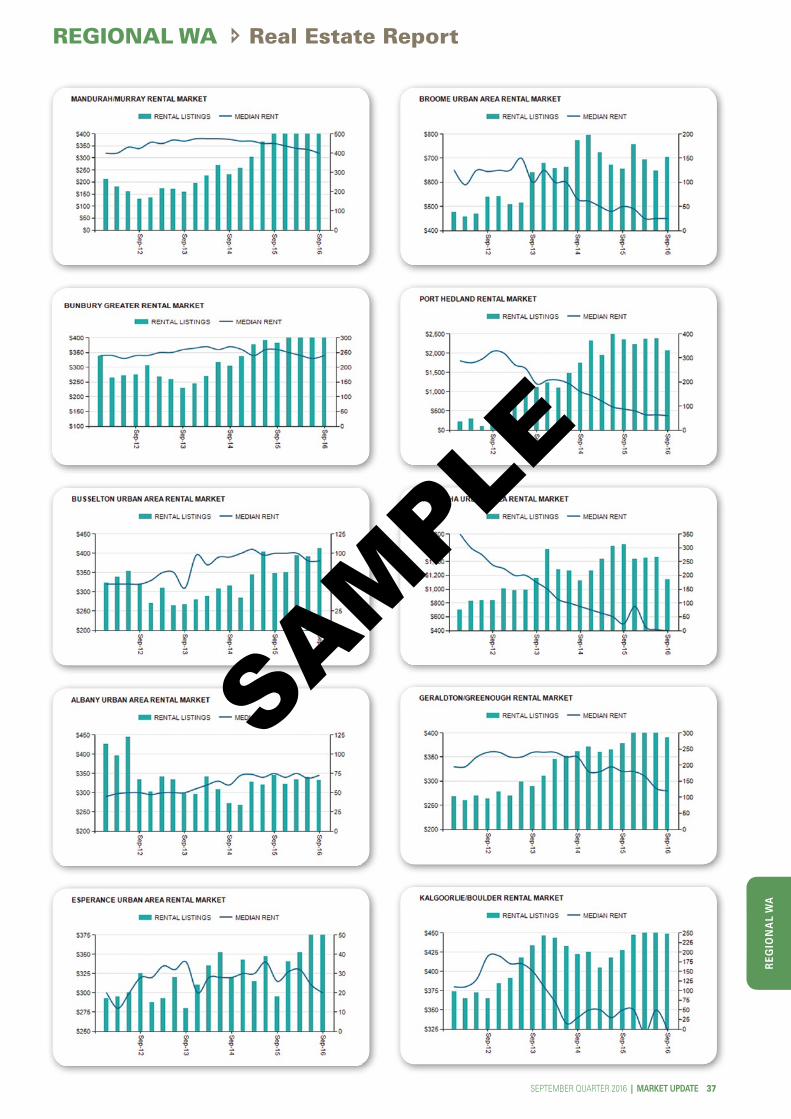
RE
GIO
NA
L W
A
SEPTEMBER QUARTER 2016 | MARKET UPDATE 37
REGIONAL WA Real Estate Report
SAMPLE

RE
GIO
NA
L W
A
38 MARKET UPDATE | SEPTEMBER QUARTER 2016
Real Estate Report REGIONAL WA
REGIONAL WAYear to September 2015 Year to September 2016 June Qtr 2016 September Qtr 2016
Sales% of
total salesSales
% of total sales
Sales% of
total salesSales
% oftotal sales
HOUSE
Up to $150,000 480 5.2% 495 6.0% 140 7.6% 134 10.2%
$150 - $200,000 370 4.0% 374 4.5% 112 6.1% 72 5.5%
$200 - $250,000 513 5.6% 439 5.3% 170 9.3% 111 8.5%
$250 - $300,000 920 10.0% 754 9.1% 182 9.9% 164 12.5%
$300 - $350,000 1219 13.3% 1108 13.3% 271 14.8% 162 12.4%
$350 - $400,000 1379 15.0% 1279 15.4% 248 13.5% 200 15.3%
$400 - $450,000 1171 12.8% 1071 12.9% 191 10.4% 139 10.6%
$450 - $500,000 827 9.0% 689 8.3% 135 7.4% 95 7.3%
$500 - $600,000 995 10.8% 920 11.1% 166 9.1% 108 8.3%
$600 - $800,000 866 9.4% 748 9.0% 145 7.9% 77 5.9%
$800 - $1 million 261 2.8% 269 3.2% 36 2.0% 28 2.1%
Over $1 million 182 2.0% 172 2.1% 35 1.9% 18 1.4%
UNIT
Up to $150,000 35 3.4% 32 3.9% 20 11.8% 20 15.3%
$150 - $200,000 67 6.5% 57 7.0% 15 8.9% 12 9.2%
$200 - $250,000 125 12.2% 76 9.4% 19 11.2% 22 16.8%
$250 - $300,000 187 18.2% 165 20.3% 34 20.1% 30 22.9%
$300 - $350,000 156 15.2% 120 14.8% 27 16.0% 12 9.2%
$350 - $400,000 98 9.5% 77 9.5% 9 5.3% 8 6.1%
$400 - $450,000 78 7.6% 76 9.4% 13 7.7% 7 5.3%
$450 - $500,000 64 6.2% 50 6.2% 6 3.6% 5 3.8%
$500 - $600,000 84 8.2% 56 6.9% 8 4.7% 6 4.6%
$600 - $800,000 89 8.7% 64 7.9% 11 6.5% 4 3.1%
$800 - $1 million 32 3.1% 19 2.3% 4 2.4% 1 0.8%
Over $1 million 13 1.3% 19 2.3% 3 1.8% 4 3.1%
VACANT LAND
Up to $100,000 373 8.3% 423 12.5% 81 13.7% 65 22.4%
$100 - $125,000 357 7.9% 232 6.8% 48 8.1% 25 8.6%
$125 - $150,000 636 14.2% 480 14.1% 77 13.0% 36 12.4%
$150 - $175,000 950 21.1% 533 15.7% 78 13.2% 26 9.0%
$175 - $200,000 697 15.5% 459 13.5% 89 15.0% 30 10.3%
$200 - $225,000 338 7.5% 325 9.6% 54 9.1% 20 6.9%
$225 - $250,000 231 5.1% 206 6.1% 37 6.3% 11 3.8%
$250 - $300,000 370 8.2% 247 7.3% 41 6.9% 22 7.6%
$300 - $400,000 309 6.9% 292 8.6% 42 7.1% 29 10.0%
$400 - $500,000 120 2.7% 106 3.1% 22 3.7% 13 4.5%
$500 - $750,000 71 1.6% 59 1.7% 16 2.7% 10 3.4%
$750 - $1 million 28 0.6% 15 0.4% 3 0.5% 2 0.7%
Over $1 million 14 0.3% 18 0.5% 4 0.7% 1 0.3%
RESIDENTIAL REAL ESTATE SALES BY PRICE RANGE JUNE QUARTER 2016Source: Landgate/REIWA
SAMPLE

RE
GIO
NA
L W
A
SEPTEMBER QUARTER 2016 | MARKET UPDATE 39
REGIONAL WA Real Estate Report
Town/SuburbSales - Year to September 2016
Annual Average % Change
Houses Units Land 2011 2015 2016 1 year 5 years
Gascoyne 75 8 18 $405,000 $375,000 $385,000 2.7% -1.0%
Balance of Gascoyne 46 1 15 $452,500 $445,000 $420,000 -5.6% -1.5%
Denham 15 3 $270,000 $220,000 $225,000 2.3% -3.6%
Exmouth 31 1 12 $510,000 $490,000 $460,000 -6.1% -2.0%
Carnarvon 29 7 3 $320,000 $345,000 $315,000 -8.7% -0.3%
Brockman 7 1 $500,000 $466,500 $349,000 -25.2% -6.9%
Brown Range 2 $430,000 $415,000 n.a. -0.7%
Carnarvon 4 $552,500 $395,000 n.a. n.a.
East Carnarvon 6 2 $348,500 $370,000 $372,500 0.7% 1.3%
Kingsford 2 $507,000 $300,000 $725,000 141.7% 7.4%
Morgantown 5 1 2 $332,500 $293,750 $215,000 -26.8% -8.4%
South Carnarvon 7 $270,000 $260,000 $260,000 0.0% -0.8%
Goldfields-Esperance 518 41 49 $311,000 $320,000 $297,500 -7.0% -0.9%
Balance of Goldfields-Esp 89 2 6 $130,000 $116,000 $87,000 -25.0% -7.7%
Condingup 2 $210,000 $160,000 -23.8% n.a.
Coolgardie 10 1 $126,500 $185,500 $136,000 -26.7% 1.5%
Gibson 2 $271,250 $270,000 $304,500 12.8% 2.3%
Grass Patch 1 $38,000 $20,000 $25,000 25.0% -8.0%
Hopetoun 8 1 $305,000 $214,000 $260,000 21.5% -3.1%
Kambalda East 13 $96,500 $100,000 $73,000 -27.0% -5.4%
Kambalda West 22 $135,000 $140,000 $95,000 -32.1% -6.8%
Laverton 2 1 $97,000 $87,500 $88,500 1.1% -1.8%
Leonora 4 1 $205,000 $113,000 $90,000 -20.4% -15.2%
Menzies 3 2 $30,000 $45,000 50.0% n.a.
Munglinup 1 $175,000 $10,000 $180,000 1700.0% 0.6%
Norseman 16 1 $55,000 $35,000 $33,000 -5.7% -9.7%
Ravensthorpe 4 $105,000 $150,750 $130,250 -13.6% 4.4%
Salmon Gums 1 1 $40,000 $80,000 $175,000 118.8% 34.3%
Esperance 118 10 24 $377,500 $368,000 $350,000 -4.9% -1.5%
Bandy Creek 1 1 2 $615,000 $645,000 $565,000 -12.4% -1.7%
Castletown 44 1 13 $380,000 $370,000 $370,000 0.0% -0.5%
Includes all towns/localities recording activity in the Year to June, irrespective of no sales activity in June Quarter 2016. Includes only house & land sales on lots < 1 Ha.© REIWA - For the exclusive use of REIWA Members. Unauthorised distribution, reproduction or sale of the data will breach REIWA’s copyright.
The Regional Sales Report presents data for regional centres and their suburbs and all other communities across Regional Western Australia in a series of discrete regional areas that generally align with Australian Bureau of Statistics and Regional Development Commission typology. Where appropriate, sub-regions are used to group towns in adjoining shires and market areas.
REGION Regional Centre Sub-Region
PEEL Mandurah-Murray Balance of Region
SOUTH WEST Bunbury Urban Area Preston
Busselton Urban Area Balance of Shire
Augusta-Margaret River Blackwood
GREAT SOUTHERN Albany Urban Area Balance of Region
GOLDFIELDS-ESPERANCE Kalgoorlie-Boulder Balance of Region
Esperance Urban Area
WHEATBELT Avon Arc
Coastal Wheatbelt
Balance of Region
MIDWEST Geraldton-Greenough Balance of Region
GASCOYNE Carnarvon Balance of Region
PILBARA Karratha Urban Area Balance of Region
Port Hedland Urban Area
KIMBERLEY Broome Urban Area Balance of Region
CHRISTMAS ISLAND
SAMPLE
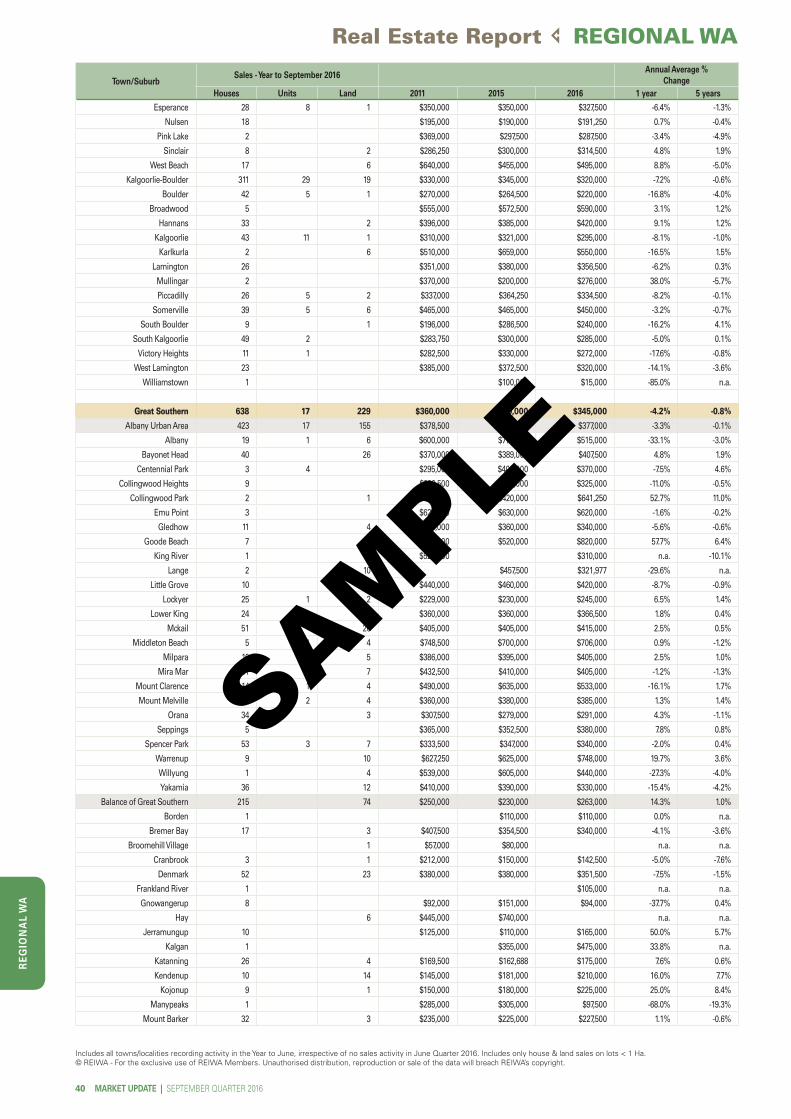
RE
GIO
NA
L W
A
40 MARKET UPDATE | SEPTEMBER QUARTER 2016
Real Estate Report REGIONAL WA
Includes all towns/localities recording activity in the Year to June, irrespective of no sales activity in June Quarter 2016. Includes only house & land sales on lots < 1 Ha.© REIWA - For the exclusive use of REIWA Members. Unauthorised distribution, reproduction or sale of the data will breach REIWA’s copyright.
Town/SuburbSales - Year to September 2016
Annual Average % Change
Houses Units Land 2011 2015 2016 1 year 5 years
Esperance 28 8 1 $350,000 $350,000 $327,500 -6.4% -1.3%
Nulsen 18 $195,000 $190,000 $191,250 0.7% -0.4%
Pink Lake 2 $369,000 $297,500 $287,500 -3.4% -4.9%
Sinclair 8 2 $286,250 $300,000 $314,500 4.8% 1.9%
West Beach 17 6 $640,000 $455,000 $495,000 8.8% -5.0%
Kalgoorlie-Boulder 311 29 19 $330,000 $345,000 $320,000 -7.2% -0.6%
Boulder 42 5 1 $270,000 $264,500 $220,000 -16.8% -4.0%
Broadwood 5 $555,000 $572,500 $590,000 3.1% 1.2%
Hannans 33 2 $396,000 $385,000 $420,000 9.1% 1.2%
Kalgoorlie 43 11 1 $310,000 $321,000 $295,000 -8.1% -1.0%
Karlkurla 2 6 $510,000 $659,000 $550,000 -16.5% 1.5%
Lamington 26 $351,000 $380,000 $356,500 -6.2% 0.3%
Mullingar 2 $370,000 $200,000 $276,000 38.0% -5.7%
Piccadilly 26 5 2 $337,000 $364,250 $334,500 -8.2% -0.1%
Somerville 39 5 6 $465,000 $465,000 $450,000 -3.2% -0.7%
South Boulder 9 1 $196,000 $286,500 $240,000 -16.2% 4.1%
South Kalgoorlie 49 2 $283,750 $300,000 $285,000 -5.0% 0.1%
Victory Heights 11 1 $282,500 $330,000 $272,000 -17.6% -0.8%
West Lamington 23 $385,000 $372,500 $320,000 -14.1% -3.6%
Williamstown 1 $100,000 $15,000 -85.0% n.a.
Great Southern 638 17 229 $360,000 $360,000 $345,000 -4.2% -0.8%
Albany Urban Area 423 17 155 $378,500 $390,000 $377,000 -3.3% -0.1%
Albany 19 1 6 $600,000 $770,000 $515,000 -33.1% -3.0%
Bayonet Head 40 26 $370,000 $389,000 $407,500 4.8% 1.9%
Centennial Park 3 4 $295,000 $400,000 $370,000 -7.5% 4.6%
Collingwood Heights 9 $332,500 $365,000 $325,000 -11.0% -0.5%
Collingwood Park 2 1 $380,000 $420,000 $641,250 52.7% 11.0%
Emu Point 3 $625,000 $630,000 $620,000 -1.6% -0.2%
Gledhow 11 4 $350,000 $360,000 $340,000 -5.6% -0.6%
Goode Beach 7 4 $600,000 $520,000 $820,000 57.7% 6.4%
King River 1 $529,000 $310,000 n.a. -10.1%
Lange 2 10 $457,500 $321,977 -29.6% n.a.
Little Grove 10 8 $440,000 $460,000 $420,000 -8.7% -0.9%
Lockyer 25 1 2 $229,000 $230,000 $245,000 6.5% 1.4%
Lower King 24 8 $360,000 $360,000 $366,500 1.8% 0.4%
Mckail 51 26 $405,000 $405,000 $415,000 2.5% 0.5%
Middleton Beach 5 1 4 $748,500 $700,000 $706,000 0.9% -1.2%
Milpara 10 5 $386,000 $395,000 $405,000 2.5% 1.0%
Mira Mar 31 4 7 $432,500 $410,000 $405,000 -1.2% -1.3%
Mount Clarence 14 1 4 $490,000 $635,000 $533,000 -16.1% 1.7%
Mount Melville 18 2 4 $360,000 $380,000 $385,000 1.3% 1.4%
Orana 34 3 $307,500 $279,000 $291,000 4.3% -1.1%
Seppings 5 $365,000 $352,500 $380,000 7.8% 0.8%
Spencer Park 53 3 7 $333,500 $347,000 $340,000 -2.0% 0.4%
Warrenup 9 10 $627,250 $625,000 $748,000 19.7% 3.6%
Willyung 1 4 $539,000 $605,000 $440,000 -27.3% -4.0%
Yakamia 36 12 $410,000 $390,000 $330,000 -15.4% -4.2%
Balance of Great Southern 215 74 $250,000 $230,000 $263,000 14.3% 1.0%
Borden 1 $110,000 $110,000 0.0% n.a.
Bremer Bay 17 3 $407,500 $354,500 $340,000 -4.1% -3.6%
Broomehill Village 1 $57,000 $80,000 n.a. n.a.
Cranbrook 3 1 $212,000 $150,000 $142,500 -5.0% -7.6%
Denmark 52 23 $380,000 $380,000 $351,500 -7.5% -1.5%
Frankland River 1 $105,000 n.a. n.a.
Gnowangerup 8 $92,000 $151,000 $94,000 -37.7% 0.4%
Hay 6 $445,000 $740,000 n.a. n.a.
Jerramungup 10 $125,000 $110,000 $165,000 50.0% 5.7%
Kalgan 1 $355,000 $475,000 33.8% n.a.
Katanning 26 4 $169,500 $162,688 $175,000 7.6% 0.6%
Kendenup 10 14 $145,000 $181,000 $210,000 16.0% 7.7%
Kojonup 9 1 $150,000 $180,000 $225,000 25.0% 8.4%
Manypeaks 1 $285,000 $305,000 $97,500 -68.0% -19.3%
Mount Barker 32 3 $235,000 $225,000 $227,500 1.1% -0.6%
SAMPLE
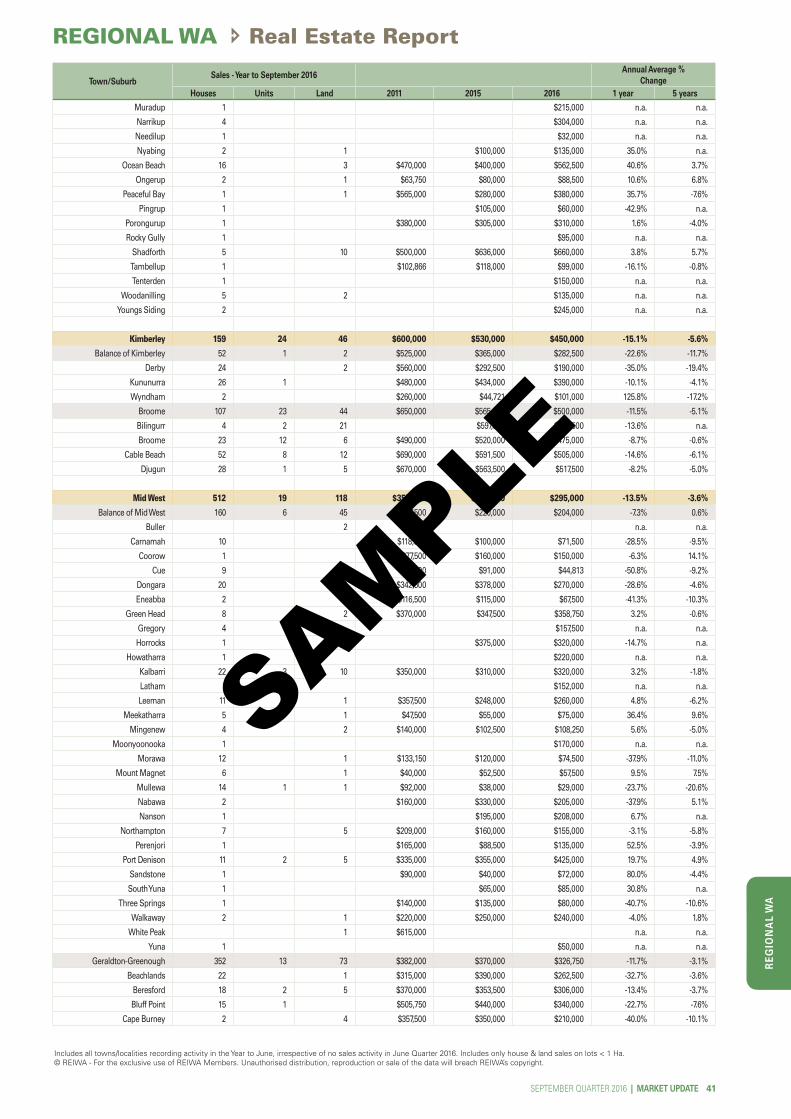
RE
GIO
NA
L W
A
SEPTEMBER QUARTER 2016 | MARKET UPDATE 41
REGIONAL WA Real Estate Report
Town/SuburbSales - Year to September 2016
Annual Average % Change
Houses Units Land 2011 2015 2016 1 year 5 years
Muradup 1 $215,000 n.a. n.a.
Narrikup 4 $304,000 n.a. n.a.
Needilup 1 $32,000 n.a. n.a.
Nyabing 2 1 $100,000 $135,000 35.0% n.a.
Ocean Beach 16 3 $470,000 $400,000 $562,500 40.6% 3.7%
Ongerup 2 1 $63,750 $80,000 $88,500 10.6% 6.8%
Peaceful Bay 1 1 $565,000 $280,000 $380,000 35.7% -7.6%
Pingrup 1 $105,000 $60,000 -42.9% n.a.
Porongurup 1 $380,000 $305,000 $310,000 1.6% -4.0%
Rocky Gully 1 $95,000 n.a. n.a.
Shadforth 5 10 $500,000 $636,000 $660,000 3.8% 5.7%
Tambellup 1 $102,866 $118,000 $99,000 -16.1% -0.8%
Tenterden 1 $150,000 n.a. n.a.
Woodanilling 5 2 $135,000 n.a. n.a.
Youngs Siding 2 $245,000 n.a. n.a.
Kimberley 159 24 46 $600,000 $530,000 $450,000 -15.1% -5.6%
Balance of Kimberley 52 1 2 $525,000 $365,000 $282,500 -22.6% -11.7%
Derby 24 2 $560,000 $292,500 $190,000 -35.0% -19.4%
Kununurra 26 1 $480,000 $434,000 $390,000 -10.1% -4.1%
Wyndham 2 $260,000 $44,721 $101,000 125.8% -17.2%
Broome 107 23 44 $650,000 $565,000 $500,000 -11.5% -5.1%
Bilingurr 4 2 21 $597,500 $516,500 -13.6% n.a.
Broome 23 12 6 $490,000 $520,000 $475,000 -8.7% -0.6%
Cable Beach 52 8 12 $690,000 $591,500 $505,000 -14.6% -6.1%
Djugun 28 1 5 $670,000 $563,500 $517,500 -8.2% -5.0%
Mid West 512 19 118 $355,000 $341,000 $295,000 -13.5% -3.6%
Balance of Mid West 160 6 45 $197,500 $220,000 $204,000 -7.3% 0.6%
Buller 2 n.a. n.a.
Carnamah 10 $118,000 $100,000 $71,500 -28.5% -9.5%
Coorow 1 $77,500 $160,000 $150,000 -6.3% 14.1%
Cue 9 $72,500 $91,000 $44,813 -50.8% -9.2%
Dongara 20 12 $342,500 $378,000 $270,000 -28.6% -4.6%
Eneabba 2 $116,500 $115,000 $67,500 -41.3% -10.3%
Green Head 8 2 $370,000 $347,500 $358,750 3.2% -0.6%
Gregory 4 $157,500 n.a. n.a.
Horrocks 1 $375,000 $320,000 -14.7% n.a.
Howatharra 1 $220,000 n.a. n.a.
Kalbarri 22 3 10 $350,000 $310,000 $320,000 3.2% -1.8%
Latham 1 $152,000 n.a. n.a.
Leeman 11 1 $357,500 $248,000 $260,000 4.8% -6.2%
Meekatharra 5 1 $47,500 $55,000 $75,000 36.4% 9.6%
Mingenew 4 2 $140,000 $102,500 $108,250 5.6% -5.0%
Moonyoonooka 1 $170,000 n.a. n.a.
Morawa 12 1 $133,150 $120,000 $74,500 -37.9% -11.0%
Mount Magnet 6 1 $40,000 $52,500 $57,500 9.5% 7.5%
Mullewa 14 1 1 $92,000 $38,000 $29,000 -23.7% -20.6%
Nabawa 2 $160,000 $330,000 $205,000 -37.9% 5.1%
Nanson 1 $195,000 $208,000 6.7% n.a.
Northampton 7 5 $209,000 $160,000 $155,000 -3.1% -5.8%
Perenjori 1 $165,000 $88,500 $135,000 52.5% -3.9%
Port Denison 11 2 5 $335,000 $355,000 $425,000 19.7% 4.9%
Sandstone 1 $90,000 $40,000 $72,000 80.0% -4.4%
South Yuna 1 $65,000 $85,000 30.8% n.a.
Three Springs 1 $140,000 $135,000 $80,000 -40.7% -10.6%
Walkaway 2 1 $220,000 $250,000 $240,000 -4.0% 1.8%
White Peak 1 $615,000 n.a. n.a.
Yuna 1 $50,000 n.a. n.a.
Geraldton-Greenough 352 13 73 $382,000 $370,000 $326,750 -11.7% -3.1%
Beachlands 22 1 $315,000 $390,000 $262,500 -32.7% -3.6%
Beresford 18 2 5 $370,000 $353,500 $306,000 -13.4% -3.7%
Bluff Point 15 1 $505,750 $440,000 $340,000 -22.7% -7.6%
Cape Burney 2 4 $357,500 $350,000 $210,000 -40.0% -10.1%
Includes all towns/localities recording activity in the Year to June, irrespective of no sales activity in June Quarter 2016. Includes only house & land sales on lots < 1 Ha.© REIWA - For the exclusive use of REIWA Members. Unauthorised distribution, reproduction or sale of the data will breach REIWA’s copyright.
SAMPLE

RE
GIO
NA
L W
A
42 MARKET UPDATE | SEPTEMBER QUARTER 2016
Real Estate Report REGIONAL WA
Town/SuburbSales - Year to September 2016
Annual Average % Change
Houses Units Land 2011 2015 2016 1 year 5 years
Drummond Cove 17 12 $477,500 $445,000 $395,000 -11.2% -3.7%
Geraldton 27 4 2 $356,500 $340,000 $310,000 -8.8% -2.8%
Glenfield 8 6 $516,500 $425,000 $389,000 -8.5% -5.5%
Karloo 5 1 $249,500 $231,000 $220,000 -4.8% -2.5%
Mahomets Flats 10 1 $406,500 $315,000 $305,000 -3.2% -5.6%
Moresby 3 $550,000 n.a. n.a.
Mount Tarcoola 38 4 $405,000 $375,000 $330,000 -12.0% -4.0%
Rangeway 18 2 $230,000 $155,000 $129,000 -16.8% -10.9%
Spalding 20 1 $266,000 $252,000 $197,500 -21.6% -5.8%
Strathalbyn 9 1 $537,500 $525,000 $470,000 -10.5% -2.6%
Sunset Beach 17 7 $435,000 $385,000 $337,500 -12.3% -4.9%
Tarcoola Beach 19 1 1 $411,500 $380,000 $355,000 -6.6% -2.9%
Utakarra 10 6 $310,000 $270,000 $187,250 -30.6% -9.6%
Waggrakine 16 8 $387,500 $347,500 $270,000 -22.3% -7.0%
Wandina 52 8 $475,000 $419,000 $415,000 -1.0% -2.7%
Webberton 2 $425,000 $557,500 n.a. 5.6%
West End 6 $190,000 $257,500 $100,250 -61.1% -12.0%
Wonthella 18 1 3 $320,000 $310,000 $267,500 -13.7% -3.5%
Woorree 3 1 $461,250 $569,500 $400,000 -29.8% -2.8%
Offshore Areas 8 3 2 $400,000 $335,000 $330,000 -1.5% -3.8%
Christmas Island 8 3 2 $400,000 $335,000 $330,000 -1.5% -3.8%
Christmas Island 7 2 2 $375,000 $310,000 $345,000 11.3% -1.7%
Settlement 1 1 $465,000 $335,000 $315,000 -6.0% -7.5%
Cocos (Keeling) Islands n.a. n.a.
Peel 1,591 241 721 $380,000 $410,000 $390,000 -4.9% 0.5%
Balance of Peel 77 3 21 $305,000 $309,500 $302,500 -2.3% -0.2%
Boddington 12 1 $330,000 $260,000 $277,500 6.7% -3.4%
Coolup 2 $295,000 $260,000 $380,000 46.2% 5.2%
Dwellingup 11 $350,000 $315,000 $300,000 -4.8% -3.0%
Hamel 1 2 $187,500 $200,000 $200,000 0.0% 1.3%
North Dandalup 4 $235,000 $338,000 $375,000 10.9% 9.8%
Preston Beach 12 8 $375,000 $345,000 $341,500 -1.0% -1.9%
Ranford 1 $250,000 n.a. n.a.
Waroona 34 2 11 $292,500 $309,000 $293,000 -5.2% 0.0%
Mandurah-Murray 1,514 238 700 $385,000 $415,000 $390,000 -6.0% 0.3%
Bouvard 5 8 6 $627,500 $406,000 $355,000 -12.6% -10.8%
Coodanup 58 23 $263,500 $322,500 $293,500 -9.0% 2.2%
Dawesville 119 3 95 $405,000 $440,000 $400,000 -9.1% -0.2%
Dudley Park 141 22 71 $390,000 $430,000 $390,000 -9.3% 0.0%
Erskine 80 19 83 $430,000 $430,000 $435,000 1.2% 0.2%
Falcon 146 20 $365,000 $399,000 $381,250 -4.4% 0.9%
Furnissdale 10 1 $341,000 $345,000 $418,500 21.3% 4.2%
Greenfields 144 9 10 $290,000 $329,000 $315,000 -4.3% 1.7%
Halls Head 222 20 67 $420,000 $463,750 $440,000 -5.1% 0.9%
Lakelands 78 31 $390,000 $416,500 $390,500 -6.2% 0.0%
Madora Bay 31 48 $442,500 $548,500 $440,000 -19.8% -0.1%
Mandurah 99 139 20 $290,000 $330,000 $307,000 -7.0% 1.1%
Meadow Springs 109 93 $400,000 $425,000 $412,000 -3.1% 0.6%
North Yunderup 12 3 $320,000 $375,000 $310,000 -17.3% -0.6%
Pinjarra 61 6 9 $342,000 $359,500 $380,000 5.7% 2.1%
Ravenswood 30 15 $385,000 $406,500 $385,500 -5.2% 0.0%
San Remo 22 4 $485,000 $490,000 $557,500 13.8% 2.8%
Silver Sands 23 1 4 $445,000 $500,000 $465,000 -7.0% 0.9%
South Yunderup 66 2 45 $620,000 $520,000 $494,500 -4.9% -4.4%
Wannanup 58 9 52 $416,000 $457,500 $471,250 3.0% 2.5%
Pilbara 418 31 25 $760,000 $500,000 $340,000 -32.0% -14.9%
Balance of Pilbara 75 7 20 $685,000 $475,000 $330,000 -30.5% -13.6%
Dampier 25 3 $857,500 $550,000 $460,000 -16.4% -11.7%
Marble Bar 1 1 $225,000 $55,000 n.a. -24.6%
Newman 24 2 19 $687,000 $395,000 $165,500 -58.1% -24.8%
Includes all towns/localities recording activity in the Year to June, irrespective of no sales activity in June Quarter 2016. Includes only house & land sales on lots < 1 Ha.© REIWA - For the exclusive use of REIWA Members. Unauthorised distribution, reproduction or sale of the data will breach REIWA’s copyright.
SAMPLE

RE
GIO
NA
L W
A
SEPTEMBER QUARTER 2016 | MARKET UPDATE 43
REGIONAL WA Real Estate Report
Town/SuburbSales - Year to September 2016
Annual Average % Change
Houses Units Land 2011 2015 2016 1 year 5 years
Nullagine 2 1 $100,000 $90,000 $47,500 -47.2% -13.8%
Onslow 6 $625,000 $700,000 $365,000 -47.9% -10.2%
Point Samson 5 1 $862,500 $656,500 $600,000 -8.6% -7.0%
Roebourne 2 $262,500 $300,000 $110,000 -63.3% -16.0%
Tom Price 8 $630,000 $520,000 $290,000 -44.2% -14.4%
Wickham 2 $485,000 $310,000 $180,000 -41.9% -18.0%
Karratha 206 11 4 $785,000 $430,000 $330,000 -23.3% -15.9%
Baynton 54 2 $957,500 $565,000 $432,500 -23.5% -14.7%
Bulgarra 43 2 1 $747,500 $383,750 $270,000 -29.6% -18.4%
Millars Well 25 1 $768,500 $380,000 $270,000 -28.9% -18.9%
Nickol 49 1 $915,000 $448,500 $330,000 -26.4% -18.5%
Pegs Creek 35 8 $700,500 $380,000 $260,000 -31.6% -18.0%
Port Hedland 137 13 1 $775,000 $682,500 $360,000 -47.3% -14.2%
Port Hedland 39 7 1 $1,095,000 $850,000 $450,000 -47.1% -16.3%
South Hedland 98 6 $749,000 $656,227 $315,500 -51.9% -15.9%
South West 2,078 235 792 $376,000 $410,000 $400,000 -2.4% 1.2%
Augusta-Margaret River 194 39 135 $435,000 $485,000 $487,500 0.5% 2.3%
Augusta 21 6 14 $480,000 $510,000 $470,000 -7.8% -0.4%
Burnside 1 $850,000 n.a. n.a.
Cowaramup 25 1 59 $555,000 $536,000 $540,000 0.7% -0.5%
East Augusta 1 $410,000 $580,000 n.a. 7.2%
Gnarabup 12 1 3 $675,000 $702,500 $782,500 11.4% 3.0%
Gracetown 4 1 $932,500 $902,500 $982,500 8.9% 1.1%
Margaret River 117 31 54 $420,000 $470,000 $460,000 -2.1% 1.8%
Molloy Island 5 2 $320,000 $325,000 $320,000 -1.5% 0.0%
Prevelly 5 2 $719,500 $905,000 $850,000 -6.1% 3.4%
Witchcliffe 3 $340,000 $384,833 $450,000 16.9% 5.8%
Balance of Busselton LGA 165 19 155 $605,000 $650,000 $635,000 -2.3% 1.0%
Carbunup River 2 $328,000 $450,000 n.a. 6.5%
Dunsborough 117 16 92 $540,000 $625,500 $615,000 -1.7% 2.6%
Eagle Bay 4 2 $1,550,000 $1,770,000 $1,185,000 -33.1% -5.2%
Kealy 11 55 $565,000 $329,000 -41.8% n.a.
Marybrook 1 $1,100,000 $1,375,000 $1,500,000 9.1% 6.4%
Quindalup 24 2 6 $736,000 $690,000 $885,000 28.3% 3.8%
Yallingup 6 1 $1,200,000 $1,512,500 $1,887,500 24.8% 9.5%
Blackwood Sub-Region 153 8 48 $270,000 $285,000 $255,000 -10.5% -1.1%
Boyup Brook 9 $200,000 $200,000 $154,500 -22.8% -5.0%
Bridgetown 37 20 $300,000 $341,250 $320,000 -6.2% 1.3%
Dingup 2 $70,000 $85,000 n.a. 4.0%
Dinninup 2 $164,000 n.a. n.a.
Greenbushes 5 5 $235,000 $175,000 $186,000 6.3% -4.6%
Hester 1 $220,000 $240,000 9.1% n.a.
Kangaroo Gully 1 $545,000 $489,000 $120,000 -75.5% -26.1%
Kulikup 2 n.a. n.a.
Manjimup 60 7 5 $255,000 $268,250 $237,500 -11.5% -1.4%
Nannup 9 6 $324,000 $338,000 $270,000 -20.1% -3.6%
Nornalup 2 $405,000 n.a. n.a.
Northcliffe 6 $165,000 $197,500 n.a. 3.7%
Pemberton 11 1 2 $250,000 $172,000 $225,000 30.8% -2.1%
Quinninup 6 $293,500 $140,000 $279,500 99.6% -1.0%
Walpole 6 4 $270,500 $350,000 $344,000 -1.7% 4.9%
Busselton 385 37 132 $415,000 $463,500 $450,000 -2.9% 1.6%
Abbey 28 4 $457,500 $620,000 $507,500 -18.1% 2.1%
Bovell 1 6 $664,000 $835,000 $850,000 1.8% 5.1%
Broadwater 57 2 6 $435,000 $470,000 $470,000 0.0% 1.6%
Busselton 35 9 6 $425,000 $485,000 $530,000 9.3% 4.5%
Geographe 75 6 25 $395,000 $440,000 $425,000 -3.4% 1.5%
Siesta Park 1 $3,600,000 $1,440,000 $1,700,000 18.1% -13.9%
Vasse 28 2 $400,000 $450,000 $417,500 -7.2% 0.9%
West Busselton 122 20 38 $390,000 $443,000 $439,500 -0.8% 2.4%
Wonnerup 2 $960,000 $805,000 $552,500 -31.4% -10.5%
Yalyalup 36 45 $432,500 $445,000 $437,500 -1.7% 0.2%
Greater Bunbury 912 123 241 $368,000 $385,000 $374,000 -2.9% 0.3%
Includes all towns/localities recording activity in the Year to June, irrespective of no sales activity in June Quarter 2016. Includes only house & land sales on lots < 1 Ha.© REIWA - For the exclusive use of REIWA Members. Unauthorised distribution, reproduction or sale of the data will breach REIWA’s copyright.
SAMPLE
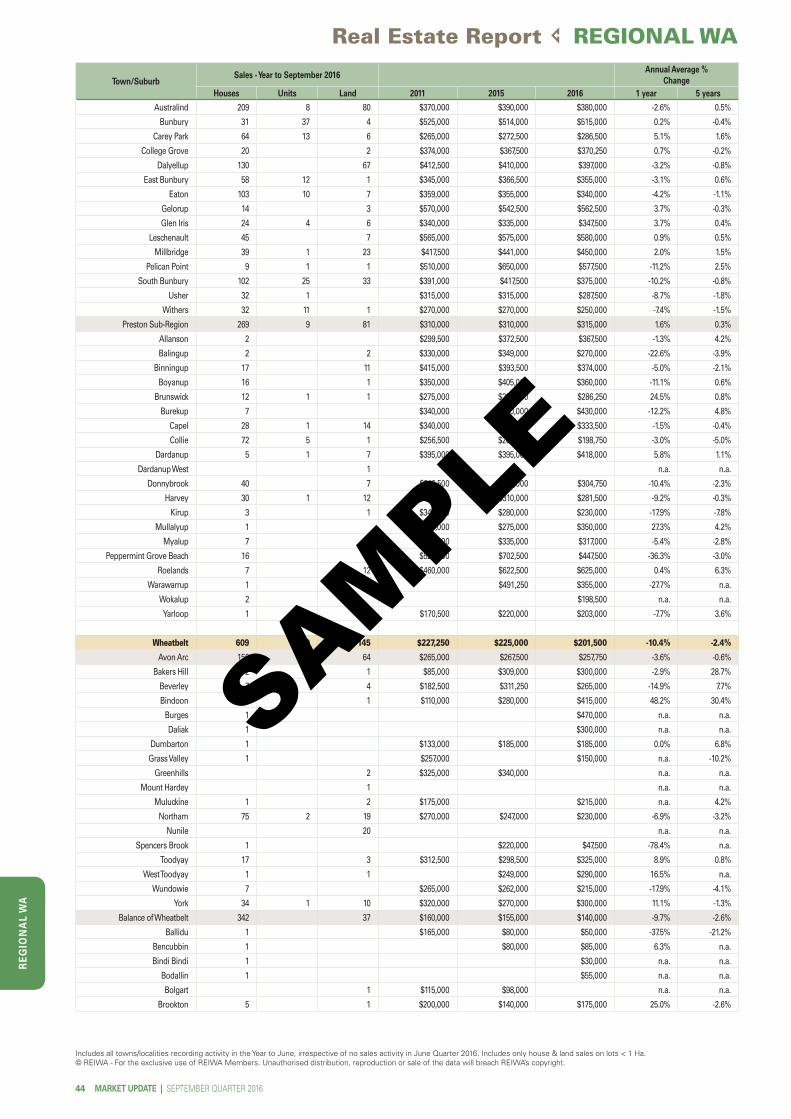
RE
GIO
NA
L W
A
44 MARKET UPDATE | SEPTEMBER QUARTER 2016
Real Estate Report REGIONAL WA
Town/SuburbSales - Year to September 2016
Annual Average % Change
Houses Units Land 2011 2015 2016 1 year 5 years
Australind 209 8 80 $370,000 $390,000 $380,000 -2.6% 0.5%
Bunbury 31 37 4 $525,000 $514,000 $515,000 0.2% -0.4%
Carey Park 64 13 6 $265,000 $272,500 $286,500 5.1% 1.6%
College Grove 20 2 $374,000 $367,500 $370,250 0.7% -0.2%
Dalyellup 130 67 $412,500 $410,000 $397,000 -3.2% -0.8%
East Bunbury 58 12 1 $345,000 $366,500 $355,000 -3.1% 0.6%
Eaton 103 10 7 $359,000 $355,000 $340,000 -4.2% -1.1%
Gelorup 14 3 $570,000 $542,500 $562,500 3.7% -0.3%
Glen Iris 24 4 6 $340,000 $335,000 $347,500 3.7% 0.4%
Leschenault 45 7 $565,000 $575,000 $580,000 0.9% 0.5%
Millbridge 39 1 23 $417,500 $441,000 $450,000 2.0% 1.5%
Pelican Point 9 1 1 $510,000 $650,000 $577,500 -11.2% 2.5%
South Bunbury 102 25 33 $391,000 $417,500 $375,000 -10.2% -0.8%
Usher 32 1 $315,000 $315,000 $287,500 -8.7% -1.8%
Withers 32 11 1 $270,000 $270,000 $250,000 -7.4% -1.5%
Preston Sub-Region 269 9 81 $310,000 $310,000 $315,000 1.6% 0.3%
Allanson 2 $299,500 $372,500 $367,500 -1.3% 4.2%
Balingup 2 2 $330,000 $349,000 $270,000 -22.6% -3.9%
Binningup 17 11 $415,000 $393,500 $374,000 -5.0% -2.1%
Boyanup 16 1 $350,000 $405,000 $360,000 -11.1% 0.6%
Brunswick 12 1 1 $275,000 $230,000 $286,250 24.5% 0.8%
Burekup 7 $340,000 $490,000 $430,000 -12.2% 4.8%
Capel 28 1 14 $340,000 $338,500 $333,500 -1.5% -0.4%
Collie 72 5 1 $256,500 $205,000 $198,750 -3.0% -5.0%
Dardanup 5 1 7 $395,000 $395,000 $418,000 5.8% 1.1%
Dardanup West 1 n.a. n.a.
Donnybrook 40 7 $342,500 $340,000 $304,750 -10.4% -2.3%
Harvey 30 1 12 $286,000 $310,000 $281,500 -9.2% -0.3%
Kirup 3 1 $345,000 $280,000 $230,000 -17.9% -7.8%
Mullalyup 1 $285,000 $275,000 $350,000 27.3% 4.2%
Myalup 7 1 $365,000 $335,000 $317,000 -5.4% -2.8%
Peppermint Grove Beach 16 4 $520,000 $702,500 $447,500 -36.3% -3.0%
Roelands 7 12 $460,000 $622,500 $625,000 0.4% 6.3%
Warawarrup 1 $491,250 $355,000 -27.7% n.a.
Wokalup 2 $198,500 n.a. n.a.
Yarloop 1 6 $170,500 $220,000 $203,000 -7.7% 3.6%
Wheatbelt 609 10 145 $227,250 $225,000 $201,500 -10.4% -2.4%
Avon Arc 150 3 64 $265,000 $267,500 $257,750 -3.6% -0.6%
Bakers Hill 2 1 $85,000 $309,000 $300,000 -2.9% 28.7%
Beverley 7 4 $182,500 $311,250 $265,000 -14.9% 7.7%
Bindoon 1 1 $110,000 $280,000 $415,000 48.2% 30.4%
Burges 1 $470,000 n.a. n.a.
Daliak 1 $300,000 n.a. n.a.
Dumbarton 1 $133,000 $185,000 $185,000 0.0% 6.8%
Grass Valley 1 $257,000 $150,000 n.a. -10.2%
Greenhills 2 $325,000 $340,000 n.a. n.a.
Mount Hardey 1 n.a. n.a.
Muluckine 1 2 $175,000 $215,000 n.a. 4.2%
Northam 75 2 19 $270,000 $247,000 $230,000 -6.9% -3.2%
Nunile 20 n.a. n.a.
Spencers Brook 1 $220,000 $47,500 -78.4% n.a.
Toodyay 17 3 $312,500 $298,500 $325,000 8.9% 0.8%
West Toodyay 1 1 $249,000 $290,000 16.5% n.a.
Wundowie 7 $265,000 $262,000 $215,000 -17.9% -4.1%
York 34 1 10 $320,000 $270,000 $300,000 11.1% -1.3%
Balance of Wheatbelt 342 37 $160,000 $155,000 $140,000 -9.7% -2.6%
Ballidu 1 $165,000 $80,000 $50,000 -37.5% -21.2%
Bencubbin 1 $80,000 $85,000 6.3% n.a.
Bindi Bindi 1 $30,000 n.a. n.a.
Bodallin 1 $55,000 n.a. n.a.
Bolgart 1 $115,000 $98,000 n.a. n.a.
Brookton 5 1 $200,000 $140,000 $175,000 25.0% -2.6%
Includes all towns/localities recording activity in the Year to June, irrespective of no sales activity in June Quarter 2016. Includes only house & land sales on lots < 1 Ha.© REIWA - For the exclusive use of REIWA Members. Unauthorised distribution, reproduction or sale of the data will breach REIWA’s copyright.
SAMPLE

RE
GIO
NA
L W
A
SEPTEMBER QUARTER 2016 | MARKET UPDATE 45
REGIONAL WA Real Estate Report
Town/SuburbSales - Year to September 2016
Annual Average % Change
Houses Units Land 2011 2015 2016 1 year 5 years
Bruce Rock 11 $108,000 $95,000 $88,500 -6.8% -3.9%
Buntine 1 $100,000 n.a. n.a.
Calingiri 2 $187,500 $167,000 $145,000 -13.2% -5.0%
Coomberdale 4 n.a. n.a.
Corrigin 15 1 $170,000 $139,250 $145,000 4.1% -3.1%
Cuballing 1 1 $311,000 $250,000 $300,000 20.0% -0.7%
Cunderdin 11 1 $180,500 $170,000 $205,000 20.6% 2.6%
Dalwallinu 14 2 $165,000 $140,000 $180,000 28.6% 1.8%
Dangin 1 n.a. n.a.
Darkan 2 $225,000 $198,750 $100,000 -49.7% -15.0%
Dowerin 6 1 $181,250 $157,000 $130,000 -17.2% -6.4%
Dumbleyung 6 $21,500 $95,000 $103,500 8.9% 36.9%
Goomalling 8 $95,000 $185,000 $177,500 -4.1% 13.3%
Hyden 1 $210,000 $220,000 n.a. 0.9%
Kalannie 5 $285,000 $207,500 $220,000 6.0% -5.0%
Kellerberrin 5 2 $163,250 $110,750 $125,000 12.9% -5.2%
Kondinin 4 $92,000 $70,000 $50,250 -28.2% -11.4%
Koorda 5 $85,000 $49,750 $65,000 30.7% -5.2%
Kukerin 1 $40,000 $29,000 $70,000 141.4% 11.8%
Kulin 7 $77,500 $96,000 $50,000 -47.9% -8.4%
Kununoppin 3 $40,000 $25,000 $50,000 100.0% 4.6%
Lake Grace 13 2 $180,000 $150,000 $170,000 13.3% -1.1%
Lake King 1 n.a. n.a.
Marvel Loch 2 $45,000 $37,500 -16.7% n.a.
Meckering 4 $137,500 $162,000 n.a. 3.3%
Merredin 44 2 $150,500 $179,000 $162,500 -9.2% 1.5%
Minnivale 1 n.a. n.a.
Moora 15 4 $155,000 $170,000 $150,000 -11.8% -0.7%
Mukinbudin 3 $150,000 $69,750 $92,000 31.9% -9.3%
Narembeen 7 $122,500 $130,000 $75,000 -42.3% -9.3%
Narrogin 32 2 $245,000 $222,500 $163,000 -26.7% -7.8%
Newdegate 2 $107,500 $75,000 $89,167 18.9% -3.7%
Nungarin 2 $43,000 $83,000 $85,000 2.4% 14.6%
Pingelly 14 2 $161,250 $140,000 $110,000 -21.4% -7.4%
Popanyinning 1 $105,000 n.a. n.a.
Quairading 5 $105,000 $185,000 $140,000 -24.3% 5.9%
Southern Cross 11 $159,500 $147,500 $80,000 -45.8% -12.9%
Tammin 4 2 $54,250 $85,000 $80,000 -5.9% 8.1%
Tincurrin 1 $70,000 n.a. n.a.
Trayning 4 $73,000 $85,500 17.1% n.a.
Wagin 22 4 $148,750 $170,000 $178,000 4.7% 3.7%
Wandering 2 $195,000 $270,000 $270,000 0.0% 6.7%
Warralakin 1 $36,000 n.a. n.a.
Watheroo 3 $130,000 $50,000 n.a. -17.4%
Westonia 3 $55,000 $34,750 $180,000 418.0% 26.8%
Wickepin 4 $170,000 $60,000 $106,000 76.7% -9.0%
Williams 8 $280,000 $195,000 $194,500 -0.3% -7.0%
Wongan Hills 10 1 $195,000 $166,000 $171,500 3.3% -2.5%
Wyalkatchem 7 1 $122,500 $87,000 $95,000 9.2% -5.0%
Yealering 1 $87,500 $115,000 n.a. 5.6%
Coastal Wheatbelt 117 7 44 $412,500 $400,000 $409,000 2.3% -0.2%
Cervantes 15 1 5 $432,500 $345,000 $335,000 -2.9% -5.0%
Dandaragan 4 $199,950 $180,500 -9.7% n.a.
Gingin 9 4 $325,000 $348,750 $320,000 -8.2% -0.3%
Granville 1 2 n.a. n.a.
Guilderton 12 1 $620,000 $505,000 $500,000 -1.0% -4.2%
Jurien Bay 34 2 26 $425,000 $390,000 $412,500 5.8% -0.6%
Lancelin 23 1 1 $375,000 $395,000 $385,000 -2.5% 0.5%
Ledge Point 13 2 1 $428,750 $425,000 $430,000 1.2% 0.1%
Muchea 5 2 $520,000 $523,500 $557,000 6.4% 1.4%
Seabird 2 2 $415,000 $312,500 -24.7% n.a.
Regional WA 6,606 629 2,145 $375,000 $385,000 $365,000 -5.2% -0.5%
Includes all towns/localities recording activity in the Year to June, irrespective of no sales activity in June Quarter 2016. Includes only house & land sales on lots < 1 Ha.© REIWA - For the exclusive use of REIWA Members. Unauthorised distribution, reproduction or sale of the data will breach REIWA’s copyright.
SAMPLE

46 MARKET UPDATE | SEPTEMBER QUARTER 2016
RE
NTA
L R
EP
OR
T
LIFE
STY
LE L
IVIN
G
Overview LIFESTYLE LIVING SUMMARY
Sub-Regional Area/ Regional Centre
HOUSES LAND
Year to September 2015 Year to September 2016Year to September
2015Year to September
2016
Sales Median Price Sales Median Price Sales Sales
Armadale/Serpentine 89 $900,000 85 $855,000 2 4
Canning 1 $12,000,000 1
Cockburn 20 $1,025,000 17 $1,135,000 6 2
Gosnells 25 $1,220,000 18 $1,400,000 1
Hills 109 $800,000 83 $730,000 25 23
Joondalup South 1 $460,000
Rockingham/Kwinana 50 $977,500 38 $982,500 6 2
Stirling East 1 $2,000,000 1
Swan 78 $900,000 52 $857,500 1 2
Wanneroo North East 41 $1,150,000 25 $1,050,000
Wanneroo North West 7 $835,000 3 $865,000 2 1
Wanneroo South 2 $5,650,000 1 $5,500,000 1
Perth Metro Region 424 $927,500 322 $875,000 47 35
Albany Urban Area 24 $647,000 31 $575,000 3 3
Broome Urban Area 2 $1,030,000
Bunbury Greater 14 $625,000 12 $591,000 1
Busselton Urban Area 8 $750,000 2 $587,500 1
Carnarvon Urban Area 1 $275,000 2 $512,500
Esperance Urban Area 7 $585,000 10 $517,500 1
Geraldton/Greenough 28 $532,500 13 $467,000 2 3
Mandurah/Murray 59 $710,000 51 $715,000 2
Northam 3 $425,000 1 $530,000 2 3
Port Hedland 1 $810,000
Z Balance of Regional WA 414 $515,000 341 $500,000 27 27
Regional WA 561 $555,000 463 $535,000 36 40
WA 985 $695,000 785 $655,000 83 75
LIFESTYLE LIVING SUMMARY - HOUSE & LAND SALES OF LOTS > 1 HA Year to September 2016Source: Landgate/REIWA
Lifestyle livingStarting with the March 2007 quarter, REIWA has segmented its market analysis into house and land sales above and below one hectare. This step has been taken to reduce the influence that higher prices of larger lifestyle lots have on overall market medians. For the majority of Perth suburbs, this change has no impact as sales of larger properties represent only 1.5-2.0% of total sales whilst in regional WA, this figure is around 5-6%. In terms of the effect on median price, exclusion of houses on lots greater than one hectare reduces Perth’s quarterly median price by $2,000 whilst for regional WA, this figure is $7,000.
The Lifestyle Living Summary table gives an indication of the distribution of lifestyle living house and land sales in the outer metropolitan areas along with sales volumes and median prices for similar properties on the periphery of various regional centres.
Comparisons of annual median house prices for the year to September 2016 highlight the price differential and influence
of lot size. The effects of segmenting markets by lot size appears to be more pronounced in local markets, reflected in the following example for Bridgetown which recorded 19 sales greater than 1Ha and 38 sales less than 1Ha for the year to June 2016.
MEDIAN HOUSE PRICE YEAR TO SEPTEMBER 2016All properties Less than 1 ha Greater than 1 Ha
Perth region $530,694 $530,000 $875,000
Regional WA $370,000 $365,000 $530,000
WA $490,000 $489,000 $654,000
Bridgetown $379,000 $320,000 $510,000
Given the variability in the size and nature of lifestyle living property, the annual and five year average annual change in median price has not been provided.
SAMPLE

RE
NTA
L R
EP
OR
TLI
FES
TYLE
LIV
ING
SEPTEMBER QUARTER 2016 | MARKET UPDATE 47
LIFESTYLE LIVING SUMMARY Perth Metro Region
Sub-regional Areas & Suburbs
HOUSES LAND
Year to September 2015 Year to September 2016 Year to September 2015 Year to September 2016
Sales Median Sales Median Sales Sales
Armadale/Serpentine 89 $900,000 85 $855,000 2 4
Bedfordale 9 $850,000 12 $727,500
Byford 1 $890,000 8 $1,824,250 1 1
Cardup 8 $875,000 9 $850,000
Darling Downs 11 $965,000 4 $892,500
Forrestdale 5 $1,228,000 4 $1,300,000
Oakford 15 $900,000 18 $952,500 1
Roleystone 11 $930,000 7 $840,000 1
Serpentine 5 $940,000 6 $711,000
Cockburn 20 $1,025,000 17 $1,135,000 6 2
Banjup 8 $1,100,000 15 $1,150,000
Jandakot 6 $1,025,000 2 $1,077,500
Gosnells 25 $1,220,000 18 $1,400,000 1
Maddington 2 $2,855,000 7 $3,300,000
Martin 5 $1,100,000 1 $715,000
Southern River 6 $2,237,500 2 $3,056,222 1
Hills 109 $800,000 83 $730,000 25 23
Chidlow 13 $700,000 14 $644,250 2 4
Forrestfield 6 $900,000 1 $920,000
Gooseberry Hill 5 $1,310,000 4 $1,125,000
Hovea 5 $800,000 8 $753,000 2
Mount Helena 12 $662,500 5 $830,000 5 8
Mundaring 2 $1,505,000 6 $642,500 1 1
Parkerville 7 $835,000 9 $678,000 5 1
Sawyers Valley 11 $575,000 3 $475,000 3 1
Stoneville 10 $765,000 6 $705,000 3 5
Wattle Grove 6 $1,350,000 3 $1,265,000 1
Rockingham/Kwinana 50 $977,500 38 $982,500 6 2
Anketell 5 $2,250,000 4 $2,562,500
Baldivis 18 $995,000 8 $1,055,000 3 1
Casuarina 2 $742,500 5 $710,000
Karnup 7 $1,180,000 8 $991,000 1
Wandi 7 $950,000 8 $992,500
Wellard 9 $807,000 3 $830,000 2
Swan 78 $900,000 52 $857,500 1 2
Brigadoon 11 $1,050,000 5 $875,000
Bullsbrook 37 $699,000 27 $750,000 2
Gidgegannup 8 $745,000 4 $742,500
Henley Brook 3 $1,250,000 5 $1,100,000
Wanneroo North East 41 $1,150,000 25 $1,050,000
Carabooda 2 $1,105,000 5 $900,000
Carramar 6 $1,082,500 3 $920,000
Gnangara 14 $1,093,000 6 $1,165,000
Mariginiup 8 $1,317,500 5 $925,000
Wanneroo 7 $1,335,000 6 $1,122,500
Wanneroo North West 7 $835,000 3 $865,000 2 1
Two Rocks 7 $835,000 3 $865,000 1 1
Perth Metro Region 424 $927,500 322 $875,000 47 35
May exclude suburbs with less than 5 house sales in either Year to September 2015 and 2016
PERTH LIFESTYLE LIVING - HOUSE & LAND SALES OF LOTS > 1 HA Year to September 2016Source: Landgate/REIWA
SAMPLE

48 MARKET UPDATE | SEPTEMBER QUARTER 2016
RE
NTA
L R
EP
OR
T
LIFE
STY
LE L
IVIN
G
Regional WA LIFESTYLE LIVING SUMMARYREGIONAL LIFESTYLE LIVING - HOUSE & LAND SALES OF LOTS > 1 HA Year to September 2016Source: Landgate/REIWA
Region & Locality
HOUSES LAND
Year to September 2015 Year to September 2016 Year to September 2015 Year to September 2016
Sales Median Sales Median Sales Sales
Gascoyne 3 $275,000 3 $665,000
Goldfields-Esperance 10 $427,500 12 $510,000 5 5
Pink Lake 3 $430,000 7 $505,000
Windabout 3 $875,000 1 $865,000
Great Southern 90 $572,500 86 $592,500 14 8
Gledhow 2 $598,500 6 $527,500 1
Lower King 1 $775,000 8 $630,000
Mckail 5 $620,000 2 $437,500
Robinson 7 $695,000 5 $555,000
Willyung 3 $624,000 2 $661,000 1 2
Bremer Bay 2 $737,500 3 $564,000
Denmark 4 $722,500 3 $750,000 1 1
Hay 6 $610,000 2 2
Kalgan 8 $680,000 7 $790,000
Kojonup 4 $502,500 1 $520,000
Marbelup 4 $645,000 3 $590,000
Millbrook 3 $625,000
Mount Barker 8 $432,500 2 $387,500 7
Ocean Beach 2 $612,500 4 $922,500
Scotsdale 2 $782,500 8 $800,000
Shadforth 4 $722,500 3 $630,000 1
Kimberley 4 $1,030,000 3 $688,000
Mid West 42 $536,000 29 $435,000 2 5
Dongara 1 $565,000 3 $328,000
Northampton 3 $330,000 2 $327,501 1
White Peak 5 $765,000 4 $610,000
Deepdale 5 $530,000 2 $363,500
Moresby 11 $495,000 6 $537,000
Rudds Gully 1 $485,000 3 $460,000 1
Waggrakine 5 $550,000 1 $375,000
Woorree 4 $612,500 1 $745,000
Peel 81 $675,000 66 $695,000 2
Lake Clifton 8 $555,000 5 $540,000
North Dandalup 2 $772,500 3 $710,000
Waroona 4 $557,500 1 $287,500
Barragup 11 $755,000 17 $650,000
Bouvard 5 $780,000 4 $837,500
Furnissdale 4 $528,750 5 $590,000
Herron 8 $645,000 7 $650,000
Parklands 7 $682,500 7 $775,000
Pinjarra 4 $700,000 3 $750,000 2
Stake Hill 11 $710,000 3 $680,000
West Pinjarra 3 $802,000 3 $775,000
Pilbara 4 $825,000 1 $665,000 1 1
Boodarie 3 $840,000 1 $665,000
SAMPLE

RE
NTA
L R
EP
OR
TLI
FES
TYLE
LIV
ING
SEPTEMBER QUARTER 2016 | MARKET UPDATE 49
LIFESTYLE LIVING SUMMARY Regional WA
Region & Locality
HOUSES LAND
Year to September 2015 Year to September 2016 Year to September 2015 Year to September 2016
Sales Median Sales Median Sales Sales
South West 163 $590,000 125 $580,000 5 8
Augusta 3 $710,000 4 $466,250
Burnside 7 $835,000 3 $785,000
Margaret River 19 $850,000 15 $860,000
Dunsborough 3 $940,000 4 $1,235,000 1
Quedjinup 2 $861,500 3 $670,000
Bridgetown 19 $470,000 19 $510,000 1
Jalbarragup 4 $550,000 4 $462,500
Kangaroo Gully 6 $675,000 2 $545,000
Nannup 4 $486,250 5 $460,000
Pemberton 7 $550,000 4 $450,000
Vasse 4 $700,000 1 $630,000
Gelorup 7 $599,000 6 $565,000
Stratham 7 $670,000 6 $615,000
Allanson 3 $490,000
Argyle 4 $520,000 6 $597,500
Balingup 3 $380,000 2 $600,000
Boyanup 4 $595,000 2 $440,000
Collie 4 $425,000
Cookernup 4 $485,000
Dardanup West 9 $615,000 5 $725,000 1 2
North Boyanup 3 $600,000 3 $600,000
Wheatbelt 164 $438,500 138 $422,500 9 11
Bakers Hill 10 $492,500 8 $435,000
Beverley 5 $320,000 5 $430,000
Bindoon 11 $430,000 10 $401,000
Chittering 4 $465,625 5 $460,000
Clackline 1 $510,000 4 $392,500
Lower Chittering 25 $677,000 21 $620,000
Northam 3 $425,000 1 $530,000 2 3
Toodyay 7 $400,000 2 $305,000
West Toodyay 3 $425,000 4 $330,000
Wundowie 9 $500,000 5 $455,000
York 7 $385,000 7 $340,000 2
Corrigin 3 $340,000
Merredin 3 $410,000 2 $412,500
Pingelly 3 $92,500 4 $287,500
Wagin 3 $297,000 3 $180,000
Gabbadah 7 $425,000 4 $530,000
Gingin 2 $385,000 4 $462,500 1 1
Jurien Bay 2 $480,000 3 $350,000
Karakin 5 $500,000 4 $383,750
Muchea 6 $680,000 5 $445,000
Nilgen 4 $355,000 3 $350,000
Woodridge 14 $462,500 7 $530,000
Regional WA 561 $555,000 463 $535,000 36 40
May exclude suburbs with less than 3 house sales in either Year to September 2015 and 2016
SAMPLE

50 MARKET UPDATE | SEPTEMBER QUARTER 2016
Macro Growth Rates REIWA MARKET UPDATE
SUBURBS & LOCALITIES WITH LARGEST GROWTH RATES OVER ONE YEAR BY MARKET SECTOR
SuburbSales Year to June
2016
Median Sales Price Year to June 2016
% Change from the previous
year
HOUSES: PERTH
Kallaroo 71 $785,000 19.1%
Swanbourne 55 $1,720,000 15.4%
Trigg 39 $1,135,000 12.9%
South Guildford 47 $558,000 9.4%
Fremantle 62 $846,500 5.5%
Applecross 83 $1,450,000 4.3%
Attadale 76 $1,068,750 4.3%
South Fremantle 38 $1,035,000 3.9%
Churchlands 39 $1,370,000 3.8%
Burns Beach 44 $943,500 3.1%
MULTI-RESIDENTIAL: PERTH
Joondanna 37 $459,000 11.5%
Applecross 50 $637,500 6.7%
Fremantle 79 $560,000 5.3%
Burswood 48 $737,500 3.5%
Glendalough 32 $310,000 3.3%
Como 147 $520,000 2.0%
Rivervale 127 $415,000 1.3%
Victoria Park 96 $434,500 1.0%
West Perth 120 $525,000 1.0%
Hamilton Hill 34 $370,000 0.0%
LAND: PERTH
Dianella 47 $480,000 12.3%
The Vines 48 $299,000 8.7%
Beckenham 57 $300,000 7.1%
Whitby 48 $191,500 6.4%
Karnup 38 $190,001 5.6%
Hilbert 113 $194,800 5.1%
Harrisdale 91 $294,000 5.0%
Southern River 81 $339,000 4.3%
Iluka 32 $550,000 3.8%
Hammond Park 45 $328,000 2.5%
HOUSES: COUNTRY WA
York 34 $300,000 11.1%
Busselton 35 $530,000 9.3%
Hannans 33 $420,000 9.1%
Jurien Bay 34 $412,500 5.8%
Pinjarra 61 $380,000 5.7%
Carey Park 64 $286,500 5.1%
Bayonet Head 40 $407,500 4.8%
Orana 34 $291,000 4.3%
Wannanup 58 $471,250 3.0%
Mckail 51 $415,000 2.5%
SUBURBS & LOCALITIES WITH LARGEST GROWTH RATES OVER THE QUARTER BY MARKET SECTOR
SuburbSales Year to June
2016
Median Sales Price Year to June 2016
Quarterly % Change in Annual Median
HOUSES: PERTH
Riverton 64 $690,000 8.9%
Attadale 76 $1,068,750 6.3%
Woodlands 48 $890,000 4.7%
East Cannington 68 $521,000 4.2%
Marmion 35 $952,000 4.0%
Warwick 47 $578,000 3.2%
Beeliar 98 $546,250 3.2%
Coogee 42 $750,000 3.0%
Fremantle 62 $846,500 2.9%
Guildford 32 $632,500 2.8%
MULTI-RESIDENTIAL: PERTH
Joondanna 37 $459,000 10.6%
South Perth 155 $570,000 8.4%
Hamilton Hill 34 $370,000 4.2%
Maylands 193 $389,000 4.1%
Rivervale 127 $415,000 2.5%
Burswood 48 $737,500 2.4%
Como 147 $520,000 1.7%
Glendalough 32 $310,000 1.6%
Yokine 63 $355,000 0.4%
East Fremantle 43 $610,000 0.0%
LAND: PERTH
The Vines 48 $299,000 8.7%
Whitby 48 $191,500 3.5%
Munster 36 $315,000 3.3%
Dianella 47 $480,000 3.2%
Madeley 37 $288,000 2.5%
Mount Claremont 46 $680,000 1.5%
Beckenham 57 $300,000 1.4%
Spearwood 40 $380,000 1.3%
Byford 222 $207,500 1.2%
Southern River 81 $339,000 1.2%
HOUSES: COUNTRY
Pinjarra 61 $380,000 3.4%
Carey Park 64 $286,500 2.3%
Mount Barker 32 $227,500 1.8%
Merredin 44 $162,500 1.6%
Wandina 52 $415,000 1.5%
Hannans 33 $420,000 1.2%
Denmark 52 $351,500 1.2%
Millbridge 39 $450,000 1.1%
Bayonet Head 40 $407,500 1.1%
Usher 32 $287,500 0.9%
SUBURBS & LOCALITIES WITH LARGEST GROWTH RATES OVER FIVE YEARS BY MARKET SECTOR
SuburbSales Year to June
2016
Median Sales Price Year to June 2016
5 Year Average Annual
Growth %
HOUSES: PERTH
Rossmoyne 31 $1,142,000 6.0%
Coolbellup 66 $500,000 5.5%
Bateman 38 $779,000 5.0%
Willetton 214 $700,000 4.8%
Alfred Cove 45 $868,000 4.5%
Kenwick 51 $397,500 4.4%
Langford 47 $414,000 4.4%
South Guildford 47 $558,000 4.3%
Kallaroo 71 $785,000 4.3%
East Cannington 68 $521,000 4.3%
MULTI-RESIDENTIAL: PERTH
Fremantle 79 $560,000 5.9%
Crawley 54 $792,500 5.1%
Maylands 193 $389,000 4.2%
Joondanna 37 $459,000 3.8%
Shoalwater 35 $275,000 3.5%
North Perth 51 $470,000 3.3%
Kewdale 32 $394,500 3.2%
Como 147 $520,000 3.2%
Wembley 87 $320,000 2.3%
Victoria Park 96 $434,500 2.2%
LAND: PERTH
Spearwood 40 $380,000 14.3%
East Cannington 41 $322,000 7.0%
Southern River 81 $339,000 5.4%
Mount Claremont 46 $680,000 5.2%
Craigie 57 $340,000 4.9%
Byford 222 $207,500 4.7%
Success 53 $300,000 4.5%
Harrisdale 91 $294,000 4.4%
The Vines 48 $299,000 4.2%
Caversham 105 $305,000 4.1%
HOUSES: COUNTRY
Busselton 35 $530,000 4.5%
Dunsborough 117 $615,000 2.6%
Wannanup 58 $471,250 2.5%
West Busselton 122 $439,500 2.4%
Coodanup 58 $293,500 2.2%
Pinjarra 61 $380,000 2.1%
Bayonet Head 40 $407,500 1.9%
Margaret River 117 $460,000 1.8%
Greenfields 144 $315,000 1.7%
Carey Park 64 $286,500 1.6%
SAMPLE
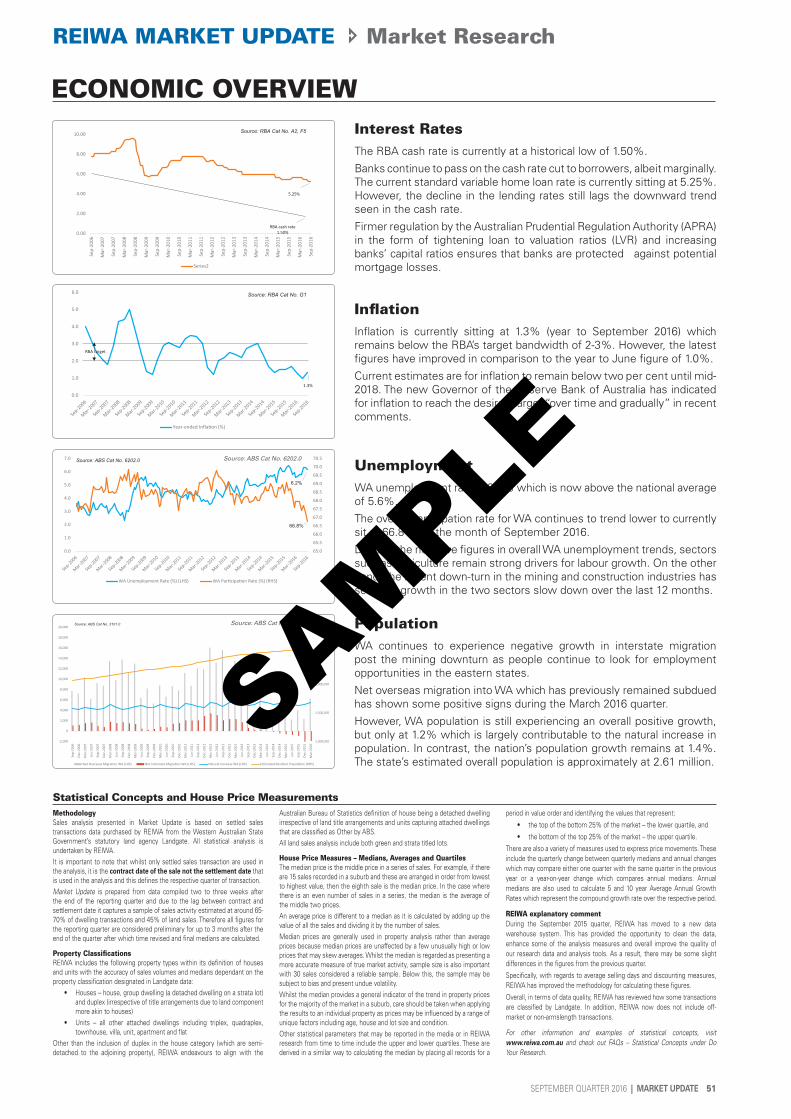
SEPTEMBER QUARTER 2016 | MARKET UPDATE 51
REIWA MARKET UPDATE Market Research
MethodologySales analysis presented in Market Update is based on settled sales transactions data purchased by REIWA from the Western Australian State Government’s statutory land agency Landgate. All statistical analysis is undertaken by REIWA.It is important to note that whilst only settled sales transaction are used in the analysis, it is the contract date of the sale not the settlement date that is used in the analysis and this defines the respective quarter of transaction.Market Update is prepared from data compiled two to three weeks after the end of the reporting quarter and due to the lag between contract and settlement date it captures a sample of sales activity estimated at around 65-70% of dwelling transactions and 45% of land sales. Therefore all figures for the reporting quarter are considered preliminary for up to 3 months after the end of the quarter after which time revised and final medians are calculated.
Property ClassificationsREIWA includes the following property types within its definition of houses and units with the accuracy of sales volumes and medians dependant on the property classification designated in Landgate data:
• Houses – house, group dwelling (a detached dwelling on a strata lot) and duplex (irrespective of title arrangements due to land component more akin to houses)
• Units – all other attached dwellings including triplex, quadraplex, townhouse, villa, unit, apartment and flat
Other than the inclusion of duplex in the house category (which are semi-detached to the adjoining property), REIWA endeavours to align with the
Australian Bureau of Statistics definition of house being a detached dwelling irrespective of land title arrangements and units capturing attached dwellings that are classified as Other by ABS.All land sales analysis include both green and strata titled lots.
House Price Measures – Medians, Averages and QuartilesThe median price is the middle price in a series of sales. For example, if there are 15 sales recorded in a suburb and these are arranged in order from lowest to highest value, then the eighth sale is the median price. In the case where there is an even number of sales in a series, the median is the average of the middle two prices.An average price is different to a median as it is calculated by adding up the value of all the sales and dividing it by the number of sales.Median prices are generally used in property analysis rather than average prices because median prices are unaffected by a few unusually high or low prices that may skew averages. Whilst the median is regarded as presenting a more accurate measure of true market activity, sample size is also important with 30 sales considered a reliable sample. Below this, the sample may be subject to bias and present undue volatility.Whilst the median provides a general indicator of the trend in property prices for the majority of the market in a suburb, care should be taken when applying the results to an individual property as prices may be influenced by a range of unique factors including age, house and lot size and condition.Other statistical parameters that may be reported in the media or in REIWA research from time to time include the upper and lower quartiles. These are derived in a similar way to calculating the median by placing all records for a
period in value order and identifying the values that represent:
• the top of the bottom 25% of the market – the lower quartile, and
• the bottom of the top 25% of the market – the upper quartile.
There are also a variety of measures used to express price movements. These include the quarterly change between quarterly medians and annual changes which may compare either one quarter with the same quarter in the previous year or a year-on-year change which compares annual medians. Annual medians are also used to calculate 5 and 10 year Average Annual Growth Rates which represent the compound growth rate over the respective period.
REIWA explanatory commentDuring the September 2015 quarter, REIWA has moved to a new data warehouse system. This has provided the opportunity to clean the data, enhance some of the analysis measures and overall improve the quality of our research data and analysis tools. As a result, there may be some slight differences in the figures from the previous quarter.
Specifically, with regards to average selling days and discounting measures, REIWA has improved the methodology for calculating these figures.
Overall, in terms of data quality, REIWA has reviewed how some transactions are classified by Landgate. In addition, REIWA now does not include off-market or non-armslength transactions.
For other information and examples of statistical concepts, visit www.reiwa.com.au and check out FAQs – Statistical Concepts under Do Your Research.
Statistical Concepts and House Price Measurements
ECONOMIC OVERVIEW
UnemploymentWA unemployment rate is 6.2% which is now above the national average of 5.6%.
The overall participation rate for WA continues to trend lower to currently sit at 66.8% for the month of September 2016.
Despite the negative figures in overall WA unemployment trends, sectors such as Agriculture remain strong drivers for labour growth. On the other hand, the recent down-turn in the mining and construction industries has seen job growth in the two sectors slow down over the last 12 months.
65.0
65.5
66.0
66.5
67.0
67.5
68.0
68.5
69.0
69.5
70.0
70.5
0.0
1.0
2.0
3.0
4.0
5.0
6.0
7.0
WA Unemployment Rate (%) (LHS) WA Participation Rate (%) (RHS)
Source: ABS Cat No. 6202.0
6.2%
66.8%
1,000,000
1,500,000
2,000,000
2,500,000
3,000,000
-2,000
0
2,000
4,000
6,000
8,000
10,000
12,000
14,000
16,000
18,000
20,000
Sep-
2006
Dec-
2006
Mar
-200
7
Jun-
2007
Sep-
2007
Dec-
2007
Mar
-200
8
Jun-
2008
Sep-
2008
Dec-
2008
Mar
-200
9
Jun-
2009
Sep-
2009
Dec-
2009
Mar
-201
0
Jun-
2010
Sep-
2010
Dec-
2010
Mar
-201
1
Jun-
2011
Sep-
2011
Dec-
2011
Mar
-201
2
Jun-
2012
Sep-
2012
Dec-
2012
Mar
-201
3
Jun-
2013
Sep-
2013
Dec-
2013
Mar
-201
4
Jun-
2014
Sep-
2014
Dec-
2014
Mar
-201
5
Jun-
2015
Sep-
2015
Dec-
2015
Mar
-201
6
Net Overseas Migration WA (LHS) Net Interstate Migration WA (LHS) Natural Increase WA (LHS) Estimated Resident Population (RHS)
Source: ABS Cat No. 3101.0 PopulationWA continues to experience negative growth in interstate migration post the mining downturn as people continue to look for employment opportunities in the eastern states.
Net overseas migration into WA which has previously remained subdued has shown some positive signs during the March 2016 quarter.
However, WA population is still experiencing an overall positive growth, but only at 1.2% which is largely contributable to the natural increase in population. In contrast, the nation’s population growth remains at 1.4%. The state’s estimated overall population is approximately at 2.61 million.
0.00
2.00
4.00
6.00
8.00
10.00
Sep-
2006
Mar
-200
7
Sep-
2007
Mar
-200
8
Sep-
2008
Mar
-200
9
Sep-
2009
Mar
-201
0
Sep-
2010
Mar
-201
1
Sep-
2011
Mar
-201
2
Sep-
2012
Mar
-201
3
Sep-
2013
Mar
-201
4
Sep-
2014
Mar
-201
5
Sep-
2015
Mar
-201
6
Sep-
2016
Series2
RBA cash rate 1.50%
5.25%
Source: RBA Cat No. A2, F5 Interest Rates The RBA cash rate is currently at a historical low of 1.50%.
Banks continue to pass on the cash rate cut to borrowers, albeit marginally. The current standard variable home loan rate is currently sitting at 5.25%. However, the decline in the lending rates still lags the downward trend seen in the cash rate.
Firmer regulation by the Australian Prudential Regulation Authority (APRA) in the form of tightening loan to valuation ratios (LVR) and increasing banks’ capital ratios ensures that banks are protected against potential mortgage losses.
0.0
1.0
2.0
3.0
4.0
5.0
6.0
Year-ended Inflation (%)
1.3%
RBA target
Source: RBA Cat No. G1
InflationInflation is currently sitting at 1.3% (year to September 2016) which remains below the RBA’s target bandwidth of 2-3%. However, the latest figures have improved in comparison to the year to June figure of 1.0%.
Current estimates are for inflation to remain below two per cent until mid-2018. The new Governor of the Reserve Bank of Australia has indicated for inflation to reach the desired target “over time and gradually” in recent comments.
Source: ABS Cat No. 3101.0
Source: ABS Cat No. 6202.0
SAMPLE

REAL ESTATE INSTITUTE OF WESTERN AUSTRALIA
MARKET UPDATE – SEPTEMBER QUARTER 2016
SAMPLE