september quarter 2012 results presentation – october 26, 2012
TRANSCRIPT

1
September Quarter 2012 Results Presentation – October 26, 2012

2
Safe Harbour Statement
This Release / Communication, except for the historical information, may contain statements, including the words or phrases such as ‘expects, anticipates, intends, will, would, undertakes, aims, estimates, contemplates, seeks to, objective, goal, projects, should’ and similar expressions or variations of these expressions or negatives of these terms indicating future performance or results, financial or otherwise, which are forward looking statements. These forward looking statements are based on certain expectations, assumptions, anticipated developments and other factors which are not limited to, risk and uncertainties regarding fluctuations in earnings, market growth, intense competition and the pricing environment in the market, consumption level, ability to maintain and manage key customer relationship and supply chain sources and those factors which may affect our ability to implement business strategies successfully, namely changes in regulatory environments, political instability, change in international oil prices and input costs and new or changed priorities of the trade. The Company, therefore, cannot guarantee that the forward looking statements made herein shall be realized. The Company, based on changes as stated above, may alter, amend, modify or make necessary corrective changes in any manner to any such forward looking statement contained herein or make written or oral forward looking statements as may be required from time to time on the basis of subsequent developments and events. The Company does not undertake any obligation to update forward looking statements that may be made from time to time by or on behalf of the Company to reflect the events or circumstances after the date hereof.

3
Agenda
1
2
3
4
Strategy
Business Environment
Current Quarter & First Half Performance
Looking Ahead

4
Clear and Compelling Strategy
Consistent Growth Competitive Growth Profitable Growth Responsible Growth
Strategic framework Sustainable Living Plan Goals

5
SQ 2012 – Business Context Challenging macro economic environment
FMCG markets sustain levels of double digit growth
• Soaps and Detergents growth continues to be led by pricing
• Volume growth moderation in discretionary categories
Volatile cost environment

6
Volatile Cost Environment
Source: Bloomberg data and internal estimates *$/barrel; ^$/tonne
PFAD^ softens USD/INR remains volatile Crude holding steady

7
SQ 2012 - Sustaining Robust Performance Growth profitable and broad based
Domestic Consumer business grows by 16%
• Strong 7% Underlying Volume Growth
• Growth continues to be led by Modern Trade and Rural
• Budget rationalization in Canteen Stores Department adversely impacts quarter growth
Operating Profit (EBIT) grows by 19%; margin up 100 bps
• Judicious pricing combined with relentless focus on buying efficiencies & CEPs
• COGS down by 140 bps
• A&P up Rs. 118 Crores; +70 bps at 12.5% of sales
PAT (bei) at Rs. 806 crores, up 23%; Net Profit up 17% to Rs. 807 crores
Domestic Consumer business = Domestic FMCG + Water CEP: Cost Effectiveness Programs; COGS: Cost of Goods Sold; A&P: Advertising & Promotion

8
Double digit growth in all segments
Growth % SQ ’12
Soaps & Detergents
Personal Products
Beverages
22
12
10
10
Domestic FMCG^ 16
Domestic Consumer^
Packaged Foods
^ Excludes Other Operational Income
Domestic Consumer business = Domestic FMCG + Water
16

9
Winning with Brands Continued focus on innovations
Surf Excel Easywash
Lakmé eyeconic range
Vim Anti Germ bar
Pureit Marvella UV with Advance Alert System
TRESemmé: For Salon style hair at home everyday
Clinic Plus: Milk Protein Formula A++ Comfort 1 Rinse
Bru Exotica Guatemala
Closeup: Deep Action
Dove Hair Fall Rescue Treatment Taaza: Taazgi bhari chaai,
dimaag khul jaaye

10
Media Intensity Heightens Investing for growth
Source: Mindshare & HUL internal estimates
ROMI: Return on Marketing Investments
Overall media intensity significantly up; highest
levels in 15 quarters
Competitive spends maintained
• A&P spends up Rs. 118 crores
• +70 bps to 12.5% of sales
• Brand investments stepped up in all FMCG segments
• Focus on 360° engagement and ROMI continues

CATEGORY HIGHLIGHTS

12
Skin Cleansing Double digit growth across all segments
All key brands grow in double digits
• Dove and Pears continue to drive premiumization
• Lux growth momentum sustained
• Lifebuoy delivers one of its strongest quarters
Liquids portfolio growth accelerates

13
Home Care Strong broad based growth
Laundry – All brands & formats grow in double digits
• Sustaining momentum on premium portfolio
• Surf and Rin deliver double digit volume growth
• Fabric conditioners continue to drive market development
• Comfort One Rinse launched
Household Care - Double digit growth in Vim & Domex
• Vim Anti Germ bar launched

14
Skin Care Modest growth
Double digit growth in Pond’s, Vaseline and Dove
• Pond’s performs well at the premium end led by Age Miracle
Fair & Lovely re-launch well received
• Momentum on tubes sustained
• Sachet price increase transition underway
15
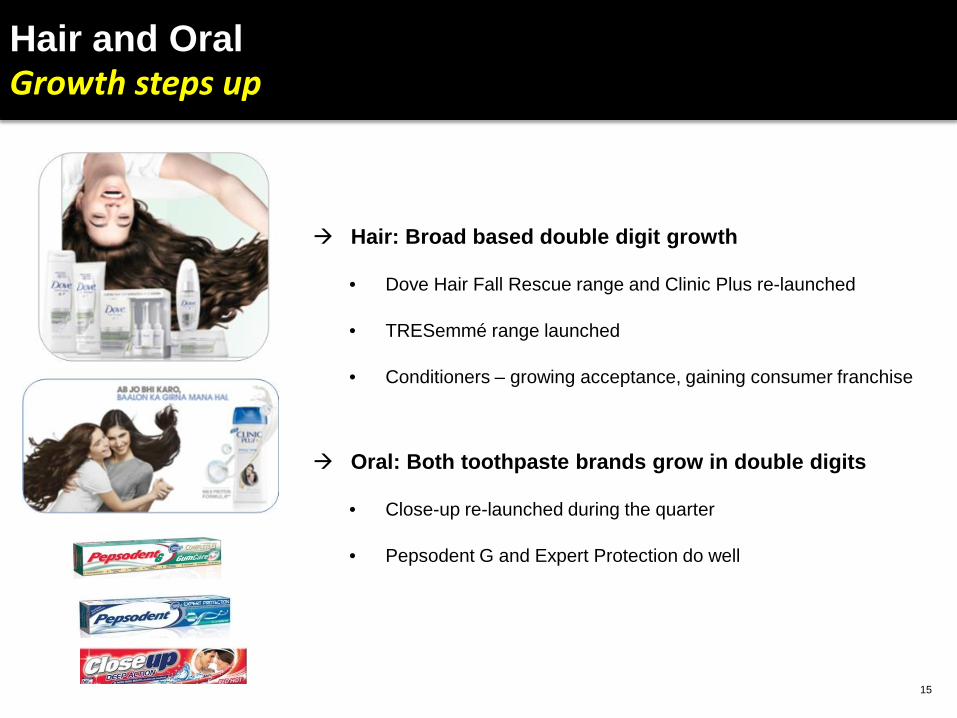
Hair and Oral Growth steps up
Hair: Broad based double digit growth
• Dove Hair Fall Rescue range and Clinic Plus re-launched
• TRESemmé range launched
• Conditioners – growing acceptance, gaining consumer franchise
Oral: Both toothpaste brands grow in double digits
• Close-up re-launched during the quarter
• Pepsodent G and Expert Protection do well

16
TRESemmé Salon Style Hair, at Home Everyday

17
Beverages Growth driven by Premium Tea & Coffee
Tea growth led by Modern Trade
• Double digit growth in the top end
• Taaza growth revival on the back of re-launch
Strong performance in Coffee sustained
• Growth broad based; across Instant and Roast & Ground
• Premium coffee momentum continues
• Exotica Guatemala introduced

18
Red Label Successful Interactive consumer campaign – 2.6 million+ callers

19
Packaged Foods Led by key brands
Kissan – Double digit growth in Ketchup in non-CSD
channels
Knorr - Double digit growth in Soups
• Actions underway to step up growth in balance portfolio
Kwality Walls sustains double digit growth
CSD: Canteen Stores Department

20
Pureit Double digit growth in a challenging environment
Slowdown in consumer durables market
Strengthening portfolio
• Foray into the premium UV segment with ‘Marvella UV’
• ‘Marvella RO’ & Germ Kill Kits continue to grow well
• ‘Advanced’ gaining strong consumer franchise
Leveraging IT to drive front end execution

21
SQ 2012 – Results FMCG exports demerged – reported numbers not comparable
Rs Cr
Particulars SQ’11 SQ’12 Growth% SQ’11 SQ’12 Growth%
Net Sales 5,516 6,155 11.6 5,266 6,155 16.9
PBITDA 827 977 18.2 797 977 22.6
PBIT 770 919 19.4 743 919 23.6
PBIT margin (%) 14.0 14.9 100 bps 14.1 14.9 80 bps
PAT bei 656 806 22.9 636 806 26.8
Net Profit 689 807 17.1 669 807 20.7
HUL (as reported) HUL (ex FMCG exports)
Sustained robust performance in Domestic Consumer Business
Healthy margin expansion
Domestic Consumer Business = Domestic FMCG + Water

22
SQ 2012 - PBIT to Net Profit
Rs Cr
Particulars SQ’11 SQ’12 Growth
PBIT 770 919 19%
Add : Other Income 81 149 83%
Less : Finance Costs 1 6
Exceptional Items – Credit / (Charge) 44 2
PBT 895 1063 19%
Less : Tax (206) (256) 25%
Net Profit 689 807 17%
• Other income includes interest income, dividend income and net gain on sale of other non trade current investments o SQ’11 includes interest on Income tax refunds of Rs. 3.4 crs.
• Exceptional items include o Profit on sale of properties Rs. 6 crs. (SQ’11: Rs. 47 crs.)
o Restructuring costs of Rs. 4 crs. (SQ’11: Rs. 3 crs.)
• Effective Tax rate for the quarter is 24.1%

23
SQ 2012 – Summary
Robust business results
• 16% growth in Domestic Consumer business with 7% UVG
• Operating Profit up 19%; margin expansion (+100 bps)
• PAT (bei) grows by 23%
Strategy on track and delivering
Domestic Consumer Business = Domestic FMCG + Water; UVG – Underlying Volume Growth

FIRST HALF 2012-13

25
FH 2012-13 Delivered on Goals
Domestic Consumer business = Domestic FMCG + Water
Competitive growth Ahead of market
Consistent growth Healthy volumes
Profitable growth Margin expansion

26
FH 2012-13 Results FMCG exports demerged – reported numbers not comparable
Rs Cr
Particulars FH’11-12 FH’12-13 Growth% FH’11-12 FH’12-13 Growth%
Net Sales 11,012 12,405 12.7 10500 12405 18.2
PBITDA 1,581 1,943 22.9 1525 1943 27.4
PBIT 1,468 1,828 24.6 1420 1828 28.7
PBIT margin (%) 13.3 14.7 140 bps 13.5 14.7 120 bps
PAT bei 1,234 1,660 34.6 1197 1660 38.7
Net Profit 1,316 2,138 62.5 1279 2138 67.1
HUL (as reported) HUL (ex FMCG exports)
Competitive, consistent and profitable growth

27
Interim Dividend
Particulars FH’11-12 Interim
FY’11-12 Final
FH’12-13 Interim
Dividend Per Share 3.5 4.0 4.5
No. of Share (Crs.) 216 216 216
Total Dividend (Rs. Crs.) 756 865 973
Div. Dist. Tax (Rs. Crs.) 123 140 158
Total Div. Outflow (Rs. Crs.) 879 1005 1130

28
Special Dividend
Particulars Special Dividend
Dividend Per Share 8.0
No. of Share (Crs.) 216
Total Dividend (Rs. Crs.) 1729
Dividend Distribution Tax (Rs. Crs.) 281
Total Dividend Outflow (Rs. Crs.) 2010
Special Dividend of Rs 8 per share (Face Value Re. 1)
Paid out of Accumulated P&L Balance and Exceptional Income
Funded from current cash balance

29
Looking Ahead
Consistent Growth Competitive Growth
Profitable Growth Responsible Growth
Near Term
• Challenging market environment
• Inflationary pressure on consumers
Medium-Long Term
• India growth potential
• Consumer demand drivers intact
• Opportunities from emerging trends
HUL : Driven by a clear & compelling strategy

30
September Quarter 2012 Results Presentation – October 26, 2012
For more information please visit http://www.hul.co.in