september 6, 2006 - uf/ifasswfrec.ifas.ufl.edu/docs/pdf/veg-hort/tomato... · california (including...
TRANSCRIPT
FLORIDATOMATO INSTITUTE
PROCEEDINGS
September 6, 2006
Compiled by:
Kent CushmanUF/IFAS, SWFREC, Immokalee
Phyllis Gilreath
UF/IFAS, Manatee County Extension Service, Palmetto
FLORIDATOMATO INSTITUTE
PROCEEDINGS
September 6, 2006
Compiled by:
Kent CushmanUF/IFAS, SWFREC, Immokalee
Phyllis Gilreath
UF/IFAS, Manatee County Extension Service, Palmetto
������������������M A G A Z I N E

- 1 -
2 0 0 6 F L O R I D A T O M A T O I N S T I T U T E Ritz Carlton • Naples, Florida • September 6, 2006 PRO 523
Moderator: Gene McAvoy, Hendry County Extension Service
9:00 Welcome and Opening Remarks George Hochmuth, Associate Dean for Research, Gainesville
9:10 “State of the Florida Tomato” Address Reggie Brown, Florida Tomato Committee, Orlando
9:20 Methyl Bromide CUE Status for 2007 and Beyond Mike Aerts , FFVA, Orlando
9:40 Food Safety and the Florida Tomato Industry Martha Roberts, UF/IFAS, Gainesville
10:00 Impact of Energy Issues on the Florida Tomato Industry John VanSickle, UF/IFAS, Gainesville . . . . . . . . . . . . . . . . . . . . . . . . . . . . . . . . . . . . . . . . pg. 2
10:20 Labor Challenges for the Florida Tomato Industry Walter Kates, FFVA, Orlando
10:40 Potential Impact of Increased Efficiency in Harvesting and Packing of Fresh Tomatoes Steve Sargent, UF/IFAS, Gainesville . . . . . . . . . . . . . . . . . . . . . . . . . . . . . . . . . . . . . . . . . pg. 8
11:00 Research Update on Grape Tomatoes: Varieties, Taste Tests and Response to N Rates Eric Simonne, UF/IFAS, Gainesville . . . . . . . . . . . . . . . . . . . . . . . . . . . . . . . . . . . . . . . . pg. 12
11:20 Lunch and Visit Sponsor Information Tables
Moderator: Alicia Whidden, Hillsborough County Extension Service, Seffner
1:00 Nitrogen BMP Efforts with Tomato Production in Florida in the 2005-2006 Season Monica Ozores-Hampton, UF/IFAS, SWFREC, Immokalee . . . . . . . . . . . . . . . . . . . . . . pg. 16
1:20 Whitefly Resistance Update and Proposed Mandated Burn Down Rule Dave Schuster, UF/IFAS, GCREC - Wimauma . . . . . . . . . . . . . . . . . . . . . . . . . . . . . . . . pg. 24
1:40 TYLCV-Resistant Cultivar Trial and Whitefly Control Kent Cushman, UF/IFAS, SWFREC, Immokalee . . . . . . . . . . . . . . . . . . . . . . . . . . . . . . .pg 29
2:00 New Product Updates Industry Representatives
3:00 Adjourn and Visit Information Cafe
Tomato Varieties for Florida Stephen M. Olson, NFREC, Quincy, and Eugene McAvoy, Hendry County Extension, LaBelle . . pg. 35
Water Management for Tomato Eric. H. Simonne, Horticultural Sciences Dept., UF, Gainesville . . . . . . . . . . . . . . . . . . . . . . . . . . . . . pg. 40
Fertilizer and Nutrient Management for Tomato Eric H. Simonne, Horticultural Sciences Dept., UF, Gainesville . . . . . . . . . . . . . . . . . . . . . . . . . . . . . pg. 45
Tomato Fungicides and Other Disease Management Products Tim Momol and Laura Ritchie, NFREC, Quincy . . . . . . . . . . . . . . . . . . . . . . . . . . . pg. 51
Selected Insecticides Approved for Use on Insects Attacking Tomatoes Susan E. Webb, Entomology and Nematology Dept., UF, Gainesville . . . . . . . . . . . . . . . . . . . . . . . . . . . . . pg. 55
Weed Control in Tomato William H. Stall, Horticultural Sciences Dept., UF, Gainesville; James P. Gilreath, UF, GCREC, Wimauma . . . . . . . . . . . . . . . . . . . . . . . . . . . . . . . . . pg. 66
Nematicides Registered for Use on Florida Tomato Joseph Noling, UF, CREC, Lake Alfred . . . . . . . . . pg. 69
CONTROL GUIDES

- 2 -
Impact of Energy Issues on the Florida Tomato Industry
John J. VanSickle and Santiago Bucaram1
Food & Resource Economics, IFAS, University of Florida and Executive Director of the International Agricultural Trade and Policy Center. Santiago Bucaram is a graduate student in the Food & Resource Economics Department.
The rise in energy prices over the last 4 years has had significant impacts on horticultural growers. Inputs ranging from fertilizer to fuel increased in price and increased the cost to provide product to consumers. Rising input costs generally increase the cost of production for all growers because no grower is generally large enough to influence the price of an input or able to alter their production practice enough to offset the rising cost of the input. One would expect rising input costs to impact all growers the same if they employ similar production technologies. Economic theory would suggest that increasing costs will force some growers out of business and result in higher prices for those growers remaining in business. Consumers will be forced to pay more for less product supplied to the market.
Since the end of 2002, U.S. retail diesel prices have been generally increasing, with a maximum of $3.15 per gallon in October, 2005 as a result of Hurricane Katrina further tightening supplies (figure 1). But the hurricane is only one factor, albeit a dramatic one, which has caused diesel prices to rise in 2005.
A major factor influencing diesel prices in 2005 was the increase in crude oil prices. The price of West Texas Intermediate (WTI) crude oil, which started the year at about $42 per barrel, reached $70 per barrel in early September. Crude oil prices rose throughout 2004 and 2005 as global oil demand increased dramatically, stretching capacity along the entire oil market system. With minimal spare capacity in the face of the potential for significant supply disruptions from numerous sources, oil prices were high throughout 2005.
In addition, Hurricane Katrina had a devastating impact on U.S. diesel markets, initially taking out more than 25 percent of U.S. crude oil production and 10-15 percent of U.S. refinery capacity. On top of that, major oil pipelines that feed the Midwest and the East Coast from the Gulf of Mexico area were shut down or forced to operate at reduced rates for a significant period. The result was a 94 percent increase in diesel prices over the 2002 to 2005 period.
Increased input costs influence competitiveness if one producing area employs more of the input in the process of producing and marketing the product. Rising energy prices are likely to result in only slight changes in comparative advantage for production costs on the farm, but should have significant impacts on the cost of getting a product to market. It is expected that those producers closer to the market will gain comparative advantage as the cost of delivering the product to consumer markets increases more for those producers at greater distance from the market. If diesel price increases are sustained, it would be expected that the
comparative advantage of some producing areas will change. Some producing areas should increase market share as others lose market share to more efficient suppliers. The objective of this research is to estimate the impact a sustained increase in fuel cost is expected to have on the U.S. vegetable market, with particular attention paid to Florida tomato growers.
METHODOLOGYA model of the North American vegetable market was
developed by VanSickle et al. (2000) to estimate the impacts of a ban of methyl bromide on producers and consumers of fresh vegetables in North America. The North American vegetable model can be characterized as a spatial equilibrium problem. The model is limited to those crops that used methyl bromide as a pre-plant fumigant and those crops that are competitive with crops that used methyl bromide. Crops included in the model were tomatoes, peppers, eggplant, cucumbers, squash, watermelons, and strawberries. Producing areas included were Florida, Mexico, California, Texas, South Carolina, Virginia, and Maryland combined, and Alabama and Tennessee combined. Florida was separated into four producing areas: Dade County, Palm Beach County, Southwest Florida, and West Central Florida (Palmetto-Ruskin area). Mexico was included with two producing areas: the Mexican states of Sinaloa and Baja California. California was separated into two producing areas for strawberries: Southern California (including Orange, Ventura, San Diego, and Los Angeles Counties) and Northern California (the remaining California production). California fresh tomatoes were modeled as a single producing area.
The U.S. vegetable model allocates production of these crops across regions based on their monthly cost delivered to regional markets; productivity and the regional demand structure for fresh vegetables in the U.S. market. Inverse demand equations were employed in the model based on work by NaLampang (2004). Preharvest and postharvest production costs were estimated for each production system and area included in the model. Transportation costs were included for delivering these products to each of the regional markets based on mileages determined by the Automap software and an estimate of $1.3072 per mile as the transportation cost of a fully loaded refrigerated truck carrying 40,000 pounds of product (VanSickle et al., 2002).
The model was solved using GAMS programming software. The analysis of impacts from increases in energy prices was conducted in two parts. First, the model was solved with parameters that assumed energy prices remained constant at the 2002 level. This solution provided the baseline for comparison to other solutions where the parameters for energy prices in the model were adjusted to reflect increased fuel costs 94 percent higher than those of 2002. Two scenarios beyond the baseline were solved with the model. The first scenario assumed that production shifts would be unconstrained and that production would move to those areas that held a seasonal comparative advantage in producing and marketing these crops. The second scenario assumed that acres devoted to production of fresh vegetables in Dade County would be constrained to acres produced in 2002. Discussions with growers suggested that urbanization in Dade County, water restrictions and labor availability constrains acreage available to vegetable crops.
- 3 -
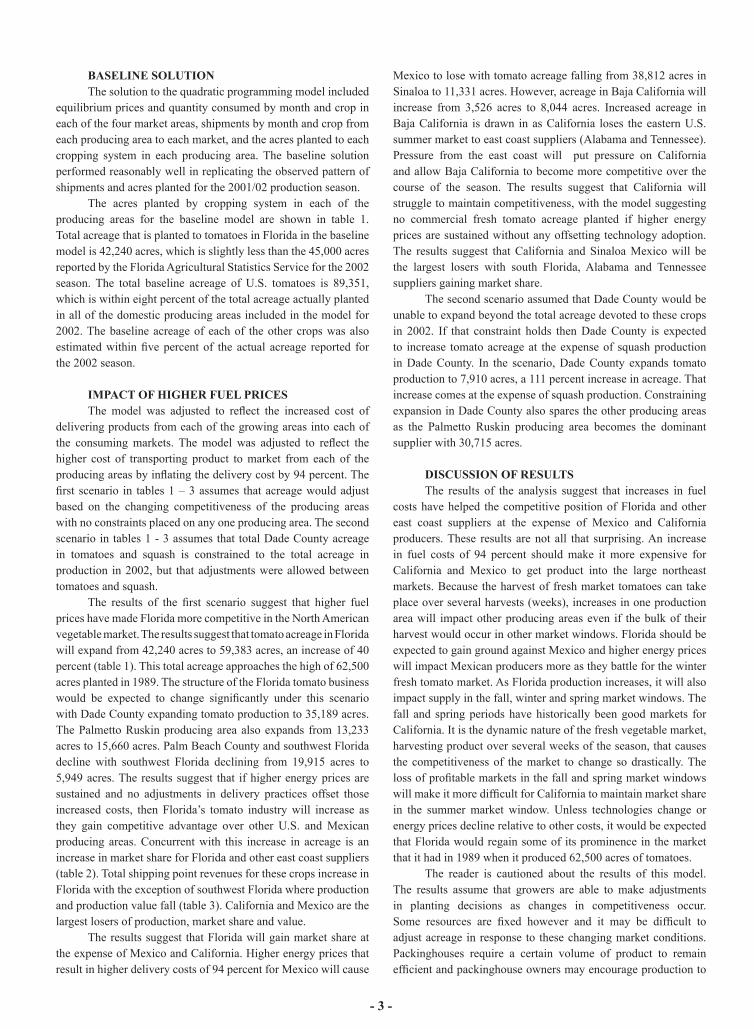
BASELINE SOLUTIONThe solution to the quadratic programming model included
equilibrium prices and quantity consumed by month and crop in each of the four market areas, shipments by month and crop from each producing area to each market, and the acres planted to each cropping system in each producing area. The baseline solution performed reasonably well in replicating the observed pattern of shipments and acres planted for the 2001/02 production season.
The acres planted by cropping system in each of the producing areas for the baseline model are shown in table 1. Total acreage that is planted to tomatoes in Florida in the baseline model is 42,240 acres, which is slightly less than the 45,000 acres reported by the Florida Agricultural Statistics Service for the 2002 season. The total baseline acreage of U.S. tomatoes is 89,351, which is within eight percent of the total acreage actually planted in all of the domestic producing areas included in the model for 2002. The baseline acreage of each of the other crops was also estimated within five percent of the actual acreage reported for the 2002 season.
IMPACT OF HIGHER FUEL PRICESThe model was adjusted to reflect the increased cost of
delivering products from each of the growing areas into each of the consuming markets. The model was adjusted to reflect the higher cost of transporting product to market from each of the producing areas by inflating the delivery cost by 94 percent. The first scenario in tables 1 – 3 assumes that acreage would adjust based on the changing competitiveness of the producing areas with no constraints placed on any one producing area. The second scenario in tables 1 - 3 assumes that total Dade County acreage in tomatoes and squash is constrained to the total acreage in production in 2002, but that adjustments were allowed between tomatoes and squash.
The results of the first scenario suggest that higher fuel prices have made Florida more competitive in the North American vegetable market. The results suggest that tomato acreage in Florida will expand from 42,240 acres to 59,383 acres, an increase of 40 percent (table 1). This total acreage approaches the high of 62,500 acres planted in 1989. The structure of the Florida tomato business would be expected to change significantly under this scenario with Dade County expanding tomato production to 35,189 acres. The Palmetto Ruskin producing area also expands from 13,233 acres to 15,660 acres. Palm Beach County and southwest Florida decline with southwest Florida declining from 19,915 acres to 5,949 acres. The results suggest that if higher energy prices are sustained and no adjustments in delivery practices offset those increased costs, then Florida’s tomato industry will increase as they gain competitive advantage over other U.S. and Mexican producing areas. Concurrent with this increase in acreage is an increase in market share for Florida and other east coast suppliers (table 2). Total shipping point revenues for these crops increase in Florida with the exception of southwest Florida where production and production value fall (table 3). California and Mexico are the largest losers of production, market share and value.
The results suggest that Florida will gain market share at the expense of Mexico and California. Higher energy prices that result in higher delivery costs of 94 percent for Mexico will cause
Mexico to lose with tomato acreage falling from 38,812 acres in Sinaloa to 11,331 acres. However, acreage in Baja California will increase from 3,526 acres to 8,044 acres. Increased acreage in Baja California is drawn in as California loses the eastern U.S. summer market to east coast suppliers (Alabama and Tennessee). Pressure from the east coast will put pressure on California and allow Baja California to become more competitive over the course of the season. The results suggest that California will struggle to maintain competitiveness, with the model suggesting no commercial fresh tomato acreage planted if higher energy prices are sustained without any offsetting technology adoption. The results suggest that California and Sinaloa Mexico will be the largest losers with south Florida, Alabama and Tennessee suppliers gaining market share.
The second scenario assumed that Dade County would be unable to expand beyond the total acreage devoted to these crops in 2002. If that constraint holds then Dade County is expected to increase tomato acreage at the expense of squash production in Dade County. In the scenario, Dade County expands tomato production to 7,910 acres, a 111 percent increase in acreage. That increase comes at the expense of squash production. Constraining expansion in Dade County also spares the other producing areas as the Palmetto Ruskin producing area becomes the dominant supplier with 30,715 acres.
DISCUSSION OF RESULTSThe results of the analysis suggest that increases in fuel
costs have helped the competitive position of Florida and other east coast suppliers at the expense of Mexico and California producers. These results are not all that surprising. An increase in fuel costs of 94 percent should make it more expensive for California and Mexico to get product into the large northeast markets. Because the harvest of fresh market tomatoes can take place over several harvests (weeks), increases in one production area will impact other producing areas even if the bulk of their harvest would occur in other market windows. Florida should be expected to gain ground against Mexico and higher energy prices will impact Mexican producers more as they battle for the winter fresh tomato market. As Florida production increases, it will also impact supply in the fall, winter and spring market windows. The fall and spring periods have historically been good markets for California. It is the dynamic nature of the fresh vegetable market, harvesting product over several weeks of the season, that causes the competitiveness of the market to change so drastically. The loss of profitable markets in the fall and spring market windows will make it more difficult for California to maintain market share in the summer market window. Unless technologies change or energy prices decline relative to other costs, it would be expected that Florida would regain some of its prominence in the market that it had in 1989 when it produced 62,500 acres of tomatoes.
The reader is cautioned about the results of this model. The results assume that growers are able to make adjustments in planting decisions as changes in competitiveness occur. Some resources are fixed however and it may be difficult to adjust acreage in response to these changing market conditions. Packinghouses require a certain volume of product to remain efficient and packinghouse owners may encourage production to

- 4 -
keep facilities open over short durations to see if adjustments occur in the market. Also, some areas will be constrained in expansion because certain resources may not be able to be added. The results can be used however, to gain insight on where expansion may occur. If current energy prices are sustained, east coast producing areas are expected to increase there presence in the market at the expense of foreign suppliers and California. Florida would also benefit from this situation.
REFERENCESSikavis NaLampang. 2004. “Impact of Selected Regulatory Policies on the U.S. Fruit and Vegetable Industry.” Unpublished Ph.D. Dissertation. Food & Resource Economics Department. University of Florida.
John J. VanSickle, Charlene Brewster, Thomas H. Spreen. 2002. “Impact of a Methyl Bromide Ban on the U.S. Vegetable Industry.” EDIS 333. Florida Cooperative Extension Service, Institute of Food and Agricultural Sciences, University of Florida.
Table 1. Planted acres by crop and producing area in the baseline model and with a 94% increase in delivery costs under alternative assumptions for Dade County, Florida.
1. Florida: Dade County (DADE), Palm Beach County(PB), Southwest Florida (SW), and West Central Florida (Palmetto-Ruskin - P-R), Texas (TXS), South California (SCA), North California (NCA), Alabama Tennessee (ALTN), South Carolina(SOCA) Virginia Maryland (VAMD) Sinaloa (MEX1), Baja California, (MEX 2).
2. Scenario 1: Dade County is not constrained in total acreage. Scenario 2: Dade County is constrained its total acreage to that show in the baseline.

- 5 -
Table 2. Average percent market share by crop and producing area in the baseline model and with a 94% increase in delivery costs under alternative assumptions for Dade County Florida.
1. Florida: Dade County (DADE), Palm Beach County(PB), Southwest Florida (SW), and West Central Florida (Palmetto-Ruskin - P-R), Texas (TXS), South California (SCA), North California (NCA), Alabama Tennessee (ALTN), South Carolina(SOCA) Virginia Maryland (VAMD) Sinaloa (MEX1), Baja California, (MEX 2).
2. Scenario 1: Dade County is not constrained in total acreage. Scenario 2: Dade County is constrained its total acreage to that show in the baseline.
- 6 -
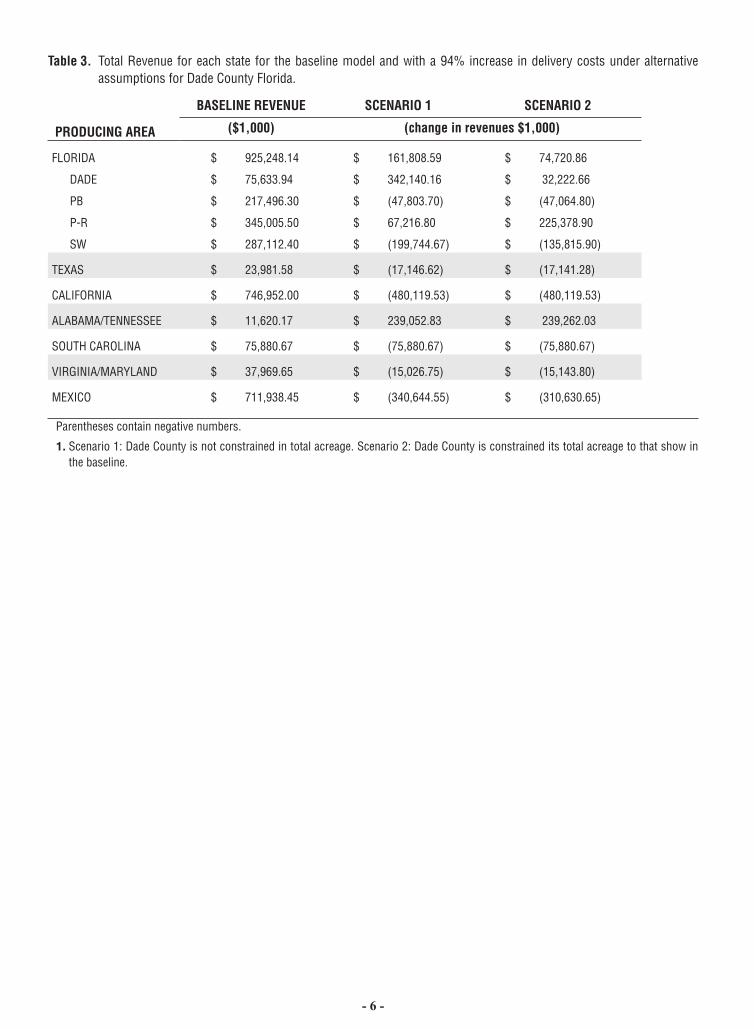
Table 3. Total Revenue for each state for the baseline model and with a 94% increase in delivery costs under alternative assumptions for Dade County Florida.
PRODUCING AREA
BASELINE REVENUE SCENARIO 1 SCENARIO 2
($1,000) (change in revenues $1,000)
FLORIDA $ 925,248.14 $ 161,808.59 $ 74,720.86
DADE $ 75,633.94 $ 342,140.16 $ 32,222.66
PB $ 217,496.30 $ (47,803.70) $ (47,064.80)
P-R $ 345,005.50 $ 67,216.80 $ 225,378.90
SW $ 287,112.40 $ (199,744.67) $ (135,815.90)
TEXAS $ 23,981.58 $ (17,146.62) $ (17,141.28)
CALIFORNIA $ 746,952.00 $ (480,119.53) $ (480,119.53)
ALABAMA/TENNESSEE $ 11,620.17 $ 239,052.83 $ 239,262.03
SOUTH CAROLINA $ 75,880.67 $ (75,880.67) $ (75,880.67)
VIRGINIA/MARYLAND $ 37,969.65 $ (15,026.75) $ (15,143.80)
MEXICO $ 711,938.45 $ (340,644.55) $ (310,630.65)
Parentheses contain negative numbers.
1. Scenario 1: Dade County is not constrained in total acreage. Scenario 2: Dade County is constrained its total acreage to that show in the baseline.

- 7 -
Figure 1. Weekly U.S. retail diesel prices, August 12, 2002 to February 12, 2006
(Endnotes)

- 8 -
Potential Impact of Increased Efficiency in Harvesting and Packing of Fresh Tomatoes
Steven A. Sargent1, John J. VanSickle2 and Santiago Bucaram2
1 Horticultural Sciences Department, P.O. Box 1106902 Food & Resource Economics Department, P.O. Box 110240 University of Florida, Gainesville FL 32611 [email protected]
Tomatoes are the largest vegetable crop grown in Florida, accounting for almost 1/3 of the total value sold. In the 2004 and 2005 seasons, tomatoes were harvested from 42,000 acres and were worth $500 million and $805 million, respectively USDA NASS, 2006.). However, tomato production costs continue to increase, averaging $11,600/acre, up by almost 40% from 2001 (FTC, 2006; Maynard and Olson, 2001). Therefore, our growers are continually seeking ways to reduce those costs. The harvest operation accounts for about 30% of total production costs and therefore amounts to about $167 million for Florida growers. Reducing net harvest costs by only 10% would translate to about $17 million annual savings for the industry.
In a 2003 study funded by the Florida Tomato Committee, Sargent identified several commercially available continuous, harvest-aid systems that utilize one or two conveyors; the harvest crew walks behind the unit. There are three general types of systems, a tractor-mounted system, a self-propelled conveyor belt system and a mobile field-packing unit. With each of these systems the crop is harvested into field buckets and carried to the conveyor.
The tractor-mounted system is designed for smaller operations. The single conveyor swings out from the side of the tractor, and the crop is conveyed over the tractor and loaded into bins or a gondola. The self-propelled conveyor belt system is powered by an on-board diesel engine and moves ahead of the picking crew and may cover 18 rows. Tomatoes are moved to the side, pass over undersize eliminator belts, are sorted and elevated into bins or a gondola. The mobile field-packing unit is also self-propelled and has two, swing-out conveyors that bring the product to the central unit, where it is graded, packed and palletized. It is intermediate in size.
We conducted timing studies and found that harvest was more efficient with the conveyor systems than with the current harvest system because the crews required less time to dump the buckets and return to the place where they were picking. We timed individual pickers with the self-propelled conveyor belt system and found that it required from 100 to 120 seconds to harvest a bucket, walk to the conveyor, and return to the picking location. With a conventional operation, pickers required from 147 to 181 seconds for these operations. Comparing these values, harvest time potentially could be shortened up to 50% using the continuous harvest system, significantly reducing costs for three postharvest operations: harvest labor, transportation to the packinghouse and
packing operations. Transportation to the packinghouse would become more efficient due to the capability for presorting in the field, thereby reducing the amount of out-of-grade tomatoes shipped to the packinghouse. With fewer out-of-grade tomatoes hauled to the packinghouse, less labor would be required for sorting and grading, and fewer culls would require disposal.
The first step in analyzing this system was to perform a sensitivity analysis to determine how reduction in harvest costs would impact market share, production, acreage and revenues for major tomato growing areas shipping to east coast markets. These results are presented in this paper.
METHODSAlthough 30% to 40% reductions in harvest labor have been
reported by companies using harvest aids, we selected reductions of 10% and 20% for this analysis to account for added capital and operating costs of the new harvest aid.
For this analysis the model of “North American Vegetable Market” was used in order to estimate the impacts of increments on efficiency in the harvesting and packing of fresh tomatoes. This model, developed by VanSickle (2000), was built in order to calculate the impacts of a ban of methyl bromide on producers and consumers of fresh vegetables in North America. At the same time, this model was based on the inverse demand system for the fresh vegetable market developed by Scott (1991). Later on, Nalampang (2004) expanded these models and refined the process which was utilized in this current study.
This model can be defined as a spatial equilibrium model and is limited to a group of crops: tomatoes, peppers, eggplant, cucumbers, squash, watermelons and strawberries. In this report only data for tomatoes are reported. The following producing areas were chosen for the model: Florida, Mexico, California, South Carolina, Virginia and Maryland combined, and Alabama and Tennessee combined. Florida was separated into four producing areas: Dade County, Palm Beach County, Southwest Florida, and the Palmetto/Ruskin area (West Central Florida). California was divided in Southern California (Orange, Ventura, San Diego and Los Angeles counties) and Northern California. Two Mexican production areas were also included, Sinaloa and Baja California. Growing seasons were analyzed based on one crop for Dade and Mexico (late fall to early spring) and California (summer). Spring and fall crops were analyzed for the other three Florida production areas.
The US vegetable model allocates production of these crops across regions based on their delivery costs to regional markets, productivity and the regional demand structure. As previously stated for this work, a system of inverse demand equations was used, based upon work by Scott (1991). A Rotterdam model was also implemented. This model is derived from the problem of a consumer that is maximizing a utility function u(q) subject to a budget constraint p’ q = m, where m is total expenditure (or full income), p is a price vector and q a vector of goods. In this specific case the model is composed of five equations of fresh vegetable demand in the US, estimated for four selected markets: Los Angeles, Chicago, Atlanta and New York City.
In order to analyze the impact of increased efficiency in harvesting of fresh tomatoes and the associated costs, the year 2002

- 9 -
was used as a baseline. Proportional changes in the harvest costs were applied at a level of -10% and -20% because of increments in the harvest efficiency. For this analysis other variables were maintained constant so as to isolate the system from other phenomena, such as natural disasters, sharply increased energy prices and demand reallocation.
We optimized this equation system by a process through which the optimal reallocation of production was provided. This was executed using GAMS program software so as to determine the impact of this technology and its consequent contraction on the harvest costs for the production system. Also, acres devoted to production of fresh tomatoes in the Dade area were upper-constrained to acres shown in the baseline, following the suggestion by growers that acreage available to tomato production in that county is constrained by urbanization, water restrictions and labor availability.
RESULTS Overall, the analyses showed that decreasing harvest
costs by 10% or 20% would give Florida growers a competitive advantage over other major growing areas. Growers in Mexico would have substantial losses in market share, production, acreage and revenues, while California growers would benefit slightly.
Average Market Share. Results showed that for a 10% decrease in costs, average market share (MS) would increase for growers in Dade, Palmetto/Ruskin, Southwest and Palm Beach districts by 1.6%, 3.6%, 0.4% and 0.2%, respectively (Table 1). A 20% decrease in costs would roughly double the increase in MS for growers in these districts, with the exception for Palm Beach district which would decrease by 0.2%. Growers in southern and northern California and in Baja California, Mexico, would maintain current MS, while growers in Sonora, Mexico, would lose 5.4% and 11.4% MS for 10% and 20% lower costs, respectively.
Total Production. Florida production was analyzed by growing season (single crop, fall, spring) and by production district. Growers in Palmetto/Ruskin (fall, spring crops) would benefit most from lower harvest costs, with the spring crop increasing about two times that of the fall crop for each reduction in harvest costs (Table 2A). Production for the single crop in Dade would increase by 60.5% and 121.8% for 10% and 20% reductions in harvest costs, respectively. Southwest growers would lose 32.8% production for the spring crop with a 10% decrease in costs, and 8.3% with a 20% decrease, but no effect on the fall crop. There were no changes for Palm Beach area growers.
Interestingly, while production in the Sinaloa area would decrease significantly (64.1% and 26.0%), production in the smaller Baja California area would increase by 116.7% for 10% but decrease by 38.5% for 20% lower harvest costs in Florida (Table 2B). Although a small production area, Alabama-Tennessee growers could lose about 40% production and acreage with a 10% decrease in Florida production costs, but could realize a 244.5% increase with a 20% decrease. Production in South Carolina and Virginia-Maryland would decrease. Production in both California areas would increase 6.8% with a 20% reduction in costs, whereas
total Mexican production would decrease by 49.1% and 27.0%, for respective reduced costs of 10% and 20% (Table 2C).
Acreage. Changes in acreage are projected to be virtually identical with those for total production.
Revenues. Florida has the largest share of revenue ($925 million) of all of the areas in this study, followed by California ($246 million) and Mexico ($712 million) (Table 3). With a 10% or 20% decrease in harvest costs, statewide revenues could be expected to increase by 7.6% and 14.8%, respectively; the Dade and Palmetto-Ruskin areas would benefit most, with increases ranging from 13.0% to 38.2%.
For the other production areas, there would be minimal impacts on revenues for California, while a 20% decrease in costs would have a slightly negative impact for South Carolina (4.3%), and moderately negative impacts for Mexico (18.7%) and Virginia-Maryland (25.4%). Again, Alabama-Tennessee would see an increase in revenues of 244.5%.
SUMMARYThis preliminary sensitivity analysis projected that
Florida tomato growers would be much more competitive than other growing regions if harvest costs were lowered by 10% or 20% due to the implementation of a conveyor harvest system. Growers in the Palmetto-Ruskin district would benefit most through increased market share, following by growers in Dade district. There would be minimal impact on growers in California, while Mexican growers in Sinaloa state would be most negatively affected. Further studies will focus on analyzing the cost structure for implementing these three conveyor systems.
REFERENCESFlorida Tomato Committee. Orlando, Florida. http://www.floridatomatoes.org/ (accessed July 2006)
NaLampang, S. 2004. Impact of selected regulatory policies on the U.S. fruit and vegetable industry. Unpublished Ph.D. dissertation. Food & Resource Economics Department, University of Florida, Gainesville.
Olson, S.M., D.N. Maynard, G.J. Hochmuth, C.S. Vavrina, W.M. Stall, T.A. Kucharek, S.EE. Webb, T.G. Taylor, S.A. Smith and E.H. Simonne. Ch.41. In, Olson, S.M. and E.H. Simonne (eds.), Vegetable Production Handbook for Florida – 2004-2005.University of Florida Extension, Gainesville and Citrus & Vegetable Magazine, Tampa.
Scott, S. W. 1991. International Competition and Demand in the United States Fresh Winter Vegetable Industry. Unpublished M.S. Thesis, University of Florida, Gainesville.
VanSickle, J.J., C. Brewster, T.H. Spreen. 2000. Impact of a methyl bromide ban on the U.S. vegetable industry. Bulletin 333. February. Food and Resource Economics Department. Gainesville.

- 10 -
CONTACT INFORMATION:Steven A. Sargent – Email: [email protected] Sciences Department, P.O. Box 110690 University of Florida, Gainesville FL 32611
John J. VanSickle – Email: [email protected] Food & Resource Economics Department, P.O. Box 110240University of Florida, Gainesville FL 32611
Santiago Bucaram – Email: [email protected] & Resource Economics Department, P.O. Box 110240University of Florida, Gainesville FL 32611
Table 1. Average market share for selected tomato growing areas as affected by a 10% or 20% reduction in Florida harvest costs.
ReducedHarvest
Cost
Florida Districts California
DadePalm Beach
Palmetto/Ruskin
South-west
South North
10% 1.6% 0.2% 3.6% 0.4% -0.4% 0.0%20% 3.2% -0.2% 7.7% 1.2% 0.3% 0.0%
ReducedHarvest
Cost
MexicoAlab-Tenn
SouthCarolina
Virg-Maryl.
Sinaloa Baja Calif.
10% -0.3% 0.0% -0.1% -5.7% 0.5%20% 1.5% -0.4% -0.6% -11.4% -1.4%
Table 3. Projected changes in revenues for selected tomato growing areas as affected by a 10% or 20% reduction in Florida harvest costs.
ProductionArea
Baseline Revenue 10% Reduction in Costs 20% Reduction in Costs($1,000) ($1,000) (%) ($1,000) (%)
Florida 925,248 995,393 7.6 1,062,494 14.8 Dade 75,634 90,866 20.1 104,508 38.2 Palm Beach 217,496 221,178 1.7 210,009 -3.4 Palm-Rusk 345,005 389,850 13.0 444,673 28.9 Southwest 287,112 293,499 2.2 303,304 5.6California 746,952 747,944 0.1 764,296 2.3Alab-Tenn 11,620 6,926 -40.4 40,029 244.5South Carolina 75,881 77,540 2.2 72,640 -4.3Virg-Maryland 37,970 37,261 -1.9 28,317 -25.4Mexico 711,938 663,737 -6.8 578,913 -18.7

- 11 -
Table 2. Projected changes in production and acreage for selected tomato growing areas and seasons as affected by a 10% or 20% reduction in Florida harvest costs.
A)
Total Production
Florida Production Districts California
DadePalm Beach
Palmetto/Ruskin
South-west South North
10%One Crop 60.5% 0.0% 0.0% 0.0% 0.4% 0.0%
Fall 0.0% 0.0% 39.7% 0.0% 0.0% 0.0%Spring 0.0% 0.0% 68.5% -32.8% 0.0% 0.0%
20%One Crop 121.8% 0.0% 0.0% 0.0% 6.8% 0.0%
Fall 0.0% 0.0% 81.2% 0.0% 0.0% 0.0%Spring 0.0% 0.0% 129.0% -8.3% 0.0% 0.0%
Total Acreage
10%One Crop 60.5% 0.0% 0.0% 0.0% 0.4% 0.0%
Fall 0.0% 0.0% 39.7% 0.0% 0.0% 0.0%Spring 0.0% 0.0% 68.5% -32.8% 0.0% 0.0%
20%One Crop 121.8% 0.0% 0.0% 0.0% 6.8% 0.0%
Fall 0.0% 0.0% 81.2% 0.0% 0.0% 0.0%Spring 0.0% 0.0% 129.0% -8.3% 0.0% 0.0%
B)
Total ProductionAlab-Tenn
SouthCarolina
Virg-Maryl. Sinaloa Baja Calif.
10%One Crop -40.4% 2.2% -1.9% -64.1% 116.7%
Fall 0.0% 0.0% 0.0% 0.0% 0.0%Spring 0.0% 0.0% 0.0% 0.0% 0.0%
20%One Crop 244.5% -4.3% -25.4% -26.0% -38.5%
Fall 0.0% 0.0% 0.0% 0.0% 0.0%Spring 0.0% 0.0% 0.0% 0.0% 0.0%
Total Acreage
10%One Crop -40.4% 2.2% -1.9% -12.6% 18.6%
Fall 0.0% 0.0% 0.0% 0.0% 0.0%Spring 0.0% 0.0% 0.0% 0.0% 0.0%
20%One Crop 244.5% -4.3% -25.4% -26.0% -38.5%
Fall 0.0% 0.0% 0.0% 0.0% 0.0%Spring 0.0% 0.0% 0.0% 0.0% 0.0%
C)
Total ProductionTotal Change
Florida California Mexico
10%One Crop 60.5% 0.4% -49.1%
Fall 39.7% 0.0% 0.0%Spring 39.8% 0.0% 0.0%
20%One Crop 121.8% 6.8% -27.0%
Fall 81.2% 0.0% 0.0%Spring 90.1% 0.0% 0.0%
Total Acreage %
10One Crop 60.5% 0.4% -10.0%
Fall 39.7% 0.0% 0.0%Spring 40.5% 0.0% 0.0%
20%One Crop 121.8% 6.8% -27.0%
Fall 81.2% 0.0% 0.0%Spring 91.1% 0.0% 0.0%

- 12 -
Research Update on Grape Tomatoes: Varieties, Taste Test and Response to N Rates
Eric Simonne, Steve Sargent, Amy Simonne, David Studstill, and Robert Hochmuth
University of Florida, IFAS, Horticultural Sciences Department Gainesville, FL 32611-0690
[email protected]; [email protected]; [email protected]
Approximately 2,000 acres of grape tomato are grown in Florida. Current research efforts aim at identifying best varieties and developing crop-specific N fertilizer recommendations.
Varieties and taste test. Grape tomatoes have recently gained in popularity among consumers because they can be eaten without being cut, they are deep red in color, and their flavor is intense and pleasant. Most grape tomatoes are of the ‘Santa’ variety and are marketed under the “Santa” trade name (Boe et al., 1980). Because seed availability of ‘Santa’ is limited, many growers are looking for a Santa-like variety (Lister, 2000; Sugarman, 2001). The growth, sensory characteristics, and selected chemical composition of eight red and three yellow commercial varieties were evaluated in 2004 on tomatoes grown with plasticulture.
Six-week-old transplants of 11 grape tomato varieties were planted on March 23, 2004 at the North Florida Research and Education Center - Suwannee Valley near Live Oak, FL on a Lakeland fine sand (Table 1). Tomatoes were grown using plasticulture on beds spaced 5 ft apart and plants spaced 1.5 ft apart within the row, which created a stand of 5,810 plants per acre. Each variety was planted onto three, 23-ft long plots. Based on soil test results, the field was fertilized with a preplant application of 13-4-13 (N-P
2O
5-K
2O) that supplied 56 kg/ha N (50
lb/acre N) and weekly injections of liquid 7-0-7 according to IFAS recommendations (Olson et al., 2005). Tomatoes were staked to a height of 8 ft and strung five times. Fruits began ripening during early June, but yields were not determined. On June 18, earliness, the presence of green shoulder on tomato fruits, plant growth habit, and the occurrence of disease symptoms were recorded by consensus of two observers.
Chemical analyses were performed by grinding, centrifuging, and filtering to obtain a clean supernatant of 1.1 lb samples collected on June 21 from one replication. The supernatant was then frozen at -22 oF for later analysis. On July 1, supernatant samples were thawed and total titratable acidity (TTA), soluble solids content (SSC), and pH were measured according to Roberts et al. (2002). TTA was determined on a 6-g (0.21 oz) aliquot by titrating with 0.1 N NaOH to an endpoint pH=8.2 with an automatic titrimeter. The volume of NaOH used was converted to milliequivallents (mEq) citric acid/100g fresh juice (%). pH was measured on the undiluted juice. Soluble solid concentration was determined with a refractometer.
For the sensory analysis, approximately 2.2 lb of grape tomato was harvested from each plot from one replication on June
21, washed, dried, and stored overnight at room temperature. The taste test was conducted the next day between 10:00 and 11:00 am in a quiet room following the recommendations from the American Society of Testing Materials (1981). Each volunteer panelist was seated and received a plate that was divided into five sections marked with random three-digit numbers. Approval was obtained from the University of Florida Institutional Review Board for research involving human subjects under UFIRB-2001-U-770. Single-fruit samples representing five varieties were placed on each plate section using tooth picks. Panelists were provided with a pen, a data collection form, and a glass of water to cleanse their palate between each sample. On the form, panelists were asked to provide age group and gender, and were instructed to not report their names. Panelists were asked to taste each of the five red-tomato samples and score sweetness, acidity, flavor, and overall preference. The number of red varieties used in the taste test was reduced to 5 based on field observations to prevent panelist fatigue. For each attribute, panelists recorded their scores by making a mark on a 90-mm (3.0 inch) long, unstructured line with anchors (Fig.1). Anchors at the left ends of the lines represented poor scores (such as “not sweet” or “dislike”) whereas those on the right end of the line represented satisfactory scores (such as “sweet” or “like”). After a short break, new plates and new data collection forms were provided for the evaluation of three yellow varieties. The distances from the left sides of the lines to the panelist’s marks were measured to the nearest millimeter to score each sensory attribute.
‘Sweet Olive’ was the earliest, ‘Chiquita’ was pink when ripe instead of red, and ‘Red Grape’, ‘Sweet Olive’, and ‘Tami G’ showed no green shoulder (Tables 1 and 2). Ranges for flesh pH (4.21 to 4.48), titratable acidity (0.31 to 0.50 % citric acid equivalent), and soluble solids (3.75 to 7.40 oBrix) were narrow, and similar for all varieties (Table 3). In the taste test, ‘Santa’ was consistently rated equivalent to ‘Red Grape’ and ‘St. Nick’ while ‘Sweet Olive’ and ‘Tami G’ received lower preference scores (Table 4). Few differences were found among the three yellow varieties. ‘Agriset 8282’ and ‘Honey Bunch’ were preferred over ‘Morning Light’.
Grape tomato response to N rates. Current N fertilization recommendations have been developed for determinate tomato varieties that have a 3-month long growing season, whereas that of the indeterminate grape cultivars may be up to six months
Six-week-old transplants were established on Mar. 23, 2005 (0 week after transplanting, WAT) at the North Florida Research and Education Center - Suwannee Valley near Live Oak, FL on a Lakeland fine sand. Tomatoes were grown on plasticulture as described above. Fertilization treatments consisted of 0%, 33%, 66%, 100%, 133%, and 166% of the current recommended rate for round tomato. Treatments were created by applying 25% of N and K
2O broadcast preplant in the bed and eight identical weekly
injections of the remaining N from 4 to 11 WAT. This corresponded to daily injection rates of 3 kg/ha N (2.7 lb/acre N) for the 100% N rate. Phosphorus and K rates were based on soil test results and were constant for all treatments. Modifications of the drip irrigation system allowed for independent fertilizer injections to plots receiving the different N rates. Each plot was 23 ft long and

- 13 -
was planted in yellow ‘Honey Bunch’ plants that were not used for data collection. Marketable yield, culls and soluble solid content were collected on two red ‘Tami G’ plants planted in the middle of each plot. Interplanting a yellow and a red variety allowed for large plots while minimizing labor needed for harvest. Tomatoes were staked to a height of 8 ft and strung five times. Irrigation was applied daily based on plant stage of growth (irrigation length ranging from 2 x 30 min each day for small plants to 3 x 1.5 hrs for large plants) in order to maintain soil water tension at the 12 inch depth between 8 (field capacity) and 15 kPa (Simonne et al., 2005). Other cultural practices followed current recommendations (Olson et al., 2005).
Plants were harvested weekly five times at the red stage on June 10, 17, 24 and July 7 and 15 (11 to16 WAT). The last harvest also included partially ripe fruits. At each harvest, three representative tomatoes from each plot were cut in halves and crushed with a garlic press. The juice was placed on the prism of a handheld refractometer for the determination of SSC. Petiole sap NO
3-N and K concentrations were determined following current
recommendations (Olson et al., 2005) at first fruit set and first and third harvests (5, 11, and 13 WAT, respectively).
The experimental design was a randomized complete block design with four replications. Marketable yield, SSC, and petiole NO
3-N and K concentration responses to N rates were determine
using regression analysis (SAS, 2001). Season marketable (SMY, kg/ha) and total yield (TY, kg/
ha) response to N rates were quadratic (SMY = -0.16 Nrate2 + 140 Nrate + 11,821 R2=0.56; CV=32%; TY = -0.18 Nrate2 + 153 Nrate + 13949; R2=0.54, CV=32%; both p<0.01; Fig.2). Highest SMY and TY occurred between 314 and 392 kg/ha N rates (280 and 350 lb/acre N). N rate effect on SMY and TY was significant only for harvests 4 and 5. SSC ranged from 6.25 to 7.5 oBrix for harvests 1 to 4 and was not significantly affected by N rate. On harvest 5, SSC tended to be greater with higher N rates. These preliminary results suggest that N fertilization for grape tomato could be done by incorporating 56 to 78 kg/ha N in the bed (50 to 70 lb/acre N), followed by weekly injections of 0, 1.7, 2.3, 2.8, 2.3, 3.0, 3.5 kg/ha/day for 1, 2, 3-4, 5-10, 11-14, and 15-16 WAT, respectively (0, 1.5, 2.0, 2.5, 2.0, 2.7, 3.1 lb/acre/day). This proposed schedule needs to be validated under commercial conditions that use optimal irrigation practices. Because the length of the growing season for grape tomato may vary, emphasis should be placed on daily N rates and irrigation management, rather than on seasonal N rate.
LITERATURE CITEDASTM. 1981. Guidelines for the selection and training of sensory panel members. ASTM Special Technique Publication 758. American Society for Testing and Materials, Philadelphia, Pg, 2-32.
Boe, A.A., P.J. Pelofske, and T.J.Bakken. 1980. ‘Santa’, ‘Gem State’, and ‘Benewah’ tomatoes. HortScience 15:536-537.
Lister, T. 2000. Shippers relieved by resolution of grape tomato debate. The Packer - Business Newspaper of the Produce Industry. September 18, p. 4.
Olson, S.M., D.N. Maynard, G.J. Hochmuth, C.S. Vavrina, W.M. Stall, T.A. Kucharek, S.E. Webb, T.G. Taylor, S.A. Smith, and E.H. Simonne. 2005. Tomato production in Florida, pp. 357-375 In: S.M. Olson and E. Simonne (Eds.) 2005-2006 Vegetable Production Handbook for Florida, Vance Pub., Lenexa, KS.
Roberts, K.P., S.A. Sargent, and A.J. Foxx. 2002. Effects of storage temperature on ripening and postharvest quality of grape and mini-pear tomatoes. Proc. Fla. State Hort. Soc. 115:80-84.
SAS Institute. 2000. SAS/STAT Guide for personal computer. Cary, NC.
Simonne, E.H., M.D. Dukes, and D.Z. Haman. 2005. Principles and practices for irrigation management, pp. 33-40. In: S.M. Olson and E. Simonne (Eds.) 2005-2006 Vegetable Production Guide for Florida, Vance Pub., Lenexa, KS.
Sugarman, C. 2001. Attack of the grape tomatoes. The Washington Post. http://www.washingtonpost.com/ac2/wp-dyn/A12414-2001 Sep11 (Accessed April 2005).

- 14 -
Table 1. Reported growth habit, and seed source, and observed fruit color, growth habit, green shoulder occurrence, and comments for selected red grape tomato varieties (all hybrids) grown in 2004 on a Lakeland fine sand near Live Oak, Fla.
Variety
Variety information Observations (18 June)Fruit color
Growth habitz Seed Source
Fruit color
Green shoulder Comments
Disease symptoms
Chiquita Red Det. Johnny’s Seeds Pink Yes Unusual color; large fruits NoneJolly Elf Red Det. Siegers Red Yes Poor taste, fair color NoneNavidad Red Indet. Rogers Red Some Late maturity; compact growth habit NoneRed Grape Red Indet. Johnny’s Seeds Red No Good taste; not vigorous NoneSt. Nick Red Indet. Siegers Red Yes Large fruit, good taste; vigorous NoneSanta Red Indet. n/a Red Yes Good taste; vigorous NoneSweet Olive Red Det. Johnny’s Seeds Red No Earliest; almost round NoneTami G Red Det. Harris Seeds Red No Nice shape, small fruit None
z Det. = determinate; Indet. = indeterminate; n/a = not commercially available.
Table 2. Reported growth habit, and seed source, and observed fruit color, growth habit, green shoulder occurrence, and comments for selected yellow grape tomato varieties (all hybrids) grown in 2004 on a Lakeland fine sand near Live Oak, Fla.
Variety
Variety information Observations (18 June)
Fruit color
Growth habitz Seed Source
Fruit color
Green shoulder Comments
Disease symptoms
Agriset 8282 Yellow Indet. Agrisales Yellow No Late maturity; large fruit, some pointed fruits None
Honey Bunch Yellow Indet. Stokes Yellow No Small fruit; not vigorous Bacterial spotMorning Light Yellow Indet. Siegers Yellow Little Uniform cluster, no fruit cracking Bacterial spot
z Indet. = indeterminate
Table 3. Chemical analyses of grape tomato varieties grown on a Lakeland fine sand in 2004.
Variety ColorSoluble solids content (Brix)
Total titratable acidity (TTA) (%) Brix:TTA ratio pH
Chiquita Red 5.15 dz 0.50 a 10 4.26 dJolly Elf Red 7.40 a 0.49 ab 15 4.41 bNavidad Red 3.75 e 0.31 f 12 4.27 dRed Grape Red 5.43 cd 0.40 de 14 4.48 aSt. Nick Red 6.30 bc 0.40 de 16 4.41 bSanta Red 5.58 bcd 0.46 bc 12 4.35 cSweet Olive Red 4.65 de 0.43 cd 11 4.21 eTami G Red 6.48 ab 0.41 cde 16 4.48 aAgriset 8282 Yellow 5.23 d 0.39 de 13 4.24 deHoney Bunch Yellow 5.33 cd 0.35 ef 15 4.33 cMorning Light Yellow 4.78 d 0.42 cd 11 4.23 de
z Within columns, mean followed by different letters are significantly different according to Duncan’s Multiple Range test at P<0.05.

- 15 -
Table 4. Sensory evaluation of selected grape tomato varieties (Spring 2004).
VarietySweetness
(mm)Acidity(mm)
Flavor(mm)
Overall preference(mm)
Red varietiesRed Grape 57 az 28 b 53 a 41 abSt. Nick 60 a 32 b 58 a 46 abSanta 57 a 25 b 56 a 55 aSweet Olive 30 b 52 a 48 a 29 bTami G 35 b 47 a 45 a 35 b
Yellow varietiesAgriset 8282 35 a 33 a 40 a 35 aHoney Bunch 45 a 42 a 47 a 40 aMorning Light 33 a 31 a 37 a 37 a
z Within columns, mean followed by different letters are significantly different according to Duncan’s Multiple Range test at P<0.05; highest and lowest possible scores were 90 and 0 mm, respectively.
Fig.2. Marketable yield (kg/ha, 5 harvests cumulated) response of ‘Tami G’ grape tomato grown with plasticulture in the Spring of 2005 at the North Florida Research and Education Center- Suwannee Valley, near Live Oak, FL, to nitrogen rates (y1 to y5 represent cumulative yields from up to harvest 1, to up to harvest 5, respectively)
y5 = -1121.2x2 + 14514x - 1573
R2 = 0.86y4 = -1334.5x2 + 14406x - 3677.5
R2 = 0.88
y3 = -1165x2 + 10324x - 2381.8
R2 = 0.87
y2 = -329.66x2 + 3239.9x + 779.63
R2 = 0.89
y1 = 378.34x + 1206.5
R2 = 0.72
0
10000
20000
30000
40000
50000
60000
0 78 157 235 314 392
Nitrogen Rate (kg/ha)
Mar
keta
ble
Yie
ld (
kg/h
a)
Harvest 1Harvest 1 & 2Harvest 1,2 & 3Harvest 1,2,3 & 4Harvest 1,2,3,4 & 5Poly. (Harvest 1,2,3,4 & 5)Poly. (Harvest 1,2,3 & 4)Poly. (Harvest 1,2 & 3)Poly. (Harvest 1 & 2)Linear (Harvest 1)
Kg/ha = 0.893 lb/acre.
Fig.1. Data collection form used for the grape tomato taste test (only 2 samples shown).
2005 NFREC-SV Grape Tomato Variety Taste Test
NO NAME PLEASE
Gender (Circle one) M F Circle your age 10-19 20-29 30-39 40-49 50-59 60-69 70-79
Instructions: For each of the red grape tomato samples, rate sweetness, acidity, flavor, and overall preference by making a mark on each corresponding line. The qualifiers provide the orientation of the lines.
Sample 141 Sample 826
Sweetness: not sweet ____________________________sweet
Acidity: dislike ______________________________like
Flavor: bland _______________________________flavorful
Overall preference: dislike _______________________________like
Sweetness: not sweet ____________________________sweet
Acidity: dislike ______________________________like
Flavor: bland _______________________________flavorful
Overall preference: dislike _______________________________like

- 16 -
Nitrogen BMP Efforts with Tomato Production in Florida in the 2005-2006 Season
Monica Ozores-Hampton1, Eric Simonne2, Eugene McAvoy3, Fritz Roka1, Pam Roberts1, Phil Stansly1, Sanjay Shukla1, Kent Cushman1 Morgan Kelly1 Tom Obreza4, Phyllis Gilreath5, Darrin Parmenter6.
1University of Florida/IFAS, SWFREC, Immokalee, FL. 2University of Florida, Horticultural Sciences Department, Gainesville, FL. 3Hendry County Extension Service. 4University of Florida, Soil and Water Science Department, Gainesville, FL. 5Manatee County Extension Service, 6Palm Beach County Extension Service.
Abstract. With the development of nutrient best management practices (BMPs) for vegetable crops N fertilizer recommendations must be high enough to ensure maximum economic tomato yield without detrimentally affecting water quality. The current statewide UF-IFAS N rate recommended rate of 200 lbs/acre (with supplemental fertilizer applications under specified conditions) may need adjustment based on growing season, soil type, and irrigation system type. The objectives of this project were to establish partnerships with Florida tomato growers to evaluate N fertilizer rate effects on yield, plant growth, petiole N sap, water table depth, and disease incidence. In 2005-2006, we conducted eight on-farm trials with N rates ranging from 200 to 330 lb/acre. Each trial included the UF-IFAS and at least one grower-defined rate. The tomato production was divided in fall, winter and spring growing seasons based on rainfall and temperature differences, therefore trials were conducted during those seasons. Nitrogen rates had no effect on tomato plant biomass except in one drip-irrigated trial where the IFAS rate produced smaller mature plants compared with the grower rate. Changes in petiole sap NO
3-N and
K concentrations differed between seepage and drip irrigation, but were above sufficiency thresholds except in one seepage-irrigated trial. Total tomato yields did not significantly differ between N treatments except in one seepage/winter trial. After excessive rain from Hurricane Wilma, additional N application did not affect yield. Applying more than 200 lb/acre N produced higher yields of large and medium fruits at third harvest during winter and spring. However, in some situations lower N rates increased extra-large fruit yield. A high level of grower engagement created a popular BMP testing program. Cooperating growers indicated willingness to continue testing N rates lower than their standard next year. Tomato yield can fluctuate widely by season and year due to changing weather conditions. Prices are also volatile, which creates an unpredictable economic situation. Nitrogen fertilizer is a minimal production system cost, so growers treat it as inexpensive insurance. In order to change the grower paradigm, BMP N rate research must be conducted during all seasons, at as many locations, and for as many years as possible in order to identify response trends.
INTRODUCTIONWith more than 20,000 acres planted each year in Collier
and Hendry counties, Southwest Florida is an important production area in the USA for winter fresh-market tomato. Depending on market conditions, production value ranges between about $150 and $300 million annually. Growing seasons are defined as fall with planting dates from August to 15 Oct., winter from 15 Oct. to 15 Dec. and spring from 15 Dec. to 1 Feb. These seasons differ in rainfall patterns, temperatures and day length. For example, fall may bring hurricanes, leaching rains, and wide-ranging temperatures; winter brings cool temperatures and unpredictable freezes accompanying cold fronts; spring is typically dry with temperatures cool at the start and warm or hot at the end. Typical growing season lengths are 18, 20, and 16 weeks for fall winter and spring, respectively. These seasons also differ from a marketing standpoint. Prices are highest in November-December when fall plantings are harvested and tend to decrease thereafter.
South Florida tomato cultural practices attempt to maximize economic return by maximizing productivity. The current UF-IFAS state-wide N fertilizer rate recommendation for tomato is based on a 6-ft bed spacing, and consists of base (200 lbs/acre) and supplemental rates (Olson et al., 2005). For drip-irrigated crops, 40% of the N and K should be applied preplant and the remaining injected through the drip system (Dangler and Locascio, 1990; Locascio et al., 1989; Locascio et al., 1997). For seepage irrigation, 40% of N and K should be broadcast incorporated in the bed (“cold mix”), with the rest banded into one or two grooves cut into the bed surface (“hot mix”). For both systems, supplemental fertilizer applications are recommended in addition to the base rate 1) after a leaching rain (3 inches in 3 days or 4 inches in 7 days); 2) when the harvest season is extended (crop in the field for more than 13 weeks); or 3) when leaf or petiole nutrients fall below the sufficiency range under sound irrigation management (Olson et al., 2005). Current UF-IFAS drip irrigation scheduling methods are based on Class A Pan evaporation (Locasio and Smajstrla, 1989) or reference evapotransporation (ETo) (Simonne et al., 2005). Both methods aim to maintain soil water tension below 10 kPa (Locascio and Smajstrala, 1996). For seepage irrigation, the water table should be maintained 12 to 16 inches deep during plant establishment, and 24 to 30 inches deep thereafter (Stanley and Clark, 2003). Although drip irrigation produced tomato yields comparable with seep-irrigated production while substantially improving water-use efficiency (Pitts et al., 1988), seepage irrigation is still widely used in southwest Florida for economic reasons (Prevatt et al., 1981).
The “Water Quality/Quantity Best Management Practices for Florida Vegetables and Agronomic Crop” manual was jointly developed in 2001-2004 by the Florida Department of Agriculture and Consumer Services and UF-IFAS (www.floridaagwaterpolicy.com). BMPs are cultural practices that maintain productivity while reducing environmental impact. The BMP manual for vegetables was adopted by rule (5M-6) and by reference in February, 2006. While the BMP manual recognizes several nutrient management strategies (including fertilizer rates that exceed current recommendations), the long-term success of this voluntary program is based on water quality improvement. Although N runoff has not been identified as a widespread

- 17 -
problem in south Florida, a concern remains that the combination of excessive fertilization and irrigation may contribute to elevated nutrient concentrations in ground and/or surface waters.
Although it has been documented that UF-IFAS tomato fertilization recommendations are sufficient for maximum yield (Stanley and Clark, 2003), fertilizer rates used to produce southwest Florida tomatoes are typically higher than recommended because growers believe that UF-IFAS rates are too low and do not provide enough flexibility to reflect the different growing conditions found throughout Florida. Because education, demonstration, and direct grower involvement have been keys to increasing BMP adoption in north Florida vegetable fields (Hochmuth et al., 2003; Simonne and Hochmuth, 2003), a 3-year project was initiated in southwest Florida to 1) establish partnerships with selected tomato growers to evaluate the effects of N fertilization in commercial fields; 2) evaluate the effect of N fertilizer rate on plant growth, nutritional status, yield, disease and pest incidences, and crop market value; 3) determine the optimum N rate for tomato production; and 4) evaluate the cost effectiveness of selected N application rates. This paper reports the results of the 2nd year of this project and focuses on objectives (1) and (2).
MATERIALS AND METHODSWe conducted eight trials at five commercial farms to
evaluated tomato response to N fertilizer rates during the 2005-2006 seasons. Together the cooperating farms represented 16,000 acres (80%) of staked tomato production in southern and eastern Florida. Soils in the area have a sandy surface layer that is prone to leaching (Muchovej et al., 2005). Treatments consisted of N fertilizer rates ranging from 200 to 330 lb/acre N applied to seepage-irrigated tomatoes in a completely randomized experimental design with three replications (Table 1). In drip-irrigated fields, there were two individual zones with 12 sub-plots per treatment. An additional 36 kg ha-1 N (32 lb/acre) for trial 1, 125 kg ha-1 N (112 lb/acre) for trial 2 and 67 kg ha-1 N (60 lb/acre) for trial 3 were applied after the hurricane Wilma passed through the area to compensate the loss of N by leaching. At the seepage-irrigated fields, the UF-IFAS rates were achieved by changing the rate or composition of the hot mix and by applying custom-made blends to keep P, K micronutrients rates constant. The trials represented diverse growing conditions found in Southwest and East Florida, and also included different varieties (mostly ‘Florida 47’ and ‘Sebring’), plant densities (in-row spacing of 18 to 26 inches between plants; 5 or 6 ft bed centers), soil types (described above), and farm sizes (700 to 5,000 acres). Cooperators prepared beds, fumigated the soil, applied bottom and hot mixes and installed polyethylene mulch, transplanted, pruned, staked, irrigated and provided pest and disease control.
Data collection: At 30 days after transplanting (DAT) and mature plants in two drip-irrigated trial, the shoots of three tomato plants (fruits removed) selected randomly in each treatment were collected and oven dried at 65o C until constant weight to determine dry matter accumulation (Mills and Jones, 1996). The water table depth was recorded bi-weekly throughout the growing season. Beginning at first flower buds and continuing until third harvest, fresh petiole sap NO
3-N and K concentrations were measured bi-
weekly using ion-specific meters (Cardi, Spectrum Technologies,
Inc., Plainfield, IL) (Olson et al., 2005). In trial 1, the Fusarium crown rot caused by the fungus, Fusarium oxysporum f.sp. radicis-lycopersici first apparent on 12 Jan 05. The number of affected plants per plot increased through 2 Feb 05, the final reading date during season 2004-05 season. At the same location in the 2005-06 season, crown rot symptoms appeared on 10 Jan 06. and the disease progressed until the final reading date of 2 Feb 06. Plants in trial 3 were rated for disease severity of bacterial spot caused by species of the bacteria Xanthomonas, on 2 Jan 06. Six sub-samples were randomly selected within the treatment plots and plants were rated visually by estimating the area of symptomatic leaf tissue.
Harvested plots were 15 to 22 22-ft long row segments of 10 plants. They were clearly marked to prevent unscheduled harvest by commercial crews. Marketable green and color tomatoes were graded in the field according to USDA specifications of number and weight of extra-large (5x6), large (6x6), and medium (6x7) fruit (USDA, 1997) of green and color. Yield data were subjected to analysis of variance (ANOVA) mean separation using Duncan’s Multiple Range Test at the 5% level of significance. Disease severity ratings were examined with ANOVA and treatment means differences were tested for significance by Tukey’s multiple comparison procedure.
Southwestern Florida tomato growers harvest mature-green tomatoes in the fall/winter and early spring market windows. Grower prices for fresh tomatoes are set daily and are sensitive to market supplies. Imported tomatoes from Mexico, Europe and Canada compete during the same market windows. In addition, during many seasons, production from other areas in Florida overlaps with the southern Florida tomato harvest.
UF-IFAS research has indicated that Florida tomato growers should be able to achieve maximum economic yield with 200 lb/acre N, but many southwest Florida tomato growers are extremely reluctant to apply this rate. They believe that a 50 % increase to 300 lb/acre N is necessary to support higher yield, thus increasing the likelihood of a favorable economic outcome.
Two economic considerations support grower preference for higher N fertilization rates. First, N fertilizer represents a minimal portion of total tomato production cost. Second, it is in the grower’s economic interest to strive for maximum production. Fresh tomato production is a financially intensive enterprise. More than $13,000 is required to plant, grow, harvest, pack, and market one acre of tomatoes. Total fertilization costs (N, P, K, and micronutrients) are estimated to be less than 3% of total costs (Smith and Taylor, 2004). In contrast, fertilizer applied by corn grain farmers in Mississippi represents close to 30% of their total costs production (Mississippi State University, 2005). Given the greater relative importance of fertilizer costs, a Mississippi corn farmer will be much more likely to adjust fertilization rates in the production budget, a Mississippi corn farmer is more likely to adjust fertilizer rates than a Florida tomato grower in response to changes in either commodity or fertilizer prices.
The fresh tomato market is highly volatile. Prices can change on a weekly or even daily basis. The break-even price for a southwest Florida tomato grower is estimated to be more than $9 per 25-lb carton (Smith and Taylor, 2004). Clearly, if market prices are above the break-even point, overall net returns is enhanced

- 18 -
with every additional carton that can be harvested and packed. More interestingly, a grower’s goal for maximum production is just as strong when prices are below break-even but above the unit cost to harvest, pack, and sell a carton of tomatoes. Within this range of market prices, each additional box of tomatoes lessens the total financial loss for that particular field or block. Hence, under most market conditions, a grower’s objective to maximize production corresponds with his or her economic interests. If production with 200 lb/acre N is less than with 300 lb/acre N, a grower is being financially compromised.
The only situations that a lower fertilization rate can be economically justified are when either the market price is below the unit cost to harvest, pack, and sell, or when the value of additional production from an increased N rate does not cover the added fertilization costs. Given fertilizer costs, market prices, harvest, and post-harvest costs, one can compute the threshold production required to economically justify additional N fertilizer. A graph of yield thresholds is generated from the following generic equation:
FERT ($/ac) + [HARV ($/ctn) * YIELD (ctn/acre)] = PRICE ($/ctn) * YIELD (ctn/acre)
Where,FERT: added cost of additional fertilizer (i.e. nitrogen);HARV: unit cost to harvest, pack, and market one carton
of tomato;YIELD: additional yield gained from the additional
application of fertilizer;PRICE: market price of a sold carton of tomatoes.
RESULTS AND DISCUSSIONWeather conditions and supplemental fertilizer
applications. Hurricane Wilma crossed over south Florida on October 24, 2005 with 100 miles/h winds and heavy rain. Tomato stems, branches, leaves, flowers, and fruits were blown from plants and entire fields were flooded for more than 8 h. Rainfall recorded by growers during the 2005-2006 season showed accumulations of 18, 6 and 5 inches for fall, winter and spring, respectively (Table 2). Local weather variability within a geographical area can extremely high during the fall particularly as related to the number of leaching rains. Therefore, is important that growers have a working gauge installed to record daily rainfall at each farm location. The IFAS tomato fertilizer recommendation allows supplemental N and K fertilizer applications in specific situations (Maynard et al., 2003), as does the BMP manual (Simonne and Hochmuth, 2003). Under this recommendation, 30 lb/acre of N can be added for each leaching rain event. Therefore, using fall 2005 as an example, a supplemental application of 90 lbs/acre of N fertilizer was permissible due to three leaching rains. However, N fertilizer application rates were 32, 112, and 60 lbs/acre in trials 1, 2 and 3, respectively. No fertilizer addition due to leaching rain was justified during the winter and spring seasons, so N fertilizer application consisted of the base 200 lbs/acre rate only (Olson et al., 2005). These results suggest that analysis and prediction of leaching rain frequency and timing would be valuable for Florida’s vegetable growing areas. Overall, Southwest Florida was hot and
wet throughout the fall, and cool and dry during the winter and spring of 2005-2006.
Irrigation management. The BMP trial acreage was irrigated 80% by seepage and 20% by drip systems. Seepage irrigation supplies water to the root zone through upward capillary movement (upflux) from an artificially-regulated shallow water table. Since drip irrigation systems supply water to the plant through plastic tubing installed under the plastic mulch, it is possible to more precisely control water and fertilizer applications. The water table in the seepage-irrigated trials fluctuated between about 16 to 20 inches deep and tensiometer readings were between 4 and 8 kPa. Higher soil moisture and water tables were observed during the fall season due to hurricane Wilma. In the drip-irrigated fields, water was applied daily at a volume estimated from the Weather Service Class A Pan evaporation combined with a crop coefficient. The water table depth in drip irrigated trials was lower than in seepage trials, ranging from about 20 to 30 inches. Previous research with seepage irrigation showed that tomato yield was not reduced when water table depth was maintained near 20 inches (Stanley and Clark, 2003). While maintaining a lower water table resulted in reduced water use in that experiment, water table depth fluctuations are likely to occur in large fields because the depth of the restrictive layer supporting the water table may fluctuate in large fields.
Biomass accumulation. Treatment differences in plant dry weight 30 DAT for all trials and seasons and final dry weight biomass in one trial were not significant different. Only in trial 5, which was drip-irrigated, did the higher N rate produce significantly greater final tomato plant dry weight than the lower rate. Overall, N rates had little effect on tomato biomass regardless of sampling date. This observation contradicts the common concept of judging crop yield potential by the size and color of the plants.
Plant nutritional status. Petiole sap NO3-N and K
concentrations tended to be above the UF-IFAS sufficiency threshold throughout the season at all eight locations and under all N treatments, except for trial 7 where the K was lower than the sufficiency range. Although the higher N rates produced tomato sap NO
3-N concentrations that were greater compared with
the lower rates, the N nutrition of plants that received either N rate was “sufficient”. Sap data suggest that tomato plants were sufficient in N and K regardless of N rate despite experiencing a hurricane, hot and wet weather conditions in the fall, and a cool and dry condition during winter and spring. Hence, monitoring NO
3-N sap content as a routine monitoring tool does not seem to
be a practical technique and BMP. For drip, irrigation, it may have a value since fertilizer is injected daily, weekly or bi-weekly, but it is not practical for a large farm. Both irrigation methods, petiole sap testing or whole leaf analysis should be used when problems are suspected.
Disease incidence. The plots with the lowest N rate in trial 1 (200 lb/acre) expressed the highest disease incidence with an average of 53% symptomatic plants in the 2004-2005 season. The other three treatments (236, 260 or 260 lb/acre N plus biosolids)

- 19 -
had 10%, 27%, and 20% average disease incidence, respectively. In contrast to the 2004-2005, the plots with the highest rate of N contained the greatest number of affected plants in 2005-2006. The rate that previously had the most incidences, 200 lb/acre N, had the lowest incidence of Fusarium crown rot in the 2005-06 season. On 17 Jan 06, significant differences were detected among treatments for the low rate of N plus compost compared with the high N rate. However, comparison of treatments by the area under the disease progress (AUDPC) did not detect significant differences between treatments. In trial 3, no significant differences were detected between treatments for the severity of bacterial spot, which were 19% and 13% disease severity for the grower and IFAS treatments, respectively. The nutritional status of the plant can have an impact on susceptibility to certain diseases. In general, plants containing higher N concentration are associated with increased susceptibility to diseases caused by Fusarium spp. That association was not observed in the current study.
Yield response to N rates. There were no significant yield differences in the first, second, third and total harvests for all size categories during the fall (P<0.05) (Fig 1). Lack of N response was probably due to the extra fertilizer applied after hurricane Wilma, and to the three leaching rains that occurred (Table 2). Higher N fertilizer rates produced higher yields for large and medium fruits at third harvest during the winter. Only one trial produced greater extra-large yield with a lower N rate during the winter. In the spring, higher N fertilizer rates increased large fruit yield at first and second harvest, but most of the yield differences were found in the third and total harvests for all size categories. Only one trial produced greater total extra-large fruit yields at the lower N rate during spring. These results illustrate that the 200 lb/acre N rate produced lower large and medium yield at third harvest compared with higher rates during a cool and dry growing season. These results show that it may be possible to reduce N rates especially when the risk of rainfall is low (winter and spring), or when only two harvests are expected (late spring). The actual rate needs to be adjusted based on planting date.
Economical analysis. Figure 2 shows yields that would be required to pay for an additional 100 lb/acre of N fertilizer across a range of market prices from $4.50 to $18.50/box of tomatoes. The additional N is valued at $40/acre to reflect fertilizer costs during the 2005-06 seasons. Figure 2 further assumes that $3.50 is required to harvest, pack, and market each carton of fruit. As market prices increase, the yield threshold decreases dramatically. When market prices are at $4.50/box, an additional 40 cartons of tomatoes/acre would be needed to cover a $40/acre increase in N fertilization cost. When the market price increases to $10.50/box, less than six additional cartons per acre have to be sold before the added fertilizer cost is covered. Figure 2 demonstrates that at current costs for fertilizer, harvesting, packing, and marketing, the yield threshold for an additional 100 lb/acre N fertilizer is low. Given field variability, it is unlikely that differences in yields will be able to detect these small amounts. All points above the yield threshold curve in Figure 2 represent a positive return to the grower from using 100 additional lb/acre N. However, since N fertilizer efficiency decreases as rate increases, the unused N
will be left in the field and could potentially cause a water quality problem if it moves off site.
Data from the second year of the southwest Florida Nitrogen BMP study have yet to produce conclusive results as to a presence and/or magnitude of yield differences between N fertilizer rates. In six trials conducted during the fall, winter and spring, only one produced statistically significant yield differences between the 200 lb/acre N recommended rate and a higher grower-standard rate. In fact, in three of the six trials, total yields were numerically greater when using the recommended rate. Of the two trials conducted during spring 2006, one produced significant yield increases at N rates of 300 lbs /acre. The other showed that higher N rates produced significantly higher yields during the second harvest. For total harvest, however, the lower N rate produced numerically higher yields, but differences were not statistically significant. Conclusive results describing the yield effects of various N fertilization rates should not be expected until several years of data can be pooled together. As the data accumulate, statistical differences may become more apparent or a trend may develop. It is important to recognize that yield variability across seasons will be another economic factor to consider. In any given year, climate and other growing conditions may not combine to produce significant yield differences between lower and higher N fertilization rates. Consequently, the added fertilizer may in fact depress grower returns. But in another year, when more favorable growing conditions exist, the added fertilizer may support significantly higher production. Growers make fertilization decisions in a state of uncertainty with regard to seasonal growing and market conditions. The added economic return during a favorable year may more than offset the costs incurred during the previous years.
What cannot be incorporated into this analysis is the environmental risk of excess N leaving the field. Whether N is an environmental hazard in southwest Florida remains an open question. However, whether it is a problem or not, environmental costs are not part of a grower’s current decision-making process. If N proves to be a real environmental threat, then public policy either through regulation or incentive payments will be needed to force changes in N fertilization rates beyond the direct impact on production. Direct monitoring of nutrient movement in and out of the field may be needed to determine if commercial use of N rates higher than the BMP standard detrimentally affects off-site water quality.
Grower participation in the project. Growers were highly engaged in the project and we developed strong successful partnerships during the 2005-2006 growing season. Growers provided input in determining fertilizer rates before the season and helped apply the treatments. We noticed that similar rates may be achieved by different combinations of cold and hot mix, and/or different numbers (1 or 2) of hot bands. While for research purposes it was preferable to refer to each situation as a rate, each situation represented a different fertilization program. Project leaders made bi-weekly visits to six trials and weekly visits to two trials throughout the growing season to discuss progress toward the goals and to review in-season bi-weekly and weekly progress reports. These progress reports were farm-by-farm records of sap

- 20 -
petiole analyses, water table depth, dry matter accumulation, and yield. Additionally, growers received a final report at the end of the season. Although not a direct part of this project, the connection between irrigation and fertilizer management was discussed. It became clear that limited irrigation scheduling may be done when using a seepage system. The constraint of applying all the fertilizer at the beginning of the season when seepage irrigation is used increases the potential risk of nutrient leaching. However, the risk may be reduced if drip irrigation or mixed systems are used.
Educating farm employees about plant nutrient management was also an important part of the project. For example, employees of several farms were trained in the use of ion-specific electrodes (Cardy meter, Spectrum Technol., Plainfield, Ill.) to monitor sap NO
3-N and K concentrations, and to interpret the results.
In conclusion, results from these second-year trials are encouraging and indicate that this project is on track to achieve its objectives.
SUMMARY
1. There were no treatment differences in plant dry weight 30 DAP and final dry biomass in all trials, except in trial 5 where final biomass was higher with higher N rates.
2. Petiole sap NO3-N and K concentrations throughout the season
tended to be above the UF-IFAS sufficiency threshold for all N treatments in all trials, but differed depending on irrigation system type.
3. The rate that in previous year had the most incidences, 200 lb/acre N, had the lowest incidence of Fusarium crown rot in the 2005-06 season.
4. During the fall there were no differences in yield due to extra addition of fertilizer application to compensate for the loss of N due to hurricane Wilma. Fertilizer N application greater than 200 lbs/acre produced higher yields of large and medium fruits at third harvest during the winter and spring season. However, in some situations lower N fertilizer rates increased extra-large fruit yield.
5. The optimum N fertilizer rate for tomato is not a simple “one size fits all”. Recommendations should consider irrigation method (seepage or drip irrigation), growing season (fall, winter and spring) requiring from 15 to 20 weeks from planting to harvest.
6. Tomato yield can fluctuate widely by season and year due to changing weather conditions. Prices are also volatile, which creates an unpredictable economic situation. Nitrogen fertilizer is a minimal production system cost, so growers treat it as inexpensive insurance.
7. A high level of grower engagement created a popular BMP testing program. Cooperating growers indicated willingness to continue testing N rates lower than their standard next year.
8. Fertilizer applied at higher than recommended rates theoretically increased the risk of negative environmental impact. This risk needs to be quantitatively assessed, compared with the economical risk of profit, and possibly reduced through the use of targeted cost-share programs.
LITERATURE CITEDDangler, J.M. and S.J. Locascio. 1990. Yield of trickle-irrigated tomatoes as affected by time of N and K application. J. Amer. Soc. Hort. Sci. 115(4):585-589.
Hochmuth, R., D. Dinkins, M. Sweat, and E. Simonne. 2003. Extension programs in Northeastern Florida help growers produce quality strawberries by improving water and nutrient management, EDIS HS-956, http://edis.ifas.ufl.edu/HS190.
Locascio, S.J. and A.G. Smajstrla. 1989. Drip irrigated tomato as affect by water quantity and N and K application timing. Proc. Fla. State Hort. Soc. 102:307-309.Locascio, S.J., S.M. Olson, and F.M. Roads. 1989. Water quantity and time of N and K application for trickle-irrigated tomatoes. J. Amer. Soc. Hort. Sci 114(2):265-268.
Locascio, S.J. and A.G. Smajstrla. 1996. Water application scheduling by pan evaporation for drip-irrigated tomato. J. Amer. Soc. Hort. Sci. 121(1):63-68.
Locascio, S.J., G.J. Hochmuth, F.M. Roads, S.M. Olson, A.G. Smajstrla, and E.A. Hanlon. 1997. Nitrogen and potassium application scheduling effects on drip-irrigated tomato yield and leaf tissue analysis. HortScience 32(2):230-235.
Mississippi State University. 2005. Corn conventional tillage, non-irrigated 8-row 38” 135 yield goal, Delta Region. Mississippi State University, Dept. of Agricultural Economics Budget Report 2005-03, December 2005, 81 pages. http://www.agecon.edu/Budgets/MSUCORN06.pdf.
Muchovej.,M, E.A. Hanlon, E. McAvoy, M. Ozores-Hampton, F.M. Roka, S. Shukla, H. Yamataki, and K. Cushman. 2005. Vegetable Production on the Sandy Soils of Southwest Florida. EDIS (In Press).
Olson, S.M., Maynard, D.N., G.J. Hochmuth, C.S. Vavrina, W.M. Stall, T.A. Kucharek, S.E. Webb, T.G. Taylor, S.A. Smith, and E.H. Simonne. 2005. Tomato production in Florida, EDIS, HS-739, http://edis.ifas.ufl.edu/CV137.
Pitts, D.J., G.A. Clark, J. Alvarez, P.H. Everett, and J.M. Grimm. 1988. A comparison of micro to subsurface irrigation of tomatoes. Proc. Fla. State Hort. Soc. 101:393-397.
Prevatt, J.W., C.D. Stanley, and A.A. Csizinski. 1981. An economic evaluation of three irrigation systems for tomato production. Proc. Fla. State Hort. Soc. 94:166-169.
Simonne, E.H. and G.J. Hochmuth. 2003. Supplemental fertilizer application for vegetable crops grown in Florida in the BMP era, EDIS HS-906, http://edis.ifas.ufl.edu/HS163
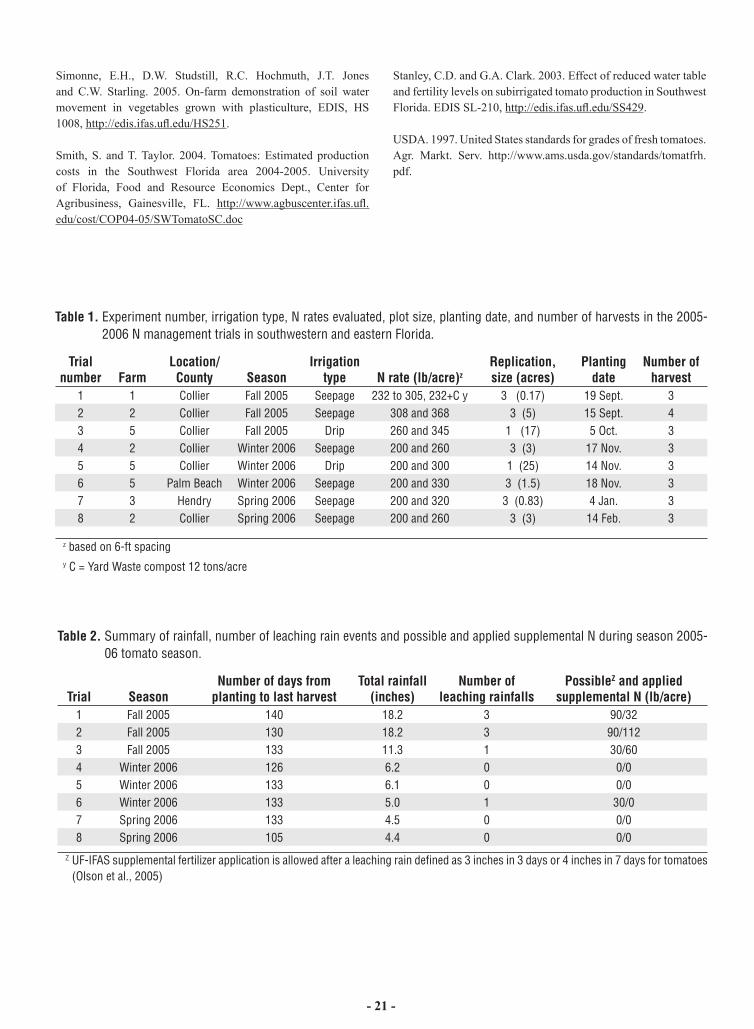
- 21 -
Simonne, E.H., D.W. Studstill, R.C. Hochmuth, J.T. Jones and C.W. Starling. 2005. On-farm demonstration of soil water movement in vegetables grown with plasticulture, EDIS, HS 1008, http://edis.ifas.ufl.edu/HS251.
Smith, S. and T. Taylor. 2004. Tomatoes: Estimated production costs in the Southwest Florida area 2004-2005. University of Florida, Food and Resource Economics Dept., Center for Agribusiness, Gainesville, FL. http://www.agbuscenter.ifas.ufl.edu/cost/COP04-05/SWTomatoSC.doc
Stanley, C.D. and G.A. Clark. 2003. Effect of reduced water table and fertility levels on subirrigated tomato production in Southwest Florida. EDIS SL-210, http://edis.ifas.ufl.edu/SS429.
USDA. 1997. United States standards for grades of fresh tomatoes. Agr. Markt. Serv. http://www.ams.usda.gov/standards/tomatfrh.pdf.
Table 1. Experiment number, irrigation type, N rates evaluated, plot size, planting date, and number of harvests in the 2005-2006 N management trials in southwestern and eastern Florida.
Trial number Farm
Location/County Season
Irrigation type N rate (lb/acre)z
Replication,size (acres)
Planting date
Number of harvest
1 1 Collier Fall 2005 Seepage 232 to 305, 232+C y 3 (0.17) 19 Sept. 32 2 Collier Fall 2005 Seepage 308 and 368 3 (5) 15 Sept. 43 5 Collier Fall 2005 Drip 260 and 345 1 (17) 5 Oct. 34 2 Collier Winter 2006 Seepage 200 and 260 3 (3) 17 Nov. 35 5 Collier Winter 2006 Drip 200 and 300 1 (25) 14 Nov. 36 5 Palm Beach Winter 2006 Seepage 200 and 330 3 (1.5) 18 Nov. 37 3 Hendry Spring 2006 Seepage 200 and 320 3 (0.83) 4 Jan. 38 2 Collier Spring 2006 Seepage 200 and 260 3 (3) 14 Feb. 3
z based on 6-ft spacing y C = Yard Waste compost 12 tons/acre
Table 2. Summary of rainfall, number of leaching rain events and possible and applied supplemental N during season 2005-06 tomato season.
Trial SeasonNumber of days from
planting to last harvestTotal rainfall
(inches)Number of
leaching rainfalls PossibleZ and applied
supplemental N (lb/acre)1 Fall 2005 140 18.2 3 90/322 Fall 2005 130 18.2 3 90/1123 Fall 2005 133 11.3 1 30/604 Winter 2006 126 6.2 0 0/05 Winter 2006 133 6.1 0 0/06 Winter 2006 133 5.0 1 30/07 Spring 2006 133 4.5 0 0/08 Spring 2006 105 4.4 0 0/0
Z UF-IFAS supplemental fertilizer application is allowed after a leaching rain defined as 3 inches in 3 days or 4 inches in 7 days for tomatoes (Olson et al., 2005)

- 22 -
Fig 1. Effect of N rates on tomato yield during season 2005-06.
FirstHarvest
(boxes/acre)Trial XL L M Total
Fall1 230 to 305 ns ns ns ns2 305 vs. 370 ns ns ns ns3 260 vs. 345 (drip) ns ns ns ns
Winter4 200 vs. 260 ns ns ns ns5 200 vs. 300 (drip) IFAS ns ns IFAS6 200 vs. 330 ns ns ns ns
Spring7 200 vs. 320 ns GROWER ns GROWER8 200 vs. 260 ns ns ns ns
SecondHarvest
(boxes/acre)Trial XL L M Total
Fall1 230 to 305 ns ns ns ns2 305 vs. 370 IFAS ns ns ns3 260 vs. 345 (drip) ns ns ns ns
Winter4 200 vs. 260 ns ns ns ns5 200 vs. 300 (drip) ns ns ns ns6 200 vs. 330 ns ns ns ns
Spring7 200 vs. 320 ns GROWER ns ns8 200 vs. 260 IFAS ns GROWER ns
Tomato Yields First HarvestSeason 2005-06
0200400600800
1,0001,2001,4001,6001,8002,000
150 200 250 300 350
N Rate (lb/acre)
Yie
lds
(bo
xes/
acre
)
Fall
Winter
Spring
Tomato Yields Second HarvestSeason 2005-06
0
200
400
600
800
1,000
1,200
1,400
150 200 250 300 350
N Rate (lb/acre)
Yie
lds
(bo
xes/
acre
)
Fall
Winter
Spring
Tomato Yields Third HarvestSeason 2005-06
0
200
400
600
800
1,000
150 200 250 300 350
N Rate (lb/acre)
Yie
lds
(bo
xes/
acre
)
Fall
Winter
Spring
ThirdHarvest
(boxes/acre)Trial XL L M Total
Fall1 230 to 305 ns ns ns ns2 305 vs. 370 IFAS ns ns ns
3 260 vs. 345 (drip) ns ns ns ns
Winter4 200 vs. 260 ns GROWER GROWER GROWER
5 200 vs. 300 (drip) ns ns GROWER GROWER
6 200 vs. 330 ns ns ns nsSpring
7 200 vs. 320 GROWER GROWER GROWER GROWER
8 200 vs. 260 ns ns ns ns

- 23 -
Tomato Yields Total HarvestSeason 2005-06
0
500
1,000
1,500
2,000
2,500
3,000
3,500
4,000
4,500
150 200 250 300 350N Rate (lb/acre)
Yie
lds
(bo
xes/
acre
)
Fall
Winter
Spring
ThirdHarvest
(boxes/acre)Trial XL L M Total
Fall1 230 to 305 ns ns ns ns2 305 vs. 370 ns ns ns ns
3 260 vs. 345 (drip) ns ns ns ns
Winter4 200 vs. 260 ns ns ns ns
5 200 vs. 300 (drip)
GROWER ns GROWER ns
6 200 vs. 330 ns ns ns nsSpring
7 200 vs. 320 ns GROWER GROWER GROWER
8 200 vs. 260 IFAS ns ns ns
Z 25-lb tomatoes/boxy XL = Extra-large (5x6 industry grade); L = Large (6x6); M = Medium (6x7)x C = Yard waste compost 12 tons/acrew growers, Ifas Significant and ns non-significant at P <0.01.
Fig. 2. Yield threshold curve for prices ranging from $4.50 to $18.50 per carton and for increasing N fertilizer from 200 to 300 lb/acre N, assuming nitrogen costs of $.40 per lb and harvesting/packing/selling costs of $3.50 per carton.
40.0
13.3
2.73.13.64.45.7
8.0
0
5
10
15
20
25
30
35
40
45
4.50 6.50 8.50 10.50 12.50 14.50 16.50 18.50Price ($/ctn)
Yie
ld (
ctn
/acr
e)
Yield

- 24 -
Whitefly Resistance Update and Proposed Mandated Burn Down Rule
David J. Schuster1, Raj Mann1, and Phyllis R. Gilreath2
1 UF/IFAS, Gulf Coast Research & Education Center, Wimauma, [email protected]
2 UF/IFAS, Manatee County Extension Service, Palmetto
INTRODUCTIONA severe outbreak of Tomato yellow leaf curl virus (TYLCV)
in west-central Florida in the spring of 2006 emphasizes that the vector of the virus, the silverleaf whitefly (SLWF), Bemisia argentifolii Bellows & Perring [also known as biotype B of the sweetpotato whitefly, B. tabaci (Gennadius)], remains the key pest of tomatoes in southern Florida. The virus outbreak occurred despite applications of the neonicotinoid Admire Pro® (imidacloprid; Bayer CropScience, Research Triangle Park, NC) to seedlings in plant production houses and additional soil applications of either Admire or Platinum® (thiamethoxam; Syngenta Crop Protection, Inc., Greensboro, NC), another neonicotinoid, and despite weekly or more frequent foliar applications of additional insecticides targeting whitefly adults. Other foliar applications of insecticides targeted nymphs as the controlling effects of Admire or Platinum diminished.
Foliarly applied insecticides included Fulfill® (pymetrozene; Syngenta Crop Protection, Inc., Greensboro, NC), Monitor® (methamidophos; Valent U.S.A. Corporation, Walnut Creek, CA), malathion (numerous suppliers), pyrethroids (numerous products and suppliers), endosulfan (several suppliers), Knack® (pyriproxyfen; Valent U.S.A. Corporation, Walnut Creek, CA), Courier® (buprofezin; Nichino American, Inc., Wilmington, DE) soap and oil. Results were mixed and residual control was short. Most growers refrained from making foliar applications of neonicotinoids including Provado® (imidacloprid; Bayer CropScience, Kansas City, MO) and Assail® (acetamiprid; Cerexagri, Inc., King of Prussia, PA) after nymphal control with Admire or Platinum declined, because this practice could encourage the development of resistance to the neonicotinoid insecticides (Elbert and Nauen 2000).
There are several possible causes of the TYLCV outbreak this past spring. The most important cause was the occurrence of hurricane Wilma which destroyed or severely damaged tomato plantings in southwestern and southeastern Florida. As a result, fall production fields in west central Florida were held longer than usual, with harvesting continuing into February and even March. These fields overlapped with spring plantings and served as reservoirs of migrating, viruliferous whitefly adults. Net house studies have suggested that Admire is less effective in managing whitefly adults, and the resulting transmission of TYLCV, than in managing whitefly nymphs (Rubenstein et al. 1999). Efficient and intensive whitefly adult management is, therefore, required to reduce TYLCV incidence (Holt et al. 1999). Unfortunately, growers and scouts have reported difficulty in controlling adults with pyrethroids, pyrethroid/organophosphate combinations and endosulfan. Declining susceptibility of whitefly adults to the neonicotinoids, as was shown for Admire from 2001 to 2003
(Schuster et al. 2003), could also contribute to an increase in TYLCV incidence; however, susceptibility of whitefly adults to Admire had actually increased in 2004 (Schuster and Thompson 2004) and 2005 (Fig. 1). Thus, monitoring for potential insecticide resistance and strict adherence to whitefly and resistant management recommendations are needed to help reduce or eliminate outbreaks.
NEONICOTINOID RESISTANCE MONITORINGA program to monitor the susceptibility of field populations
of the SLWF to Admire and Platinum using a cut leaf petiole method was initiated in 2000 and continued in 2006 (Schuster and Thompson 2001, 2004; Schuster et al. 2002, 2003). Bioassays were conducted using adults reared from foliage infested with nymphs that had been collected from each tomato field. Standard probit analyses (SAS Institute 1989) were used to estimate the LC
50 values (the concentration estimated to kill 50% of the
population) for a laboratory colony and for each field population. The laboratory colony used as a susceptible standard in this study has been in continuous culture since the late 1980’s without the introduction of whiteflies collected from the field and, therefore, would be expected to be particularly susceptible to insecticides. The relative susceptibility (RS
50) of each field population compared
to the laboratory colony was calculated by dividing the LC50
values of the field populations by the LC
50 value of the laboratory
colony. Increasing values greater than one suggest decreasing susceptibility in the field population. While values approaching 8 could indicate decreasing susceptibility of the whiteflies, such variability is not unexpected when comparing field-collected insects with susceptible, laboratory-reared insects. Values of 10 or greater, especially those of 20 or higher, are sufficiently high to draw attention.
Average RS50
values for Admire increased from 2000 to 2003, but decreased in both 2004 and 2005, although only two populations were bioassayed in 2005 (Fig. 1). Average RS
50 values
for Platinum increased from 2003 to 2005. In 2006 average RS50
values jumped tremendously for both Admire and Platinum. The maximum RS
50 values observed were about 60 and 53 for Admire
and Platinum, respectively. These values are much higher than any observed in previous years, especially for Platinum. The results indicate a sudden reduction in susceptibility of whitefly adults to both products; however, different persons have conducted the bioassays over each of the last three years, which could contribute to annual differences. New baseline RS
50 values for the lab colony
were obtained for each of the persons for each of the years, which would help ameliorate any bias among the three persons. The largest potential for bias among persons is involved in deciding whether a whitefly adult is alive, dead, or moribund (dying); however, the senior author reviewed the criteria with each person. Therefore, susceptibility to Admire and Platinum appears to have decreased in 2006, which should prompt growers to stringently adhere to resistance management recommendations.
Biotype Q of the sweetpotato whitefly is the most prevalent biotype in the Mediterranean region and has plagued greenhouse-grown crops in southern Spain for years. This biotype is resistant to many of the commonly used insecticides for managing

- 25 -
whiteflies, including the pyrethroids, neonicotinoids, pymetrozine and insect growth regulators (Courier and Knack). Furthermore, resistance in biotype Q is more stable than that in biotype B, i.e. resistance does not diminish over time. Biotype Q has now been found in greenhouses and nurseries in 22 states including Florida. Although the biotype has not been detected in the field, it represents a new threat to vegetables and other crops in Florida. Strict adherence to management guidelines, especially those dealing with crop hygiene and cultural controls, is important in inhibiting or delaying the establishment of biotype Q in the field.
A Resistance Management Working Group was formed in 2003 to promote resistance management on a regional basis. The group modified previous resistance management recommendations (Schuster and Thompson 2001, 2004; Schuster et al. 2002, 2003) and met with growers to encourage their adoption. The Working Group consisted of University of Florida research and extension personnel, representatives of the chemical companies marketing neonicotinoid insecticides, representatives of commodity organizations, and commercial scouts. Because of the threat of biotype Q and decreased insecticide susceptibility, the group was expanded and met in May, 2006 to once again to discuss and revise the whitefly and resistance management recommendations. The recommendations include field hygiene and cultural practices which should be considered a high priority and should be included as an integral part of the overall strategy for managing whitefly populations, TYLCV incidence, and insecticide resistance. These practices will help reduce the onset of the initial infestation of whitefly and lower the initial infestation level during the cropping period, thus reducing insecticide use and selection pressure for insecticide resistance development. The recommendations also include insecticide use recommendations which help improve whitefly and resistance management.
Mandatory Burndown RuleOne outcome of whitefly, virus and resistance management
discussions has been the proposal of a mandatory “Tomato Plant Destruction” rule by the Florida Department of Agriculture and Consumer Services. The proposed wording of the rule at the time of this publication states:
“Within five days following the final harvest of a tomato crop, commercial tomato producers shall destroy remaining tomato plants on the production site using a chemical burn-down with a contact desiccant type herbicide that is EPA labeled and approved for this use such as paraquat that also contains a minimum three percent oil and a non-ionic adjuvant to destroy crop vegetation. This must be followed by immediate complete destruction by crop removal unless double cropping is planned.”
Furthermore, the rule provides for enforcement:
“The commercial tomato producer failing to destroy tomato plants within five days following final harvest as described shall be issued an immediate final order. An immediate final order issued by the department pursuant to this section shall notify the property owner that the tomato plants that are the subject of the immediate final order must be removed and destroyed unless the commercial tomato producer, no later than 10 days after delivery of the immediate final order requests and obtains a stay of the immediate final order from the district court of appeal with jurisdiction to review such requests. The commercial tomato producer shall not be required to seek a stay of the immediate final order by the department prior to seeking the stay from the district court of appeal. If the commercial tomato producer refuses or neglects to comply with the terms of the notice within 10 days after receiving it, the director or her or his authorized representative may, under authority of the department, proceed to destroy the tomato plants. The expense of the destruction shall be assessed, collected, and enforced against the commercial tomato producer by the department.”
This proposed rule is agreeable to most growers and is the first attempt to manage the whitefly/virus situation in tomatoes by regulatory enforcement. Some growers support defined, mandatory crop free periods in the summer while others do not. If progress is not made in the management the silverleaf whitefly and associated TYLCV, pressure may build for a regulatory rule stipulating crop destruct and crop planting dates.

- 26 -
RECOMMENDATIONS FOR MANAGEMENT OF WHITEFLIES, BEGOMOVIRUS, AND INSECTICIDE RESISTANCE FOR FLORIDA VEGETABLE PRODUCTION
A. Crop Hygiene. Field hygiene should be a high priority and should be included as an integral part of the overall strategy for managing whitefly populations, TYLCV incidence, and insecticide resistance. These practices will help reduce the onset of the initial infestation of whiteflies, both biotype B and biotype Q (if present), and lower the initial infestation level during the cropping period.
1. Establish a minimum two-month crop free period during the summer, preferably from at least mid-June to mid-August.
2 Use a correct crop destruction technique, which includes destruction of existing whitefly populations in addition to the physical destruction of the crop.
a. Promptly and efficiently destroy all vegetable crops within 5 days of final harvest to maximally decrease whitefly numbers and sources of plant begomoviruses like TYLCV.
b. Use a contact desiccant (“burn down”) herbicide in conjunction with a heavy application of oil (not less than 3 % emulsion) and a non-ionic adjuvant to destroy crop plants and to quickly kill whiteflies.
c. Time burn down sprays to avoid crop destruction during windy periods, especially when prevailing winds are blowing whiteflies toward adjacent plantings.
d. Destroy crops block by block as harvest is completed rather than waiting and destroying the entire field at one time.
B. Other Cultural Control Practices.Reduce overall whitefly populations, both biotype B and biotype Q (if present), by strictly adhering to cultural practices.
1. Use proper pre-planting practices. a. Plant whitefly- and virus-free transplants. 1) Do not grow vegetable transplants and vegetatively
propagated ornamental plants (i.e. hibiscus, poinsettia, etc.) at the same location, especially if bringing in plant materials from other areas of the US or outside the US.
2) Isolate vegetable transplants and ornamental plants if both are produced at the same location.
3) Do not work with or manipulate vegetable transplants and ornamental plants at the same time.
4) Practice worker isolation between vegetable transplants and ornamental crops.
5) Avoid yellow clothing or utensils as these attract whitefly adults.
6) Cover all vents and other openings with whitefly resistant screening. Use double doors with positive pressure. Cover roofs with UV absorbing films.
b. Delay planting new fall crops as long as possible. c. Do not plant new crops near or adjacent to old, infested
crops. d. Use determinant varieties of grape tomatoes to avoid
extended crop seasons. e. Use TYLCV resistant tomato cultivars (see additional
information below for list) where possible and appropriate, especially during historically critical periods of virus pressure. Whitefly control must continue even with use of TYLCV resistant cultivars because these cultivars can carry the virus.
f. Use TYLCV resistant pepper cultivars (see additional information below for list) when growing pepper and tomato in close proximity.
g. Use ultraviolet light reflective (aluminum) mulch on plantings that are historically most susceptible to whitefly infestation and TYLCV infection.
2. Use proper post-planting practices. a. Apply an effective insecticide to kill whitefly adults prior
to cultural manipulations such as pruning, tying, etc. b. Rogue tomato plants with symptoms of TYLCV at least
until second tie. Plants should be treated for whitefly adults prior to roguing and, if nymphs are present, should be removed from the field, preferably in plastic bags, and disposed of as far from production fields as possible.
c. Manage weeds within crops to minimize interference with spraying and to eliminate alternative whitefly and virus host plants.
d. Dispose of cull tomatoes as far from production fields as possible. If dumped in pastures for cattle feeding, the fruit should be spread instead of dumped in a large pile to encourage consumption by cattle. The fields should then be monitored for germination of tomato seedlings and, if present, they should be controlled by mowing or with herbicides.
e. Avoid u-pick or pin-hooking operations unless effective whitefly control measures are continued.
f. Destroy old crops within 5 days after harvest, destroy whitefly infested abandoned crops, and control volunteer plants with a desiccant herbicide and oil.
C. Insecticidal Control Practices.
1. Use a proper whitefly insecticide program. Follow the label!
a. On transplants in the production facility, do not use a neonicotinoid insecticide if biotype Q is present. If biotype B is present, apply a neonicotinoid one time 7-10 days before shipping. Use products in other chemical classes, including Fulfill, soap, etc. before this time.
b. Use neonicotinoids in the field only during the first six weeks of the crop, thus leaving a neonicotinoid-free period at the end of the crop.
c. As control of whitefly nymphs diminishes following soil drenches of the neonicotinoid insecticide or after more
- 27 -
than six weeks following transplanting, use rotations of insecticides of other chemical classes including insecticides effective against biotype Q. Consult the Cooperative Extension Service for the latest recommendations.
d. Use selective rather than broad-spectrum control products where possible to conserve natural enemies and enhance biological control.
e. Do not apply insecticides on weeds on field perimeters because this can kill natural enemies, thus interfering with biological control, and because this can select for biotype Q, if present, which is more resistant than biotype B to many insecticides.
2. Soil applications of neonicotinoid insecticides for whitefly control.
a. For best control, use a neonicotinoid as a soil drench at transplanting, preferably in the transplant water.
b. Soil applications of neonicotinoids through the drip irrigation system are not recommended.
c. Do not use split applications of soil drenches of neonicotinoid insecticides (i.e. do not apply at transplanting and then again later).
3. Foliar applications of neonicotinoid insecticides for whitefly control.
a. If foliar applications of a neonicotinoid insecticide are used instead of or in addition to soil drenches at transplanting, foliar applications should be restricted to the first six weeks after transplanting. Do not exceed the maximum active ingredient per season according to the label.
b. Follow scouting recommendations when using a foliar neonicotinoid insecticide program. Rotate to non-neonicotinoid insecticide classes after the first six weeks and do not use any neonicotinoid class insecticides for the remaining cropping period.
D. Do unto your neighbor as you would have him do unto you.
1. Look out for your neighbor’s welfare. This may be a strange or unwelcome concept in the highly
competitive vegetable industry but it is in your best interest to do just that. Growers need to remember that should the whiteflies develop full-blown resistance to insecticides, especially the neonicotinoids, it’s not just the other guy that will be hurt—everybody will feel the pain! This is why the Resistance Management Working Group has focused on encouraging region-wide cooperation in this effort.
2. Know what is going on in the neighbor’s fields. Growers should try to keep abreast of operations in upwind
fields, especially harvesting and crop destruction, which both disturb the foliage and cause whitefly adults to fly. Now that peppers have been added to the list of TYLCV hosts, tomato growers will need to keep in touch with events in that crop as well.
FOR ADDITIONAL INFORMATION:IRAC (Insecticide Resistance Action Committee) Website – http://www.irac-online.org.
More suggestions for breaking the whitefly/TYLCV cycle and a list of TYLCV resistant pepper cultivars can be found in articles by Dr. Jane Polston in the 2002 and 2003 Proceedings of the Florida Tomato Institute: http://swfrec.ifas.ufl.edu/veghort/docs/tom_inst_2002_091202.pdf and http://gcrec.ifas.ufl.edu/TOMATO%202003.pdf, respectively. TYLCV resistant tomato cultivars can be found in an article by Dr. Jay Scott in the 2004 Florida Tomato Institute Proceedings: http://gcrec.ifas.ufl.edu/TomatoOptimized.pdf.
ACKNOWLEDGMENTSThe authors wish to express their appreciation to Mary
Lamberts, Henry Yonce and Leon Lucas for identifying and/or collecting whitefly samples for the 2006 monitoring, and to Bayer CropScience for providing partial funding for the neonicotinoid resistance monitoring. Appreciation also is expressed to representatives of the Florida Tomato Committee, Florida Fruit and Vegetable Association, Bayer CropScience, Syngenta Crop Protection, Cerexagri Inc., Glades Crop Care, Agricultural Crop Consulting, Agri-Tech Services, and Integrated Crop Management, and to UF/IFAS personnel Alicia Whidden, Gene McAvoy, Jim Price and Phil Stansly for their participation in the Resistance Management Working Group and for their many contributions to the whitefly and resistance management recommendations.
REFERENCES CITEDElbert, A. and R. Nauen. 2000. Resistance in Bemisia tabaci (Homoptera: Aleyrodidae) to insecticides in southern Spain with special reference to neonicotinoids. Pest Management Sci. 56:60-64.
Holt, J., J. Colvin and V. Muniyappa. 1999. Identifying control strategies for tomato leaf curl virus disease using and epidemiological model. J. Appl. Ecol. 36:625-633.
Rubenstein, G., S. Morin and H. Czosnek. 1999. Transmission of tomato yellow leaf curl geminivirus to imidacloprid treated tomato plants by the whitefly Bemisia tabaci (Homoptera: Aleyrodidae). J. Econ. Entomol. 92:658-662.
SAS Instititute Inc. 1989. SAS/STAT User’s Guide, Version 6, Fourth Edition, Bol. E, SAS Institute Inc., Cary, NC.
Schuster, D. J. And S. Thompson. 2001. Monitoring susceptibility of the silverleaf whitefly to imidacloprid, pp. 16-18. In P. Gilreath and C. S. Vavrina [eds.], 2001 Fla. Tomato Institute Proc., Univ. Fla., Gainesville, PRO 518.

- 28 -
Schuster, D. J. And S. Thompson. 2004. Silverleaf whitefly resistance management update, pp. 19-25. In P. Gilreath and W. H. Stall [eds.], Fla. Tomato Institute Proc., Univ. Fla., Gainesville, PRO 521.
Schuster, D. J., S. Thompson, P. A. Stansly and J. Conner. 2002. Update on insecticides for whitefly and leafminer control, pp. 51-60. In P. Gilreath and C. S. Vavrina [eds.], 2002 Fla. Tomato Institute Proc., Univ. Fla., PRO 519.
Schuster, D. J., S. Thompson and P. R. Gilreath. 2003. What’s up with all these whiteflies?, pp. 12-19. In P. Gilreath and W. H. Stall [eds.], Fla. Tomato Institute Proc., Univ. Fla., PRO 520.
0
5
10
15
20
25
30
35
2000 2001 2002 2003 2004 2005 2006
Avg
RS50
9 (2) 14 (4) 10 (8)
6.7
9.9
14.7
3.7
3 (0) 11 (1)
6.1
2 (0)2.5
29.9
7 (6)
Fig. 1. Monitoring relative susceptibility (RS50
) of whitefly adults from nicotinoid-treated tomato fields to Admire (A) or Platinum (B) using a laboratory bioassay. Numbers at the top of the bars are the average RS
50 values and the numbers inside the bar are the number of
populations bioassayed and the number with RS50
values >10 (in parentheses).
0
5
10
15
20
25
30
2003 2004 2005 2006
27.2
6.1
2.01.85 (4)7 (1)3 (0)8 (0)
A
B
Avg
RS50

- 29 -
TYLCV-resistant Tomato Cultivar Trial and Whitefly Control
Kent Cushman and Phil StanslyUF/IFAS, Southwest Florida Research & Education Center, Immokalee
[email protected]; [email protected]
Commercial tomato growers in much of the rest of the country try to limit losses due to a disease vectored by thrips called Tomato Spotted Wilt Virus. Not so in south and central Florida. Here growers strive to limit losses due to Tomato Yellow Leaf Curl Virus (TYLCV), a disease vectored by whitefly and a problem we share in common with other tropical and semi-tropical regions of the world. This report presents results of two trials conducted in southwest Florida during Spring 2006 to evaluate management of TYLCV in commercial tomato plantings using resistant cultivars and whitefly control strategies.
Variety Trial. One way to control losses due to TYLCV is for the plant to do most of the work. Tomato cultivars resistant to TYLCV have been available for many years, but for one reason or another they have not been well received by Florida growers. Cultivars used on commercial farms must produce plants that are strong, disease resistant, and highly productive and that yield large, round fruit with good holding and shipping ability. Excellent choices are available, but often these cultivars were developed for other markets, such as markets that prefer smaller-sized fruit or a more flattened shape, or were developed in less humid areas.
Twelve entries of TYLCV-resistant cultivars and numbered breeders’ selections and one entry of a standard TYLCV-susceptible cultivar (Table 1) were evaluated in a replicated trial at the Southwest Florida Research and Education Center (SWFREC). Seed were planted in flats and grown on site. Plants were transplanted to the field on Feb. 20. Seed of Zeraim Gedera arrived late and were planted in flats and then transplanted to the field on Feb. 24. The crop was grown on raised beds with black plastic mulch and was irrigated and fertilized with drip tubing. A standard insect and disease control program was used throughout the duration of the crop, including an imidacloprid drench at transplant and whitefly control thereafter. The goal of the trial was to evaluate horticultural characteristics of each entry and not the level of virus resistance. Tomatoes were harvested three times, May 10, 24, and June 6. At each harvest, marketable fruit were separated by mature green and later maturities and then graded by size, counted, and weighed. Unmarketable fruit were separated by cull categories and also counted and weighed. The experimental design was a randomized complete block and data were statistically analyzed to determine significant differences.
Growing conditions were excellent with little rainfall and relatively warm, sunny days. Whitefly populations were low until the second harvest at which time populations became well established in the planting. At the time of final harvest, TYLVC-resistant cultivars had no virus-affected plants and susceptible cultivars had a low level of incidence (Table 1). The two entries
from Abbott & Cobb had higher levels of TYLVC disease than the standard cultivar Florida 47. A previous trial at this location experienced a high level of disease in susceptible cultivars (Gilreath et al. 2000).
HA 3075 (Hazera) produced the highest total yield, though its total yield was similar to that of ACR-2012 (Abbott and Cobb), S-50257, VT-60774, and VT-60780 (Zeraim Gedera). HA 3075 was the only entry to produce significantly greater total yield than ‘Florida 47’ (Table 2). HA 3075 also produced the highest yield of 5x6s, though yield of this size category was similar to that of Florida 47 (Table 3). Despite having the highest yield, HA 3075 did not produce the largest fruit in this size category. BHN 745 (BHN Seed) averaged 5x6 fruit of 9.4 ounces and this was similar to that of ‘Florida 47’ and ‘Tygress’ at 9.1 ounces each. HA 3075 averaged 8.3 ounces per fruit in the 5x6 size category. S-50260 produced the highest percentage of cull fruit, though its percentage of cull fruit was similar to that of HA 3074, Fla 8477, and BHN 745. Defects of fruit of S-50260 and Fla 8477 were mostly due to zipper scarring and catfacing. Fruit of S-50252 also exhibited a high percentage of zipper scarring and catfacing compared to most other entries.
In conclusion, several entries produced total yields equal to or better than the standard cultivar. Based on marketable yield, cull categories, and size and shape of marketable fruit, TYLCV-resistant entries from this trial that could be grown for observation in small blocks on commercial farms are HA 3075, S-50257, VT-60774, and VT-60780, and BHN 745.
Cultivars in Combination with Control Strategies. A trial was conducted at SWFREC to evaluate the interaction of cultivar and control strategies. One TYLCV-resistant cultivar, Tygress, and one TYLCV-susceptible cultivar, Florida 47, were planted 22 Feb. 2006 in raised beds with black plastic mulch and drip irritation. Whitefly control strategies were applied to cultivars in an unbalanced experimental design, with more treatments applied to ‘Florida 47’ than ‘Tygress’. All treatments (Table 4) were replicated four times.
Average numbers of whitefly adults during the first six weeks of the trial were low, but numbers increased dramatically during the later five weeks. Most adult whiteflies were observed on untreated ‘Tygress’ plants, although not significantly more than on the untreated ‘Florida 47’. Numbers of adults seen on plants treated with the low (8 oz) rate of Platinum followed by the standard spray combination were not different from either untreated check (Fig. 1). Fewest whiteflies were observed on plants treated with Admire at planting, then the low rate of NNI 0101, though not less than plants treated the same except with the higher rate of NNI 0101, in turn not significantly different from plants sprayed with the standard or with oil following the Admire drench. Fewest whitefly eggs were seen on plants sprayed following the Admire drench with the high rate of NNI 0101 twice and Courier once or weekly with JMS Stylet oil, with no differences compared to the untreated controls exhibited by the other treatments (Fig. 2). The checks were not significantly different in regard to small nymphs than the remaining treatments with significantly fewer of these seen in all remaining treatments. Fewest small nymphs were seen on plants treated with the high rate

- 30 -
of NNI 0101, though not significantly so compared to treatments with either rate of Platinum instead of Admire, or by substituting these sprays with the standard spray schedule or JMS Oil. More large nymphs were seen on unsprayed ‘Florida 47’ than unsprayed ‘Tygress’, with no differences between this latter control and all remaining treatments except the high (11 oz) rate of Platinum. Few plants were observed with symptoms of TYLCV throughout the course of the trial, and they aggregated in unusual ways with most seen on plants treated with 11 oz of Platinum followed by the standard spray schedule. However, no virus symptoms were seen on the ‘Tygress’ plants except for one possible case in an unsprayed plot, although this was not significantly different than the other treatments except for ‘Florida 47’ treated according to the standard schedule or the aforementioned Platinum and standard sprays. All treated plants yielded more marketable fruit than untreated plants, with most harvested from ‘Tygress’ receiving the standard treatment, though not significantly different from all but oil, Platinum and check plants. Similarly, fewest culls were taken from plants receiving the standard treatment regardless of variety, though not significantly less than plants receiving either rate of Platinum, NNI 0101 or oil.
In conclusion, resistant varieties showed little or no virus symptoms, resulting in a trend toward better yield although the difference was not significant, probably because of low virus incidence. However, unsprayed resistant or susceptible plants yielded the same. Nichino 0101, a growth inhibitor, provided control of whiteflies comparable to the standard treatment of adults. Weekly oil treatment after the Admire drench also provided good whitefly control although the yield suffered somewhat, comparable to plants treated with Platinum at the low rate followed by the standard sprays. Although this trial did not demonstrate a clear advantage to using the resistant variety under conditions of low virus pressure, neither was there any disadvantage. Thus, use of ‘Tygress’ in the spring growing season could provide an extra measure of security to the grower, over and above the standard insecticidal regime.
LITERATURE CITEDGilreath, P., P. Stansly, K. Shuler, J. Polston, T. Sherwood, G. McAvoy, and E. Waldo. 2000. Tomato yellow leaf curl virus resistant tomato variety trials. Proc. Fla. State Hort. Soc. 113:190-193.
Table 1. Cultivars and advanced breeder’s varieties evaluated in this study along with seed source, fruit shape, and percentage of diseased plants observed in the variety trial.
Variety SourceDiseased plants
(%)z
Florida 47 Seminis 5
Tygress Seminis 0
Fla 8477 UF/IFAS 0
BHN 745 BHN 0
HA 3074 Hazera 0
HA 3075 Hazera 0
ACR-242 Abbott & Cobb 8
ACR-2012 Abbott & Cobb 7
S-50252 Zeraim Gedera 0
S-50257 Zeraim Gedera 0
S-50260 Zeraim Gedera 0
VT-60774 Zeraim Gedera 0
VT-60780 Zeraim Gedera 0z Percentage of TYLVC-affected plants at end of trial, after third harvest. Values are means of four replications of 10-12 plants.

- 31 -
Table 2. Marketable yield by size category, percent of total yield at breaker stage or beyond, and average weight of 5x6 (extra-large), 6x6 (large), and 6x7 (medium) sized fruit.
Marketable yield (boxes/acre) z % Avg fruit wt (oz)
Treatments 5x6 6x6 6x7 Total Color 5x6 6x6 6x7
Florida 47 2,380 ab 158 h-j 226 e-g 2,760 b-e 30 ef 9.1 a 5.6 a-c 4.7 ab
Tygress 2,310 b 115 j 131 g 2,550 d-f 29 ef 9.1 a 5.5 a-d 4.6 a-d
Fla 8477 1,760 de 369 d-f 379 cd 2,500 ef 37 de 7.6 de 5.6 ab 4.7 a
BHN 745 2,240 bc 133 ij 184 fg 2,560 d-f 20 f 9.4 a 5.5 b-d 4.4 d
HA 3074 2,120 b-d 265 f-h 267 d-g 2,650 c-e 53 bc 8.2 bc 5.6 a-c 4.8 a
HA 3075 2,780 a 238 g-i 248 d-g 3,270 a 37 de 8.3 b 5.7 a 4.6 a-c
ACR-242 2,040 b-d 396 de 331 de 2,760 b-e 54 a-c 7.5 de 5.5 a-d 4.5 b-d
ACR-2012 2,200 bc 396 de 368 cd 2,960 a-c 44 cd 7.9 cd 5.7 a 4.8 a
S-50252 1,880 cd 519 bc 489 bc 2,880 b-d 63 a 7.4 ef 5.6 a-d 4.7 ab
S-50257 1,420 ef 757 a 761 a 2,940 a-c 64 a 6.9 g 5.5 dc 4.4 cd
S-50260 1,290 f 465 cd 481 bc 2,240 f 61 ab 7.1 fg 5.4 d 4.6 a-d
VT-60774 2,360 b 332 e-g 317 d-f 3,010 a-c 39 de 7.9 cd 5.5 b-d 4.6 a-d
VT-60780 1,880 cd 585 b 591 b 3,050 ab 61 ab 7.6 de 5.5 a-d 4.6 a-d
Significance <.001 <.001 <.001 0.001 <.001 <.001 0.063 0.017
z Marketable yield is mature green fruit plus later maturities but minus unmarketable (cull) fruit. Values are means of four replications of 10 or 12 plants. Means followed by the same letter are not statistically different at P≤0.05.
Table 3. Unmarketable (cull) categories and total unmarketable weight. Blossom end scar (BES), zipper and catface, sunscald and yellow shoulder (SS, YS), radial and concentric cracking (Crk), misshapen (Mspn), and other cull categories.
Unmarketable fruit by cull category (%) z Total Cull wt
Treatments BES Zip +Catface SS, YS Crk Mspn Other Total (boxes/acre)
Florida 47 0.3 de 4.5 f-h 0.5 1.2 c-e 1.8 ab 1.3 de 9.6 e-g 326 bc
Tygress 0.3 de 7.1 de 0.5 1.1 c-e 0.8 cd 2.5 bc 12.2 de 372 bc
Fla 8477 1.3 c 10.4 b 0.7 0.4 e 1.2 bc 3.8 a 17.8 ab 710 a
BHN 745 2.8 b 7.9 cd 0.5 2.1 bc 1.0 b-d 2.6 a-c 16.9 a-c 690 a
HA 3074 2.5 b 6.4 d-f 0.7 4.7 a 0.8 cd 3.0 ab 18.2 ab 726 a
HA 3075 1.1 cd 1.4 i 1.0 2.2 bc 1.4 bc 1.9 b-e 9.0 f-h 362 bc
ACR-242 0.6 c-e 2.7 hi 0.4 0.7 de 1.3 bc 2.1 b-d 7.7 gh 241 c
ACR-2012 3.7 a 5.3 e-g 0.5 1.8 b-d 2.3 a 2.0 b-e 15.6 bc 711 a
S-50252 0.7 c-e 9.9 bc 1.4 0.6 de 0.3 d 1.7 c-e 14.6 cd 592 a
S-50257 0.1 e 5.1 e-g 1.2 0.5 e 1.2 bc 0.9 e 8.9 f-h 322 bc
S-50260 0.3 de 13.7 a 1.7 0.4 e 0.7 cd 2.5 bc 19.3 a 700 a
VT-60774 0.4 de 3.2 g-i 1.4 2.9 b 0.7 cd 2.4 b-d 11.0 ef 419 b
VT-60780 0.7 c-e 1.5 i 1.3 0.4 e 0.9 b-d 1.7 c-e 6.5 h 229 c
Significance <.001 <.001 0.314 <.001 0.006 <.001 <.001 <.001
z Unmarketable (cull) categories reported as percentage of total number of marketable plus unmarketable fruit. Values are means of four replications of 10 or 12 plants. Means followed by the same letter are not statistically different at P≤0.05.
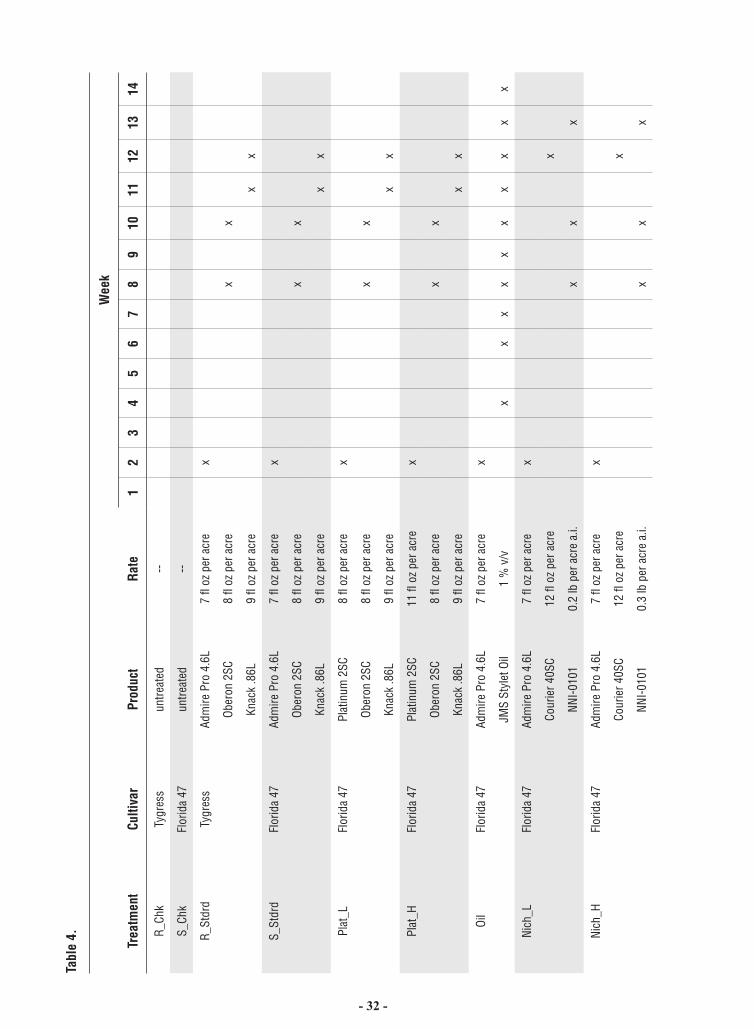
- 32 -
Tabl
e 4.
Wee
k
Trea
tmen
tCu
ltiva
rPr
oduc
tR
ate
12
34
56
78
910
1112
1314
R_Ch
kTy
gres
sun
treat
ed--
S_Ch
kFl
orid
a 47
untre
ated
--
R_St
drd
T ygr
ess
Adm
ire P
ro 4
.6L
7 fl
oz p
er a
cre
x
Ober
on 2
SC8
fl oz
per
acr
ex
x
Knac
k .8
6L9
fl oz
per
acr
ex
x
S_St
drd
Flor
ida
47Ad
mire
Pro
4.6
L7
fl oz
per
acr
ex
Ober
on 2
SC8
fl oz
per
acr
ex
x
Knac
k .8
6L9
fl oz
per
acr
ex
x
Plat
_LFl
orid
a 47
Plat
inum
2SC
8 fl
oz p
er a
cre
x
Ober
on 2
SC8
fl oz
per
acr
ex
x
Knac
k .8
6L9
fl oz
per
acr
ex
x
Plat
_HFl
orid
a 47
Plat
inum
2SC
11 fl
oz
per a
cre
x
Ober
on 2
SC8
fl oz
per
acr
ex
x
Knac
k .8
6L9
fl oz
per
acr
ex
x
Oil
Flor
ida
47Ad
mire
Pro
4.6
L7
fl oz
per
acr
ex
JMS
Styl
et O
il1
% v
/vx
xx
xx
xx
xx
x
Nich
_LFl
orid
a 47
Adm
ire P
ro 4
.6L
7 fl
oz p
er a
cre
x
Cour
ier 4
0SC
12 fl
oz
per a
cre
x
NNI-0
101
0.2
lb p
er a
cre
a.i.
xx
x
Nich
_HFl
orid
a 47
Adm
ire P
ro 4
.6L
7 fl
oz p
er a
cre
x
Cour
ier 4
0SC
12 fl
oz
per a
cre
x
NNI-0
101
0.3
lb p
er a
cre
a.i.
xx
x

- 33 -
Figure 1. Average number adult whiteflies collected in 4 beats over 11 sample weekly dates.
0
5
10
15
20
25
R_CHK
S_CHK
Plat_L
PLAT_H
S_STDR OIL
R_STDR
NichH
NichL
Ad
ult
s p
er 4
bea
ts
Figure 2. Average number of eggs, small nymphs and large nymphs over 10 weekly sample dates.
0
1
2
3
4
5
6
7
S_CHK R_CHKOIL
PLAT_HNichL Plat_L
R_STDRNichH
S_STDR
Number/7cm
2
Eggs
Small Nymphs
Large Nymphs

- 34 -
Figure 3. Mean incidence of plants with TYLCV symptoms in tomato plots.
0
5
10
15
20
25
30
35
40
PLAT_H S_STDRNichH S_CHK Plat_L NichL
OIL
R_CHKR_STDR
TYLCV (%)
a
ababc
bc bcbc bc
bcc
Columns designated by the same letter represent means that are not significantly different (LSD, P < 0.05)
Figure 4. Mean weight from 8 plants of marketable and unmarketable fruit yield from 6 harvests.
0
10
20
30
40
50
60
70
R_STDRNichL
S_STDR PLAT_HNichH
OIL
Plat_L R_CHK S_CHK
LBS/8 plants
Marketable
Culls
a
ab
ab
ab
ab b b
c c
a
bc
abb
c bcc
d
cd
dd
Columns designated by the same letter represent means that are not significantly different (LSD, P < 0.05). Columns representing marketable yield were analyzed separate from columns representing unmarketable yield.
- 35 -
Tomato Varieties for Florida
Stephen M. Olson1 and Eugene McAvoy2
1 North Florida Research & Education Center, University of Florida, Quincy; [email protected]
2 Hendry County Extension, University of Florida, Labelle; [email protected]
Variety selections, often made several months before planting, are one of the most important management decisions made by the grower. Failure to select the most suitable variety or varieties may lead to loss of yield or market acceptability. The following characteristics should be considered in selection of tomato varieties for use in Florida.
Yield The variety selected should have the potential to produce crops at least equivalent to varieties already grown. The average yield in Florida is currently about 1400 25-pound cartons per acre. The potential yield of varieties in use should be much higher than average.
Disease Resistance Varieties selected for use in Florida must have resistance to Fusarium wilt, races 1 and 2 and in some areas race 3; Verticillium wilt (race 1); Gray leaf spot; and some tolerance to Bacterial soft rot. Available resistance to other diseases may be important in certain situations, such as Tomato spotted wilt and Bacterial wilt resistance in northwest Florida.
Horticultural Quality Plant habit, stem type and fruit size, shape, color, smoothness and resistance to defects should all be considered in variety selection.
Adaptability Successful tomato varieties must perform well under the range of environmental conditions usually encountered in the district or on the individual farm.
Market Acceptability The tomato produced must have characteristics acceptable to the packer, shipper, wholesaler, retailer and consumer. Included among these qualities are pack out, fruit shape, ripening ability, firmness, and flavor.
CURRENT VARIETY SITUATIONMany tomato varieties are grown commercially in Florida,
but only a few represent most of the acreage. In years past we have been able to give a breakdown of which varieties are used and predominantly where they were being used but this information is no longer available through the USDA Crop Reporting Service.
TOMATO VARIETY TRIAL RESULTSTable 1 shows results of spring trials for 2005 and Table 2
shows results of fall trial of 2005 conducted at the North Florida Research and Education Center, Quincy.
TOMATO VARIETIES FOR COMMERCIAL PRODUCTIONThe following varieties are currently popular with Florida
growers or have done well in university trials. It is by no means a comprehensive list of all varieties that may be adapted to Florida conditions. Growers should try new varieties on a limited basis to see how they perform for them.
LARGE FRUITED VARIETIESAmelia. Vigorous determinate, main season, jointed hybrid.
Fruit are firm and aromatic suitable for green or vine ripe. Good crack resistance. Resistant: Verticillium wilt (race 1), Fusarium wilt (race 1,2,3), root-knot nematode , Gray leaf spot and Tomato spotted wilt. (Harris Moran).
BHN 586. Midseason maturity. Fruit are large to extra-large, deep globed shaped with firm, uniform green fruits well suited for mature green or vine-ripe production. Determinate, medium to tall vine. Resistant: Verticillium wilt (race 1), Fusarium wilt (race 1,2) Fusarium crown rot and root-knot nematode. (BHN)
BHN 640. Early-midseason maturity. Fruit are globe shape but tend to slightly elongate, and green shouldered. Not for fall planting. Resistant: Verticillium wilt (race 1), Fusarium wilt (race 1,2,3), Gray leaf spot, and Tomato spotted wilt. (BHN).
Crista. Midseason maturity. Large, deep globe fruit with tall robust plants. Does best with moderate pruning and high fertility. Good flavor, color and shelf-life. Resistant: Verticillium wilt (race 1), Fusarium wilt (race 1,2,3), Tomato spotted wilt and root-knot nematode. (Harris Moran)
Crown Jewel. Uniform fruit have a deep oblate shape with good firmness, quality and uniformly-colored shoulders. Determinate with medium-tall bush. Resistant: Verticillium wilt (race 1), Fusarium wilt (race 1,2) Fusarium crown rot, Alternaria stem canker and Gray leaf spot. (Seminis)
Florida 47. A late midseason, determinate, jointed hybrid. Uniform green, globe-shaped fruit. Resistant: Fusarium wilt (race 1,2), Verticillium wilt (race 1), Alternaria stem canker, and Gray leaf spot. (Seminis).
Florida 91. Uniform green fruit borne on jointed pedicels. Determinate plant. Good fruit setting ability under high temperatures. Resistant: Verticillium wilt (race 1), Fusarium wilt (race 1,2), Alternaria stem canker, and Gray leaf spot. (Seminis).
HA 3073. A midseason, determinate, jointed hybrid. Fruit are large, firm, slightly oblate and are uniformly green. Resistant: Verticillium wilt (race 1), Fusarium wilt (race 1,2), Gray leaf spot, Tomato yellow leaf Curl and Tomato mosaic. (Hazera)
Linda. Main season. Large round, smooth, uniform shouldered fruit with excellent firmness and a small blossom end scar. Strong determinate bush with good cover. Resistant:
- 36 -
Verticillium wilt (race 1), Fusarium wilt (race 1,2), Alternaria stem canker and Gray leaf spot. (Sakata)
Phoenix. Early mid-season. Fruit are large to extra-large, high quality, firm, globe-shaped and are uniformly-colored. “Hot-set” variety. Determinate, vigorous vine with good leaf cover for fruit protection. Resistant: Verticillium wilt (race 1), Fusarium wilt (race 1,2), Alternaria stem canker and Gray leaf spot. (Seminis)
Quincy. Full season. Fruit are large to extra-large, excellent quality, firm, deep oblate shape and uniformly colored. Very strong determinate plant. Resistant: Verticillium wilt (race 1), Fusarium wilt (race 1,2), Alternaria stem canker, Tomato spotted wilt and Gray leaf spot. (Seminis)
RPT 6153. Main season. Fruit have good eating quality and fancy appearance in a large sturdy shipping tomato and are firm enough for vine-ripe. Large determinate plants. Resistant: Verticillium wilt (race 1), Fusarium wilt (race 1,2) and Gray leaf spot. (Seedway)
Sanibel. Main season. Large, firm, smooth fruit with light green shoulder and a tight blossom end. Large determinate bush. Resistant: Verticillium wilt (race 1), Fusarium wilt (race 1,2), root-knot nematodes, Alternaria stem canker and Gray leaf spot. (Seminis)
Sebring. A late midseason determinate, jointed hybrid with a smooth, deep oblate, firm, thick walled fruit. Resistant: Verticillium wilt (race 1), Fusarium wilt (race 1,2,3), Fusarium crown rot and Gray leaf spot. (Syngenta)
Solar Fire. An early, determinate, jointed hybrid. Has good fruit setting ability under high temperatures. Fruit are large, flat-round, smooth, firm, light green shoulder and blossom scars are smooth. Resistant: Verticillium wilt (race 1), Fusarium wilt (race 1,2,3) and Gray leaf spot. (Harris Moran)
Solar Set. An early, green-shouldered, jointed hybrid. Determinate. Fruit set under high temperatures (92oF day/72o night) is superior to most other commercial varieties. Resistant: Fusarium wilt (race 1,2), Verticillium wilt (race 1), Alternaria stem canker, and Gray leaf spot. (Seminis).
Solimar. A midseason hybrid producing globe-shaped, green shouldered fruit. Resistant: Verticillium wilt (race 1), Fusarium wilt (race 1,2), Alternaria stem canker, Gray leaf spot. (Seminis).
Soraya. Full season. Fruit are high quality, smooth and tend toward large to extra-large. Continuous set. Strong, large bush. Resistant: Verticillium wilt (race 1), Fusarium wilt (race 1,2,3), Fusarium crown rot and Gray leaf spot. (Syngenta Rogers Seed)
Talledega. Midseason. Fruit are large to extra-large, globe to deep globe shape. Determinate bush. Has some hot-set ability. Performs well with light to moderate pruning. Resistant:
Verticillium wilt (race 1), Fusarium wilt (race 1,2), Tomato spotted wilt and Gray leaf spot. (Syngenta Rogers Seed)
Tygress. A midseason, jointed hybrid producing large, smooth firm fruit with good packouts. Resistant: Verticillium wilt (race 1), Fusarium wilt (race 1,2), Gray leaf spot, Tomato mosaic and Tomato yellow leaf curl. (Seminis).
PLUM TYPE VARIETIESBella Rosa. Heat tolerant determinate type. Produces firm,
uniformly shaped fruit. Resistant: Tomato spotted wilt. (Sakata)
BHN 410. Midseason. Large, smooth, blocky, jointless fruit tolerant to weather cracking. Compact to small bush with concentrated high yield. Resistant: Verticillium wilt (race 1), Fusarium wilt (race 1, 2), Bacterial speck (race 0) and Gray leaf spot. (BHN Seed)
BHN 411. Midseason. Large, smooth, jointless fruit is tolerant to weather cracks and has reduced tendency for graywall. Compact plant with concentrated fruit set. Resistant: Verticillium wilt (race 1), Fusarium wilt (race 1,2), Bacterial speck (race 0) and Gray leaf spot. (BHN Seed)
BHN 485. Midseason. Large to extra-large, deep blocky, globe shaped fruit. Determinate, vigorous bush with no pruning recommended. Resistant: Verticillium wilt (race 1), Fusarium wilt (race 1,2,3) and Tomato spotted wilt. (BHN Seed)
Marianna. Midseason. Fruit are predominately extra-large and extremely uniform in shape. Fruit wall is thick and external and internal color is very good with excellent firmness and shelf life. Determinate, small to medium sized plant with good fruit set. Resistant: Verticillium wilt (race 1), Fusarium wilt (race 1,2), root-knot nematode, Alternaria stem canker and tolerant to Gray leaf spot. (Sakata)
Monica. Midseason. Fruit are elongated, firm, extra-large and uniform green color. Vigorous bush with good cover. Resistant: Verticillium wilt (race 1), Fusarium wilt (race 1,2), Bacterial speck (race 0) and Gray leaf spot. (Sakata)
Plum Dandy. Medium to large determinate plants. Rectangular, blocky, defect-free fruit for fresh-market production. When grown in hot, wet conditions, it does not set fruit well and is susceptible to bacterial spot. For winter and spring production in Florida. Resistant: Verticillium wilt, Fusarium wilt (race 1), Early blight, and rain checking. (Harris Moran).
Sunoma. Main season. Fruit are medium-large, elongated and cylindrical. Plant maintains fruit size through multiple harvests. Determinate plant with good fruit cover. Resistant: Verticillium wilt (race 1), Fusarium wilt (race 1,2), Bacterial speck (race 0), root-knot nematodes, Tomato mosaic and Gray leaf spot. (Seminis)

- 37 -
CHERRY TYPE VARIETIESBHN 268. Early. An extra firm cherry tomato that holds,
packs and ships well. Determinate, small to medium bush with high yields. Resistant: Verticillium wilt (race 1), Fusarium wilt (race 1). (BHN Seed)
Camelia. Midseason. Deep globe, cocktail-cherry size with excellent firmness and long shelf life. Indeterminate bush. Outdoor or greenhouse production. Verticillium wilt (race 1), Fusarium wilt (race 1) and Tobacco mosaic. (Siegers Seed)
Cherry Blossom. 70 days. Large cherry, holds and yields well. Determinate bush. Resistant: Verticillium wilt (race 1), Fusarium wilt (race 1,2), Bacterial speck (race 0), root-knot nematodes, Alternaria stem canker and Gray leaf spot. (Seedway)
Mountain Belle. Vigorous, determinate type plants. Fruit are round to slightly ovate with uniform green shoulders borne on jointless pedicels. Resistant: Fusarium wilt (race 2), Verticillium wilt (race 1). (Syngenta Rogers Seed).
Super Sweet 100 VF. Produces large clusters of round uniform fruit with high sugar levels. Fruit somewhat small and may crack during rainy weather. Indeterminate vine with high yield potential. Resistant: Verticillium wilt (race 1) and Fusarium wilt (race 1). (Siegers Seed, Seedway)
Shiren. Compact plant with high yield potential and nice cluster. Resistant: Fusarium wilt (race 1,2), root-knot nematodes and Tomato mosaic. (Hazera)
GRAPE TOMATOESBrixmore. Very early. Indeterminate. Very uniform in
shape and size, deep glossy red color with very high early and total yield. High brix and excellent firm flavor. Resistant: Verticillium wilt (race 1), root-knot nematodes and Tomato mosaic. (Harris Moran)
Cupid. Early. Vigorous, indeterminate bush. Oval-shaped fruit have an excellent red color and a sweet flavor. Resistant: Fusarium wilt (race 1,2), Bacterial speck (intermediate resistance race 0) and Gray leaf spot. (Seminis)
Jolly Elf. Early season. Determinate plant. Extended market life with firm, flavorful grape-shaped fruits. Average 10% brix. Resistant: Verticillium wilt (race 1), Fusarium wilt (race 2) and cracking. (Siegers Seed, Seedway)
Santa. 75 days. Vigorous indeterminate bush. Firm elongated grape-shaped fruit with outstanding flavor and up to 50 fruits per truss. Resistant: Verticillium wilt (race 1), Fusarium wilt (race 1), root-knot nematodes and Tobacco mosaic. (Thompson and Morgan)
St Nick. Mid-early season. Indeterminate bush. Oblong, grape-shaped fruit with brilliant red color and good flavor. Up to 10% brix. (Siegers Seed)
Smarty. 69 days. Vigorous, indeterminate bush with short internodes. Plants are 25% shorter than Santa. Good flavor, sweet and excellent flavor. (Seedway)

- 38 -
Table 1. Tomato variety trial results spring 2005. NFREC-Quincy, FL.
Marketable Yield (25 lb cartons/A Fruit wt. Marketable TSW
Entry Source Medium Large Extra-large Total (oz) (%) (%)
Quincy (8383) Seminis 200 e-iz 359 b-g 1858 a 2416 a 7.3 ab 85.9 a-e 0
NC 0227 NCS 354 b-d 536 a 1493 a-d 2384 a 6.5 b-g 86.0 a-e 0
SXT 6741 Nunhems 286 b-h 455 a-d 1596 ab 2337 ab 6.6 b-g 88.9 a 0
NC 0236 NCS 335 b-e 450 a-d 1528 a-c 2314 ab 6.7 b-g 86.8 a-d 8.3
Crista (NC 0256) Harris Moran 260 c-h 390 a-g 1611 ab 2260 a-c 6.7 b-g 86.6 a-d 0
NC 0377 NCS 405 b 516 ab 1338 a-e 2259 a-c 6.3 c-g 84.0 a-f 0
NC 0392 NCS 302 b-h 467 a-d 1462 a-d 2231 a-c 6.8 b-f 88.4 ab 0
BHN 444 BHN 356 b-d 524 ab 1314 a-e 2194 a-d 6.4 c-g 81.4 a-f 2.1
Talladega Syngenta 171 g-i 346 c-g 1608 ab 2125 a-e 7.0 b-d 81.9 a-f 2.1
SXT 6758 Nunhems 255 c-h 428 a-f 1314 a-e 1996 a-e 6.2 d-g 87.4 a-c 0
BHN 640 BHN 356 b-d 500 a-c 1106 b-f 1962 a-e 6.1 e-g 80.4 a-f 0
BHN 601 BHN 392 bc 481 a-d 1039 b-f 1913 a-e 6.0 fg 83.6 a-f 0
Amelia Harris Moran 186 f-i 329 d-g 1396 a-e 1911 a-e 7.0 b-d 84.6 a-e 2.1
Phoenix (8233) Seminis 194 e-i 340 c-g 1372 a-e 1906 a-e 7.1 a-c 77.7 d-g 2.1
*FL 47 Seminis 180 g-i 363 b-g 1324 a-e 1868 a-e 6.9 b-e 82.1 a-f 20.8
Top Gun (503) Seminis 217 d-i 383 a-g 1251 a-e 1851 a-e 6.6 b-g 82.7 a-f 0
Fla. 7964 GCREC 312 b-g 445 a-e 1020 b-f 1778 a-e 6.2 d-g 77.3 e-g 0
Solar Fire Harris Moran 273 b-h 406 a-g 1091 b-f 1771 a-e 6.3 c-g 83.1 a-f 27.1
Fla. 8314 GCREC 292 b-h 403 a-g 1051 b-f 1746 a-e 6.2 d-g 78.3 c-f 14.6
Soraya Syngenta 166 hi 276 fg 1276 a-e 1719 a-f 7.1 a-c 81.0 a-f 16.7
Fla. 8224 GCREC 326 b-f 394 a-g 933 c-f 1653 b-f 6.0 g 80.3 a-f 27.1
Mountain Spring Syngenta 240 d-h 280 e-g 1124 b-f 1644 b-f 6.7 b-g 79.9 a-f 22.9
Fla. 8153 GCREC 592 a 496 a-d 492 f 1579 c-f 5.2 h 79.9 b-f 22.9
FL 91 Seminis 175 g-i 274 fg 1056 b-f 1504 d-f 6.7 b-g 83.0 a-f 16.7
Sebring Syngenta 169 g-i 251 gh 1068 b-f 1487 ef 6.8 b-e 84.2 a-e 16.7
Fla. 8135 GCREC 275 b-h 365 b-g 787 ef 1428 ef 6.1 e-g 75.0 fg 22.9
Biltmore Seminis 81 i 125 h 851 d-f 1056 f 7.8 a 69.9 g 37.5
Z Mean separation by Duncan’s multiple range test, 5 % level.
Comments: In-row spacing 20 in., between row spacing 6 ft., trickle irrigation under black polyethylene mulch, fertilizer applied 195-60-195 lbs/A N-P2O5-K2O. Seeded: 14 February 2005. Transplanted 29 March 2005. Harvested 23 June - 7 July, 3 harvests; Soil: Orangeburg loamy fine sand
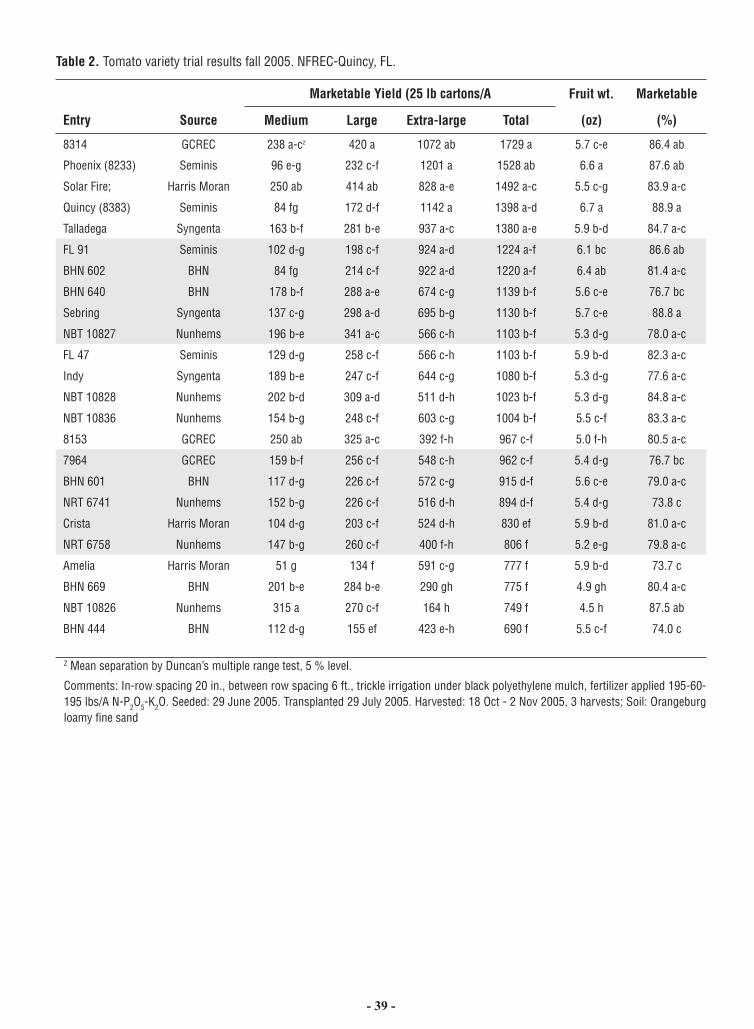
- 39 -
Table 2. Tomato variety trial results fall 2005. NFREC-Quincy, FL.
Marketable Yield (25 lb cartons/A Fruit wt. Marketable
Entry Source Medium Large Extra-large Total (oz) (%)
8314 GCREC 238 a-cz 420 a 1072 ab 1729 a 5.7 c-e 86.4 ab
Phoenix (8233) Seminis 96 e-g 232 c-f 1201 a 1528 ab 6.6 a 87.6 ab
Solar Fire; Harris Moran 250 ab 414 ab 828 a-e 1492 a-c 5.5 c-g 83.9 a-c
Quincy (8383) Seminis 84 fg 172 d-f 1142 a 1398 a-d 6.7 a 88.9 a
Talladega Syngenta 163 b-f 281 b-e 937 a-c 1380 a-e 5.9 b-d 84.7 a-c
FL 91 Seminis 102 d-g 198 c-f 924 a-d 1224 a-f 6.1 bc 86.6 ab
BHN 602 BHN 84 fg 214 c-f 922 a-d 1220 a-f 6.4 ab 81.4 a-c
BHN 640 BHN 178 b-f 288 a-e 674 c-g 1139 b-f 5.6 c-e 76.7 bc
Sebring Syngenta 137 c-g 298 a-d 695 b-g 1130 b-f 5.7 c-e 88.8 a
NBT 10827 Nunhems 196 b-e 341 a-c 566 c-h 1103 b-f 5.3 d-g 78.0 a-c
FL 47 Seminis 129 d-g 258 c-f 566 c-h 1103 b-f 5.9 b-d 82.3 a-c
Indy Syngenta 189 b-e 247 c-f 644 c-g 1080 b-f 5.3 d-g 77.6 a-c
NBT 10828 Nunhems 202 b-d 309 a-d 511 d-h 1023 b-f 5.3 d-g 84.8 a-c
NBT 10836 Nunhems 154 b-g 248 c-f 603 c-g 1004 b-f 5.5 c-f 83.3 a-c
8153 GCREC 250 ab 325 a-c 392 f-h 967 c-f 5.0 f-h 80.5 a-c
7964 GCREC 159 b-f 256 c-f 548 c-h 962 c-f 5.4 d-g 76.7 bc
BHN 601 BHN 117 d-g 226 c-f 572 c-g 915 d-f 5.6 c-e 79.0 a-c
NRT 6741 Nunhems 152 b-g 226 c-f 516 d-h 894 d-f 5.4 d-g 73.8 c
Crista Harris Moran 104 d-g 203 c-f 524 d-h 830 ef 5.9 b-d 81.0 a-c
NRT 6758 Nunhems 147 b-g 260 c-f 400 f-h 806 f 5.2 e-g 79.8 a-c
Amelia Harris Moran 51 g 134 f 591 c-g 777 f 5.9 b-d 73.7 c
BHN 669 BHN 201 b-e 284 b-e 290 gh 775 f 4.9 gh 80.4 a-c
NBT 10826 Nunhems 315 a 270 c-f 164 h 749 f 4.5 h 87.5 ab
BHN 444 BHN 112 d-g 155 ef 423 e-h 690 f 5.5 c-f 74.0 c
Z Mean separation by Duncan’s multiple range test, 5 % level.
Comments: In-row spacing 20 in., between row spacing 6 ft., trickle irrigation under black polyethylene mulch, fertilizer applied 195-60-195 lbs/A N-P2O5-K2O. Seeded: 29 June 2005. Transplanted 29 July 2005. Harvested: 18 Oct - 2 Nov 2005, 3 harvests; Soil: Orangeburg loamy fine sand

- 40 -
Water Management for Tomato
E.H. SimonneUF/IFAS Horticultural Sciences Department, Gainesville
Water and nutrient management are important aspects of tomato production. Water is used for wetting fields before land preparation, transplant establishment, and irrigation. The objective of this article is to provide an overview of recommendations for tomato irrigation in Florida. Recommendations in this article should be considered together with those presented in the “Fertilizer and nutrient management for tomato”, also included in this publication.
Irrigation is used to replace the amount of water lost by transpiration and evaporation. This amount is also called crop evapotranspiration (ETc). Irrigation scheduling is used to apply the proper amount of water to a tomato crop at the proper time. The characteristics of the irrigation system, tomato crop needs, soil properties, and atmospheric conditions must all be considered to properly schedule irrigations. Poor timing or insufficient water application can result in crop stress and reduced yields from inappropriate amounts of available water and/or nutrients. Excessive water applications may reduce yield and quality, are a waste of water, and increase the risk of nutrient leaching
A wide range of irrigation scheduling methods is used in Florida, with corresponding levels of water managements (Table 1). The recommend method to schedule irrigation for tomato is to use together an estimate of the tomato crop water requirement that is based on plant growth, a measurement of soil water status and a guideline for splitting irrigation (water management level 5 in Table 1; Table 2). The estimated water use is a guideline for irrigating tomatoes. The measurement of soil water tension is useful for fine tuning irrigation. Splitting irrigation events is necessary when the amount of water to be applied is larger than the water holding capacity of the root zone.
Tomato Water Requirement. Tomato water requirement (ETc) depends on stage of growth, and evaporative demand. ETc can be estimated by adjusting reference evapotranspiration (ETo) with a correction factor call crop factor (Kc; equation [1]). Because different methods exist for estimating ETo, it is very important to use Kc coefficients which were derived using the same ETo estimation method as will be used to determine ETc. Also, Kc values for the appropriate stage of growth and production system (Table 3) must be used.
By definition, ETo represents the water use from a uniform green cover surface, actively growing, and well watered (such as a turf or grass covered area). ETo can be measured on-farm using a small weather station. When daily ETo data are not available, historical daily averages of Penman-method ETo can be used (Table 4). However, these long-term averages are provided as guidelines since actual values may fluctuate by as much as 25%, either above the average on hotter and drier than normal days, or below the average on cooler or more overcast days than normal. As a result, SWT or soil moisture should be monitored in the field.
Eq. [1] Crop water requirement = Crop coefficient x Reference evapotranspiration
ETc = Kc x ETo
Tomato crop water requirement may also be estimated from Class A pan evaporation using:
Eq. [2] Crop water requirement = Crop factor x Class A pan evaporation
ETc = CF x Ep
Typical CF values for fully-grown tomato should not exceed 0.75 (Locascio and Smajstrla, 1996).
A third method for estimated tomato crop water requirement is to use modified Bellani plates also known as atmometers. A common model of atmometer used in Florida is the ET
gage. This
device consists of a canvas-covered ceramic evaporation plate
mounted on a water reservoir. The green fabric creates a diffusion barrier that controls evaporation at a rate similar to that of well water plants. Water loss through evaporation can be read on a clear sight tube mounted on the side of the device. Evaporation from the ET
gage (ETg) was well correlated to ETo except on rainy
days, but overall, the ETgage
tended to underestimate ETo (Irmak et al., 2005). On days with rainfall less than 0.2 inch/day, ETo can be estimated from ETg as: ETo = 1.19 ETg. When rainfall exceeded 0.2inch/day, rain water wets the canvas which interferes with the flow of water out of the atmometers, and decreases the reliability of the measurement.
Tomato Irrigation Requirement. Irrigation systems are generally rated with respect to application efficiency (Ea), which is the fraction of the water that has been applied by the irrigation system and that is available to the plant for use. In general, Ea is 20% to 70% for seepage irrigation and 90% to 95% for drip irrigation. Applied water that is not available to the plant may have been lost from the crop root zone through evaporation, leaks in the pipe system, surface runoff, subsurface runoff, or deep percolation within the irrigated area. When dual drip/seepage irrigation systems are used, the contribution of the seepage system needs to be subtracted from the tomato irrigation requirement to calculate the drip irrigation need. Otherwise, excessive water volume will be systematically applied. Tomato irrigation requirement are determined by dividing the desired amount of water to provide to the plant (ETc), by Ea as a decimal fraction (Eq. [3]).
Eq. [3] Irrigation requirement = Crop water requirement / Application efficiency
IR = ETc/Ea
Irrigation scheduling for tomato. For seepage irrigated crops, irrigation scheduling recommendations consist of maintaining the water table near the 18-inch depth shortly after transplanting and near the 24- inch depth thereafter (Stanley and

- 41 -
Clark, 2003). The actual depth of the water table may be monitored with shallow observation wells (Smajstrla, 1997).
Irrigation scheduling for drip irrigated tomato typically consists in daily applications of ETc, estimated from Eq. [1] or [2] above. In areas where real-time weather information is not available, growers use the “1,000 gal/acre/day/string” rule for drip-irrigated tomato production. As the tomato plants grow from 1 to 4 strings, the daily irrigation volumes increase from 1,000 gal/acre/day to 4,000 gal/acre/day. On 6-ft centers, this corresponds to 15 gal/100lbf/day and 60 gal/100lbf/day for 1 and 4 strings, respectively.
Soil Moisture Measurement. Soil water tension (SWT) represents the magnitude of the suction (negative pressure) the plant roots have to create to free soil water from the attraction of the soil particles, and move it into its root cells. The dryer the soil, the higher the suction needed, hence, the higher SWT. SWT is commonly expressed in centibars (cb) or kiloPascals (kPa; 1cb = 1kPa). For tomatoes grown on the sandy soils of Florida, SWT in the rooting zone should be maintained between 6 (field capacity) and 15 cb.
The two most common tools available to measure SWT in the field are tensiometers and time domain reflectometry (TDR) probes, although other types of probes are now available (Muñoz-Carpena, 2004). Tensiometers have been used for several years in tomato production. A porous cup is saturated with water, and placed under vacuum. As the soil water content changes, water comes in or out of the porous cup, and affects the amount of vacuum inside the tensiometer. Tensiometer readings have been successfully used to monitor SWT and schedule irrigation for tomatoes. However, because they are fragile and easily broken by field equipment, many growers are reluctant to use them. In addition, readings are not reliable when the tensiometer dries, or when the contact between the cup and the soil is lost. Depending on the length of the access tube, tensiometers cost between $40 and $80 each. Tensiometers can be reused as long as they are maintained properly and remain undamaged.
It is necessary to monitor SWT at two soil depths when tensiometers are used. A shallow 6-in depth is useful at the beginning of the season when tomato roots are near that depth. A deeper 12-in depth is used to monitor SWT during the rest of the season. Comparing SWT at both depth is useful to understand the dynamics of soil moisture. When both SWT are within the 4-8 cb range (close to field capacity), this means that moisture is plentiful in the rooting zone. This may happen after a large rain, or when tomato water use is less than irrigation applied. When the 6-in SWT increases (from 4-8 cb to 10-15cb) while SWT at 12-in remains within 4-8 cb, the upper part of the soil is drying, and it is time to irrigate. If the 6-in SWT continues to rise above 25cb, a water stress will result; plants will wilt, and yields will be reduced. This should not happen under adequate water management.
A SWT at the 6-in depth remaining with the 4-8 cb range, but the 12-in reading showing a SWT of 20-25 cb suggest that deficit irrigation has been made: irrigation has been applied to re-wet the upper part of the profile only. The amount of water applied was not enough to wet the entire profile. If SWT at the 12-in depth continues to increase, then water stress will become more severe
and it will become increasingly difficult to re-wet the soil profile. The sandy soils of Florida have a low water holding capacity. Therefore, SWT should be monitored daily and irrigation applied at least once daily. Scheduling irrigation with SWT only can be difficult at times. Therefore, SWT data should be used together with an estimate of tomato water requirement
Times domain reflectometry (TDR) is not a new method for measuring soil moisture but its use in vegetable production has been limited in the past. The recent availability of inexpensive equipment ($400 to $550/unit) has increased the potential of this method to become practical for tomato growers. A TDR unit is comprised of three parts: a display unit, a sensor, and two rods. Rods may be 4 inches or 8 inches in length based on the depth of the soil. Long rods may be used in all the sandy soils of Florida, while the short rods may be used with the shallow soils of Miami-Dade county.
The advantage of TDR is that probes need not being buried permanently, and readings are available instantaneously. This means that, unlike the tensiometer, TDR can be used as a hand-held, portable tool.
TDR actually determines percent soil moisture (volume of water per volume of soil). In theory, a soil water release curve has to be used to convert soil moisture in to SWT. However, because TDR provides an average soil moisture reading over the entire length of the rod (as opposed to the specific depth used for tensiometers), it is not practical to simply convert SWT into soil moisture to compare readings from both methods. Preliminary tests with TDR probes have shown that best soil monitoring may be achieved by placing the probe vertically, approximately 6 inches away from the drip tape on the opposite side of the tomato plants. For fine sandy soils, 9% to 15% appears to be the adequate moisture range. Tomato plants are exposed to water stress when soil moisture is below 8%. Excessive irrigation may result in soil moisture above 16%.
Guidelines for Splitting Irrigation. For sandy soils, a one square foot vertical section of a 100-ft long raised bed can hold approximately 24 to 30 gallons of water (Table 5). When drip irrigation is used, lateral water movement seldom exceeds 6 to 8 inches on each side of the drip tape (12 to 16 inches wetted width). When the irrigation volume exceeds the values in table 5, irrigation should be split into 2 or 3 applications. Splitting will not only reduce nutrient leaching, but it will also increase tomato quality by ensuring a more continuous water supply. Uneven water supply may result in fruit cracking.
Units for Measuring Irrigation Water. When overhead and seepage irrigation were the dominant methods of irrigation, acre-inches or vertical amounts of water were used as units for irrigations recommendations. There are 27,150 gallons in one acre-inch; thus, total volume was calculated by multiplying the recommendation expressed in acre-inch by 27,150. This unit reflected quite well the fact that the entire field was wetted.
Acre-inches are still used for drip irrigation, although the entire field is not wetted. This section is intended to clarify the conventions used in measuring water amounts for drip irrigation. In short, water amounts are handled similarly to fertilizer amounts,

- 42 -
i.e., on an acre basis. When an irrigation amount expressed in acre-inch is recommended for plasticulture, it means that the recommended volume of water needs to be delivered to the row length present in a one-acre field planted at the standard bed spacing. So in this case, it is necessary to know the bed spacing to determine the exact amount of water to apply. In addition, drip tape flow rates are reported in gallons/hour/emitter or in gallons/hour/100 ft of row. Consequently, tomato growers tend to think in terms of multiples of 100 linear feet of bed, and ultimately convert irrigation amounts into duration of irrigation. It is important to correctly understand the units of the irrigation recommendation in order to implement it correctly.
Example. How long does an irrigation event need to last if a tomato grower needs to apply 0.20 acre-inch to a 2-acre tomato field. Rows are on 6-ft centers and a 12-ft spray alley is left unplanted every six rows? The drip tape flow rate is 0.30 gallons/hour/emitter and emitters are spaced 1 foot apart.
1. In the 2-acre field, there are 14,520 feet of bed (2 x 43,560/6). Because of the alleys, only 6/8 of the field is actually planted. So, the field actually contains 10,890 feet of bed (14,520x 6/8).
2. A 0.20 acre-inch irrigation corresponds to 5,430 gallons applied to 7,260 feet of row, which is equivalent to 75gallons/100feet (5,430/72.6).
3. The drip tape flow rate is 0.30 gallons/hr/emitter which is equivalent to 30 gallons/hr/100feet. It will take 1 hour to apply 30 gallons/100ft, 2 hours to apply 60 gallons/100ft, and 2.5 hours to apply 75 gallons. The total volume applied will be 8,168 gallons/2-acre (75 x 108.9).
Irrigation and Best Management Practices. As an effort to clean impaired water bodies, federal legislation in the 70’s, followed by state legislation in the 90’s and state rules since 2000 have progressively shaped the Best Management Practices (BMP) program for vegetable production in Florida. Section 303(d) of the Federal Clean Water Act of 1972 required states to identify impaired water bodies and establish Total Maximum Daily Loads (TMDL) for pollutants entering these water bodies. In 1987, the Florida legislature passed the Surface Water Improvement and Management Act requiring the five Florida water management districts to develop plans to clean up and preserve Florida lakes, bays, estuaries, and rivers. In 1999, the Florida Watershed Restoration Act defined a process for the development of TMDLs. More recently, the “Florida vegetable and agronomic crop water quality/quantity Best Management Practices” manual was adopted by reference and by rule 5M-8 in the Florida Administrative Code on Feb.9, 2006 (FDACS, 2005). The manual which is available at www.floridaagwaterpolicy.com, provides background on the state-wide BMP program for vegetables, lists all the possible BMPs, provides a selection mechanism for building a customized BMP plan, outlines record-keeping requirements, and explains how to participate in the BMP program. By definition, BMPs are specific cultural practices that aim at reducing nutrient load while
maintaining or increasing productivity. Hence, BMPs are tools to achieve the TMDL. Vegetable growers who elect to participate in the BMP program receive three statutory benefits: (1) a waiver of liability from reimbursement of cost and damages associated with the evaluation, assessment, or remediation of contamination of ground water (Florida Statutes 376.307); (2) a presumption of compliance with water quality standards (F.S. 403.067 (7)(d)), and (3); an eligibility for cost-share programs (F.S. 570.085 (1)).
BMPs cover all aspects of tomato production: pesticide management, conservation practices and buffers, erosion control and sediment management, nutrient and irrigation management, water resources management, and seasonal or temporary farming operations. The main water quality parameters of importance to tomato and pepper production and targeted by the BMPs are nitrate, phosphate and total dissolved solids concentration in surface or ground water. All BMPs have some effect on water quality, but nutrient and irrigation management BMPs have a direct effect on it.
ADDITIONAL READINGS:FDACS. 2005. Florida Vegetable and Agronomic Crop Water Quality and Quantity BMP Manual. Florida Department of Agriculture and Consumer Services.h t t p : / /www. f lo r i daagwa te rpo l i cy. com/PDFs /BMPs /vegetable&agronomicCrops.pdf
Irmak, S., M. Asce, M.D. Dukes, and J.M. Jacobs. 2005. Using modified Bellani plate evapotranspiration gauges to estimate short canopy reference evapotranspiration.J. Irr. Drainage Eng. (2):164-175.
Locascio, S.J. and A.G. Smajstrla. 1996. Water application scheduling by pan evaporation for drip-irrigated tomato. J. Amer. Soc. Hort. Sci. 121(1):63-68
Muñoz-Carpena, R. 2004. Field devices for monitoring soil water content. EDIS Bul. 343. http://edis.ifas.ufl.edu/AE266.
Simonne, E.H., D.W. Studstill, R.C. Hochmuth, G. McAvoy, M.D. Dukes and S.M. Olson. 2003. Visualization of water movement in mulched beds with injections of dye with drip irrigation. Proc. Fla. State Hort. Soc. 116:88-91.
Simonne, E.H., D.W. Studstill, T.W. Olczyk, and R. Munoz-Carpena. 2004. Water movement in mulched beds in a rocky soil of Miami-Dade county. Proc. Fla. State Hort. Soc 117:68-70.
Simonne, E. and B. Morgan. 2005. Denitrification in seepage irrigated vegetable fields in South Florida, EDIS, HS 1004, http://edis.ifas.ufl.edu/HS248.
Simonne, E.H., D.W. Studstill, R.C. Hochmuth, J.T. Jones and C.W. Starling. 2005. On-farm demonstration of soil water movement in vegetables grown with plasticulture, EDIS, HS 1008, http://edis.ifas.ufl.edu/HS251.

- 43 -
Smajstrla, A.G. 1997. Simple water level indicator for seepage irrigation. EDIS Circ. 1188, http://edis.ifas.ufl.edu/AE085.
Stanley, C.D. and G.A. Clark. 2003. Effect of reduced water table and fertility levels on subirrigated tomato production in Southwest Florida. EDIS SL-210, http://edis.ifas.ufl.edu/SS429.
Table 1. Levels of water management and corresponding irrigation scheduling method for tomato.
Water Management
Level Rating Irrigation scheduling method
0 None Guessing (irrigate whenever)
1 Very low Using the “feel and see” method
2 Low Using systematic irrigation (example: 2 hrs every day)
3 Intermediate Using a soil moisture measuring tool to start irrigation
4 Advanced Using a soil moisture measuring tool to schedule irrigation and apply amounts based on a budgeting procedure
5 Recommended Using together a water use estimate based on tomato plant stage of growth, a measurement of soil water moisture, determining rainfall contribution to soil moisture, and having a guideline for splitting irrigation. In addition, BMPs have some record keeping requirements
Table 2. Summary of irrigation management guidelines for tomato.
Irrigation management component
Irrigation systemz
Seepagey Dripx
1- Target water application rate
Keep water table between 18 and 24 inch depth Historical weather data or crop evapotranspiration (ETc) calculated from reference ET or Class A pan evaporation
2- Fine tune application with soil moisture measurement
Monitor water table depth with observation wells Maintain soil water tension in the root zone between 8 and 15 cbar
3- Determine the contribution of rainfall
Typically, 1 inch rainfall raises the water table by 1 foot
Poor lateral water movement on sandy and rocky soils limits the contribution of rainfall to crop water needs to (1) foliar absorption and cooling of foliage and (2) water funneled by the canopy through the plan hole.
4- Rule for splitting irrigation
Not applicable Irrigations greater than 12 and 50 gal/100ft (or 30 min and 2 hrs for medium flow rate) when plants are small and fully grown, respectively are likely to push the water front being below the root zone
5-Record keeping Irrigation amount applied and total rainfall receivedw
Days of system operation
Irrigation amount applied and total rainfall receivedw
Daily irrigation schedule
z Efficient irrigation scheduling also requires a properly designed and maintained irrigation systemsy Practical only when a spodic layer is present in the fieldx On deep sandy soilsw Required by the BMPs

- 44 -
Table 3. Crop coefficient estimates (Kc) for tomatoz.
Tomato Growth Stage Plasticulture1 0.302 0.403 0.904 0.905 0.75
Z Actual values will vary with time of planting, length of growing season and other site-specific factors. Kc values should be used with ETo values in Table 2 to estimated crop evapotranspiration (ETc)
Table 4. Historical Penman-method reference ET (ETo) for four Florida locations (in gallons per acre per day)
Month Tallahassee Tampa West Palm Beach MiamiJanuary 1,630 2,440 2,720 2,720February 2,440 3,260 3,530 3,530March 3,260 3,800 4,340 4,340April 4,340 5,160 5,160 5,160May 4,890 5,430 5,160 5,160June 4,890 5,430 4,890 4,890July 4,620 4,890 4,890 4,890August 4,340 4,620 4,890 4,620September 3,800 4,340 4,340 4,070October 2,990 3,800 3,800 3,800November 2,170 2,990 3,260 2,990December 1,630 2,170 2,720 2,720
z assuming water application over the entire area with 100% efficiency
Table 5. Estimated maximum water application (in gallons per acre and in gallons/100lfb) in one irrigation event for tomato grown on 6-ft centers (7,260 linear bed feet per acre) on sandy soil (available water holding capacity 0.75 in/ ft and 50% soil water depletion). Split irrigations may be required during peak water requirement.
Wetting width (ft)
Gal/100ft to wet depth of 1 ft
Gal/100ft to wet depth of 1.5 ft
Gal/100ft to wet depth of 2 ft
Gal/acre to wet depth of 1 ft
Gal/acre to wet depth of 1.5ft
Gal/acre to wet depth of 2 ft
1.0 24 36 48 1,700 2,600 3,5001.5 36 54 72 2,600 3,900 5,200
- 45 -
Fertilizer and Nutrient Management for Tomato
E.H. SimonneUF/IFAS Horticultural Sciences Department, Gainesville
Fertilizer and nutrient management are essential components of successful commercial tomato production. This article presents the basics of nutrient management for the different production systems used for tomato in Florida.
Calibrated Soil Test: Taking the Guesswork Out of Fertilization. Prior to each cropping season, soil tests should be conducted to determine fertilizer needs and eventual pH adjustments. Obtain a UF/IFAS soil sample kit from the local agricultural Extension agent or from a reputable commercial laboratory for this purpose. If a commercial soil testing laboratory is used, be sure the lab uses methodologies calibrated and extractants suitable for Florida soils. When used with the percent sufficiency philosophy, routine soil testing helps adjust fertilizer applications to plant needs and target yields. In addition, the use of routine calibrated soil tests reduces the risk of over-fertilization. Over fertilization reduces fertilizer efficiency and increases the risk of groundwater pollution. Systematic use of fertilizer without a soil test may also result in crop damage from salt injury.
The crop nutrient requirements of nitrogen, phosphorus, and potassium (designated in fertilizers as N-P
2O
5-K
2O) represent
the optimum amounts of these nutrients needed for maximum tomato production (Table 1). Fertilizer rates are provided on a per-acre basis for tomato grown on 6-ft centers. Under these conditions, there are 7,260 linear feet of tomato row in an acre. When different row spacings are used, it is necessary to adjust fertilizer application accordingly. For example, a 200 lb/A N rate on 6-ft centers is the same as 240 lb/A N rate on 5-ft centers and a 170 lb/A N rate on 7-ft centers. This example is for illustration purposes, and only 5 and 6 ft centers are commonly used for tomato production in Florida.
Fertilizer rates can be simply and accurately adjusted to row spacings other than the standard spacing (6-ft centers) by expressing the recommended rates on a 100 linear bed feet (lbf) basis, rather than on a real-estate acre basis. For example, in a tomato field planted on 7-ft centers with one drive row every six rows, there are only 5,333 lbf/A (6/7 x 43,560 / 7). If the recommendation is to inject 10 lb of N per acre (standard spacing), this becomes 10 lb N/7,260 lbf or 0.14 lb N/100 lbf. Since there are 5,333 lbf/acre in this example, then the adjusted rate for this situation is 7.46 lb/acre N (0.14 x 53.33). In other words, an injection of 10 lb N to 7,260 lbf is accomplished by injecting 7.46 lb N to 5,333 lbf.
Liming. The optimum pH range for tomatoes is 6.0 and 6.5. This is the range for which the availability of all the essential nutrients is highest. Fusarium wilt problems are reduced by liming within this range, but it is not advisable to raise the pH above 6.5 because of reduced micronutrient availability. In areas where soil
pH is basic (>7.0), micronutrient deficiencies may be corrected by foliar sprays.
Calcium and magnesium levels should be corrected according to the soil test. If both elements are “low”,, and lime is needed, then broadcast and incorporate dolomitic limestone (CaCO
3, MgCO
3). Where calcium alone is deficient, “hi-cal”
(CaCO3) limestone should be used. Adequate calcium is important
for reducing the severity of blossom-end rot. Research shows that a Mehlich-I (double-acid) index of 300 to 350 ppm Ca would be indicative of adequate soil-Ca. On limestone soils, add 30-40 lb/acre of magnesium in the basic fertilizer mix. It is best to apply lime several months prior to planting. However, if time is short, it is better to apply lime any time before planting than not to apply it at all. Where the pH does not need modification, but magnesium is low, apply magnesium sulfate or potassium-magnesium sulfate with the fertilizer.
Changes in soil pH may take several weeks to occur when carbonate-based liming materials are used (calcitic or dolomitic limestone). Oxide-based liming materials (quick lime -CaO- or dolomitic quick lime -CaO, MgO-) are fast reacting and rapidly increase soil pH. Yet, despite these advantages, oxide-based liming materials are more expensive than the traditional liming materials, and therefore are not routinely used.
The increase in pH induced by liming materials is NOT due to the presence of calcium or magnesium. Instead, it is the carbonate (“CO
3”) and oxide (“O”) part of CaCO
3 and CaO,
respectively, that raises the pH. Through several chemical reactions that occur in the soil, carbonates and oxides release OH- ions that combine with H+ to produce water. As large amounts of H+ react, the pH rises. A large fraction of the Ca and/or Mg in the liming materials gets into solution and binds to the sites that are freed by H+ that have reacted with OH-.
FERTILIZER-RELATED PHYSIOLOGICAL DISORDERSBlossom-End Rot. Growers may have problems with
blossom-end-rot, especially on the first or second fruit clusters. Blossom-end rot (BER) is a Ca deficiency in the fruit, but is often more related to plant water stress than to Ca concentrations in the soil. This is because Ca movement in the plant occurs with the water (transpiration) stream. Thus, Ca moves preferentially to the leaves. As a maturing fruit is not a transpiring organ, most of the Ca is deposited during early fruit growth.
Once BER symptoms develop on a tomato fruit, they cannot be alleviated on this fruit. Because of the physiological role of Ca in the middle lamella of cell walls, BER is a structural and irreversible disorder. Yet, the Ca nutrition of the plant can be altered so that the new fruits are not affected. BER is most effectively controlled by attention to irrigation and fertilization, or by using a calcium source such as calcium nitrate when soil Ca is low. Maintaining adequate and uniform amounts of moisture in the soil are also keys to reducing BER potential.
Factors that impair the ability of tomato plants to obtain water will increase the risk of BER. These factors include damaged roots from flooding, mechanical damage or nematodes, clogged drip emitters, inadequate water applications, alternating

- 46 -
dry-wet periods, and even prolonged overcast periods. Other causes for BER include high fertilizer rates, especially potassium and nitrogen.
Calcium levels in the soil should be adequate when the Mehlich-1 index is 300 to 350 ppm, or above. In these cases, added gypsum (calcium sulfate) is unlikely to reduce BER. Foliar sprays of Ca are unlikely to reduce BER because Ca does not move out of the leaves to the fruit.
Gray Wall. Blotchy ripening (also called gray wall) of tomatoes is characterized by white or yellow blotches that appear on the surface of ripening tomato fruits, while the tissue inside remains hard. The affected area is usually on the upper portion of the fruit. The etiology of this disorder has not been formally established, but it is often associated with high N and/or low K, and aggravated by excessive amount of N. This disorder may be at times confused with symptoms produced by the tobacco mosaic virus. Gray wall is cultivar specific and appears more frequently on older cultivars. The incidence of gray wall is less with drip irrigation where small amounts of nutrients are injected frequently, than with systems where all the fertilizer is applied pre-plant.
Micronutrients. For virgin, acidic sandy soils, or sandy soils where a proven need exists, a general guide for fertilization is the addition of micronutrients (in elemental lb/A) manganese -3, copper -2, iron -5, zinc -2, boron -2, and molybdenum -0.02. Micronutrients may be supplied from oxides or sulfates. Growers using micronutrient-containing fungicides need to consider these sources when calculating fertilizer micronutrient needs.
Properly diagnosed micronutrient deficiencies can often be corrected by foliar applications of the specific micronutrient. For most micronutrients, a very fine line exists between sufficiency and toxicity. Foliar application of major nutrients (nitrogen, phosphorus, or potassium) has not been shown to be beneficial where proper soil fertility is present.
FERTILIZER APPLICATION Mulch Production with Seepage Irrigation. Under this
system, the crop may be supplied with all of its soil requirements before the mulch is applied (Table 1). It is difficult to correct a deficiency after mulch application, although a liquid fertilizer injection wheel can facilitate sidedressing through the mulch. The injection wheel will also be useful for replacing fertilizer under the used plastic mulch for double-cropping systems. A general sequence of operations for the full-bed plastic mulch system is:
1. Land preparation, including development of irrigation and drainage systems, and liming of the soil, if needed.
2. Application of “cold” mix comprised of 10% to 20% of the total nitrogen and potassium seasonal requirements and all of the needed phosphorus and micronutrients. The cold mix can be broadcast over the entire area prior to bedding and then incorporated. During bedding, the fertilizer will be gathered into the bed area. An alternative is to use a “modified broadcast” technique for systems with wide bed spacings. Use of modified broadcast
or banding techniques can increase phosphorus and micronutrient efficiencies, especially on alkaline (basic) soils.
3. Formation of beds, incorporation of herbicide, and application of mole cricket bait.
4. The remaining 80% to 90% of the nitrogen and potassium is placed in narrow bands 9 to 10 inches to each side of the plant row in furrows. This “hot mix” fertilizer should be placed deep enough in the grooves for it to be in contact with moist bed soil. Bed presses are modified to provide the groove. Only water-soluble nutrient sources should be used for the banded fertilizer. A mixture of potassium nitrate (or potassium sulfate or potassium chloride), calcium nitrate, and ammonium nitrate has proven successful.
5. Fumigation, pressing of beds, and mulching. This should be done in one operation, if possible. Be sure that the mulching machine seals the edges of the mulch adequately with soil to prevent fumigant escape.
Water management with the seep irrigation system is critical to successful crops. Use water-table monitoring devices and/or tensiometers in the root zone to help provide an adequate water table but no higher than required for optimum moisture. It is recommended to limit fluctuations in water table depth since this can lead to increased leaching losses of plant nutrients.
Mulched Production with Drip Irrigation. Where drip irrigation is used, drip tape or tubes should be laid 1 to 2 inches below the bed soil surface prior to mulching. This placement helps protect tubes from mice and cricket damage. The drip system is an excellent tool with which to fertilize tomato. Where drip irrigation is used, apply all phosphorus and micronutrients, and 20 percent to 40 percent of total nitrogen and potassium preplant in the bed. Apply the remaining nitrogen and potassium through the drip system in increments as the crop develops.
Successful crops have resulted where the total amounts of N and K
2O were applied through the drip system. Some growers find
this method helpful where they have had problems with soluble-salt burn. This approach would be most likely to work on soils with relatively high organic matter and some residual potassium. However, it is important to begin with rather high rates of N and K
2O to ensure young transplants are established quickly. In most
situations, some preplant N and K fertilizers are needed.Suggested schedules for nutrient injections have been
successful in both research and commercial situations, but might need slight modifications based on potassium soil-test indices and grower experience (Table 1).
Sources of N-P2O
5-K
2O. About 30% to 50% of the total
applied nitrogen should be in the nitrate form for soil treated with multi-purpose fumigants and for plantings in cool soil. Controlled-release nitrogen sources may be used to supply a portion of the nitrogen requirement. One-third of the total required nitrogen can

- 47 -
be supplied from sulfur-coated urea (SCU), isobutylidene diurea (IBDU), or polymer-coated urea (PCU) fertilizers incorporated in the bed. Nitrogen from natural organics and most controlled-release materials is initially in the ammoniacal form, but is rapidly converted into nitrate by soil microorganisms.
Normal superphosphate and triple superphosphate are recommended for phosphorus needs. Both contribute calcium and normal superphosphate contributes sulfur.
All sources of potassium can be used for tomatoes. Potassium sulfate, sodium-potassium nitrate, potassium nitrate, potassium chloride, monopotassium phosphate, and potassium-magnesium sulfate are all good K sources. If the soil test predicted amounts of K
2O are applied, then there should be no concern for
the K source or its associated salt index.
Sap Testing and Tissue Analysis. While routine soil testing is essential in designing a fertilizer program, sap tests and/or tissue analyses reveal the actual nutritional status of the plant. Therefore these tools complement each other, rather than replace one another.
When drip irrigation is used, analysis of tomato leaves for mineral nutrient content (Table 2) or quick sap test (Table 3) can help guide a fertilizer management program during the growing season or assist in diagnosis of a suspected nutrient deficiency. Experience has shown that these tools are of limited use for routine analysis with seepage irrigated crops. However, they still may be used when deficiencies/toxicities are suspected.
For both nutrient monitoring tools, the quality and reliability of the measurements are directly related with the quality of the sample. A leaf sample should contain at least 20 most recently, fully developed, healthy leaves. Select representative plants, from representative areas in the field.
Supplemental Fertilizer Applications. In practice, supplemental fertilizer applications allow vegetable growers to numerically apply fertilizer rates higher than the standard UF/IFAS recommended rates when growing conditions require doing so. Applying additional fertilizer under the three circumstances described in Table 1 (leaching rain, ‘low’ foliar content, and extended harvest season) is part of the current UF/IFAS fertilizer recommendations and nutrient BMPs.
Levels of Nutrient Management for Tomato Production. Based on the growing situation and the level of adoption of the tools and techniques described above, different levels of nutrient management exist for tomato production in Florida. Successful production and nutrient BMPs requires management levels of 3 or above (Table 4).
SUGGESTED LITERATUREFlorida Department of Agriculture and Consumer Services. 2005. Florida Vegetable and Agronomic Crop Water Quality and Quantity BMP Manual.h t t p : / /www. f lo r i daagwa te rpo l i cy. com/PDFs /BMPs /vegetable&agronomicCrops.pdf
Gilbert, C.A and E.H. Simonne. 2005. Update and outlook for 2005 of Florida’s BMP program for vegetable crops, EDIS HS1013, http://edis.ifas.ufl.edu/HS256.
Hochmuth, G. 1994. Plant petiole sap-testing for vegetable crops. Univ. Fla. Coop. Ext. Circ. 1144, http://edis.ifas.ufl.edu/cv004
Hochmuth, G., D. Maynard, C. Vavrina, E. Hanlon, and E. Simonne. 2004. Plant tissue analysis and interpretation for vegetable crops in Florida. EDIS http://edis.ifas.ufl.edu/EP081.
Maynard, D.N., and G.J. Hochmuth. 1997. Knott’s Handbook for vegetable growers. 4th ed. Wiley Interscience, New York.
Olson, S.M., D.N. Maynard, G.J. Hochmuth, C.S. Vavrina, W.M. Stall, T.A. Kucharek, S.E. Webb, T.G. Taylor, S.A. Smith, and E.H. Simonne. 2004. Tomato production in Florida, pp. 301-316 In: S.M. Olson and E. Simonne (Eds.) 2004-2005 Vegetable Production Handbook for Florida, Vance Pub., Lenexa, KS.
Simonne, E.H. and G.J. Hochmuth. 2004. Soil and fertilizer management for vegetable production in Florida, pp. 3-16 In: S.M. Olson and E. Simonne (Eds.) 2004-2005 Vegetable Production Handbook for Florida, Vance Pub., Lenexa, KS.
Simonne, E., D. Studstill, B. Hochmuth, T. Olczyk, M. Dukes, R. Munoz-Carpena, and Y. Li. 2002. Drip irrigation: The BMP era - An integrated approach to water and fertilizer management in Florida, EDIS HS917, http://edis.ifas.ufl.edu/HS172.
Simonne, E.H. and G.J. Hochmuth. 2003. Principles of irrigation and fertilization management for vegetable crops grown in Florida in the BMP era: Introduction. EDIS HS897, http://edis.ifas.ufl.edu/HS154.

- 48 -
Table 1. Fertilization recommendations for tomato grown in Florida on sandy soils testing very low in Mehlich-1 potassium (K2O).
Production system Nutrient
Recommended base fertilizationz Recommended supplemental fertilizationz
Total(lb/A)
Preplanty
(lb/A)
Injectedx
Leaching rainr,s
Measured “low” plant nutrient
contentu,s
Extended harvest seasons
(lb/A/day)Weeks after transplantingw
1-2 3-4 5-11 12 13
Drip irrigation, raised beds, and polyethylenemulch
N 200 0-50 1.5 2.0 2.5 2.0 1.5 n/a 1.5 to 2 lb/A/day for 7dayst
1.5-2 lb/A/dayp
K2O 220 0-50 2.5 2.0 3.0 2.0 1.5 n/a 1.5-2 lb/A/day for 7dayst
1.5-2 lb/A/dayp
Seepage irrigation, raised beds, and polyethylenemulch
N 200 200v 0 0 0 0 0 30 lb/Aq 30 lb/At 30 lb/Ap
K2O 220 220v 0 0 0 0 0 20 lb/Aq 20 lb/At 20 lb/Ap
z 1 A = 7,260 linear bed feet per acre (6-ft bed spacing); for soils testing “very low” in Mehlich 1 potassium (K2O).y applied using the modified broadcast method (fertilizer is broadcast where the beds will be formed only, and not over the entire field).
Preplant fertilizer cannot be applied to double/triple crops because of the plastic mulch; hence, in these cases, all the fertilizer has to be injected.
x This fertigation schedule is applicable when no N and K2O are applied preplant. Reduce schedule proportionally to the amount of N and K2O applied preplant. Fertilizer injections may be done daily or weekly. Inject fertilizer at the end of the irrigation event and allow enough time for proper flushing afterwards.
w For a standard 13 week-long, transplanted tomato crop grown in the Spring.v Some of the fertilizer may be applied with a fertilizer wheel though the plastic mulch during the tomato crop when only part of the recommended base rate is applied preplant. Rate may be reduced when a controlled-release fertilizer source is used.u Plant nutritional status may be determined with tissue analysis or fresh petiole-sap testing, or any other calibrated method. The “low”
diagnosis needs to be based on UF/IFAS interpretative thresholds.t Plant nutritional status must be diagnosed every week to repeat supplemental application. s Supplemental fertilizer applications are allowed when irrigation is scheduled following a recommended method. Supplemental fertilization
is to be applied in addition to base fertilization when appropriate. Supplemental fertilization is not to be “applied “in advance” with the preplant fertilizer.
r A leaching rain is defined as a rainfall amount of 3 inches in 3 days or 4 inches in 7 days.q Supplemental amount for each leaching rainp Plant nutritional status must be diagnosed after each harvest before repeating supplemental fertilizer application.

- 49 -
Tabl
e 2.
Defi
cien
t, ad
equa
te, a
nd e
xces
sive
nut
rient
con
cent
ratio
ns fo
r tom
ato
[mos
t-rec
ently
-mat
ured
(MRM
) lea
f (bl
ade
plus
pet
iole
)].
NP
KCa
Mg
SFe
Mn
ZnB
CuM
o--
----
----
----
----
----
----
- % --
----
----
----
----
----
----
-- --
----
----
----
----
----
----
--- p
pm --
----
----
----
----
----
----
--
Tom
ato
MRM
z leaf
5-le
afst
age
Defic
ient
<3.0
0.3
3.0
1.0
0.3
0.3
40
30
25
20
50.
2Ad
equa
te ra
nge
3.05
.00.
30.6
3.05
.01.
02.0
0.30
.50.
30.8
4010
030
100
2540
2040
515
0.20
.6Hi
gh>5
.00.
65.
02.
00.
50.
810
010
0 4
0 4
015
0.6
MRM
leaf
Firs
tflow
erDe
ficie
nt<2
.80.
22.
51.
00.
30.
3 4
0 3
0 2
5 2
0 5
0.2
Adeq
uate
Ran
ge2.
84.0
0.20
.42.
54.0
1.02
.00.
30.5
0.30
.840
100
3010
025
4020
4051
50.
20.6
High
>4.0
0.4
4.0
2.0
0.5
0.8
100
100
40
40
150.
6T o
xic
(>)
1500
300
250
MRM
leaf
Early
fruit
set
Defic
ient
<2.5
0.2
2.5
1.0
0.25
0.3
40
30
20
20
50.
2Ad
equa
te R
ange
2.5
4.0
0.20
.42.
54.0
1.02
.00.
250.
50.
30.6
4010
030
100
2040
2040
510
0.20
.6Hi
gh>4
.00.
44.
02.
00.
50.
610
0 1
00 4
0 4
010
0.6
T oxi
c (>
)25
0
T om
ato
MRM
leaf
Firs
t rip
e fru
itDe
ficie
nt<2
.00.
22.
01.
00.
250.
3 4
0 3
020
20 5
0.2
Adeq
uate
Ran
ge 2
.0 3
.50.
20.4
2.04
.01.
02.0
0.25
0.5
0.30
.6 4
0100
301
0020
4020
40 5
100.
20.6
High
>3.5
0.4
4.0
2.0
0.5
0.6
100
100
4040
100.
6
MRM
leaf
Durin
g ha
r ves
t pe
riod
Defic
ient
<2.0
0.2
1.5
1.0
0.25
0.3
40
30
2020
50.
2Ad
equa
te R
ange
2.0
3.0
0.20
.41.
52.5
1.02
.00.
250.
50.
30.6
401
00 3
0100
2040
2040
510
0.20
.6Hi
gh>3
.00.
42.
52.
00.
50.
610
010
040
4010
0.6
z MRM
=Mos
t rec
ently
mat
ured
leaf
.

- 50 -
Table 3. Recommended nitrate-N and K concentrations in fresh petiole sap for tomato.Sap concentration (ppm)
Stage of growth NO3-N KFirst buds 1000-1200 3500-4000
First open flowers 600-800 3500-4000Fruits one-inch diameter 400-600 3000-3500Fruits two-inch diameter 400-600 3000-3500
First harvest 300-400 2500-3000Second harvest 200-400 2000-2500
Table 4. Progressive levels of nutrient management for tomato production.z
Nutrient ManagementLevel Rating Description
0 None Guessing1 Very low Soil testing and still guessing2 Low Soil testing and implementing “a” recommendation3 Intermediate Soil testing, understanding IFAS recommendations, and correctly implementing them4 Advanced Soil testing, understanding IFAS recommendations, correctly implementing them, and monitoring
crop nutritional status5 Recommended Soil testing, understanding IFAS recommendations, correctly implementing them, monitoring crop
nutritional status, and practice year-round nutrient management and/or following BMPs (including one of the recommended irrigation scheduling methods).
z These levels should be used together with the highest possible level of irrigation management

- 51 -
Tomato Fungicides and Other Disease Management Products (Updated June 2006) Tim Momol and Laura RitchieUF/IFAS, NFREC, Quincy, FL
Be sure to read a current product label before applying any chemical.
ChemicalFungicide
Group1
Maximum Rate / Acre / Min.
Days to Harvest
Pertinent Diseases or Pathogens Remarks2Applic. Season
Manex 4 F (maneb) M3 2.4 qts. 16.8 qts. 5 Early blightLate blightGray leaf spot Bacterial spot3
See label
Dithane, Manzate or Penncozeb 75 DFs (mancozeb)
M3 3 lbs. 22.4 lbs. 5
Maneb 80 WP (maneb)
M3 3 lbs 21 lbs. 5
Dithane F 45 or Manex II 4 FLs (mancozeb)
M3 2.4 pts. 16.8 qts. 5
Dithane M-45, Penncozeb 80, or Manzate 80 WPs (mancozeb)
M3 3 lbs. 21 lbs. 5
Maneb 75 DF (maneb)
M3 3 lbs. 22.4 lbs. 5 See label for details
Equus 7204, Echo 720, Chloro Gold 720 6 Fls (chlorothalonil)
M5 3 pts. or 2.88 pts.
20.1 pts. 2 Early blightLate blightGray leaf spotTarget spot
Use higher rates at fruit set and lower rates before fruit set, see label
Echo 90 DF or Equus 82.5DF (chlorothalonil)
M5 2.3 lbs. 2
Ridomil Gold Bravo 76.4 W (chlorothalonil +mefenoxam)
4 / M5 3 lbs. 12 lbs 14 Early blightLate blightGray leaf spotTarget Spot
Limit is 4 appl./crop, see label
Amistar 80 DF (azoxystrobin)
11 2 ozs 12 ozs 0 Early blightLate blightSclerotinia Powdery mildew
Limit is 2 sequential appl. or 6 application total. Alternate or tank mix with a multi-site effective fungicide (FRAC code M), see label
Quadris (azoxystrobin)
11 6.2 fl.ozs. 37.2 fl.ozs. 0 Target spotBuckeye rot
Cabrio 2.09 F (pyraclostro-bin)
11 16 fl oz 96 fl oz 0

- 52 -
ChemicalFungicide
Group1
Maximum Rate / Acre /
Min. Days to Harvest
Pertinent Diseases or Pathogens Remarks2Applic. Season
Flint (trifloxystro-bin) 11 16 oz 3 Early blight Late blightGray leaf spot
See label for details
Ridomil Gold EC (mefenoxam)
4 2 pts. / trtd. acre
3 pts / trtd. acre
28 Pythium diseases See label for details
Ridomil MZ 68 WP (mefenoxam + mancozeb)
4 / M3 2.5 lbs. 7.5 lbs. 5 Late blight Limit is 3 appl./crop, see label
Ridomil Gold Copper 64.8 W (mefenoxam + copper hydroxide)
4 / M1 2 lbs. 14 Late blight Limit is 3 appl. /crop. Tank mix with maneb or mancozeb fungicide, see label
JMS Stylet-Oil (paraffinic oil)
3 qts. Potato Virus YTobacco Etch VirusCMV
See label for restrictions and use (e.g. use of 400 psi spray pressure)
Aliette 80 WDG (fosetyl-al)
33 5 lbs. 20 lbs. 14 Phytophthora root rot Using potassium carbonate or Diammonium phosphate, the spray of Aliette should be raised to a pH of 6.0 or above when applied prior to or after copper fungicides, see label
Bravo Ultrex (chlorothalonil)
M5 2.6 lbs. 18.3 lbs 2 Early blightLate blightGray leaf spot Target spot BotrytisRhizoctonia fruit rot
Use higher rates at fruit set, see label
Bravo Weather Stik (chlorothalonil)
M5 2 ¾ pts. 20 pts 2
Botran 75 W (dichloran)
14 1 lb. 4 lbs. 10 Botrytis Greenhouse use only. Limit is 4 applications. Seedlings or newly set transplants may be injured, see label
Nova 40 W (myclobutanil)
3 4 ozs. 1.25 lbs. 0 Powdery mildew Note that a 30 day plant back restriction exists, see label
Sulfur (many brands) M2 1 Powdery mildew Follow label closely, it may cause phytotoxicity.
Actigard (acibenzolar-S-methyl)
P 1/3-3/4 oz. 4 ozs. 14 Bacterial spot Bacterial speck Tomato spotted wilt – a viral disease (use in combination of UV-reflective mulch and vector thrips specific insecticides).
Do not use highest labeled rate in early sprays to avoid a delayed onset of harvest. See label for details.
ManKocide 61.1 DF (mancozeb + copper hydroxide)
M3 / M1 5 lbs. 112 lbs. 5 Bacterial spotBacterial speckLate blightEarly blightGray leaf spot
See label
Gavel 75DF (mancozeb + zoaximide)
M3 / 22 2.0 lbs 16 lbs 5 Buckeye rot Early blightGray leaf spot Late blightLeaf mold
See label
Previcur Flex (propamocarb hydrochloride)
28 0.7-1.5 pints( see Label)
7.5 pints 5 Late blight Only in a tank mixture with chlorothalonil, maneb or mancozeb, see label
Curzate 60DF (cymoxanil)
27 5 oz 30 oz per 12 month
3 Late Blight Do not use alone, see label for details

- 53 -
ChemicalFungicide
Group1
Maximum Rate / Acre /
Min. Days to Harvest
Pertinent Diseases or Pathogens Remarks2Applic. Season
Tanos (famoxadone + cymoxanil)
11 / 27 8 oz 72 oz 3 Early blightLate blight Target spotBacterial spot (suppression)
See label for details
Acrobat 50 WP (dimethomorph)
15 6.4 oz 32 oz 4 Late blight See label for details
K-phite(Phosphorous acid)
33 2 qts. in a minimum of 100 gal.
0 Phytophthora sp. (root rot)Pythium sp. (Damping-off)
Dosage given is for drip application.See label for restrictions and details
Scala SC (pyrimethanil)
9 7 fl oz0.27 lbs
35 fl oz1.4 lbs
1 Early blightBotrytis
Use only in a tank mix with another effective fungicide (non FRAC code 9), see label
Endura (boscalid) 7 3.5 oz 21 0 Target spot(Corynespora cassiicola)Early Blight(Alternaria solani)
Alternate with non-FRAC code 7 fungicides, see label
Terraclor 75 WP (PCNB)
14 See Label See Label Soil trt. at
planting
Southern blight (Sclerotium rolfsii)
See label for application type and restrictions
Fix Copper +mancozeb or maneb
M1 / M3 5 Bacterial spotBacterial speck
Mancozeb or maneb enhances bactericidal effect of Fix copper compounds, see label
Kocide 101 or Champion 77 WPs (copper hydroxide)
M1 4 lbs. 2
Kocide 4.5 LF (copper hydroxide)
M1 2 2/3 pts 1
Kocide 2000 53.8 DF (copper hydroxide)
M1 3 lbs. 1
Champ 57.6 DP (copper hydroxide)
M1 1 1/3 lbs 1
Basicop 53 WP (copper sulfate)
M1 4 lbs. 1
Kocide 61.4 DF(copper hydroxide)
M1 4 lbs
Cuprofix Disperss 36.9 DF(copper hydroxide)
M1 6 lbs
Allpro Exotherm Termil(20 % chlorothalonil)
M5 1 can / 1000 sq. ft.
7 BotrytisLeaf moldLate blightEarly blight Gray leaf spotTarget spot
Greenhouse use only. Allow can to remain overnight and then ventilate. Do not use when greenhouse temperature is above 75 F, see label
Reason 500SC (fenamidone)
11 5.5-8.2 oz 24.6 lb 14 Early blight Late blight Septoria leaf spot
See label for details
Ranman 400SC (cyazofamid)
21 2.1-2.75 oz
16 oz 0 Late Blight Limit is 6 appl./crop, see label

- 54 -
ChemicalFungicide
Group1
Maximum Rate / Acre /
Min. Days to Harvest
Pertinent Diseases or Pathogens Remarks2Applic. Season
Serenade Serenade ASOSerenade Max(Bacillus subtilis)
Sonata(B. pumilis)
Biological material
See label See label 0 Bacterial spot mix with copper compounds, see label
1 Fungicide group (FRAC code): Numbers (1-37) and letters (M, U, P) are used to distinguish the fungicide mode of action groups. All fungicides within the same group (with same number or letter) indicate same active ingredient or similar mode of action. This information must be considered for the fungicide resistance management decisions. M = Multi site inhibitors, fungicide resistance risk is low; U = Recent molecules with unknown mode of action; P = host plant defense inducers. Source: http://www.frac.info/ (FRAC = Fungicide Resistance Action Committee).
2 Information provided in this table applies only to Florida. Be sure to read a current product label before applying any chemical. The use of brand names and any mention or listing of commercial products or services in the publication does not imply endorsement by the University of Florida Cooperative Extension Service nor discrimination against similar products or services not mentioned.
3 Tank mix of mancozeb or maneb enhances bactericidal effect of copper compounds.
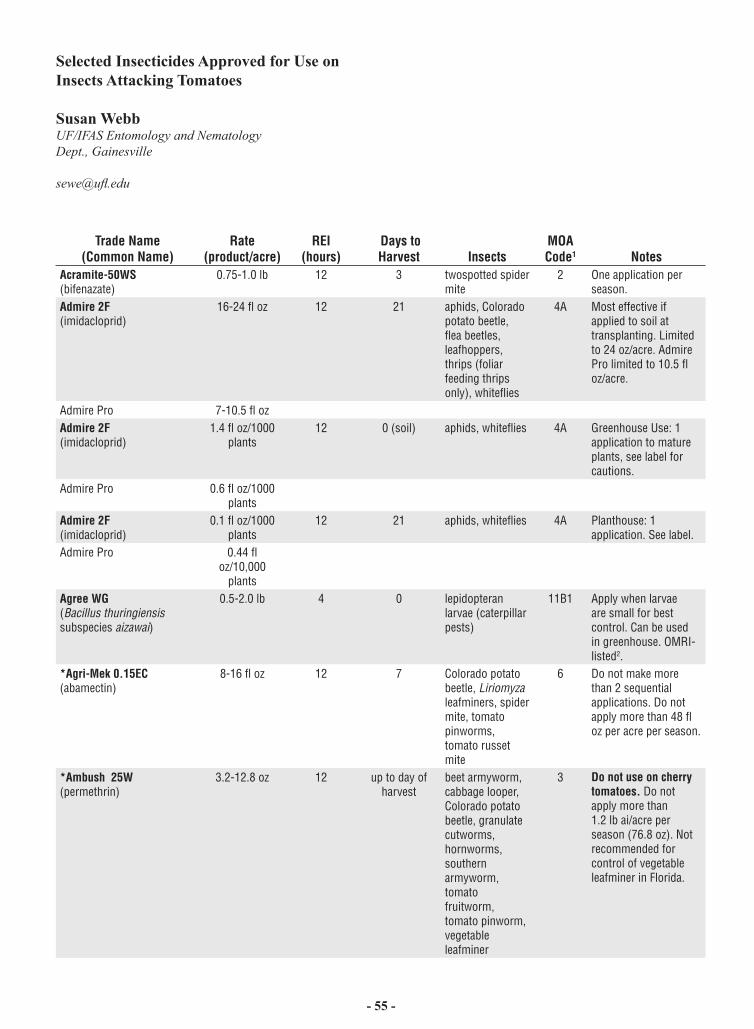
- 55 -
Selected Insecticides Approved for Use on Insects Attacking Tomatoes
Susan WebbUF/IFAS Entomology and Nematology Dept., Gainesville
Trade Name (Common Name)
Rate(product/acre)
REI (hours)
Days to Harvest Insects
MOA Code1 Notes
Acramite-50WS(bifenazate)
0.75-1.0 lb 12 3 twospotted spider mite
2 One application per season.
Admire 2F (imidacloprid)
16-24 fl oz 12 21 aphids, Colorado potato beetle, flea beetles, leafhoppers, thrips (foliar feeding thrips only), whiteflies
4A Most effective if applied to soil at transplanting. Limited to 24 oz/acre. Admire Pro limited to 10.5 fl oz/acre.
Admire Pro 7-10.5 fl ozAdmire 2F (imidacloprid)
1.4 fl oz/1000 plants
12 0 (soil) aphids, whiteflies 4A Greenhouse Use: 1 application to mature plants, see label for cautions.
Admire Pro 0.6 fl oz/1000 plants
Admire 2F (imidacloprid)
0.1 fl oz/1000 plants
12 21 aphids, whiteflies 4A Planthouse: 1 application. See label.
Admire Pro 0.44 fl oz/10,000
plantsAgree WG(Bacillus thuringiensis subspecies aizawai)
0.5-2.0 lb 4 0 lepidopteran larvae (caterpillar pests)
11B1 Apply when larvae are small for best control. Can be used in greenhouse. OMRI-listed2.
*Agri-Mek 0.15EC (abamectin)
8-16 fl oz 12 7
Colorado potato beetle, Liriomyza leafminers, spider mite, tomato pinworms, tomato russet mite
6 Do not make more than 2 sequential applications. Do not apply more than 48 fl oz per acre per season.
*Ambush 25W (permethrin)
3.2-12.8 oz 12 up to day of harvest
beet armyworm, cabbage looper, Colorado potato beetle, granulate cutworms, hornworms, southern armyworm, tomato fruitworm, tomato pinworm, vegetable leafminer
3 Do not use on cherry tomatoes. Do not apply more than 1.2 lb ai/acre per season (76.8 oz). Not recommended for control of vegetable leafminer in Florida.

- 56 -
Trade Name (Common Name)
Rate(product/acre)
REI (hours)
Days to Harvest Insects
MOA Code1 Notes
*Asana XL (0.66EC) (esfenvalerate)
2.9-9.6 fl oz 12 1
beet armyworm (aids in control), cabbage looper, Colorado potato beetle, cutworms, flea beetles, grasshoppers, hornworms, potato aphid, southern armyworm, tomato fruitworm, tomato pinworm, whiteflies, yellowstriped armyworm
3 Not recommended for control of vegetable leafminer in Florida. Do not apply more than 0.5 lb ai per acre per season, or 10 applications at highest rate.
Assail 70WP(acetamiprid)
0.6-1.7 oz 12 7 aphids, Colorado potato beetle, thrips, whiteflies
4A Do not apply to crop that has been already treated with imidacloprid or thiamethoxam at planting. Begin applications for whiteflies when first adults are noticed. Do not apply more than 4 times per season or apply more often than every 7 days.
Assail 30 SG 1.5-4.0 ozAvaunt (indoxacarb)
2.5-3.5 oz 12 3 beet armyworm, hornworms, loopers, southern armyworm, tomato fruitworm, tomato pinworm, suppression of leafminers
22 Do not apply more than 14 ounces of product per acre per crop. Minimum spray interval is 5 days.
Aza-Direct(azadirachtin)
1-2 pts, up to 3.5 pts, if
needed
4 0 aphids, beetles, caterpillars, leafhoppers, leafminers, mites, stink bugs, thrips, weevils, whiteflies
26 Antifeedant, repellant, insect growth regulator. OMRI-listed2.
Azatin XL (azadirachtin)
5-21 fl oz 4 0 aphids, beetles, caterpillars, leafhoppers, leafminers, thrips, weevils, whiteflies
26 Antifeedant, repellant, insect growth regulator.

- 57 -
Trade Name (Common Name)
Rate(product/acre)
REI (hours)
Days to Harvest Insects
MOA Code1 Notes
*Baythroid 2 (cyfluthrin)
1.6-2.8 fl oz 12 0
beet armyworm(1), cabbage looper, Colorado potato beetle, dipterous leafminers, European corn borer, flea beetles, hornworms, potato aphid, southern armyworm(1), stink bugs, tomato fruitworm, tomato pinworm, variegated cutworm , western flower thrips, whitefly(2)
3 (1) lst and 2nd instars only (2) suppression Do not apply more than 0.26 lb ai per acre per season. Maximum number of applications: 6.
Biobit HP(Bacillus thuringiensis subspecies kurstaki)
0.5-2.0 lb 4 0 caterpillars (will not control large armyworms)
11B2 Treat when larvae are young. Good coverage is essential. Can be used in the greenhouse. OMRI-listed2.
BotaniGard 22 WP, ES(Beauveria bassiana)
WP:0.5-2 lb/100 gal
ES:0.5-2 qts 100/
gal
4 0 aphids, thrips, whiteflies
-- May be used in greenhouses. Contact dealer for recommendations if an adjuvant must be used. Not compatible in tank mix with fungicides.
*Capture 2EC(bifenthrin)
2.1-5.2 fl oz 12 1 aphids, armyworms, corn earworm, cutworms, flea beetles, grasshoppers, mites, stink bug spp., tarnished plant bug, thrips, whiteflies
3 Make no more than 4 applications per season. Do not make applications less than 10 days apart.
CheckMate TPW, TPW-F (pheromone)
TPW: 200 dispenser
TPW-F:1.2-6.0 fl oz
0 0 tomato pinworm -- For mating disruption - See label. TPW formulation. OMRI-listed2.
Confirm 2F (tebufenozide)
6-16 fl oz 4 7
armyworms, black cutworm, hornworms, loopers
18 Product is a slow-acting IGR that will not kill larvae immediately. Do not apply more than 1.0 lb ai per acre per season.

- 58 -
Trade Name (Common Name)
Rate(product/acre)
REI (hours)
Days to Harvest Insects
MOA Code1 Notes
Courier 70WP, 40SC (buprofezin)
70WP:6-9 oz40SC:
9-13.6 fl oz
12 1 whitefly nymphs 16 See label for plantback restrictions. Apply when a threshold is reached of 5 nymphs per 10 leaflets from the middle of the plant. Product is a slow-acting IGR that will not kill nymphs immediately. No more than 2 applications per season. Allow at least 28 days between applications.
Crymax WDG(Bacillus thuringiensis subspecies kurstaki)
0.5-2.0 lb 4 0 caterpillars 11B2 Use high rate for armyworms. Treat when larvae are young.
*Danitol 2.4 EC (fenpropathrin)
10.67 fl oz 24 3 days, or 7 if mixed with
Monitor 4
beet armyworm, cabbage looper, fruitworms, potato aphid, silverleaf whitefly, stink bugs, thrips, tomato pinworm, twospotted spider mites, yellowstriped armyworm
3 Use alone for control of fruitworms, stink bugs, twospotted spider mites, and yellowstriped armyworms. Tank-mix with Monitor 4 for all others, especially whitefly. Do not apply more than 0.8 lb ai per acre per season. Do not tank mix with copper.
Deliver(Bacillus thuringiensis subspecies kurstaki)
0.25-1.5 lb 4 0 caterpillars 11B2 Use higher rates for armyworms. OMRI-listed2.
*Diazinon AG500; 4E; *50 W(diazinon)
AG500, 4E: 0.5-1.5 pts
50W: 0.5-1.5 lb
24
1
aphids, beet armyworm, banded cucumber beetle, Drosophila, fall armyworm, dipterous leafminers, southern armyworm
1B Will not control organophosphate- resistant leafminers. Do not apply more than five times per season.
AG500, 4E:1-4 qts
50W: 2-8 lb
24 preplant cutworms, mole crickets, wireworms
Dimethoate 4 EC, 2.67 EC (dimethoate)
4EC:0.5-1.0 pt
2.67:0.75-1.5 pt
48 7 aphids, leafhoppers, leafminers
1B Will not control organophosphate-resistant leafminers.
DiPel DF(Bacillus thuringiensis supspecies kurstaki)
0.5-2.0 lb 4 0 caterpillars 11B2 Treat when larvae are young. Good coverage is essential. OMRI-listed2.

- 59 -
Trade Name (Common Name)
Rate(product/acre)
REI (hours)
Days to Harvest Insects
MOA Code1 Notes
Endosulfan 3EC(endosulfan)
0.66-1.33 qt 24 2 aphids, blister beetle, cabbage looper, Colorado potato beetle, flea beetles, hornworms, stink bugs, tomato fruitworm, tomato russet mite, whiteflies, yellowstriped armyworm
2 Do not exceed a maximum of 3.0 lb active ingredient per acre per year or apply more than 6 times. Can be used in greenhouse.
Entrust(spinosad)
0.5-2.5 oz 4 1 armyworms, Colorado potato beetle, flower thrips, hornworms, Liriomyza leafminers, loopers, other caterpillars, tomato fruitworm, tomato pinworm
5 Do not apply more than 9 oz per acre per crop. OMRI-listed2.
Esteem Ant Bait(pyriproxyfen)
1.5-2.0 lb 12 1 red imported fire ant
7D Apply when ants are actively foraging.
Extinguish ((S)-methoprene)
1.0-1.5 lb 4 0 fire ants 7A Slow-acting IGR (insect growth regulator). Best applied early spring and fall where crop will be grown. Colonies will be reduced after three weeks and eliminated after 8 to 10 weeks. May be applied by ground equipment or aerially.
Fulfill (pymetrozine)
2.75 oz 12 0 - if 2 applications14 - if 3 or 4 applications
green peach aphid, potato aphid, suppression of whiteflies
9B Do not make more than four applications. 24(c) label for growing transplants also.
Intrepid 2F(methoxyfenozide)
4-16 fl oz 4 1 beet armyworm, cabbage looper, fall armyworm, hornworms, southern armyworm, tomato fruitworm, true armyworm, yellowstriped armyworm
18 Do not apply more than 64 fl oz acre per season. Product is a slow-acting IGR that will not kill larvae immediately.
Javelin WG(Bacillus thuringiensis subspecies kurstaki)
0.12-1.5 lb 4 0 most caterpillars, but not Spodoptera species (armyworms)
11B2 Treat when larvae are young. Thorough coverage is essential.OMRI-listed2.

- 60 -
Trade Name (Common Name)
Rate(product/acre)
REI (hours)
Days to Harvest Insects
MOA Code1 Notes
Kelthane MF 4 (dicofol)
0.75-1.5 pt 12 2
tomato russet mites, twospotted and other spider mites
20 Do not apply more than twice a season or more than 1.6 pts per year.
Knack IGR (pyriproxyfen)
8-10 fl oz 12 14
immature whiteflies
7D Apply when a threshold is reached of 5 nymphs per 10 leaflets from the middle of the plant. Product is a slow-acting IGR that will not kill nymphs immediately. Make no more than two applications per season.
Kryocide; (cryolite)
8-16 lb 12 14
blister beetle, cabbage looper, Colorado potato beetle larvae, flea beetles, hornworms, tomato fruitworm, tomato pinworm
9A Minimum of 7 days between applications. Do not apply more than 64 lbs per acre per season. Not for cherry tomatoes.
*Lannate LV, *SP (methomyl)
LV:0.75-3.0 pt
SP:0.25-1.0 lb
48 1
aphids, armyworms, beet armyworm, fall armyworm, hornworms, loopers, southern armyworm, tomato fruitworm, tomato pinworm, variegated cutworm
1A Do not apply more than 6.3 lb ai/acre per crop.
Lepinox WDG(Bacillus thuringiensis subspecies kurstaki)
1.0-2.0 lb 12 0 for most caterpillars, including beet armyworm (see label)
11B2 Treat when larvae are small. Thorough coverage is essential.
Malathion 8 F(malathion)
1.5-2 pt 12 1 aphids, Drosophila, mites
1B Can be used in greenhouse.
*Monitor 4EC (methamidophos)
[24(c) labels]
1.5-2 pts 48 7
aphids, fruitworms, leafminers, tomato pinworm(1), whiteflies(2)
1B (1) Suppression only(2) Use as tank mix with a pyrethroid for whitefly control. Do not apply more than 8 pts per acre per crop season, nor within 7 days of harvest.
M-Pede 49% EC (Soap, insecticidal)
1-2% V/V 12 0 aphids, leafhoppers, mites, plant bugs, thrips, whiteflies
-- OMRI-listed2.

- 61 -
Trade Name (Common Name)
Rate(product/acre)
REI (hours)
Days to Harvest Insects
MOA Code1 Notes
*Mustang Max(zeta-cypermethrin)
2.24-4.0 oz 12 1 beet armyworm, cabbage looper, Colorado potato beetle, cutworms, fall armyworm, flea beetles, grasshoppers, green and brown stink bugs, hornworms, leafminers, leafhoppers, Lygus bugs, plant bugs, southern armyworm, tobacco budworm, tomato fruitworm, tomato pinworm, true armyworm, yellowstriped armyworm. Aides in control of aphids, thrips and whiteflies.
3 Not recommended for vegetable leafminer in Florida. Do not make applications less than 7 days apart. Do not apply more than 0.3 lb ai per acre per season.
Neemix 4.5 (azadirachtin)
4-16 fl oz 12 0 aphids, armyworms, hornworms, psyllids, Colorado potato beetle, cutworms, leafminers, loopers, tomato fruitworm (corn earworm), tomato pinworm, whiteflies
18A IGR, feeding repellant. OMRI-listed2.
NoMate MEC TPW (pheromone)
0 0 tomato pinworm -- For mating disruption - See label.
Oberon 2SC(spiromesifen)
7.0-8.5 fl oz 12 7 broad mite, twospotted spider mite, whiteflies (eggs and nymphs)
23 Maximum amount per crop: 25.5 fl oz/acre. No more than 3 applications.
Platinum (thiamethoxam)
5-8 fl oz 12 30 aphids, Colorado potato beetles, flea beetles, whiteflies
4A Soil application. See label for rotational restrictions.
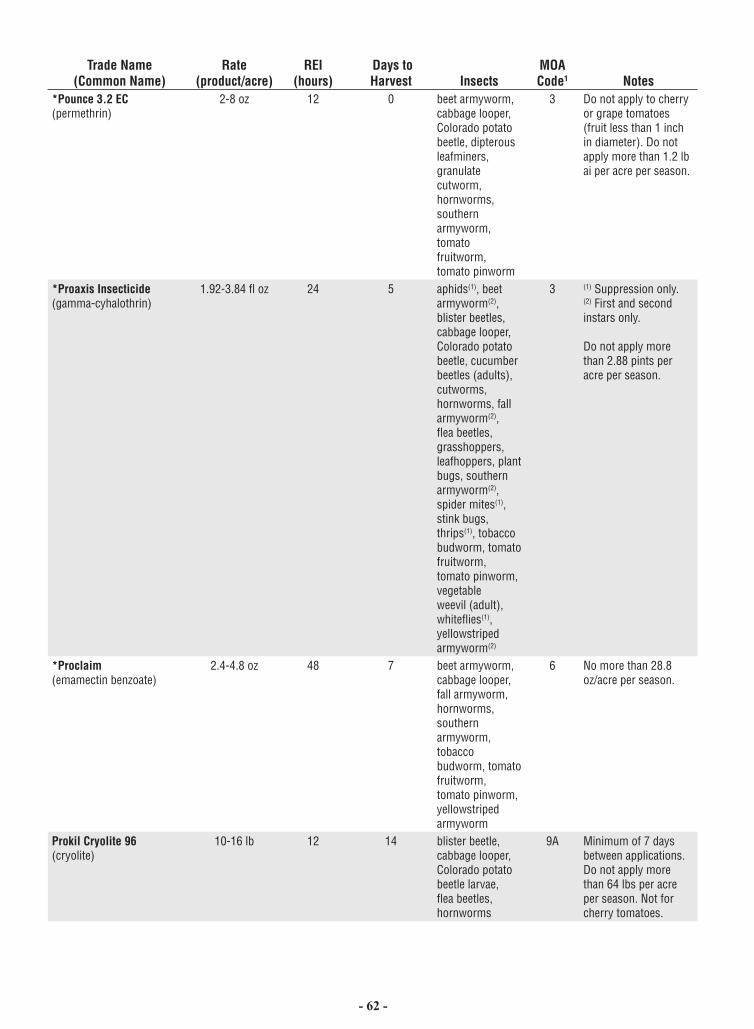
- 62 -
Trade Name (Common Name)
Rate(product/acre)
REI (hours)
Days to Harvest Insects
MOA Code1 Notes
*Pounce 3.2 EC (permethrin)
2-8 oz 12 0
beet armyworm, cabbage looper, Colorado potato beetle, dipterous leafminers, granulate cutworm, hornworms, southern armyworm, tomato fruitworm, tomato pinworm
3 Do not apply to cherry or grape tomatoes (fruit less than 1 inch in diameter). Do not apply more than 1.2 lb ai per acre per season.
*Proaxis Insecticide(gamma-cyhalothrin)
1.92-3.84 fl oz 24 5 aphids(1), beet armyworm(2), blister beetles, cabbage looper, Colorado potato beetle, cucumber beetles (adults), cutworms, hornworms, fall armyworm(2), flea beetles, grasshoppers, leafhoppers, plant bugs, southern armyworm(2), spider mites(1), stink bugs, thrips(1), tobacco budworm, tomato fruitworm, tomato pinworm, vegetable weevil (adult), whiteflies(1), yellowstriped armyworm(2)
3 (1) Suppression only.(2) First and second instars only.
Do not apply more than 2.88 pints per acre per season.
*Proclaim(emamectin benzoate)
2.4-4.8 oz 48 7 beet armyworm, cabbage looper, fall armyworm, hornworms, southern armyworm, tobacco budworm, tomato fruitworm, tomato pinworm, yellowstriped armyworm
6 No more than 28.8 oz/acre per season.
Prokil Cryolite 96 (cryolite)
10-16 lb 12 14
blister beetle, cabbage looper, Colorado potato beetle larvae, flea beetles, hornworms
9A Minimum of 7 days between applications. Do not apply more than 64 lbs per acre per season. Not for cherry tomatoes.

- 63 -
Trade Name (Common Name)
Rate(product/acre)
REI (hours)
Days to Harvest Insects
MOA Code1 Notes
Provado 1.6F (imidacloprid)
3.8 oz 12 0
aphids, Colorado potato beetle, leafhoppers, whiteflies
4A Do not apply to crop that has been already treated with imidacloprid or thiamethoxam at planting. Do not apply more than 18.75 oz per acre as foliar spray.
Pyrellin EC (pyrethrin + rotenone)
1-2 pt 12 12 hours
aphids, Colorado potato beetle, cucumber beetles, flea beetles, flea hoppers, leafhoppers, leafminers, loopers, mites, plant bugs, stink bugs, thrips, vegetable weevil, whiteflies
3, 21
Sevin 80S; XLR; 4F (carbaryl)
80S: 0.63-2.5XLR; 4F: 0.5-
2.0 A
12 3
Colorado potato beetle, cutworms, fall armyworm, flea beetles, lace bugs, leafhoppers, plant bugs, stink bugs(1), thrips(1), tomato fruitworm, tomato hornworm, tomato pinworm, sowbugs
1A (1) suppression Do not apply more than seven times. Do not apply a total of more than 10 lb or 8 qt per acre per crop.
SpinTor 2SC (spinosad)
1.5-8.0 fl oz 4 1
armyworms, Colorado potato beetle, flower thrips, hornworms, Liriomyza leafminers, loopers, Thrips palmi, tomato fruitworm, tomato pinworm
5 Do not apply to seedlings grown for transplant within a greenhouse or shadehouse. Leafminer and thrips control may be improved by adding an adjuvant. Do not apply more than three times in any 21 day period. Do not apply more than 29 ozs per acre per crop.
Sulfur (many brands) See label 24 see label tomato russet mite
--
*Telone C-35 (dichloropropene + chloropicrin)
See label 5 days (See label)
preplant
garden centipedes (symphylans), wireworms
-- See supplemental label for restrictions in certain Florida counties.
*Telone II(dichloropropene)

- 64 -
Trade Name (Common Name)
Rate(product/acre)
REI (hours)
Days to Harvest Insects
MOA Code1 Notes
Trigard (cyromazine)
26.6 oz 12 0 Colorado potato beetle (suppression of), leafminers
17 No more than 6 applications per crop.
Trilogy(extract of neem oil)
0.5-2.0% V/V 4 0 aphids, mites, suppression of thrips and whiteflies
26 Apply morning or evening to reduce potential for leaf burn. Toxic to bees exposed to direct treatment. OMRI-listed2.
Ultra Fine Oil,JMS Stylet-Oil, and others(oil, insecticidal)
3-6 qts/100 gal (JMS)
4 0 aphids, beetle larvae, leafhoppers, leafminers, mites, thrips, whiteflies, aphid-transmitted viruses (JMS)
-- Do not exceed four applications per season. Organic Stylet-Oil is OMRI-listed2.
Venom(dinotefuran)
foliar: 1-4 oz
soil: 5-6 oz
12 foliar: 1soil: 21
Colorado potato beetle, green peach aphid, flea beetles, leafhoppers, leafminers, potato aphid thrips, whiteflies
4A Use only one application method (soil or foliar). Limited to three applications per season. Do not use on grape or cherry tomatoes.
*Vydate L 2EC (oxamyl)
foliar: 2-4 pt 48 3
aphids, Colorado potato beetle, leafminers (except Liriomyza trifolii), whiteflies (suppression only)
1A Do not apply more than 32 pts per acre per season.
*Warrior (lambda-cyhalothrin)
1.92-3.84 fl oz 24 5 aphids(1), beet armyworm(2), cabbage looper, Colorado potato beetle, cutworms, fall armyworm(2), flea beetles, grasshoppers, hornworms, leafhoppers, leafminers(1), plant bugs, southern armyworm(2), stink bugs, thrips(3), tomato fruitworm, tomato pinworm, whiteflies(1), yellowstriped armyworm(2)
3 (1) suppression only (2) for control of 1st and 2nd instars only. Do not apply more than 0.36 lb ai per acre per season. (3)Does not control western flower thrips.

- 65 -
Trade Name (Common Name)
Rate(product/acre)
REI (hours)
Days to Harvest Insects
MOA Code1 Notes
Xentari DF(Bacillus thuringiensis subspecies aizawai)
0.5-2 lb 4 0 caterpillars 11B1 Treat when larvae are young. Thorough coverage is essential. May be used in the greenhouse. Can be used in organic production. OMRI-listed2.
The pesticide information presented in this table was current with federal and state regulations at the time of revision. The user is responsible for determining the intended use is consistent with the label of the product being used. Use pesticides safely. Read and follow label instructions.
1 Mode of Action codes for vegetable pest insecticides from the Insecticide Resistance Action Committee (IRAC) Mode of Action Classification v.3.3 October 2003. 1A. Acetylcholine esterase inhibitors, Carbamates 1B. Acetylcholine esterase inhibitors, Organophosphates
2A. GABA-gated chloride channel antagonists 3. Sodium channel modulators 4A. Nicotinic Acetylcholine receptor agonists/antagonists, Neonicotinoids 5. Nicotinic Acetylcholine receptor agonists (not group 4) 6. Chloride channel activators 7A. Juvenile hormone mimics, Juvenile hormone analogues 7D. Juvenile hormone mimics, Pyriproxifen 9A. Compounds of unknown or non-specific mode of action (selective feeding blockers), Cryolite 9B. Compounds of unknown or non-specific mode of action (selective feeding blockers), Pymetrozine 11B1. Microbial disruptors of insect midgut membranes, B.t. var aizawai 11B2. Microbial disruptors of insect midgut membranes, B.t. var kurstaki 12B. Inhibitors of oxidative phosphorylation, disruptors of ATP formation, Organotin miticide 15. Inhibitors of chitin biosynthesis, type 0, Lepidopteran 16. Inhibitors of chitin biosynthesis, type 1, Homopteran 17. Inhibitors of chitin biosynthesis, type 2, Dipteran 18. Ecdysone agonist/disruptor 20. Site II electron transport inhibitors 21. Site I electron transport inhibitors 22. Voltage-dependent sodium channel blocker 23. Inhibitors of lipid biosynthesis 25. Neuroactive (unknown mode of action) 26. Unknown mode of action, Azadirachtin2 OMRI listed: Listed by the Organic Materials Review Institute for use in organic production.
* Restricted Use Only

- 66 -
Weed Control in Tomato
William M. Stall and James P. GilreathUF/IFAS Horticultural Sciences Department, Gainesville
Although weed control has always been an important component of tomato production, its importance has increased with the introduction of the sweet potato whitefly and development of the associated irregular ripening problem. Increased incidence of several viral disorders of tomatoes also reinforces the need for good weed control. Common weeds, such as the difficult to control nightshade, and volunteer tomatoes (considered a weed in this context) are hosts to many tomato pests, including sweet potato whitefly, bacterial spot, and viruses. Control of these pests is often tied, at least in part, to control of weed hosts. Most growers concentrate on weed control in row middles; however, peripheral areas of the farm may be neglected. Weed hosts and pests may flourish in these areas and serve as reservoirs for re-infestation of tomatoes by various pests. Thus, it is important for growers to think in terms of weed management on all of the farm, not just the actual crop area.
Total farm weed management is more complex than row middle weed control because several different sites, and possible herbicide label restrictions are involved. Often weed species in row middles differ from those on the rest of the farm, and this might dictate different approaches. Sites other than row middles include roadways, fallow fields, equipment parking areas, well and pump areas, fence rows and associated perimeter areas, and ditches.
Disking is probably the least expensive weed control procedure for fallow fields. Where weed growth is mostly grasses, clean cultivation is not as important as in fields infested with nightshade and other disease and insect hosts. In the latter situation, weed growth should be kept to a minimum throughout the year. If cover crops are planted, they should be plants which do not serve as hosts for tomato diseases and insects. Some perimeter areas are easily disked, but berms and field ditches are not and some form of chemical weed control may have to be used on these areas. We are not advocating bare ground on the farm as this can lead to other serious problems, such as soil erosion and sand blasting of plants; however, where undesirable plants exist, some control should be practiced, if practical, and replacement of undesirable species with less troublesome ones, such as bahiagrass, might be worthwhile.
Certainly fence rows and areas around buildings and pumps should be kept weed-free, if for no other reason than safety. Herbicides can be applied in these situations, provided care is exercised to keep it from drifting onto the tomato crop.
Field ditches as well as canals are a special consideration because many herbicides are not labeled for use on aquatic sites. Where herbicidal spray may contact water and be in close proximity to tomato plants, for all practical purposes, growers probably would be wise to use Diquat only. On canals where drift onto the crop is not a problem and weeds are more woody, Rodeo, a systemic herbicide, could be used. Other herbicide possibilities
exist, as listed in Table 1. Growers are cautioned against using Arsenal on tomato farms as tomatoes are very sensitive to this herbicide. Particular caution should be exercised if Arsenal is used on seepage irrigated farms as it has been observed to move in some situations.
Use of rye as a windbreak has become a common practice in the spring; however, in some cases, adverse effects have resulted. If undesirable insects such as thrips buildup on the rye, contact herbicide can be applied to kill it and eliminate it as a host, yet the remaining stubble could continue serving as a windbreak.
The greatest row middle weed control problem confronting the tomato industry today is control of nightshade. Nightshade has developed varying levels of resistance to some post-emergent herbicides in different areas of the state. Best control with post-emergence (directed) contact herbicides are obtained when the nightshade is 4 to 6 inches tall, rapidly growing and not stressed. Two applications in about 50 gallons per acre using a good surfactant are usually necessary.
With post-directed contact herbicides, several studies have shown that gallonage above 60 gallons per acre will actually dilute the herbicides and therefore reduce efficacy. Good leaf coverage can be obtained with volumes of 50 gallons or less per acre. A good surfactant can do more to improve the wetting capability of a spray than can increasing the water volume. Many adjuvants are available commercially. Some adjuvants contain more active ingredient then others and herbicide labels may specify a minimum active ingredient rate for the adjuvant in the spray mix. Before selecting an adjuvant, refer to the herbicide label to determine the adjuvant specifications.
Postharvest Vine Desiccation. Additionally important is good field sanitation with regard to crop residue. Rapid and thorough destruction of tomato vines at the end of the season always has been promoted; however, this practice takes on new importance with the sweet potato whitefly. Good canopy penetration of pesticidal sprays is difficult with conventional hydraulic sprayers once the tomato plant develops a vigorous bush due to foliar interception of spray droplets. The sweet potato whitefly population on commercial farms was observed to begin a dramatic, rapid increase about the time of first harvest in the spring of 1989. This increase appears to continue until tomato vines are killed. It is believed this increase is due, in part, to coverage and penetration. Thus, it would be wise for growers to continue spraying for whiteflies until the crop is destroyed and to destroy the crop as soon as possible with the fastest means available. Gramoxone Inteon is now labeled for postharvest dessication of tomato vines. The label differs slightly from the previous Gramoxone labels, so it’s important to read and follow the label directions.
The importance of rapid vine destruction can not be overstressed. Merely turning off the irrigation and allowing the crop to die is not sufficient; application of a desiccant followed by burning is the prudent course.

- 67 -
Table 1. Chemical weed controls: tomatoes.
Herbicide Labeled Crops Time of Application to CropRate (lbs. AI./Acre)
Mineral MuckCarfentrazone(Aim)
Tomato Preplant Directed-Hooded row-middles
0.031 0.031
Remarks: Aim may be applied as a preplant burndown treatment and /or as a post-directed hooded application to row middles for the burndown of emerged broadleaf weeds. May be tank mixed with other registered herbicides. May be applied up to 2 oz (0.031 lb ai). Use a quality spray adjuvant such as crop oil concentrate (coc) or non-ionic surfactant at recommended rates.Clethodim (Select 2 EC)
Tomatoes Postemergence 0.9-.125 ---
Remarks: Postemergence control of actively growing annual grasses. Apply at 6-8 fl oz/acre. Use high rate under heavy grass pressure and/or when grasses are at maximum height. Always use a crop oil concentrate at 1% v/v in the finished spray volume. Do not apply within 20 days of tomato harvest.DCPA (Dacthal W-75)
Established Tomatoes Posttransplanting after crop establishment (non-mulched)
6.0-8.0 ---
Remarks: Controls germinating annuals. Apply to weed-free soil 6 to 8 weeks after crop is established and growing rapidly or to moist soil in row middles after crop establishment. Note label precautions of replanting non-registered crops within 8 months.Glyphosate (Roundup, Durango Touchdown, Glyphomax)
Tomato Chemical fallow Preplant, pre-emergence, Pre transplant
0.3-1.0 ---
Remarks: Roundup, Glyphomax and touchdown have several formulations. Check the label of each for specific labeling directions.Halosulfuron (Sandea)
Tomatoes Pre-transplantPostemergtenceRow middles
0.024 - 0.036 ---
Remarks: A total of 2 applications of Sandea may be applied as either one pre-transplant soil surface treatment at 0.5-0.75 oz. product; one over-the-top application 14 days after transplanting at 0.5-0.75 oz. product; and/or postemergence applications(s) of up to 1 oz. product (0.047 lb ai) to row middles. A 30-day PHI will be observed. For postemergence and row middle applications, a surfactant should be added to the spray mix.S-Metolachlor (Dual Magnum)
Tomatoes PretransplantRow middles
1.0 - 1.3 ---
Remarks: Apply Dual Magnum preplant non-incorporated to the top of a pressed bed as the last step prior to laying plastic. May also be used to treat row-middles. Label rates are 1.0-1.33 pts/A if organic matter is less than 3%. Research has shown that the 1.33 pt may be too high in some Florida soils except in row middles. Good results have been seen at 0.6 pts to 1.0 pints especially in tank mix situations under mulch. Use on a trial basis.Metribuzin(Sencor DF) (Sencor 4)
Tomatoes PostemergencePosttransplanting after establishment
0.25 - 0.5 ---
Remarks: Controls small emerged weeds after transplants are established direct-seeded plants reach 5 to 6 true leaf stage. Apply in single or multiple applications with a minimum of 14 days between treatments and a maximum of 1.0 lb ai/acre within a crop season. Avoid applications for 3 days following cool, wet or cloudy weather to reduce possible crop injury.Metribuzin(Sencor DF) (Sencor 4)
Tomatoes Directed spray in row middles 0.25 - 1.0 ---
Remarks: Apply in single or multiple applications with a minimum of 14 days between treatments and maximum of 1.0 lb ai/acre within crop season. Avoid applications for 3 days following cool, wet or cloudy weather to reduce possible crop injury. Label states control of many annual grasses and broadleaf weeds including, lambsquarter, fall panicum, amaranthus sp., Florida pusley, common ragweed, sicklepod, and spotted spurge.Napropamid (Devrinol 50DF)
Tomatoes Preplant incorporated 1.0 - 2.0 ---
Remarks: Apply to well worked soil that is dry enough to permit thorough incorporation to a depth of 1 to 2 inches. Incorporate same day as applied. For direct-seeded or transplanted tomatoes.Napropamid (Devrinol 50DF)
Tomatoes Surface treatment 2.0 ---
Remarks: Controls germinating annuals. Apply to bed tops after bedding but before plastic application. Rainfall or overhead-irrigate sufficient to wet soil 1 inch in depth should follow treatment within 24 hours. May be applied to row middles between mulched beds. A special Local Needs 24(c) Label for Florida. Label states control of weeds including Texas panicum, pigweed, purslane, Florida pusley, and signalgrass.

- 68 -
Table 1. Chemical weed controls: tomatoes.
Herbicide Labeled Crops Time of Application to CropRate (lbs. AI./Acre)
Mineral MuckOxyfluorfen (Goal 2XL) (Goaltender)
Tomatoes Fallow bed 0.25 - 0.5
Remarks: Must have a 30 day treatment-planting interval for transplanted tomatoes. Apply as a preemergence broadcast or banded treatment at 1-2 pt/A or ½ to 1 pt/A for Goaltender to preformed beds. Mulch may be applied any time during the 30-day interval.Paraquat (Gramoxone Inteon) (Firestorm)
Tomatoes Premergence; Pretransplant 0.62 - 0.94 ---
Remarks: Controls emerged weeds. Use a non-ionic spreader and thoroughly wet weed foliage.Paraquat(Gramoxone Inteon)
Tomatoes Post directed spray in row middle 0.47 ---
Remarks: Controls emerged weeds. Direct spray over emerged weeds 1 to 6 inches tall in row middles between mulched beds. Use a non-ionic spreader. Use low pressure and shields to control drift. Do not apply more than 3 times per season.Paraquat (Gramoxone Inteon)
Tomato Postharvestdessication
0.62-0.93 0.46-0.62
Remarks: Broadcast spry over the top of plants after last harvest. Label for Boa states use of 1.5-2.0 pts while Gramoxone label is from 2-3 pts. Use a nonionic surfactant at 1 pt/100 gals to 1 qt/100 gals spray solution. Thorough coverage is required to ensure maximum herbicide burndown. Do not use treated crop for human or animal consumption.Pelargonic Acid (Scythe) Fruiting Vegetable (tomato) PreplantPreemergence
Directed-Shielded3-10% v/v
Remarks: Product is a contact, nonselective, foliar applied herbicide. There is no residual control. May be tank mixed with several soil residual compounds. Consult the label for rates. Has a greenhouse and growth structure label.Rimsulfuron (Matrix)
Tomato Posttransplant and directed-row middles 0.25 - 0.5 oz.
Remarks: Matrix may be applied preemergence (seeded), postemergence, posttransplant and applied directed to row middles. May be applied at 1-2 oz. product (0.25-0.5 oz ai) in single or sequential applications. A maximum of 4 oz. product per acre per year may be applied. For post (weed) applications, use a non-ionic surfactant at a rate of 0.25% v/v. for preemergence (weed) control, Matrix must be activated in the soil with sprinkler irrigation or rainfall. Check crop rotational guidelines on label.Sethoxydim (Poast) Tomatoes Postemergence 0.188 - 0.28Remarks: Controls actively growing grass weeds. A total of 42 pts. product per acre may be applied in one season. Do not apply within 20 days of harvest. Apply in 5 to 20 gallons of water adding 2 pts. of oil concentrate per acre. Unsatisfactory results may occur if applied to grasses under stress. Use 0.188 lb ai (1 pt.) to seedling grasses and up to 0.28 lb ai (12 pts.) to perennial grasses emerging from rhizomes etc. Consult label for grass species and growth stage for best control.Trifloxysulfuron (Envoke)
Tomatoes(transplanted)
Post directed 0.007-0.014
Remarks: Envoke can be applied at 0.1 to 0.2 oz product/A post-directed to transplanted tomatoes for control of nutsedge, morningglory, pigweeds and other weeds listed on the label. Applications should be made prior to fruit set and at least45 days prior to harvest. A non-ionic surfactant should be added to the spray mix.Trifluralin (Treflan HFP) (Treflan TR-10) (Trifluralin 4EC)
Tomatoes (except Dade County)
Pretransplant incorporated 0.5
Remarks: Controls germinating annuals. Incorporate 4 inches or less within 8 hours of application. Results in Florida are erratic on soils with low organic matter and clay contents. Note label precautions of planting non-registered crops within 5 months. Do not apply after transplanting.
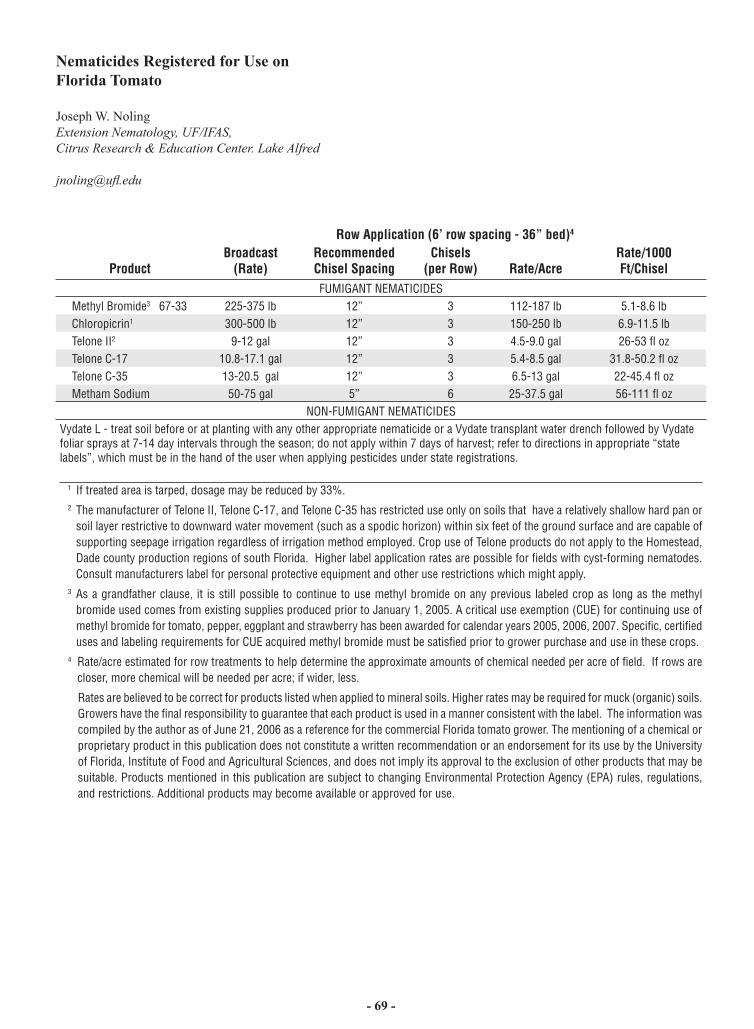
- 69 -
Nematicides Registered for Use on Florida Tomato
Joseph W. NolingExtension Nematology, UF/IFAS, Citrus Research & Education Center. Lake Alfred
Row Application (6’ row spacing - 36” bed)4
ProductBroadcast
(Rate)RecommendedChisel Spacing
Chisels(per Row) Rate/Acre
Rate/1000Ft/Chisel
FUMIGANT NEMATICIDESMethyl Bromide3 67-33 225-375 lb 12” 3 112-187 lb 5.1-8.6 lbChloropicrin1 300-500 lb 12” 3 150-250 lb 6.9-11.5 lbTelone II2 9-12 gal 12” 3 4.5-9.0 gal 26-53 fl ozTelone C-17 10.8-17.1 gal 12” 3 5.4-8.5 gal 31.8-50.2 fl ozTelone C-35 13-20.5 gal 12” 3 6.5-13 gal 22-45.4 fl ozMetham Sodium 50-75 gal 5” 6 25-37.5 gal 56-111 fl oz
NON-FUMIGANT NEMATICIDESVydate L - treat soil before or at planting with any other appropriate nematicide or a Vydate transplant water drench followed by Vydate foliar sprays at 7-14 day intervals through the season; do not apply within 7 days of harvest; refer to directions in appropriate “state labels”, which must be in the hand of the user when applying pesticides under state registrations.
1 If treated area is tarped, dosage may be reduced by 33%.2 The manufacturer of Telone II, Telone C-17, and Telone C-35 has restricted use only on soils that have a relatively shallow hard pan or
soil layer restrictive to downward water movement (such as a spodic horizon) within six feet of the ground surface and are capable of supporting seepage irrigation regardless of irrigation method employed. Crop use of Telone products do not apply to the Homestead, Dade county production regions of south Florida. Higher label application rates are possible for fields with cyst-forming nematodes. Consult manufacturers label for personal protective equipment and other use restrictions which might apply.
3 As a grandfather clause, it is still possible to continue to use methyl bromide on any previous labeled crop as long as the methyl bromide used comes from existing supplies produced prior to January 1, 2005. A critical use exemption (CUE) for continuing use of methyl bromide for tomato, pepper, eggplant and strawberry has been awarded for calendar years 2005, 2006, 2007. Specific, certified uses and labeling requirements for CUE acquired methyl bromide must be satisfied prior to grower purchase and use in these crops.
4 Rate/acre estimated for row treatments to help determine the approximate amounts of chemical needed per acre of field. If rows are closer, more chemical will be needed per acre; if wider, less.
Rates are believed to be correct for products listed when applied to mineral soils. Higher rates may be required for muck (organic) soils. Growers have the final responsibility to guarantee that each product is used in a manner consistent with the label. The information was compiled by the author as of June 21, 2006 as a reference for the commercial Florida tomato grower. The mentioning of a chemical or proprietary product in this publication does not constitute a written recommendation or an endorsement for its use by the University of Florida, Institute of Food and Agricultural Sciences, and does not imply its approval to the exclusion of other products that may be suitable. Products mentioned in this publication are subject to changing Environmental Protection Agency (EPA) rules, regulations, and restrictions. Additional products may become available or approved for use.