september 2018 - kerala
TRANSCRIPT

GOVERNMENT OF INDIA
EARTH SYSTEM SCIENCE ORGANISATION MINISTRY OF EARTH SCIENCES
Report on the exceptionally heavy rainfall over Kerala
during 1st – 19th Aug. 2018
SEPTEMBER 2018

1
Contents: Page No.
1. Introduction 1
2. Characteristics of exceptionally high rainfall over Kerala 1
2.1. Seasonal rainfall: 1
2.2. Monthly rainfall: 2
2.3. Weekly rainfall: 3
2.4. Daily rainfall: 3
2.5. District-wise rainfall 9
2.6. Type of rainfall 11
2.7. Large scale synoptic systems contributing to exceptionally high
rainfall over Kerala 11
2.8. Kerala rainfall in August and reservoir management 13
3. NWP Models Forecast 16
3.1. Performance of extended range forecast system (based on CFSV2
& GFSbc)) in predicting heavy rainfall over Kerala during
9-15 August 2018 16
3.2. Short and medium range forecasts for Kerala state 16
3.2.1. IMD GFS T1534 16
3.2.2. NCUM: 22
3.2.3. NEPS: 25
3.2.4. GFS T 1534 (V 13.0 and V14.0) performance at district level 42
3.2.5. GEFS model forecast 50
3.2.6. Comparative analysis of deterministic GFS V14 and
probabilistic GEFS 13 51
3.2.7. GEFS Probability following Webster et al 54
3.2.8. Verification of Vertically Integrated Moisture Transport(NCUM) 56
3.2.9. Comparative analysis of GFS and ECMWF forecast 63
3.2.10. WRF 67
4. Verification of operational forecasts issued to the stake holders 74
5. Warning services 80
6. Summary & conclusions 81

2
1. Introduction
Kerala experienced exceptionally high rainfall during 8-16 August 2018 in two consecutive
spells leading to devastating floods in many parts of the state. As per the latest report about 300
people died and lakhs of people affected due to this flood.
The main causative factors for the occurrence of heavy rainfall over Kerala are stronger
westerly/southwesterly winds over the Arabian Sea along and off Kerala coast. Usually the strength of
this westerly/southwesterly winds increases with the formation of low pressure area over northwest
Bay of Bengal and their further intensification. Comparing the peak rainfall activity on 10 and 20 June,
20 July and 8 and 15 August, all except the 20 June was associated with the depression over
northwest Bay of Bengal. Considering the number of low pressure system days over Indian region
during 1-18 August, 2018, it was 10 days. The rainfall peak around 20 June was in association with an
off shore trough off west coast running from Konkan to Kerala coast with an embedded cyclonic
circulation extending upto middle tropospheric level over south Konkan and neighbourhood.
IMD mobilised all its resources including satellite, Radar and ground based observational
systems and the numerical models to track the heavy rainfall events and regular warnings were issued
to concerned central and state disaster management agencies, print & electronic media and general
public through it National Weather Forecasting Centre (NWFC), Regional Weather Forecasting Centre
(RWFC), Chennai and Meteorological Centre, Thiruvananthapuram.
The models used in MoES for prediction of heavy rainfall warning are as follows
(i) Global Forecast System (GFS) model with a horizontal resolution of 12 km
(ii) Global Ensemble Forecasting System (GEFS) with a horizontal resolution of 12 km
(iii) Unified model of NCMRWF with a horizontal resolution of 12 km for and for forecast
(iv) Unified model Ensemble Prediction System with a horizontal resolution of 12 km
(v) Regional Unified model with a horizontal resolution of 4 km for forecast upto 3 days
(vi) Region Weather Research and Forecast (WRF) model with a horizontal resolution of 9 and 3
km
Other international models like European Centre for medium Range Weather Forecasting
(ECMWF) model, Japan Meteorological Agency (JMA) model, national centre for Environmental
Prediction (NCEP), USA, GFS model etc.
The salient characteristics of rainfall over Kerala in Monsoon season 2018, the performance of
MWP models for prediction of the heavy rainfall episodes and the operational (consensus forecast
issued for districts of Kerala and state as a whole are analysed and presented in the following
sections.
2. Characteristics of exceptionally high rainfall over Kerala
2.1. Seasonal rainfall:
Rainfall over Kerala during southwest monsoon season 2018 (1st June to 19th August 2018) has
been exceptionally high. Kerala received 2366.1 mm against a normal of 1663.4 mm (above normal
by 42%). It is the only state in which the rainfall received so far during the season is excess.
The rainfall over Kerala during June, July and August (1st-19th August) has been 15%, 18% and
164% above normal respectively as shown in Table 1.
Table 1: Monthly and seasonal rainfall for Kerala State during 1st June to 19th August 2018
Month Realized rainfall (mm) Normal rainfall (mm) % departure from normal
June, 2018 749.6 649.8 +15
July, 2018 857.4 726.1 +18
1st – 19th Aug. 2018 758.6 287.6 +164
1st June – 19th Aug. 2346.6 1649.5 +42

3
From Table 1, it can be found that Kerala received maximum rainfall in July (73 cm) followed by
June (65 cm), August 41 cm and September (24 cm). The standard deviation of rainfall in August over
Kerala is about 16. 1 cm. Thus the rainfall over Kerala during the month of August is highly variable
with coefficient of variation of 39.4%.
2.2. Monthly rainfall:
Based on past 143 years of data, it has been found that Kerala received 1132 mm of rain
during the month of August in the year 1931 which is ever recorded maximum August rainfall of
Kerala. Followed by 877 mm in the year 1923 and 851 in the year 1907. This year based on the real
time data, rainfall of Kerala for the month of August was 821.0 mm. Maximum rainfall received during
the whole SW monsoon season was 3284 mm in the year 1924 in which Kerala received 1387 mm
(second highest July rainfall after 1445 mm rainfall in the year 1892). Table 2, gives the top ten
highest August rainfall during last 144 years (1875-2018) in August. Kerala received such huge
amount of rain in August after the year 1931.
Table 2: Highest recorded Rainfall in August over Kerala during 1875-2018
YEAR RF in mm % DEP
1931 1132.9 175
1923 876.6 112
1907 850.8 102
2018 821.0 94
1897 820.2 83
1878 800.1 79
1947 739.1 78
2014 733.9 75
1884 688.1 54
Thus during 2018, August rainfall of Kerala is fourth highest rainfall since the beginning of the record
in 1875. Fig. 1 presents the histogram of Kerala August rainfall for the period 1875-2018.
Fig. 1: Rainfall (mm) over Kerala during August during 1875-2018
During the period 1875 to 2018, the highest excess rainfall in August was recorded in 1931
(175 % above normal), as shown in Fig.2. The maximum rainfall in the month of August over Kerala
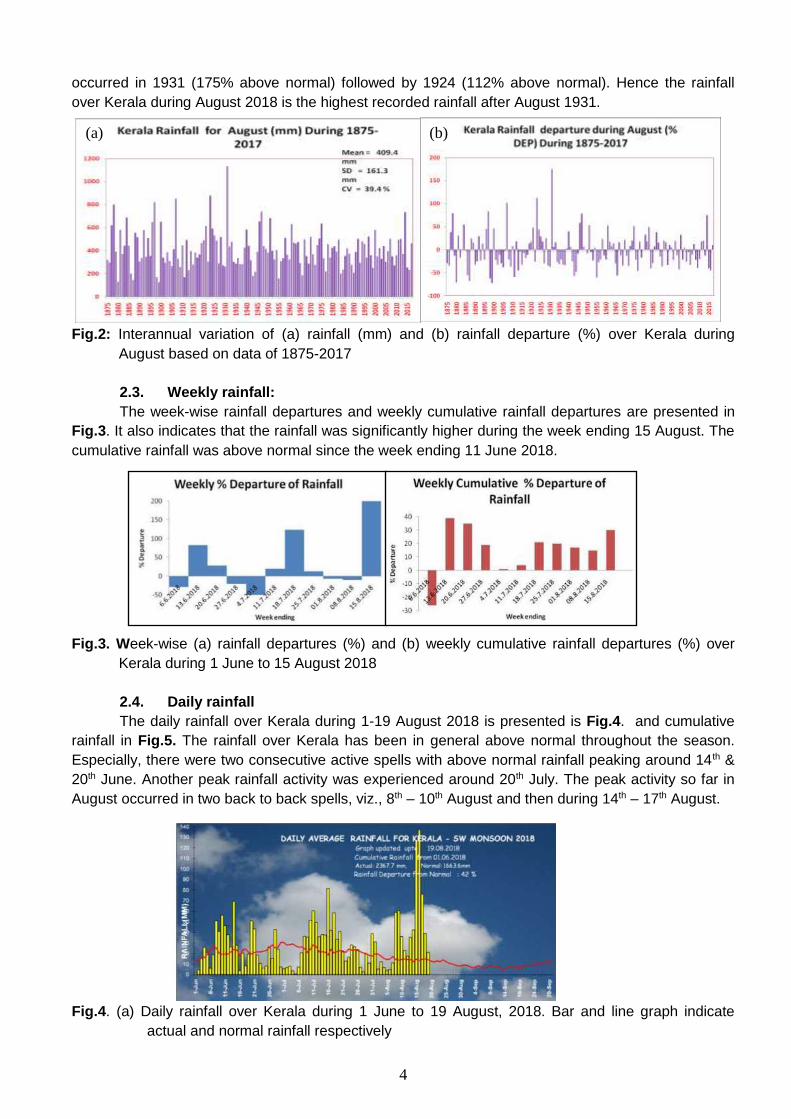
4
occurred in 1931 (175% above normal) followed by 1924 (112% above normal). Hence the rainfall
over Kerala during August 2018 is the highest recorded rainfall after August 1931.
Fig.2: Interannual variation of (a) rainfall (mm) and (b) rainfall departure (%) over Kerala during
August based on data of 1875-2017
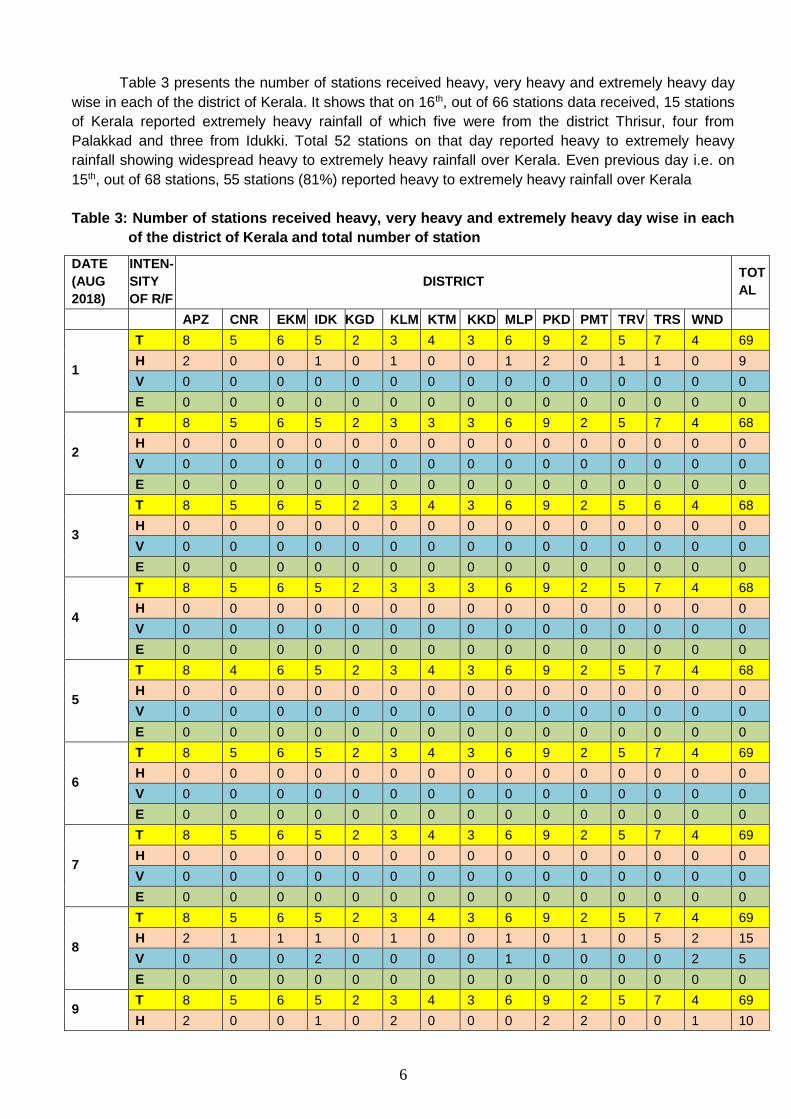
2.3. Weekly rainfall:
The week-wise rainfall departures and weekly cumulative rainfall departures are presented in
Fig.3. It also indicates that the rainfall was significantly higher during the week ending 15 August. The
cumulative rainfall was above normal since the week ending 11 June 2018.
Fig.3. Week-wise (a) rainfall departures (%) and (b) weekly cumulative rainfall departures (%) over
Kerala during 1 June to 15 August 2018
2.4. Daily rainfall
The daily rainfall over Kerala during 1-19 August 2018 is presented is Fig.4. and cumulative
rainfall in Fig.5. The rainfall over Kerala has been in general above normal throughout the season.
Especially, there were two consecutive active spells with above normal rainfall peaking around 14th &
20th June. Another peak rainfall activity was experienced around 20th July. The peak activity so far in
August occurred in two back to back spells, viz., 8th – 10th August and then during 14th – 17th August.
Fig.4. (a) Daily rainfall over Kerala during 1 June to 19 August, 2018. Bar and line graph indicate
actual and normal rainfall respectively
(a) (b)

5
Fig. 4(b): Daily area weighted rainfall for the state Kerala ending at 0830 hrs IST of date
It can be seen that the first spell has started on 8th August with average rainfall of Kerala
touching about 6 cm with 316% departure from normal on that day. The pick of first spell was on 9th
when Kerala received around 6.6cm with percentage departure from normal was 377%. Subsequently
the intensity decreases from 10th onward. The second intense spell started from 13th August with
rainfall of 3.6cm (percentage Dep. 154%). The peak intensity reaches on 16th August on which day
Kerala received around 14cm with percentage departure from normal being 915%.
During these days the centre of the rainstorm has also shifted but mainly concentrated over
central, southern parts of central Kerala. Fig. 4b shows the day wise average rainfall over fourteen
districts of Kerala from 1st to 20th August.
Fig.5. Cumulative daily rainfall over Kerala during 1 June to 19 August, 2018
The number of stations reporting heavy rainfall on daily basis is presented in Fig.6. It indicates
that during 8-16 August 2018, the number of stations reporting heavy to extremely heavy rainfall was
exceptionally high on 15th August followed by 16th August 2018.
Fig.6: Number of stations which reported rainfall in the given ranges on a day-to-day basis from 1st –
19th August 2018, for the past 24 hours ending at 0830 hrs IST of the given date.
6
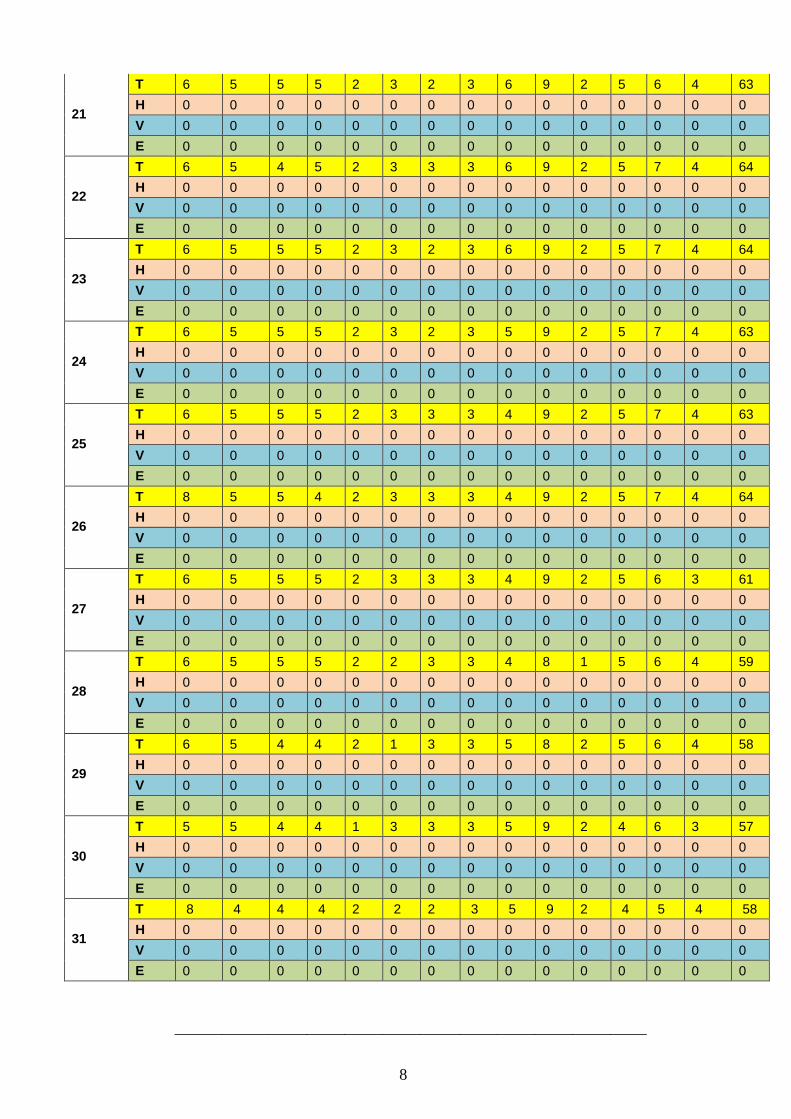
Table 3 presents the number of stations received heavy, very heavy and extremely heavy day
wise in each of the district of Kerala. It shows that on 16th, out of 66 stations data received, 15 stations
of Kerala reported extremely heavy rainfall of which five were from the district Thrisur, four from
Palakkad and three from Idukki. Total 52 stations on that day reported heavy to extremely heavy
rainfall showing widespread heavy to extremely heavy rainfall over Kerala. Even previous day i.e. on
15th, out of 68 stations, 55 stations (81%) reported heavy to extremely heavy rainfall over Kerala
Table 3: Number of stations received heavy, very heavy and extremely heavy day wise in each
of the district of Kerala and total number of station
DATE
(AUG
2018)
INTEN-
SITY
OF R/F
DISTRICT TOT
AL
APZ CNR EKM IDK KGD KLM KTM KKD MLP PKD PMT TRV TRS WND
1
T 8 5 6 5 2 3 4 3 6 9 2 5 7 4 69
H 2 0 0 1 0 1 0 0 1 2 0 1 1 0 9
V 0 0 0 0 0 0 0 0 0 0 0 0 0 0 0
E 0 0 0 0 0 0 0 0 0 0 0 0 0 0 0
2
T 8 5 6 5 2 3 3 3 6 9 2 5 7 4 68
H 0 0 0 0 0 0 0 0 0 0 0 0 0 0 0
V 0 0 0 0 0 0 0 0 0 0 0 0 0 0 0
E 0 0 0 0 0 0 0 0 0 0 0 0 0 0 0
3
T 8 5 6 5 2 3 4 3 6 9 2 5 6 4 68
H 0 0 0 0 0 0 0 0 0 0 0 0 0 0 0
V 0 0 0 0 0 0 0 0 0 0 0 0 0 0 0
E 0 0 0 0 0 0 0 0 0 0 0 0 0 0 0
4
T 8 5 6 5 2 3 3 3 6 9 2 5 7 4 68
H 0 0 0 0 0 0 0 0 0 0 0 0 0 0 0
V 0 0 0 0 0 0 0 0 0 0 0 0 0 0 0
E 0 0 0 0 0 0 0 0 0 0 0 0 0 0 0
5
T 8 4 6 5 2 3 4 3 6 9 2 5 7 4 68
H 0 0 0 0 0 0 0 0 0 0 0 0 0 0 0
V 0 0 0 0 0 0 0 0 0 0 0 0 0 0 0
E 0 0 0 0 0 0 0 0 0 0 0 0 0 0 0
6
T 8 5 6 5 2 3 4 3 6 9 2 5 7 4 69
H 0 0 0 0 0 0 0 0 0 0 0 0 0 0 0
V 0 0 0 0 0 0 0 0 0 0 0 0 0 0 0
E 0 0 0 0 0 0 0 0 0 0 0 0 0 0 0
7
T 8 5 6 5 2 3 4 3 6 9 2 5 7 4 69
H 0 0 0 0 0 0 0 0 0 0 0 0 0 0 0
V 0 0 0 0 0 0 0 0 0 0 0 0 0 0 0
E 0 0 0 0 0 0 0 0 0 0 0 0 0 0 0
8
T 8 5 6 5 2 3 4 3 6 9 2 5 7 4 69
H 2 1 1 1 0 1 0 0 1 0 1 0 5 2 15
V 0 0 0 2 0 0 0 0 1 0 0 0 0 2 5
E 0 0 0 0 0 0 0 0 0 0 0 0 0 0 0
9
T 8 5 6 5 2 3 4 3 6 9 2 5 7 4 69
H 2 0 0 1 0 2 0 0 0 2 2 0 0 1 10

7
V 0 0 0 0 0 0 0 0 0 2 0 0 0 2 4
E 0 0 0 3 0 0 0 0 1 1 0 0 0 1 6
10
T 8 5 6 5 2 3 4 3 6 9 2 5 7 4 69
H 0 0 1 0 0 1 0 0 1 0 0 0 0 1 4
V 0 0 0 2 0 0 0 0 0 0 0 0 0 0 2
E 0 0 0 0 0 0 0 0 0 0 0 0 0 0 0
11
T 8 5 6 5 2 3 4 3 5 9 2 5 7 4 68
H 0 0 0 1 0 0 0 0 0 0 0 0 0 0 1
V 0 0 0 0 0 0 0 0 0 0 0 0 0 0 0
E 0 0 0 0 0 0 0 0 0 0 0 0 0 0 0
12 T 8 5 6 5 2 3 4 3 6 9 2 5 6 4 68
H 0 0 0 0 0 0 0 0 0 0 0 0 0 0 0
V 0 0 0 0 0 0 0 0 0 0 0 0 0 0 0
E 0 0 0 0 0 0 0 0 0 0 0 0 0 0 0
13
T 8 5 6 5 2 3 4 3 6 9 2 5 6 4 68
H 0 1 0 2 0 0 0 1 0 1 0 0 0 2 7
V 0 0 0 0 0 0 0 0 0 0 0 0 0 0 0
E 0 0 0 0 0 0 0 0 0 0 0 0 0 0 0
14
T 8 4 6 5 2 3 3 3 6 9 2 5 7 4 67
H 0 0 0 3 2 0 0 3 5 2 0 0 0 1 16
V 0 0 0 1 0 0 0 0 0 1 0 0 0 1 3
E 0 0 0 0 0 0 0 0 0 0 0 0 0 0 0
15
T 8 4 6 5 2 3 4 3 6 9 2 5 7 4 68
H 6 1 2 0 1 2 4 1 0 5 1 2 3 1 29
V 2 3 4 2 0 1 0 2 5 3 1 2 4 3 32
E 0 0 0 3 0 0 0 0 1 0 0 0 0 0 4
16
T 7 4 6 5 2 3 3 3 6 9 2 5 7 4 66
H 5 0 2 0 0 3 2 0 0 1 0 0 0 4 17
V 0 0 2 2 0 0 1 2 5 4 2 0 2 0 20
E 0 0 1 3 0 0 0 1 1 4 0 0 5 0 15
17
T 6 4 5 5 2 3 4 3 6 9 2 5 6 4 64
H 3 0 2 2 0 2 2 0 3 5 2 0 2 4 27
V 0 0 0 3 0 0 0 0 0 2 0 0 3 0 8
E 0 0 0 0 0 0 0 0 0 0 0 0 0 0 0
18
T 5 4 5 5 2 3 4 3 6 9 2 5 6 4 63
H 0 0 0 3 0 1 0 0 0 0 1 0 0 0 5
V 0 0 0 0 0 0 0 0 0 0 0 0 0 0 0
E 0 0 0 0 0 0 0 0 0 0 0 0 0 0 0
19
T 6 4 5 5 2 3 3 3 6 9 2 5 6 4 63
H 0 0 0 1 0 0 0 0 0 0 0 0 0 0 1
V 0 0 0 0 0 0 0 0 0 0 0 0 0 0 0
E 0 0 0 0 0 0 0 0 0 0 0 0 0 0 0
20
T 5 5 5 5 2 3 3 3 6 9 2 5 6 4 63
H 0 0 0 1 0 0 0 0 0 0 0 0 0 0 1
V 0 0 0 0 0 0 0 0 0 0 0 0 0 0 0
E 0 0 0 0 0 0 0 0 0 0 0 0 0 0 0
8
21
T 6 5 5 5 2 3 2 3 6 9 2 5 6 4 63
H 0 0 0 0 0 0 0 0 0 0 0 0 0 0 0
V 0 0 0 0 0 0 0 0 0 0 0 0 0 0 0
E 0 0 0 0 0 0 0 0 0 0 0 0 0 0 0
22
T 6 5 4 5 2 3 3 3 6 9 2 5 7 4 64
H 0 0 0 0 0 0 0 0 0 0 0 0 0 0 0
V 0 0 0 0 0 0 0 0 0 0 0 0 0 0 0
E 0 0 0 0 0 0 0 0 0 0 0 0 0 0 0
23
T 6 5 5 5 2 3 2 3 6 9 2 5 7 4 64
H 0 0 0 0 0 0 0 0 0 0 0 0 0 0 0
V 0 0 0 0 0 0 0 0 0 0 0 0 0 0 0
E 0 0 0 0 0 0 0 0 0 0 0 0 0 0 0
24
T 6 5 5 5 2 3 2 3 5 9 2 5 7 4 63
H 0 0 0 0 0 0 0 0 0 0 0 0 0 0 0
V 0 0 0 0 0 0 0 0 0 0 0 0 0 0 0
E 0 0 0 0 0 0 0 0 0 0 0 0 0 0 0
25
T 6 5 5 5 2 3 3 3 4 9 2 5 7 4 63
H 0 0 0 0 0 0 0 0 0 0 0 0 0 0 0
V 0 0 0 0 0 0 0 0 0 0 0 0 0 0 0
E 0 0 0 0 0 0 0 0 0 0 0 0 0 0 0
26
T 8 5 5 4 2 3 3 3 4 9 2 5 7 4 64
H 0 0 0 0 0 0 0 0 0 0 0 0 0 0 0
V 0 0 0 0 0 0 0 0 0 0 0 0 0 0 0
E 0 0 0 0 0 0 0 0 0 0 0 0 0 0 0
27
T 6 5 5 5 2 3 3 3 4 9 2 5 6 3 61
H 0 0 0 0 0 0 0 0 0 0 0 0 0 0 0
V 0 0 0 0 0 0 0 0 0 0 0 0 0 0 0
E 0 0 0 0 0 0 0 0 0 0 0 0 0 0 0
28
T 6 5 5 5 2 2 3 3 4 8 1 5 6 4 59
H 0 0 0 0 0 0 0 0 0 0 0 0 0 0 0
V 0 0 0 0 0 0 0 0 0 0 0 0 0 0 0
E 0 0 0 0 0 0 0 0 0 0 0 0 0 0 0
29
T 6 5 4 4 2 1 3 3 5 8 2 5 6 4 58
H 0 0 0 0 0 0 0 0 0 0 0 0 0 0 0
V 0 0 0 0 0 0 0 0 0 0 0 0 0 0 0
E 0 0 0 0 0 0 0 0 0 0 0 0 0 0 0
30
T 5 5 4 4 1 3 3 3 5 9 2 4 6 3 57
H 0 0 0 0 0 0 0 0 0 0 0 0 0 0 0
V 0 0 0 0 0 0 0 0 0 0 0 0 0 0 0
E 0 0 0 0 0 0 0 0 0 0 0 0 0 0 0
31
T 8 4 4 4 2 2 2 3 5 9 2 4 5 4 58
H 0 0 0 0 0 0 0 0 0 0 0 0 0 0 0
V 0 0 0 0 0 0 0 0 0 0 0 0 0 0 0
E 0 0 0 0 0 0 0 0 0 0 0 0 0 0 0

9
T Total No. of stations in the district whose data is received
H No. of stations with heavy rainfall
V No. of stations with very heavy rainfall
E No. of stations with Extremely heavy rainfall
APZ Alapuzha KGD Kasargod MLP Malappuram TRS Thrissur
CNR Cannur KLM Kollam PKD Palakkad WND Wynad
EKM Ernakulam KTM Kottayam PMT Pathanamithitta
IDK Idukki KKD Kozhikode TRV Thiruvananthapuram
Month wise frequency of rainfall events of different intensities for all the stations of Kerala for
all available period since 1901 are computed from the daily rainfall data in the archive. While analysing
station data of this year we have found that for many stations monthly frequency of different intensities
(heavy, very heavy, extremely heavy) have crossed previous highest records and these are given in
the Table 4.
Table 4: Stations for which monthly frequency of different intensities of rainfall have crossed
previous highest records
Category Frequency Station
Extremely Heavy 3 Peermade
Extremely Heavy 2 Idukki
Very Heavy 3 Idukki
Heavy 5 Idukki
Extremely Heavy 3 Munnar
Heavy 3 Ottapalam
Total of Heavy, V. Heavy, E. Heavy 5 Ottapalam
Very Heavy 3 Parambikulam
Heavy 4 Palakkad
2.4.1. One day, two day, three day point rainfall
The highest recorded 1-Day, 2-Day, 3-Day point rainfall with this year August point rainfall over
Kerala is discussed in this section. During August some stations have crossed their previous highest
1- Day, 2 –Day, 3- Day point rainfall.
Peer made rain gauge station of Idukki district:
1-Day rainfall 349.0mm on 16th Aug, 2018. Previous highest : 313.7mm on 15/7/1924
2-Day rainfall 623.0mm on 15-16 Aug, 2018. Previous highest :590.0mm on 22-23/6/2007
Idduki rain gauge station of Idukki district:
1-Day rainfall 295.0mm on 16th Aug, 2018. Previous highest : 223.0mm on 5/8/2013
2-Day rainfall 530.0mm on 15-16 Aug, 2018. Previous highest :353.2mm on 8-9/7/2001
3-Day rainfall 710.2mm on 15-17 Aug 2018. Previous highest: 435.7mm on 7-9/7/2001
Kochi C.I.A.L. of Ernakulam district:
1-Day rainfall 171.9mm on 15th Aug, 2018. Previous highest : 160.6mm on 13/6/2010
2.5. District-wise rainfall:
The spatial distribution of district-wise seasonal rainfall is shown in Fig. 7. It indicates that
highest excess rainfall is recorded over Idukki District (93% above normal) followed by Palakkad (74%

10
above normal) as on 17 August 2018. Considering the weekly rainfall during the peak period (9-15
August 2018), the pattern was similar. Though all districts received large excess rainfall during this
week, it was maximum over Idukki district.
Fig.7: (a) District wise weekly rainfall departure (%) during 9-15 August 2018 and (b) cumulative
rainfall departure during 1st June – 19th August 2018 and
The rainfall during June and July 2018 is presented in Fig.8. It indicates that the Idukki and
Palakkad districts also received higher rainfall. Considering all these the accumulated rainfall during
June and July also in these districts also aggravated the flood condition resulting from the
exceptionally high rainfall during August.
Fig.8: Spatial map of Monthly accumulated rainfall during (a) June & (b) July 2018
The district wise monthly cumulative rainfall over Kerala during August 2018 is presented in
Fig. 9. In the individual district record, monthly rainfall of Idukki district during 2018 (1478.9mm) has
crossed the previous record of 138.7 mm in the year 1907. However for the other districts, the monthly
totals have not crossed the highest record monthly rainfall.
Fig. 9: Kerala district rainfall (mm) for August 2018 (till 29th)
The climatological aspects of exceptionally heavy rainfall over Kerala has been analysed based on
past 143 years of data. The district-wise daily average rainfall and spatial pattern of rainfall are shown
in Fig.10 and 11 respectively.
(a)
(b)

11
Fig.10: Daily average rainfall of fourteen districts of Kerala
Fig.11: Spatial rainfall pattern over Kerala from 8th to 17th August
2.6. Type of rainfall
The INSAT-3D derived brightness temperatures alongwith the lightning occurrence during the
period of heavy rainfall has been examined. It is found that the depth of convective clouds was not
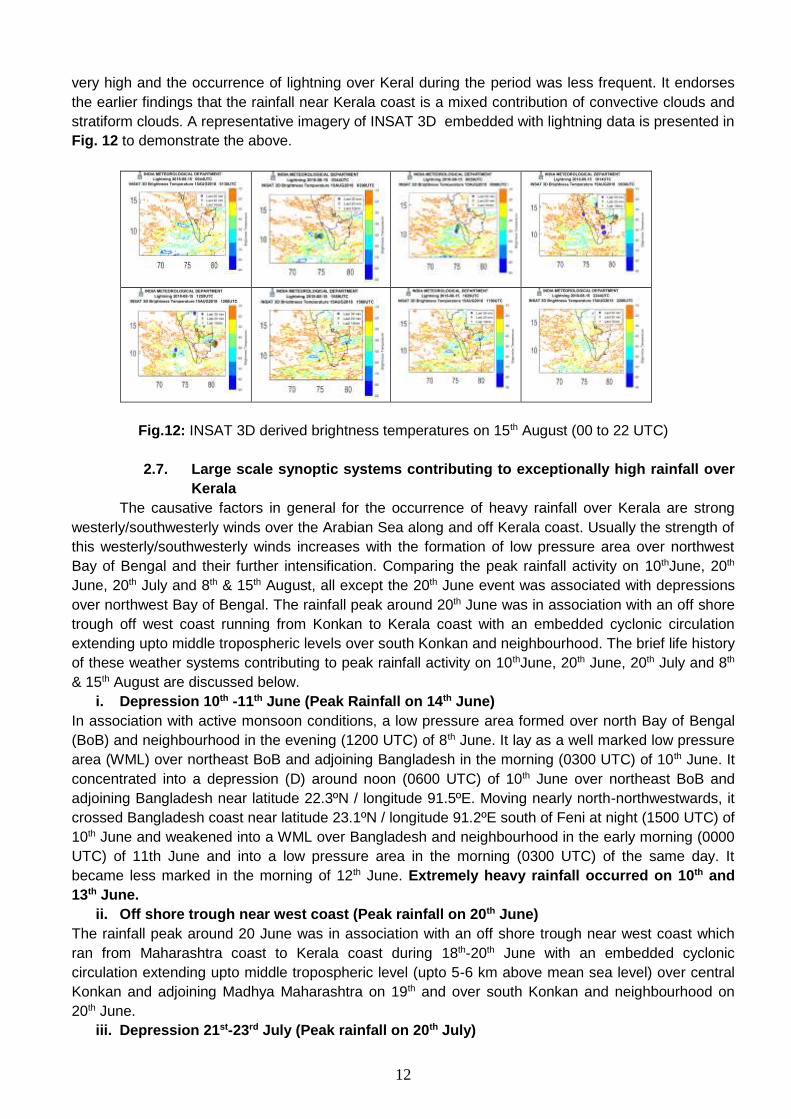
12
very high and the occurrence of lightning over Keral during the period was less frequent. It endorses
the earlier findings that the rainfall near Kerala coast is a mixed contribution of convective clouds and
stratiform clouds. A representative imagery of INSAT 3D embedded with lightning data is presented in
Fig. 12 to demonstrate the above.
Fig.12: INSAT 3D derived brightness temperatures on 15th August (00 to 22 UTC)
2.7. Large scale synoptic systems contributing to exceptionally high rainfall over
Kerala
The causative factors in general for the occurrence of heavy rainfall over Kerala are strong
westerly/southwesterly winds over the Arabian Sea along and off Kerala coast. Usually the strength of
this westerly/southwesterly winds increases with the formation of low pressure area over northwest
Bay of Bengal and their further intensification. Comparing the peak rainfall activity on 10thJune, 20th
June, 20th July and 8th & 15th August, all except the 20th June event was associated with depressions
over northwest Bay of Bengal. The rainfall peak around 20th June was in association with an off shore
trough off west coast running from Konkan to Kerala coast with an embedded cyclonic circulation
extending upto middle tropospheric levels over south Konkan and neighbourhood. The brief life history
of these weather systems contributing to peak rainfall activity on 10thJune, 20th June, 20th July and 8th
& 15th August are discussed below.
i. Depression 10th -11th June (Peak Rainfall on 14th June)
In association with active monsoon conditions, a low pressure area formed over north Bay of Bengal
(BoB) and neighbourhood in the evening (1200 UTC) of 8th June. It lay as a well marked low pressure
area (WML) over northeast BoB and adjoining Bangladesh in the morning (0300 UTC) of 10th June. It
concentrated into a depression (D) around noon (0600 UTC) of 10th June over northeast BoB and
adjoining Bangladesh near latitude 22.3ºN / longitude 91.5ºE. Moving nearly north-northwestwards, it
crossed Bangladesh coast near latitude 23.1ºN / longitude 91.2ºE south of Feni at night (1500 UTC) of
10th June and weakened into a WML over Bangladesh and neighbourhood in the early morning (0000
UTC) of 11th June and into a low pressure area in the morning (0300 UTC) of the same day. It
became less marked in the morning of 12th June. Extremely heavy rainfall occurred on 10th and
13th June.
ii. Off shore trough near west coast (Peak rainfall on 20th June)
The rainfall peak around 20 June was in association with an off shore trough near west coast which
ran from Maharashtra coast to Kerala coast during 18th-20th June with an embedded cyclonic
circulation extending upto middle tropospheric level (upto 5-6 km above mean sea level) over central
Konkan and adjoining Madhya Maharashtra on 19th and over south Konkan and neighbourhood on
20th June.
iii. Depression 21st-23rd July (Peak rainfall on 20th July)

13
A low pressure area formed over northwest BoB and adjoining Gangetic West Bengal & Odisha in the
morning (0300 UTC) of 19th July 2018. It lay as a WML over northwest BoB and adjoining West
Bengal & Odisha in the morning (0300 UTC) of 20th. It concentrated into a depression over northwest
BoB in the morning (0300 UTC) of 21st. Moving northwestwards, it crossed north Odisha - West
Bengal coasts in the same evening (1100-1200 UTC) between Balasore and Digha. Moving further
west-northwestwards, it weakened into a WML over northwest Jharkhand & neighbourhood in the
morning (0300 UTC) of 23rd. It further wakened into a low pressure area over northeast Madhya
Pradesh and adjoining southeast Uttar Pradesh in the morning (0300 UTC) of 24th July. It then moved
as a low pressure area across Uttar Pradesh till 28th. On 28th it lay as low pressure area over
northwest Uttar Pradesh and neighbourhood. It became insignificant on 29th July.
iv. Depression 07th-08th August (peak rainfall on 8th August)
A low pressure area formed over northwest BoB and neighbourhood in the morning (0300 UTC) of 6th
August 2018. It lay as a WML over northwest BoB and adjoining West Bengal & Odisha coasts in the
early morning (0000 UTC) of 7th. It concentrated into a depression over northwest BoB in the
afternoon (0900 UTC) of 7th. Moving west-northwestwards it crossed north Odisha-West Bengal
coasts close to Balasore during same night (1430 to 1630UTC). Moving further west-northwestwards,
it weakened into a WML over north Chattisgarh and neighbourhood in the morning (0300 UTC) of 8th
August. It further weakened into a low pressure area over central parts of south Madhya Pradesh in
the morning (0300 UTC) of 09th August.
v. Depression 15th-17th August (peak rainfall on 15th August)
Under the influence of a cyclonic circulation over northwest BoB off West Bengal coast, a low pressure
area formed over the same region in the morning (0300 UTC) of 13th. It lay as a WML over northwest
BoB off West Bengal-north Odisha coasts in the afternoon (0900 UTC) of 14th. It concentrated into a
depression over coastal Odisha in the morning (0300 UTC) of 15th. It moved west-northwestwards
and weakened gradually into a WML over southwest Madhya Pradesh and neighbourhood in the
morning (0300 UTC) of 17th and into a low pressure area in the same evening (0900 UTC) over
southwest Madhya Pradesh and adjoining Gujarat. It became less marked in the morning (0300 UTC)
of 18th.
The tracks of the Depressions are given in Fig.13. It indicates that out of the four depressions,
both the depressions during August moved nearly westwards causing most favourable conditions for
rainfall over Kerala unlike the other two depressions during June and July which moved nearly
northward and northwestwards respectively. The associated monsoon trough during the peak rainfall
activity are presented in Fig.14. It indicates that the monsoon trough (especially the eastern end of
monsoon trough) was south of its normal position in these days.
Fig.13: (a). Observed tracks of depressions over Bay of Bengal during 10-11 June, 21-23 July, 07-08
August and 15-17 August, 2018 and (b) Position of Monsoon Trough on 20 July, 7 August & 15
August
(a) (b)

14
The relation between seasonal frequency of monsoon depressions and rainfall on a
meteorological sub-divisional scale is presented in Fig. 10. It may be noted that the rainfall over Kerala
shows a significant increase with an increased frequency of monsoon depressions. (Mohapatra et al,
2017).
Fig. 14: Correlation coefficient (CC) between sub-divisional rainfall and cyclonic disturbances (CDs)
frequency during the monsoon season based on data of 1901–2010. Sub-divisions showing
significantly positive CCs are shaded red and negative CCs, blue (whole numbers indicate the
meteorological sub-division as listed on the right side; Real numbers (with two decimal) are the CC
values; |CC| > 0.19: significant at the 95 % confidence level).
Thus to conclude, the exceptionally heavy rainfall in August (170% above normal rainfall over
Kerala during 1-17 August, 2018) can be attributed to consecutive formation (within seven days) of the
low pressure system on 6th and 13th August morning. Further both these low pressure systems
intensified into Depression and moved west-northwestwards along the monsoon trough. It led to
strengthening of westerly/southwesterly winds along and off Kerala coasts as the cross equatorial
monsoon flow increased towards the region of low pressure system. These stronger winds interacted
with the Western Ghats leading to orographic uplifting of moist air. This orographic uplifting led to
development of clouds and hence heavy rainfall. Considering the number of low pressure system days
over Indian region during 1-18 August, 2018, it was 10 days.
2.8. Kerala rainfall in August and reservoir management
The date-wise rainfall, reservoir status and the spill from the reservoir based on the onlane data
available from Kerala State Load Dispatch Centre (KSLDC) is presented in Fig. 15. By the end of July
2018, in all the major 35 odd reservoirs in Kerala, the storage was close to the Full Reservoir Level
(FRL) and had no buffer storage to accommodate the heavy inflows from 8th August. The continued
exceptionally heavy rainfall in August (with 170% above normal) in the catchment areas had
compelled the authorities to resort to heavy releases downstream into the rivers only from 15th August.
Such a scenario that continued for almost a week now caused overflowing of all river banks leading to
widespread flooding almost all over the state.

15
Fig.15. Date-wise rainfall, reservoir status and the spill from the reservoir based on the onlane data available from Kerala State Load Dispatch Centre (KSLDC)

16
Fig.15 (contd.). Date-wise rainfall, reservoir status and the spill from the reservoir based on the onlane data available from Kerala State Load Dispatch Centre (KSLDC)

17
3. NWP Models Forecast
3.1. Performance of extended range forecast system (based on CFSV2 & GFSbc)) in
predicting heavy rainfall over Kerala during 9-15 August 2018
The model outputs proved to be very consistent in indicating normal to above normal rainfall activity
over Kerala and adjoining areas of south Peninsula nearly almost a month ahead. The rainfall
anomaly maps from this output are reproduced in Fig.16. Week – 4 forecasts of the Extended Range
Prediction System, based on 18th July 2018 Initial Conditions (IC) indicated 2-5 mm per day above
normal rainfall over Kerala for the period 9th – 15th August. Week – 3 forecast based on 25th July IC,
continued to show the same results for Kerala. The week – 2 forecast based on 1st August IC, issued
on 2nd August 2018, showed still higher rate of rainfall as can be seen from the anomaly pattern.
Almost similar pattern of above normal rainfall continued in the subsequent IC based on 8th August for
its week – 1 forecast as well.
Fig.16: Extended range forecasts based on past 4 weeks initial conditions from IITM – IMD ERF
group based on initial conditions of (a) 18th July (week-4), (b) 25th July (week-3), (c) 1st
August (week-2) and (d) 8th August (week-1)
Thus, the extended range forecasts, very clearly and consistently brought out that the rainfall
activity is most likely to remain above normal during the period 9th – 15th August 2018. However, the
above normal rainfall activity during 2nd – 8th August 2018 was picked up by the model, only in its week
–2 forecast based on 25th July IC. Dependability and utility of the ‘Extended range forecasts’ is to be
stressed upon in the planning of water management from Reservoirs and on crucial decisions
including controlled release of water to the rivers / irrigation canals during the rainy season.
3.2. Short and medium range forecasts for Kerala state
Performance of a few major Numerical models which guide the weather forecasters to
formulate the weather forecasts & warnings on various time scales are summarized initially.
Verification is carried out according to the point rainfall data recorded by the rain gauge stations
spread across Kerala.
3.2.1. IMD GFS T1534
The model could not pick up the enhanced rainfall in advance. It predicted heavy rainfall over
Kerala only on 7th & 8th August, [based on the initial conditions (IC) of 00UTC of 5th August and of 6th
August] and then for 8th August (based on the IC of 7th August). It is to be pointed out that on 8th
morning the rainfall reported has been widespread with isolated places reporting very heavy rains
(Nilambur – 15.5 cm) whereas, this model not only missed this enhancement in rainfall, but could not
simulate the scattered heavy to very heavy with isolated extremely heavy event occurred on 8th
August, as reported on 9th August morning, when Nilambur reported 40 cm rainfall and Manathawadi
reported 31cm rainfall. The model did not indicate any heavy rainfall for the subsequent 7 days based
on its 8th, 00 UTC run.
(a) (b) (c) (d)
(d)

18
Regarding the flow pattern, wind field at 850 hPa were often predominated by west-
northwesterly component prior to the start of the event during August. However, there was indication
of downstream convergence in the lower tropospheric wind field, from 8th August, which aided the
forecasters to predict enhancement in rainfall a couple of days ahead of the event.
Fig.17: GFS T1534 heavy rainfall forecasts (day-1 to day-7) over Kerala versus the realized
rainfall
Regarding the low pressure area genesis, the model often provided guidance, though it lacked
consistency. The period witnessed the formation of two monsoon Depressions, one during 7th – 8th
August and the other during 15th – 17th August. The intensity was underestimated in both the cases.
Further, the faster westward movement of the depression on 15th and 16th August could not be
predicted by the model. Verification results for the heavy & very heavy rainfall are given in Tables 5
(a) & 5 (b). Fig. 17 & 18 provides the day-wise verification of 3 day accumulated actual rain events
and the forecast 3 day accumulated rainfall respectively. It can be found that there was spatial bias
indicating relatively higher rainfall in northern latitudes along the coast based on initial conditions of
7th, 8th and 9th August. It also underestimated the intensity for second spell during 14-17 August, 2018.
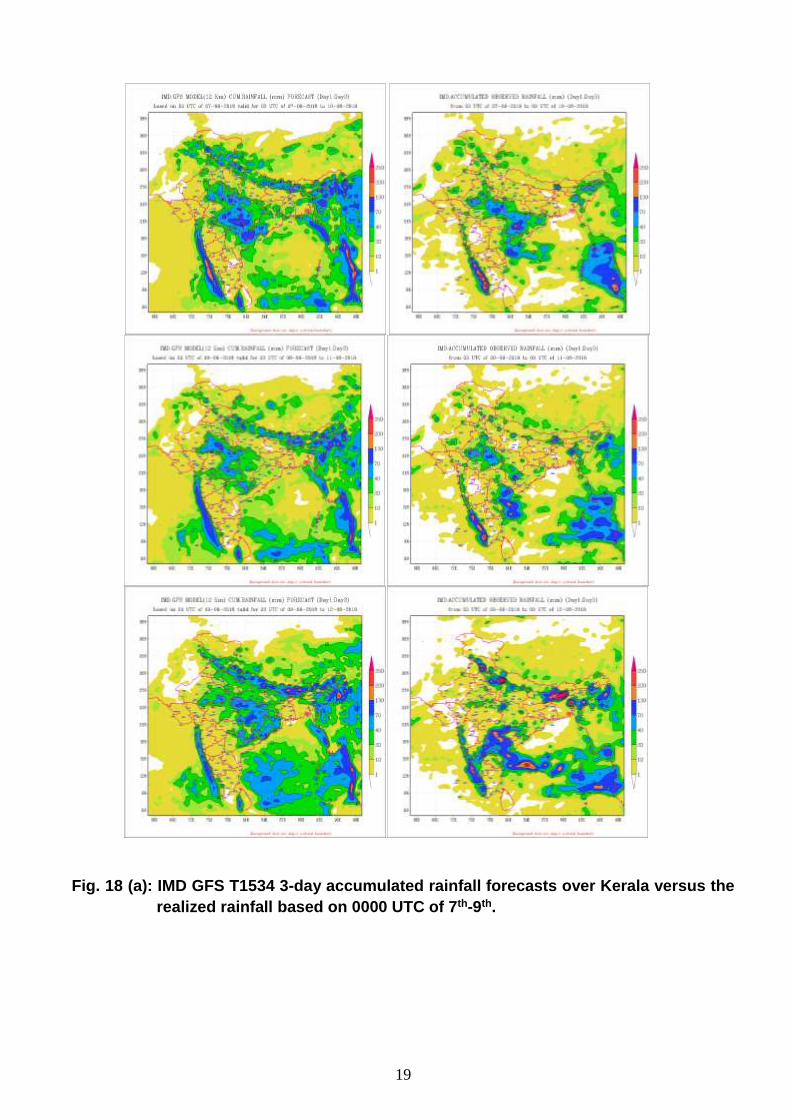
19
Fig. 18 (a): IMD GFS T1534 3-day accumulated rainfall forecasts over Kerala versus the
realized rainfall based on 0000 UTC of 7th-9th.
20
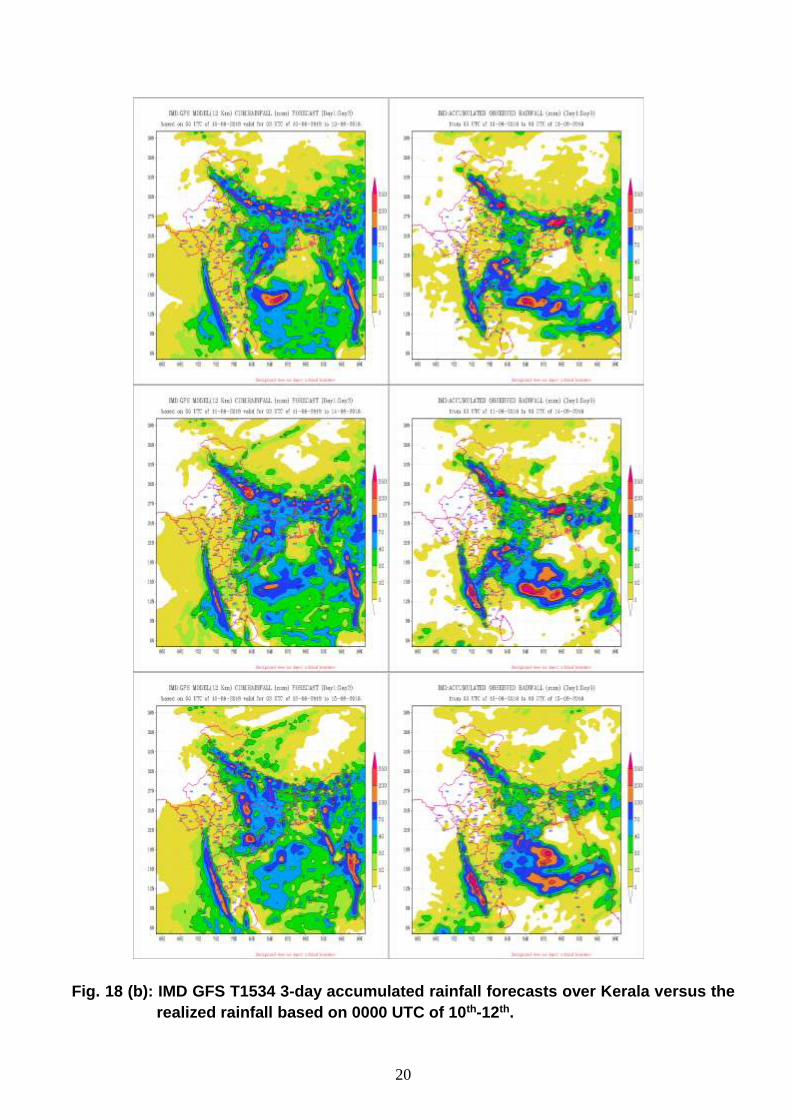
Fig. 18 (b): IMD GFS T1534 3-day accumulated rainfall forecasts over Kerala versus the
realized rainfall based on 0000 UTC of 10th-12th.
21
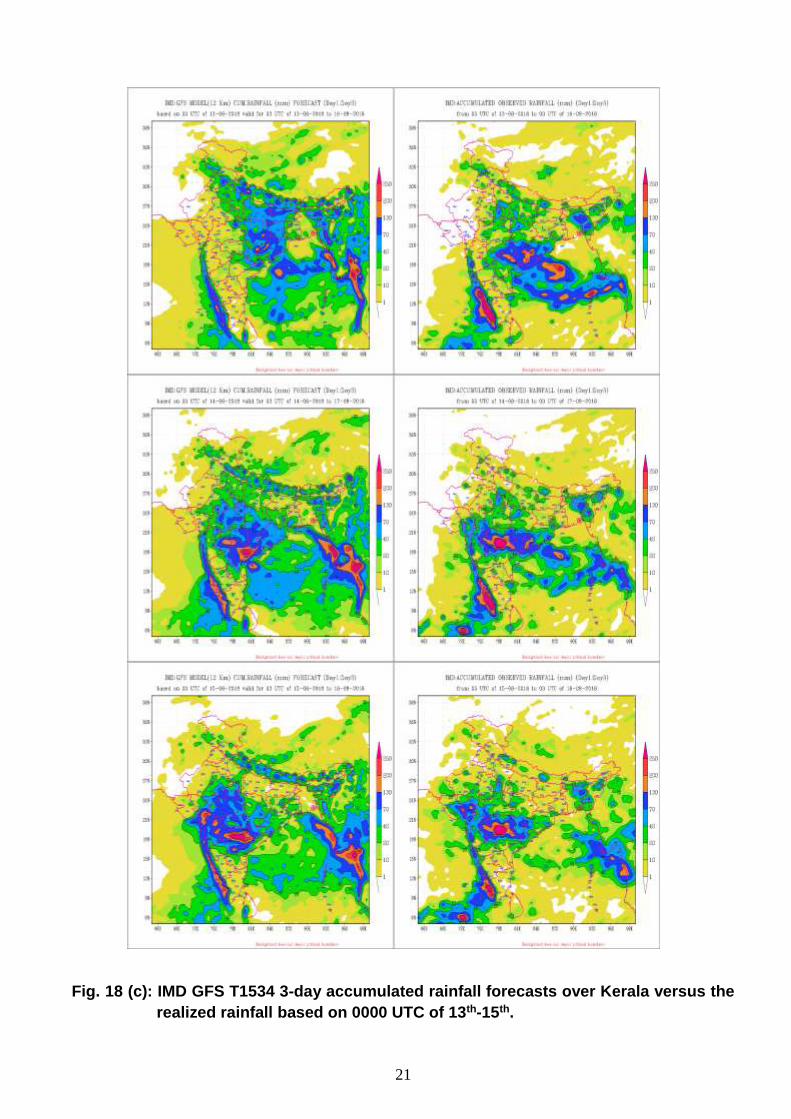
Fig. 18 (c): IMD GFS T1534 3-day accumulated rainfall forecasts over Kerala versus the
realized rainfall based on 0000 UTC of 13th-15th.

22
Fig. 18 (d): IMD GFS 1534 3-day accumulated rainfall forecasts over Kerala versus the
realized rainfall based on 0000 UTC of 16th-18th.

23
FAR MR CNON PC BIAS CSI HSS POD
D1 0.00 0.86 1.00 0.68 0.14 0.14 0.17 0.14
D2 0.00 1.00 1.00 0.63 0.00 0.00 0.00 0.00
D3 0.00 1.00 1.00 0.63 0.00 0.00 0.00 0.00
D4 0.00 1.00 1.00 0.63 0.00 0.00 0.00 0.00
D5 0.00 1.00 1.00 0.63 0.00 0.00 0.00 0.00
The objective skill of the model in predicting heavy rainfall (7 cm or more in 24 hours) has been
calculated considering the highest rainfall predicted by the model anywhere in the state of Kerala and
the realized heavy rainfall recorded over any station. The results are presented in Table 5 (a). Similar
analysis has been carried out for very heavy rainfall also and the results are presented in Table 5 (b).
Table 5 (a): GFS Model skill for Heavy Rainfall or more for Kerala
Table 5 (b): GFS Model skill for very Heavy Rainfall or more for Kerala
It shows that the performance of deterministic GFS – T 1534 run by IMD has been poor in
providing guidance to the forecasters during this period.
3.2.2. NCUM:
The operational NCUM at NCMRWF has been upgraded with horizontal resolution of the
model increased from ~17 km (N768L70) to ~12 km (N1024L70). Hybrid 4D-Var method is used for
data assimilation. Major improvements of the new NCUM data assimilation system in comparisons
with previous system used at NCMRWF is the use of improved version of the radiative transfer model
and the improved ability of the new system to assimilate more satellite observations.
3.2.2.1. Forecast
The relevant part of the forecast fields which have direct implications with the rainfall over Kerala on
an operational forecaster’s point of view is reproduced below.
Date / time of Initial
Conditions
Note
1st August /
00 UTC
The forecast wind field of 6th August indicated strengthening of winds over
south Arabian Sea from 6th August.
2nd August /
00UTC
Indication for the strengthening of winds over south Arabian Sea started from
5th August itself. Also a low pressure area was predicted over coastal Odisha
on 6th August and further strengthening of winds over the Arabian Sea from
6th.The mean sea level pressure pattern of 7th indicated northwestward
movement of the closed low of 998 hPa over to Jharkhand and a deepening
of the pressure gradient over the Arabian Sea. 850 hPa winds were indicative
of a feeble downstream convergence over Kerala (but divergence over south
interior Karnataka) on 7th.
3rd August /
00 UTC
Mean sea level pressure field showed a closed low over coastal west Bengal
on 5th itself and its deepening on 6th over the same region and further
FAR MR CNON PC BIAS CSI HSS POD
D1 0.00 0.82 1.00 0.53 0.18 0.18 0.16 0.18
D2 0.00 1.00 1.00 0.42 0.00 0.00 0.00 0.00
D3 0.00 0.91 1.00 0.47 0.09 0.09 0.08 0.09
D4 0.00 1.00 1.00 0.42 0.00 0.00 0.00 0.00
D5 0.00 1.00 1.00 0.42 0.00 0.00 0.00 0.00

24
intensification and westward movement on 7th.Downstream convergence of
850 hPa winds could be noticed across Kerala on 7th. On 8th; the system was
located over northeast Madhya Pradesh in the forecast mean sea level
pressure map. Heavy rainfall was predicted over north Kerala [Realised was
Nilambur – 15.5 cm]. More strong westerlies were there in the forecast field of
850 hPa on 8th August, thereby indicating sustenance of the rainfall activity.
4th August /
00 UTC
Mean sea level pressure pattern showed a closed isobar of 996 hPa over
Odisha – west Bengal coasts on 6th, its deepening and westward movement
on 7th, strengthening of winds over south peninsula at 850 hPa on 8th, heavy
rainfall on 7th, further westward movement and weakening of the low pressure
area on 9th.
5th August /
00 UTC
Showed only an extended low of 998 hPa on 6th August [and weak, when
compared to the heat low of 994 hPa], an organized and deep low pressure
area (994 hPa) on 7th, westward movement of the intense system and a steep
pressure gradient over the Arabian Sea on 8th, further westward movement
and slight weakening of the system on 9th and weakening of the pressure
gradient as well as rainfall intensity over Kerala on 10th.
6th August /
00 UTC
According to this, on 8th, the system was intense and lay over Odisha and
adjoining Chhattisgarh. Weakening of pressure gradient and reduction in rain
intensity over Kerala could be noticed from 10th.
7th August /
00 UTC
In retrogression, this forecast re-located the system over to south Odisha on
8th. However, the rainfall prediction indicating heavy rains continued over
Kerala on 8th. A weaker system over central Madhya Pradesh on 9th and its
persistence on 10th was seen. By 11th, the system became less marked in the
forecast field and the isobars became parallel to the coast along Kerala coast
(indicating reduction in rainfall for the day – in tune with what actually
happened).
8th August /
00 UTC
Model picked up the system on 9th August, predicted the rainfall of 8th and the
weakening of the pressure gradient and reduction in rainfall from 10th – 12th.
The mean sea level pressure pattern of 13th indicated a further deepening of
the pressure gradient and re-alignment of isobars along the west coast.
9th August /
00 UTC
Model indicated the fresh low pressure area (994 hPa ) over northwest Bay of
Bengal off Odisha – west Bengal coasts on 13th, its persistence and slight
deepening on 14th, indicated the heavy rainfall over Kerala on 13th (but totally
missing out those extremely heavy events over coastal and south interior
Karnataka on 13th August).
10th August /
00 UTC
Model indicated the low pressure area (994 hPa ) and a steep north- south
pressure gradient on 13th, its persistence with slight reduction in pressure
gradient on 14th, slight westward movement and filling-up (996 hPa) of the
system on 15th. (The mean sea level pressure pattern was not indicative of
the occurrence of scattered heavy to very heavy and isolated extremely heavy
rains over Kerala on 15th August).
11th August /
00 UTC
Indications of a low pressure area (994 hPa) over northwest Bay of Bengal
and adjoining Odisha and a steep north-south pressure gradient on 13th, very
strong (25 – 30 knots) winds at 850 hPa over south peninsula on 13th,
persistence of the system, with reduced north-south pressure gradient on 14th,
slight southward drift in the system on 15th and a slight westward drift on 16th.
Model even predicted 8-16 cm of rainfall over north Kerala and coastal
Karnataka on 15th. (But the same was missed over Ghat areas of south

25
interior Karnataka and Tamil Nadu).
12th August /
00 UTC
No low pressure area in the forecast field of 13th. However a well defined
cyclonic circulation is seen over northwest Bay of Bengal off Odisha coast at
850 hPa and over west central Bay of Bengal off Andhra Pradesh coast at
500 hPa on 13th. The low pressure area at mean sea level is shown only on
14th. Low pressure area is predicted to deepen on 15th, but the winds at 850
hPa shows a weakening to 25- 30 mps across south peninsula on 15th. Slight
filling and west-northwestward movement of the low pressure area on 16th and
further filling up and westward movement on 17th.
13th August /
00 UTC
Indicated a low pressure area (996 hPa) over northwest Bay of Bengal and
adjoining Odisha coast on 14th, its deepening on 15th, westward movement on
16th [ 8-16 cm rainfall predicted over Kerala for 15th August, continued over
Kerala but missed over the Ghat areas of south interior Karnataka and Tamil
Nadu ]. The system was predicted to be over Madhya Pradesh with a more
realistic intensity on 17th August and further westward movement and
weakening was indicated for 18th August.
14th August /
00 UTC
Low pressure area (994 hPa) is well captured on 15th August. Day-1 rainfall
forecast even showed rainfall of 16-32 cm over north Kerala for 14th August,
westward movement of the intense low pressure system on 16th August, but in
the rainfall forecast of 15th, there is a reduction to 8-16 cm range, while the
rainfall increased in reality from 14th – 15th. The mean sea level pressure
pattern of 17th showed slight westward movement and weakening of the
system and the pressure, wind and rainfall pattern of 18th showed a reduction
in intensity.
15th August /
00 UTC
The forecasts were in SYNC with the actual from 15th onwards.
3.2.2.2. Verification of Deterministic Model (NCUM) Forecasts
The rainfall verification over Kerala has been carried out using traditional verification approach.
The scores have been computed over the region (8-14N, 74-79E) during the period of 1-19 August
2018. The forecast is based on two high resolution deterministic models namely NCUM and GFS. The
verification has been carried out against IMD-NCMRWF merged rainfall observations. The scores
have been computed based on the component of the (2x2) contingency table. The score computed
are BIAS, Probability of Detection (POD), False alarm Ratio (FAR), Critical Success index and Peirce
Skill Score (PSS).
Fig.19 shows the verification scores obtained for NCUM in comparison with IMD GFS for a
period of 1st to 19th August over Kerala. NCUM suggests higher POD and lower FAR as compared to
GFS in all lead times. Also, NCUM has an edge over GFS in case of CSI and PSS. Other than the
exception of frequency BIAS in the day-5 forecasts where GFS shows a lower BIAS as compared to
NCUM in all the other scores and all the lead times NCUM forecasts outperform the IMD GFS
forecasts.
Thus, the NCUM: (i) could simulate the two depressions almost realistically about 4-5 days in
advance. (ii) Indications of an increase in rainfall over Kerala (which was however missed over the
western Ghat sections) also were available almost 3-4 days in advance in the precipitation forecast
field. (iii) Though the model was quite consistent, with the approach of the event, ie, within 48 hours of
the forecast range, there was under prediction.

26
Fig.19: Verification of deterministic forecasts from NCUM and IMD GFS for 1st to 19th August
2018 over Kerala
3.2.3. NEPS
The operational EPS at NCMRWF was upgraded from ~33 km (N400L70) to ~12 km
(N1024L70) resolution. It is based on Unified Model version 10.8 (UM10.8) that is a part of latest
‘Operational Global Suite’ (PS40) being developed at Met Office, UK. A total of 23 ensemble members
(22 perturbed forecasts + 1 control forecast) constitute this ensemble system. A 10 day forecast of
NEPS is routinely generated based on 00 UTC and 12 UTC initial conditions which include a control
forecast starting from hybrid-4DVar analysis and 22 (11 from 12 UTC of previous day+ 11 from 00
UTC of current day) ensemble members starting from perturbed initial conditions.
3.2.3.1. Forecast
Observed rainfall over Kerala and neighbourhood regions on 8th August is presented in Fig.20.
Day-3, 5 and 7 probablistic quantitative precipitation forecasts (PQPF) and departure of NEPS mean
forecast from model climatology valid for 8th Aug 2018 are presented in Figures 21 and 22
respectively.
Fig. 20: Observed rainfall over Kerala and neighborhood regions
on 08-08-2018
27
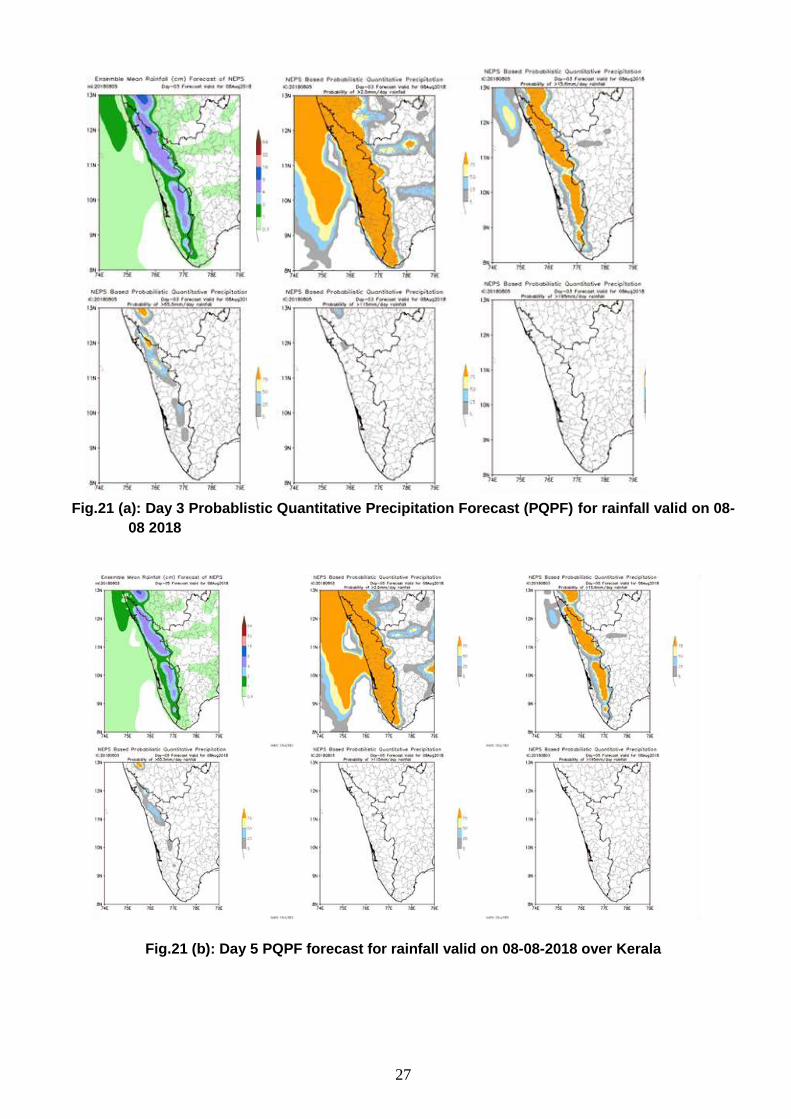
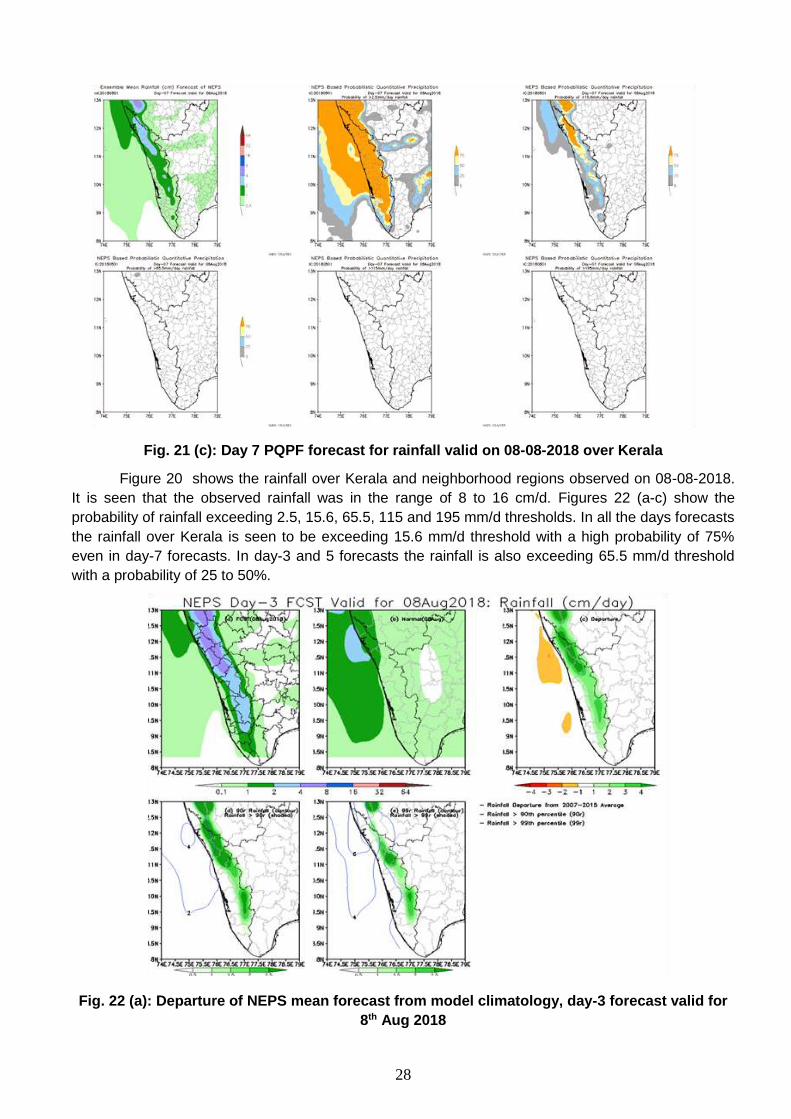
Fig.21 (a): Day 3 Probablistic Quantitative Precipitation Forecast (PQPF) for rainfall valid on 08-
08 2018
Fig.21 (b): Day 5 PQPF forecast for rainfall valid on 08-08-2018 over Kerala
28
Fig. 21 (c): Day 7 PQPF forecast for rainfall valid on 08-08-2018 over Kerala
Figure 20 shows the rainfall over Kerala and neighborhood regions observed on 08-08-2018.
It is seen that the observed rainfall was in the range of 8 to 16 cm/d. Figures 22 (a-c) show the
probability of rainfall exceeding 2.5, 15.6, 65.5, 115 and 195 mm/d thresholds. In all the days forecasts
the rainfall over Kerala is seen to be exceeding 15.6 mm/d threshold with a high probability of 75%
even in day-7 forecasts. In day-3 and 5 forecasts the rainfall is also exceeding 65.5 mm/d threshold
with a probability of 25 to 50%.
Fig. 22 (a): Departure of NEPS mean forecast from model climatology, day-3 forecast valid for
8th Aug 2018

29
Fig. 22 (b): Departure of NEPS mean forecast from model climatology, day-5 forecast valid for
8th Aug 2018
Fig. 22 (c): Departure of NEPS mean forecast from model climatology, day-7 forecast valid for
8th Aug 2018

30
Figures 22 (a-c) show the departure of NEPS mean forecast (Day-3, 5 and 7) from the model
climatology (based on 2007 to 2015 obtained from MOGREPS forecasts) as well as the forecast
rainfall exceeding the 90th and 99th percentile of the climatological rainfall. Figure 18 (a) and (c) show
that the rianfall forecasts exceeded the 99th percentile of the climatology for both Day-3 and 5. In Day-
7 also, (Figure 22 (c)) the forecast rainfall is seen to exceed the 90th percentile of the climatology.
Forecasts valid on 15th August 2018
Fig.23: Observed Rainfall on 15-08-2018 over Kerala
Figure 23 shows the rainfall over Kerala and neighborhood regions observed on 15-08-2018. It
is seen that the observed rainfall was in the range of 8 to 16 cm/d in most parts but in some parts of
northern and southern Kerala the rainfall was in the range of 16 to 32 cm/d. In Figure 24 (a-c) Day3, 5
and 7 PQPF forecasts from NEPS are presented.
Fig.24 (a): Day 3 PQPF forecast for rainfall valid on 15-08-2018 over Kerala

31
Fig. 24 (b): Day 5 PQPF forecast for rainfall valid on 15-08-2018 over Kerala
Fig. 24 (c): Day 7 PQPF forecast for rainfall valid on 15-08-2018 over Kerala
Figures 24 (a-c) that in all the days of forecasts, the rainfall over Kerala is seen to be
exceeding 65.5 mm/d threshold with a high probability of more than 75% even in day-7 forecast. Also,
in all the days of forecasts the rainfall is seen to be exceeding 115 mm/d threshold, with a smaller
probability ranging from 25 to 50%. In the day- 5 forecasts the probability of rainfall exceeding 115
mm/d threshold is seen to be in the range of 50 to 75 %. This forecast is also supported by the
departure plots as seen in the Figures 25 (a-c).

32
Fig. 25(a): Departure of NEPS mean forecast from model climatology, day-3 forecast valid for
15th Aug 2018
Fig. 25 (b): Departure of NEPS mean forecast from model climatology, day-5 forecast valid for
15th Aug 2018

33
Fig.25 (c): Departure of NEPS mean forecast from model climatology, day-7 forecast valid for
15th Aug 2018
Figures 25 (a-c) show the departure of NEPS mean forecast (Day-3, 5 and 7) from the model
climatology as well as the forecast rainfall exceeding the 90th and 99th percentile of the climatological
rainfall. It is seen from all the days forwcast that the rainfall exceeds the 90th and 99th percentile of the
climatology, which is a clear indication of more than normal (in this case extreme) rainfall event.
Forecasts valid on 16th August 2018
Fig.26: Observed Rainfall on 16-08-2018 over Kerala
Fig.26 shows the rainfall over Kerala and neighborhood regions observed on 16-08-2018. It is
seen that the observed rainfall was in the range of 8 to 16 cm/d in most parts but in some parts of
northern, central and southern Kerala the rainfall was in the range of 16 to 32 cm/d. In Figure 27 (a-c)
Day3, 5 and 7 PQPF forecasts from NEPS are presented. These indicate the probability of rainfall
exceeding 2.5, 15.6, 65.5, 115 and 195 mm/d thresholds. In all the days forecasts the rainfall over
Kerala is seen to be exceeding 65.5 mm/d threshold with a high probability of more than 75% even in
day-7 forecast particularly over northern, central and southern Kerala. Also, in day-3 and 5 forecasts

34
the rainfall forecasts are seen to be exceeding 65.5 mm/d threshold with a smaller probability of 25 to
25 %.
Fig. 27 (a): Day 3 PQPF forecast for rainfall valid on 16-08-2018 over Kerala
Fig. 27 (b): Day 5 PQPF forecast for rainfall valid on 16-08-2018 over Kerala

35
Fig. 27 (c): Day 7 PQPF forecast for rainfall valid on 16-08-2018 over Kerala
Fig. 28 (a): Departure of NEPS mean forecast from model climatology, day-3 forecast valid for
16th Aug 2018

36
Fig. 28 (b): Departure of NEPS mean forecast from model climatology, day-5 forecast valid for
16th Aug 2018
Fig. 28 (c): Departure of NEPS mean forecast from model climatology, day-7 forecast valid for 16th Aug 2018

37
Figures 28 (a-c) show the departure of NEPS mean forecast (Day-3, 5 and 7) from the model
climatology as well as the forecast rainfall exceeding the 90th and 99th percentile of the climatological
rainfall. It is seen from all the days forwcast that the rainfall exceeds the 90th and 99th percentile of the
climatology, which is a clear indication of more than normal (in this case extreme) rainfall event.
The NEPS Day-4 rainfall (cm/day) valid for 9th August, 2018 is presented in Fig. 29. 12 members out of 22 show very heavy rainfall between 12-20 cm and 17h member could capture extremely heavy rainfall beyond 20 cm.
Fig.29: NEPS Day-4 rainfall (cm/day) valid for 9th August, 2018

38
NEPS Day-1 rainfall (cm/day) valid for 15th August, 2018 is presented in Fig.30. All the members captured very heavy rainfall of 12-20cm and 17 members + CNTL could capture extreme heavy rainfall beyond 20 cm
Fig.30: NEPS Day-1 rainfall (cm/day) valid for 15th August, 2018

39
NEPS Day-3 rainfall (cm/day) valid for 15th August, 2018 is presented in Fig.31. CNTL + 6 members captured very heavy rainfall of 12-20cm and 19th member could capture extreme heavy rainfall beyond 20 cm.
Fig.31: NEPS Day-3 rainfall (cm/day) valid for 15th August, 2018

40
NEPS Day-1 rainfall (cm/day) valid for 16th August, 2018 is presented in Fig.32. CNTL and 12 members captured heavy rainfall of 12-20 cm.
Fig.32: NEPS Day-1 rainfall (cm/day) valid for 16th August, 2018
41
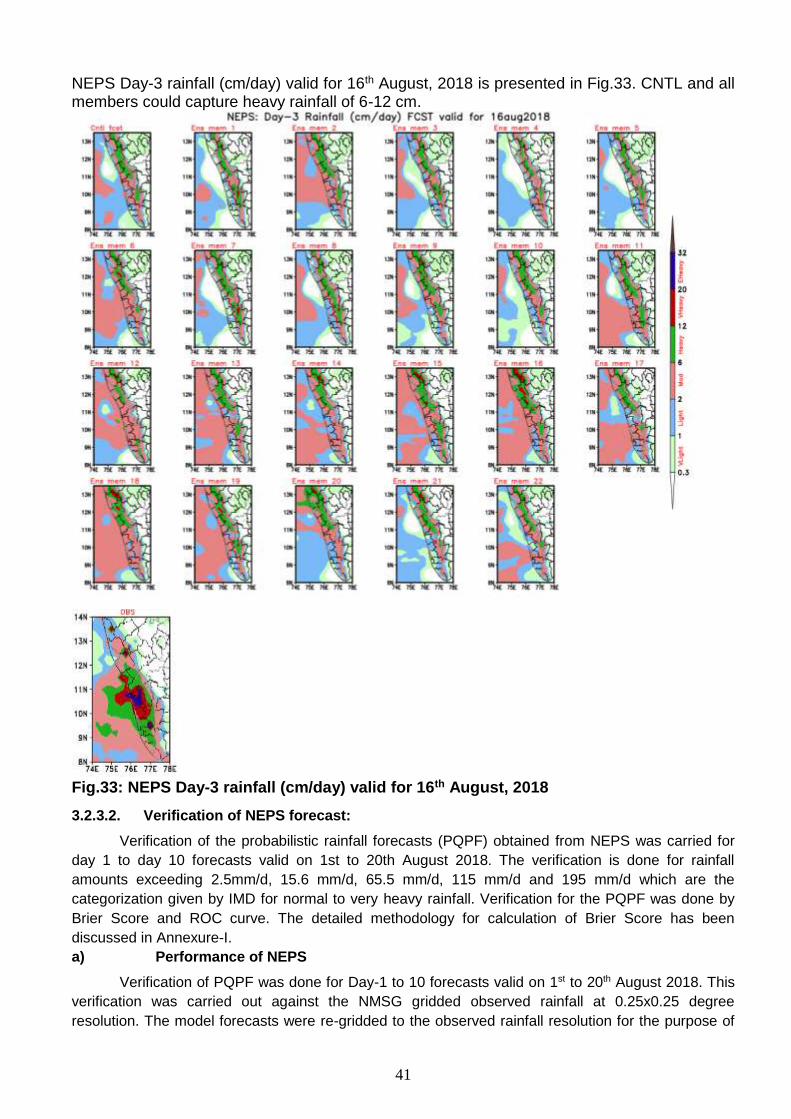
NEPS Day-3 rainfall (cm/day) valid for 16th August, 2018 is presented in Fig.33. CNTL and all members could capture heavy rainfall of 6-12 cm.
Fig.33: NEPS Day-3 rainfall (cm/day) valid for 16th August, 2018
3.2.3.2. Verification of NEPS forecast:
Verification of the probabilistic rainfall forecasts (PQPF) obtained from NEPS was carried for
day 1 to day 10 forecasts valid on 1st to 20th August 2018. The verification is done for rainfall
amounts exceeding 2.5mm/d, 15.6 mm/d, 65.5 mm/d, 115 mm/d and 195 mm/d which are the
categorization given by IMD for normal to very heavy rainfall. Verification for the PQPF was done by
Brier Score and ROC curve. The detailed methodology for calculation of Brier Score has been
discussed in Annexure-I.
a) Performance of NEPS
Verification of PQPF was done for Day-1 to 10 forecasts valid on 1st to 20th August 2018. This
verification was carried out against the NMSG gridded observed rainfall at 0.25x0.25 degree
resolution. The model forecasts were re-gridded to the observed rainfall resolution for the purpose of

42
verification. The thresholds used for the calculation of BS are 2.5, 15.6, 65.5, 115 and 195 mm/d.
Fig.34 shows the BS for all the days and the above mentioned thresholds. It is seen from the figure
that the BS for lower rainfall thresholds is better as compared to higher rainfall values. This shows that
the model is better predict lower rainfall amounts. For rainfall exceeding 115 and 195 mm/d thresholds
the BS is almost identical showing that the model has comparable skill in predicting rainfall in these
thresholds. Also, the BS is seen to be decreasing with increasing forecast lead time indicating that the
model has better capability of predicting rainfall with increasing time. Also for 2.5 mm/d threshold the
BS is almost constant for all forecast lead times which shows that the skill of the model is not changing
much from day-1 to day-10 for this threshold.
Fig. 34: Brier Score for day-1 to 10 forecasts (valid for 1st to 20th august 2018) for rainfall exceeding the above mentioned thresholds.
Fig.35 shows the ROC curve for day-3, 5 and 7 forecasts for 2.5, 15.6, 65.5 and 115 mm/d
thresholds. It indicates that the model has some skill in predicting rainfall in all these thresholds as the
ROC curve is above the diagonal in all the cases. In the Day-3 forecasts for all the thresholds it is
seen that forecasts with 90% probability are having a hit rate of more than 60% and a false alarm rate
of more than 40%. The false alarm rate is seen to be increasing along with the hit rate with increasing
rainfall thresholds. The hit rate is seen to be decreasing with increasing lead time particularly for lower
rainfall thresholds of 2.5 and 15.6 mm/d. Even in day-7 it is seen that the forecasts with higher
probabilities have a high hit rate particularly for 2,5 and 15.6 mm/d thresholds the false alarm rate is
also lower.
Fig.35: ROC curve for day-1, 3 and 7 forecasts (valid for 1st to 20th August 2018) for rainfall exceeding the above mentioned thresholds.
Day-7 Day-5 Day-3

43
Districtwise rainfall verification of NEPS over Kerala state during 1st Aug. to 19th Aug.
2018 is presented in Fig. 36.
Fig. 36: District level Rainfall verification of NEPS over Kerala state during 1st Aug. to
19th Aug. 2018
3.2.4. GFS T 1534 (V 13.0 and V14.0) performance at district level
District level day-1 to day-5 foreacst based on GFS T1534 Model over Kerala state have been
verified during the period from 1Aug to 19 Aug 2018. Here, the observed maximum, minimum and
average rainfall in each district is compared with model day-1 to day-5 forecast. It is observed that
model could capture the Heavy rainfall in most of the districts in the day-1 forecast and in some district
in the day-2 forecast .However, in the day-2 to day-5 forecast, model could capture the average
rainfall over the districts. Results are shown in Fig.37.
Fig.38 depicts the accumulated rainfall as forecast by GFSV14 for the period 1 August-19
August up to 5 days. It is seen that, Day 1 forecast shows accumulation of more than 120 cm of rain
over the regions around Malappuram, Palakkad and Idukki districts. It also shows rainfall accumulation
of around 60~80 cm all along the coastal Kerala suggesting the exceptionally heavy nature of rainfall.
Rainfall accumulation on day 2 forecast is found to be reduced to 40~60 cm over the coastal
Kerala and also over the districts of large excess. Model forecast of day3 to day 4 shows further
reduction of accumulated rainfall forecast of about 20~40 cm over the coastal belts and also over the
mentioned districts. Day 5 forecast does not show the exceptional heavy nature of rainfall
accumulation over the state.
Fig.39 presents that the rainfall over the state picked up around 8 August and continued with
varied intensity till around 18 August. During this period the observed rainfall was significantly higher
than the climatology. This happened particularly during 8-9 Aug and 15-16 Aug. During 1-7 Aug, when
the observed rainfall was low, the model forecast was comparable with the observation. On 8 Aug,
model forecast of 24h and 48h could show some indication of the heavy spell but underestimated the
observed rain. As the lead time increases, forecast rainfall decreases gradually. On subsequent days
of heavy rain during 9-12 Aug, the model forecast underestimated the observed rain. From 13 Aug

44
onward, the GFS forecast could capture the heavy spells with some underestimation on 14 and 15
Aug. The reduction of rainfall intensity beyond 48/72 hr of forecast is evident during this period of
heavy rain spells.
The time series of daily rainfall (averaged over the state) from the IMD-GPM merged daily
rainfall data along with IMD climatology and model (GFSv14) 5 days forecast is presented in Fig.40.
Fig. 37: District level Rainfall verification of GFS T1534 over Kerala state during 8-18th Aug.

45
Fig.38: Accumulated rainfall forecast in (cm/day) during 01-19 August 2018 based on GFSV14.
Fig.39: Rainfall (mm/day) time series over Kerala during 01-19Aug, 2018
Fig.40: IMD GFSv14 5 days forecast of daily rainfall (mm/day) accumulation over Kerala during 01-19August 2018 alongwith IMD GPM merged daily rainfall data and IMD climatology

46
Fig. 41, 42 and 43 present the spatial rainfall forecast from GFSv14 with 24hr, 48hr, 72hr, 96hr
and 120 hr lead time valid for 03UTC 6th Aug, 8th Aug and 9th Aug. The forecast was compared with
the spatial plot of IMD-GPM data for the respective days.
On 6th Aug (Fig.41), model prediction shows rainfall being confined mostly over northern
Kerala region and relatively lighter rain of around 10 mm/day over the southern parts. Fig.42 shows
the 5 days prediction of GFSV14 valid for the first day of extremely heavy spell on 8th Aug. While the
model in 24, 48 and 72 hr forecast shows significant enhancement of rainfall over the whole coastal
region of the state, it is unable to show the pick rainfall activity over land as shown in the observation.
Heavier rainfall was predicted off the coast. For the forecast valid for 03 UTC of 9th August (Fig.43),
the model prediction upto 72 hr shows rainfall all along the coast around 50-60 mm/day while the
observed was significantly higher. The spatial plot is consistent with the time series of prediction and
observation.
Fig.41. GFS (12.5 km) model rainfall forecast upto 120h lead time valid for 0300UTC of 6 Aug
Fig.42. GFS (12.5 km) model rainfall forecast upto 120h lead time valid for 0300UTC of 8 Aug
24 Hr 48 Hr 72Hr
96 Hr 120 Hr IMD GPM Obs 06 Aug
24 Hr 48Hr 72 Hr
96 Hr 120 Hr IMD GPM Obs 08 Aug

47
Fig.43: GFS (12.5 km) model rainfall forecast upto 120h lead time valid for 0300UTC of 9th Aug
Fig.44 shows the spatial plot of forecast rainfall valid for 03 UTC of 15th where the next extremely heavy rainfall spells were received. The 24hr forecast of GFSV14 (with initial condition of 14 Aug 00UTC) was able to capture some of the localized heavy spells as reported on 03 UTC of 15 Aug. However, the localised heavy rainfall of 15 Aug was not very evident in 72 to 120 hr forecast although the model showed enhanced rainfall of around 50-60 mm/day over land areas of the state.
Fig. 44: GFS (12.5 km) model rainfall forecast upto 120h lead time valid for 0300UTC of 15th Aug
24hr 48h 72h
120h 96 hr IMD-GPM Obs 15 Aug
96 Hr 120 Hr IMD GPM Obs 09 Aug
24 Hr 48Hr 72 Hr

48
Fig.45 shows the spatial plot of forecast rainfall valid for 03 UTC of 16th Aug where the next extremely heavy rainfall spells was received. 24hr and 48 hr GFSV14 forecast could capture some of the locations of extremes rain as seen in the IMD-GPM observed rainfall plots. However from 72 hr onwards the forecast underestimate the extreme rainfall amount and location.
Fig.45. GFS (12.5 km) model rainfall forecast upto120hr lead time valid for 0300UTC of 16th Aug
Fig.46 & 47 show the GFS(V14.0) model rainfall forecast error with respect to observed gridded rainfall for the period 5-9 Aug, 10-14 Aug and 15-19 Aug for day 1 to day 4 lead time. It is evident that the forecast rainfall is underestimated more during 5-9 Aug due to which model shows positive error (more rain over sea) and negative error over the land. The error over land for the period of 10-14 Aug is relatively less than that during 5-9 Aug.
Fig. 46: Error (Model-Observation) for Day 1 (upper panel) and Day 2 (lower panel) Forecast 5
day accumulated rainfall
24h 48h 72h
96Hr 120Hhr IMD-GPM Obs 16 Aug 03UTC
5th
-9th
August 10th
-14th
August 15th
-19th
August

49
Fig.47: Error (Model-Observation) for Day 3 (upper panel) and Day 4 (lower panel) Forecast 5
day accumulated rainfall
Fig.48, 49 and 50 show the bias, equitable threat score (ETS) and Peirce’s skill score (true skill statistics: TSS). All these scores are computed based on contingency table mentioned below and bringing the model grid rainfall re-gridded to IMD-GPM rainfall grid. It shows the bias skill for 1 – 19 Aug for 5 days lead. As shown in the figures, the bias shows values more than 1 over the coastal sea region and less than 1 over the land. This indicates model bias towards overestimating rain over oceanic region and underestimating over land.
Fig.48: Bias score for rainfall (1-19 August 2018) at 15.6 mm threshold for GFS T1534 V14
5th
-9th
August 10th
-14th
August 15th
-19th
August

50
From Fig.49 and 50, over the coastal and land region up to 2 days (48 hr) lead period the ETS varied between 02 to 0.3 and during 72hr to 120 hr, the ETS reduced and varied between 0.1 & 0.2. The PSS skill scores of day 1 forecast was around 0.4 and reduced in longer leads and varies between 0.2 & 0.4.
Fig.49: Equitable Threat Score for rainfall (1-19 August 2018) at 15.6 mm threshold for GFS
T1534 V14
Fig.50: Peirce Skill Score for rainfall(1-19 Aug. 2018) at 15.6 mm threshold for GFS T1534 V14

51
3.2.5. GEFS model forecast
Fig.51, 52 and 53 show the spatial plots of forecast rainfall probability from GEFS valid for 08
Aug and 15 Aug with 06 Aug initial condition, 14 Aug initial condition and 12 Aug initial condition
respectively. For forecast valid for 03 UTC of 8 Aug with 06 Aug 00UTC initial condition, the extremely
heavy rain probability is missed (Fig.51) in the model prediction.
Fig.51: 24 hr forecast Rainfall probability GEFS: IC 20180814 00UTC Valid for 03UTC of 15 Aug
2018
Fig.52: 48 hr Rainfall probability GEFS: IC 20180806 00UTC Valid for 03UTC of 08 Aug 2018
>2.5 mm/day >15.6 mm/day >65.5 mm/day
>115 mm/day >195 mm/day
>65.5 mm/day
>15.6 mm/day >2.5mm/day
>115
mm/day

52
Fig.53. 72 hr forecast spatial rainfall probability with GEFS: IC 20180812 00UTC Valid for 03UTC of 15 Aug 2018
Fig.53 shows the 3 day (72 hr) forecast valid for 15 Aug 03UTC with initial condition of 12 Aug
00UTC. Besides the lower probability, the GEFS EPS could show the heavy rainfall exceeding 65.5
mm/day with more than 75% probability.
3.2.6. Comparative analysis of deterministic GFS V14 and probabilistic GEFS 13
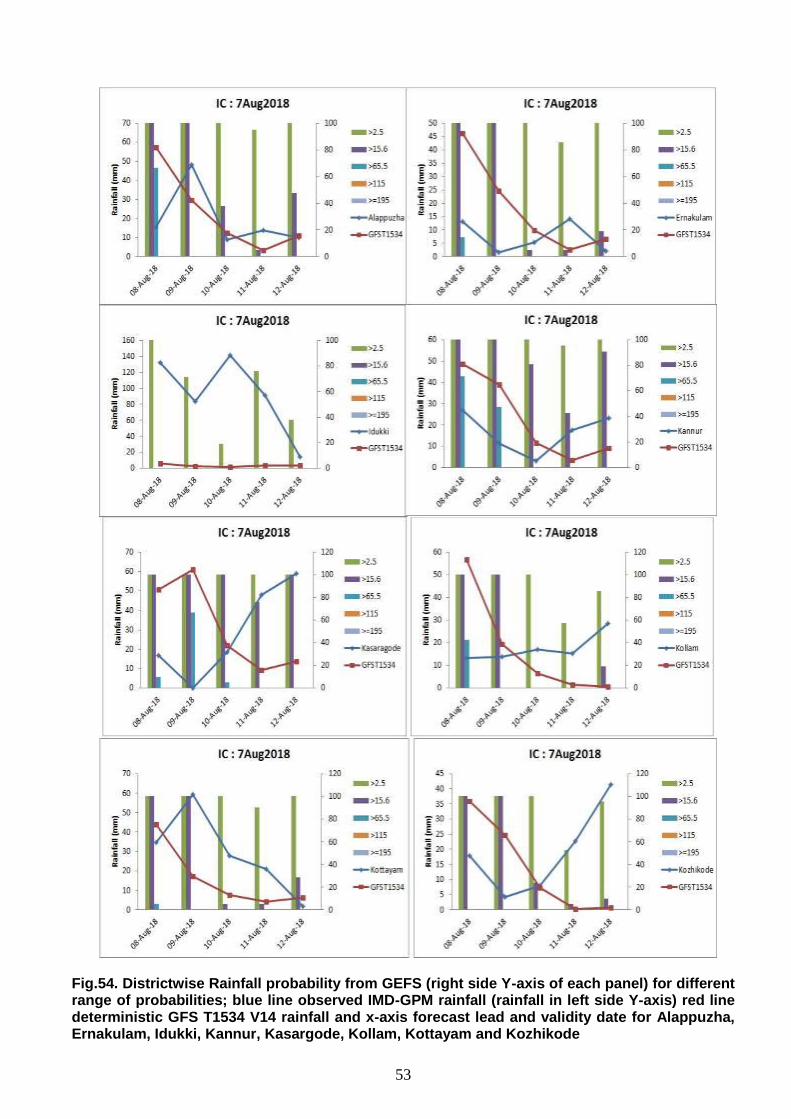
Fig.54 shows the deterministic GFSV14 rainfall forecast for next 5 days and comparison with IMD-GPM observed rain over the location for next five days. It also shows the GEFS probability for all the thresholds. This figure brings out the forecast amount from deterministic model and probability of the rain from the ensemble prediction system. Fig.54 show the analyses with 07 Aug initial condition for the next five days over Alappuzha, Ernakulam, Idukki, Kannur, Kasargode, Kollam, Kottayam and Kozhikode.
It is seen that the observed and predicted rain over Alappuzha matches well on 9, 10, 11 and 12 Aug. The probability was high in all the days for 2.5 mm/day threshold. Higher probability for threshold of 15.6 mm/day was predicted on 8-9 Aug. Probability from EPS matches well on 8, 10, 11 and 12 Aug. The intensity from deterministic forecast is found reasonable on 9-12 Aug over Alappuzha. For Ernakulam, with 7 Aug, initial condition, the deterministic prediction overestimates the observation on 8 and 9 Aug but captures during 10, 11 and 12 Aug. The probability of rain from EPS matches well with all the five days rainfall. With 7 Aug, initial condition, over Idukki, the deterministic prediction could not capture the very heavy rainspell and the probability from EPS also could not indicate the possibility of heavy rain. Over Kannur, the rainfall intensity prediction by GFSv14 and the probability from EPS is reasonable with respect to observation. Over Kasargode, the GFSv14 overestimates the observed rainfall on 8 and 9 Aug and
underestimates subsequently while the rainfall in observation picked up. The EPS probability was
indicating higher probability with rainfall exceeding 15.6 mm/day. Over Kollam, the higher probability
was for the rain exceeding 15.6 mm/day for 8 and 9 Aug and the observed rain appears to be of the
same order. During 10-11 Aug, Kollam receives rain of the order of 15-20 mm/day while the GFS V14
prediction shows almost no rain. Over Kottayam, on 8 Aug, the observation and GFSV14 24hr
forecast matches well. On 9 Aug, the rainfall increases up to around 60 mm/day which the GFSV14
underestimates. The higher probability is found for the rain exceeding 15.6 mm/day. Over Kozhikode,
from 8 Aug to 12 Aug, the rainfall gradually increases starting from around 15 mm/day on 8 Aug.
GFSV14 overestimates the rain on 8 Aug and then gradually shows lesser rain in subsequent days.
>2.5 mm/day >15.6 mm/day >65.5mm/day
53
Fig.54. Districtwise Rainfall probability from GEFS (right side Y-axis of each panel) for different range of probabilities; blue line observed IMD-GPM rainfall (rainfall in left side Y-axis) red line deterministic GFS T1534 V14 rainfall and x-axis forecast lead and validity date for Alappuzha, Ernakulam, Idukki, Kannur, Kasargode, Kollam, Kottayam and Kozhikode

54
Fig.55 shows the rainfall over Alappuzha, Ernakulam, Idukki and Kannur with 11 Aug and 15 Aug initial conditions.
Fig.55: Districtwise Rainfall probability from GEFS (right side Y-axis of each panel) for different range of probabilities; blue line observed IMD-GPM rainfall (rainfall in left side Y-axis) red line deterministic GFS T1534 V14 rainfall and x-axis forecast lead and validity date based on initial condition of (a-d) 11 August and (e-h) 15 August for Alappuzha, Ernakulam, Idukki and Kannur

55
To understand the possible dynamical reason, the vertical profile moisture convergence is
presented in Fig.56. The climatological moisture convergence for the period of 1-19 Aug from ERA is
compared with that of the GFSV14 T1534 analyses and corresponding forecast upto 5 day lead
averaged over Kerala. It may be noted that lower level convergence as estimated from GFS analyses
is significantly higher than its climatology (3 to 4 times) based on ERA. The convergence however is
confined within boundary layer. The GFS forecast with day 1 lead is able to capture the convergence
to certain extent but in subsequent lead barring day 2, the lower level convergence is weak.
Fig.56. Vertical profiles of moisture convergence based on ERA data for climatology, GFS
T1534 analyses and forecast up to day 5 lead for the period 1 – 19 Aug 2018 over the state of Kerala.
The state of Kerala witnessed unprecedented rainfall activity during 1-19 Aug 2018. The
rainfall spells were particularly strong during 8-9 Aug and 15-16 Aug although it was continuously
getting during this whole period. GFS and GEFS model could capture the second spell of 15-16 Aug
reasonably well but find it difficult to capture the intensity on 8 Aug in particular. One of the issues that
has come up from the analyses is the model has a positive error over the coastal ocean and negative
error over the land particularly during 4 – 9 Aug period. This has been reflected in Bias skill of the
model. It appears that the lower level moisture convergence during this period was exceptionally high
almost 3 to 4 times than its climatology. GFS forecast with 24h lead, is able to capture the moisture
convergence and with 48h lead also it has partly captured but with longer lead, the convergence
weakened. This could be one possible reason, why the extremely heavy rainfall is missed on some
occasions in model forecast with longer lead.
3.2.7. GEFS Probability following Webster etal The Accumulated rainfall by IMD-GPM and by GEFS for the duration 13-16 August is
presented in Fig.57(a) & (b) respectively. Model underestimated the forecast rainfall although captures some of the location of heavy rain.

56
Fig.57: Accumulated rainfall (cm) during 13-16 August (a) from IMD-GPM merged data and (b) GEFS forecast
Fig.58(a, b and c) shows the GEFS probability from 11 to 19 August for Idukki, Palakkad and all land region of Kerala respectively. The blue line is the observed rain. Dashed line (black) is the ensemble mean. Fig.58: Colored shading shows the probability of rainfall based on 21 ensemble
member with 10 Aug IC. Black dashed line is ensemble mean and blue solid line is the observed rainfall.
Fig.59 is drawn similar to Webster et al. Fig.59a and Fig.59b give similar information (Fig.59b is exactly similar to Webster et al.). These Figures show probability with forecast lead time for a rainfall threshold of climatology + 1 Standard deviation. As per this definition, event of 8 Aug and that of 15-16 Aug is predicted with 60 to 70% probability (Fig.59a and 59b). For Kerala, the climatological rain for each day of 1 to 19 Aug was around 2 cm and the 1 standard deviation is ~ 0.5, so the threshold selected here had been ~ 2.5 cm. The probability that these two figures show the probability for a threshold of 2.5 cm, which is not an extreme rain category for the region at this period. It may be noted in Webster et al paper, the peak of July 12 was ~30 mm/day. The threshold of climatology + 2 S. D., where we get 1 to 2 days lead (with 60% probability) is presented in Fig.59c and 59d.

57
Fig.59: Forecast lead time diagram of the probability of GEFS for threshold rain of
Climatology plus 1 SD (upper panel) and climatology plus 2SD (lower panel)
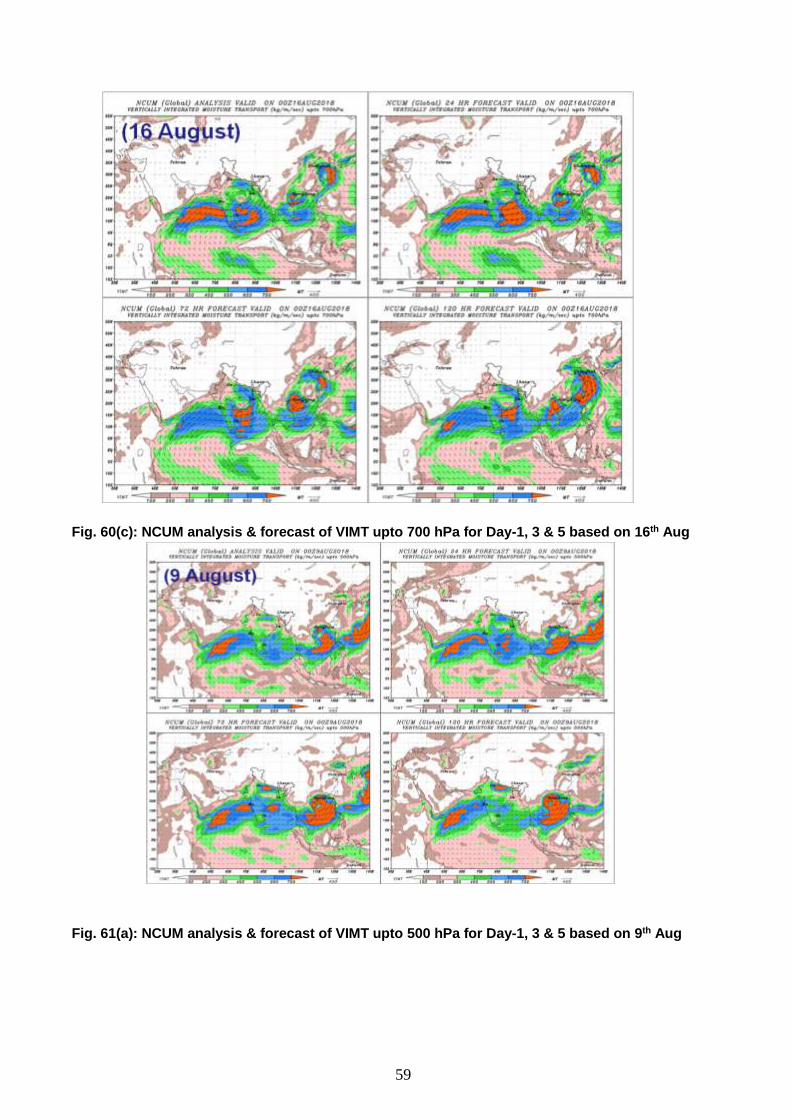
3.2.8. Verification of Vertically Integrated Moisture Transport NCUM analysis and forecast fields of vertically integrated moisture transport (VIMT) for
Day-1, 3 and 5 upto 700, 500 and 300 hPa levels are presented in Fig.60, 61 and 62 respectively.
Fig. 60(a): NCUM analysis & forecast of VIMT upto 700 hPa for Day-1, 3 & 5 based on 9th-10th Aug.

58
Fig. 60(b): NCUM analysis & forecast of VIMT upto 700 hPa for Day-1, 3 & 5 based on 14th-15th Aug.
59
Fig. 60(c): NCUM analysis & forecast of VIMT upto 700 hPa for Day-1, 3 & 5 based on 16th Aug Fig. 61(a): NCUM analysis & forecast of VIMT upto 500 hPa for Day-1, 3 & 5 based on 9th Aug

60
Fig.61(b): NCUM analysis & forecast of VIMT upto 500 hPa for Day-1, 3 & 5 based on 10th &14th Aug.

61
Fig.61(c): NCUM analysis & forecast of VIMT upto 500 hPa for Day-1, 3 & 5 based on 15th &16th Aug

62
Fig.62(a): NCUM analysis & forecast of VIMT upto 300 hPa for Day-1, 3 & 5 based on 9th &14th Aug

63
Fig.62(b): NCUM analysis & forecast of VIMT upto 300 hPa for Day-1, 3 & 5 based on 15th &16th Aug.

64
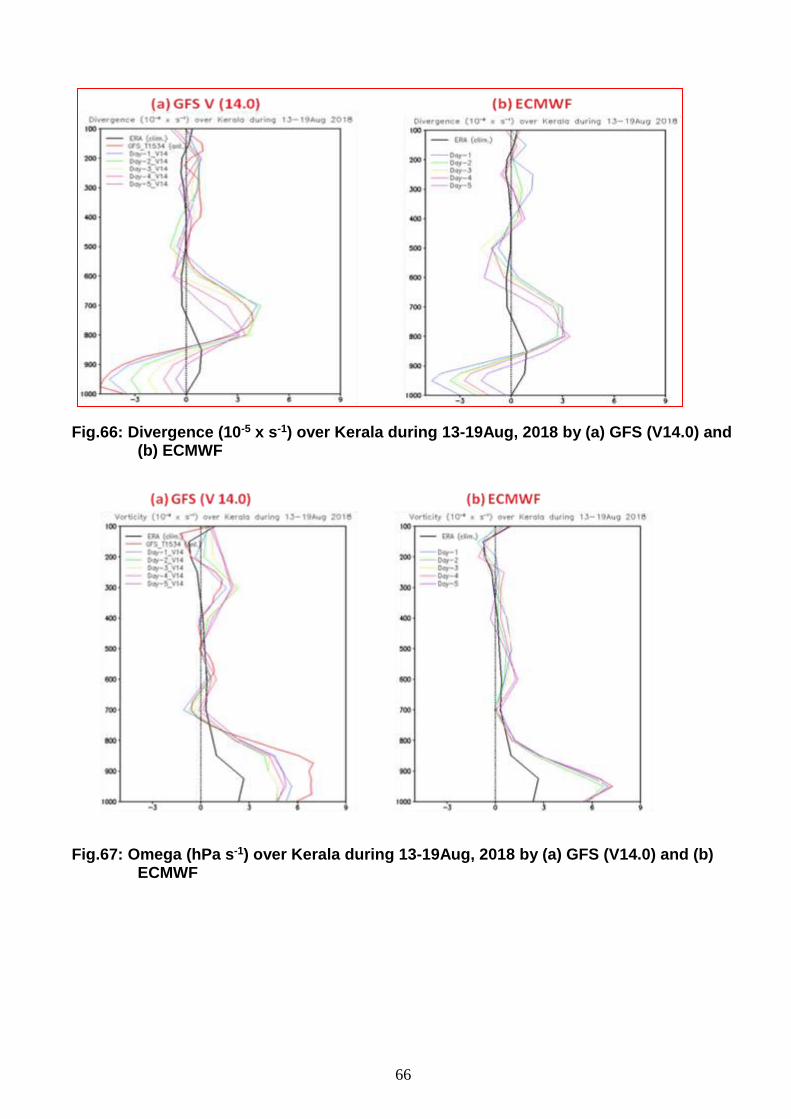
3.2.9. Comparative analysis of GFS and ECMWF forecast The comparative analysis of GFS forecast for the period 1-19 August and ECMWF
forecast with 5 days lead time is discussed in this section (Fig.63-69). It is seen that both the
systems performed equivalently in terms of capturing the spell between 13-19 Aug and not
capturing the spell during 6-9 August so well. Both the modelling systems seemingly suggest
(from vorticity, vertical velocity and divergence/convergence fields) that the convection during
this time was not deep and extending upto about 3 km (700 hPa). This was also supported by
the cloud top temperature and very less lightning activity during this time.
Fig.63: Accumulated rainfall (cm) (a) observed (IMD-GPM merged) and forecast (day-1,2,3,4 & 5) during 06 - 19th August 2018 by (b) GFS (V 14.0) and (c) ECMWF
(a) (b) (c)

65
Fig.64: Rainfall (mm/day) time series over Kerala during 06-19Aug, 2018 by (a) GFS (V14.0) and (b) ECMWF
Fig.65: Weekly Rainfall (mm) accumulation over Kerala during 06-19Aug, 2018 by (a)
GFS (V14.0) and (b) ECMWF
66
Fig.66: Divergence (10-5 x s-1) over Kerala during 13-19Aug, 2018 by (a) GFS (V14.0) and (b) ECMWF
Fig.67: Omega (hPa s-1) over Kerala during 13-19Aug, 2018 by (a) GFS (V14.0) and (b)
ECMWF

67
Fig.68: Vorticity (10-5 x s-1) over Kerala during 13-19Aug, 2018 by (a) GFS (V14.0) and (b) ECMWF
Fig.69: Q1 (Kday-1) over Kerala during 13-19Aug, 2018 by (a) GFS (V14.0) and (b)
ECMWF

68
3.2.10. WRF
The realtime WRF model forecasts were available with two different resolutions (9 and 3 km)
during the heavy rainfall episodes over Kerala from 01 August to 19 August 2018. The two most
prominent heavy rainfall episodes during 08 to 10 August (EPISODE-1) and 14 to 16 August
(EPISODE-2) 2018 respectively are discussed here to present in terms of spatial distribution of
rainfall over Kerala. Although the districtwise verification of daily maximum rainfall forecasts has been
carried out for the whole duration mentioned above. The performance of WRF forecasts with two
different resolutions have been discussed separately one after another but at the end comparative
anaysis also been included.
3.2.10.1. WRF (09 km):
The spatial distributions observed rainfall from the 0.25ox0.25o analysis of IMD are shown in
the top panels of the Fig.70 for the EPISODE-1. The panels starting from the leftmost panel towards
right are representing sequentially the rainfall for the consecutive days from 08 August to 10 August
2018. The model forecasts for the respective days are shown in the diagrams in the rows downwards
for Day 1, Day 2 and Day 3 respectively. The forecasts in a column represent the 24 hours
accumulated rainfall valid at 03 UTC of the respective day matching with observation time.
The subjective assessement of the model forecasts reveals that the rain events during these
days have been missed in terms of intensity along with a complete mismatch in the location of peak
rainfall. Although, the Day 1 forecasts could produce better rainfall distribution compared to Day 2 or
Day 3 forecasts but the rainfall amount execeeding heavy rainfall limit (more than 6.45 cm) could not
be brought out by the model. The Day 3 forecasts rather predicted comparatively higher rainfall
amount nearby areas on 8 and 9 August 2018 and missed the observed locations of heavy to very
heavy rainfall. The model forecasts with all lead times could not capture the area of maximum rainfall
valid on 10 August 2018.
The Fig.71 shows the spatial distribution of observed and forecast rainfall similar to figure 1 but
for the period during EPISODE-2. in this case, the spatial distribution of rainfall in Day 1 forecasts
resembles better compared to EPISODE-1. The model performance in Day 2 and Day 3 forecasts
degraded compared to Day 1. The intensity of rainfall could not be predicted well by the model
forecasts but demonstration of heavy rainfall (>7.0 cm) zones over Kerala districts in Day 1 forecasts
is comparatively better than the model performance during EPISODE-1. The presence of heavy
rainfall zone north of Kerala along west coast and the absense of heavy rainfall over Kerala in Day 2
and Day 3 forecasts is a distinguished feature of the model performance.
The time series of daily observed maximum rainfall recorded at any of the station located
inside the districts of Kerala are shown in the bar plots of Fig.72. The bar plots of model forecasts for
Day 1, Day 2 and Day 3 are plotted along with the observed rainfall of respective days during the
whole duration from 01 August to 19 August 2018. The figure illustrates the maximum rainfall
predictions for 12 districts of Kerala which experienced several very heavy rainfall (>12.5 cm) events
during the first 19 days of August 2018. The district of Kasaragod received maximum rainfall less than
10 cm and therefore has been omitted in the discussion. Same way, the time series for
Thiruvananthapuram district is not discussed as it experienced maximum rainfall more than 10 cm
only for a day during the period.
The overall analysis of the time series of district-wise observed maximum rainfall along with
corresponding models forecasts reveal that the occurrences of very heavy rainfall events over all
districts of Kerala have been missed by the model with a lead time of 48 and 72 hours. In some days,
Day 1 forecasts could predict peak rainfall more than 10 cm but the extremely heavy rainfall (> 24.5
cm) events over all districts are always absent in model forecasts. The figures also demonstrated that
the model forecasts missed the heavy rainfall events over all districts during EPISODE-1 and also
established rather better performance of the model during EPISODE-2.

69
Fig.70: Rainfall distribution of 24 hour accumulated rainfall during EPISODE-1. The (a), (b) and (c) are
for observed rainfall analyses whereas (d), (e) and (f) for Day 1, (g), (h) and (i) for Day 2 and (j), (k) and (l) for Day 3 forecasts of WRF (9 km) model valid at 03 UTC of 08, 09 and 10 August 2018 respectively.
(a) Obs. Rainfall on 08-08-2018 (b) Obs. Rainfall on 09-08-2018 (c) Obs. Rainfall on 10-08-2018
(d) Day 1 forecast (e) Day 1 forecast (f) Day 1 forecast
(g) Day 2 forecast (h) Day 2 forecast (i) Day 2 forecast
(j) Day 3 forecast (k) Day 3 forecast (l) Day 3 forecast

70
(a) Obs. Rainfall on 14-08-2018 (b) Obs. Rainfall on 15-08-2018 (c) Obs. Rainfall on 16-08-2018
(d) Day 1 forecast (e) Day 1 forecast (f) Day 1 forecast
(g) Day 2 forecast (h) Day 2 forecast (i) Day 2 forecast
(j) Day 3 forecast (k) Day 3 forecast (l) Day 3 forecast
Fig.71: Rainfall distribution of 24 hour accumulated rainfall during EPISODE-2. The (a), (b) and (c) are
for observed rainfall analyses whereas (d), (e) and (f) for Day 1, (g), (h) and (i) for Day 2 and (j), (k) and (l) for Day 3 forecasts of WRF (9km) model valid at 03 UTC of 14, 15 and 16 August 2018 respectively.
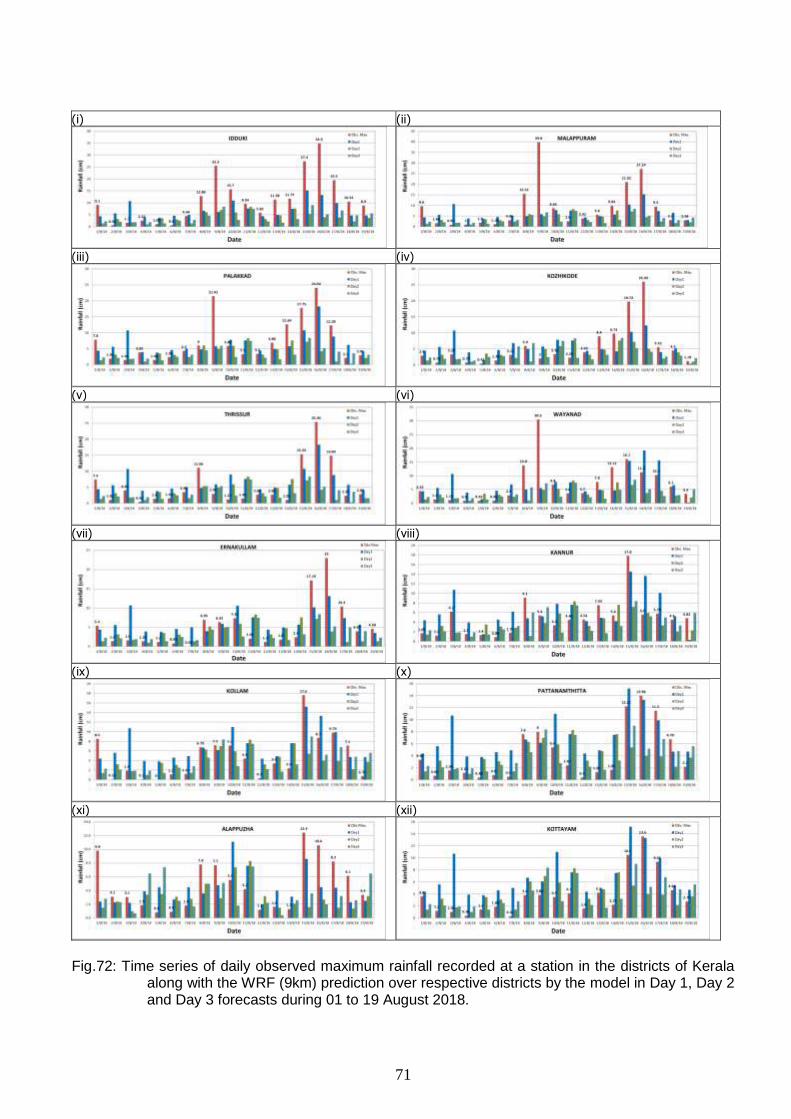
71
(i) (ii)
(iii) (iv)
(v) (vi)
(vii) (viii)
(ix) (x)
(xi) (xii)
Fig.72: Time series of daily observed maximum rainfall recorded at a station in the districts of Kerala
along with the WRF (9km) prediction over respective districts by the model in Day 1, Day 2 and Day 3 forecasts during 01 to 19 August 2018.

72
3.2.10.2 WRF (03 km):
The Fig.73 represents the spatial distribution of of WRF (3 km) model forecasts along with
observed rainfall presenting the EPISODE-1. The investigation all panels of the figure depicts that the
rain events during these days the peak rainfall over the region could not be captured by the model. In
this case also the Day 1 forecasts could produce better rainfall distribution compared to Day 2 or Day
3. The rainfall zones with amount execeeding heavy rainfall limit (more than 6.45 cm) is produced in a
better way comapred to WRF (9km). The Day 3 forecasts rather predicted comparatively higher
rainfall amount although missed the exact observed locations of heavy to very heavy rainfall.
(a) Obs. Rainfall on 08-08-2018 (b) Obs. Rainfall on 09-08-2018 (c) Obs. Rainfall on 10-08-2018
(d) Day 1 forecast (e) Day 1 forecast (f) Day 1 forecast
(g) Day 2 forecast (h) Day 2 forecast (i) Day 2 forecast
(j) Day 3 forecast (k) Day 3 forecast (l) Day 3 forecast
Fig.73: Rainfall distribution of 24 hour accumulated rainfall during EPISODE-1. The (a), (b) and (c) are
for observed rainfall analyses whereas (d), (e) and (f) for Day 1, (g), (h) and (i) for Day 2 and (j), (k) and (l) for Day 3 forecasts of WRF (03 km) model valid at 03 UTC of 08, 09 and 10 August 2018 respectively
The spatial distribution of observed and WRF (3km) forecast rainfall for the period during
EPISODE-2 is plotted in Fig.74. The model show improved performance during these days as it is
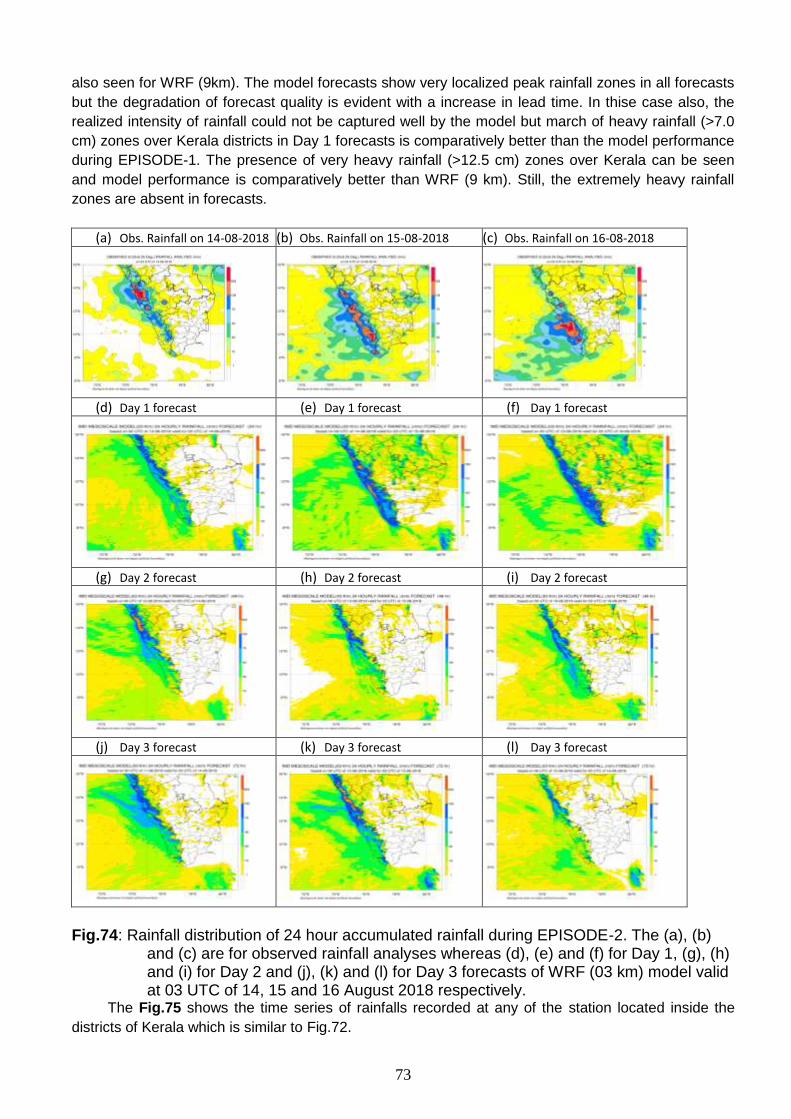
73
also seen for WRF (9km). The model forecasts show very localized peak rainfall zones in all forecasts
but the degradation of forecast quality is evident with a increase in lead time. In thise case also, the
realized intensity of rainfall could not be captured well by the model but march of heavy rainfall (>7.0
cm) zones over Kerala districts in Day 1 forecasts is comparatively better than the model performance
during EPISODE-1. The presence of very heavy rainfall (>12.5 cm) zones over Kerala can be seen
and model performance is comparatively better than WRF (9 km). Still, the extremely heavy rainfall
zones are absent in forecasts.
(a) Obs. Rainfall on 14-08-2018 (b) Obs. Rainfall on 15-08-2018 (c) Obs. Rainfall on 16-08-2018
(d) Day 1 forecast (e) Day 1 forecast (f) Day 1 forecast
(g) Day 2 forecast (h) Day 2 forecast (i) Day 2 forecast
(j) Day 3 forecast (k) Day 3 forecast (l) Day 3 forecast
Fig.74: Rainfall distribution of 24 hour accumulated rainfall during EPISODE-2. The (a), (b) and (c) are for observed rainfall analyses whereas (d), (e) and (f) for Day 1, (g), (h) and (i) for Day 2 and (j), (k) and (l) for Day 3 forecasts of WRF (03 km) model valid at 03 UTC of 14, 15 and 16 August 2018 respectively.
The Fig.75 shows the time series of rainfalls recorded at any of the station located inside the
districts of Kerala which is similar to Fig.72.

74
(i) (ii)
(iii) (iv)
(v) (vi)
(vii) (viii)
(ix) (x)
(xi) (xii)
Fig.75:Time series of daily observed maximum rainfall recorded at a station in the districts of Kerala
along with the WRF (3km) prediction over respective districts by the model in Day 1, Day 2 and Day 3 forecasts during 01 to 19 August 2018.
The Figure 56 illustrates that a large underestimation is evident in predicting the maximum
rainfall for 12 districts of Kerala which experienced during EPISODE-1 whereas a fair amount
overestimation is visible over many districts of Kerala during EPISODE-2 or during other days.
Although, overall performance of the model in capturing district-wise observed maximum rainfall is
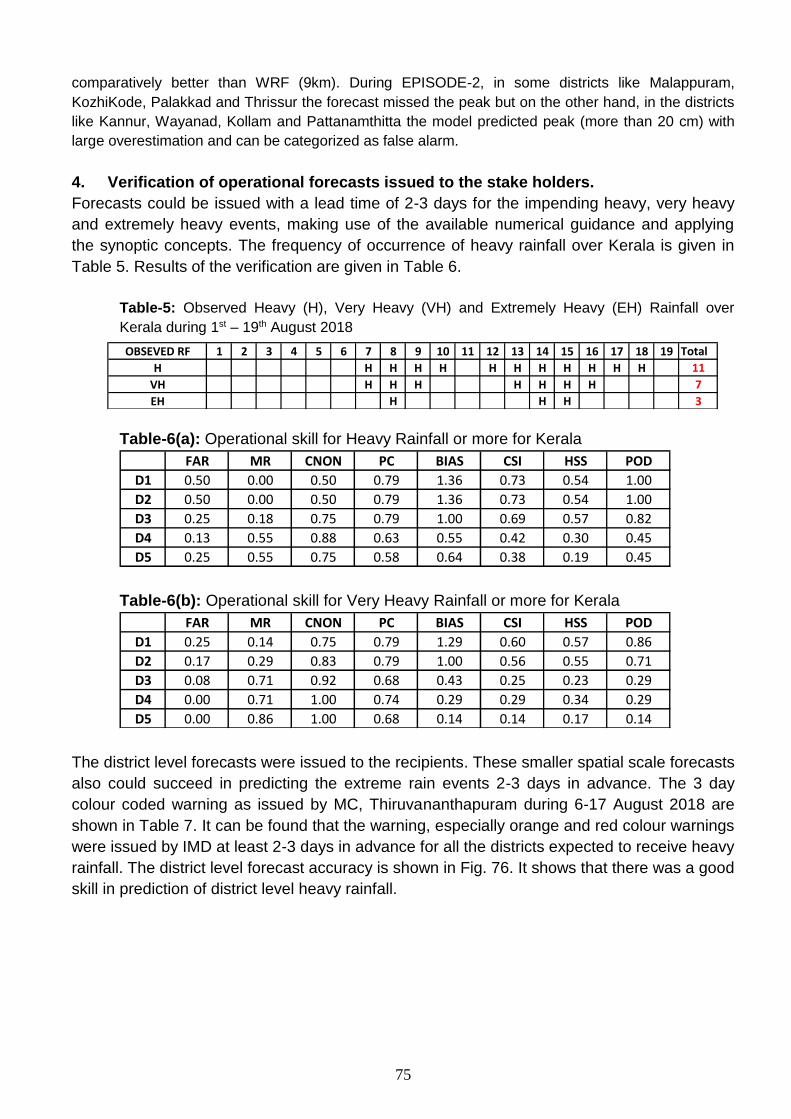
75
comparatively better than WRF (9km). During EPISODE-2, in some districts like Malappuram,
KozhiKode, Palakkad and Thrissur the forecast missed the peak but on the other hand, in the districts
like Kannur, Wayanad, Kollam and Pattanamthitta the model predicted peak (more than 20 cm) with
large overestimation and can be categorized as false alarm.
4. Verification of operational forecasts issued to the stake holders.
Forecasts could be issued with a lead time of 2-3 days for the impending heavy, very heavy
and extremely heavy events, making use of the available numerical guidance and applying
the synoptic concepts. The frequency of occurrence of heavy rainfall over Kerala is given in
Table 5. Results of the verification are given in Table 6.
Table-5: Observed Heavy (H), Very Heavy (VH) and Extremely Heavy (EH) Rainfall over
Kerala during 1st – 19th August 2018
Table-6(a): Operational skill for Heavy Rainfall or more for Kerala
FAR MR CNON PC BIAS CSI HSS POD
D1 0.50 0.00 0.50 0.79 1.36 0.73 0.54 1.00
D2 0.50 0.00 0.50 0.79 1.36 0.73 0.54 1.00
D3 0.25 0.18 0.75 0.79 1.00 0.69 0.57 0.82
D4 0.13 0.55 0.88 0.63 0.55 0.42 0.30 0.45
D5 0.25 0.55 0.75 0.58 0.64 0.38 0.19 0.45
Table-6(b): Operational skill for Very Heavy Rainfall or more for Kerala
FAR MR CNON PC BIAS CSI HSS POD
D1 0.25 0.14 0.75 0.79 1.29 0.60 0.57 0.86
D2 0.17 0.29 0.83 0.79 1.00 0.56 0.55 0.71
D3 0.08 0.71 0.92 0.68 0.43 0.25 0.23 0.29
D4 0.00 0.71 1.00 0.74 0.29 0.29 0.34 0.29
D5 0.00 0.86 1.00 0.68 0.14 0.14 0.17 0.14
The district level forecasts were issued to the recipients. These smaller spatial scale forecasts
also could succeed in predicting the extreme rain events 2-3 days in advance. The 3 day
colour coded warning as issued by MC, Thiruvananthapuram during 6-17 August 2018 are
shown in Table 7. It can be found that the warning, especially orange and red colour warnings
were issued by IMD at least 2-3 days in advance for all the districts expected to receive heavy
rainfall. The district level forecast accuracy is shown in Fig. 76. It shows that there was a good
skill in prediction of district level heavy rainfall.
OBSEVED RF 1 2 3 4 5 6 7 8 9 10 11 12 13 14 15 16 17 18 19 Total
H H H H H H H H H H H H 11
VH H H H H H H H 7
EH H H H 3

76
Table 7. District-wise Heavy Rainfall Warning issued by IMD, Thiruvananthapuram
6 August 2018 Day 1 Day 2 Day 3
Thiruvananthapuram Kollam
Pathanamthitta
Alappuzha
Kottayam
Idukki
Ernakulam
Thrissur
Palakkad
Malappuram
Kozhikode
Waynad
Kannur
Kasaragode
7 August 2018 Day 1 Day 2 Day 3
Thiruvananthapuram
Kollam
Pathanamthitta
Alappuzha
Kottayam
Idukki
Ernakulam
Thrissur
Palakkad
Malappuram
Kozhikode
Waynad
Kannur
Kasaragode
8 August 2018 Day 1 Day 2 Day 3
Thiruvananthapuram
Kollam
Pathanamthitta
Alappuzha
Kottayam
Idukki
Ernakulam
Thrissur
Palakkad
Malappuram

77
Kozhikode
Waynad
Kannur
Kasaragode
9 August 2018 Day 1 Day 2 Day 3
Thiruvananthapuram
Kollam
Pathanamthitta
Alappuzha
Kottayam
Idukki
Ernakulam
Thrissur
Palakkad
Malappuram
Kozhikode
Waynad
Kannur
Kasaragode
10 August 2018 Day 1 Day 2 Day 3
Thiruvananthapuram
Kollam
Pathanamthitta
Alappuzha
Kottayam
Idukki
Ernakulam
Thrissur
Palakkad
Malappuram
Kozhikode
Waynad
Kannur
Kasaragode
11 August 2018 Day 1 Day 2 Day 3
Thiruvananthapuram
Kollam
Pathanamthitta
Alappuzha
Kottayam
Idukki
Ernakulam

78
Thrissur
Palakkad
Malappuram
Kozhikode
Waynad
Kannur
Kasaragode
12 August 2018 Day 1 Day 2 Day 3
Thiruvananthapuram
Kollam
Pathanamthitta
Alappuzha
Kottayam
Idukki
Ernakulam
Thrissur
Palakkad
Malappuram
Kozhikode
Waynad
Kannur
Kasaragode
13 August 2018 Day 1 Day 2 Day 3
Thiruvananthapuram
Kollam
Pathanamthitta
Alappuzha
Kottayam
Idukki
Ernakulam
Thrissur
Palakkad
Malappuram
Kozhikode
Waynad
Kannur
Kasaragode
14 August 2018 Day 1 Day 2 Day 3
Thiruvananthapuram
Kollam
Pathanamthitta
Alappuzha
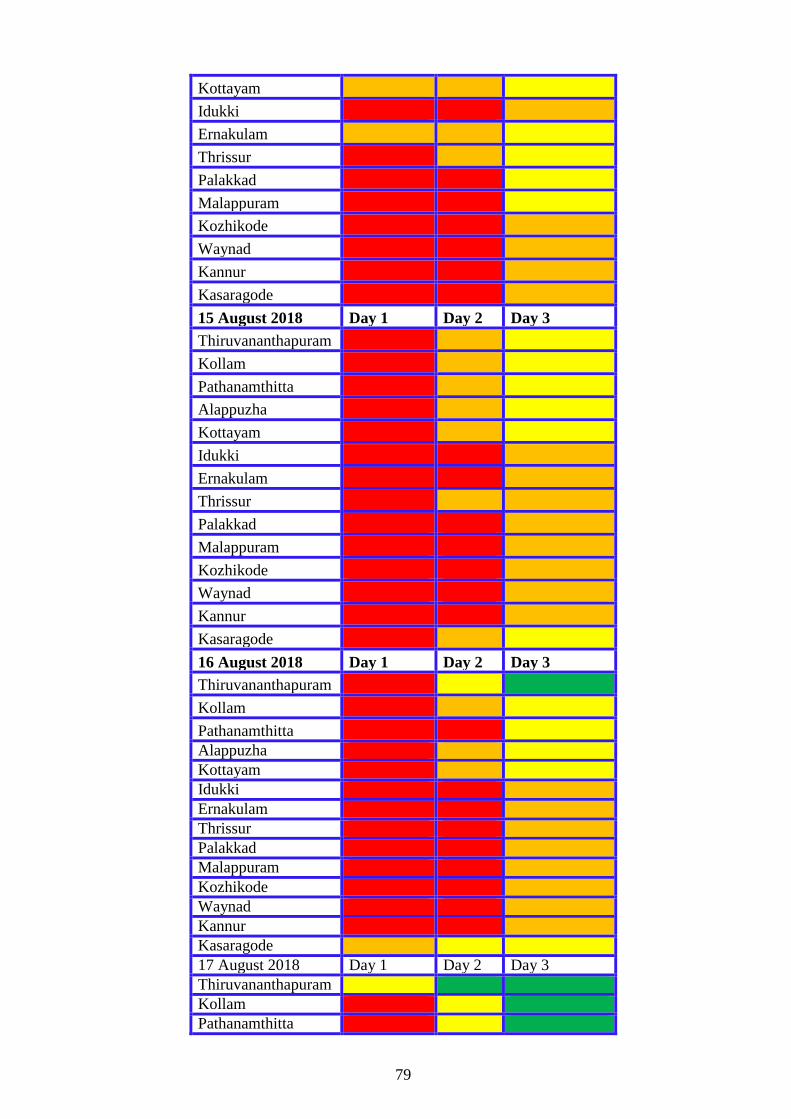
79
Kottayam
Idukki
Ernakulam
Thrissur
Palakkad
Malappuram
Kozhikode
Waynad
Kannur
Kasaragode
15 August 2018 Day 1 Day 2 Day 3
Thiruvananthapuram
Kollam
Pathanamthitta
Alappuzha
Kottayam
Idukki
Ernakulam
Thrissur
Palakkad
Malappuram
Kozhikode
Waynad
Kannur
Kasaragode
16 August 2018 Day 1 Day 2 Day 3
Thiruvananthapuram
Kollam
Pathanamthitta
Alappuzha
Kottayam
Idukki
Ernakulam
Thrissur
Palakkad
Malappuram
Kozhikode
Waynad
Kannur
Kasaragode
17 August 2018 Day 1 Day 2 Day 3
Thiruvananthapuram
Kollam
Pathanamthitta

80
Alappuzha
Kottayam
Idukki
Ernakulam
Thrissur
Palakkad
Malappuram
Kozhikode
Waynad
Kannur
Kasaragode
Fig.76 (a-c). The percentage correct, true skill score (TSS) and Heidke skill score (HSS)
of the district level forecast issued by IMD during 1-18 August 2018
81
5. Warning services
India Meteorological Department (IMD) issued all necessary severe weather warnings
through its office in Thiruvananthapuram. As per the regular practice, warnings are uploaded
in the local website (www.imdtvm.gov.in) every day. District wise rainfall forecast along with
warnings with colour coded alerts are also uploaded and updated thrice daily in the website.
Nowcasts for next 3 hours are also issued through SMS to SDMA, SEOC, District collectors
using Doppler Weather Radar Data. Weather Forecasts for 5 days and outlook for
subsequent two days, which also include heavy rainfall warning and wind warning, are sent
through e-mail to Chief Secretary, Addl. Chief Secretary (Revenue & Disaster Management),
SDMA, Navy, Special Marine enforcement, Print and electronic media.
High level officials of Kerala Government were briefed in a meeting convened by Chief
Minister on 9th August about the strong monsoon conditions with heavy rainfall activity. Also
the Addl. Chief Secretary (Revenue & Disaster Management) was briefed orally over phone
on all occasions. Member Secretary, SDMA was briefed on 10th August. District Collectors
of Kollam and Thiruvananthapuram were briefed on 14th August. Briefings were sent to
media also during this period
➢ Extended range forecasts (issued 2 weeks in advance) issued from Delhi
In a press release issued on 2nd August 2018, it was indicated that the rainfall over ‘extreme
south peninsula’ shall be above normal during 9th – 15th August 2018. In the subsequent
press release issued on 9th August also, the same statement was repeated, along with a
date-wise indication of likely widespread rainfall with isolated heavy rainfall over Kerala
restarting from 13th August. The above press releases had been communicated to the Chief
Secretaries of all the States via E-Mail and also posted on the IMD website.
➢ Short & medium range forecasts (5 days in advance) issued from IMD
Thiruvanthapuram
Orange alerts (prepare for action) were issued w.e.f 6th applicable for 8th August onwards
and Red alert (for action) were issued w.e.f 9th August. Further, for showing the severity of
rainfall intensity expected, heavy (7-11 cm in 24 hrs) to very heavy (12-20 cm in 24 hrs)
rainfall warning for Kerala state was issued w.e.f 10th August for 14th August with Orange
Alert to Idukki and Alappuzha, Red alert to Wayanad district. On 11th heavy to very heavy
rainfall warning extended for 15th August also with orange alert to Idukki and Wayanad
districts.
On 12th August Red alert was issued for Idukki effective from 14th August. On 14th August,
again heavy to very heavy rainfall warning was issued for 14th and 15th with red alert and
orange alerts for most of the districts. On 15th, extremely heavy (>20 cm in 24 hrs) rainfall
warning was issued for Kerala state with red alert to all districts for 16th August and red for 7
districts and orange for the remaining 7 districts for 17th August. It may be noted that the Red
alert is the highest alert for issuing heavy rainfall warning and no other alerting criteria than
this is adopted by IMD.

82
The weather Bulletins issued from Delhi office also carried warnings for Kerala in ‘Orange’
and ‘Red’ colours about 2-3 days in advance of the event, advising the Disaster managers to
be alert and initiate action respectively.
6. Summary & conclusions.
Rainfall characteristics leading to flood:
The quantum of rainfall received over Kerala remained above normal during June
(+15%), July (+18%) and also during 1st – 19th August (+164%).
There were two consecutive active rain spells in June, with above normal rainfall
peaking around 14th 7 20th June, one in July around 20th and two spells in August, viz.,
8th – 10th and 14th – 17th.
The above normal rainfall occurred during June & July had brought the Reservoir
levels to their near full capacity and the first peak spell of rainfall in August, centred
around 8th, caused them to fill up to the maximum capacity.
In the individual district record, monthly rainfall of Idukki district during 2018 (1478.9mm) has crossed the previous record of 138.7 mm in the year 1907. However for the other districts, the monthly totals have not crossed the highest record monthly rainfall.
On 16th, out of 66 stations data received, 15 stations of Kerala reported extremely heavy rainfall of which five were from the district Thrisur, four from Palakkad and three from Idukki. Total 52 stations on that day reported heavy to extremely heavy rainfall showing widespread heavy to extremely heavy rainfall over Kerala. Even previous day i.e. on 15th, out of 68 stations, 55 stations (81%) reported heavy to extremely heavy rainfall over Kerala
Causative physical process for heavy rainfall: The exceptionally heavy rainfall in August
(170% above normal rainfall over Kerala during 1-17 August, 2018) can be attributed to
consecutive formation (within seven days) of the low pressure system on 6th and 13th August
morning. Further both these low pressure systems intensified into Depression and moved
west-northwestwards along the monsoon trough. It led to strengthening of
westerly/southwesterly winds along and off Kerala coasts as the cross equatorial monsoon
flow increased towards the region of low pressure system. These stronger winds interacted
with the Western Ghats leading to orographic uplifting of moist air. This orographic uplifting led
to development of clouds and hence heavy rainfall. Considering the number of low pressure
system days over Indian region during 1-18 August, 2018, it was 10 days.
NWP model performance
The extended range forecast models, very clearly and consistently brought out that the
rainfall activity is most likely to remain above normal during the period 9th – 15th August 2018.
However, the above normal rainfall activity during 2nd – 8th August 2018 was picked up by the
model, only in its week –2 forecast based on 25th July IC. Dependability and utility of the
‘Extended range forecasts’ is to be stressed upon in the planning of water management from
Reservoirs and on crucial decisions including controlled release of water to the rivers /
irrigation canals during the rainy season.
IMDGFS: That there was spatial bias indicating relatively higher rainfall in northern latitudes
along the coast based on initial conditions of 7th, 8th and 9th August. It also underestimated the
intensity for second spell during 14-17 August, 2018.
NCUM : NCUM suggests higher POD and lower FAR as compared to GFS in all lead times. Also, NCUM has an edge over GFS in case of CSI and PSS. It could simulate the two depressions almost realistically about 4-5 days in advance. It suggested indications of an increase in rainfall over Kerala (which was however missed over the western Ghat sections) also were available almost 3-4 days in advance in the precipitation forecast field. Though the

83
model was quite consistent, with the approach of the event, ie, within 48 hours of the forecast range, an under prediction happened.
NEPS: In all the days forecasts the rainfall over Kerala is seen to be exceeding 65.5 mm/d
threshold with a high probability of more than 75% even in day-7 forecast particularly over northern, central and southern Kerala. Also, in day-3 and 5 forecasts the rainfall forecasts are seen to be exceeding 65.5 mm/d threshold with a smaller probability of 25 to 25 %. The Brier Score (BS) for lower rainfall thresholds is better as compared to higher rainfall values. This shows that the model is better predict lower rainfall amounts. For rainfall exceeding 115 and 195 mm/d thresholds the BS is almost identical showing that the model has comparable skill in predicting rainfall in these thresholds. Also, the BS is seen to be decreasing with increasing forecast lead time indicating that the model has better capability of predicting rainfall with increasing time.
GFS (version13.0): It could capture the heavy rainfall in most of the districts in the day-1 forecast and in some district in the day-2 forecast .However, in the day-2 to day-5 forecast, model could capture the average rainfall over the districts.
GFS (Version14.0): For the forecast valid for 03 UTC of 9th August, the model prediction upto 72 hr shows rainfall all along the coast around 50-60 mm/day while the observed rainfall was significantly higher. The spatial plot is consistent with the time series of prediction and observation. However, the localised heavy rainfall of 15 Aug was not very evident in 72 to 120 hr forecast although the model showed enhanced rainfall of around 50-60 mm/day over land areas of the state.
It appears that the lower level moisture convergence during this period was exceptionally high almost 3 to 4 times than its climatology. GFS forecast with 24h lead, is able to capture the moisture convergence and with 48h lead also it has partly captured but with longer lead, the convergence weakened. This could be one possible reason, why the extremely heavy rainfall is missed on some occasions in model forecast with longer lead.
GEFS: The model could capture the second spell of 15-16 Aug reasonably well but find it difficult to capture the intensity on 8 Aug in particular. One of the issues that has come up from the analyses is the model has a positive error over the coastal ocean and negative error over the land particularly during 4 – 9 Aug period. This has been reflected in Bias skill of the model.
WRF (9km): The overall analysis of the time series of district-wise observed maximum rainfall along with corresponding models forecasts reveal that the occurrences of very heavy rainfall events over all districts of Kerala have been missed by the model with a lead time of 48 and 72 hours. In some days, Day 1 forecasts could predict peak rainfall more than 10 cm but the extremely heavy rainfall (> 24.5 cm) events over all districts are always absent in model forecasts. The figures also demonstrated that the model forecasts missed the heavy rainfall events over all districts during EPISODE-1 (8-10 August)and also established rather better performance of the model during EPISODE-2(14-17 August).
WRF(3 km): The rainfall zones with amount execeeding heavy rainfall limit (more than 6.45 cm) is produced in a better way comapred to WRF (9km). The Day 3 forecasts rather predicted comparatively higher rainfall amount although missed the exact observed locations of heavy to very heavy rainfall.
ECMWF: The performance of ECMWF model in 2-3 days lead period seems to be
better than GFS in both the cases of heavy rainfall during August
Operational forecast performance
Extended range forecasts which is utilized for planning of Agriculture as well as water
management purpose, gave indication for the second spell (viz., 14th – 17th August) of
above normal rainfall over Kerala nearly one month in advance, ie., based on its 18th
July initial conditions and also consistently in the subsequent weeks.
Short to medium range forecast: The operational forecasts issued for the sub-
division as a whole and also at District level, gave indications that a spell of high
rainfall is expected during 14th – 17th August 2018, 3-5 days in advance.

84
Warning Services: Orange alerts (prepare for action) were issued w.e.f 6th applicable
for 8th August onwards and Red alert (for action) were issued w.e.f 9th August.
Further, for showing the severity of rainfall intensity expected, heavy (7-11 cm in 24
hrs) to very heavy (12-20 cm in 24 hrs) rainfall warning for Kerala state was issued
w.e.f 10th August for 14th August with Orange Alert to Idukki and Alappuzha, Red alert
to Wayanad district. On 11th heavy to very heavy rainfall warning extended for 15th
August also with orange alert to Idukki and Wayanad districts. On 12th August Red
alert was issued for Idukki effective from 14th August. On 14th August, again heavy to
very heavy rainfall warning was issued for 14th and 15th with red alert and orange
alerts for most of the districts. On 15th, extremely heavy (>20 cm in 24 hrs) rainfall
warning was issued for Kerala state with red alert to all districts for 16th August and
red for 7 districts and orange for the remaining 7 districts for 17th August. It may be
noted that the Red alert is the highest alert for issuing heavy rainfall warning and no
other alerting criteria than this is adopted by IMD.
Rainfall and reservoir management: The continued exceptionally heavy rainfall in August
in the catchment areas had compelled the authorities to resort to heavy releases downstream
into the rivers. The release of water from dams/reservoirs ware delayed and response
actions seems to be inadequate with respect to the district level orange and red
coloured alerts and warnings issued by IMD since 9th August. Significant amount of
water was released from the reservoirs on 15th (for example 390mcm of water from
Idukki) only on the day of occurrence of maximum rainfall. Prior to this the spill from the
reservoirs were very less (50-60 mcm per day), though the current reservoir level
continued to be more that 95%.

85
Annexure-I
Relative operating characteristic (ROC):
This curve shows the hit rate (POD) versus the false alarm rate (POFD). This curve can be used to
answers the question about the ability of the forecast to discriminate between events and non-
events?A percfect curve travels from bottom left to top left of diagram, then across to top right of
diagram. The diagonal line indicates no skill. ROC curve measures the ability of the forecast to
discriminate between two alternative outcomes, thus measuring resolution. It is not sensitive to bias in
the forecast, so says nothing about reliability. A biased forecast may still have good resolution and
produce a good ROC curve, which means that it may be possible to improve the forecast through
calibration. The ROC can thus be considered as a measure of potential usefulness.