september 2009 debt management - gao.gov management. treasury inflation ... figure 2: marketable...
TRANSCRIPT

GAO United States Government Accountability Office
Report to the Secretary of the Treasury
DEBT MANAGEMENT
Treasury Inflation Protected Securities Should Play a Heightened Role in Addressing Debt Management Challenges
September 2009
GAO-09-932

What GAO Found
United States Government Accountability Office
Why GAO Did This Study
HighlightsAccountability Integrity Reliability
September 2009 DEBT MANAGEMENT
Treasury Inflation Protected Securities Should Play a Heightened Role in Addressing Debt Management Challenges Highlights of GAO-09-932, a report to the
Secretary of the Treasury
The 2008 financial market crisis and the economic recession led to a rapid and substantial increase in federal debt. This report, part of a line of work on debt management, was conducted under the Comptroller General’s authority. It describes current debt management challenges and examines the role of a program that could benefit Treasury—Treasury Inflation Protected Securities (TIPS). GAO analyzed market data and interviewed experts as well as the two largest holders of Treasury securities in each of six sectors.
What GAO Recommends
GAO recommends that, in the context of projected sustained increases in federal debt, the Secretary of the Treasury take steps to increase TIPS liquidity and reduce their cost to Treasury: increase issuance, issue longer-dated maturities, and conduct more frequent auctions. Also, the Secretary should continually review the appropriate composition of the TIPS program and consider: the impact of Treasury’s public statements and TIPS issuance on TIPS liquidity, how different analytical perspectives are valuable for evaluating cost, how TIPS can diversify Treasury’s investor base, and how TIPS impact the cost of nominal securities. Treasury took note of our findings, conclusions, and recommendations and said they were consistent with their commitment to increasing TIPS issuance.
In January 1997, Treasury introduced an inflation-indexed security—TIPS. Treasury’s stated objectives were to both raise the national savings rate and to reduce the federal government’s cost of borrowing. TIPS offer inflation protection to investors who are willing to pay a premium for this protection in the form of a lower interest rate. In a functioning TIPS market, the difference between the interest rate on nominal Treasury securities and the interest rate on TIPS is expected to be approximately equal to the expected inflation rate. Federal government actions in response to both the financial market crisis and the economic recession have added significantly to Treasury’s borrowing needs. Since the onset of the recession in December 2007, Treasury has borrowed more than $2.3 trillion, largely by issuing short-term nominal debt, which significantly changed the composition of Treasury’s debt portfolio. The challenges presented by increasing debt and the change in its composition take place in the context of the medium and longer term fiscal outlook and will not recede with the return of financial market stability and economic growth. The Congressional Budget Office (CBO) projects that, absent changes in current policy, debt held by the public will double in 5 years (from 2008 to 2013) and almost triple in 11 years (from 2008 to 2019)—reaching 82 percent of GDP. In order to meet these challenges Treasury needs to diversify its funding sources and lengthen the term-to-maturity of its debt portfolio. TIPS can contribute to this effort. Treasury’s TIPS program has had varying degrees of liquidity (the ease with which investors can trade the security) since its inception. The major institutional investors that GAO interviewed perceived Treasury’s commitment to the TIPS program as having wavered in recent years, decreasing the liquidity of TIPS in the market. Investors demand a premium for holding less-liquid TIPS, which increases Treasury’s borrowing costs. TIPS offer benefits to Treasury and measuring the cost against which to weigh these benefits requires both forward-looking and after-the-fact analysis. A more robust TIPS program could benefit Treasury by diversifying and expanding its funding sources and reducing the cost of nominal securities. Governments are well suited to bear inflation risk because periods of inflation are often associated with increased revenues. TIPS auctions also help provide a measure of market inflation expectations. On July 1, 2009, GAO briefed Treasury’s Office of Debt Management on the findings from our analysis and interviews with major institutional investors. Treasury later posed questions about ways to improve the TIPS program to the Primary Dealers and the Treasury Borrowing Advisory Committee (TBAC). At the August 2009 TBAC meeting, members discussed TIPS. Following the meeting, Treasury’s Deputy Assistant Secretary for Federal Finance reaffirmed Treasury’s commitment to TIPS and announced plans to gradually increase issuance of TIPS.
View GAO-09-932 or key components. For more information, contact Susan J. Irving at (202) 512-6806 or [email protected].

Page i GAO-09-932
Contents
Letter 1
Background 1 Scope and Methodology 2 Size and Composition of Treasury’s Debt Profile Has Changed
Substantially 4 Treasury’s TIPS Program Has Had Varying Degrees of Liquidity
Since Inception and Major Institutional Investors Have Expressed Concern about Treasury’s Commitment to the Program 12
TIPS Program Offers Benefits to Treasury, and Measuring Its Cost Requires both Forward-Looking and After-the-Fact Analysis 17
Concluding Observations 22 Recommendations 23 Agency Comments 23
Appendix I Treasury Inflation Protected Securities 25
Overview 25 Principal 25 Interest Payments 25 Taxation 26 Auction Schedule 26 Purchasing TIPS 27
Appendix II The Cost of Treasury Inflation Protected Securities
Compared to Nominal Securities 28
Disentangling the Drivers of Recent Shifts in the Nominal-TIPS Yield Differential (Breakeven Inflation Rate) 29
Appendix III GAO Contact and Staff Acknowledgments 31
Figures
Figure 1: Changes in Outstanding Marketable Treasury Securities from December 31, 2007, to June 30, 2009 (Total Outstanding as of June 30, 2009—$6.6 trillion) 5
Figure 2: Marketable Securities by Year of Maturity, as of June 30, 2009 (Total Outstanding—$6.6 trillion) 6
Figure 3: Net Interest Costs and 10-Year Treasury Rates 7
Debt Management

Figure 4: Debt Held by the Public and Percentage of GDP, 2001 through 2019 9
Figure 5: Debt Held by the Public as a Share of GDP under Two Different Fiscal Policy Simulations 10
Figure 6: Treasury’s Statements of Support for TIPS, Gross TIPS Issuance, and the TIPS Program’s Relative Costs 13
Figure 7: Bid-to-Cover Ratios for Selected Treasury Securities, July 2003 to July 2009 16
Figure 8: Inflation-Protected Mutual Funds and Assets under Management, December 2002 to May 2009 19
List of Abbreviations
CBO Congressional Budget Office CPI-U Consumer Price Index for All Urban Consumers GDP gross domestic product ODM Office of Debt Management OMB Office of Management and Budget SIFMA Securities Industry and Financial Markets Association TARP Troubled Asset Relief Program TBAC Treasury Borrowing Advisory Committee TIPS Treasury Inflation Protected Securities
This is a work of the U.S. government and is not subject to copyright protection in the United States. The published product may be reproduced and distributed in its entirety without further permission from GAO. However, because this work may contain copyrighted images or other material, permission from the copyright holder may be necessary if you wish to reproduce this material separately.
Page ii GAO-09-932 Debt Management
Page 1 GAO-09-932
United States Government Accountability Office
Washington, DC 20548
September 29, 2009
The Honorable Timothy F. Geithner Secretary of the Treasury
Dear Mr. Secretary:
Between December 2007 and the end of June 2009, the Department of the Treasury borrowed more than $2.3 trillion to finance federal government actions related to both the financial market crisis and the economic recession in addition to regular government financing needs. This rapid and substantial increase in federal debt takes place in the context of the medium- and long-term fiscal outlook that will present Treasury with continued financing challenges long after the return of financial stability and economic growth. GAO has begun a line of work related to Treasury’s management of its growing debt portfolio. As part of this ongoing work, we will continue to provide updates and make recommendations as appropriate.
In this first report, conducted under the Comptroller General’s authority, we describe Treasury’s borrowing challenges and analyze one Treasury program that has the potential to provide benefits to both Treasury and investors—Treasury Inflation Protected Securities (TIPS). We address the following questions:
• What are the debt management challenges associated with planning for future borrowing needs given the long-term fiscal outlook and Treasury’s increased borrowing due to economic and financial sector stress?
• What role, if any, should TIPS play in Treasury’s borrowing program?
Congress has assigned to Treasury the responsibility of borrowing the funds necessary to finance the gap between cash-in and cash-out, subject to a statutory limit. Treasury’s primary debt management goal is to finance the government’s borrowing needs at the lowest cost over time. Issuing debt predictably through regularly scheduled auctions lowers borrowing costs because investors and dealers value liquidity and certainty of supply. Treasury responds to increases in borrowing needs in a traditional manner, by first increasing the issuance size of existing securities; then, increasing the frequency of issuances; and finally, introducing new securities to its auction calendar as necessary.
Background
Debt Management

Treasury normally auctions nominal marketable securities that range in maturity from 4 weeks to 30 years and sells them at auction on a pre-announced schedule. Treasury also issues cash management bills that are not part of the regular schedule to meet immediate cash needs. Treasury securities are widely viewed as the premium risk-free asset and are actively used by investors, traders, and foreign central banks for hedging, liquidity, and reserve purposes. The outstanding mix of U.S. Treasury securities can have a significant influence on the federal government’s interest payments. Longer term securities typically carry higher interest rates (which translate to increased cost to the government), primarily due to concerns about future inflation. However, these longer term securities offer the government the certainty of fixing the interest payments over a longer period and reduce the amount of debt that Treasury needs to refinance in the short term. In contrast, shorter term securities generally carry lower interest rates but add volatility to the government’s interest costs and require Treasury to conduct more frequent auctions to refinance maturing debt.
During the 1980s and 1990s, a number of countries introduced inflation-indexed securities to their debt offerings, including the United Kingdom, France, and the United States.1 In January 1997, Treasury introduced its own inflation-indexed securities, TIPS, as part of its debt program. At the time, Treasury’s stated objectives for introducing TIPS were both to raise the national savings rate and to reduce the federal government’s cost of borrowing. TIPS offer inflation protection to investors who are willing to pay a premium for this protection in the form of a lower interest rate. In a functioning TIPS market, the difference between the interest rate on nominal Treasury securities and the interest rate on TIPS should approximately equal the expected inflation rate. Treasury currently issues 5-, 10-, and 20-year TIPS. In the past, Treasury issued 30-year TIPS, but discontinued them in 2001. See appendix I for additional details on the structure of TIPS.
To identify the debt management challenges associated with Treasury’s increased borrowing, we analyzed the scale, timing, term to maturity, and composition of Treasury’s borrowing since the start of the economic
Scope and Methodology
1As of the end of 2008, inflation-indexed securities made up 24 percent of the United Kingdom’s total outstanding debt portfolio, 15 percent of France’s outstanding debt portfolio, and 10 percent of the United States’ outstanding debt portfolio.
Page 2 GAO-09-932 Debt Management

recession, using data and information obtained from the Department of the Treasury and the Federal Reserve. We also interviewed market experts, Treasury, and Federal Reserve staff and officials.
To examine what role TIPS should play in Treasury’s debt portfolio and the potential for the TIPS program to help address Treasury’s debt management challenges, we conducted literature reviews on the costs and benefits of inflation-indexed securities and examined research by Federal Reserve economists, market experts, academic sources, and the Department of the Treasury, including an internal review of the TIPS program done by the Office of Debt Management (ODM). We also conducted 12 structured interviews in June 2009 with the two largest holders of Treasury securities in each of the following sectors: mutual funds; commercial banks; life insurance companies; property and casualty insurance companies; state and local pension funds; and private pension funds. The major institutional investors we interviewed held at least $351 billion in Treasury securities. Of their Treasury holdings, $99.4 billion were TIPS, which was 19 percent of total outstanding TIPS as of March 31, 2009. These interviews covered the institution’s holdings of Treasury securities, demand for TIPS, changes that could be made to the TIPS program, perceived risks to investors in Treasury markets, and Treasury’s sources for information on demand for Treasury securities. On July 1, 2009, we briefed Treasury’s ODM on the findings from the structured interviews, which are discussed and expanded upon in this report.2
Where possible and appropriate, we corroborated the results of our data analyses and interviews with other sources. On the basis of our assessment we believe that the data are reliable for the purposes of our review. We conducted our review from June 2009 through August 2009 in accordance with generally accepted government auditing standards. Those standards require that we plan and perform the audit to obtain sufficient, appropriate evidence to provide a reasonable basis for our findings and conclusions based on our audit objectives. We believe that the evidence obtained provides a reasonable basis for our findings and conclusions based on our audit objectives.
2ODM is responsible for providing the Assistant Secretary for Financial Markets with advice and analysis on matters related to the Treasury’s debt management policy, the issuance of Treasury and federally related securities, and financial markets.
Page 3 GAO-09-932 Debt Management

Treasury faces two near-term challenges in managing the growing government debt: the rise in total outstanding debt and the shortening of the average maturity of the debt profile.3 Treasury’s total outstanding debt increased by $2.3 trillion (25 percent increase in federal debt) since the onset of the economic recession in December 2007.4 In actions Treasury described as in accordance with normal operating procedures, Treasury increased short-term borrowing to address its massive and immediate borrowing needs. As a result, the average maturity of Treasury’s debt decreased as the percentage of marketable debt maturing within 1 year increased from 35.6 percent to 41.1 percent between September 2007 and June 2009. At the end of June 2009, Treasury’s outstanding marketable securities stood at $6.6 trillion, an increase of almost $2.1 trillion from December 2007.5 The largest increase in outstanding marketable Treasury securities was in short-term debt. Treasury bill and cash management bill issuance increased by a combined $1 trillion between December 2007 and June 2009.6 The amount of Treasury notes issued also increased significantly over this period, adding $929.3 billion to the amount of notes outstanding. Almost half of the increase was comprised of shorter-term notes (with 2-year and 5-year maturities). The monthly issuance of 2-year notes alone has almost doubled in the last 2 years. Figure 1 shows the relative size of the increases in different categories of securities. The smallest increase was in TIPS which increased by $60.6 billion.
Size and Composition of Treasury’s Debt Profile Has Changed Substantially
3Federal debt held by the public is the value of all federal securities sold to the public that are still outstanding. See GAO, Federal Debt: Answers to Frequently Asked Questions: An
Update, GAO-04-485SP (Washington, D.C.: August 12, 2004).
4Treasury issues two major types of debt securities to the public: marketable and nonmarketable securities. Marketable securities, which consist of Treasury bills, notes, and bonds and can be resold by whoever owns them while nonmarketable securities, such as savings securities and special securities for state and local governments, cannot be resold.
5Treasury data states that almost half of the $6.6 trillion in marketable securities is held by foreign investors, as of May 2009.
6Treasury’s increase in issuance of cash management bills is largely due to establishment of the Supplementary Financing Program (SFP). The SFP was created to provide cash for Federal Reserve lending and liquidity draining initiatives in response to the financial market crisis. According to GAO’s audit of the Bureau of the Public Debt for Fiscal Years 2008 and 2007, $300 billion in cash management bills were issued in September 2008 under the Supplementary Financing Program initiated by Treasury. See GAO, Financial Audit:
Bureau of the Public Debt’s Fiscal Years 2008 and 2007 Schedules of Federal Debt, GAO-09-44 (Washington, D.C.: November 7, 2008).
Page 4 GAO-09-932 Debt Management

Figure 1: Changes in Outstanding Marketable Treasury Securities from December 31, 2007, to June 30, 2009 (Total Outstanding as of June 30, 2009—$6.6 trillion)
0
500
1,000
1,500
2,000
2,500
3,000
3,500
4,000
Increase in marketable Treasury securities from Dec. 31, 2007 to June 30, 2009
Outstanding marketable Treasury securities as of Dec. 31, 2007
Cash management billsTreasury Inflation Protected SecuritiesTreasury bondsTreasury billsTreasury notes
Dollars (in billions)
Borrowings, by Marketable Treasury Securities
Source: GAO analysis of Treasury monthly statement of public debt data.
$2,488.5
$1,003.9$558.5 $471.7 $440
$929.3
$562.6
$85.1$60.6
$440
$3,417.8Total =
$1,566.5
$643.6$532.3
Cas
h
Trea
sury
Trea
sury
Trea
sury
Trea
sury
man
agem
ent
Infla
tion
bills
Prot
ecte
dSe
curit
ies
bond
s
bills
note
s
Note: Does not include $11.9 billion in marketable securities outstanding for the Federal Financing Bank. Treasury bills and cash management bills are short-term securities that mature in 1 year or less from their issue date. Treasury notes mature in more than 1 year, but not more than 10 years from their issue date. Treasury bonds mature in more than 10 years from their issue date. Treasury bills, notes, and bonds are nominal securities, meaning they are not adjusted for inflation. TIPS are adjusted for inflation and have maturities of 5, 10, or 20 years.
Treasury has raised significant amounts of cash since the onset of the economic recession in December 2007 largely by adhering to its regular and predictable debt issuance schedule, which is meant to ensure the lowest borrowing costs over time. However, Treasury has also turned to issuing cash management bills, which are announced shortly before auction to fulfill Treasury’s immediate cash needs. After the financial market crisis hit in fall of 2008, Treasury raised an unprecedented $1.1 trillion in under 18 weeks largely by issuing cash management bills. Treasury was able to finance such an amount due in part to outsized demand among global investors for a safe and liquid financial instrument in the midst of the contraction in global economic activity.
Page 5 GAO-09-932 Debt Management

Figure 2: Marketable Securities by Year of Maturity, as of June 30, 2009 (Total Outstanding—$6.6 trillion)
0
500
1,000
1,500
2,000
2,500
3,000
3,500
2031–2039
2021–2030
2016–2020
2011–2015
2009–2010
Dollars (in billions)
(Percentage of totaloutstanding securities thatmature during time frame)
Year of maturity
Source: GAO analysis of Treasury monthly statement of public debt data.
(46%)
(32%)
(13%)
(6%)(3%)
$3,041
$2,083
$864
$424
$188
Note: Does not include $11.9 billion in marketable securities outstanding for the Federal Financing Bank, $43 million in matured notes, and $45 million in matured bonds.
As shown in figure 2, 78 percent (or about $5.1 trillion) of the outstanding marketable Treasuries mature by 2015 and will need to be rolled over (or refinanced)—potentially at higher interest rates. Because short-term rates have been reduced sharply by the decision of the Federal Reserve to set its federal funds target near zero, Treasury’s borrowing costs decreased even though debt levels increased. (See figure 3.) However, projections from both the Congressional Budget Office (CBO) and Office of Management and Budget (OMB) assume higher interest rates and higher interest payments. CBO’s analysis of the President’s Budgetary Proposals for Fiscal Year 2010 assumed that interest rates on 91-day Treasury bills would increase from 0.3 percent in 2009 to 4.7 percent in 2015 and that interest on 10-year Treasury notes would increase from 2.9 percent to 5.4 percent over the same period. CBO’s analysis of the President’s Budgetary Proposals for Fiscal Year 2010 shows—absent changes in policy—interest
Page 6 GAO-09-932 Debt Management

payments on federal debt more than tripling—to almost $800 billion—by 2019.7 (See figure 3.)
Figure 3: Net Interest Costs and 10-Year Treasury Rates
0
100
200
300
400
500
600
700
800
900
Estimated net interest outlays
Actual net interest outlays
20192018201720162015201420132012201120102009200820072006200520042003200220012000
Sources: Congressional Budget Office data from their analysis of the President’s budget proposal of actual and estimatednet interest costs and estimated interest rates and Federal Reserve data of actual interest rates.
Dollars (in billions)
Fiscal year
0
1
2
3
4
5
6
7
10-year Treasury nominal interest rate
Percent
Note: Net interest outlays is a cash measure that is defined as interest payments on gross debt less interest received on loans and advances, and is affected by the volume of net debt on issue and by interest rates.
Treasury’s Director of ODM and the ODM staff whom we interviewed view the current maturity profile as reasonable given economic conditions and the massive increase in borrowing that was necessary in a compressed time period. They underscored the importance of making any changes to the current debt portfolio in a gradual manner to ensure that there will be enough demand at a reasonable price and told us that they plan to
7See Congressional Budget Office, An Analysis of the President’s Budgetary Proposals for
Fiscal Year 2010 (Washington, D.C.: June 2009).
Page 7 GAO-09-932 Debt Management

gradually transition the portfolio into longer term debt.8 They also told us that, given the need to be flexible operationally, Treasury’s debt management horizon is shorter than the horizon used by CBO and OMB in budget projections and that they are confident about their ability to finance the projected budget deficits for 2010 and 2011.
Fiscal Outlook Will Present Continued Debt Management Challenges
As noted, the federal government’s policy response to the financial market crisis and the economic recession created a significant increase in both debt and debt management challenges. These will not recede when stability returns to financial markets and economic growth resumes. CBO projects that, absent changes in current policy, the debt held by the public will double in 5 years (from 2008 to 2013) and almost triple in 11 years (from 2008 to 2019). (See figure 4.) CBO projects that debt held by the public will increase from 41 percent of gross domestic product (GDP) in fiscal year 2008 to 71 percent by the end of fiscal year 2013.
8As of August 2009, the average maturity of issuance on the current auction calendar now exceeds the average maturity of marketable debt outstanding.
Page 8 GAO-09-932 Debt Management

Figure 4: Debt Held by the Public and Percentage of GDP, 2001 through 2019
0
2
4
6
8
10
12
14
16
18
Projected debt held by the public
Actual debt held by the public
2019201820172016201520142013201220112010200920082007200620052004200320022001
Source: Congressional Budget Office data from their analysis of the President’s budget proposal.
Dollars (in trillions)
8.0
9.410.3
11.111.8
12.613.5
14.4 15.4 15.9 17.1
3.3
5.85.04.84.64.33.9
3.5
Fiscal year
0
10
20
30
40
50
60
70
80
90
Debt held by the public (as a percentage of gross domestic product)
Percentage of GDP
57
6569 70 71 73
75 77 79 79 82
33
41373738373634
The actions that Treasury has taken to increase borrowing in response to the economic recession and financial market crisis take place within the context of the already serious longer term fiscal condition of the federal government. While the administration and Congress have been understandably focused on addressing problems with financial markets and responding to the economic recession, the government will need to apply the same level of intensity to the nation’s long-term fiscal challenge. Both our long-term simulations and CBO’s show growing deficits and debt, underscoring that the long-term fiscal outlook is unsustainable. Under our alternative simulation, by 2025 debt held by the public would exceed the historical high of 109 percent of GDP, reached in the aftermath of World War II.9 (See figure 5.)
9See GAO, The Nation’s Long-Term Fiscal Outlook March 2009 Update, GAO-09-405SP (Washington, D.C.: April 30, 2009) and CBO, The Long-Term Budget Outlook (Washington, D.C.: June 2009).
Page 9 GAO-09-932 Debt Management

Figure 5: Debt Held by the Public as a Share of GDP under Two Different Fiscal Policy Simulations
Percentage of GDP
Historical high109 percent in 1946
Fiscal year
Source: GAO’s March 2009 analysis based on the Trustees’ assumptions for Social Security and Medicare. (See GAO,The Nation’s Long-Term Fiscal Outlook March 2009 Update, GAO-09-405SP (Washington, D.C.: April 30, 2009).
0
50
100
150
200
250
300
350
400
Alternative
Baseline extended
205020492048204720462045204420432042204120402039203820372036203520342033203220312030202920282027202620252024202320222021202020192018201720162015201420132012201120102009200820072006200520042003200220012000 20502005 2025202020152010 2030 2045204020352000
The deterioration in the short-term and long-term budget outlooks, combined with expenditures associated with the Troubled Asset Relief Program (TARP) and Recovery Act spending, will likely continue to stress the existing auction schedule. Treasury has already begun to respond by adjusting the auction schedule so that they can conduct more auctions of increasingly larger amounts, while simultaneously minimizing borrowing costs over the long term.
According to the major institutional investors that we interviewed, the best days of the week for Treasury to conduct auctions are Tuesday, Wednesday, and Thursday. However, Treasury is facing an increasingly crowded borrowing schedule, often with multiple auctions in a single day. For example, during the week of July 27, 2009, Treasury held eight auctions, issuing close to $272 billion in securities in one week and holding multiple auctions on two of those days. In addition, Treasury has been forced to hold and plan auctions on days that it has tried to avoid in the past, such as days of major Federal Reserve announcements. Holding auctions on these days increases uncertainty for auction participants.
Page 10 GAO-09-932 Debt Management

Market experts believe that the large amount of the debt that must be rolled over in the next few years is cause for concern and agree with Treasury that it needs to increase the average maturity of its debt portfolio and diversify its funding sources. Large and growing borrowing needs put a premium on better understanding current and future demand for Treasury securities. Two securities that Treasury can currently use to reduce the amount of securities that are rolling over in the next 10 years are 30-year nominal bonds and 20-year TIPS.10 Treasury has already increased the frequency of the issuance of 30-year bonds; first it reopened the 30-year bond in February 2009 and then added a second reopening in May 2009, effectively issuing the 30-year bond on a monthly basis. Treasury should continue to consider options to lengthen its maturity profile to mitigate the risks mentioned above. Longer-dated TIPS offer one option. The 30-year TIPS was discontinued along with the 30-year nominal bond in October 2001, but only the 30-year nominal bond was reintroduced. The 20-year TIPS, is currently issued only twice a year, but its record as a low-cost funding source has been mixed in part due to a lack of liquidity as explained in the next section.
10At the August 2009 Treasury Borrowing Advisory Committee (TBAC) meeting, Treasury asked TBAC members to consider whether 30-year TIPS should replace 20-year TIPS. 30-year TIPS would also serve to reduce the amount of securities that Treasury needs to roll over in the next 10 years.
Page 11 GAO-09-932 Debt Management

Treasury’s TIPS program has had varying degrees of liquidity since its inception in 1997. Liquidity is a measure of the ease with which investors can trade a security. Liquidity is important to Treasury because liquid securities can be auctioned at lower rates, and thus cost Treasury less money.
The difference between the breakeven inflation rate—the interest rate on a nominal security minus the interest rate on a comparable-maturity TIPS—and a measure of expected inflation can be used to evaluate the ex-ante cost of nominal securities relative to TIPS.11 When this difference is positive, nominal securities cost more than TIPS; when it is negative, TIPS cost more than nominal securities; and when the difference is zero, the cost is approximately equivalent. Two primary factors affect this difference. The first is the illiquidity premium associated with TIPS, which raises the interest rate on TIPS relative to nominal securities. The second is the inflation risk premium, which is the insurance value that investors attach to TIPS’ protection against inflation. The inflation risk premium reduces the interest rate on TIPS relative to the rate on nominal securities. To the degree that the inflation risk premium and illiquidity premium are roughly equal, nominal Treasury securities and TIPS of the same maturity would cost about the same, on an ex-ante (or before the fact) basis. For a more detailed discussion on calculating the cost of TIPS compared to nominal securities see appendix II.
Treasury’s TIPS Program Has Had Varying Degrees of Liquidity Since Inception and Major Institutional Investors Have Expressed Concern about Treasury’s Commitment to the Program
In 1997, when the TIPS program was launched, the initial auctions were well-received by investors, with robust bid-to-cover ratios.12 As seen in figure 6, the average 10-year breakeven rate minus expected inflation in 1997 was the largest seen to date on the 10-year TIPS. Thereafter, from 1998 until about 2004, TIPS liquidity remained relatively poor and the gross amount issued by Treasury decreased from 1998 to 2000.
11We use the real-time estimate of expected inflation from the Survey of Professional Forecasters maintained by the Federal Reserve Bank of Philadelphia.
12The bid-to-cover ratio is the ratio between the amounts tendered over the amounts accepted at auction.
Page 12 GAO-09-932 Debt Management

Figure 6: Treasury’s Statements of Support for TIPS, Gross TIPS Issuance, and the TIPS Program’s Relative Costs
0
10
20
30
40
50
60
70
80
90
Year-to-date TIPS issuance
Source: GAO analysis of Treasury data on TIPS issuances and Federal Reserve Bank of Philadelphia's Survey ofProfessional Forecasters Inflation Expectations.
Dollars (in billions)
Year
-2.0
-1.5
-1.0
-0.5
0.0
0.5
Average 10-year breakeven rate minus expected inflation
May-09200820072006200520042003200220012000199919981997
Percent
Treasury speeches andexpansion of TIPSb
$33 $34 $31 $16 $16 $23 $26 $63 $69 $77 $65 $62 $31
Treasury speeches andexpansion of TIPSc
Treasury speechesand expansion
of TIPSa
aTreasury official announcement on expansion of TIPS on May 1, 2002. Treasury speech bolstering TIPS program on June 3, 2002, October 17, 2002, November 8, 2002, and December 5, 2002. bTreasury official announcement on expansion of TIPS on April 30, 2003. Treasury speech bolstering TIPS program on May 20, 2003 and June 26, 2003. cTreasury official announcement on expansion of TIPS on May 4, 2004. Treasury speech bolstering TIPS program on April 22, 2004, June 16, 2004, and July 8, 2004.
Starting in 2002, Treasury sought input from market participants on how to improve the TIPS program and made a number of changes to the program. Specifically, Treasury increased the amount issued at auction and increased the frequency and range of TIPS offerings. In addition, Treasury made a number of speeches and official statements to reaffirm its commitment to the program and to indicate its dedication to improving TIPS liquidity. Some of the major institutional investors we interviewed observed that these efforts improved investor confidence in the program and ultimately improved the liquidity of TIPS. As seen in figure 6, from 2004 to 2007, the difference between the average 10-year breakeven rate and inflation expectations was positive or near zero, meaning the TIPS illiquidity premium was approximately equal to the inflation risk premium
Page 13 GAO-09-932 Debt Management

of nominal securities and indicating that TIPS liquidity improved over that period.
More recently, from 2006 to 2008, Treasury reduced the gross amount of TIPS issuance by 19 percent. The major institutional investors that we interviewed also perceived that during this time, Treasury’s commitment to the TIPS program began to wane, communicating uncertainty about the program’s future. These investors believed that the uncertainty surrounding TIPS hurt TIPS liquidity in the secondary market.
In the period following the 2008 financial market crisis, TIPS liquidity further deteriorated as demand for the more liquid nominal Treasury securities soared. The illiquidity premium, or the extra compensation that Treasury has to pay investors to hold TIPS, may have increased during the financial crisis due to the increased difficulty of selling holdings of TIPS in the secondary market during that time. Major institutional investors whom we interviewed reported uncertainty about Treasury’s commitment to the TIPS program and suggested increased issuance and positive signaling to improve the liquidity of TIPS, thereby reducing the cost of the program to Treasury.
Major Institutional Investors Report Uncertainty about Treasury’s Commitment to TIPS and Suggest Increased Issuance and Positive Signaling to Improve the Liquidity of TIPS
Interviews with major institutional investors revealed uncertainty about Treasury’s commitment to TIPS. The investors pointed to the 19 percent decline in TIPS gross issuance amounts, along with Treasury’s tepid signaling on TIPS, as fueling speculation about the future of the program.13 (See figure 6.) As of June 2009, TIPS made up about 8 percent of total outstanding marketable Treasury securities, compared to 10 percent in September 2007 and 2008.
As we reported to Treasury, on July 1, 2009, there was agreement among the major institutional investors whom we interviewed that Treasury could improve liquidity in the TIPS market by signaling to the market its commitment to the program and by increasing issuance. Investors suggested that Treasury repeat efforts to promote the TIPS program as
13Gross issuance is the total amount issued in a year (whether it is obtaining new money or refinancing maturing debt). As we have shown, it has decreased since 2006. The net change in total TIPS outstanding from year to year increased during this time, but at a decreasing rate (reflecting the decrease in gross issuance). In commenting on this report, Treasury’s Director of ODM and ODM staff said that they view this as a stabilization of the TIPS program—done to permit a review of the program after its first decade.
Page 14 GAO-09-932 Debt Management

they did from 2002 to 2004. Investors told us that increasing the issuance amount at auction or increasing the frequency of auctions would have a similar signaling effect and the additional supply would also improve liquidity in the secondary market. Most of the investors replied that they planned to purchase TIPS in the next year; interest in the 10-year TIPS was mentioned most frequently. Some investors stated that their organizations would be more likely to participate in the TIPS market if the supply of securities was greater and auctions were conducted more frequently. Some investors reported wanting to make larger TIPS purchases than was possible in the secondary market and also that the long wait between TIPS auctions sometimes did not align with their investment needs. Currently, there is a 6-month wait between auctions for 5-year and 20-year TIPS and a 3-month wait between auctions for 10-year TIPS.
At our briefing, Treasury’s Director of ODM and ODM staff told us that if it were to expand the TIPS program, Treasury would face increased exposure to auction risk due to the current concentration of bidders at auction and the resulting possibility that there may not be enough bidders to cover the auctioned amount. But Treasury already has policies in place to ensure that potentially undersubscribed auctions are sufficiently covered. In addition to these policies, investors we interviewed told us that a more formalized line of communication between Treasury and end-users could enable Treasury to better gauge market demand. We are in the process of surveying investors on what actions Treasury could take to increase participation in TIPS auctions and improve communication with end-users of Treasury securities.
One indicator used to measure demand at a Treasury auction is the bid-to-cover ratio, which compares the dollars bid to the dollars accepted at a Treasury auction. If the ratio is high, it indicates strong demand for a particular Treasury security at auction. There is historical evidence that auctions in the TIPS market have bid-to-cover ratios only slightly lower than the more robust market for nominal securities. As shown in figure 7, for most of the period prior to 2009, TIPS auctions had slightly lower bid-to-cover ratios than comparable nominal securities. But more recently, differences between TIPS and nominal bid-to-cover ratios have decreased. From January to July of 2009, the average bid-to-cover ratio for 5-, 10-, and 30-year nominal auctions has been 2.30. The average bid-to-cover ratio of 5-, 10-, and 20-year TIPS auctions has been 2.31 during the same period.
Page 15 GAO-09-932 Debt Management

Figure 7: Bid-to-Cover Ratios for Selected Treasury Securities, July 2003 to July 2009
Source: GAO analysis of Treasury auction data on 5-year, 10-year, and 30-year nominal Treasury securities and 5-year, 10-year,20-year, and 30-year TIPS.
Bid-to-cover ratio
0
0.5
1.0
1.5
2.0
2.5
3.0
3.5
3-month nominal moving average
3-month TIPS moving average
Full subscription threshold
20-year TIPS
10-year TIPS
5-year TIPS
10-year note
5-year note
30-year bond
Jul09
Jun09
May09
Apr09
Mar09
Feb09
Jan09
Dec08
Nov08
Oct08
Sep08
Aug08
Jul08
Jun08
May08
Apr08
Mar08
Feb08
Jan08
Dec07
Nov07
Oct07
Sep07
Aug07
Jul07
Jun07
May07
Apr07
Mar07
Feb07
Jan07
Dec06
Nov06
Oct06
Sep06
Aug06
Jul06
Jun06
May06
Apr06
Mar06
Feb06
Jan06
Dec05
Nov05
Oct05
Sep05
Aug05
Jul05
Jun05
May05
Apr05
Mar05
Feb05
Jan05
Dec04
Nov04
Oct04
Sep04
Aug04
Jul04
Jun04
May04
Apr04
Mar04
Feb04
Jan04
Dec03
Nov03
Oct03
Sep03
Aug03
Jul03
Oct.JulyAprJan.Oct.July Oct.JulyApr.Jan.Oct.JulyApr.Jan. JulyApr.Jan.Oct.JulyApr.Jan.Oct.JulyApr.Jan.
20042003
Year
20062005 200920082007
Treasury’s current policies to ensure sufficient coverage of auctions were instituted after a 10-year nominal Treasury note auction had a relatively low bid-to-cover ratio of 1.2 in May 2003. The more recent, stronger bid-to-cover ratios indicate that the market would support increased TIPS issuance. A more liquid TIPS market would benefit Treasury. At the same time, the cost to Treasury of the TIPS program going forward remains a subject of debate.
Page 16 GAO-09-932 Debt Management

TIPS offer a variety of benefits to both Treasury and investors. TIPS provide Treasury the opportunity to diversify its investor base because TIPS are by design a very different product than nominal securities. In addition, TIPS may reduce the cost of nominal securities. The cost against which to weigh the benefits of TIPS, however, is unclear. While there is agreement on the higher initial cost of the TIPS program, less consensus exists on the total cost of the TIPS program to date.
TIPS Program Offers Benefits to Treasury, and Measuring Its Cost Requires both Forward-Looking and After-the-Fact Analysis
TIPS Program Could Benefit Treasury by Diversifying Its Funding Sources and Investor Base
TIPS could benefit Treasury by diversifying its funding sources and investor base. Market experts and researchers, including the Securities Industry and Financial Markets Association (SIFMA), asserted that TIPS could provide Treasury with access to new investors whose needs could complement those of investors in nominal securities.14 In a 2004 letter to Treasury, the Bond Market Association, now part of SIFMA, stated that “the Association continues to believe that the Treasury’s TIPS program is likely to ultimately help reduce Treasury’s overall cost of funding by attracting a new pool of investors and facilitate better liability management.”
There is direct evidence that TIPS could help Treasury access different groups of investors.15 According to research by a New York Federal Reserve expert on Treasury markets, between July 30, 2001, and December 28, 2005, investment funds (which included mutual funds and hedge funds) accounted for 30.2 percent of TIPS sold at auction, but only 11.5 percent of nominal notes and bonds.16 Whereas, between July 30,
14SIFMA is an organization that represents the shared interests of participants in the global financial markets. SIFMA members include international securities firms, U.S.-registered broker-dealers and asset managers. SIFMA members are part of TBAC, which meets quarterly with Treasury and presents their observations to Treasury on the overall strength of the U.S. economy as well as providing recommendations on a variety of technical debt management issues.
15As investors can purchase TIPS in either the secondary market or at auction, diversification of Treasury’s end-user investor base might not be directly related to auction concentration.
16Michael Fleming, “Who Buys Treasury Securities at Auction?” Current Issues in
Economics and Finance, vol. 13, no. 1 (2007).
Page 17 GAO-09-932 Debt Management

2001, and December 28, 2005, the largest group of Treasury holders, foreign and international investors, accounted for 8.2 percent of TIPS sold at auction and 21.1 percent of nominal notes and bonds. Another example of the diversification that TIPS could provide is that pension funds tend to purchase a higher share of TIPS securities than nominal Treasury securities at auctions.
While TIPS auctions have been highly concentrated, with just a few regular participants, TIPS may exhibit less ownership concentration than nominal securities. As of December 2008, the largest TIPS fund (Vanguard Inflation-Protected Securities Fund) reported $16.6 billion in TIPS holdings, accounting for 3.1 percent of the $530 billion in TIPS outstanding on that date. In contrast, Treasury International Capital data shows that the largest foreign holder of U.S. Treasury securities (China) reported $727 billion, accounting for 12.5 percent of the $5.8 trillion in total marketable Treasury securities on the same date.17
One indicator of TIPS’ potential to diversify funding sources for Treasury is the growth of inflation-protected mutual funds. Both the number and the amount of assets under management in inflation-protected funds have increased since 2002. As seen in figure 8, the number of inflation-protected funds doubled from 20 at the end of December 2002 to 40 at the end of May 2009. The amounts of inflation-protected funds under management increased from $11.8 billion to $54.4 billion during the same period. The mutual fund managers that we interviewed expressed their investors’ continued interest in the TIPS program going forward and plan to continue to purchase TIPS securities over the next year. According to data from one large mutual fund company, between 2003 and 2008 the large majority of inflows into its TIPS fund came from non-Treasury funds.
17Treasury International Capital data is available at http://www.treasury.gov/tic.
Page 18 GAO-09-932 Debt Management

Figure 8: Inflation-Protected Mutual Funds and Assets under Management, December 2002 to May 2009
0
10
20
30
40
50
60
Total net assets (in billions)
5/0912/0812/0712/0612/0512/0412/0312/02
Dollars (in billions)
Date
Source: GAO analysis of Investment Company Institute data.
$11.8
$18.1
$28.3
$36.0 $35.0
$40.6
$46.5
$54.4
0
5
10
15
20
25
30
35
40
45
Number of inflation protected Mutual Funds
Number of inflation protected Mutual Funds
41
24
42
40
20
34
41 41
According to market experts, another potential benefit of the TIPS program to Treasury is its potential to reduce government borrowing costs. If Treasury has to increase the supply of nominal securities substantially to fund larger deficits, it may need to raise yields in order to attract enough buyers due to the saturation of the nominal Treasury market. Therefore, issuing TIPS may make sense as a substantial shift in the composition of Treasury issuance into TIPS from nominal Treasuries could lead to lower interest rates paid on the remaining nominal Treasury issuance. This argument has been cited as a benefit by a number of market experts, but additional research is required. Treasury’s access to auction data puts ODM staff in a unique position to conduct a comprehensive and ongoing analysis of the impact that TIPS have on the cost of nominal securities. In commenting on this report, Treasury told us that ODM staff have reviewed such data. They note that TIPS have remained less liquid than nominal securities and are considering approaches to improve the inflation-indexed market.
Page 19 GAO-09-932 Debt Management

Treasury securities have the potential to provide a number of social, fiscal, and monetary benefits. All Treasury securities provide investors with virtually zero credit risk. Only TIPS, however, provide zero inflation risk, making them one of the most effective ways for risk-averse households to meet their savings needs. In contrast, one of the downsides of nominal Treasury securities is that in the event of unexpected inflation, the real return to investors will be less than expected. Investors in nominal Treasury securities assume the risk of inflation eroding their expected return, but inflation-protected investments, such as TIPS, shift the inflation risk to the issuer.
Economists have noted that governments are better able to bear inflation risk because periods of inflation are often associated with increased revenues. Economists have also noted that TIPS could make the Federal government more accountable for the inflationary consequences of its actions in the form of higher payments on TIPS, if inflation increases. The results of TIPS auctions also provide useful information to policymakers on inflation expectations. In this respect, TIPS auctions help provide a measure of market inflation expectations, which can be taken into account when making monetary policy decisions.18
Ex-ante vs. Ex-post Analysis Ex-ante is Latin for beforehand. In models with uncertainty, ex-ante values are expected values that are calculated before the uncertainty is resolved.
Ex-post is Latin for after the fact. In models with uncertainty, ex-post values are the realized or actual values that are calculated after the uncertainty has been resolved. In the context of nominal interest-bearing government securities, investors are assumed to demand compensation for expected inflation. Ex-ante expectations about inflation are assumed to be formed rationally, meaning that expectations will be identical to optimal forecasts using all available information. Ex-post, realized inflation rates may differ from ex-ante expected values, but these differences should not be systematically positive or negative. For a sufficiently lengthy time horizon the cost of TIPS relative to nominal Treasury securities should be the same when calculated on both an ex-ante and ex-post basis, all else equal. For shorter time horizons, the difference between expected and realized inflation values may appear to be persistent; thus, the ex-ante approach may be preferred to assess the cost of TIPS relative to nominal Treasury securities over the short term.
Forward-Looking Analysis of TIPS Program’s Costs Adds an Important Perspective to Evaluating the Role of TIPS as Part of Treasury’s Debt Portfolio
18William C. Dudley, Jennifer Roush, and Michelle Steinberg Ezer, “The Case for TIPS: An Examination of the Costs and Benefits,” FRBNY Economic Policy Review (July 2009).
Page 20 GAO-09-932 Debt Management
Market experts have measured costs of TIPS in two primary ways. The first approach evaluates TIPS on an ex-post (after the fact) basis. That is, the cost of TIPS and nominal securities are compared based on what inflation actually was during a given time period.19 Economists conducting ex-post analyses have concluded that the TIPS program has been less cost-effective for Treasury than nominal securities. A 2008 study by a Federal Reserve economist estimated that the total cost of the TIPS program through October 2007 was between $4.5 billion and $7.5 billion.20 Based on TIPS issued through July 2009, Treasury’s ODM estimated the total cost of TIPS at $10 billion to date. This more recent study includes the anomalous period characterized by the financial market crisis and the related flight to quality which made nominal securities relatively inexpensive for Treasury. Economists generally agree that part of the relatively higher cost of the TIPS program can be attributed to its start-up costs. According to market experts and the major institutional investors that we interviewed, other factors that may have contributed to the relatively higher cost to Treasury of the TIPS program to date are investors’ perceptions of Treasury’s lack of commitment to the program and the relatively low inflation experienced throughout the life of the program. Since the TIPS program was introduced, the annual Consumer Price Index for All Urban Consumers (CPI-U) percent change never exceeded 3.8 percent, which is low by historical standards. The CPI-U averaged 7.08 percent and 5.55 percent during the 1970s and 1980s, respectively.
In contrast, other economists who have studied the issue argue that from an ex-ante (before the fact) basis, TIPS are not more costly to issue than nominal securities and that the relative cost of the TIPS program to date in part reflects start-up costs that will not be incurred again.21 One recent study by Treasury’s ODM found that TIPS are not less costly when measured on an ex-ante basis, but this study includes the anomalous period characterized by the financial market crisis and the related flight to
19For the total cost of the TIPS program, ex-post analysis computes the cost of TIPS going forward if future inflation follows an assumed path.
20Jennifer Roush, “The ‘Growing Pains’ of TIPS Issuance,” Finance and Economic
Discussion Series (2008).
21Jennifer Roush, “The ‘Growing Pains’ of TIPS Issuance,” Finance and Economic
Discussion Series (2008); William C. Dudley, Jennifer Roush, and Michelle Steinberg Ezer, “The Case for TIPS: An Examination of the Costs and Benefits,” FRBNY Economic Policy
Review (July 2009); and Pu Shen, “Developing a Liquid Market for Inflation-Indexed Government Securities: Lessons from Earlier Experiences,” Economic Review (First Quarter 2009).
Page 21 GAO-09-932 Debt Management
quality which made nominal securities relatively inexpensive for Treasury. Another ex-ante study, noted that if the TIPS program were as liquid as the market for off-the-run nominal Treasuries, Treasury would have realized total cost savings from the TIPS program of $22 billion to $32 billion.22 Over the short run, economists recognize that an assessment of TIPS program’s relative costs depends on whether Treasury or the investor is the beneficiary from differences in expected and actual inflation. The time horizon of the analysis affects the results since, over the long run, the average amount by which actual inflation exceeds expected inflation will roughly equal the average amount when the opposite is true.23 Therefore, some market experts argue that TIPS should be evaluated on an ex-ante basis, for example, by finding the difference between the breakeven inflation rate (the nominal-TIPS yield differential) and a survey-based measure of inflation expectations at the time of the TIPS auction. This difference is independent of inflation surprises and provides a measure of the net savings or loss incurred by Treasury.
Faced with the economic recession and the ensuing 2008 financial market crisis, Treasury is to be commended for its success in raising unprecedented amounts of cash in a very short amount of time. Absent policy changes, the medium- and long-term fiscal outlook mean that Treasury will need to raise increasing amounts of cash, and build borrowing flexibility by increasing the term to maturity of its debt portfolio, while retaining its focus on reducing its overall borrowing cost. While questions remain about how to evaluate the cost of the TIPS program, TIPS have the potential to provide Treasury with a number of benefits and help Treasury achieve its debt management objectives.
Concluding Observations
On July 1, 2009, we briefed Treasury’s ODM on the findings from our analysis and interviews with major institutional investors. Treasury later posed questions about ways to improve the TIPS program to the Primary Dealers and TBAC. At the August 2009 TBAC meeting, members discussed TIPS. Following the meeting, Treasury’s Deputy Assistant Secretary for
22Off-the-run securities are securities that are no longer on-the-run (or the most recently auctioned security of a given maturity).
23William C. Dudley, Jennifer Roush, and Michelle Steinberg Ezer, “The Case for TIPS: An Examination of the Costs and Benefits,” FRBNY Economic Policy Review (July 2009); and Dean Croushore, “An Evaluation of Inflation Forecasts From Surveys Using Real-Time Data,” Federal Reserve Bank of Philadelphia Working Papers (December 2008).
Page 22 GAO-09-932 Debt Management

Federal Finance reaffirmed Treasury’s commitment to TIPS and announced plans to gradually increase issuance of TIPS.
The Secretary of the Treasury should take the following actions to improve TIPS liquidity in the context of projected sustained increases in federal debt:
Recommendations
• increase TIPS issuance, • issue TIPS with longer-dated maturities, and • conduct more frequent TIPS auctions.
The Secretary should continually review the appropriate composition of the TIPS program, and consider:
• the impact of Treasury’s public statements and TIPS issuances on TIPS liquidity,
• how both ex-ante (before the fact) and ex-post (after the fact) analyses are valuable for evaluating the cost of TIPS, recognizing the anomalous nature of market data from periods such as the 2008 financial market crisis,
• the ways in which the TIPS program can diversify Treasury’s investor base and funding sources, and
• the degree to which TIPS impact the cost of nominal securities.
We requested comments on a draft of this report from the Secretary of the Treasury and received comments on behalf of the Treasury from its Deputy Assistant Secretary of Federal Finance. Treasury took note of our findings, conclusions, and recommendations, and said they were consistent with their commitment to increasing TIPS issuance in the context of projected sustained increases in federal debt. Treasury reiterated that they are committed to issuing TIPS in a regular and predictable manner across the yield curve, and noted that they are an important part of their overall debt management strategy. Treasury also noted that it is always reviewing the appropriate composition of the TIPS program.
Agency Comments
We are sending copies of this report to the Secretary of the Treasury and other interested parties. We will also make copies available at no charge on the GAO Web site at http://www.gao.gov. If you or your staff have any questions about this report, please contact Susan J. Irving at (202) 512-6806 or [email protected]. Contact points for our Offices of Congressional
Page 23 GAO-09-932 Debt Management

Relations and Public Affairs may be found on the last page of this report. GAO staff who made major contributions to this report are listed in appendix III.
Sincerely yours,
Director, Federal Budget Analysis
Susan J. Irving
Strategic Issues
Page 24 GAO-09-932 Debt Management
Appendix I: Tre
Sec
asury Inflation Protected
urities
Page 25 GAO-09-932
Appendix I: Treasury Inflation Protected Securities
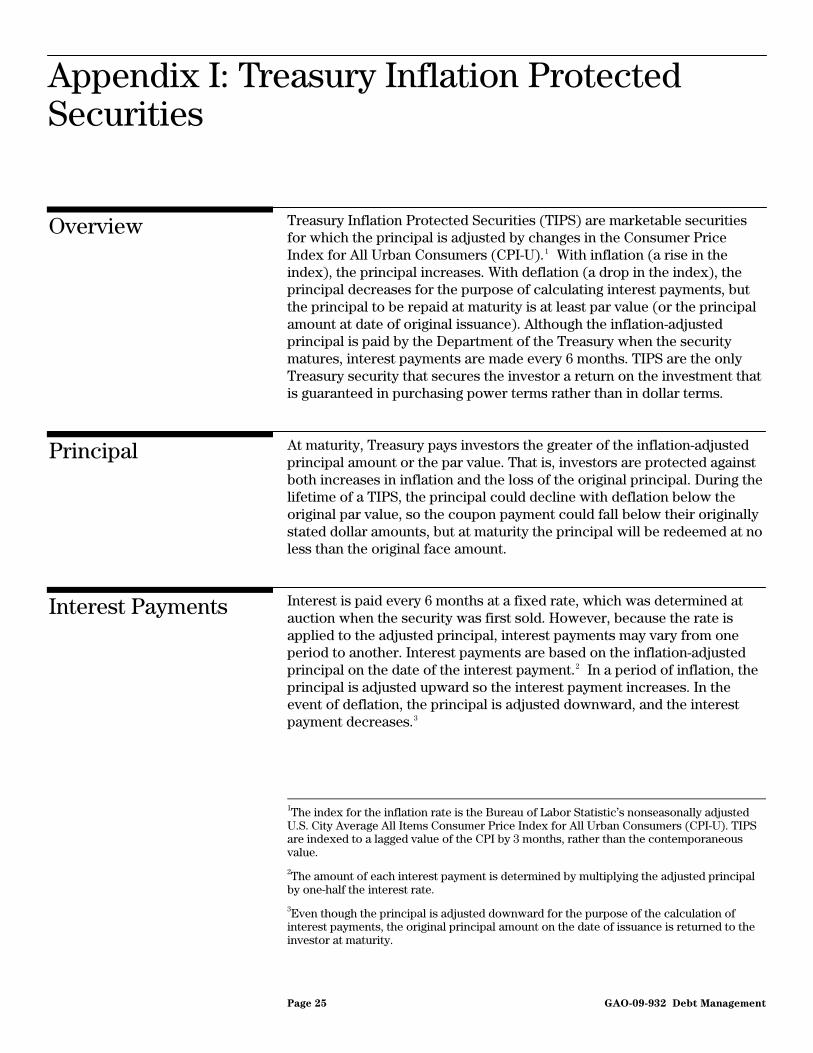
Treasury Inflation Protected Securities (TIPS) are marketable securities for which the principal is adjusted by changes in the Consumer Price Index for All Urban Consumers (CPI-U).1 With inflation (a rise in the index), the principal increases. With deflation (a drop in the index), the principal decreases for the purpose of calculating interest payments, but the principal to be repaid at maturity is at least par value (or the principal amount at date of original issuance). Although the inflation-adjusted principal is paid by the Department of the Treasury when the security matures, interest payments are made every 6 months. TIPS are the only Treasury security that secures the investor a return on the investment that is guaranteed in purchasing power terms rather than in dollar terms.
Overview
At maturity, Treasury pays investors the greater of the inflation-adjusted principal amount or the par value. That is, investors are protected against both increases in inflation and the loss of the original principal. During the lifetime of a TIPS, the principal could decline with deflation below the original par value, so the coupon payment could fall below their originally stated dollar amounts, but at maturity the principal will be redeemed at no less than the original face amount.
Principal
Interest is paid every 6 months at a fixed rate, which was determined at auction when the security was first sold. However, because the rate is applied to the adjusted principal, interest payments may vary from one period to another. Interest payments are based on the inflation-adjusted principal on the date of the interest payment.2 In a period of inflation, the principal is adjusted upward so the interest payment increases. In the event of deflation, the principal is adjusted downward, and the interest payment decreases.3
Interest Payments
1The index for the inflation rate is the Bureau of Labor Statistic’s nonseasonally adjusted U.S. City Average All Items Consumer Price Index for All Urban Consumers (CPI-U). TIPS are indexed to a lagged value of the CPI by 3 months, rather than the contemporaneous value.
2The amount of each interest payment is determined by multiplying the adjusted principal by one-half the interest rate.
3Even though the principal is adjusted downward for the purpose of the calculation of interest payments, the original principal amount on the date of issuance is returned to the investor at maturity.
Debt Management

Appendix I: Treasury Inflation Protected
Securities
Below is an illustrative example of how to calculate the inflation adjustments to the principal and the semi-annual interest payments (note that CPI-U numbers and rates are purely hypothetical).
How to Calculate an Inflation-Indexed Security Interest and Principal
An inflation-indexed security with par value of $1,000,000 was purchased on April 15, 2003, with a coupon rate of 3.5 percent. The first semi-annual interest payment date for
this inflation indexed security is October 15, 2003. The reference CPI-U number for the
issue date was 120. The reference CPI-U number for the first interest payment was 135. The inflation adjusted principal on October 15, 2003 was:
$1,000,000 x 135/120 = $1,125,000
The interest payment was:
$1,125,000 x 0.035/2 = $19,687.50
Both interest payments and the inflation adjustments applied to the principal of TIPS are subject to federal tax. The accrued increase in principal caused by the inflation adjustment is taxable in the year in which it is accrued, which is the standard structure for all other Treasury securities. However, with TIPS the increase in principal is an unrealized gain because the principal is not received until the bond matures. This is not an issue if TIPS are held in a tax-deferred account.
Taxation
Treasury currently auctions 5-, 10-, and 20-year TIPS. Treasury used to also issue 30-year TIPS, but discontinued doing so in 2001. Treasury currently auctions TIPS on a quarterly basis. The 5-year TIPS is issued in April and reopened in October.4 The 10-year TIPS is issued in January and July, with reopenings in April and October, and the 20-year TIPS is issued in January and reopened in July.
Auction Schedule
4In a reopening, Treasury sells an additional amount of a previously issued security. The reopened security has the same maturity date and interest rate as the original security. However, as compared to the original security, the reopened security has a different issue date and can have a different purchase price.
Page 26 GAO-09-932 Debt Management

Appendix I: Treasury Inflation Protected
Securities
TIPS are sold in increments of $100, with a required minimum purchase of $100. Treasury issues TIPS in electronic form. At auction, an investor can place competitive or noncompetitive bids for TIPS. However, noncompetitive bids are limited in a single auction to $5 million while competitive bids are limited to 35 percent of the initial offering amount.5 Investors can hold TIPS until they mature or sell them in the secondary market before they mature.
Purchasing TIPS
5A competitive bid is a bid to U.S. Treasury to buy Treasury securities at a particular yield. A noncompetitive bid is a method of purchasing Treasury securities at auction, without having to submit a price or a yield. Unlike competitive bids, noncompetitive bids are always accepted.
Page 27 GAO-09-932 Debt Management

Appendix II: The Cost of Treasury Inflation
Protected Securities Compared to Nominal
Securities
Appendix II: The Cost of Treasury Inflation Protected Securities Compared to Nominal Securities
For a sufficiently lengthy time horizon the cost of Treasury Inflation Protected Securities (TIPS) relative to nominal Treasury securities should be the same when calculated on both an ex-ante (before the fact) and ex-post (after the fact) basis, all else equal.
The following arithmetic illustrates the approximate equivalence between ex-ante and ex-post evaluations of the cost of TIPS relative to nominal securities.1
Ex-Post Calculation of the Nominal-TIPS Cost Difference
Nominal yield = real yield + expected inflation + inflation risk premium
TIPS yield = real yield + illiquidity premium
Ex-post evaluation of the cost difference between nominals and TIPS adds actual inflation to the TIPS yield, so ex-post:
TIPS yield = real yield + illiquidity premium + actual inflation
Ex-post, therefore, the nominal-TIPS cost difference is:
real yield + expected inflation + inflation risk premium -
real yield - illiquidity premium - actual inflation
In the long run, expected inflation should equal actual inflation on average, so the ex-post nominal-TIPS cost difference reduces to:
inflation risk premium - illiquidity premium
1While the cost difference between nominal Treasury securities and TIPS is primarily driven by illiquidity and inflation risk premiums, the relative cost also reflects such technical market factors as the taxation difference between TIPS and nominal issuances, the convexity of difference between real and nominal yields, and the price of TIPS embedded deflation floor.
Page 28 GAO-09-932 Debt Management

Appendix II: The Cost of Treasury Inflation
Protected Securities Compared to Nominal
Securities
Ex-ante calculation of the cost difference between nominals and TIPS subtracts a survey-based measure of expected inflation from the nominal-TIPS cost difference.
Ex-Ante Calculation of the Nominal-TIPS Cost Difference
Real yield + expected inflation + inflation risk premium - surveyed inflation expectation - real yield - illiquidity premium
If the survey accurately captures expected inflation, then expected inflation equals surveyed expected inflation and this ex-ante difference reduces to:
Inflation risk premium - illiquidity premium
Again, over the long run, if expected inflation = surveyed expected inflation = actual inflation, ex-ante and ex-post calculations of the cost of TIPS relative to nominals should be approximately the same. However, the possibility of persistent inflation surprises in one direction over a few years suggests using the ex-ante approach over shorter horizons.
The cost of TIPS compared to nominal securities increased substantially in fall 2008 when the subprime crisis intensified.2 During the latter part of 2008, TIPS yields rose while nominal yields declined resulting in near historic lows in the breakeven inflation rate, approaching zero by the end of 2008. During 2009, breakeven rates generally rose from their late-2008 lows and reached the 2 percent range in early August.
Disentangling the Drivers of Recent Shifts in the Nominal-TIPS Yield Differential (Breakeven Inflation Rate)
2Ingo Fender, Corrinne Ho, and Peter Hordähl, “Overview: investors ponder depth and duration of global downturn,” BIS Quarterly Review (March 2009).
Page 29 GAO-09-932 Debt Management
Appendix II: The Cost of Treasury Inflation
Protected Securities Compared to Nominal
Securities
Disentangling the Drivers of Recent Shifts in the Nominal-TIPS Yield Differential (Breakeven Inflation Rate) The sharp decline in breakeven inflation rates in late 2008 can be attributed to a combination of liquidity and technical market factors. Strong flight-to-liquidity flows during the market upheaval boosted the demand for nominal Treasury securities. Because TIPS markets are less liquid than nominal Treasury markets, this reduced the breakeven inflation rate.
In addition, technical market factors closely linked to liquidity effects appear to have contributed to the decline in breakeven inflation rates. Lehman Brothers owned TIPS as part of repo trades or posted TIPS as counterparty collateral. Because of Lehman’s bankruptcy, the court and its counterparty needed to sell these TIPS, which created a flood of TIPS on the market. There appeared to be few buyers and distressed market makers were unwilling to take positions in these TIPS. As a result, the TIPS yields rose sharply.
Inflation expectations and the inflation risk premium, two other important determinants of the nominal-TIPS yield differential, appear to have had negligible roles in the recent shifts in the yield differential. The median survey value of 10-year inflation forecasts compiled by the Federal Reserve Bank of Philadelphia’s Survey of Professional Forecasters displayed little variation over the last 2 years, which implies that long-term inflation expectations remained stable. Estimates also suggest that the inflation risk premium has remained relatively small and fairly stable.
Some financial economists view the experience with TIPS yields after the Lehman bankruptcy as a highly abnormal market situation where liquidity issues suddenly created severe financial anomalies. They suggest that this was an unrepresentative episode and that observations from this period could be ignored.
See John Campbell, Robert Shiller, and Luis Viceira, “Understanding Inflation-Indexed Bond Markets,” Working Paper Presented Brookings Institute (March 2009); and Ingo Fender, Corrinne Ho, and Peter Hordähl, “Overview: investors ponder depth and duration of global downturn,” BIS Quarterly Review (March 2009).
Page 30 GAO-09-932 Debt Management

Appendix III: GAO
A
Contact and Staff
cknowledgments
Page 31 GAO-09-932
Appendix III: GAO Contact and Staff Acknowledgments
Susan J. Irving, (202) 512-6806 or [email protected]
In addition to the contact named above, Jose Oyola (Assistant Director), Tara Carter (Analyst-in-Charge), Mark Kehoe, Erik Kjeldgaard, Richard Krashevski, Margaret McKenna and Jason Vassilicos made contributions to the report. Julie Matta, Rick Cambosos, Stuart Kaufman, and Greg Wilmoth also provided key assistance.
Debt Management
GAO Contact
Staff Acknowledgments
(450777)
GAO’s Mission The Government Accountability Office, the audit, evaluation, and investigative arm of Congress, exists to support Congress in meeting its constitutional responsibilities and to help improve the performance and accountability of the federal government for the American people. GAO examines the use of public funds; evaluates federal programs and policies; and provides analyses, recommendations, and other assistance to help Congress make informed oversight, policy, and funding decisions. GAO’s commitment to good government is reflected in its core values of accountability, integrity, and reliability.
The fastest and easiest way to obtain copies of GAO documents at no cost is through GAO’s Web site (www.gao.gov). Each weekday afternoon, GAO posts on its Web site newly released reports, testimony, and correspondence. To have GAO e-mail you a list of newly posted products, go to www.gao.gov and select “E-mail Updates.”
Obtaining Copies of GAO Reports and Testimony
Order by Phone The price of each GAO publication reflects GAO’s actual cost of production and distribution and depends on the number of pages in the publication and whether the publication is printed in color or black and white. Pricing and ordering information is posted on GAO’s Web site, http://www.gao.gov/ordering.htm.
Place orders by calling (202) 512-6000, toll free (866) 801-7077, or TDD (202) 512-2537.
Orders may be paid for using American Express, Discover Card, MasterCard, Visa, check, or money order. Call for additional information.
Contact:
Web site: www.gao.gov/fraudnet/fraudnet.htm E-mail: [email protected] Automated answering system: (800) 424-5454 or (202) 512-7470
Ralph Dawn, Managing Director, [email protected], (202) 512-4400 U.S. Government Accountability Office, 441 G Street NW, Room 7125 Washington, DC 20548
To Report Fraud, Waste, and Abuse in Federal Programs
Congressional Relations
Chuck Young, Managing Director, [email protected], (202) 512-4800 U.S. Government Accountability Office, 441 G Street NW, Room 7149 Washington, DC 20548
Public Affairs
Please Print on Recycled Paper