september 1, 2017 issued for use cressey...
TRANSCRIPT

Tetra Tech Canada Inc.Suite 1000 – 10th Floor, 885 Dunsmuir Street
Vancouver, BC V6C 1N5 CANADATel 604.685.0275 Fax 604.684.6241
September 1, 2017 ISSUED FOR USE FILE: PTRN.VHWY03086-01
Cressey Developments Via Email: [email protected] 200 – 555 West 8th Avenue Vancouver, BC, V5Z 1C6
Attention: Nathan Gurvich Development Manager
Subject: Traffic Management Study – Commercial Development 425 West 6th Avenue, Vancouver, BC Revision 1
1.0 INTRODUCTION
Tetra Tech Canada Inc. (Tetra Tech) was retained by Cressey Developments to undertake a traffic impact assessment (TIA) for a proposed commercial development to be located on a lot at the northwest corner of the intersection of West 6th Avenue and Yukon Street in Vancouver, BC. The proposed development will comprise of 17,450 ft2 of retail space and 158,765 ft2 of office space. The basic information of the land is provided in Table 1.1, location and site relative to its environs is shown in Figure 1.
Table 1.1: Site Information
The traffic impact assessment considered weekday a.m. and p.m. peak hour conditions for the 2018 (assumed opening year) and the 2023 horizon year. The analysis covers the impact of site traffic at the intersection of West 6th Avenue and Yukon Street. This study examined the potential need for road improvements that may be required to mitigate any adverse impacts associated with the proposed development.
2.0 EXISTING CONDITIONS
2.1 Road Network
The site is located at the North-West corner of West 6th Avenue and Yukon Street. The road network in the vicinity of the site is summarized in the Table 2.1.
Civic address 425 West 6th Avenue, Vancouver
Legal address Lot 10 block 12 plan vap5832 district lot 302, New Westminster land distance
Zoning Cambie Street (east side) C-3A guidelines
Site area 2,243.52 m2 (24,149 ft2)
Site dimensions 37.16 m x 60.38 m (122 ft x 198 ft)
Proposed Height 9-storeys

TRAFFIC IMPACT STUDY – WEST 6TH AVENUE, VANCOUVER
FILE: PTRN.VHWY03086-01 | SEPTEMBER 1, 2017 | ISSUED FOR USE
2
West 6th Traffic Study_IFU_rev1.docx
Table 2.1: Road Network
Orientation Classification Segment/Stretch Posted Speed
West 6th Avenue East-West Local Road Cambie Street – Ontario Street
(turns into East 6th after)
50 km/h
Yukon Street North-South Local Road West 2nd Avenue – West 16th Avenue
30 km/h
(Assumed, not posted in the immediate vicinity of
the site)
2.2 Intersection Channelization and Controls
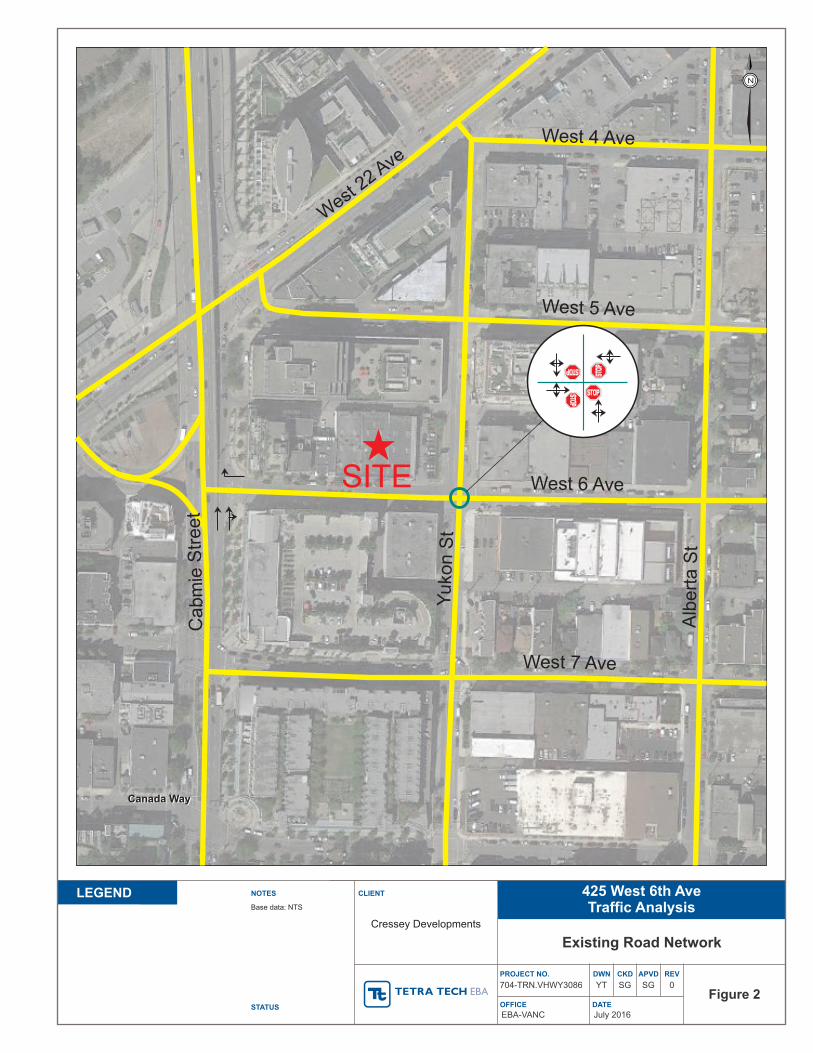
The existing laning and traffic controls at the study intersection is summarized in Table 2.2 and shown in Figure 2.
Table 2.2: Existing Laning and Traffic Controls
N-S St E-W St Eastbound Westbound Northbound Southbound
Traffic Control L T R L T R L T R L T R
Yukon Street West 6th Avenue < 1 > < 1 > < 1 > < 1 > All-Way Stop
2.3 Land Use
The site is currently occupied by an auto repair business (Craftsman Collision). The area is surrounded by a mix of residential, commercial and industrial uses. The Cambie Street Bridge is located half a block to the west of the proposed site, but is not directly accessible via West 6th Avenue.
The immediate neighbourhood to the north includes:
A 9-storey terraced brick ICBC building on West 5th Avenue
A recently constructed 5-storey brick office building at 395 West 5th Avenue housing an animation studio
The west of the site includes:
Two mixed use concrete buildings with commercial space at grade and residential above – 7 and 4 stories respectively
A 2-storey commercial building adjacent to subject site
The south of the site includes:
A large-scale retail development housing Best Buy and Canadian Tire stores
A 2-storey stucco commercial building
A 3 vets outdoor goods retail store
A 2-storey glass metal and brick building for industrial use
The east of the site includes:
A 2-storey masonry Kitchen and Bath showroom building

TRAFFIC IMPACT STUDY – WEST 6TH AVENUE, VANCOUVER
FILE: PTRN.VHWY03086-01 | SEPTEMBER 1, 2017 | ISSUED FOR USE
3
West 6th Traffic Study_IFU_rev1.docx
2.4 Existing Transit Service
There are a number of transit services in close proximately to the site. The Olympic Village transit loop is located approximately a 4 minute walk away from the site. This transit loop services Route #15, #50, #84 and the Canada Line Skytrain station. Route #15 services areas in Vancouver by running from Marine Drive to Olympic Village along Cambie Street. Route #50 services Vancouver / downtown Vancouver and runs from Olympic Village to Waterfront. UBC and Vancouver Community College are serviced by Route #84. The Canada Line provides service to downtown Vancouver, as well as Vancouver International Airport (YVR) and Richmond City Centre. The site is also approximately a 5 minute walk away from a southbound bus stop on Cambie Street providing additional access to Route #17. This route offers service between Marine Drive and downtown Vancouver.
The site is considered to have very good transit accessibility which should contribute to reducing the vehicle trip generation from the development compared with a more suburban location.
2.5 Existing Traffic Volumes
New turning movement counts were undertaken specifically for this study at the study intersections. Counts covered the weekday a.m. and p.m. peak periods. A summary of the a.m. and p.m. existing link volumes are provided in Tables 2.3 and 2.4 and illustrated in Figure 2.1.
West 6th Ave
Ca
mbie
Str
ee
t
Yukon
Str
eet
8(11)105(60)19(26)
(10)13(35)18(46)12
72(6
6)
187
(346
)7
(16
)
(81)
90
(18
1)2
37
(22)
23
N
West 5th Ave
SITE
LEGEND
XXX AM Peak Hour Traffic Volumes(XXX) PM Peak Hour Traffic Volumes
Figure 2.1: Existing (2017) peak hour traffic volumes a.m. (p.m.) peak hours
Table 2.3: Existing Link Volumes (2017 a.m. Peak Hour)
Start Time From North From East From South From West
R T L Ped R T L Ped R T L Ped R T L Ped
Tot. Pass. Veh
(8:00 to 9:00) 71 184 7 29 8 103 18 51 23 234 90 10 12 18 13 45
Tot. Trucks
(8:00 to 9:00) 1 3 0 0 0 2 1 0 0 3 0 0 0 0 0 0
Total 72 187 7 29 8 105 19 51 23 237 90 10 12 18 13 45

TRAFFIC IMPACT STUDY – WEST 6TH AVENUE, VANCOUVER
FILE: PTRN.VHWY03086-01 | SEPTEMBER 1, 2017 | ISSUED FOR USE
4
West 6th Traffic Study_IFU_rev1.docx
Table 2.4: Existing Link Volumes (2017 p.m. Peak Hour)
From North From East From South From West
Start Time R T L Ped R T L Ped R T L Ped R T L Ped
Tot. Pass. Veh
(4:45 to 5:15) 66 326 14 33 10 60 24 69 21 159 80 52 44 33 10 60
Tot. Trucks
(4:45 to 5:15) 0 20 2 0 1 0 2 0 1 22 1 0 2 2 0 0
Total 66 346 16 33 11 60 26 69 22 181 81 52 46 35 10 60
2.6 Recent Network Changes
There have been no changes to the transportation network in the immediate vicinity of the site.
2.7 Future Background Traffic Volumes
Future background traffic volumes were established by factoring the existing traffic counts at a rate of 2% per annum. Background volumes covered opening year (2018) and opening year plus five years (2023).
The 2018 and 2023 background traffic volumes are illustrated in Figures 2.2 and 2.3 respectively.
West 6th Ave
Ca
mbie
Str
ee
t
Yukon
Str
eet
8(11)107(61)19(27)
(10)13(36)18(47)12
73(6
7)
191
(353
)7
(16
)
(83)
92
(18
5)2
42
(22)
23
N
West 5th Ave
SITE
LEGEND
XXX AM Peak Hour Traffic Volumes(XXX) PM Peak Hour Traffic Volumes
Figure 2.2: 2018 Future Background Traffic Volumes
TRAFFIC IMPACT STUDY – WEST 6TH AVENUE, VANCOUVER
FILE: PTRN.VHWY03086-01 | SEPTEMBER 1, 2017 | ISSUED FOR USE
5
West 6th Traffic Study_IFU_rev1.docx
West 6th Ave
Ca
mbie
Str
ee
t
Yukon
Str
eet
9(11)116(66)21(29)
(11)14(39)20(51)13
79(7
3)
206
(381
)8
(18
)
(89)
99
(19
9)2
61
(24)
25
N
West 5th Ave
SITE
LEGEND
XXX AM Peak Hour Traffic Volumes(XXX) PM Peak Hour Traffic Volumes
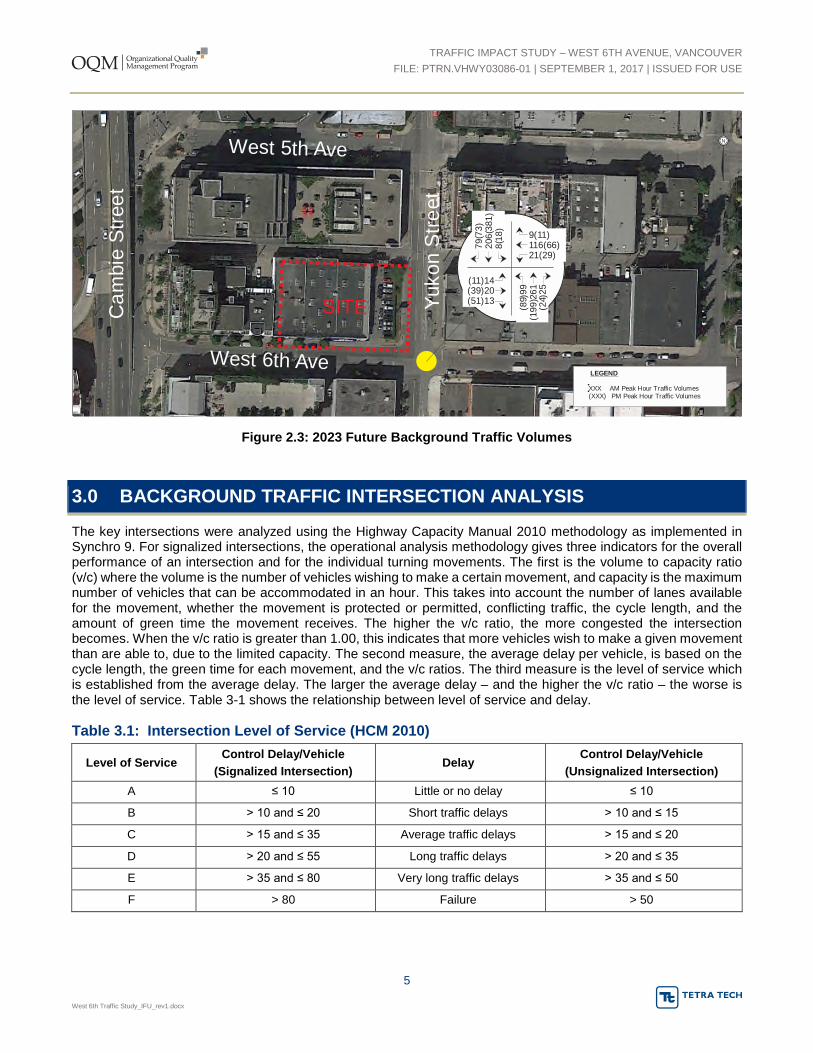
Figure 2.3: 2023 Future Background Traffic Volumes
3.0 BACKGROUND TRAFFIC INTERSECTION ANALYSIS
The key intersections were analyzed using the Highway Capacity Manual 2010 methodology as implemented in Synchro 9. For signalized intersections, the operational analysis methodology gives three indicators for the overall performance of an intersection and for the individual turning movements. The first is the volume to capacity ratio (v/c) where the volume is the number of vehicles wishing to make a certain movement, and capacity is the maximum number of vehicles that can be accommodated in an hour. This takes into account the number of lanes available for the movement, whether the movement is protected or permitted, conflicting traffic, the cycle length, and the amount of green time the movement receives. The higher the v/c ratio, the more congested the intersection becomes. When the v/c ratio is greater than 1.00, this indicates that more vehicles wish to make a given movement than are able to, due to the limited capacity. The second measure, the average delay per vehicle, is based on the cycle length, the green time for each movement, and the v/c ratios. The third measure is the level of service which is established from the average delay. The larger the average delay – and the higher the v/c ratio – the worse is the level of service. Table 3-1 shows the relationship between level of service and delay.
Table 3.1: Intersection Level of Service (HCM 2010)
Level of Service Control Delay/Vehicle
(Signalized Intersection) Delay
Control Delay/Vehicle
(Unsignalized Intersection)
A ≤ 10 Little or no delay ≤ 10
B > 10 and ≤ 20 Short traffic delays > 10 and ≤ 15
C > 15 and ≤ 35 Average traffic delays > 15 and ≤ 20
D > 20 and ≤ 55 Long traffic delays > 20 and ≤ 35
E > 35 and ≤ 80 Very long traffic delays > 35 and ≤ 50
F > 80 Failure > 50

TRAFFIC IMPACT STUDY – WEST 6TH AVENUE, VANCOUVER
FILE: PTRN.VHWY03086-01 | SEPTEMBER 1, 2017 | ISSUED FOR USE
6
West 6th Traffic Study_IFU_rev1.docx
The generally accepted guidelines for determining whether or not a signalized intersection needs to be upgraded is that all individual movements should operate with a v/c ratio of 0.90 or less.
If the above threshold is not achieved, any signal changes required to achieve these levels should be identified. These cover changes to signal timings and phasing, for example adding advanced phases for left turn movements and possible elimination of certain turning movements, but not the provision of additional capacity with extra through or turn lanes.
When traffic generated by a development is added to an intersection and the v/c ratio of a specific movement that was less than 0.90 under background conditions is now greater than 0.90, then improvements must be identified to allow the movement to operate at the 0.90 value.
If the movement was above 0.90 under background conditions, then the original v/c ratios must not be exceeded, i.e., the operation of the movement must be no worse as a result of the development.
The study intersections were analyzed under 2018 and 2038 peak hour traffic conditions using the above approach. The results are summarised in Table 3-2.
The analysis takes into account the high volume of trucks using the network in the vicinity of the site.
Table 3.2: Intersection Level of Service (HCM 2010) Background Traffic Analysis – West 6th
Avenue / Yukon Street
2018 Background 2038 Background
a.m. Peak Hour EB WB NB SB Overall EB WB NB SB Overall
LoS A B C B B B B C B C
v/c 0.09 0.27 0.63 0.48 0.64 0.10 0.31 0.70 0.53 0.70
p.m. Peak Hour
LoS A B B C B B B B C C
v/c 0.16 0.18 0.45 0.64 0.64 0.19 0.20 0.51 0.74 0.74
A B C B B B B C B C
Note: EB = Eastbound; WB = Westbound; NB = Northbound; and SB = Southbound
Based on the analysis the study intersection is operating well under background traffic conditions. No improvements will be required through to 2038 to accommodate background traffic growth.
4.0 SITE TRAFFIC
4.1 Development Concept
The proposed development will comprise 17,453 ft2 of retail space and 158,767 ft2 of office space. Potential uses of the commercial space have not yet been determined. Access to the site is proposed via a single location at the south end of the site. The latest site plan is illustrated in Figure 5.
4.2 Trip Generation
The trip generation from the site was initially established using standard ‘street peak’ trip generation rates published in the Institute of Transportation Engineers’ Trip Generation Handbook, 9th Edition. The trip rates for a ‘General Office Building’ (Land Use 710) was applied to the office component, while the rates for a ‘Shopping Centre’ (Land Use 820) was applied to the commercial component of the development. To account for site’s proximity to the
TRAFFIC IMPACT STUDY – WEST 6TH AVENUE, VANCOUVER
FILE: PTRN.VHWY03086-01 | SEPTEMBER 1, 2017 | ISSUED FOR USE
7
West 6th Traffic Study_IFU_rev1.docx
Cambie Street Canada Line Station, a 40% reduction factor was applied. A summary of the anticipated trip generation is provided in the table below.
Table 4.1: Intersection Level of Service (HCM 2010) Trip Generation
Use Size* a.m. Peak Hour p.m. Peak Hour
Rate Total In Out Rate Total In Out
General Office Building
(Land Use 710) 158,767 ft2 1.56 248 218 30 1.49 237 40 197
Commercial (Land Use 820) 17,453 ft2 0.96 17 11 6 3.71 65 31 34
Reduction 40% 106 92 14 121 28 92
Total 159 137 22 181 43 139
*Note: The trip generation and intersection capacity analyses (Section 4 and 5) were based on the latest site plan available at the time of undertaking the analyses. A new site was made available on August 31, 2017 with minor changes to the GFA of the different uses (16,504 ft2
of retail and 155,147 ft2 of office space). Given that the GFA for both the office and commercial components decreased, the trip generation
and the subsequent analyses were not redone; therefore, the subsequent analyses can be considered conservative.
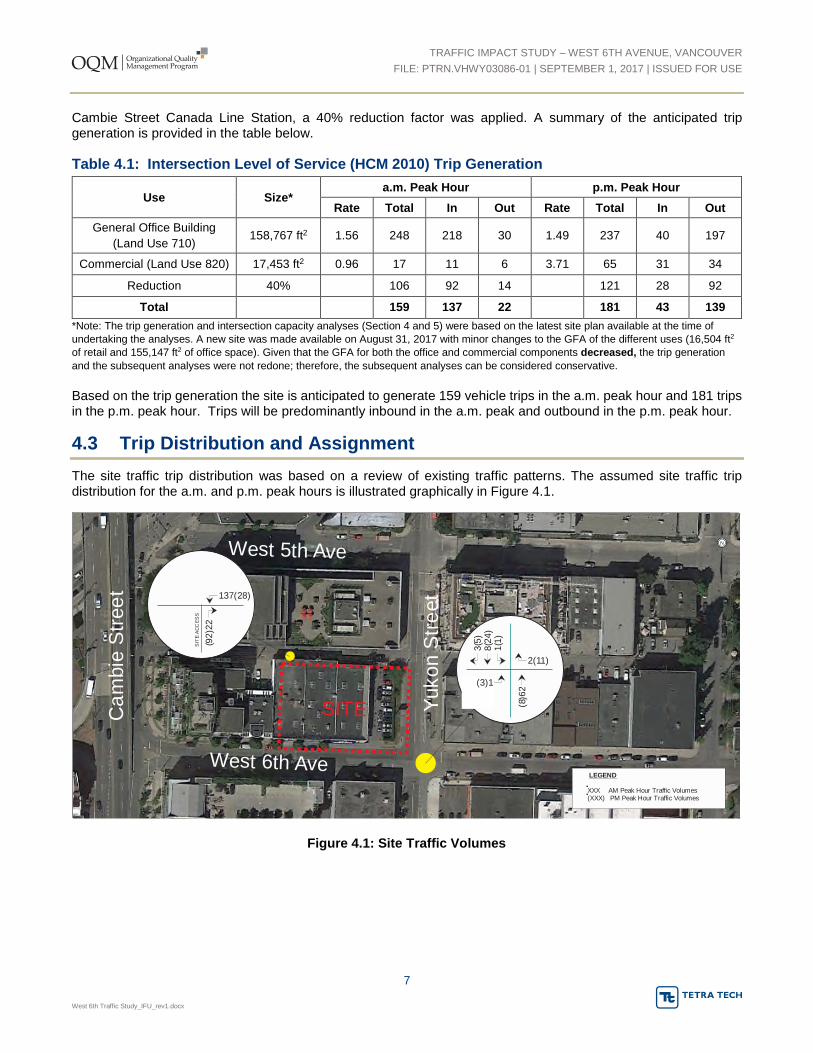
Based on the trip generation the site is anticipated to generate 159 vehicle trips in the a.m. peak hour and 181 trips in the p.m. peak hour. Trips will be predominantly inbound in the a.m. peak and outbound in the p.m. peak hour.
4.3 Trip Distribution and Assignment
The site traffic trip distribution was based on a review of existing traffic patterns. The assumed site traffic trip distribution for the a.m. and p.m. peak hours is illustrated graphically in Figure 4.1.
West 6th Ave
Ca
mbie
Str
ee
t
Yukon
Str
eet
2(11)
(3)1
3(5
)8
(24
)1
(1)
(8)6
2
N
West 5th Ave
SITE
LEGEND
XXX AM Peak Hour Traffic Volumes(XXX) PM Peak Hour Traffic Volumes
137(28)
(92
)22
SIT
EA
CC
ES
S
Figure 4.1: Site Traffic Volumes

TRAFFIC IMPACT STUDY – WEST 6TH AVENUE, VANCOUVER
FILE: PTRN.VHWY03086-01 | SEPTEMBER 1, 2017 | ISSUED FOR USE
8
West 6th Traffic Study_IFU_rev1.docx
5.0 POST DEVELOPMENT TRAFFIC CONIDITIONS
5.1 Post Development Traffic Volumes
The post development traffic volumes were established by superimposing the site traffic onto background traffic volumes at each horizon year.
The post development traffic volumes for the 2018 and 2038 horizon years are illustrated in Figures 5.1 and 5.2.
West 6th Ave
Ca
mbie
Str
ee
t
Yukon
Str
eet
N
West 5th Ave
SITE
LEGEND
XXX AM Peak Hour Traffic Volumes(XXX) PM Peak Hour Traffic Volumes
137(28)
(92
)22
SIT
EA
CC
ES
S
10(12)107(61)19(27)
(11)16(36)18(47)12
76
(72)
19
9(3
77
)8(1
7)
(83)9
2(1
93
)30
4(2
2)2
3
Figure 5.1: 2018 Peak Hour Combined Traffic Volumes a.m. (p.m.)
West 6th Ave
Ca
mbie
Str
ee
t
Yukon
Str
eet
N
West 5th Ave
SITE
LEGEND
XXX AM Peak Hour Traffic Volumes(XXX) PM Peak Hour Traffic Volumes
137(28)
(92
)22
SIT
EA
CC
ES
S
11(13)116(66)21(29)
(12)17(39)20(51)13
82
(78)
21
3(4
05
)9(1
9)
(89)9
9(2
07
)32
3(2
4)2
5
Figure 5.2: 2023 Peak Hour Combined Traffic Volumes a.m. (p.m.)

TRAFFIC IMPACT STUDY – WEST 6TH AVENUE, VANCOUVER
FILE: PTRN.VHWY03086-01 | SEPTEMBER 1, 2017 | ISSUED FOR USE
9
West 6th Traffic Study_IFU_rev1.docx
5.2 Post Development Traffic Analysis
The intersection analyzed under background conditions was reanalyzed under post development traffic conditions. A summary of the overall intersection performance is summarized in Tables 5.1 and 5.2
Table 5.1: Intersection Level of Service (HCM 2010) Post Development Traffic Analysis (2018)
2018 Background 2018 Post Development
EB WB NB SB Overall EB WB NB SB Overall
a.m. Peak Hour
LoS A B C B B B B C B C
v/c 0.09 0.27 0.63 0.48 0.64 0.10 0.29 0.76 0.51 0.76
p.m. Peak Hour
LoS A B B C B B B B C C
v/c 0.16 0.18 0.45 0.64 0.64 0.17 0.19 0.47 0.69 0.59
Note: EB = Eastbound; WB = Westbound; NB = Northbound; and SB = Southbound
Table 5.2: Intersection Level of Service (HCM 2010) Post Development Traffic Analysis (2023)
2023 Background 2023 Post Development
EB WB NB SB Overall EB WB NB SB Overall
a.m. Peak Hour
LoS B B C B C B B C B C
v/c 0.10 0.31 0.70 0.53 0.70 0.12 0.33 0.83 0.58 0.83
p.m. Peak Hour
LoS B B B C C B B C D C
v/c 0.19 0.20 0.51 0.74 0.74 0.19 0.21 0.54 0.79 0.79
As shown in the tables above, the study intersection of West 6th Avenue and Yukon Street is anticipated to continue
to operate well under post development traffic conditions. No improvements are necessary accommodate site
generated traffic.
6.0 SITE ACCESS
A single access will be provided to the underground parkade via the back lane. No access to the site from West 6th
Avenue and Yukon Street will be provided.
6.1 Site Access Performance
Based on the anticipated site traffic volumes, as show in the site plan, one inbound lane and one outbound lane should adequately serve the anticipated site traffic volumes.
6.2 Back Lane
The existing back lane is designated as a commercial lane as shown in Photo 6.1. The road geometry should be verified for the adequacy of providing site access from this lane. Upgrades such as repaving and changes to signage is recommended to support site access.

TRAFFIC IMPACT STUDY – WEST 6TH AVENUE, VANCOUVER
FILE: PTRN.VHWY03086-01 | SEPTEMBER 1, 2017 | ISSUED FOR USE
10
West 6th Traffic Study_IFU_rev1.docx
Photo 6.1: Back Lane from Yukon Street – facing west
7.0 PARKING
7.1 Proposed Parking Supply
The site will provide 298 parking stalls across five floors of underground parking. The proposed parking supply is summarized in Table 7.1.
Table 7.1: Proposed Parking Supply
Level Total Prov. HC Reg Small
P1 26 4 20 2
P2 67 4 50 13
P3 69 0 51 15
P4 69 0 51 15
P5 67 0 47 15
Total 298 8 219 71
7.2 Bylaw Requirements
A review of the proposed parking supply was undertaken to assess the extent to which the parking supply meets the requirements under the City of Vancouver Bylaw. The City requirements were based on Section 4.1.7 of the Off-Street Parking Space Regulations of the City of Vancouver’s Zoning Bylaw for the Mount Pleasant Industrial Area. The off-street parking requirements are summarized below.

TRAFFIC IMPACT STUDY – WEST 6TH AVENUE, VANCOUVER
FILE: PTRN.VHWY03086-01 | SEPTEMBER 1, 2017 | ISSUED FOR USE
11
West 6th Traffic Study_IFU_rev1.docx
At least one parking space for each 145 m2 of gross floor area for the first 290 m2 of gross floor area, and one additional space for each additional 70 m2 of gross floor area; and
Not more than one space for each 40 m2 of gross floor area.
Based on a total gross floor area of 15,947 m2 (14,413 m2 office, 1,533 m2 retail), the site requires a minimum of 226 stalls. The proposed parking supply of 307 stalls will exceed this requirement by 81 stalls.
7.3 Off-Street Bicycle Space Requirements
The number of spaces required for the off-street bicycles parking were calculated according to Section 6.2 of the City’s Parking Bylaw. Based on the bylaw, both the office and commercial component requires a minimum of one Class A space per 500 m2 of GFA. This translates to a total of 32 off-street bicycle parking spaces. Given that 40 stalls are proposed, no modifications are required to satisfy the bylaw requirements. The off-street bicycle parking requirements are summarized in Table 7.2.
Table 7.2: Bicycle Parking Requirements
Reg Retail Office
Bylaw 6.2.4.1,6.2.5.1 32 3 29
Provided 40
7.4 Loading Requirement
Section 5.2 of the City’s Parking Bylaw specifies the Class A and Class B off-street loading requirements for developments. Based on the bylaw, Class A spaces are at least 5.5 m long, 2.7 m wide, and 2.3 m high. Class B spaces are at least 8.5 m long, 3.0 m wide, and 3.8 m high. The Class A and Class B loading requirements for the proposed uses are as follows:
Retail:
Class A: Not required.
Class B: One space for the first 465 m2 gross floor area plus one space for any portion of the next 1 860 m2 and one additional space for each additional 2 325 m2.
Office Uses:
Class A: At least one space for 1,000 to 7,500 m2 of gross floor area; at least two spaces for more than 7,500 to 15,000 m2 of gross floor area; at least three spaces for more than 15,000 to 20,000 m2 of gross floor area; at least four spaces for more than 20,000 to 28,000 m2 of gross floor area; and at least one additional space for any portion of each additional 7 500 m2 of gross floor area.
Class B: At least one space for 500 to 5,000 m2 of gross floor area; at least two spaces for more than 5,000 to 10,000 m2 of gross floor area; at least three spaces for more than 10,000 to 28,000 m2 of gross floor area; and at least one additional space for any portion of each additional 15,000 m2 of gross floor area.

TRAFFIC IMPACT STUDY – WEST 6TH AVENUE, VANCOUVER
FILE: PTRN.VHWY03086-01 | SEPTEMBER 1, 2017 | ISSUED FOR USE
12
West 6th Traffic Study_IFU_rev1.docx
The above requirements are summarized in Table 7.3.
Table 7.3: Loading Space Requirements
Loading Required Class A Class B Class C
5.2.7 office use 2 3 -
5.2.5 retail - 2 -
Total 2 5 -
Provided 2 5
Based on the bylaw the development requires two Class A spaces and five Class B loading spaces. The proposed supply will satisfy this requirement.
8.0 CONCLUSIONS
Our conclusions and recommendations are as follows:
The site will be located at the northwest corner of the intersection of West 5th Avenue and Yukon Street. The property currently occupied by a collision repair shop.
The site is located within walking distance of the Olympic Village Canada Line Station. There are also a number of bus routes that service the site and its surrounding areas.
The intersection of West 6th Avenue and Yukon Street is anticipated to operate well under background traffic conditions. No improvements will be necessary through to the 2023 horizon year.
The site will comprise 17,453 ft2 of retail space and 158,767 ft2 of office space.
One site access will be provided from the back lane just north of West 6th Avenue. No access from West 6th
Avenue or Yukon Street will be provided.
Assuming a 40% reduction to account for the site proximity to transit, the site is anticipated to generate 159 vehicle trips in the a.m. peak hour and 181 vehicle trips in the p.m. peak hour.
The study intersection of West 6th Avenue and Yukon Street will continue to operate well under post development traffic conditions.
Based on the City’s bylaw, the site requires 226 off street parking spaces, 32 bike parking spaces, and 7 loading stalls. The proposed development will satisfy these requirements.
9.0 LIMITATIONS OF REPORT
This report and its contents are intended for the sole use of Cressey Developments and their agents. Tetra Tech Canada Inc. (operating as Tetra Tech) does not accept any responsibility for the accuracy of any of the data, the analysis, or the recommendations contained or referenced in the report when the report is used or relied upon by any Party other than Cressey Developments, or for any Project other than the proposed development at the subject site. Any such unauthorized use of this report is at the sole risk of the user. Use of this report is subject to the terms and conditions stated in Tetra Tech Canada Inc.’s Services Agreement. Tetra Tech’s General Conditions are provided in Appendix A of this report.

TRAFFIC IMPACT STUDY – WEST 6TH AVENUE, VANCOUVER
FILE: PTRN.VHWY03086-01 | SEPTEMBER 1, 2017 | ISSUED FOR USE
13
West 6th Traffic Study_IFU_rev1.docx
10.0 CLOSURE
We trust this report meets your present requirements. If you have any questions or comments, please contact the undersigned.
Respectfully submitted, Tetra Tech Canada Inc.
Prepared by:
Masrur Askar, M.Sc., P.Eng., PTOE
Senior Transportation Engineer
Northern Alberta Roads and Highways
Direct Line: 780.451.2130 x356
Prepared by: Reviewed by: Yutaka Tabata, E.I.T. Stephen Gardner, M.Sc. Transportation Engineer Principal Specialist Transportation Practice Transportation Practice Direct Line: 777.945.5726 Direct Line: 777.945.5713 [email protected] [email protected]
/sy
Attachments: Figures (3)
Appendix A – Tetra Tech’s General Conditions

TRAFFIC IMPACT STUDY – WEST 6TH AVENUE, VANCOUVER
FILE: PTRN.VHWY03086-01 | SEPTEMBER 2017 | ISSUED FOR USE
West 6th Traffic Study_IFU_rev1.docx
FIGURES
Figure 1 Site Location
Figure 2 Existing Road Network
Figure 3 Site Plan

NOTES CLIENT
PROJECT NO. DWN
OFFICE DATESTATUS
CKD APVD REV
LEGEND
SITE
Downtown Vancouver
City HallCanada Line Station
Olympic VillageCanada Line Station
Cam
bie
Bridge
Broadway St
Cam
bie
St
Main
St
West 6 Ave
West 7 Ave
tS
atre
blA
evA 22 tseW
Site Location
Figure 1704-TRN.VHWY3086 YT
July 2016EBA-VANC
SG SG 0
Base data: NTS
425 West 6th AveTraffic Analysis
Wolfe Road
daoR maharG
sseccA PHM
223(2
73)
2(4
)
508(4
26)
0(0
)
7(1)3(1)
0(1
2)
230(2
62)
2(5
)
507(4
17)
1(4)
1(8)
0(0
)
222(2
71)
8(5
)
503(4
21)
3(6)
0(0)
xyz (xyz)
=Friday p.m. Peak Hour Traffic Volumes=Saturday Peak Hour Traffic Volumes
Beta
Aven
ue
Alp
ha A
ven
ue
Willin
gd
on
Aven
ue
Dawson Street
Gilm
ore
Aven
ue
Highway 7
Beta
Aven
ue
Alp
ha A
ven
ue
Willin
gd
on
Aven
ue
Ro
sser
Aven
ue
Ro
sser
Aven
ue
Dawson Street
Mad
iso
n A
ven
ue
Mad
iso
n A
ven
ue
Gilm
ore
Aven
ue
Highway 7
SITE
Highway 7
Highway 1Highway 1Canada WayCanada Way
LEGENDBase data: NTS
ISSUED FOR USE
365(277)280(133)
2242(1
734)
273(5
37)
(18
08)1
293
(797)3
59
(968)1009(557)903
212(2
84)
1414(1
750)
(711
)801
(1395)1
172
West 6th Ave
Cam
bie
Str
eet
Yuko
n S
treet
8(11)107(61)19(27)
(10)13(36)18(47)12
73
(67
)1
91
(35
3)
7(1
6)
(83
)92
(18
5)2
42
(22
)23
N
West 5th Ave
SITE
LEGEND
XXX AM Peak Hour Traffic Volumes(XXX) PM Peak Hour Traffic Volumes
West 6th Ave
Cam
bie
Str
eet
Yuko
n S
treet
8(11)105(60)19(26)
(11)15(39)20(51)13
72
(66
)1
87
(34
6)
7(1
6)
(81
)90
(18
1)2
37
(22
)23
N
West 5th Ave
SITE
LEGEND
XXX AM Peak Hour Traffic Volumes(XXX) PM Peak Hour Traffic Volumes
West 6th Ave
Cam
bie
Str
eet
Yuko
n S
treet
9(11)116(66)21(29)
(11)14(39)20(51)13
79
(73
)2
06
(38
1)
8(1
8)
(89
)99
(19
9)2
61
(24
)25
N
West 5th Ave
SITE
LEGEND
XXX AM Peak Hour Traffic Volumes(XXX) PM Peak Hour Traffic Volumes
2023 BG
West 6th Ave
Cam
bie
Str
eet
Yuko
n S
treet
2(11)
(3)1
3(5
)8
(24
)1
(1)
(8)6
2
N
West 5th Ave
SITE
LEGEND
XXX AM Peak Hour Traffic Volumes(XXX) PM Peak Hour Traffic Volumes
SITE
(3)1
8(2
4)
1(1
)
(8)6
2
137(28)
(92
)22
SIT
E A
CC
ES
S
West 6th Ave
Cam
bie
Str
eet
Yuko
n S
treet
2(11)
(3)1
3(5
)8
(24
)1
(1)
(8)6
2
N
West 5th Ave
SITE
LEGEND
XXX AM Peak Hour Traffic Volumes(XXX) PM Peak Hour Traffic Volumes
2018 COMBINED
137(28)
(92
)22
SIT
E A
CC
ES
S
10(12)107(61)19(27)
(11)16(36)18(47)12
76
(72
)1
99
(37
7)
8(1
7)
(83
)92
(19
3)3
04
(22
)23
10(12)107(61)19(27)
(11)16(36)18(47)12
76
(72
)1
99
(37
7)
8(1
7)
(83
)92
(19
3)3
04
(22
)23
West 6th Ave
Cam
bie
Str
eet
Yuko
n S
treet
N
West 5th Ave
SITE
LEGEND
XXX AM Peak Hour Traffic Volumes(XXX) PM Peak Hour Traffic Volumes
2023 COMBINED
137(28)
(92
)22
SIT
E A
CC
ES
S
11(13)116(66)21(29)
(12)17(39)20(51)13
82
(78
)2
13
(40
5)
9(1
9)
(89
)99
(20
7)3
23
(24
)25
2017 BG
2018 BG
West 6 Ave
West 7 Ave
tS
atre
blA
evA 22 tseW
Cressey Developments
N
NOTES CLIENT
PROJECT NO. DWN
OFFICE DATESTATUS
CKD APVD REV
LEGEND
West 6 Ave
West 7 Ave
tS
atre
blA
evA 22 tseW
Existing Road Network
Figure 2704-TRN.VHWY3086 YT
July 2016EBA-VANC
SG SG 0
Base data: NTS
425 West 6th AveTraffic Analysis
Wolfe Road
daoR maharG
sseccA PHM
223(2
73)
2(4
)
508(4
26)
0(0
)
7(1)3(1)
0(1
2)
230(2
62)
2(5
)
507(4
17)
1(4)
1(8)
0(0
)
222(2
71)
8(5
)
503(4
21)
3(6)
0(0)
xyz (xyz)
=Friday p.m. Peak Hour Traffic Volumes=Saturday Peak Hour Traffic Volumes
Beta
Aven
ue
Alp
ha A
ven
ue
Willin
gd
on
Aven
ue
Dawson Street
Gilm
ore
Aven
ue
Highway 7
Beta
Aven
ue
Alp
ha A
ven
ue
Willin
gd
on
Aven
ue
Ro
sser
Aven
ue
Ro
sser
Aven
ue
Dawson Street
Mad
iso
n A
ven
ue
Mad
iso
n A
ven
ue
Gilm
ore
Aven
ue
Highway 7
SITE
Highway 7
Highway 1Highway 1Canada WayCanada Way
LEGENDBase data: NTS
ISSUED FOR USE
365(277)280(133)
2242(1
734)
273(5
37)
(18
08)1
293
(797)3
59
(968)1009(557)903
212(2
84)
1414(1
750)
(711
)801
(1395)1
172
West 6th Ave
Cam
bie
Str
eet
Yuko
n S
treet
8(11)107(61)19(27)
(10)13(36)18(47)12
73
(67
)1
91
(35
3)
7(1
6)
(83
)92
(18
5)2
42
(22
)23
N
West 5th Ave
SITE
LEGEND
XXX AM Peak Hour Traffic Volumes(XXX) PM Peak Hour Traffic Volumes
West 6th Ave
Cam
bie
Str
eet
Yuko
n S
treet
8(11)105(60)19(26)
(11)15(39)20(51)13
72
(66
)1
87
(34
6)
7(1
6)
(81
)90
(18
1)2
37
(22
)23
N
West 5th Ave
SITE
LEGEND
XXX AM Peak Hour Traffic Volumes(XXX) PM Peak Hour Traffic Volumes
West 6th Ave
Cam
bie
Str
eet
Yuko
n S
treet
9(11)116(66)21(29)
(11)14(39)20(51)13
79
(73
)2
06
(38
1)
8(1
8)
(89
)99
(19
9)2
61
(24
)25
N
West 5th Ave
SITE
LEGEND
XXX AM Peak Hour Traffic Volumes(XXX) PM Peak Hour Traffic Volumes
2023 BG
West 6th Ave
Cam
bie
Str
eet
Yuko
n S
treet
2(11)
(3)1
3(5
)8
(24
)1
(1)
(8)6
2
N
West 5th Ave
SITE
LEGEND
XXX AM Peak Hour Traffic Volumes(XXX) PM Peak Hour Traffic Volumes
SITE
(3)1
8(2
4)
1(1
)
(8)6
2
137(28)
(92
)22
SIT
E A
CC
ES
S
West 6th Ave
Cam
bie
Str
eet
Yuko
n S
treet
2(11)
(3)1
3(5
)8
(24
)1
(1)
(8)6
2
N
West 5th Ave
SITE
LEGEND
XXX AM Peak Hour Traffic Volumes(XXX) PM Peak Hour Traffic Volumes
2018 COMBINED
137(28)
(92
)22
SIT
E A
CC
ES
S
10(12)107(61)19(27)
(11)16(36)18(47)12
76
(72
)1
99
(37
7)
8(1
7)
(83
)92
(19
3)3
04
(22
)23
10(12)107(61)19(27)
(11)16(36)18(47)12
76
(72
)1
99
(37
7)
8(1
7)
(83
)92
(19
3)3
04
(22
)23
West 6th Ave
Cam
bie
Str
eet
Yuko
n S
treet
N
West 5th Ave
SITE
LEGEND
XXX AM Peak Hour Traffic Volumes(XXX) PM Peak Hour Traffic Volumes
2023 COMBINED
137(28)
(92
)22
SIT
E A
CC
ES
S
11(13)116(66)21(29)
(12)17(39)20(51)13
82
(78
)2
13
(40
5)
9(1
9)
(89
)99
(20
7)3
23
(24
)25
2017 BG
2018 BG
West 6 Ave
West 7 Ave
tS
atre
blA
evA 22 tseW
SITE
Cressey Developments
N

NOTES CLIENT
PROJECT NO. DWN
OFFICE DATESTATUS
CKD APVD REV
Site Plan
Figure 3YT
August 2017 EBA-Vancouver
SG SG 0
LEGEND 425 West 6th AveTraffic Analysis
Cressey Developments
Bow Lake Picnic Area
Icefie
lds P
arkw
ay
704-TRN.VHWY3086

TRAFFIC IMPACT STUDY – WEST 6TH AVENUE, VANCOUVER
FILE: PTRN.VHWY03086-01 | SEPTEMBER 2017 | ISSUED FOR USE
West 6th Traffic Study_IFU_rev1.docx
APPENDIX A
TETRA TECH’S GENERAL CONDITIONS
1
GENERAL CONDITIONS
TRAFFIC / TRANSPORTATION REPORT
This report incorporates and is subject to these “General Conditions”.
1.1 USE OF REPORT AND OWNERSHIP
This Traffic/Transportation Report pertains to a specific site, a specific development, and a specific scope of work. The Traffic/Transportation Report may include plans, drawings, profiles and other support documents that collectively constitute the Traffic/Transportation Report. The Report and all supporting documents are intended for the sole use of TETRA TECH’s Client. TETRA TECH does not accept any responsibility for the accuracy of any of the data, analyses or other contents of the Traffic/Transportation Report when it is used or relied upon by any party other than TETRA TECH’s Client, unless authorized in writing by TETRA TECH. Any unauthorized use of the Traffic/Transportation Report is at the sole risk of the user.
All reports, plans, and data generated by TETRA TECH during the performance of the work and other documents prepared by TETRA TECH are considered its professional work product and shall remain the copyright property of TETRA TECH.
1.2 ALTERNATIVE REPORT FORMAT
Where TETRA TECH submits both electronic file and hard copy versions of reports, drawings and other project-related documents and deliverables (collectively termed TETRA TECH’s instruments of professional service), only the signed and/or sealed versions shall be considered final and legally binding. The original signed and/or sealed version archived by TETRA TECH shall be deemed to be the original for the Project.
Both electronic file and hard copy versions of TETRA TECH’s instruments of professional service shall not, under any circumstances, no matter who owns or uses them, be altered by any party except TETRA TECH. TETRA TECH’s instruments of professional service will be used only and exactly as submitted by TETRA TECH.
Electronic files submitted by TETRA TECH have been prepared and submitted using specific software and hardware systems. TETRA TECH makes no representation about the compatibility of these files with the Client’s current or future software and hardware systems.
1.1 INFORMATION PROVIDED TO TETRA TECH BY OTHERS
During the performance of the work and the preparation of the report, TETRA TECH may rely on information provided by persons other than the Client. While TETRA TECH endeavours to verify the accuracy of such information when instructed to do so by the Client, TETRA TECH accepts no responsibility for the accuracy or the reliability of such information which may affect the report.