sept 2015 - bnktrinity.files.wordpress.com gujarat 2010 1.25 satara, maharashtra 2011 2.0 sangli,...
TRANSCRIPT

Management Presentation Sept 2015

Safe Harbour
2
This presentation and the accompanying slides (the “Presentation”), which have been prepared by Sarla Performance Fibers Ltd. (the “Company”), have been prepared solely for information purposes and do not constitute any offer, recommendation or invitation to purchase or subscribe for any securities, and shall not form the basis or be relied on in connection with any contract or binding commitment whatsoever. No offering of securities of the Company will be made except by means of a statutory offering document containing detailed information about the Company.
This Presentation has been prepared by the Company based on information and data which the Company considers reliable, but the Company makes no representation or warranty, express or implied, whatsoever, and no reliance shall be placed on, the truth, accuracy, completeness, fairness and reasonableness of the contents of this Presentation. This Presentation may not be all inclusive and may not contain all of the information that you may consider material. Any liability in respect of the contents of, or any omission from, this Presentation is expressly excluded.
Certain matters discussed in this Presentation may contain statements regarding the Company’s market opportunity and business prospects that are individually and collectively forward-looking statements. Such forward-looking statements are not guarantees of future performance and are subject to known and unknown risks, uncertainties and assumptions that are difficult to predict. These risks and uncertainties include, but are not limited to, the performance of the Indian economy and of the economies of various international markets, the performance of the tire industry in India and world-wide, competition, the company’s ability to successfully implement its strategy, the Company’s future levels of growth and expansion, technological implementation, changes and advancements, changes in revenue, income or cash flows, the Company’s market preferences and its exposure to market risks, as well as other risks. The Company’s actual results, levels of activity, performance or achievements could differ materially and adversely from results expressed in or implied by this Presentation. The Company assumes no obligation to update any forward-looking information contained in this Presentation. Any forward-looking statements and projections made by third parties included in this Presentation are not adopted by the Company and the Company is not responsible for such third party statements and projections.

Table Of Contents
Company Overview
India Operations
Overseas Operations
Growth Plans
Financials
3

Table Of Contents
Company Overview
India Operations
Overseas Operations
Growth Plans
Financials
4

Background
Brief Highlights
5
Presence Financials
Commenced operations in 1995 as a manufacturer of commodity yarns
Progressed to specialized and higher value added yarns
100% EOU:
Focus on high margin specialty polyester & nylon yarns
Products application:
Narrow Fabrics, Hosiery, Innerwear & Sportswear
Threads
Industrial Yarns
Nylon 66:
Pilot plant set up at Silvassa facility
India:
Silvassa: 2 manufacturing facilities; capacity 11,900 TPA
Vapi: In-house dyeing plant Capacity 3,200 TPA
Wind mills with capacities in Satara (2MW), Sangli (4MW) & Vapi (1.25 MW)
USA:
Plant set up in South Carolina in 2013; capacity 30 tons per day
Europe & South America:
Marketing offices in Portugal commenced in 2009
Last 10 years CAGR:
Revenue: 13%
EBITDA: 15%
PAT: 15%
~18% EBITDA margin consistently
Operating cash flows prudently deployed back into the business
For enhanced productivity and efficiency

Key Milestones
6
1997
2004
2007
2013
2009
2006
1999
1996
2016
Setup 100% US subsidiary - SarlaFlex LLC,(South Carolina) for the markets of USA and neighbouring countries Pilot Plant for Nylon 66 high tenacity yarn
Established an in-house dyeing plant in Vapi broadening the product offering to dyed yarns.
Started with value added products : Air Covered, Rubber/Spandex Yarns
1st overseas JV Savitex S.A. de C.V. in Honduras, Central America
Established Marketing subsidiary in Portugal, Sarla Europe LDA
SarlaFlex LLC commenced operations
Expanded Capacity by adding 2 new building units at Silvassa
Started as a 100% Export Oriented Unit (EOU) & Manufacturing unit at Silvassa for Polyester Textured, Twisted Yarn
Established 2nd manufacturing unit in Silvassa to house increasing production capacities
Introduced 2nd core product : Nylon Textured, Twisted and Dyed Yarn
1995
2005 High Tenacity Yarn Nylon 6 manufacturing unit started in Silvassa
2015 Raised Rs. 466.9 mn by Placing Equity Shares at premium of Qualified Institutional Buyers (QIBs)
2014
Liquid Assets of the Company crossed Rs. 1 bn Mark

Management Team
7
Mr. Mahendra Sheth CFO & Company Secretary
FCA, ACS, B Com and LLB from University of Mumbai 35 years of experience in the field of Accounts, Finance & Secretarial
Ms. Neha Jhunjhunwala Director
BMS from University of Mumbai & Master’s in Marketing & Strategy from University of Warwick, London
Currently involved in managing Business Development, Operations & HRD
Commerce graduate with more than 50 years of experience in cotton trading
Has been president of Bombay Cotton Merchants and Muccadams Association, Western Indian Chambers of Commerce and also the director of East India Cotton Association
Commerce Graduate from University of Mumbai with more than 25 years of experience in textile industry
Engaged in all aspects of Production, Planning, Marketing & Operations
Actively participates in the key financial decisions of the Company
Madhusudan Jhunjhunwala
Chairman & Whole Time
Director
Krishnakumar Jhunjhunwala
Managing Director & CEO

Shareholding Pattern
Shareholding as at September 2015
8
Promoters, 55.20% FII, 1.16%
DIIs, 15.87%
Public & Others, 27.77%

Organisation Structure
9
Board of Directors
Plant Head VP
(Sales) VP (Purchases) Admin/Legal CFO
HR Manager
Others*
MD/CEO
Heads Quality Control
Asst. Manager
Export Manager
Excise and Other
Manager Accounts
Manager Secretarial
Dispatch & Store Head
Dyeing Head, Twisting Head, Texturizing Head
Sales Manager
In charge of Overseas Subsidiaries

Overview Of Key Subsidiaries
10
SARLA PERFORMANCE
FIBERS LTD.
Sarla Overseas Holdings Ltd.
(SOHL) Sarla Flex INC, USA
Sarla Flex LLC
Sarla Europe LDA
Sarla Tekstil Filament Sanayi Ve Tic
MRK S.A. De C.V.
M/S Savitex S.A. De C.V.
Manufacturing POY from polyester chips, texturising & twisting
Manufacture of Dyed Yarn
Manufacturer of Nylon & Polyester Rubber / Lycra / Spandex Covered Yarn
Marketing Operations for Europe & South America Markets
Manufacturer of Polyester Textured Yarn, Twisted Yarn & Dyed Yarn
Note:- Management is in the process of winding up the JVs present in Honduras * Sarla’s share of the business
100% 100%
100% 60% *
45%*
40%*
33%*

Key Products
11
Bulklon
Sewing Thread, Furniture
Upholstery, Automotive
Upholstery, Narrow Fabrics and Tapes, Circular and Flat Knitted products
Narrow Fabrics and
Hosiery applications
Active Wear, Swim Wear, Narrow Fabrics, Tapes,
Hosiery, Undergarments,
Furniture Upholstery, Automotive Upholstery
Apparel, Swim wear, Lingerie, Fleece Goods,
Towels & Washcloths, Table Cloths,
Placemats, Sheets & Pillow Cases
POY (Partially Oriented Yarn) Lycra Spandex Rubber
Chips FDY (Fully
Drawn Yarn)
Silvassa South Carolina, USA
Narrow tapes, Hosiery, Lingerie,
Seamless Knit wear, Medical
Bandages, Knitted and Denim
fabrics
Automotive seat belts & trims,
air bags, upholstery, dress, casual &
athletic footwear, leather
goods, soft luggage
Key Raw Material
Location
End User
Industry
Textured Nylon Stretch Yarns
Textured Polyester Yarn
Textured Sewing Thread
Covered Yarn High Tenacity
Yarn

Covered Yarn 7%
High Tenacity Nylon, 8%
High Tenacity Polyester, 2%
Texturised Nylon, 15%
Twisted Nylon, 4%
Texturised Polyester 49%
Twisted Polyester, 15%
Fully Drawn Yarn, 0%
Product Mix (By Value)
Revenue Mix
Covered Yarn 11%
High Tenacity Nylon 9%
High Tenacity Polyester, 1%
Texturised Nylon 18% Twisted
Nylon 7%
Texturised Polyester
34%
Twisted Polyester
20%
Product Mix (By Volume)
Figures in INR 2013 2014 2015
Texturised Nylon 315 328 322
Twisted Nylon 375 425 392
Texturised Polyester 184 192 197
Fully Drawn Yarn - 368 370
Covered Yarn 7% High Tenacity
Nylon, 6%
High Tenacity Polyester, 1%
Texturised Nylon, 15%
Twisted Nylon, 4%
Texturised Polyester
46%
Twisted Polyester,
21%
Fully Drawn Yarn, 0%
2014 2015
The product mix has moved in favour of products (Texturised & Twisted Polyester and Nylon),
having higher realisation
Realisation per Kg.
12

Manufacturing Facility – India
Facility
2 Manufacturing facilities located in Silvassa, next to each other
Total Installed capacity – 11,900 TPA
Highlights
Product Offerings
Textured Polyester Yarns
Bulkon
Textured Nylon Stretch Yarns
Textured Sewing Thread
Covered Yarns
High Tenacity Yarns
In-house Dyeing facility at Vapi
Installed capacity – 3,200 TPA
Manufacturing Dyeing
Increased product offering to Dyed yarns
Large scale expansion, upgradation & modernisation undertaken in 2010
Being only 12 km from Silvassa facilitates movement of goods to quickly cater to customer orders
13

India Facility – Silvassa
External View of the Plant
Plant & Machinery
14

India Facility – Vapi
External View of the Plant
Plant & Machinery
15

Manufacturing Facility – Overseas
Manufacturing –South Carolina, USA
Manufacturing unit in Charleston, South Carolina which manufactures POY (Partially Oriented Yarn), Textured Polyester Yarn and Twisted Yarn
Total Installed capacity – POY and Textured Polyester Yarn 9,900 TPA each and Twisted Yarn 4,400 TPA
Phase I of project completed in December 2013 with a capital investment of USD 13.8 million
First Indian Textile company to set up a facility in the US
Product offering expanded into furnishings, automotive and industrial markets
This move is taken on the motive of CAFTA/NAFTA laws which are in favour of companies having manufacturing units set up in the region
Exporting to North and Central American countries is viable only for companies manufacturing in the region as they are waived off duties to the extent of 32%
H1FY15 H1 FY16
Production (lbs.)
Partially Oriented Yarn* 2,895,480 2,982,194
Textured Polyester Yarn 3,159,657 2,862,071
Twisted Yarn 2,165,158 929,555
Sales (lbs.)
Partially Oriented Yarn 204,651 50,083
Textured Polyester Yarn 1,009,070 1,285,941
Twisted Yarn 1,610,851 1,360,434
Sales (INR million)
Partially Oriented Yarn 0.01 0.01
Textured Polyester Yarn 14 18
Twisted Yarn 14 24
Charleston South Carolina
16

US Facility
External View of the Plant
Plant & Machinery
17

Table Of Contents
Company Overview
India Operations
Overseas Operations
Growth Plans
Financials
18

High-End Application products produced in India
19
Raw Materials Processes & Products Applications
Polyster POY
Nylon POY
Nylon Chips
High Tenacity Polyester Nylon 6
Texturising
Twisting
Extrusion
Twisting
Texturised Yarn
Twisted Yarn
Fully Drawn Yarn
Nylon 6 & Nylon 66
High Tenacity Nylon & Polyester
Lycra/ Spandex/ Rubber, Texturised Polyester / Nylon
Covering Covered Yarn
Threads, Hosiery, Elastics, Medical Bandages
Parachutes, Shoes, Seat Belts and Car Airbags
Fishing Nets, Twines ,Filter Fabrics & Industrial
Applications
Socks, Hosiery, Elastics, Innerwears

Facility Highlights • 2 facilities next to each other • Installed Capacity of 11,900 TPA • Can produce 250 different
varieties of Polyester & Nylon Yarn
Product Offering • Textured Polyester Yarn • Bulklon • Textured Nylon Stretch Yarns • Covered Yarns • High Tenacity Yarns
Manufacturing Facility - India
20
Silvassa Vapi
Facility Highlights • In-house dyeing facility • Installed Capacity of 3,200 TPA • State of the art technology • Computer shading matching and
developing new colours
Highlights • Increased product offering to
Dyed Yarn • Expansion, upgradation &
modernisation undertaken in 2010
12 KM distance between facilities

Wind Power Business
21
Efficient Wind Power Operations
Place Year Of
Commissioning Capacity (in MW)
Baradiya, Gujarat 2010 1.25
Satara, Maharashtra 2011 2.0
Sangli, Maharashtra 2012 4.0
Total Installed Capacity 7.25
Captive Use for Dyeing facility in Vapi
Agreement for Power Procurement with
private entities
• Increased utilization of wind turbines & sale of renewable energy certificates benefiting Power income
• Limited CAPEX requirement makes it a cash positive business
• CAPEX per MW ~Rs.6 crores
• Current plant load factor at ~23-25%
Profitable Wind Power Business
The Company has taken ECB loans for windmill projects. Exclusive charge of the windmill to the lending banks.
Funding

Table Of Contents
Company Overview
India Operations
Overseas Operations
Growth Plans
Financials
22

Overseas Subsidiaries
23
Entered in joint venture in 2009
Operates as a marketing subsidiary in Portugal
Services the customer requirements of European & South American Region
Entered in joint venture in 2010
Located at gateway to Europe catering to Turkish & European Markets
Subsidiary of the company -Sarla Performance Fibers Ltd
In 2013, SPFL entered US markets through SarlaFlex LLC
Installed capacity of 9,900 TPA for POY and 4,400 TPA for Twisted Yarn
Duty free benefits on goods manufactured inside the US as per NAFTA & CAFTA
Sarla Europe LDA, Portugal
Sarla Tekstil, Turkey
SarlaFlex LLC, USA Sarla Overseas Holdings Ltd. (SOHL)
60% 45% 100%

Manufacturing Facility - USA
24
Charleston, South Carolina
Highlights
Benefits
Current Capacity of 9,900 TPA
Commenced Production in Dec 2013
Products: Partially Oriented Yarn (POY) & Textured Polyester Yarn
First POY plant in USA since 1998
NAFTA & CAFTA treaties, allows waiver of duties upto 32% on synthetic garments manufactured in North or Central American region using US origin yarn when exported back into the United States
Proximity & Visibility to customers
Lower Logistics & Power
Lower Cost of Borrowing
Facility Details:
Land Cost of Rs 4 Crores to be paid over 7 years
Spread over 42 acres
Constructed area of 3.3 lakh sqft
USA: Strategic Location
~99% of the decision makers of textile industry with global brand presence are in the USA
Presence in USA builds confidence & helps develop business with large customers
Sarla is the only player in this sector to have manufacturing presence in USA & India
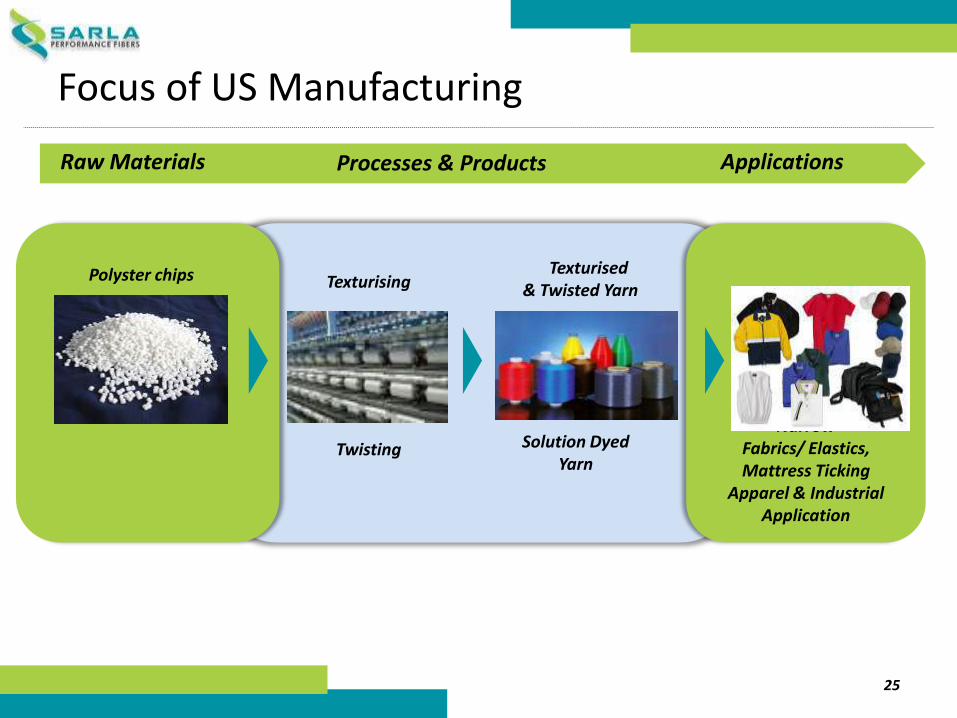
Threads, Hosiery , Narrow
Fabrics/ Elastics, Mattress Ticking
Apparel & Industrial Application
Focus of US Manufacturing
25
Polyster chips Texturising
Twisting
Texturised & Twisted Yarn
Solution Dyed Yarn
Raw Materials Processes & Products Applications

Opportunity in US Market
26
Higher realization
Greater visibility
Duty waiver
Demand boost
Competitive edge in the US
Legal restrictions As per NAFTA & CAFTA laws, American apparel companies can source
goods from US based manufacturers if they want their garment to have duty free access in the US market
Exporting to North and Central American countries is viable only for companies manufacturing locally in the regions as they are waved off duties to the extent of 35%
Sarla expects to gain tremendous impetus after operations stabilize and with a strong demand & marketing initiatives in place
Proximity and visibility to customer is expected to contribute significantly towards expanding and deepening customer relationships
Exporting low duty goods from India and manufacturing high duty goods in the US giving them a competitive edge
1 2 3 4 5
US Prices are 55 -70% higher than in Asia / Far East which enhances the profitability margins 6

Fiber Prices
Figures in Cents/ Kg. Jul-13 Sep-14 Sep-15
Polyester Fiber Prices
Asia / Far East
75 den textured 188-196 178-182 132-143
150 den textured 165-170 156-161 115-125
USA
70 den textured 322-366 140-163 127-151
150 den textured 282-317 122-141 112-130
West Europe
167 dtex texured 215-263 204-245 171-199
Nylon Fiber Prices
Asia / Far East
70 den 340-355 320-333 245-250
USA
40 den 785-807 365-380 365-380
70-200 den 597-762 260-340 245-315
For Polyester, the realisations in US and Europe are ~ 50 -70% higher than in India
For Nylon, the realisations in US and Europe are ~ 80-120% higher than in India
Source : PCI Fibres Report July 2014 27

Favourable Cost Structure in the US
Cost Component Unit India US Remarks
Raw Material % of Sales > 60% < 50% Raw Material cost as a % of sales is
lower in the US than in India
Labour $ / hr 1.5 15 Labour costs are higher in the US
than in India *
Electricity Rs. / Kwh 5 2.5 Electricity costs in the US are 50%
of the cost in India
Borrowing Cost % 13-15% p.a. 3-5%p.a. Borrowing cost in the US is one-
third of the cost in India
* Although labor costs are higher in the US, the high level of automation in the US facility will reduce the intensity of labour by over 30%
The savings in cost of raw materials, electricity and borrowing cost along with higher realisations in the US would result in higher profitability and return ratios. This will in turn be the key driver of the overall
profitability going forward
Source : Company 28

Global Presence
29

Table Of Contents
Company Overview
India Operations
Overseas Operations
Growth Plans
Financials
30

Growth Drivers
Optimization of US facility by increasing current capacity utilisation from the ~30% to
100% going forward
Expand the Installed capacity of the Partially Oriented Yarn from the current 9,900 TPA to
18,150 TPA by 2017
Set up manufacturing capability of Fully Drawn Yarn with an initial installed capacity of
1,980 TPA and gradually increase it to 3,960 TPA by 2017
Expansion of the Nylon 66 capacity at Silvassa from the current 1.5 TPD to 6 TPD with an
incremental capex of ~ INR 100 million
Cater to sectors like Automobiles which requires enhanced applications of specialised
yarn in headliners and others
Targeting an increased wallet share from the existing customers
31

Nylon 6,6 in India – to breakthorugh with existing key customers and replace
current imports into India
Uniquely positioned to gain market share in both Polyester and Nylon fibers
through its global business strategy and product offering
Growing opportunity in the South American market through Portugal
subsidiary
Investments made to manufacture new products in India and US to cater to
the growing demand
With the prevalence of Technical Textiles for Industrial applications in India, the
demand drivers for company’s product would get further strengthened in next
few years
Opportunity in Other markets & India
32

US Facility – Expansion Plan
33
Further Expansion Of South Carolina Facility
Current capacity Capacity by 2017
Facility will directly cater to clients in North, South & Central American markets
POY
• The total cost of the project is USD~ 25 mn
• Cost of Phase I already incurred
9,900 TPA ~18,000 TPA
Expansion
Total
~11
Phase I
~25
Phase II
~14
Cost of Project (USD Million)
New Product addition – Flat Yarn
Any Further Update?

New Products – Nylon 66
Commenced trials production of Nylon 66 yarn at Silvassa in 2013 on pilot basis
Nylon 66 is high tenacity and lower shrinkage yarn product
Being a niche product on its own, extremely specialized hence margins are substantially higher
Product applications:
Parachutes, Shoes, Seat Belts & Car Airbags, Specialized Sewing Applications in Automotive, Shoes, Leather, Industrial Filters, Hoses
Installed Capacity of 450 TPA at a pilot stage in Silvassa
34
Only company in India to “manufacture” Nylon 66
End User Industries
Seat Belts
Parachutes
Filter Fabric
Air Bags
Sports Shoes

Entry Barriers
35
Yarn constitutes ~5% to total cost of final product; however a very crucial product, hence Premium paid for Quality & Consistency desired by Large Global Customers
Over 150 varieties of moulds
Moulds form an integral part of the final product
These are designed as per clients specifications to fit the varied machinery used by them in their plants in different geographies
Clients Stickiness towards Quality & Goodwill
Global brands demand consistent quality products across markets
Major overseas clients with long standing relationship built over the years
Multi Geography Presence
Only Indian company in the sector to have manufacturing presence in NAFTA & CAFTA regions
Manufacturing operations in US & India and Marketing offices in South America & Europe

Key Strengths
36
Consistent quality & wide range of products provided to customers across the geographies
Over 150 moulds based on specifications provided by customers
Focused on High Margin value added products: Specialised Polyester and Nylon Yarns
Amongst a few players globally catering to Specialised Yarns – Used in a variety of niche applications
One of the Largest Manufacturers of Covered Yarn in India
Effectively positioned to be a preferred supplier to global manufacturers in Eastern and Western Hemisphere
Only Indian company in this sector to have manufacturing presence in NAFTA and CAFTA regions
Manufacturing & Distribution hub in close proximity to demand centres globally
Extremely low leverage – India Textile business has ‘Zero‘ Long Term Debt
QIP raised 46.7 crores in 2014
Liquid Assets of Over Rs. 100 crores
Strong Balance Sheet
Product Innovations & Quality
Relationships with brands like Hanes Brands, Gildan, Renfro, American & Efird, Delta Galil, Coats & Jockey
Manufacturing presence in USA gives confidence to most of the major customers based out of USA
Strong Relationship with Worlds Largest Brands globally

Table Of Contents
Company Overview
India Operations
Overseas Operations
Growth Plans
Financials
37

38
Q2 FY2016 Highlights
Revenue of Rs. 816 mn, YoY growth of 2%
Revenue excluding US Operations were at Rs. 681 mn
Gross Profit of Rs. 518 mn, margin 65%
EBITDA of Rs. 234 mn, margin of 28%, impacted due to:
Capacity Utilization for the US Operations in the range of 30-35%
PAT of Rs.132 mn, YoY growth of 31%
PAT excluding US Operations at Rs. 210 mn
Cash PAT of Rs. 171 mn margin of 21%

Profitability Statement
39
Rs. In Millions Q2 FY16 Q2 FY15 YoY H1FY16 H1FY15 YoY
Revenues 816 801 1.82% 1616 1622 -0.43%
Raw Material 330 410 701 870
Manpower Cost 56 64 109 131
Other Operating Expenses 227 198 430 389
EBITDA 234 133 76% 422 272 55%
EBITDA Margin 29% 17% 26% 17%
Other Income 31 52 46 68
Depreciation 39 40 77 80
Interest 14 11 28 22
PBT 182 81 124% 316 171 84%
Tax 50 34 84 60
PAT 132 47 180% 232 111 109%
PAT Margin 16% 6% 14% 7%
Cash PAT 171 88 94% 310 191 62%
Cash PAT Margin 21% 11% 19% 11%

Consolidated Performance Highlights H1 FY16
40
801 816
Q2FY2016 Q2FY2015
+1.82%
Revenue EBITDA Cash PAT
Rs. in Million
133
234
Q2FY2015 Q2FY2016
+76.00%
88 171
+94.0%
Q2FY2016 Q2FY2015
1,622 1,616
2016 2015
-0.43%
Revenue EBITDA Cash PAT
237 422
+55.00%
2015 2016
191 310
2015
2016
+61.73%

Performance of US Operations H1 FY16
41
110 160
+46%
Q2FY2016 Q2FY2015
Revenue EBITDA Cash PAT
Rs. in Million
22
Q2FY2016 Q2FY2015
20
Q2FY2015 Q2FY2016
219 309
2016 2015
+40.60%
Revenue EBITDA Cash PAT
44
2016 2015
40
2016 2015

Consolidated P&L Statement
Figures in INR million FY11 FY12 FY13 FY14 FY15 1HFY16
Net Sales / Income from Operations 1,930 2,336 2,587 2,618 3,120 1,616
Growth 24.3% 21.0% 10.7% 1.2% 19.2% -0.4%*
EBITDA 359 345 476 467 496 376
EBITDA Margin (%) 16.1% 14.8% 18.4% 17.8% 15.9% 23.2%
Finance Charges (Net) 19 30 43 69 64 29
Depreciation 66 80 82 110 145 77
Profit Before Tax (PBT) 274 235 350 323 404 316
PBT Margin (%) 14.2% 10.5% 13.5% 12.3% 12.9% 19.6%
Provision for Taxes 49 46 71 100 123 84
Profit After Tax (PAT) 225 189 280 223 280 232
PAT (%) 11.7% 8.4% 10.8% 9.1% 9.0% 14.4%
Earning Per Share 32.42 27.22 40.25 39.93 36.93 27.84
Rounded off to the nearest million *over 1HFY15 42

Consolidated Balance Sheet
Figures in INR million FY11 FY12 FY13 FY14 FY15 1HFY16
(A) LIABILITIES
Shareholder’s funds
a) Capital 70 70 70 70 84 84
b) Reserves & Surplus 1,013 1,175 1,355 1,622 2,214 2,384
Shareholder's Funds 1,083 1,244 1,425 1,692 2,298 2,468
Loan Funds 457 624 1,048 2,033 2,375 2,524
Deferred Tax Liability 92 113 140 151 142 142
TOTAL LIABILITIES 1,632 1,981 2,612 3,876 4,815 5,134
(B) ASSETS
Fixed Assets 779 823 1,287 1,970 1,893 1,903
Investments - 15 28 548 576 769
Total Current Assets 1,270 1,566 1,768 2,116 3,108 3,402
Less : Current Liabilities 416 423 471 758 762 940
Net Current Assets 853 1,143 1,297 1,358 2,346 2,462
TOTAL ASSETS 1,632 1,981 2,612 3,876 4,815 5,134
43 Rounded off to the nearest million

Ratio Analysis
44
Key Ratios FY12 FY13 FY14 FY15 1HFY16
Debt-Equity Ratio 0.52 0.80 1.38 1.13 1.11
Long Term Debt-Equity Ratio 0.08 0.31 0.94 0.60 0.72
Current Ratio 1.56 1.53 1.50 1.49 1.70
Fixed Assets Ratio * 1.87 1.86 1.27 1.19 1.19
Inventory Ratio * 4.31 4.47 3.37 4.18 3.53
Debtors Ratio * 3.7 4.43 3.91 4.16 3.77
Interest Cover Ratio 7.9 8.06 6.50 7.35 12.10
PBIDTM (%) 14.77 18.40 20.54 18.94 26.10
PBITM (%) 11.33 15.22 16.48 14.46 21.32
PBDTM (%) 13.5 16.72 18.01 16.95 24.33
ROCE (%) * 15.72 17.47 13.53 10.51 10.31
RONW (%) * 16.25 20.96 17.81 14.00 19.45
Debtors Velocity (Days) * 99 80 93 88 97
Creditors Velocity (Days) * 78 40 67 73 85
* Annualised for FY16

Financials – Growth Story
45
2,227 2,587 2,629
3,168 3,231
+13%
2015 2014 2013 2012 2016*
332
468 478 544 843
2014 2012 2013
+15%
2015 2016*
189
280 321 209
463
2012 2015 2014
2013
1,244 1,425 1,692
2,297 2,699
2015 2013 2012 2014
+18%
Revenues EBITDA
Profit After Tax Networth
Rs. in Million *2016 Figures are Annualised
+15%
2016* 2016*

Working Capital Profile for H1 FY16
46
87 103
2015 2016
73 85
2015 2016
88 97
2015 2016
Inventory Days Creditor Days
Debtor Days Net Working Capital Days
102 115
2015 2016

Future Box
Cost of Project USD million Phase I Phase II Total Land 0.80 - 0.80 Building 1.00 1.00 2.00 Plant & Machinery 9.40 9.25 18.65 Total Plant & Machinery 11.20 10.25 21.45 Pre-Operative Expenses 1.10 2.00 3.10 Working Capital 1.50 5.00 6.50 Total Current Assets 2.60 7.00 9.60 Total Cost of Project 13.80 17.25 31.05
The Company plans to expand the Installed capacity of the Partially Oriented Yarn from the current 9,900 TPA to 18,150 TPA by 2017
It plans to set up manufacturing capability of Fully Drawn Yarn with an initial installed capacity of 1,980 TPA and gradually increase it to 3,960 TPA by 2017
Planned capex cost (revised) of Phase 2 is USD 17.25 million
Plant will directly cater to our clients in the North, South and Central America markets
Phase 2 - Expansion of Manufacturing facility – South Carolina, USA
The total cost projected is USD 31 million.
Cost for Phase 1 has already been incurred
Source : Annual Reports 47

Clientele
Customers
48

Figures in INR million Mar-13 % Mar-14 % Mar-15 % Relationship
179 7% 221 8% 234 8% 5 to 10 Years
180 7% 189 7% 198 7% > 10 Years
105 4% 153 6% 182 6% > 10 Years
127 5% 117 4% 107 4% < 5 Years
70 3% 108 4% 105 3.5% 5 to 10 Years
Total Contribution to Revenue 787 26% 787 29% 826 26%
Client Concentration & Tenor (1/2)
Revenue contribution by the TOP 5 customers in 2014
49

Client Concentration & Tenor (2/2)
Figures in INR million FY13 % FY14 % FY15 % Relationship
179 7% 221 8% 234 8% 5 to 10 Years
180 7% 189 7% 198 7% > 10 Years
105 4% 153 6% 182 6% > 10 Years
127 5% 117 4% 108 4% < 5 Years
70 3% 108 4% 105 4% 5 to 10 Years
299 12% 93 3% 78 3% 5 to 10 Years
29 1% 73 3% 104 3% < 5 Years
Regal Elastics 62 2% 62 2% 50 2% 5 to 10 Years
38 1% 59 2% 44 2% > 10 Years
31 1% 54 2% 42 1% < 5 Years
Total Contribution to Revenue 1,120 43% 1,128 42% 1,145 37%
Revenue contribution by the TOP 10 customers for 2014
50

Case Study – Renfro Corporation
Sarla has been the only supplier for Renfro India since 1995
Revenue contributed by Renfro India has been increasing year on year for Sarla
SarlaFlex Inc. plans to sell its products from the US facility to the parent company, the Renfro Corporation
Despite its track record in serving Renfro Corporation’s Indian subsidiary, Sarla has to follow the regular process for empanelment as it’s preferred supplier
Revenue Contribution ( INR Mn)
Mar-13 Mar-14 Mar-15
105 153 182
Getting empanelment / approvals from Global Customers like Renfro Corporation is a Huge Barrier to entry
India Success Story for Sarla….
…..has little correlation with credentials for supplying to US parent, Renfro Corporation
51

Quality Standards & Environment Consciousness
QUALITY POLICY Sarla Performance Fibers Ltd is committed to a policy of continuous improvement and shall strive for excellence in all its endeavours. Each individual and the whole team shall work towards total quality culture aiming for customer satisfaction to remain competitive in business.
OEKO TEX CERTIFIED
ENVIRONMENT CONSCIOUSNESS SPFL Green Policy
Wind Power as a source of Energy
52

53
For further information, please contact:
Company :
Sarla Performance Fibers Limited CIN: L31909DN1993PLC0000562596 Mr. Mahendra Sheth, CFO & Company Secretary [email protected] www.sarlafibers.com