separation of active and passive components of short-range...
TRANSCRIPT

Separation of active and passive components of short-range stiffness of muscle
D. L. MORGAN Electrical Engineering Department, Monash University, Melbourne, Victoria, Australia 3168
MQRGAN, D. L. Separation of active and passive compo- nents of short-range stiffness of muscle. Am. J. Physiol. 232( 1): C45-C49, 1977 or Am. J. Physiol., C45-C49, 1977. -The short-range stiffness of smoothly but submaximally contract- ing isometric soleus muscles of anesthetised cats was mea- sured by applying small fast stretches. The ratio of isometric tension to stiffness was plotted against tension over a wide range of muscle lengths and stimulus rates. The results fitted a straight line well, as predicted from crossbridge theory, showing the stiffness to be a function of tension only, inde- pendent of the combination of length and stimulus rate used to generate the tension. The major deviation from this line was attributed to incomplete fusion at low frequencies of stimula- tion. Values believed to be tendon compliance and crossbridge tension per unit of stiffness were found from the graph, and the tendon compliance correlated with the maximum muscle tension. Shortening the tendon by attaching nearer to the muscle changed the results in a manner consistent with the theory, provided that appropriate precautions were taken against slippage.
cat; series elastic component; crossbridges; soleus muscle; dis- tributed stimulation
THE SHORT-RANGE STIFFNESS of a muscle is that lightly damped stiffness with which an active muscle resists small fast changes in length. In a muscle model of the three-element type (3), this is the series elastic compo- nent that has been measured many times by three main methods, giving qualitatively similar, but significantly different results. In the first method, e.g., ref. 4, knowl- edge of the tension-velocity relationship of the contrac- tile component and of the tension-time curve for the rise of isometric tension gave an estimate of the force-exten- sion curve of the series elastic component, under the assumption that in isometric contraction the contractile component shortened at the expense of the series elastic component. The second common method was controlled shortening of the muscle at a speed faster than the maximum contraction speed of the muscle, e.g., ref. 5. Usually this was “not much faster,” and allowance was made for the contraction of the contractile component during the shortening. In the third method, the initial position step accompanying a tension step was mea- sured, e.g., ref. 17. Most measurements were taken at maximal stimulation and optimum length, although Jewel1 and Wilkie (10) did vary the muscle length and begin the releases at various stages of the decay of a twitch. They found that the length-tension diagram was
independent of length, provided that the passive tension was small.
In a crossbridge model, that part of the muscle com- pliance that cannot be accounted for by tendon, is attrib- uted to the crossbridges. Thus the short-range stiffness is seen as deformation of existing crossbridges without significant breakdown or reformation (15). In this case, the short-range stiffness would be expected to vary with the state of the muscle prior to measurement, particu- larly with tension and movement (See ref. 8, p. 678; ref. 12, p. 560; ref. 13, p. 508). Joyce and Rack (14) measured the short-range stiffness as a function of tension during smooth submaximal isometric contraction using small tension steps at various initial tensions, These are true measurements of the short-range stiffness or incremen- tal stiffness, as opposed to the earlier measurements that often involved quite substantial movements and hence were “large signal” measurements. From these measurements, incremental values could be obtained only by assuming that the extension was due to a non- linear but passive and time-invariant component, which is not so in a crossbridge model.
PREDICTIONS
Using a crossbridge model, it is possible to make some predictions about the variation of the short-range stiff- ness with muscle conditions. This paper will be re- stricted to considering smooth isometric contraction at various initial lengths and stimulus rates.
It is thought that the tension contribution of an indi- vidual crossbridge varies with the “degree of deforma- tion” that varies as the filaments to which the bridge is attached move past each other, and that the normal population of bridges under isometric conditions is dis- tributed over some well-defined range of deformations (7, 8, 12, 13). Under the assumption that this range is determined by crossbridge mechanics and not by stimu- lus rate or muscle length, the average tension per cross- bridge should be independent of the number of cross- bridges. It is possible that the degree of stimulation does effect the shape of the distribution, for example, by allowing bridges to form with greater degrees of defor- mation, but this seems unlikely because more energy would be required to establish the bond. In Huxley’s 1957 theory (ref. 7, p. 285), this assumption would mean that stimulation changes the values of fi, g,, and g,, but not h. The resultant conclusion is that the tension ex- erted during a smooth isometric contraction is directly
c45
C46 13. L. MORGAN
proporti comere.
onal to the number of crossbridges per half sar-
Under similar conditions, if the short-range stiffness was due to deformation of existing bridges without sig- nificant breakdown or reformation as believed, then the stiffness would be proportional to the number of bridges. It should be noted that this conclusion does not depend on linear deformation of bridges, nor any assumed dis- tribution of degree of deformation, provided that the distribution does not change as the total number of bridges changes. Hence, the stiffness of the crossbridge array should be directly proportional to the tension, as both are proportional to the number of bridges. Blange et al. (1) have derived this relationship for a particular model l
Mathematically the relationship is expressed as
AP/Ax* = P/a, or tig = AP l a,,lP
where P is the isometric tension, AP is a small change from the isometric tension, & is the associated change in length of the crossbridge array, and cy,, is defined by the equation as the constant of proportionality that will depend on crossbridge properties and the number of sarcomeres in series-
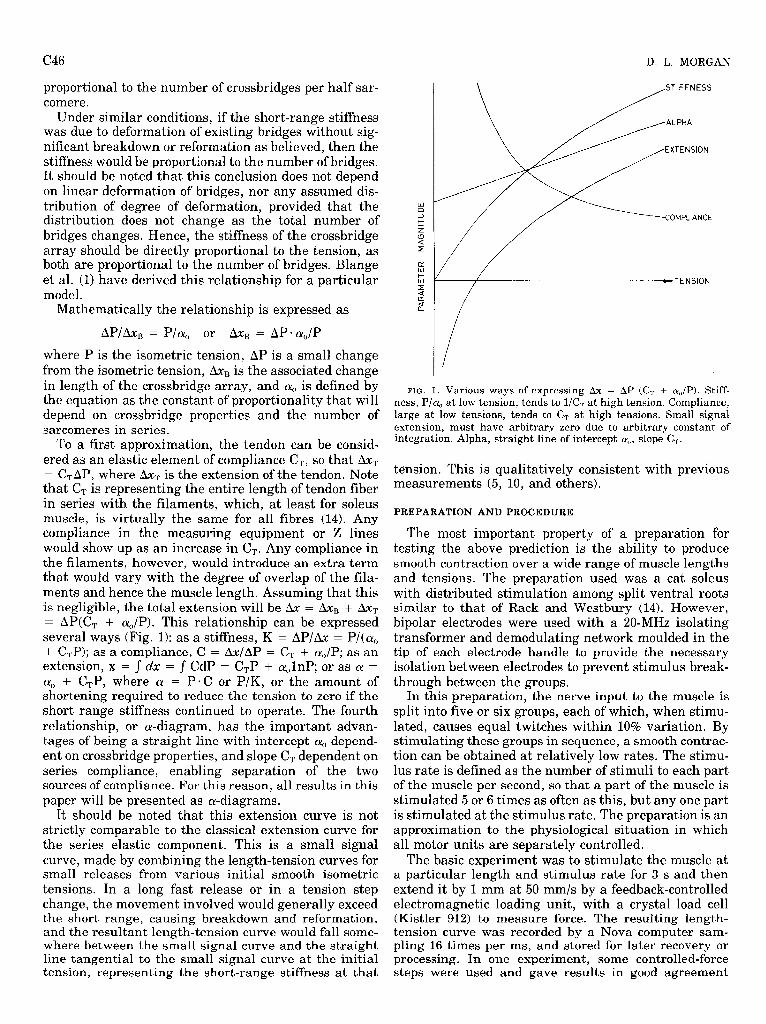
To a first approximation, the tendon can be consid- ered as an elastic element of compliance CT, so that & = C,AP, where aXT is the extension of the tendon. Note that CT is representing the entire length of tendon fiber in series with the filaments, which, at least for soleus muscle, is virtually the same for all fibres (14). Any compliance in the measuring equipment or 2 lines would show up as an increase in CT+ Any compliance in the filaments, however, would introduce an extra term that would vary with the degree of overlap of the fila- ments and hence the muscle length. Assum .ing that this is negligible, the total extension will be & = aXB + b T = AP(C, + q,/P). This relationship can be expressed several ways (Fig. 1): as a stiffness, K = AP/aX = P/(cu, + C,P); as a compliance, C = AxlAP = CT + a,,/P; as an extension, x = J dx = J CdP = C,P + a&P; or as a = q, + CTP, where a = P* C or P/K, or the amount of shortening required to reduce the tension to zero if the short range stiffness continued to operate. The fourth relationship, or a-diagram, has the important advan- tages of being a straight line with intercept a, depend- ent on crossbridge properties, and slope CT dependent on series compliance, enabling separation of the two sources of compliance. For this reason, all results in this paper will be presented as a-diagrams.
It should be noted that this extension curve is not strictly comparable to the classical extension curve for the series elastic component. This is a small signal curve, made by combining the length-tension curves for small releases from various initial smooth isometric tensions. In a long fast release or in a tension step change, the movement involved would generally exceed the short range, causing breakdown and reformation, and the resultant length-tension curve would fall some- where between the small signal curve and the straight line tangential to the small signal curve at the initial tension, representing the short-range stiffness at that
STIFFNESS
ALPHA
EXTENSlON
COMPLIANCE
FIG. 1. Various ways of expressing Ax = AP (C, + ar,/P). Stiff- ness, P/q, at low tension, tends to l/C, at high tension. Compliance, large at low tensions, tends to CT at high tensions. Small signal extension, must have arbitrary zero due to arbitrary constant of integration. Alpha, straight line of intercept a{,, slope C,.
tension, This is qualitatively consistent with previous measurements (5, 10, and others).
PREPARATION AND PROCEDURE
The most important property of a preparation for testing the above prediction is the ability to produce smooth contraction over a wide range of muscle lengths and tensions. The preparation used was a cat soleus with distributed stimulation among split ventral roots similar to that of Rack and Westbury (14). However, bipolar electrodes were used with a 20-MHz isolating transformer and demodulating network moulded in the tip of each electrode handle to provide the necessary isolation between electrodes to prevent stimulus break- through between the groups,
In this preparation, the nerve input to the muscle is split into five or six groups, each of which, when stimu- lated, causes equal twitches within 10% variation. By stimulating these groups in sequence, a smooth contrac- tion can be obtained at relatively low rates. The stimu- lus rate is defined as the number of stimuli to each part of the muscle per second, so that a part of the muscle is stimulated 5 or 6 times as often as this, but any one part is stimulated at the stimulus rate, The preparation is an approximation to the physiological situation in which all motor units are separately controlled.
The basic experiment was to stimulate the muscle at a particular length and stimulus rate for 3 s and then extend it by 1 mm at 50 mm/s by a feedback-controlled electromagnetic loading unit, with a crystal load cell (Kistler 912) to measure force. The resulting length- tension curve was recorded by a Nova computer sam- pling 16 times per ms, and stored for later recovery or processing. In one experiment, some controlled-force steps were used and gave results in good agreement

ACTIVE AND PASSIVE COMPONENTS OF SHORT RANGE STIFFNESS c47
RUN 11
15-
P (N)
lo-
77
5 ?
0 0 -6hm
f - 5mm
FIG. 2. Typical length tension curves resulting from stretching muscle by 1 mm at 50 mm/s. These curves are for various stimulation rates, but same initial muscle length, i.e., 6 mm shorter than length corresponding to 90” ankle joint. Straight lines representing short range stiffness are also shown.
with those from the controlled-position method. A wait- ing period of 100 s was allowed between runs. The total compliance of the mounting frame and loading unit was measured as 5 pm/N.
Typical length tension curves (Fig. 2) showed a small initial increase in tension complete in about 100 pm, or 2 ms,l followed by a longer linear region of about 400 pm (similar to ref. 15, p. 340) before the short range was exceeded and the tension rose less quickly or, depending upon length and stimulus rate, even fell. After the motion stopped, the tension fell to the isometric level appropriate to the new length. The long linear region was taken as representing the short-range stiffness, and its value was found by computer fitting of the best fit straight line to the samples in this region after subtract- ing an appropriate passive record? Each lengthening thus produced one point on a diagram of a versus P.
RESULTS
These diagrams were produced for twelve cats, and the basic features were common to all. It was apparent that cy was a function of P only, and not of length or stimulus rate as such. Furthermore, the relationship is nearly linear, as predicted, but with a larger scatter of points at low tensions, mainly excessively large values of a for small tensions due to greater initial lengths and very low stimulus rates (7 pps and less). Possible causes for this scatter would include lack of fusion, internal movement, increased tendon compliance at low ten-
l This region extended over a greater range at higher speeds suggesting some viscous damping in the bridges with time constants of the order of 1 ms, similar to that seen by Huxley and Simmons (8) and probably arising from the same source.
2 It has been shown that part of the resting tension of a muscle arises from crossbridges and is modified by stimulation. However, this component of tension is usually small compared to the total resting tension and always very small compared to the active tension for muscles in physiological media.
sions, or the increased effect at low tensions of any measurement errors. This is illustrated in Fig. 3, which shows the results of experiment 74/12. Measurements of a and P were made over an 18 mm range of initial lengths, using stimulus rates from 5 to 50 pulses/s. The four points above the main group at low tensions are for 5 and 7 pps at the longer lengths. The length range was restricted to keep the passive tension less than 1 N. The straight line is the least-squares fit to points for ten- sions. The intercept is a, = 1.01 mm, and the slope is the compliance C, = .033 mm/N.
A similar diagram was produced for each cat used and values found for Q, in the range 0.81-1.15 mm, and for C, in the range 0.033-0.086, with an average of 0.059 mm/N. Joyce and Rack (11) by direct microscopic obser- vations of one muscle found a tendon compliance of 0.051 mm/N. If their plot of short-range stiffness versus ten- sion (their Fig. 9) is replotted as an a-diagram, values of a0 = 0.7 mm and C, = 0,035 mm/N are obtained. The somewhat smaller value of a, could be expected as the tension steps used in those experiments would include the steeper tension rise in the first 50-100 pm, of move- ment, which was excluded in these experiments.
It was noticed that the maximum tension exerted by a muscle and the corresponding value for CT were closely inversely related as shown by Fig. 4. Intuitively this seems reasonable, that a “stronger” muscle should have a stronger and, hence, stiffer tendon. From a muscle structure point of view (2), a stronger muscle has more muscle fibers in parallel, and each fiber bundle has the same length of tendon fiber in series with it, provided that the skeletal measurements are similar. Therefore, both tension and tendon stiffness are proportional to the number of muscle tendon fiber units. An interesting consequence of this is that, at maximum muscle ten- sion, the “tendon” compliance is approximately equal to the compliance of the crossbridge array for all cat soleus muscles, even over a wide range of maximum muscle tension (see also ref. 10, p, 538). A correlation could also be expected between a, and the number of sarcomeres in
2
1
w mr
FIG, 3, Diagram of a versus tension for experiment 74/12. A vari- ety of stimulation rates was used for each muscle length, to produce a range of tensions.

C48
T 7;/6
7515
7.4 12 1
0’ -01 *OZ -03 *04 -05 *06 +07 .08
~/PM-?
FIG. 4. This shows correlation between C, and maximum tension exerted by the muscle at 25 pps. Standard deviations of CVr are shown when they were found.
a fibril, which may be reflected in the normal range of movement or in the muscle fiber length. These quanti- ties were estimated for each muscle used, but the range of variation was too small for any clear relationship to emerge.
FURTHER VERIFICATION
A possible further check on these theories was to shorten the effective length of the tendon in a single experiment and look for a proportional change in CT without affecting a, V The practical difficulties however proved considerable.
The experiment consisted of first plotting an cr-dia- gram with the muscle hook tied to the tendon as near as possible to the end where it fused with the calcaneum, and then repeating the procedure with the muscle hook tied to the tendon as near as possible to the muscle body. This shortened each tendon fiber by 6-14 mm depending on the muscle. Initially the results were most erratic, often showing an increase in compliance when the tendon was shortened. This effect was finally attributed to slipping of some of the tendon fibers inside the bundle, even though the outer layer was firmly tied; this slip- ping did not occur in the first part of the experiment due to the fusion of the fibers at the end of the tendon. By tying the tendon fibers in six small bundles before tying them all to the muscle hook and by using some cyano- acrilate adhesive, (I.S.-0.3, Loctite Ltd.), the effect, in three experiments, was reduced to give results con- sistent with the theory.
The a-diagram for one of these experiments is shown in Fig. 5. It can be seen that, after shortening the tendon, the points departed from the straight line at
D. L. MORGAN
higher tensions than was the case before shortening. This was taken to indicate that some slipping of tendon fibers was still taking place. In each experiment, the values for a, before and after shortening the tendon were the same within standard deviations, and lines of equal a, could be drawn so that the RMS deviation of each set of points from these lines was not more than 5% above the RMS deviation of the points from the line of best fit. The percentage change in CT, assuming equal a, and after correcting for frame compliance, and the percentage change in tendon length agreed in each case to within the accuracy of measuring the length of ten- don removed, i.e., t2 mm. This length was estimated by comparing the graphs of static tension versus trans- ducer position. Thus the experiments supported the pre- diction, but the inaccuracies involved prevented conclu- sive proof.
In one experiment, after plotting an a-diagram in the normal way, further measurements were made while the animal was recovering from a paralysing dose of gallamine triethiodide (May and Baker, Flaxedil). These gave values of a in general accord with the first set, but with less upward curvature at low tensions. This result strongly suggests that the main cause of the curvature had been lack of real fusion, even though the stimulus rate was sufficient for the fluctuations in iso- metric tension to be small.
In conclusion, the fact that the form of the variation of the short-range stiffness with tension could be predicted so well from crossbridge theory without making many special assumptions provides further support for the basic concepts of crossbridge models, i.e., that the ten- sion is generated by an array of parallel independent identical “bridges” with a finite compliance and that variations in isometric tension are brought about by variations in the number of bridges.
Accepting the general explanation, several specific conclusions can also be drawn. First, any compliance in the filaments themselves must be small, as any signifi-
2
oc m m
1
0 E
NE&ON5
FIG. 5. Plot of 1y versus initial tension before and after shortening tendon for experiment 75/K l , muscle hook tied to free end of tendon. +, muscle hook tied to tendon near muscle body.

ACTIVE AND PASSIVE COMPONENTS OF SHORT RANGE STIFFNESS c49
cant compliance there would introduce a dependence of total muscle compliance on muscle length, which was not seen. This does not however apply to compliance in the 2 lines. Second, if the contribution of the crossbridge array to a really is independent of tension, as is sug- gested, then the one specific assumption made, that changes in tension are brought about by changing the number of bridges without changing the distribution of the bridges among the various possible degrees of defor- mation, is supported. That this assumption is so, even when the muscle length is varied over quite a wide range, increases the arguments for a system of flexible links such as that suggested by H, E. Huxley (9) so that
REFERENCES
1. BLANGE, T.,J. M. KAREMAKER, AND A.E.J.L. KRAMER. Elastic- ity as an expression of crossbridge activity in rat muscle. Pflue- gem Arch. 336: 277-288, 1972.
2. CLOSE, R. Dynamic properties of fast and slow skeletal muscles of the rat during development. J. PhysioZ., London 173: 74-95, 1964,
3. HILL, A. V. The heat of shortening and the dynamic constants of muscle. Proc. Roy. Sot., London, Ser. B 126: 136-195, 1938.
4. HILL, A. V. The abrupt transition from rest to activity in muscle. Proc. Roy. Sot., London, Ser. B 136: 399-420, 1949.
5. HILL, A. V. The series elastic component of muscle. Proc. Roy. Sot., London, Serb B 137: 273-280, 1950.
6. HILL, D. K. Tension due to interaction between the sliding filaments in resting striated muscle. The effect of stimulation. J. Physiol., London 199: 637-684, 1968,
7. HUXLEY, A. F. Muscle structure and theories of contraction, Progr. Biophys. Biophys. Chem. 7: 255-318, 1957.
8. HUXLEY, A. F., AND R. M. SIMMONS. Mechanical transients and the origin of muscular force. Cold Springs Hurb. Symp. Quant. Biol. 37: 669-680, 1973.
9. HUXLEY, H. E. The mechanism of muscle contraction. Science 164: 1356-1366, 1969.
10. JEWELL, B. R., AND D. R. WILKIE. An analysis of the mechanical
the range of possible deformations of the bridges is independent of interfilament spacing, which vary with muscle length.
The ability of the method to separate the two compo- nents of the short-range stiffness in a quantitative man- ner for an individual muscle, rather than relying on typical figures is valuable.
I have the pleasure of acknowledging the assistance of Dr. T. I. H. Brown, who develohed the preparation, and the guidance of Prof. D. G. Lampard.
Received for publication 12 January 1976.
components in frog’s striated muscle. J. Physiol., London 143: 515-540, 1958.
11. JOYCE, G. C., AND P. M. H. RACK. isotonic lengthening and shortening movements of cat soleus muscle. J. Physiol., London 204: 475-491, 1969.
12. JULIAN, F. J., K. R. SOLLINS, AND M. R. SOLLINS. A model for the transient and steady state mechanical behaviour of contracting muscle. Biophys. J. 14: 546-562, 1974.
13. PODOLSKY, R. J., A. C. NOLAN, AND S. A. ZAVELER. Cross-bridge properties derived from muscle isotonic velocity transients. Proc. NutZ. Acad. Sci. U.S. 64: 504-511, 1969.
14. RACK, P. M. H., AND D. R. WESTBURY. The effects of length and stimulus rate on tension in the isometric cat soleus muscle. J. Physiol., London 204: 443-460, 1969.
15. RACK, P. M. H., AND D. R, WESTBURY. The short range stiffness of active mammalian muscle and its effects on mechanical prop- erties. J. PhysioZ., London 240: 331-350, 1974.
16. WELLS, J. B. Comparison of mechanical properties between slow and fast mammalian muscles. J. Physiol., London 178: 252-269, 1965.
17. WILKIE, D. R. Measurement of the series elastic component at various times during a single muscle twitch. J. Physiol., London 134: 527-530, 1956.