seo/birdlife bird monitoring programmes · pdf filethe sampling coverage keeps growing thanks...
TRANSCRIPT

SEO/BIRDLIFE BIRDMONITORING PROGRAMMES 2012

4 Sacre programmeBird trends in spring
10 Sacin programmeBird trends in winter
12 Sacre / SacinCommon bird trends in National Parks
14 Noctua programmeNocturnal bird trends
16 Paser programmeBird ringing in spring
20 Birds and climateBird phenology
22 Migra programmeBird migration
26 CensusBird population size
30 WaterbirdsCensus of aquatic birds in winter
32 Atlas in winter / Atlas in springBird distribution
2 Our volunteers’ contribution
Thanks to the contribution of our volunteers we are able to takeon large-scale projects, as it would be difficult to recruit profes-sional staff for this work. The value of this contribution does notonly reside in the scale or scope that can be given to the work. It isalso an economic question– the economic value of our volunteers’work is almost never quantified.
It is not difficult to calculate a minimum economic value of our vol-unteers’ contribution to each monitoring programme, census andatlas. It is also worthwhile to know its relevance in the understand-ing of the state of biodiversity in our country.
Each participant in any SEO/BirdLife monitoring programme(Sacre, Sacin or Noctua) must visit the field once or twice prior tosampling. They also need to design the work in hand well, whichinvolves some “office” hours – a good job depends on a good de-sign. Thus, they need to invest some time in checking digital or anyother type of map, to consult and calculate things difficult to ap-preciate in the field, or to have an overview of the sampling area,the itineraries or the distribution of the points. This previous work,at home and in the field, also involves hours or even days in visitsto the countryside and fieldwork. The censuses and atlases alsoimply this investment in time.
In other SEO/BirdLife monitoring programmes, like Paser, in addi-tion to this previous work time –a must in any task–, we also haveto consider the investment in special equipment, essential in sci-entific bird ringing (nets, electronic scales, rulers and special pli-ers, etc.). Moreover, it is a difficult task for a single person, so thereare around 3-4 people in each ringing station.
We do not include in the calculations the prior design of the project,the equipment for some programmes (like Paser), other basic itemsin all programmes –binoculars, good boots, coat, etc.– and a car,the only way to reach locations where there is no public transport.
For example, just the annual tasks in the Sacre programme (with1,050 participants represent nearly 2,100 fieldwork days per sea-son. This fieldwork, meaning travelling to and from the samplingstarting point, can imply very different efforts. For some people thefieldwork is close by, but for others it entails many kilometres. Thisis the result of the uneven distribution of the human populationacross Spain, with enormous extensions containing few inhabitants,like Tarragona, Teruel, Guadalajara, Cuenca, Ciudad Real, Córdoba,Badajoz, certain areas in Galicia and the east of Andalusia, where
OUR VOLUNTEERS’ CONTRIBUTION

ornithologist are scarce. Some volunteerstravel scores or even hundreds of kilome-tres each year to obtain information onthese areas. As well as the trips, lunchmust also be taken into account. Oneneeds to eat something during the work-ing day. If a modest quantity (€100-€120)was paid for the kilometres, a simplelunch and a working day, it would amountto between €210,000 and €252,000 just forthe fieldwork.
Applying the same calculations for Sacin(the 630 current participants contribute€116,000-€121,000), Noctua (€159,000-€190,000 with 529 current participants –3visits per sampling unit) and Paser(€300,000-€360,000 with 300 current par-ticipants –10 visits per season– in 60 sta-tions), only the seasonal fieldwork in thesefour monitoring programmes would repre-sent around €795,000-€955,000.
But these monitoring programmes alsoprogress thanks to several people in-tensely working full time in coordinatingand maintaining the activity of severalthousand people. This activity is main-tained thanks to a regional coordinationsystem, which itself requires attention; tothe IT staff who create, update and im-prove computer applications so the volun-teers can add their data and havepermanent access to it in the form of ta-bles, maps or graphs; to data compilation,review and correction, to analyse and thenpublish and disseminate the results; tothe production of new materials, search ofnew participants, etc. Although thesetasks cannot be assessed here in detail,we just wanted to stress the importance ofour volunteers’ contribution. It would alsobe good to add to the previous figure thesalaries covered by the NGOs involved, as
their contribution to these monitoring sys-tems. In brief, SEO/BirdLife and its volun-teers contribute more than €1m everyyear just for the maintenance of these fourmonitoring programmes.
It would be easy to quantify and show thevalue of the data included in the latestAtlas of birds in winter in Spain, a huge jobworth highlighting here. Apart from theitineraries drawn for the Atlas, many
previous fieldwork days were invested indesigning the most adequate methodol-ogy, in obtaining information from spe-cific censuses on Cranes, Seagulls andHerons; from nocturnal bird and seabird
samplings, etc. This work involved 2,600people over three years, which amounts to€900,000-€1,100,000. Again, excludingthe money to pay the staff in coordination,compilation, review and analysis, trips,committee and coordination meetings,etc., the value of the Atlas of birds in winterin Spain, just published, would be around€1,800,000.
We are talking about enormous figuresthat give huge value to the activity gener-ated by SEO/BirdLife, understood as thethousands of volunteers in all censuses,atlases and monitoring programmes,since they are the base of this Society’swork in monitoring our birds
SEO/BIRDLIFE 2012 MONITORING PROGRAMMES OUR VOLUNTEERS’ CONTRIBUTION 3
THE CONTRIBUTION OF SEO/BIRDLIFE AND ITS VOLUNTEERS IS OVER ONE MILLIONEUROS PER YEAR JUST FOR THE MAINTAINANCE OF THESE FOUR MONITORINGPROGRAMMES (SACRE, SACIN, NOCTUA AND PASER).
Rufous-tailed Rock-Thrush
Volunteer
© Q
uiqu
e M
arce
lo
© P
ablo
Ver
a
Extensive livestock farming is very important for birds
© S
EO/B
irdLi
fe-v
olun
taria
do

The sampling coverage keeps growingthanks to the fidelity of our previous par-ticipants and with new ones arrivingeach season. Moreover, in certain areas,and thanks to funding by some au-tonomous regions (in 2012, Basque Coun-try, Valencia Region, Madrid andAndalusia), professional staff were hiredin order to cover the bulk of the territory(Basque Country) or as back-up staff (Va-lencia). In addition, the support in coordi-nation by the Galician Ornithology Societyhas improved the progress of the pro-gramme in this region.
Finally, and thanks to specific contracts, thisprogramme was undertaken in all nation-al parks in 2012, starting the sampling in ar-eas that were previously not covered (withsome exceptions) due to the difficulty ofsampling there (restricted access). This ex-pansion in coverage is very important forthis monitoring programme since the resultis further information on more and morespecies and increasingly consistent data.
Out of the 107 common species from whichwe obtained a value to determine theirpopulation trend under this monitoring
• The sampling unit is 20 census points located within a 10 x 10 km UTM grid.• It is carried out over two days: the first between 15 April and 15 May and the second
between 15 May and 15 June (earlier in the Canary Islands and later in the mountains).• Five minutes is spent at each census point noting all species detected.• It begins at sunrise and ends before midday.
4 SACRE. BIRD TRENDS IN SPRING SEO/BIRDLIFE 2012 MONITORING PROGRAMMES
Virginia EscandellSEO/BirdLife
BIRD TRENDS IN SPRING
Crested Tit
© Q
uiqu
e M
arce
lo

Spanish Sample Interannual average Change (%) with name change (1998-2012) respect to 1998Acrocephalus arundinaceus 163 -3.8 (-5.9; -1.6)** -14.2Acrocephalus scirpaceus 213 1.7 (-0.2; 3.6) 36.3Aegithalos caudatus 599 -0.4 (-1.8; 0.9) 7.9Alauda arvensis 622 -2.3 (-2.9; -1.6)** -26.5Alcedo atthis 143 -5.2 (-9.6; -0.7)* -45.2Alectoris rufa 878 -1 (-1.5; -0.4)** -16.2Anas platyrhynchos 675 0.9 (-0.2; 1.9) -6.6Anthus campestris 223 -0.8 (-2.9; 1.3) -4.7Anthus trivialis 245 1.1 (-0.4; 2.6) 0.7Apus apus 991 -0.9 (-1.6; -0.3)** -26.2Athene noctua 500 -3.3 (-4.5; -2.2)** -37.4Buteo buteo 886 -1.5 (-2.3; -0.7)** -8.3Calandrella brachydactyla 307 -0.5 (-1.9; 0.9) -15.2Carduelis cannabina 860 -0.4 (-1.1; 0.3) 14.5Carduelis carduelis 1,006 -0.5 (-1; 0.1) 12.3Cecropis daurica 345 0.6 (-1; 2.2) 24.7Certhia brachydactyla 667 2.6 (1.8; 3.5)** 62.5Cettia cetti 722 0.1 (-0.5; 0.7) -11.1Chloris chloris 984 2.2 (1.5; 2.8)** 64.5Ciconia ciconia 510 2.4 (1.6; 3.3)** 59.7Cinclus cinclus 104 0.5 (-3.5; 4.6) 29.1Cisticola juncidis 538 -0.3 (-1.1; 0.5) -38.2Clamator glandarius 258 5.4 (2.7; 8)** 34.6Columba livia 572 -0.1 (-1.2; 1) -1.0Columba oenas 166 5.9 (2.5; 9.3)** -16.8Columba palumbus 975 2.5 (1.8; 3.2)** 101.5Corvus corax 730 -1.6 (-2.7; -0.5)** -7.0Corvus corone 738 -1 (-1.6; -0.5)** -2.9Corvus monedula 461 -3.3 (-4.2; -2.3)** -43.6Coturnix coturnix 689 -2.2 (-3; -1.4)** -53.3Cuculus canorus 955 0.4 (0; 0.9) 7.9Cyanistes caeruleus 851 2.5 (1.8; 3.2)** 50.5Cyanopica cookii 235 3.2 (1.7; 4.6)** 61.8Delichon urbicum 795 1.2 (0.2; 2.1)* -3.4Dendrocopos major 685 3.6 (2.6; 4.5)** 76.5Emberiza calandra 871 0.3 (-0.2; 0.9) 23.6Emberiza cia 401 1.6 (0.3; 3)* 40.6Emberiza cirlus 514 -0.3 (-1.4; 0.9) 37.6Emberiza citrinella 163 -3.6 (-5.3; -1.8)** -14.3Emberiza hortulana 114 -2.9 (-5.2; -0.5)* -13.2Erithacus rubecula 688 1.4 (0.7; 2.1)** 42.3Falco tinnunculus 904 -2 (-2.8; -1.3)** -39.2Fringilla coelebs 944 3.3 (2.7; 3.8)** 75.4Galerida cristata 762 -0.8 (-1.4; -0.3)** -6.1Galerida theklae 342 3.4 (1.9; 4.9)** 86.8Garrulus glandarius 641 2.2 (1.2; 3.3)** 55.5Hippolais polyglotta 588 2.9 (1.9; 3.8)** 47.6Hirundo rustica 1,051 -1.8 (-2.4; -1.2)** -41.0Jynx torquilla 220 -0.1 (-2.4; 2.3) -24.8Lanius collurio 252 -2.2 (-3.9; -0.5)* -49.9Lanius meridionalis 532 -6.4 (-7.7; -5.2)* -56.6Lanius senator 622 -1.9 (-2.9; -0.9)** -13.6Lophophanes cristatus 380 -0.7 (-2.2; 0.8) 29.7Loxia curvirostra 138 6 (2.9; 9.2)** 130.4
Spanish Sample Interannual average Change (%) with name change (1998-2012) respect to 1998Lullula arborea 594 0.8 (0; 1.6)* 15.6Luscinia megarhynchos 853 2.2 (1.8; 2.5)** 33.3Melanocorypha calandra 392 -3.8 (-4.5; -3.1)** -33.9Merops apiaster 730 -0.3 (-1.2; 0.6) -6.6Milvus migrans 664 2.7 (1.7; 3.7)** 51.4Monticola solitarius 129 -2 (-4.6; 0.7) 17.1Motacilla alba 752 -1.5 (-2.5; -0.6)** -18.6Motacilla cinerea 296 -0.2 (-2.3; 2) 12.4Motacilla flava 255 1.7 (0.5; 3)** 28.2Muscicapa striata 250 0.9 (-1.4; 3.2) 34.6Oenanthe hispanica 423 -2.2 (-3.3; -1.1)** -25.1Oenanthe oenanthe 359 -1.3 (-2.4; -0.2)* -14.7Oriolus oriolus 710 2.9 (2.1; 3.6)** 54.3Parus major 1,013 1.2 (0.6; 1.7)** 28.0Passer domesticus 1,054 -0.9 (-1.3; -0.4)** -5.2Passer hispaniolensis 116 5 (-2; 12) 480.9Passer montanus 401 -1.8 (-3.1; -0.5)** -17.8Periparus ater 505 1.6 (0.6; 2.6)** 31.2Petronia petronia 394 1.2 (0; 2.4) 24.9Phoenicurus ochruros 544 0.1 (-1.1; 1.3) 30.9Phylloscopus bonelli 342 4.3 (3.2; 5.4)** 126.0Phylloscopus collybita (1) 285 -7.6 (-10.6; -4.7)** -55.5Phylloscopus ibericus (1) 198 4.4 (1.7; 7.1)** -2.8Pica pica 853 -0.3 (-0.9; 0.2) 0.9Picus viridis 851 -1.9 (-2.6; -1.2)** -21.9Prunella modularis 239 -2.3 (-3.8; -0.9)** -36.3Ptyonoprogne rupestris 267 0.8 (-1.5; 3.1) -6.0Pyrrhocorax pyrrhocorax 296 1.4 (-0.8; 3.7) 75.6Pyrrhula pyrrhula 233 -2 (-4.3; 0.3) 20.9Regulus ignicapilla 400 2.5 (1; 4)** 37.8Regulus regulus 108 -0.2 (-6; 5.5) -38.6Riparia riparia 111 0.3 (-3.6; 4.2) -74.9Saxicola rubicola 851 -2.6 (-3.4; -1.9)** -18.3Serinus serinus 1,043 -1.5 (-2; -1.1)** -10.1Sitta europaea 303 4.5 (2.8; 6.1)** 110.0Streptopelia decaocto 761 15.4 (14; 16.9)** 966.3Streptopelia turtur 756 -1.6 (-2.5; -0.8)** -29.3Sturnus unicolor 966 1.6 (1; 2.3)** 27.3Sturnus vulgaris 144 4.2 (1.4; 6.9)** 62.4Sylvia atricapilla 781 5.6 (4.9; 6.4)** 118.0Sylvia borin 205 -0.5 (-2.2; 1.2) 17.4Sylvia cantillans 355 2.8 (1.4; 4.3)** 40.2Sylvia communis 287 -4.1 (-5.6; -2.7)** -37.9Sylvia conspicillata 189 0.2 (-3; 3.4)** 26.5Sylvia hortensis 195 4.7 (2.1; 7.3)** 131.1Sylvia melanocephala 583 0.9 (0.2; 1.6)* 15.6Sylvia undata 434 -2.6 (-4; -1.1)** -30.3Tetrax tetrax 232 -2.7 (-3.9; -1.6)** -46.3Troglodytes troglodytes 637 1.2 (0.5; 1.9)** 30.9Turdus merula 1,063 1.5 (1.1; 2)** 31.8Turdus philomelos 441 2.5 (1.1; 3.9)** 51.6Turdus viscivorus 446 1.9 (0.4; 3.3)* 31.7Upupa epops 866 -0.5 (-1.1; 0.2) 8.2
SEO/BIRDLIFE 2012 MONITORING PROGRAMMES SACRE. BIRD TRENDS IN SPRING 5
Sample: number or sampling units considered in the analysis (those used two or more years). Interannual average change: average of the interannual variationsbetween 1998 and 2012. Change (%) with respect to 1998: population percentage change with respect to 1998. It shows the statistically significant results (WaldTest: * p<0.05; ** p<0.01). (1) Values with respect to year 2005. In red, the 25 species of the most common birds.

programme, 32% are in decline. Most ofthem are birds associated with farmland andurban habitats (some of them are huntingspecies). The Southern Grey Shrike, Com-mon Quail, Little Bustard, Eurasian Jackdaw,Barn Swallow, Little Owl, Calandra Lark andthe Dartford Warbler are some of thespecies with the sharpest declines andcontinuing over the longest period.
Rapid population decline is one of the cri-teria considered by the IUCN to classifythe species in the various categories ofthreat, and this is one of the values ob-tained with the data from Sacre pro-gramme. These species should at least beincluded in the “Vulnerable” category ofthe Red Book of Birds of Spain, as the Lit-tle Bustard now is, in accordance with thedecline suffered by their populationssince their numbers have gone down bymore than 30% in the last 14 years, intune with the information from the latestanalyses. Nevertheless, the SouthernGrey Shrike is still classified as “Near
threatened” and the Eurasian Jackdaw,the Barn Swallow, the Little Owl, the Ca-landra Lark and the Dartford Warbler havenot even been assessed. These species,
according to this information, should al-so be considered within the national listof endangered species. Among thespecies whose populations reflect a pos-itive change, we can highlight theEurasian Collared-Dove.
Although more modestly, the popula-tions of Treecreeper, Great Spotted Wood-pecker, Wood Nuthatch and Coal Tit arealso growing. Most of them belong to for-est habitats or they are generalist, exceptthe Eurasian Collared-Dove, whose pop-ulation is strongly linked to urban centres,especially located around farmland.
The population trend may vary among thestudied regions given the large extensionof Spain’s territory and the different bio-geographical regions. This is the case ofthe Northern Raven, whose populationsare stable in the Eurosiberian region, butare decreasing in the Mediterranean andincreasing in the south.
Species with sharp negative trends in morethan one region are the most worrying. This
6 SACRE. BIRD TRENDS IN SPRING SEO/BIRDLIFE 2012 MONITORING PROGRAMMES
Number of species classified in each population trend category considered
THE SOUTHERN GREY SHRIKE IS STILLCATALOGUED AS "NEAR THREATENED"WHILE THE EURASIAN JACKDAW, BARNSWALLOW, LITTLE OWL, CALANDRA LARKAND DARTFORD WARBLER HAVE NOTEVEN BEEN ASSESSED.
1996
1,200
1,000
800
600
400
200
01997 1998 1999 2000 2001 2002 2003 2004 2005 2006 2007 2009 201120102008 2012
No. o
f col
abor
ator
s
Coverage in 2012 and change in the sampling units since 1996

is the case of the Eurasian Jackdaw in theEurosiberian and northern Mediterraneanregions, and the Southern Grey Shrike inboth Mediterranean regions. Stonechatpopulations are also in decline in several re-gions (in this case, in the three regions stud-ied), but more moderately. The opposite ishappening with the Eurasian Collared-
Dove, notably increasing in both Mediter-ranean regions.
Thanks to the work undertaken in the na-tional parks, the sampling in high mountainareas and in the Canary Islands has aug-mented. This will allow us in just a few sea-sons to show the results for these regionsseparately (currently we consider the data
obtained in these regions with the gener-al analyses at national scale).
Out of 32% of species whose populationsare in decline, most are birds associatedwith farmland and urban habitats, precise-ly those closest to humans. This shouldalert us to identify whether the rapidtransformation suffered by this habitat in
recent years (both in its management andin its structure) is the cause of thesechanges or if there are other unknown prob-lems. The abandonment of agriculturalland, especially small farms around villages,and the loss of extensive grazing in manyregions, implies the transformation of theterritory with an increase in the forestmass. This affects the birds associated with
SEO/BIRDLIFE 2012 MONITORING PROGRAMMES SACRE. BIRD TRENDS IN SPRING 7
Biogeographical regions considered. Number of species in each category of population trend in the Eurosiberian and southern and northern Mediterranean regions.This division has been carried out by different authors, most notably by Rivas Martínez and Allué Andrade, based on biogeographical regions
Eurasian Jackdaw
© J
avie
r Milla
OUT OF 32% OF SPECIES WHOSE POPULATIONS ARE IN DECLINE, MOST AREBIRDS ASSOCIATED WITH FARMLAND AND URBAN HABITATS, PRECISELY THOSECLOSEST TO HUMANS.
Eurosiberian region
High mountain areas
Northern Mediterranean region
Southern Mediterranean region
Canary region
16
26
14
411 2
Strong decline Moderate decline Stable
With no definite change Moderate increase Strong increase
10
33
184 3
19
Eurosiberia
37
30
15
201 3
NorthernMediterranean
region
SouthernMediterranean
region
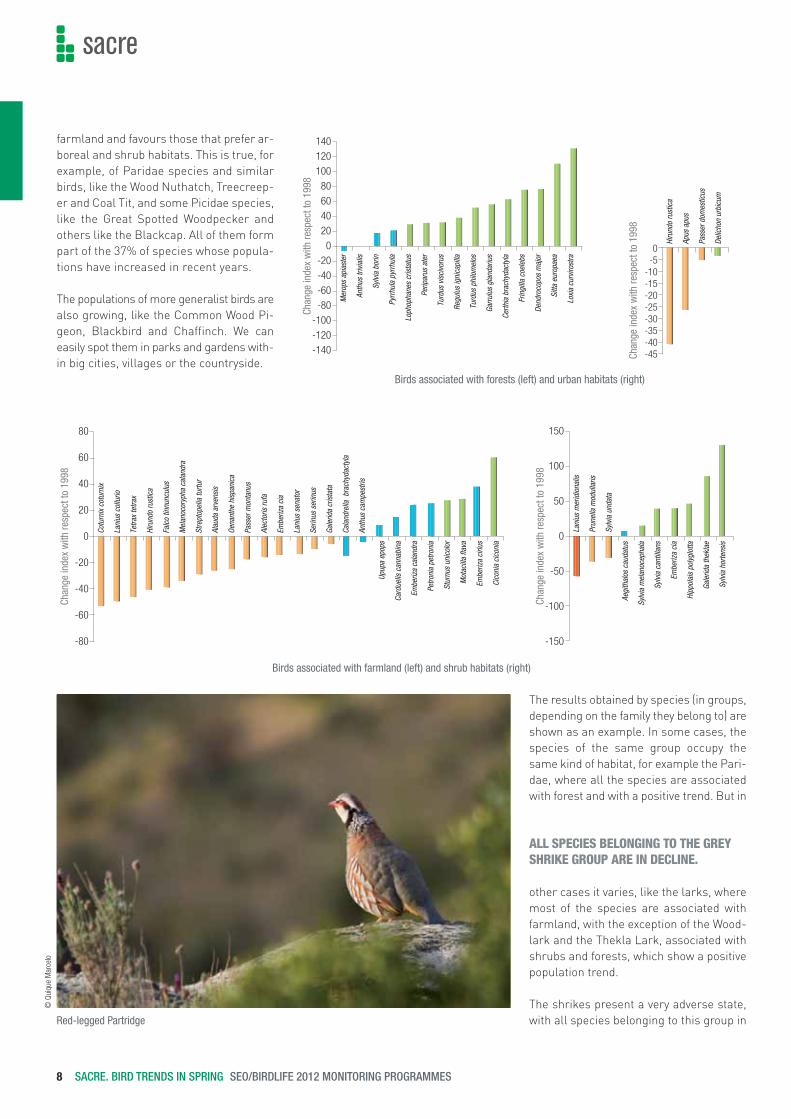
farmland and favours those that prefer ar-boreal and shrub habitats. This is true, forexample, of Paridae species and similarbirds, like the Wood Nuthatch, Treecreep-er and Coal Tit, and some Picidae species,like the Great Spotted Woodpecker andothers like the Blackcap. All of them formpart of the 37% of species whose popula-tions have increased in recent years.
The populations of more generalist birds arealso growing, like the Common Wood Pi-geon, Blackbird and Chaffinch. We caneasily spot them in parks and gardens with-in big cities, villages or the countryside.
The results obtained by species (in groups,depending on the family they belong to) areshown as an example. In some cases, thespecies of the same group occupy thesame kind of habitat, for example the Pari-dae, where all the species are associatedwith forest and with a positive trend. But in
other cases it varies, like the larks, wheremost of the species are associated withfarmland, with the exception of the Wood-lark and the Thekla Lark, associated withshrubs and forests, which show a positivepopulation trend.
The shrikes present a very adverse state,with all species belonging to this group in
Chan
ge in
dex
with
resp
ect t
o 19
98
Aegi
thal
os c
auda
tus
Sylv
ia m
elan
ocep
hala
Sylv
ia c
antil
lans
Embe
riza
cia
Hipp
olai
s po
lygl
otta
Gale
rida
thek
lae
Sylv
ia h
orte
nsis
150
100
50
0
-50
-100
-150
Lani
us m
erid
iona
lis
Prun
ella
mod
ulla
ris
Sylv
ia u
ndat
a
© Q
uiqu
e M
arce
lo
8 SACRE. BIRD TRENDS IN SPRING SEO/BIRDLIFE 2012 MONITORING PROGRAMMES
Chan
ge in
dex
with
resp
ect t
o 19
98
Mer
ops
apia
ster
Anth
us tr
ivia
lis
Sylv
ia b
orin
Pyrrh
ula
pyrrh
ula
Loph
opha
nes
cris
tatu
s
Perip
arus
ate
r
Turd
us v
isci
voru
s
Regu
lus
igni
capi
lla
Turd
us p
hilo
mel
os
Garru
lus
glan
dariu
s
Certh
ia b
rach
ydac
tyla
Frin
gilla
coe
lebs
Dend
roco
pos
maj
or
Sitta
eur
opae
a
Loxi
a cu
rviro
stra
140120100806040200
-20-40-60-80
-100-120-140
Cotu
rnix
cot
urni
x
Lani
us c
ollu
rio
Tetra
x te
trax
Hiru
ndo
rust
ica
Falc
o tin
nunc
ulus
Mel
anoc
oryp
ha c
alan
dra
Stre
ptop
elia
turtu
r
Alau
da a
rven
sis
Oena
nthe
his
pani
ca
Pass
er m
onta
nus
Alec
toris
rufa
Embe
riza
cia
Lani
us s
enat
or
Serin
us s
erin
us
Gale
rida
cris
tata
Cala
ndre
lla b
rach
ydac
tyla
Anth
us c
ampe
stris
Chan
ge in
dex
with
resp
ect t
o 19
98
80
60
40
20
0
-20
-40
-60
-80
Upup
a ep
ops
Card
uelis
can
nabi
na
Embe
riza
cala
ndra
Petro
nia
petro
nia
Stur
nus
unic
olor
Mot
acill
a fla
va
Embe
riza
cirlu
s
Cico
nia
cico
nia
Chan
ge in
dex
with
resp
ect t
o 19
98
0-5
-10-15-20-25-30-35-40-45
Hiru
ndo
rust
ica
Apus
apu
s
Pass
er d
omes
ticus
Delic
hon
urbi
cum
Red-legged Partridge
Birds associated with forests (left) and urban habitats (right)
Birds associated with farmland (left) and shrub habitats (right)
ALL SPECIES BELONGING TO THE GREYSHRIKE GROUP ARE IN DECLINE.
decline. This is especially noticeable in theSouthern Grey Shrike population and veryworrying in the case of the Lesser GreyShrike –although its population in Spain hasalways been small, now it is, in practicalterms, extinct.
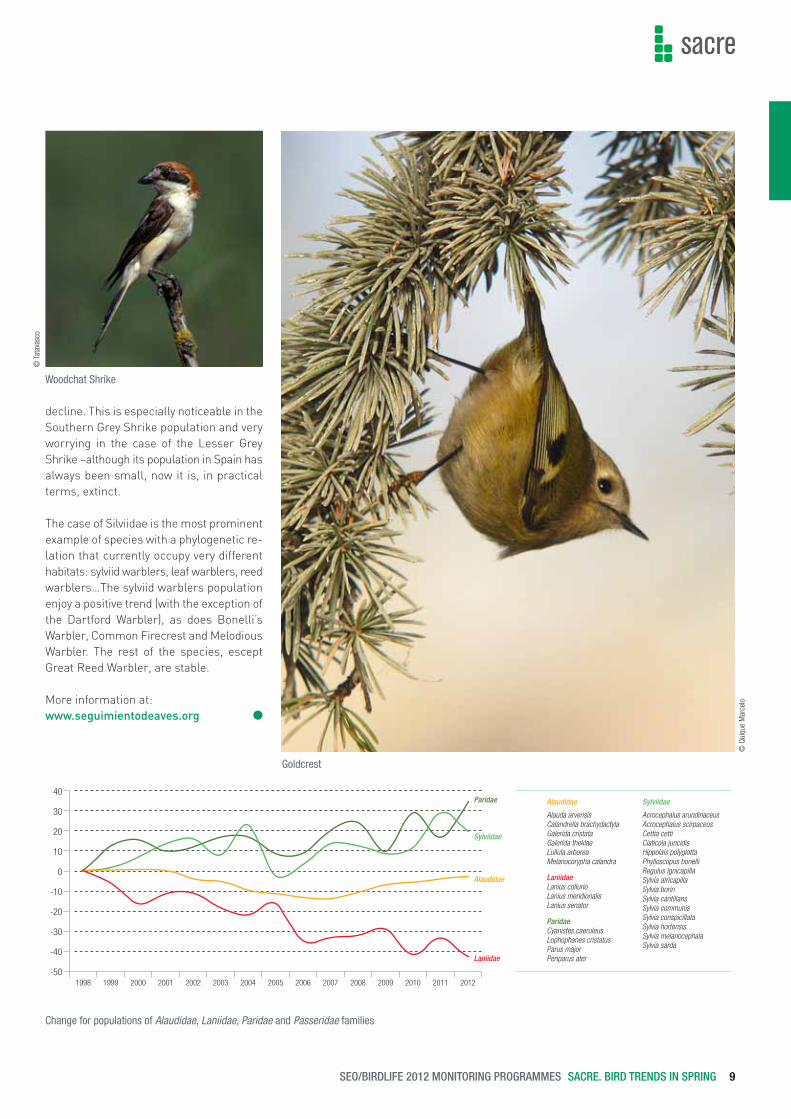
The case of Silviidae is the most prominentexample of species with a phylogenetic re-lation that currently occupy very differenthabitats: sylviid warblers, leaf warblers, reedwarblers…The sylviid warblers populationenjoy a positive trend (with the exception ofthe Dartford Warbler), as does Bonelli’sWarbler, Common Firecrest and MelodiousWarbler. The rest of the species, esceptGreat Reed Warbler, are stable.
More information at:www.seguimientodeaves.org
SEO/BIRDLIFE 2012 MONITORING PROGRAMMES SACRE. BIRD TRENDS IN SPRING 9
Change for populations of Alaudidae, Laniidae, Paridae and Passeridae families
Goldcrest
Woodchat Shrike
© Q
uiqu
e M
arce
lo
© T
atav
asco

After four winters of fieldwork on theSacin programme we have the first re-sults indicating the trend for the popula-tions this season. In many species thereis a coincidence between the populationtrend in winter and in spring. This is quiteworrying with the decreasing popula-tions, like the Southern Grey Shrike, Ca-landra Lark, Common Kestrel, CrestedLark, Dartford Warbler and Red-leggedPartridge. However, other species showpositive population trends in winter, con-trary to the results in spring. We can men-
tion the House Sparrow, Tree Sparrow, Eu-rasian Jackdaw, European Serin and Euro-pean Stonechat.
In general terms, Paridae, species asso-ciated with arboreal environments, have apositive trend. Other species that also pre-sent a favourable situation in both sea-sons are the Blackcap, Common WoodPigeon, European Robin, Chaffinch andEurasian Collared-Dove. The case of theBlackcap particularly stands out. It is apre-Saharian migratory species whose
• The sampling unit is 8 itineraries, consecutive, if possible.• Located within a 10 x 10 km UTM grid.• It is carried out in two days: the first between 15 November and 31 December and the
second between 1 January and 15 February (earlier in the Canary Islands).• One walks very slowly (400-700 m in 15 minutes).• It begins at dawn and ends after approximately two hours.
10 SACIN. BIRD TRENDS IN WINTER SEO/BIRDLIFE 2012 MONITORING PROGRAMMES
Virginia EscandellSEO/BirdLife
BIRD TRENDS IN WINTER
600
500
400
300
200
100
02008/9 2009/10 2010/11 2011/12
No. o
f col
abor
ator
s
Current coverage of participation in the programme and change in participation since 2008

increase in population in winter (in addi-tion to the increase of its breeding popu-lations across the continent) could beinfluenced by climate change– it might bea species whose migratory behaviour ischanging.
On many occasions, surveys in this seasonare especially tough, but very interesting: ifclimate conditions are really changing, the
record they leave in the fieldwork duringthis season will be key to having the datato prove it.
More information at:www.seguimientodeaves.org
SEO/BIRDLIFE 2012 MONITORING PROGRAMMES SACIN. BIRD TRENDS IN WINTER 11
Species Sample Average Change with respect change (%) to 2008/9 (%)
Aegithalos caudatus 268 1.9 (-3.1; 7) 10.04
Alauda arvensis 164 -2.5 (-6.6; 1.6) 0.03
Alcedo atthis 52 20.5 (0; 41.1) 54.14
Alectoris rufa 215 -9 (-14.7; -3.2)** -26.42
Anthus pratensis 261 8 (2; 14.1)** 22.6
Anthus spinoletta 29 -23.4 (-44.3; -2.5)* -45.89
Carduelis cannabina 253 17.9 (10.3; 25.4)** 75.7
Carduelis carduelis 348 19.3 (13.5; 25.2)** 62.06
Carduelis citrinella 11 -32.2 (-80.5; 16.1) -44.82
Carduelis spinus 88 1.2 (-14.3; 16.7) -24.71
Certhia brachydactyla 208 2.7 (-3.7; 9.1) 12.67
Cettia cetti 111 -2.9 (-11.1; 5.3) -16.73
Chloris chloris 271 9.2 (1.6; 16.8)* 31.97
Ciconia ciconia 98 26.4 (10.7; 42.1)** 191.07
Cisticola juncidis 83 -1.1 (-13.1; 10.8) 5.6
Coccothraustes coccothraustes 75 -9.4 (-25.6; 6.8) -37.82
Columba livia 160 11.2 (0.7; 21.7)* 64.81
Columba oenas 38 28.8 (-1.7; 59.4) 120.77
Columba palumbus 287 6.9 (1.3; 12.5)* 17.97
Corvus corax 225 10 (2.1; 17.9)* 35.8
Corvus corone 219 5.5 (1.3; 9.7)* 24.55
Corvus monedula 101 20.1 (6.1; 34)* 69.46
Cyanistes caeruleus 294 4.1 (0; 8.2)* 11.79
Cyanopica cookii 103 -10.6 (-17.7; -3.5)** -31.96
Dendrocopos major 204 6.8 (1.1; 12.6)* 18.45
Emberiza calandra 193 2.5 (-4.8; 9.8) 7.42
Emberiza cia 183 6.4 (-2.2; 15.1) 20.69
Emberiza cirlus 152 7.4 (-1.3; 16.2) 35.68
Emberiza citrinella 39 -4.5 (-22.1; 13.2) -10.26
Emberiza schoeniclus 44 -15.9 (-27.4; -4.4)** -33.32
Erithacus rubecula 356 8.1 (5.1; 11)* 28.09
Falco columbarius 49 5.6 (-23; 34.3) 6.04
Falco tinnunculus 254 -6.1 (-12; -0.2)* -18.06
Fringilla coelebs 367 5.8 (2.2; 9.4)** 15.69
Galerida cristata 201 -3.4 (-8; 1.2) -3.53
Galerida theklae 98 3.3 (-4.8; 11.4) 13.08
Garrulus glandarius 204 2.8 (-2; 7.5) 13.65
Grus grus 57 3.1 (-14.4; 20.6) -16.14
Hirundo rustica 29 -33.1 (-70.2; 4) -55.22
Lanius meridionalis 188 -1.8 (-8.5; 4.8) -3.65
Lophophanes cristatus 148 4.9 (-2.1; 11.9) 17.87
Species Sample Average Change with respect change (%) to 2008/9 (%)
Loxia curvirostra 50 3.2 (-10.6; 17.1) 3.83
Lullula arborea 131 -3.5 (-11.6; 4.6) -14.65
Melanocorypha calandra 76 -10.6 (-21.6; 0.3) -23.32
Monticola solitarius 24 2.3 (-25.2; 29.8) 15.26
Motacilla alba 301 5.3 (0.5; 10.1)* 24.02
Motacilla cinerea 118 12.4 (0; 24.8)* 57.97
Oenanthe leucura 13 0.5 (-24.9; 25.9) -15
Parus major 348 4.2 (1.1; 7.4)** 11.53
Passer domesticus 308 9.5 (4.6; 14.3)** 41.91
Passer hispaniolensis 48 4.2 (-7.9; 16.3) 1.71
Passer montanus 113 4.5 (-8.8; 17.9) 40.74
Periparus ater 168 19.8 (12.9; 26.7)** 61
Petronia petronia 76 6.6 (-13.2; 26.4) 36.06
Phoenicurus ochruros 269 4 (-0.5; 8.5) 16.13
Phylloscopus collybita 276 14.5 (9; 20.1)** 47.1
Pica pica 270 -1.9 (-4.9; 1.1) -4.36
Picus viridis 223 -3.4 (-8.9; 2) -8.68
Prunella modularis 145 10.4 (1.2; 19.5)* 38.57
Ptyonoprogne rupestris 44 -36.8 (-46.8; -26.8)** -71.71
Pyrrhocorax pyrrhocorax 78 2.8 (-11.2; 16.7) 24.34
Pyrrhula pyrrhula 82 -2.3 (-15.3; 10.8) -15.95
Regulus ignicapilla 195 -3 (-8.8; 2.8) -14.53
Regulus regulus 72 -33.7 (-46.2; -21.2)** -83.09
Saxicola rubicola 249 0.2 (-4.8; 5.2) 1.68
Serinus serinus 255 8 (0.8; 15.2)* 32.53
Sitta europaea 122 1.4 (-5; 7.9) 7.33
Streptopelia decaocto 186 10.2 (1.9; 18.5)* 58.05
Sturnus unicolor 308 12.5 (6.7; 18.4)* 45.13
Sturnus vulgaris 129 19 (4.8; 33.1)** 47.73
Sylvia atricapilla 199 19.8 (13.3; 26.3)** 80.02
Sylvia melanocephala 196 7.7 (2.5; 13)** 20.07
Sylvia undata 143 -2 (-9.7; 5.7) -8.59
Troglodytes troglodytes 204 8.4 (3.4; 13.4)** 28.7Turdus iliacus 118 -46.2 (-55.2; -37.2)** -84.95
Turdus merula 362 3.6 (0.9; 6.2)** 8.9
Turdus philomelos 291 -0.9 (-5.1; 3.3) -7.28
Turdus pilaris 55 -29.8 (-51.9; -7.8)* -81.09
Turdus viscivorus 232 4.1 (-2.1; 10.3) 8.22
Upupa epops 111 -4.4 (-12.9; 4.1) -13.26
Vanellus vanellus 140 -11.3 (-20; -2.6)* -36.02
Sample: number of sampling units considered in the analysis. Average interannual trend: average in the interannual variations between the winters of 2008/2009and 2011/2012. Change (%) with respect to 2008/2009: percentage of change in the populations with respect to 2008/2009. It shows the statistically significantresults (Wald Test: * p<0.05; ** p<0.01)
© E
duar
d Go
nzál
ez G
raci
a
Winter itinerary in Aigüestortes

The results shown here are the startingpoint to obtain the population trend forcommon birds in the National Parks Net-work and which can be used as an indica-tor of the state of the biodiversity in theseareas.
Obtaining the information needed to as-sess the trend of the state of conservationof bird populations is very useful so as towarn of changes affecting it within the Na-tional Parks Network. This indicator is al-ready being used on a European, nationaland regional scale, and is obtained th-rough the long-term monitoring program-mes Sacre and Sacin. This is why thesesampling programmes started in 2012 in
the current 14 national parks. After anumber of years of sampling, we will notonly have an indicator for the NationalParks Network, but we will also be able tocompare results with the rest of the terri-tory on a larger scale and check the diffe-rences between areas with differentenvironmental impacts.
We took into account the proportion ofeach habitat in each park to design thewinter itineraries and the spring samplingstations. In general, forests are the mostsampled, since it is the most abundant ha-bitat in many parks: conifers in Ordesa yMonte Perdido, Aigüestortes i Estany deSant Maurici and Sierra Nevada, Holm Oak
• Spring: Sampling following the same methodology as the Sacre programme within the limitsof the 14 national parks.
• Winter: Sampling following the same methodology as Sacin programme within the limits ofthe 14 national parks.
12 NATIONAL PARKS SEO/BIRDLIFE 2012 MONITORING PROGRAMMES
Virginia EscandellSEO/BirdLife
COMMON BIRD TRENDS IN NATIONAL PARKS
Aigüestortes i Estany de Sant Maurici National Park
© M
onts
erra
t Bac
ardi
t

forests in Monfragüe and Cabañeros, fo-rests of Canary Island pine in Caldera deTaburiente and Laurel forests in Garajo-nay. The shrub areas are represented inTeide, Atlantic Islands and Cabrera and thepastures in Picos de Europa. The wetlandareas are mainly concentrated in Daimieland part of Doñana, and the rocky areas, inTimanfaya. Although abundant, farmland isthe habitat with the least samplings, as itoccupies a low percentage of the nationalparks. In the high mountain parks there areslight differences in the sampling percen-tage between winter and spring: there aremore shrubs and pastures in spring, loca-ted at high altitudes and difficult to reach inwinter. This occurs in Sierra Nevada andAigüestortes, respectively.
The highest number of species and speci-mens are in the peninsular parks, espe-cially in Cabañeros, Tablas de Daimiel,Monfragüe and Doñana. The values aresmaller for those parks in high mountains(Picos de Europa, Ordesa, Aigüestortes andSierra Nevada), in particular for Aigües-tortes, probably due to the harsher condi-tions, especially in winter. The parks withthe least number of species and speci-mens, both in spring and winter, are in theBalearic and Canary islands, the latter inparticular. However, in the Atlantic Islandsof Galicia the number of species is more si-milar to those in high mountains in the Pe-ninsula than to those in other islands. It isthe second park in number of specimens inspring, after Daimiel (due to the large num-ber of seagulls).
In all the parks the number of species ishigher in spring than in winter with anaverage of 14 species more in spring, ex-cept in Cabrera, where two more specieswere found in winter.
More information at: www.seguimientodeaves.org
SEO/BIRDLIFE 2012 MONITORING PROGRAMMES NATIONAL PARKS 13
National Park Forests Shrub land Pastures Wetland areas Agricultural land Rocky areasSacre Sacin Sacre Sacin Sacre Sacin Sacre Sacin Sacre Sacin Sacre Sacin
Galician Atlantic Islands Maritime-Terrestrial Nat. Park 32 19 52 66 0 0 0 0 10 6 7 9
Picos de Europa 53 50 8 3 36 30 2 0 0 18 1 0
Ordesa y Monte Perdido 72 88 2 0 17 8 10 0 0 4 0 0
Aigüestortes i Estany de Sant Maurici 60 88 3 0 33 0 0 13 0 0 5 0
Monfragüe 83 92 17 8 0 0 0 0 0 0 0 0
Cabañeros 75 75 19 17 6 8 0 0 0 0 0 0
Tablas de Daimiel 5 0 0 0 0 0 95 100 0 0 0 0
Sierra Nevada 27 73 66 10 0 2 0 0 2 2 6 13
Doñana 60 25 24 25 0 13 16 38 0 0 0 0
Archipiélago of Cabrera 50 63 50 38 0 0 0 0 0 0 0 0
Caldera de Taburiente 100 100 0 0 0 0 0 0 0 0 0 0
Garajonay 100 100 0 0 0 0 0 0 0 0 0 0
Teide 13 0 88 100 0 0 0 0 0 0 0 0
Timanfaya 0 0 0 50 0 0 0 0 0 0 100 50
Percentage of sampling in each habitat in each national park in spring (Sacre) and in winter (Sacin)
GalicianAtlanticIslands
Maritime-Terrestrial
National Park
90
80
70
60
50
40
30
20
10
0Picos
deEuropa
Ordesay MontePerdido
Aigüestortesi Estanyde SantMaurici
Monfragüe Cabañeros Tablas deDaimiel
SierraNevada
Doñana Archip.Cabrera
Calderade
Taburiente
Garajonay Teide Timanfaya
No. s
peci
es
GalicianAtlanticIslands
Maritime-Terrestrial
National Park
5.000
4.500
4.000
3.500
3.000
2.500
2.000
1.500
1.000
500
0Picos
deEuropa
Ordesay MontePerdido
Aigüestortesi Estanyde SantMaurici
Monfragüe Cabañeros Tablas deDaimiel
SierraNevada
Doñana Archip.Cabrera
Calderade
Taburiente
Garajonay Teide Timanfaya
No. o
f spe
cim
ens
Number of specimens registered in each national park in spring (green) and in winter (blue)
Number of species registered in each national park in spring (green) and in winter (blue)

• The sampling unit is 5 points located within a 10 x 10 km UTM grid.• It is carried out over three days: the first between 1 December and 15 February, the second
between 1 March and 15 May and the third between 16 April and 30 June.• 10 minutes is spent at each census point taking note of all the species detected. It begins at
dusk and ends after approximately two hours.
14 NOCTUA. NOCTURNAL BIRD TRENDS SEO/BIRDLIFE 2012 MONITORING PROGRAMMES
Virginia EscandellSEO/BirdLife
NOCTURNAL BIRD TRENDS
Through the Noctua programme fieldworkthe most common nocturnal birds of preyare detected, but also other less commonspecies, like the Short-eared Owl and, veryoccasionally, over the years of sampling itsdistribution area, the Boreal Owl. We alsoobtain information on other groups of birdswith nocturnal habits, such as nightjars andthe Eurasian Stone-curlew. The results arepresented here, since we obtain sufficientdata for analysis and the methodology ap-plied is appropriate in these cases.
Out of the five most common species ofnocturnal birds of prey, three show quiteunfavourable results: The Eurasian ScopsOwl, the Barn Owl and the Little Owl. Allof them, to a greater or lesser extent, areassociated with areas of the livestock-farming mosaic and all show an index ofchange in population trend with negativevalues with respect to 2006. Only the Ea-gle Owl and the Tawny Owl display a po-sitive change, especially in the last year,and particularly the Eagle Owl.
Little Owl
© Q
uiqu
e M
arce
lo

After large population growth in previousyears, over the last three seasons it hasbeen stable but with a slight decrease.Now, it has returned to growth, showingan important increase this last season.The Tawny Owl’s positive change is sha-red with other birds associated with fo-rests, as can be seen in the results fromSacre programme.
In addition, Eurasian Stone-curlew andReck-necked Nightjar (species also asso-ciated with livestock farming habitats) havelikewise shown a decline. Nevertheless,European Nightjar, which has had manyups and downs in its population trend since2006, now shows an increase of almost20% in the last season, with respect to theprevious one.
The negative trend for the Eurasian Stone-curlew and the Little Owl discovered bythe Noctua programme coincides with re-sults from Sacre programme, although thedecrease of the Little Owl is much sharperaccording to data from daytime sampling.
More information at: www.seguimientodeaves.org
SEO/BIRDLIFE 2012 MONITORING PROGRAMMES NOCTUA. NOCTURNAL BIRD TRENDS 15
Trends of the most common species of nocturnal birds of prey in Spain (left). Trends of other nocturnal birds or with nocturnal activity in Spain (right)
Species Sample Average interannual Change (in %)change (2006-2012) with respect to 2006
Asio otus 98 -3.7 (-12.2; 4.8) 11.4
Athene noctua 269 0.3 (-1.9; 2.5) -4.8
Bubo bubo 150 13.8 (9.1; 18.5)** 142.6
Burhinus oedicnenus 101 -5.6 (-9.5; -1.7)** -29.6
Caprimulgus europaeus 218 1.3 (-2.3; 4.8) 18.8
Caprimulgus ruficollis 174 -4.9 (-8.1; -1.6)** -19.3
Otus scops 286 -2.6 (-4.7; -0.5)* -18.2
Strix aluco 166 3.9 (-0.5; 8.2) 43.9
Tyto alba 142 -2.5 (-9; 3.9) -10.9
Sample: number of sampling units considered in the analysis. Average interannual trend: averageinterannual variations between 2006 and 2012. Change (%) with respect to 2006: population percentagechange with respect to 2006. It shows the statistically significant results (Wald Test: * p<0.05; ** p<0.01)
OUT OF THE FIVE MOST COMMONSPECIES OF NOCTURNAL BIRDSOF PREY, THREE SHOW QUITEUNFAVOURABLE RESULTS: THEEURASIAN SCOPS OWL, THE BARN OWLAND THE LITTLE OWL.
700
600
500
400
300
200
100
01998 1999 2000 2001 2002 2003 2004 2005 2006 2007 2009 201120102008 2012
No. o
f col
labo
rato
rs
Noctua programme current coverage and participation change since 1998
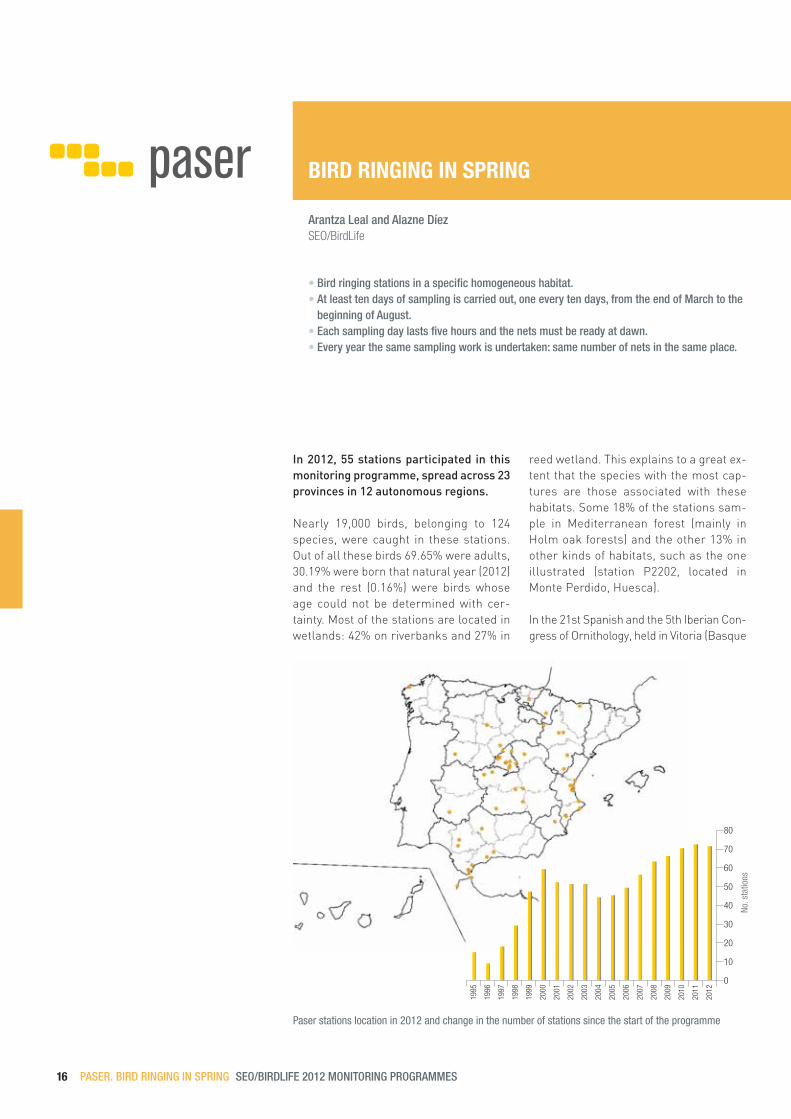
In 2012, 55 stations participated in thismonitoring programme, spread across 23provinces in 12 autonomous regions.
Nearly 19,000 birds, belonging to 124species, were caught in these stations.Out of all these birds 69.65% were adults,30.19% were born that natural year (2012)and the rest (0.16%) were birds whoseage could not be determined with cer-tainty. Most of the stations are located inwetlands: 42% on riverbanks and 27% in
reed wetland. This explains to a great ex-tent that the species with the most cap-tures are those associated with thesehabitats. Some 18% of the stations sam-ple in Mediterranean forest (mainly inHolm oak forests) and the other 13% inother kinds of habitats, such as the oneillustrated (station P2202, located inMonte Perdido, Huesca).
In the 21st Spanish and the 5th Iberian Con-gress of Ornithology, held in Vitoria (Basque
16 PASER. BIRD RINGING IN SPRING SEO/BIRDLIFE 2012 MONITORING PROGRAMMES
Arantza Leal and Alazne DíezSEO/BirdLife
BIRD RINGING IN SPRING
• Bird ringing stations in a specific homogeneous habitat.• At least ten days of sampling is carried out, one every ten days, from the end of March to the
beginning of August.• Each sampling day lasts five hours and the nets must be ready at dawn.• Every year the same sampling work is undertaken: same number of nets in the same place.
Paser stations location in 2012 and change in the number of stations since the start of the programme
80
70
60
50
40
30
20
10
0
1995
1996
1997
1998
1999
2000
2001
2002
2003
2004
2005
2006
2007
2008
2009
2010
2011
2012
No. s
tatio
ns
SEO/BIRDLIFE 2012 MONITORING PROGRAMMES PASER. BIRD RINGING IN SPRING 17
Country), in 2012, a poster analysed theparticipation in the Paser stations "Paser1995-2012. Eighteen years of a bird monito-ring programme through ringing".Available at www.seo.org.
The level of demand for this programmehas meant that the Paser stations ope-ration has varied over these 18 years. Weanalysed the change in the number ofstations under continuous operationover the years, the average lifetime andthe percentage of stations that met allthe methodological requirements of theprogramme.
Since 1995, a total of 177 stations haveparticipated: In recent years, an average of60 stations operating each season hasbeen maintained; 45% of them have beenworking for 5 or more years. Out of the 15initial stations, 4 of them remain active.
One of the keys to making the results ofthe Paser programme useful is to main-tain it the largest possible number of yearsand for that we make the following recom-mendations: 1. Carry out the bird ringingbetween several bird ringers, 2. Set thesampling point in places with easy-access,close to the participants residence andavoiding places with restricted access, and3. Run permanent training of new bird rin-gers to ensure future operations.
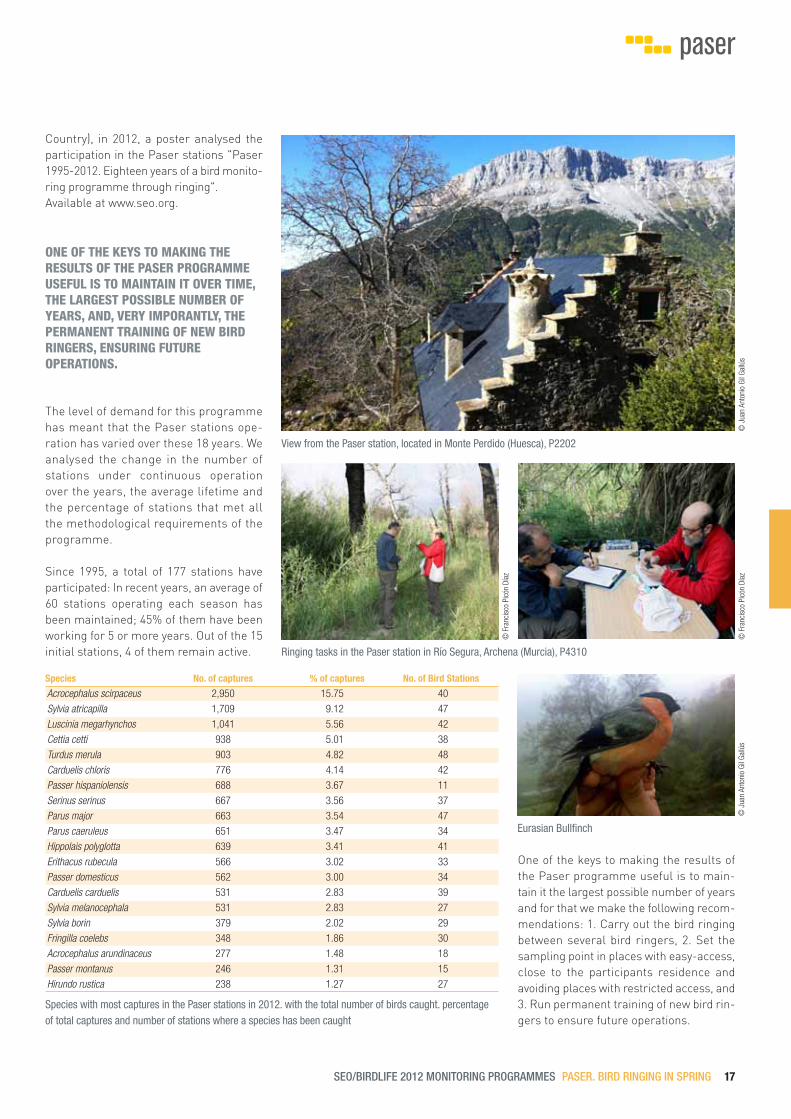
View from the Paser station, located in Monte Perdido (Huesca), P2202
Species No. of captures % of captures No. of Bird Stations
Acrocephalus scirpaceus 2,950 15.75 40
Sylvia atricapilla 1,709 9.12 47
Luscinia megarhynchos 1,041 5.56 42
Cettia cetti 938 5.01 38
Turdus merula 903 4.82 48
Carduelis chloris 776 4.14 42
Passer hispaniolensis 688 3.67 11
Serinus serinus 667 3.56 37
Parus major 663 3.54 47
Parus caeruleus 651 3.47 34
Hippolais polyglotta 639 3.41 41
Erithacus rubecula 566 3.02 33
Passer domesticus 562 3.00 34
Carduelis carduelis 531 2.83 39
Sylvia melanocephala 531 2.83 27
Sylvia borin 379 2.02 29
Fringilla coelebs 348 1.86 30
Acrocephalus arundinaceus 277 1.48 18
Passer montanus 246 1.31 15
Hirundo rustica 238 1.27 27
Species with most captures in the Paser stations in 2012. with the total number of birds caught. percentageof total captures and number of stations where a species has been caught
© J
uan
Anto
nio
Gil G
allú
s©
Fra
ncis
co P
icón
Día
z
Ringing tasks in the Paser station in Río Segura, Archena (Murcia), P4310
Eurasian Bullfinch
© F
ranc
isco
Pic
ón D
íaz
© J
uan
Anto
nio
Gil G
allú
s
ONE OF THE KEYS TO MAKING THERESULTS OF THE PASER PROGRAMMEUSEFUL IS TO MAINTAIN IT OVER TIME,THE LARGEST POSSIBLE NUMBER OFYEARS, AND, VERY IMPORANTLY, THEPERMANENT TRAINING OF NEW BIRDRINGERS, ENSURING FUTUREOPERATIONS.
PASER PHENOLOGY
The data generated by bird ringing throughthis monitoring programme can be analy-sed in many ways in order to obtain diffe-rent results. Up to now, the data wasused to show the change in the producti-vity index, and calculate the number ofyoung captured by year with respect tothe total number of captures (young plusadults). This index allows us to observeinterannual changes in the reproductivetrend of common birds breeding in Spain.
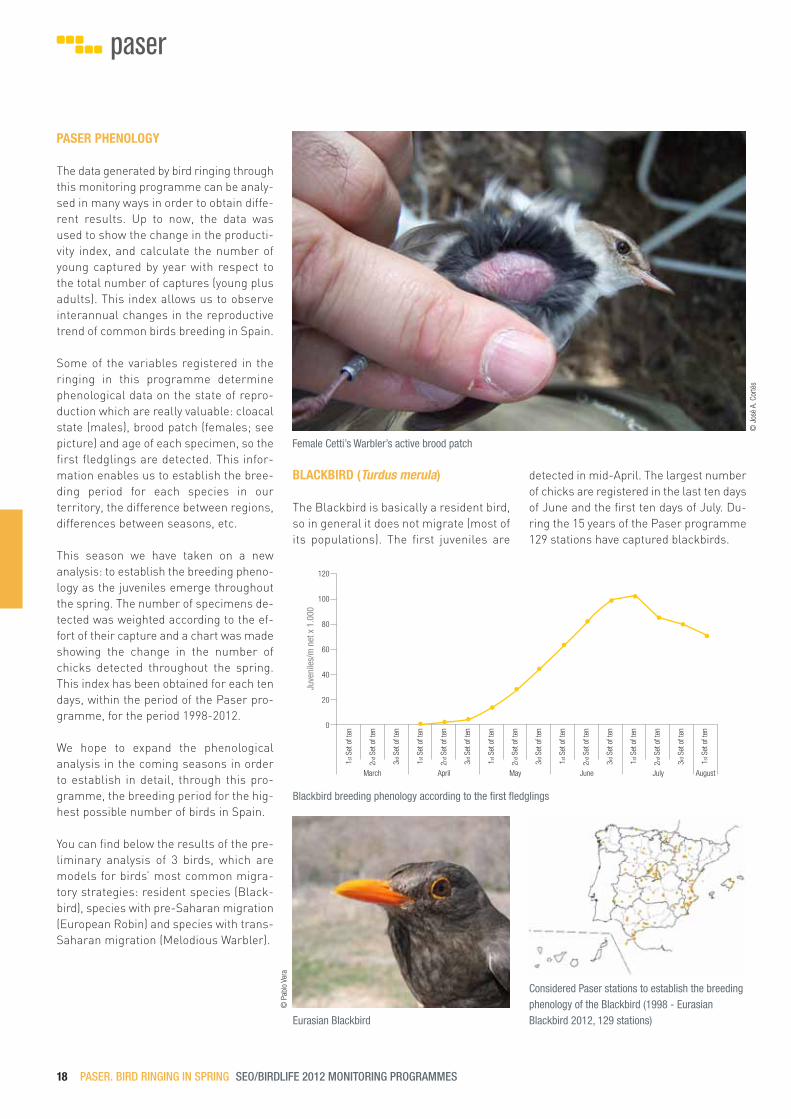
Some of the variables registered in theringing in this programme determinephenological data on the state of repro-duction which are really valuable: cloacalstate (males), brood patch (females; seepicture) and age of each specimen, so thefirst fledglings are detected. This infor-mation enables us to establish the bree-ding period for each species in ourterritory, the difference between regions,differences between seasons, etc.
This season we have taken on a newanalysis: to establish the breeding pheno-logy as the juveniles emerge throughoutthe spring. The number of specimens de-tected was weighted according to the ef-fort of their capture and a chart was madeshowing the change in the number ofchicks detected throughout the spring.This index has been obtained for each tendays, within the period of the Paser pro-gramme, for the period 1998-2012.
We hope to expand the phenologicalanalysis in the coming seasons in orderto establish in detail, through this pro-gramme, the breeding period for the hig-hest possible number of birds in Spain.
You can find below the results of the pre-liminary analysis of 3 birds, which aremodels for birds’ most common migra-tory strategies: resident species (Black-bird), species with pre-Saharan migration(European Robin) and species with trans-Saharan migration (Melodious Warbler).
18 PASER. BIRD RINGING IN SPRING SEO/BIRDLIFE 2012 MONITORING PROGRAMMES
Female Cetti’s Warbler’s active brood patch
© J
osé
A. C
orté
s
Considered Paser stations to establish the breedingphenology of the Blackbird (1998 - EurasianBlackbird 2012, 129 stations)Eurasian Blackbird
Juve
nile
s/m
net
x 1
.000
120
100
80
60
40
20
0
1st S
et o
f ten
2 nd S
et o
f ten
3 rd S
et o
f ten
1st S
et o
f ten
2nd S
et o
f ten
3 rd S
et o
f ten
1 st S
et o
f ten
2nd S
et o
f ten
3rd S
et o
f ten
1st S
et o
f ten
2 nd S
et o
f ten
3rd S
et o
f ten
1 st S
et o
f ten
2 nd S
et o
f ten
3 rd S
et o
f ten
1st S
et o
f ten
March April May June July August
Blackbird breeding phenology according to the first fledglings
BLACKBIRD (Turdus merula)
The Blackbird is basically a resident bird,so in general it does not migrate (most ofits populations). The first juveniles are
detected in mid-April. The largest numberof chicks are registered in the last ten daysof June and the first ten days of July. Du-ring the 15 years of the Paser programme129 stations have captured blackbirds.
© P
ablo
Ver
a

SEO/BIRDLIFE 2012 MONITORING PROGRAMMES PASER. BIRD RINGING IN SPRING 19
Considered Paser stations to establish the breedingphenology of the Melodious Warbler (1998 -Melodious Warbler 2012, 121 stations)Melodious Warbler
Juve
nile
s/m
net
x 1
.000
120
100
80
60
40
20
0
1st S
et o
f ten
2 nd S
et o
f ten
3 rd S
et o
f ten
1st S
et o
f ten
2nd S
et o
f ten
3 rd S
et o
f ten
1 st S
et o
f ten
2nd S
et o
f ten
3rd S
et o
f ten
1st S
et o
f ten
2 nd S
et o
f ten
3rd S
et o
f ten
1 st S
et o
f ten
2 nd S
et o
f ten
3 rd S
et o
f ten
1st S
et o
f ten
March April May June July August
Phenology of Melodious Warbler reproduction according to the emergence of fledglings
MELODIOUS WARBLER(Hippolais polyglotta)
The Melodious Warbler is a trans-Saharanmigrant that spends the winter in theequatorial regions in central and southernAfrica. It is one of the most captured spe-cies in Paser and it is easily identified byits long bouts of singing and its yellow co-lour, but it will not be seen easily on theground, as occurs with the two previousspecies. It feeds mainly on insects caughtin the vegetation where it lives.
The first juveniles are registered in mid-June and the highest number of youngspecimens emerge at the end of July orearly August. Its juveniles are the latest toappear of the three species studied.
More information at: www.seguimientodeaves.org
European Robin fledgling
1st S
et o
f ten
2 nd S
et o
f ten
3 rd S
et o
f ten
1st S
et o
f ten
2nd S
et o
f ten
3 rd S
et o
f ten
1 st S
et o
f ten
2nd S
et o
f ten
3rd S
et o
f ten
1st S
et o
f ten
2 nd S
et o
f ten
3rd S
et o
f ten
1 st S
et o
f ten
2 nd S
et o
f ten
3 rd S
et o
f ten
1st S
et o
f ten
Juve
nile
s/m
net
x 1
.000
120
100
80
60
40
20
0
March April May June July August
Phenology of the European Robin reproduction according to the emergence of fledglings
EUROPEAN ROBIN(Erithacus rubecula)
The European Robin shows a pre-Saharanmigratory strategy where the wintering limitis located in the north of Africa. Like theBlackbird, the Robin can easily be seen ea-ting on the ground, since its diet is made upof invertebrates that can be found in thesubstratum, although it can also eat smallberries and fruits, depending on the regionand season.
These birds move northwards to breed andthe moment to start catching juveniles bornthat year is similar to Blackbird dates. From10 to 20 July is when the maximum numberof specimens start flying, a bit earlier thanthe Blackbird.
© P
ablo
Ver
a©
Jos
é A.
Cor
tés
Considered Paser stations to establish the breedingphenology of the European Robin (1998-2012, 89stations)

The Birds and Climate programme hasalready gathered more than 80,000 re-gisters; some 20,000 have been recordedsince its start in 2007. The constant co-llaboration in providing dates of interestwill provide very solid information in thelong term.
This programme allows us to understandthe phenology of the species in great de-tail and at different regional scales. Theconstant gathering of information yearafter year at the same location reflects the
dates of arrival and departure of some mi-gratory species. Moreover, the knowledgeabout the breeding phenology of somebirds provides a good tool to work in con-servation, since it helps to have informa-tion to mark out sensitive periods inforestry work or hunting dates.
It is important to pay attention to the ob-servations and register the dates correctlyin order to establish the phenology ofeach species and assess future changesthat are not subject to natural variations.
20 BIRDS AND CLIMATE. BIRD PHENOLOGY SEO/BIRDLIFE 2012 MONITORING PROGRAMMES
Blas MolinaSEO/BirdLife
BIRD PHENOLOGY
• Selection of participation sites which are visited frequently or daily.• Record the observation dates (first arrivals, latest observations, first and last fledglings, etc.).
Barn Swallow
© J
avie
r Milla

As there is a lack of constant attention, itis essential that the selection of locationscorresponds to an area regularly fre-quented by the collaborator, and whomust have experience and knowledge ofthe area so that the data registered in the
programme contains the least chance oferror.
The current information on the databasecan define the general graph on pheno-logy of the most common species for
periods of migration, reproduction andwintering, bearing in mind the migratoryor sedentary behaviour shown by each ofthem. The easiest species to observehave the highest number of registers andare often seen in urban areas, like BarnSwallow, Common Swift or House Mar-tin. Phenology is determined by variousfactors such as latitude, altitude and to-pography. However, each year the prevai-ling weather conditions determine thefirst and last sightings (storms, prevai-ling winds, droughts, etc.).
The limits of the periods marked on thegeneral phenology graphs are shortenedin the coldest areas, mountains and areasfurthest from migratory routes. Conver-sely, they are extended in southern areasof the Peninsula, warmer areas or in pla-ces where migratory flows are detected.The migratory or wintering contingentvery often overlaps or meets the seden-tary population. Furthermore, there arefew specimens at the beginning and endof each period with the bulk of the popu-lation migrating, breeding or wintering inthe middle of each period.
More information at: www.avesyclima.org
SEO/BIRDLIFE 2012 MONITORING PROGRAMMES BIRDS AND CLIMATE. BIRD PHENOLOGY 21
Phenology of the 10 most registered species in the Birds and Climate programme. Data available displayed.Each square corresponds to a period of 10 days in each month (decade)
BRE: Breeding season. Occupation of area during breeding until abandonment, fights and disputes between males,pairing, etc.MIG: Prenuptial migration period (destined for breeding area) or post-nuptial (destined for wintering areas) is initiatedwith the arrival or departure of the first specimens according to species. WIN: Wintering period. Birds established in an area over a period during the winter months.
Number of registers included in the phenologydatabase of SEOBird/Life, AEMET (NationalMeteorology Agency) and Phenology File(SEOBirdLife and Birds and Climate historical data)

In 2012 we obtained the first results fromthe birds ringed in the Migra programmeand their migration trips. The programmestarted in 2011 thanks to the support ofFundación Iberdrola. The aim of this pro-gramme is to study bird migrations andmovements through the most modern re-mote monitoring technologies which, for-tunately, improve every year, allowing us toaddress new challenges.
In 2011 we marked more than 90 birdsbelonging to 5 species with differentkinds of devices: 7 European Booted Ea-gles with GPS data loggers and 26 Com-mon Terns, 17 European Bee-eaters, 12Eurasian Scops-Owls and 30 Great Reed-Warblers with geolocators. The first re-sults came in the second year of theprogramme. Thus, we are finding out indetail the migration journey, the winte-ring and resting areas in the migrationand when the birds leave and return totheir breeding areas.
The marking of the European Booted Ea-gles with GPS data loggers was very suc-cessful and also very exciting, since wewere able to consult their movementsdaily and in real time, monitoring theirmigration and wintering trips 2011/2012through www.migraciondeaves.org. Outof the marked specimens, we recapturedtwo European Booted Eagles, two Euro-pean Bee-eaters, two Great Reed-War-blers and two Common Terns in order to
download the information from the geo-locators and data loggers.
THE FIRST MIGRATION REVEALED:THE EUROPEAN BOOTED EAGLE’S TRIP
We only knew that Spanish European Boo-ted Eagles crossed the Strait of Gibraltar andwent beyond the desert to winter thanks to afew recuperated birds, marked in Spain andfound dead in Sahel in winter. Now they arethe first species with results in the Migraprogramme. Thanks to the specimens mar-ked with GPS by SEO/BirdLife and the Go-vernement of Extremadura in Castilla yLeón, Catalonia, the Region of Valencia, Ex-tremadura and Madrid in 2011, some of thesecrets of their migration and winteringareas are now revealed.
The European Booted Eagles leave theirbreeding areas in Spain in mid-Septemberand, after a trip of 13-50 days, they reachtheir wintering areas in mid-October.
They spend the winter in sub-SaharanAfrica, in Guinea, Mali, Mauritania, Niger,Nigeria and Sierra Leone, in a narrow stripwith a width of around 1,500 km, furthersouth than the Egyptian Vultures, Short-toed Snake Eagles, Montagu’s Harriersand Spanish Lesser Kestrels. In generalterms, they spend the whole winter in asingle wintering area at 2,800-3,500 kmfrom their nests.
• Remote device migration monitoring• Long-term work sites, such as continuous ringing stations, bird boxes, etc., are used as
marking points for small species.
22 MIGRA. BIRD MIGRATION SEO/BIRDLIFE 2012 MONITORING PROGRAMMES
Javier de la Puente, Ana Bermejo and Juan Carlos del MoralSEO/BirdLife
BIRD MIGRATION

Between the end of February and mid-March, after about five months in theSahel and far away from their nests, theyleave the wintering areas in Africa and,
after a one-month trip (between 18-42days), they come back to the same nestsas the previous year during the first fort-night of April. The migration back to Spainis slower than the autumn one and gene-rally following a route further to the west.
This is called "circuitous migration". Thefollowing winter they migrate back to thesame wintering areas.
The European Booted Eagles travel anaverage of 200 km per day, with a maxi-mum of 500 km per day. During their mi-gration they may sometimes rest forweeks at a time, in an intermediate placebetween the breeding and wintering areas,as shown by a specimen which stopped onits two migrations in northern Morocco.
As expected for a gliding bird of prey, theyonly fly during the daytime and cross fromEurope to Africa by the Strait of Gibraltarin both migrations.
With the data from the first year of work,and thanks to researchers from AlicanteUniversity, Bird Study (a prestigious inter-national science magazine, devoted to ap-plied ornithology) published the firstresults on migration.
But there is still much information toanalyse and publish. For instance, thelocal movements within the breedingareas of some specimens proved sur-prising. In fact, there are cases ofdaily trips of up to 60 km away from
the nest to areas with an abundanceof prey to hunt.
THE JOURNEYS OF A 30-GRAMMEPASSERINE THE GREAT REED-WARBLER
For the first time we know in some detailthe migratory journey and wintering areaof a Passerine in Spain: the Great Reed-Warbler. Although this trans-Saharan mi-gratory bird has, since the 80’s, often beenringed in Spain (more than 29,000 ringedspecimens and more than 3,000 recupera-ted) there were only 7 ringed specimenscaptured in Africa (6 in Morocco, probablystill in migration, and 1 in Mauritania, clo-ser to the wintering area), so the winteringareas in Africa remained a mystery.
In the spring of 2011 SEO/BirdLife fitted 30birds with geolocators in Madrid, Valencia-Alicante and Vitoria (Basque Country). Thefieldwork was carried out in collaborationwith researchers from Valencia Universityand the ringing groups Pit-Roig, Merula,Txepetxa and Aranzadi.
In the spring of 2012 two ringed birds wererecuperated. A male ringed in Madrid over-wintered in two areas of Mali and BurkinaFaso, at 3,000 km from its breeding area.After leaving Spain at the beginning of Au-gust, it reached its wintering area in early
SEO/BIRDLIFE 2012 MONITORING PROGRAMMES MIGRA. BIRD MIGRATION 23
Trips of up to 60 km from the nest of a breeding European Booted Eagle in Madrid
European Booted Eagles migratory journeys
Great Reed-warbler migratory journeys
THE EUROPEAN BOOTED EAGLE SPENT THE WINTER AT 2,800-3,500 KM FROM ITSNEST. IT TRAVELLED AN AVERAGE OF 200 KM PER DAY, WITH A MAXIMUM OF 500 KMPER DAY.
specimens belonging to 13 species werefitted with satellite transmitter devicesand geolocators.
One new species is the White Stork, thefirst adult specimens marked in Spainwith GPS-satellite transmitters in collabo-ration with the regional governments of LaRioja and the Basque Country.
The marking of the Red Kite began in thewinter of 2012-2013, thanks to the supportof Fundación Biovidersidad. The birdswere marked in Aragón, Castilla y Leónand Madrid. This species is in danger ofextinction in Spain. The information that isbeing gathered will be of great help for itsfuture conservation.
In addition, Common Swifts were fittedwith geolocators for the first time in Spain.Some specimens of Great Reed-Warbler,Eurasian Scops-Owl, Cory’s Shearwaterand Bulwer’s Petrel, recuperated in 2013,were marked again.
The marking of these new species wasundertaken thanks to the collaboration ofother entities. For the first time in Spain,the Ornithology Group SEO-Monticolamarked Barn Swallows and CommonNightingales with geolocators, in Madrid.The Extremadura regional governmentprovided information on two new BootedEagles, two European Rollers and the firstEuropean Bee-eater marked in Spain witha GPS-satellite transmitter, apart from the
September, where it remained until theend of November. Then, it flew to a secondwintering area, 600 km to the west, whereit stayed until it returned to Spain, reachingits breeding area at the beginning of May.
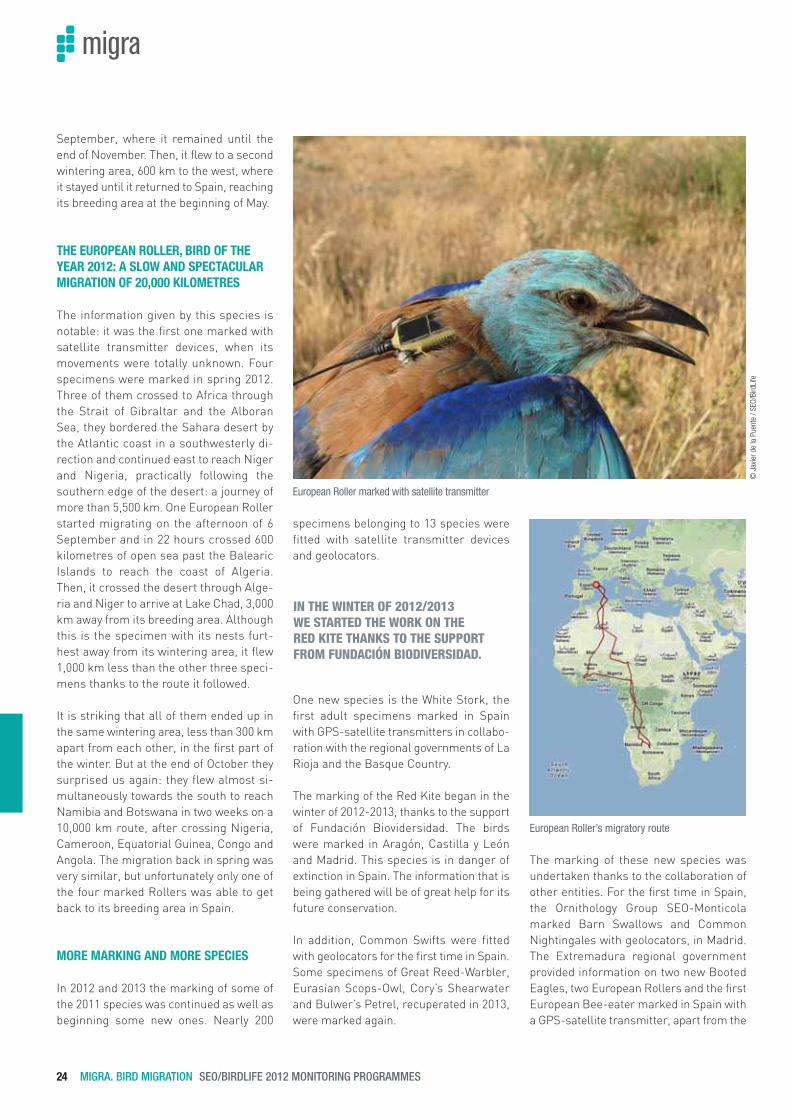
THE EUROPEAN ROLLER, BIRD OF THEYEAR 2012: A SLOW AND SPECTACULARMIGRATION OF 20,000 KILOMETRES
The information given by this species isnotable: it was the first one marked withsatellite transmitter devices, when itsmovements were totally unknown. Fourspecimens were marked in spring 2012.Three of them crossed to Africa throughthe Strait of Gibraltar and the AlboranSea, they bordered the Sahara desert bythe Atlantic coast in a southwesterly di-rection and continued east to reach Nigerand Nigeria, practically following thesouthern edge of the desert: a journey ofmore than 5,500 km. One European Rollerstarted migrating on the afternoon of 6September and in 22 hours crossed 600kilometres of open sea past the BalearicIslands to reach the coast of Algeria.Then, it crossed the desert through Alge-ria and Niger to arrive at Lake Chad, 3,000km away from its breeding area. Althoughthis is the specimen with its nests furt-hest away from its wintering area, it flew1,000 km less than the other three speci-mens thanks to the route it followed.
It is striking that all of them ended up inthe same wintering area, less than 300 kmapart from each other, in the first part ofthe winter. But at the end of October theysurprised us again: they flew almost si-multaneously towards the south to reachNamibia and Botswana in two weeks on a10,000 km route, after crossing Nigeria,Cameroon, Equatorial Guinea, Congo andAngola. The migration back in spring wasvery similar, but unfortunately only one ofthe four marked Rollers was able to getback to its breeding area in Spain.
MORE MARKING AND MORE SPECIES
In 2012 and 2013 the marking of some ofthe 2011 species was continued as well asbeginning some new ones. Nearly 200
24 MIGRA. BIRD MIGRATION SEO/BIRDLIFE 2012 MONITORING PROGRAMMES
European Roller marked with satellite transmitter
© J
avie
r de
la P
uent
e / S
EO/B
irdLi
fe
IN THE WINTER OF 2012/2013WE STARTED THE WORK ON THE RED KITE THANKS TO THE SUPPORTFROM FUNDACIÓN BIODIVERSIDAD.
European Roller’s migratory route

two Booted Eagles and the Black-shoul-dered Kite marked in 2011.
The Terra Natura Biological Station (Uni-versity of Alicante) informed on the move-ments of the first Lesser Kestrels taggedin Spain with satellite transmitters, as wellas five Short-toed Snake Eagles. Cabañe-ros National Park gave the data about 11Black Vultures marked in 2006. BarcelonaUniversity made available data for 2 Eura-sian Scops-Owls, 3 Cory’s Shearwatersand 14 Bulwer’s Petrels.
The Swiss Stork organisation, Grefa (Ma-drid) and Grupo SaBio from the Institute ofCinegetic Resources or IREC, by its initialsin Spanish (UCLM-CSIC-JCCM) are givinginformation on many specimens for theproject’s website.
It is also important to highlight that inspring 2013 four European Rollers, twoBarn Swallows, two Common Nightinga-les, one Great Reed-Warbler and oneCommon Swift were recuperated with thegeolocators – all of them had valuable
information accumulated since theirmarking, nearly one year ago. In the co-ming months, after analysing the data,we will be able to publish for the first timethese three species’ -marked in Spain-wintering areas and migration in detail.
WWW.MIGRACIONDEAVES.ORG
Migra programme’s web page is becomingthe reference website on bird migration inSpain. In mid-2013, there is information on171 specimens belonging to 18 differentspecies, with more than 245,000 locations.
During 2012 many innovations improvedthe display of information and facilitatedits dissemination. An RSS system was in-cluded as well as an option to subscribeto a distribution list to receive the Migrae-news. In addition, the new section todonate will allow everyone to help finan-cially, from small quantities to adopting abird, so the programme can mark morespecimens. We are now uploading pdffiles and in the future we will include pu-blications and monographs obtained withthe analysis of all the information beinggathered.
More information at: www.migraciondeaves.org
SEO/BIRDLIFE 2012 MONITORING PROGRAMMES MIGRA. BIRD MIGRATION 25
Common Swift marked with a geolocator
Common Nightingale with a geolocator
Marking a Common Nightingale with a geolocator
© J
avie
r de
la P
uent
e / S
EO/B
irdLi
fe
© J
avie
r de
la P
uent
e / S
EO/B
irdLi
fe©
Car
los
Ponc
e

In 2012-2013, SEO/BirdLife carried out acensus on the breeding and winteringGreat Cormorant, within the internationalcensus promoted by IUCN/Wetlands Inter-national Cormorant Research Group andthe "CorMan" project, in collaborationwith the European Commission, whoseaim was to assess the number and distri-bution of the Great Cormorant in theWestern Palearctic.
The first two attempts of this species atbreeding were recorded in the 1980s and
since then new colonies have appeared. In2007 a minimum of 532 pairs were coun-ted while in 2012 that figure rose to 1,605.That means that the breeding populationhas tripled in five years.
The Great Cormorant wintering populationstill shows a positive trend, although mo-re moderate. In January 2013 the third cen-sus was carried out in order to update thechange a decade after the previous census.Over 1,000 sites were visited, counting aminimum of 78,893 specimens.
26 BIRD POPULATION SIZE. THE GREAT CORMORANT IN SPAIN SEO/BIRDLIFE 2012 MONITORING PROGRAMMES
BIRD POPULATION SIZE
Great Cormorant colony in Encinta. Extremadura
© Á
ngel
Sán
chez
Blas MolinaSEO/BirdLife
THE GREAT CORMORANT IN SPAIN BREEDING AND WINTER POPULATIONIN 2012-2013
• Spring: direct census of breeding colonies.• Winter: roosts census.

DISTRIBUTION AND SIZEOF THE BREEDING POPULATION
During the breeding Cormorant census 293wetlands were visited, especially those si-tes known to be breeding areas, siteswith previous traces or with specimenspresent throughout the year. Some 125participants obtained a good coverage.
They detected 21 colonies in 24 provinces,in 5 autonomous regions, mainly in thesouth east of the Peninsula, with a mini-mum of 1,605 pairs. The most important co-lonies were found in Badajoz (Extremadura)
and 70% of the pairs were in the Guadia-na and Tagus rivers basins. In the northernhalf of the Peninsula there was only a smallcolony in Navarre. The rest were located inthe middle zone of the Duero river basin.Virtually all the breeding points are in re-servoirs or rivers.
The nests were in trees over 3 meters tall,especially in holm oaks, poplars, French ta-marisk and eucalyptus. Only the colony inNavarra was located in a reed wetland. Onoccasions, the nests are found in Ardeida-e’s colonies, as is the case of the El Puente
gravel pits (Toledo), Pisuerga river (Palen-cia), Pitillas Lagoon (Navarra) and Zufre re-servoir (Huelva).
The biggest colony is located in La Sere-na reservoir (Badajoz) with over 600 nestsin holm oaks. The average colony size isbelow 50 nests, having isolated nests infour cases.
Although we did not make any special effortto count non-breeding specimens, there we-re about a thousand of them in early sum-mer, scattered around 29 provinces.
SEO/BIRDLIFE 2012 MONITORING PROGRAMMES BIRD POPULATION SIZE. THE GREAT CORMORANT IN SPAIN 27
Num
ber o
f col
onie
s1-50
16
14
12
10
8
6
4
2
0
Colony size (no. of nests)
51-100 101-200 201-650
Distribution of Great Cormorant population in the breeding season 2012
Colony ranking by number of nests
Autonomous region No. of pairs
Extremadura 651
Castilla-La Mancha 483
Andalusia 259
Castilla y León 205
Navarra 7
Total 1,605
Number of Great Cormorant breeding pairs in 2012by autonomous region.
Province No. of pairs
Badajoz 651
Toledo 468
Jaén 196
Salamanca 120
Valladolid 60
Huelva 54
Zamora 24
Ciudad Real 15
Cádiz 8
Navarra 7
Granada 1
Palencia 1
Total 1,605
Number of Great Cormorant breeding pairs in 2012by province
River basin No. pairs %
Guadiana 666 41.50
Tagus 468 29.16
Guadalquivir 251 15.64
Duero 205 12.77
Andalusian Atlantic 8 0.50
Ebro 7 0.44
Total 1,605 100.00
Number of Great Cormorant breeding pairs in 2012by river basin.
1-50
51-100
101-200
201-400
401-700
Great Cormorant no. of pairs

The trend change in the breeding popu-lation in Spain is clearly positive, with anoutput that now triples the 2007 figure.Despite some colonies appearing anddisappearing between seasons, others, weknow, remain, like those in the Rosaritoreservoir in Toledo, the Castronuño riverbanks in Valladolid or the Guadalén andGiribaile reservoirs in Jaén.
WINTER DISTRIBUTION AND POPULATIONSIZE (2012-2013)
In January 2013, the 3rd national censuson wintering Great Cormorant was carriedout. It basically focused on detecting andcounting the roosts or groupings formedby the cormorants overnighting. Only insome cases the Cormorants outside ofthese groupings were considered, wherethe counting was very tough due to the dif-ficulty in locating the sites or where therewere many small roosts.
Some 1,090 wetlands and sites were pros-pected, including some coastal stretches.We paid particular attention to sites withevidence of roosts in previous years and inthose with positive results in the 2003 na-tional census.
Nearly a thousand people participated inthis task. The minimum number of speci-mens counted was 78,893.
The Andalusian region hosted the most nu-merous population with over 20,000 speci-mens. Another five autonomous regionsexceeded 5,000 birds. On this occasion, afew specimens were also registered in theCanary Islands and Ceuta. Valencia pro-vince hosted the highest number of winte-ring specimens (7,828) and another threeprovinces (Sevilla, Badajoz and Murcia) ex-ceeded 5,000.
The Albufera of Valencia is one of the mainconcentration points for wintering cormo-rants, accounting for over 50% of thosebirds in the Valencia region. Other notablewetlands with over a thousand specimenswere the River Ebro Delta in Tarragona, Re-dondella Island and Isla Grossa in Murcia,the Valuengo reservoir in Badajoz and theOdiel Marshes and Isla Cristina in Huelva.
28 BIRD POPULATION SIZE. THE GREAT CORMORANT IN SPAIN SEO/BIRDLIFE 2012 MONITORING PROGRAMMES
Autonomous Regions/ Number of specimensProvinces
Almería 1,042
Cádiz 3,314
Córdoba 2,226
Granada 446
Huelva 4,138
Jaén 1,119
Málaga 1,127
Seville 6,997
Andalusia 20,409
Huesca 499
Teruel 199
Zaragoza 1,845
Aragón 2,543
Asturias 1,340
Asturias 1,340
Cantabria 702
Cantabria 702
S, C, Tenerife 11
Las Palmas 1
Canary Islands 12
Ávila 189
Burgos 226
León 1,231
Palencia 517
Salamanca 629
Segovia 168
Soria 248
Valladolid 873
Zamora 1,826
Castilla y León 5,907
Albacete 304
Ciudad Real 1,408
Cuenca 147
Guadalajara 336
Toledo 3,857
Castilla-La Mancha 6,052
Autonomous Regions/ Number of specimensProvinces
Barcelona 1,988
GIrona 1,086
Lleida 1,395
Tarragona 4,277
Catalonia 8,746
Alicante 1,057
Castellón 794
Valencia 7,282
Valencia Region 9,133
Ceuta 41
Badajoz 5,736
Cáceres 2,762
Extremadura 8,498
A Coruña 1,530
Lugo 552
Ourense 826
Pontevedra 1,380
Galicia 4,288
Mallorca 376
Menorca 163
Ibiza 0
Formentera 3
Cabrera 0
Balearic Islands 542
La Rioja 1,006
Madrid 1,849
Murcia 5,598
Navarra 1,184
Álava 261
Guipúzcoa 400
Vizcaya 382
Basque Country 1,043Total 78,893
Number of Great Cormorant specimens counted inroosts by autonomous region and province inJanuary 2013
Great Cormorant
© R
amón
Eló
segu
i

The trend continues to be positive, risingby about 10,000 specimens with respect to2003 (68,785 Cormorants) in generalterms, with slight or similar increases inmost regions. Some autonomous regionspresented a decrease in their winteringpopulations, like the Valencia region andNavarra. Although Extremadura resultedin a smaller number, it could well be amore adjusted figure than that of 2003.Aragón showed inferior values, perhapsdue to lower coverage.
More information at: www.seguimientodeaves.org
Null1-910-99100-999
>999
Number of individuals of Great Cormorant
SEO/BIRDLIFE 2012 MONITORING PROGRAMMES BIRD POPULATION SIZE. THE GREAT CORMORANT IN SPAIN 29
Wetland/Site Province No. of specimens
Albufera of Valencia I Valencia 3,345
Isla Redondella (Mar Menor) Murcia 3,032
Albufera of Valencia II Valencia 2,874
Odiel Marshes Huelva 2,346
Isla Grosa Murcia 1,945
Paraje Natural Marismas de Isla Cristina/Ayamonte Huelva 1,120
National Park Delta de l’Ebre: Salinas-Punta de la Banya Tarragona 1,048
Valuengo Reservoir Badajoz 1,032
Corta de los Olivillos Sevilla 850
Tarfia (Veta la Palma) Sevilla 846
Guadiana River-Orellana Reservoir Badajoz 832
National Park Delta de l’Ebre: Badia del Fangar Tarragona 803
Foix Reservoir Barcelona 784
Torre del Águila Reservoir Sevilla 779
River Guadalquivir, Alcolea del Río Sevilla 705
The 15 wetlands with highest number of wintering specimens registered
Some roosts gathering on coastal cliffs
© J
uan
Jim
énez
Distribution and size of the cormorant roosts in winter, 13th January

The data obtained from the water birdcensus have traditionally been analysed inorder to attain information on wetland si-tes, provinces, autonomous regions or ona national level, but not on a hydrographi-cal demarcation scale.
The concept of "hydrographical demarca-tion" stems from the EU Water Frame-work Directive, passed in 2000, andcorresponds to the terrestrial and marinearea formed by one or several close river
basins and the transitional, subterraneanand coastal waters associated with them.A river basin is an area which drains itswater into the sea through a main riverand all the streams, creeks, lagoons, etc.Therefore, demarcation is a concept di-rectly linked to the way water is managedand administered as a natural resource.The flood level and the state of conserva-tion of the wetlands in each river basinhave an effect on the number of waterbirds overwintering each season.
30 CENSUS OF AQUATIC BIRDS IN WINTER SEO/BIRDLIFE 2012 MONITORING PROGRAMMES
Tufted Duck
© Q
uiqu
e M
arce
lo
OVERWINTERING WATER BIRDSAND HYDROGRAPHICAL DEMARCATIONSBlas MolinaSEO/BirdLife
• Wetlands direct census.• Mid-January.• Preferably at dawn or dusk, especially in sites with vegetation.
CENSUS OF AQUATIC BIRDS IN WINTER

Fifteen demarcations have been conside-red for the Peninsula and the Balearic Is-lands. In 2010 the highest number of waterbirds were found in the Ebro and Guadal-quivir river demarcations, in two large we-tlands: The Ebro Delta and GuadalquivirMarshlands.
On a wider scale we obtain eight hydro-graphical groups, grouping demarcationsby their similar hydrological and climaticfeatures. The units corresponding to Anda-lusia and the river Ebro and the basins inCatalonia concentrate about 60% of waterbirds. Most water birds concentrate in win-ter in the coastal wetlands or around them.This is why the coastal hydrographicalgroups register greater numbers. The in-dex of change in the wintering populationof Anatidae and Coots per hydrographicaldemarcation (with 1991 as the referenceyear, when it started) shows notable decre-ases in Andalusia and uncertain results inthe short term. For the Guadiana demar-cation the index resulted negative, both inthe short and long term. By contrast, theBalearic populations shows positive chan-ges in both periods.
More information at: www.seguimientodeaves.org
SEO/BIRDLIFE 2012 MONITORING PROGRAMMES CENSUS OF AQUATIC BIRDS IN WINTER 31
Hydrographical demarcations
Tablas de Daimiel
© B
las
Mol
ina
Grouped hydrographical demarcations and wetlands censused in each
Hydrographical Anatidae Other Total % %Demarcation and Coots water birds Cumulative
Ebro 223,315 214,437 437,752 23.07 23.07
Guadalquivir 201,880 221,661 423,541 22.32 45.39
Galicia-Costa 18,208 131,918 150,126 7.91 53.30
Júcar 51,871 78,394 130,265 6.86 60.17
Andalucia Atlantic Basin 11,422 118,407 129,829 6.84 67.01
Guadiana 69,879 51,900 121,779 6.42 73.43
Duero 91,114 22,637 113,751 5.99 79.42
Catalonia Interior Basin 12,586 83,167 95,753 5.05 84.47
Tajo 39,575 43,421 82,996 4.37 88.84
Cantábrico 19,538 53,523 73,061 3.85 92.69
Segura 21,453 19,239 40,692 2.14 94.84
Andalucia Mediterranean Basin 8,263 26,751 35,014 1.85 96.68
Islas Baleares 17,563 14,081 31,644 1.67 98.35
Basque Country Interior Basin 1,908 16,583 18,491 0.97 99.32
Miño-Sil 5,312 7,532 12,844 0.68 100.00
Total 793,887 1,103,651 1,897,538 100.00
General results of census of wintering water birds in Spain in 2010 per Hidrographical demarcation
Hydrographical Anatidae Other Water birds % % Change (%) Change (%) Demarcation-Grouped and Coots water birds group Cumulative 1991-2010 2000-2011
Andalucia 221,565 366,819 588,384 31.01 31.01 -13.24 Sin definir(1)
Ebro & Catalonia Int. Basin 235,901 297,612 533,513 28.12 59.12 10.28 2.41
Norte 44,966 209,556 254,522 13.41 72.54 11.82 4.73
Levante 73,324 97,633 170,957 9.01 81.55 -1.33 -1.05
Guadiana 69,879 51,900 121,779 6.42 87.96 -35.98 -52.09
Duero 91,114 22,629 113,743 5.99 93.96 158.98 -8.58
Tajo 39,575 43,421 82,996 4.37 98.33 21.12 -43.23
Baleares 17,563 14,081 31,644 1.67 100.00 196.61 197.88
Total 793,887 1,103,651 1,897,538 100.00 -3.67 -3.09
Number of specimens of wintering water birds and change index (in the short and long term) of Anatidaeand Coot populations per Hydrographical Demarcation. (1) Non-significant result

BIRD DISTRIBUTION
32 BIRD DISTRIBUTION PROGRAMAS DE SEGUIMIENTO DE AVIFAUNA DE SEO/BIRDLIFE 2012
After many years of work (2006-2012),the Atlas of birds in winter in Spain has justbeen published.
It took seven years to prepare it, from theinitial work and planning (2006) andchecks to implement the methodology,contrast the results and analyse the workneeded to obtain the proposed goals(2007).
Now, a new challenge begins: to updatethe Atlas in spring.
The latest atlas of breeding birds in Spainwas published 10 years ago. Not only mustwe update the information to keep track ofthe changes in bird populations and to tryto identify where the problems lie –wemust also address the renewal of thisatlas for many other reasons.
On the one hand, using a similar methodo-logy to the atlas in winter is interesting be-cause then we can compare the data moreeasily and create a repeatable samplingsystem that facilitates the registration ofchanges over time. On the other hand, weneed to bear in mind that the whole of Eu-rope is working on a new atlas in the bre-eding season and we cannot be left behind.Spain needs to contribute to such an im-portant general interest project.
SEO/BirdLife is going to take the neces-sary steps to organise this new task in
order to have a new publication by 2020,although we will try to have the fieldworkfinished by 2017, so that all the informa-
Juan Carlos del MoralSEO/BirdLife
� 2,600 participants
� 1,600 various monitoring programmes
� 1,071 atlas participants
� 2,121 complete grids
� 40,106 itineraries
� 120,317 km of sampling (1.8 laps of the Earth)
� 30,100 hours (3 years and 5 months)
� 407 species:
· 314 habitual: 238 abundant / 76 scarce
· 35 rare
· 58 exotic

PROGRAMAS DE SEGUIMIENTO DE AVIFAUNA DE SEO/BIRDLIFE 2012 BIRD DISTRIBUTION 33
tion will be included in the new Europeanatlas of breeding birds.
A scientific committee will be created(from the SEO/BirdLife scientific commit-
tee) that will establish the appropriatemethodology to try to obtain the best re-sults. The methodology and desired re-sults (within our limitations) will dependon several questions:
• Number of collaborators. Ideally, wewould like to count on 5,600 participants,corresponding to the number of grids inSpain, taking as a sample unit the UTM10x10 km grid. If there were one partici-pant per grid, everything would be easy.
• Experience of the collaborators. Thebasic idea is to show where a species ismore abundant or scarcer (or where it ismore or less probable to find it), but it isnot easy to carry out qualitative censu-ses or properly census the number ofdetected specimens per species andcalculate the distances between detec-tions. The strong mathematical link bet-ween the number of specimens in anarea and the frequency of occurrencehas been verified, so it is possible to optfor a double methodology, like in thewintering bird atlas. One to collect listsof detected species periodically (per-haps under the breeding categories:possible, probable, certain) and anotherto quantify the specific number of birdsin the itineraries. The quantitative workby a few people could complement thequalitative work by many.
• The sampling effort needed to obtainenough data to facilitate as much aspossible the fieldwork of the volunteerswho will participate in the atlas, but en-suring good coverage of each partici-pant’s fieldwork. An example is theresult from the design of the winter atlasfieldwork, where the limit of the effortrequested of the participants was esta-blished when examining the curves of
accumulation of species per grid as thenumber of itineraries increased (seegraph). That pilot study confirmed, forinstance, that with 15 working hours inwinter in three seasons (60 itineraries of
15 minutes) 90% of the species were de-tected in each grid (depending on the re-gion). We have to test the minimumeffort needed in spring to reasonablycover a grid.
There will probably be a debate addres-sing: 1) trying to cover all the grids inSpain with little effort in all of them if thereis not one person per grid, renouncing to
properly cover each grid and representingonly the occurrence or not of the mostcommon species or those detected in ashort time during the sampling; or 2) fo-cusing the effort on some of the grids inSpain to obtain the best information possi-ble of those and calculate for the non-sam-pled grids (but with known environmentalfeatures) the possibility of detecting the spe-cies according to their most relevant envi-ronmental variables. That implies theuse of predictive models to determine thebird distribution and abandon the traditio-nal method (representing the occurrence/
non-occurrence), being aware of the prosand cons of each methodology. The se-cond can predict the occurrence of spe-cies where they are not; the first is clearly
deficient because we will never detect allthe species in 100 km2 and less in the5,600 grids in Spain.
In addition, we will make a big effort to ob-tain information on those species notusually detected in the standardised atlaswork. We will also have to work on samplingnocturnal birds, seabirds, specific censu-ses, identification of scarce species (com-mittees of rarities and exotic birds, etc.).
More information at: www.seguimientodeaves.org
No. o
f det
ecte
d sp
ecie
s
0
70
60
50
40
30
20
10
0
No. of 15-minute transects
5 10 15 20 25 30 35 40 45 50 55 60 65 70 75 80 85 90 95 100
90.6%92.8%90.9%90.7%
Peninsula total South East Region Central Plateaux Atlantic-Pyrenees Region
Accumulation curves of number of species in different regions according to the sampling hours in winter
European Robin
THE WHOLE OF EUROPE IS WORKING ON A NEW ATLAS OF BREEDING BIRDSAND WE CANNOT BE LEFT BEHIND. SPAIN MUST CONTRIBUTE TO SUCH ANIMPORTANT GENERAL INTERST PROJECT
© F
elip
e Go
nzál
ez

TEN ONGOING MONITORING PROGOperation period of each programm
34 SEO/BIRDLIFE 2012 MONITORING PROGRAMMES

SEO/BIRDLIFE 2012 MONITORING PROGRAMMES 35
• We need new participants each season to replace vacancies and tokeep growing.
• Train and convince a friend to keep the participation growing • We need your help.
GET THE KNOWLEDGE TO CONSERVE
© S
EO/B
irdLi
fe-v
olun
taria
do
GRAMMES NEED YOUR PARTICIPATIONme and number of participants in each.

First and foremost, SEO/BirdLife wishes tothank once again the hundreds of partici-pants for all the work included in the pre-sent document. In the electronic version ofthis bulletin www.seo.org (publicaciones)everyone is included. Thanks to them, thisgood work continues.
We are grateful to Fundación Biodiversi-dad for its support on some of the pro-grammes summarised here. We alsothank all of the autonomous regions thatback this work every year. We are equallygrateful for the support of the NationalMeteorology Agency, which continues toprovide phenological information throughtheir network of collaborators for theBirds and Climate programme.
Pedro Silos for carrying out and improvingall of the computer applications and themaintenance of the database, making theprocessing of all the records possible. The
transfer of all the data, received in non-elec-tronic format, was realised by Mariano Ve-lázquez, Emilio Escudero and Blas Molina.
We appreciate the contribution made withthe sampling provided by the NationalParks Autonomous Body to the nationalindicator in order to obtain the indicator inthe National Park Network, and also tosome autonomous regions that contributeto obtain this indicator on a smaller scale:Andalusia, Valencia, Madrid and the Bas-que Country.
Manuel Santa Cruz, María Carmen Astu-dillo and Carlos Mompó reviewed thePaser programme historical data andAlazne Díez helped with the phenologyanalysis with this programme data.
Recommended citation for publicationSEO/BirdLife 2013. SEO/BirdLife birdmonitoring programmes in 2012.SEO/BirdLife. Madrid.
Recommended citation for the chaptersEscandell, V. 2013. Sacre programme.In, SEO/BirdLife. SEO/BirdLife birdmonitoring programmes in 2012,pages 4-9. SEO/BirdLife. Madrid.
www.seo.org
ACKNOWLEDGEMENTS
CREDITS WITH THE COLLABORATION OF
CITATIONS
Editorial board:Juan Carlos del Moral, Virginia Escandell,Ana Bermejo, Blas Molina, Javier de laPuente and Arantza Leal (SEO/BirdLife).
Coordination:Juan Carlos del Moral.
Database:Pedro Silos.
Cover photograph:Herrerillo capuchino. Quique Marcelo.
Interior photographs:Ángel Sánchez, Blas Molina, Carlos Ponce,Eduardo González-García, Francisco PicónDíaz, Javier de la Puente, Javier Milla, JoséAntonio Cortés, Juan Antonio Gil Garrido,Juan Jiménez, Quique Marcelo, MonserratBacardit, Pablo Vera and Ramón Elosegui.
Illustrations:Juan Varela Simó.
Layout:Espacio de ideas.
Translation: Open DOOR Translations.
September 2013
IN COLLABORATION WITH:
WITH THE SUPPORT OF: